Embed Size (px)
Citation preview
UNITED STATES DEPARTMENT OF LABORFrances Perkins, Secretary
B U R E A U OF LABO R STATISTICS Isador Lubin, Commissioner
Earnings and Hours in Shoe and Allied Industries
During First Quarter of 1939
+
Boots and Shoes Cut Stock and Findings
Shoe Patterns +
Prepared by theDivision of Wage and Hour Statistics, B. L. S.
J. PERLMAN, Chief
Bulletin l^o. 670
UNITED STATES
G O V E R N M E N T PRINTING OFFICE
W ASH IN G TO N : 1939
For sale by the Superintendent of Documents, Washington, D. C. Price 15 cents
Digitized for FRASER http://fraser.stlouisfed.org/ Federal Reserve Bank of St. Louis

Digitized for FRASER http://fraser.stlouisfed.org/ Federal Reserve Bank of St. Louis

CONTENTS
PageLetter of transmittal__________________________________________________________ vPreface_________________________________________________________________________ vnIntroduction and summary___________________________________________________ 1
Part I.— Manufacture of Boots and Shoes
Scope and method___________ 7Definition of industry____________________________________________________ 7Analysis of sample________________________________________________________ 7
Average hourly earnings_______________________________________________________ 10Methods of wage payment_______________________________________________ 10Earnings of all workers___________________________________________________ 10Variations by sex and skill_______________________________________________ 12Variations by plant averages, _________________________________________ 14Geographical differences__________________________________________________ 16Influence of size of community__________________________________________ 19Comparisons with wage standards provided in Fair Labor Standards
A c t______________________________________________________________________ 23Comparisons with wage standards provided in N R A code_____________ 25Earnings of union and nonunion workers_______________________________ 26Variations by retail price of shoes_______________________________________ 28Individual influence of size of community, unionization, and retail
price of shoes___________________________________________________________ 31Variations by type of shoe construction________________________________ 33Variations by kind of shoes______________________________________________ 38Differences by size of company__________________________________________ 40Occupational differences__________________________________________________ 41Earnings in manufacture of slippers_____________________________________ 46Earnings in units manufacturing cut stock and findings in integrated
companies_______________________________________________________________ 47Extent of earnings from extra rates for overtime work________________ 49Comparisons with previous surveys_____________________________________ 49
Weekly hours__________________________________________________________________ 51Full-time weekly hours___ ______________________________ 51Actual weekly hours________________ 51
Weekly earnings_________________ 53
Part II.— Manufacture of Boot and Shoe Cut Stock andFindings
Scope and method_____________________________________________________________ 57Definition of industry____________________________________________________ 57Analysis of sample________________________________________________________ 57
in
Digitized for FRASER http://fraser.stlouisfed.org/ Federal Reserve Bank of St. Louis

IV C O N T E N T S
PageAverage hourly earnings_______________________________________________________ 59
Methods of wage payment_______________________________________________ 59Earnings of all workers___________________________________________________ 59Variations by sex and skill_______________________________________________ 61Variations by plant averages____________________________________________ 62Geographical differences__________________________________________________ 65Influence of size of community__________________________________________ 67Comparisons with wage standards provided in Fair Labor Standards
Act______________________________________________________________________ 68Comparisons with wage standards provided in N R A codes____________ 69Earnings of union and nonunion workers_______________________________ 70Variations by kind of product____________________________________________ 71Occupational differences__________________________________________________ 73Earnings covering identical occupations in boot and shoe and cut stock
and findings industries_________________________________________________ 76Extent of earnings from extra rates for overtime work_________________ 77
Weekly hours___________________________________________________________________ 78Full-time weekly hours___________________________________________________ 78Actual weekly hours______________________________________________________ 78
Weekly earnings________________________________________________________________ 80
P a rt I II .— M a n u fa c tu r e o f S h o e P a tte r n s
Scope and method_____________________________________________________________ 83Average hourly earnings_______________________________________________________ 84Weekly hours and earnings____________________________________________________ 86
Digitized for FRASER http://fraser.stlouisfed.org/ Federal Reserve Bank of St. Louis
Letter of Transmittal
U n i t e d S t a t e s D e p a r t m e n t o f L a b o r ,B u r e a u o f L a b o r S t a t i s t i c s , Washington, D. C., August 10, 1939.
The S e c r e t a r y o f L a b o r :Transmitted herewith is a report on Earnings and Hours in Shoe
and Allied Industries covering a pay-roll period during the first quarter of 1939.
I s a d o r L u b i n , Commissioner.Hon. F r a n c e s P e r k i n s ,
Secretary of Labor.
Digitized for FRASER http://fraser.stlouisfed.org/ Federal Reserve Bank of St. Louis

Digitized for FRASER http://fraser.stlouisfed.org/ Federal Reserve Bank of St. Louis

PREFACE
This is the eighteenth of a series of surveys made by the Bureau of Labor Statistics in the boot and shoe industry, the first having been conducted in 1903 and having covered the period back to 1890. The present survey was made at the request of the Economic Section of the Wage and Hour Division, Carroll Daugherty, Chief, for use by Industry Committee No. 6 in recommending minimum wage rates for the shoe manufacturing and allied industries under the Fair Labor Standards Act.
The Bureau wishes to express its grateful appreciation to the various firms that voluntarily cooperated in furnishing the information that made this report possible. The debt which the Bureau also owes to various trade associations and unions for their valuable contributions is freely acknowledged.
In the preparation of the information contained in this bulletin for the Wage and Hour Division, the Bureau of Labor Statistics has strictly adhered to its long-established policy of keeping confidential all information submitted to it by individual establishments.
The survey was made by the Division of Wage and Hour Statistics of the Bureau of Labor Statistics, J. Perlman, Chief. P. L. Jones andO. R. Witmer were in charge of the field and office work. This bulletin was written by J. Perlman, assisted by Messrs. Jones, Witmer, and H. O. Rogers. Acknowledgment for valuable suggestions in the preparation of the bulletin is also extended to W. P. Fallon of the Economic Section and A. B. Long of the Industry Committee Section of the Wage and Hour Division.
I s a d o k L u b i n ,Commissioner oj Labor Statistics.
A u g u s t 1939.
Digitized for FRASER http://fraser.stlouisfed.org/ Federal Reserve Bank of St. Louis

Digitized for FRASER http://fraser.stlouisfed.org/ Federal Reserve Bank of St. Louis

Bulletin 7S[o. 670 of the
United States Bureau o f Labor Statistics
Earnings and Hours in Shoe and Allied Industries
Introduction and Summary
A study of earnings and hours was made by the Bureau of Labor Statistics in the boot and shoe industry, the boot and shoe cut stock and findings industry, and the shoe pattern industry, at the request of the Wage and Hour Division of the Department of Labor. The study, the results of which are given in this bulletin, covered a payroll period during the first quarter of 1939. It indicated that practically the same level of hourly earnings prevailed in the manufacture of footwear as in the manufacture of cut stock and findings. Although the average hourly earnings of the workers in the cut stock and findings industry were somewhat above those of the same skills in the boot and shoe industry, because of the larger proportion of unskilled workers, the average for the industry was 0.2 cent less per hour than in the boot and shoe industry. Thus, although skilled, semiskilled, and unskilled workers in the cut stock and findings industry earned on an average 68.5, 45.5, and 39.5 cents per hour, as compared with corresponding figures for the boot and shoe industry of 61.5, 45.4, and 36.3 cents, the industry average was 48.7 cents as compared with 48.9 cents in the boot and shoe industry. The shoe pattern industry showed hourly earnings very much higher than either of the other two industries; skilled workers averaged 97.1 cents, while semiskilled and unskilled workers combined averaged 50.2 cents. The average for the industry was 81.5 cents.
Weekly hours averaged 39.4 in the boot and shoe industry, 38.5 in the cut stock and findings industry, and 40.0 in the shoe pattern industry.
Weekly earnings averaged $19.33 in the boot and shoe industry, $18.79 in the cut stock and findings industry, and $32.93 in the shoe pattern industry.
The study revealed wide fluctuations in earnings, not only on the basis of sex and skill, but from plant to plant and State to State. (There were no significant variations between broad geographical regions.) Other factors having considerable influence on the level of earnings were the size of the community in which the plant was
1170209°— 39------ 2
Digitized for FRASER http://fraser.stlouisfed.org/ Federal Reserve Bank of St. Louis

2 E A R N IN G S AN D H O U R S, SH OE A N D A LLIE D IN D U ST R IE S
located, the price of shoe produced, and the unionization of the workers.
The information in the study was collected by the Bureau’s field staff, who visited the various establishments, obtained data from pay-roll and other records, and interviewed plant officials.
Information was collected on wages and hours, occupational descriptions, and general plant policies. The wages-and-hours data cover all occupations, including working supervisors and factory clerks, but exclude higher plant supervisors and office employees. For each person, the Bureau obtained the occupation, sex, color,1 method of wage payment, and number of actual hours worked and total earnings for one pay-roll period.2 Descriptions of occupations were secured from a number of establishments, especially in cases where there was some doubt as to the duties. On the basis of this information, as well as that obtained from previous surveys of the industry, the Bureau developed the detailed occupational groupings used in this report.
In addition to detailed occupational groupings, there is also included in this report a classification according to skill. The latter is based on skill designations for each occupation, which were secured from a person in charge of operations in each plant, the classification by the Bureau taking into account the consensus of opinion in the industry. Any classification of occupations according to skill is apt to be somewhat arbitrary in nature. Nevertheless, it is felt that the skill designations used here are essentially accurate.
Production in the shoe manufacturing and allied industries is seasonal in nature, one season reaching its peak usually in February or March and another in August. Thus, as a plant swings into seasonal production, the cutting department is affected first, followed successively by the other departments, through the finishing process. The field representatives of the Bureau were instructed to select a period during which there was a more or less even flow of production through all departments. They were likewise directed to avoid a period at or near the peak of seasonal production, which may include a large amount of overtime worked by individual employees. In nearly all establishments, the pay-roll period covered was during the months of January, February, or March 1939.3
Under the provisions of the Fair Labor Standards Act of 1938, employees working in excess of 44 hours per week are entitled to a rate at time and one-half for overtime. In obtaining the data on wages
1 The number of colored workers in the establishments covered was not sufficient to justify separate tabulation.
2 In case the pay-roll period exceeded 1 week, there was also obtained the number of hours worked during 1 continuous week within the pay-roll period. This enabled the Bureau to present weekly hours, as well as weekly earnings, covering all employees.
3 In plants where time worked was not of record for piece workers or other employees, arrangements were made to have a daily record kept of the hours worked by each such wage earner for 1 pay-roll period.
Digitized for FRASER http://fraser.stlouisfed.org/ Federal Reserve Bank of St. Louis
INTRODUCTION 3
and hours in this survey, separate figures were secured for regular and overtime work. The hourly earnings used in this report, unless otherwise specified, are based on regular rates, thus excluding the earnings from the extra rates paid for overtime. This is contrary to the practice followed by the Bureau in previous surveys, but was necessitated by the fact that the figures were to be used in connection with a recommendation of minimum wages. However, hourly earnings, including the extra earnings for overtime, were also computed for some of the break-downs and are presented in separate sections of this report.
The general plant information obtained covers such items as corporate affiliation, product, full-time hours, overtime, methods of wage payment, and employer-employee relations.
Digitized for FRASER http://fraser.stlouisfed.org/ Federal Reserve Bank of St. Louis

Digitized for FRASER http://fraser.stlouisfed.org/ Federal Reserve Bank of St. Louis
Part I.— Manufacture of Boots and Shoes
5
Digitized for FRASER http://fraser.stlouisfed.org/ Federal Reserve Bank of St. Louis

Digitized for FRASER http://fraser.stlouisfed.org/ Federal Reserve Bank of St. Louis

Scope and Method
Definition of Industry
The definition of the boot and shoe industry adopted in this survey conforms very closely to that used by the Census of Manufactures for the industry designated as “ Boots and Shoes, Other Than Kubber.” The latter includes establishments “ engaged primarily in the manufacture of boots, shoes, slippers, sandals, moccasins and other types of footwear, leggings, overgaiters, etc., made chiefly of leather, but to some extent of canvas and other textile fabrics.”
More specifically, the survey covered plants whose principal products are men's (dress and work), youths', boys', women's, misses', girls', children’s, and infants' footwear (boots and shoes), which are made by any of the standard methods of shoe construction. The survey also included establishments engaged primarily in making athletic or sport shoes, riding boots, and hard- or soft-soled slippers and moccasins, when made entirely or partly of leather. Plants whose principal product was footwear with rubber soles were covered only when the soles were attached by one of the standard methods of construction.
Excluded from the survey were establishments engaged primarily in manufacturing molded rubber footwear, such as sneakers, “ gym” shoes, rubber overshoes, rubber boots, etc. There were also excluded those whose principal products were spats, leggings, etc., made entirely of canvas, felt, or other textile fabrics.
Whenever cut stock and findings were produced by boot and shoe companies principally for their own use, either in the same plant making shoes or in separate establishments, these products were covered in the survey of the boot and shoe industry. On the other hand, plants engaged entirely in the production of cut stock and findings for sale were excluded, being treated as in a separate industry and covered in part II of this report.
The survey differed from the Census of Manufactures in that it included only establishments with 50 or more wage earners, as those having less than that number are for the most part plants making custom-order and turned shoes.
Analysis of Sample
According to the Census of Manufactures, the boot and shoe industry had 1,080 establishments and 215,437 wage earners in 1937. Of these, 724 plants had 50 or more workers, employing a total of 208,155 wage earners.
7
Digitized for FRASER http://fraser.stlouisfed.org/ Federal Reserve Bank of St. Louis
8 E A R N IN G S A N D H O U R S , SH O E A N D A L L IE D IN D U S T R IE S
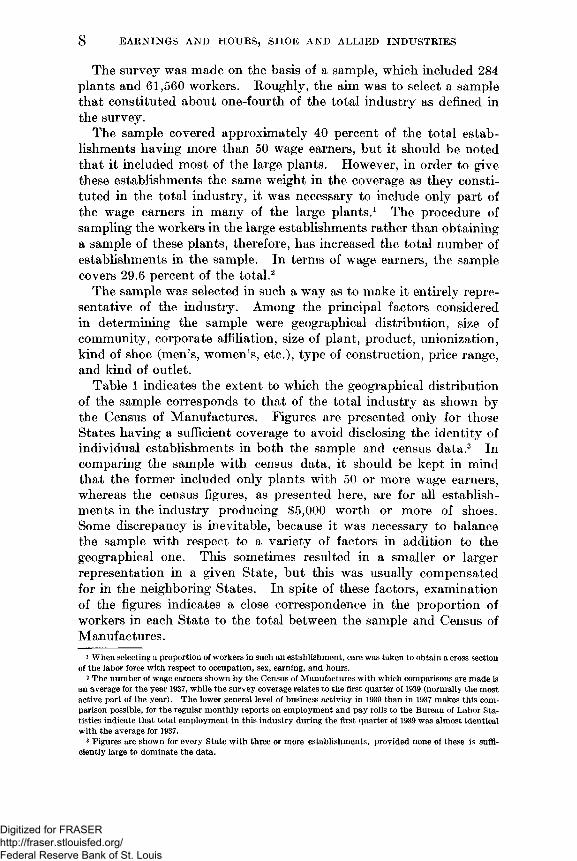
The survey was made on the basis of a sample, which included 284 plants and 61,560 workers. Roughly, the aim was to select a sample that constituted about one-fourth of the total industry as defined in the survey.
The sample covered approximately 40 percent of the total establishments having more than 50 wage earners, but it should be noted that it included most of the large plants. However, in order to give these establishments the same weight in the coverage as they constituted in the total industry, it was necessary to include only part of the wage earners in many of the large plants.1 The procedure of sampling the workers in the large establishments rather than obtaining a sample of these plants, therefore, has increased the total number of establishments in the sample. In terms of wage earners, the sample covers 29.6 percent of the total.2
The sample was selected in such a way as to make it entirely representative of the industry. Among the principal factors considered in determining the sample were geographical distribution, size of community, corporate affiliation, size of plant, product, unionization, kind of shoe (men’s, women’s, etc.), type of construction, price range, and kind of outlet.
Table 1 indicates the extent to which the geographical distribution of the sample corresponds to that of the total industry as shown by the Census of Manufactures. Figures are presented only for those States having a sufficient coverage to avoid disclosing the identity of individual establishments in both the sample and census data.3 In comparing the sample with census data, it should be kept in mind that the former included only plants with 50 or more wage earners, whereas the census figures, as presented here, are for all establishments in the industry producing $5,000 worth or more of shoes. Some discrepancy is inevitable, because it was necessary to balance the sample with respect to a variety of factors in addition to the geographical one. This sometimes resulted in a smaller or larger representation in a given State, but this was usually compensated for in the neighboring States. In spite of these factors, examination of the figures indicates a close correspondence in the proportion of workers in each State to the total between the sample and Census of Manufactures.
1 When selecting a proportion of workers in such an establishment, care was taken to obtain a cross section of the labor force with respect to occupation, sex, earning, and hours.
2 The number of wage earners shown by the Census of Manufactures with which comparisons are made is an average for the year 1937, while the survey coverage relates to the first quarter of 1939 (normally the most active part of the year). The lower general level of business activity in 1939 than in 1937 makes this comparison possible, for the regular monthly reports on employment and pay rolls to the Bureau of Labor Statistics indicate that total employment in this industry during the first quarter of 1939 was almost identical with the average for 1937.
3 Figures are shown for every State with three or more establishments, provided none of these is sufficiently large to dominate the data.
Digitized for FRASER http://fraser.stlouisfed.org/ Federal Reserve Bank of St. Louis

M A N U F A C T U R E OF BOOTS A N D SH O E S 9
T a b l e 1 .— Coverage o f survey o f boot and shoe industry, by States, first quarter o f 1989
State
Census of Manufactures, 19371 Bureau survey 2
N umber of plantsWorkers Number of plants
W orkersNumber Percent Number Percent
United States_________________________ 1,080 215,437 1 00 .0 284 61,560 1 00 .0
California___________ _______________ 13 871 .4 3 390 . 6Connecticut ___ __________ ___________ 6 892 .4 4 392 . 6Georgia. _ __ _ ______ ______ 4 1, 508 .7 3 522 . 8Illinois__ ___________________________ _ 63 16, 662 7.7 19 4,845 7.9Indiana_______________________________ 7 1,933 .9 4 711 1 .2Maine_______________________________ 55 13, 605 6.3 17 4,080 6 .6Maryland_____ ____________________ 12 2, 637 1 .2 5 973 1 .6Massachusetts.- __ ___ _ _________ 294 46, 720 21.7 67 13, 561 2 2 .0Michigan------------------ ------------------------- 9 962 .4 3 334 .5Minnesota.. _ ---------- „------------------------ 7 642 .3 3 298 .5Missouri__ _________________________ 57 26,110 1 2 .1 25 8,158 13.3New Hampshire----------------------------------- 73 17,713 8 .2 20 4,150 6.7New Jersey________________________ . . 24 2, 336 1 .1 6 846 1.4New York.. __ __ - . . . ____ 219 33, 673 15.6 44 8, 632 14.0Ohio____ ______________________ ___ 36 14, 810 6.9 13 3,897 6.3Pennsylvania-------- ---------------------------- 88 12, 942 6 .0 17 3,299 5.4Tennessee-------------------------------------------- 12 4, 464 2 .1 6 1,208 2 .0Wisconsin_____ _ - - - - - - - - ---- 54 10,065 4.7 16 3, 543 5.8Other States__________________________ 3 4 7 6,892 3.3 <9 1,721 2 .8
1 Includes all establishments producing $5,000 worth or more of shoes.2 Includes only establishments with 50 or more workers.s Includes 1 in Alabama, 1 in Arizona, 1 in Florida, 4 in Iowa, 3 in Kansas, 4 in Kentucky, 3 in Nebraska,
1 in North Carolina, 4 in Oregon, 2 in Rhode Island, 5 in Texas, 4 in Vermont, 6 in Virginia, 6 in Washington, and 2 in West Virginia.* Includes 1 in Iowa, 2 in Kentucky, and 6 in Virginia.
170209°— 39------ 3
Digitized for FRASER http://fraser.stlouisfed.org/ Federal Reserve Bank of St. Louis
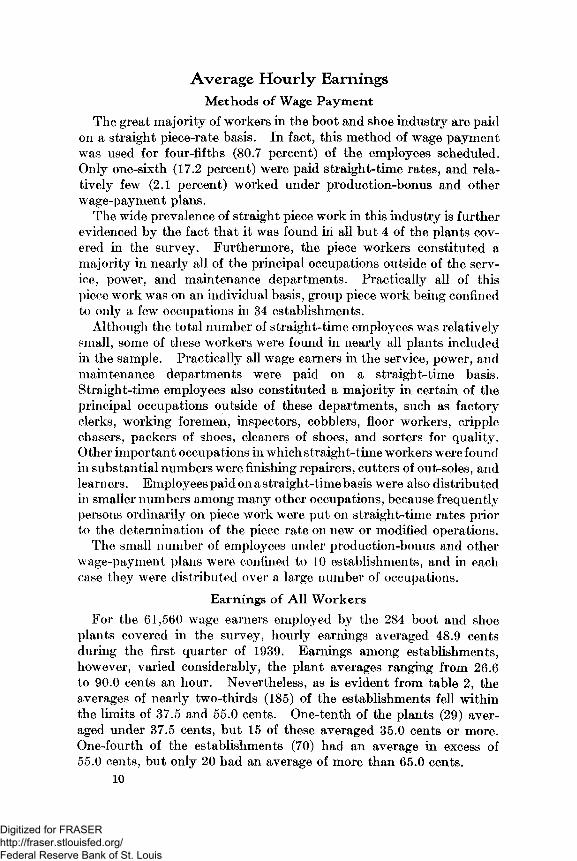
Average Hourly EarningsMethods of Wage Payment
The great majority of workers in the boot and shoe industry are paid on a straight piece-rate basis. In fact, this method of wage payment was used for four-fifths (80.7 percent) of the employees scheduled. Only one-sixth (17.2 percent) were paid straight-time rates, and relatively few (2.1 percent) worked under production-bonus and other wage-payment plans.
The wide prevalence of straight piece work in this industry is further evidenced by the fact that it was found in all but 4 of the plants covered in the survey. Furthermore, the piece workers constituted a majority in nearly all of the principal occupations outside of the service, power, and maintenance departments. Practically all of this piece work was on an individual basis, group piece work being confined to only a few occupations in 34 establishments.
Although the total number of straight-time employees was relatively small, some of these workers were found in nearly all plants included in the sample. Practically all wage earners in the service, power, and maintenance departments were paid on a straight-time basis. Straight-time employees also constituted a majority in certain of the principal occupations outside of these departments, such as factory clerks, working foremen, inspectors, cobblers, floor workers, cripple chasers, packers of shoes, cleaners of shoes, and sorters for quality. Other important occupations in which straight-time workers were found in substantial numbers were finishing repairers, cutters of out-soles, and learners. Employees paid on a straight-time basis were also distributed in smaller numbers among many other occupations, because frequently persons ordinarily on piece work were put on straight-time rates prior to the determination of the piece rate on new or modified operations.
The small number of employees under production-bonus and other wage-payment plans were confined to 10 establishments, and in each case they were distributed over a large number of occupations.
Earnings of All WorkersFor the 61,560 wage earners employed by the 284 boot and shoe
plants covered in the survey, hourly earnings averaged 48.9 cents during the first quarter of 1939. Earnings among establishments, however, varied considerably, the plant averages ranging from 26.6 to 90.0 cents an hour. Nevertheless, as is evident from table 2, the averages of nearly two-thirds (185) of the establishments fell within the limits of 37.5 and 55.0 cents. One-tenth of the plants (29) averaged under 37.5 cents, but 15 of these averaged 35.0 cents or more. One-fourth of the establishments (70) had an average in excess of55.0 cents, but only 20 had an average of more than 65.0 cents.
10
Digitized for FRASER http://fraser.stlouisfed.org/ Federal Reserve Bank of St. Louis
M A N U F A C T U R E OF BOOTS A N D SH O E S II
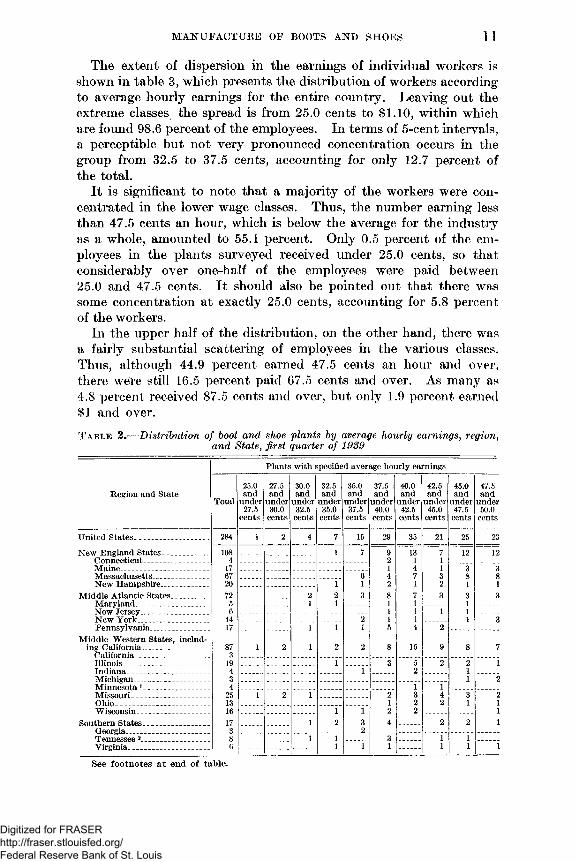
The extent of dispersion in the earnings of individual workers is shown in table 3, which presents the distribution of workers according to average hourly earnings for the entire country. Leaving out the extreme classes the spread is from 25.0 cents to $1.10, within which are found 98.6 percent of the employees. In terms of 5-cent intervals, a perceptible but not very pronounced concentration occurs in the group from 32.5 to 37.5 cents, accounting for only 12.7 percent of the total.
It is significant to note that a majority of the workers were concentrated in the lower wage classes. Thus, the number earning less than 47.5 cents an hour, which is below the average for the industry as a whole, amounted to 55.1 percent. Only 0.5 percent of the employees in the plants surveyed received under 25.0 cents, so that considerably over one-half of the employees were paid between25.0 and 47.5 cents. It should also be pointed out that there was some concentration at exactly 25.0 cents, accounting for 5.8 percent of the workers.
In the upper half of the distribution, on the other hand, there was a fairly substantial scattering of employees in the various classes. Thus, although 44.9 percent earned 47.5 cents an hour and over, there were still 16.5 percent paid 67.5 cents and over. As many as4.8 percent received 87.5 cents and over, but only 1.9 percent earned $1 and over.T a b l e 2 .— Distribution of boot and shoe plants by average hourly earnings, region ,
and State, first quarter of 1939
Plants with specified average hourly earnings
Region and State Total25.0andunder27.5cents
27.5andunder30.0cents
30.0andunder32.5cents
32.5andunder35.0cents
35.0andunder37.5cents
37.5andunder40.0cents
40.0andunder42.5cents
42.5andunder45.0cents
45.0andunder47.5cents
47.5andunder50.0centsUnited States 284 1 2 4 7 15 29 35 21 25 23New England States _ . ____ 108 1 7 9 13 7 12 12Connecticut 4 2 1 1Maine ___ 17 1 4 1 3 3M assachusetts__ 67 6 4 7 3 8 8New Hampshire__ . _ 20 1 1 2 1 2 1 1
Middle Atlantic States . _ _ _ 72 2 2 3 8 7 3 3 3M aryland_____ _ _ 5 1 1 1 1 1New Jersey 6 1 1 1 1New Y o rk ______ 44 2 1 1 1 3Pennsylvania 17 1 1 1 5 4 2
Middle Western States, including California_______ _ _ 87 1 2 1 2 2 8 15 9 8 7California 3Illinois _ ___ 19 1 3 5 2 2 1Indiana ____ 4 1 2 1Michigan __ _____ 3 1 2Minnesota 1 _____ 4 1 1Missouri ___ _ 25 1 2 1 2 3 4 3 2Ohio 13 1 2 2 1 1Wisconsin _ _ _ __ _ 16 1 1 2 2 1
Southern States 17 1 2 3 4 2 2 1Cp.nrgia 3 2Tennessee 2 8 1 1 3 1 1 .V irginia 6 1 1 i 1 1 1
See footnotes a t end of table.
Digitized for FRASER http://fraser.stlouisfed.org/ Federal Reserve Bank of St. Louis
12 E A R N IN G S A N D H O U R S , SH O E A N D A L LIE D IN D U S T R IE S
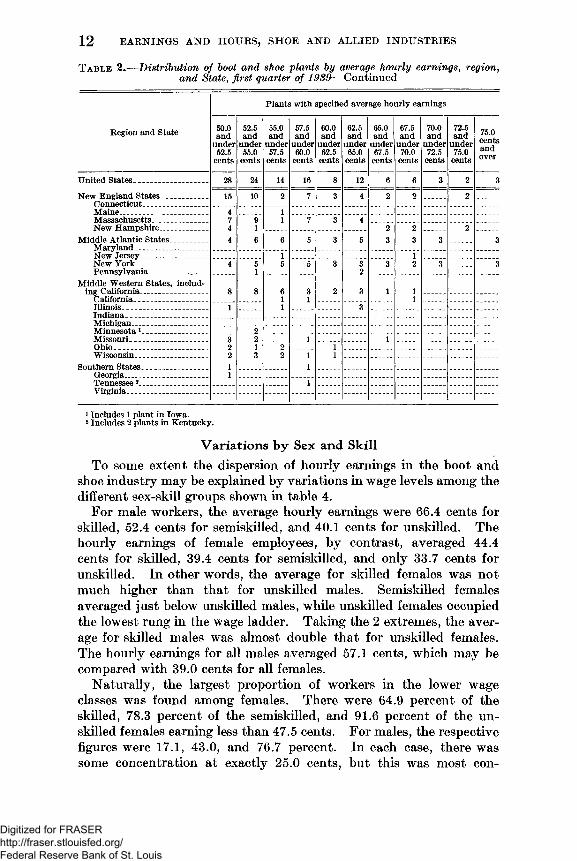
T a b l e 2 .— Distribution of boot and shoe plants by average hourly earnings, region , and State, first quarter o f 1989— Continued
Plants with specified average hourly earnings
Region and State 50.0andunder52.5cents
52.5andunder55.0cents
55.0andunder57.5cents
57.5andunder60.0cents
60.0andunder62.5cents
62.5andunder65.0cents
65.0andunder67.5cents
67.5andunder70.0cents
70.0andunder72.5cents
72.5andunder75.0cents
75.0centsandoverUnited States ________ ___ 28 24 14 16 8 12 6 6 3 2 3New England States ______ __ 15 10 2 7 3 4 2 2 2Connecticut ___ . . . _____Maine ___ _____________ 4 1Massachusetts - _ ________ 7 9 1 7 3 4New Hampshire. _ . _ ___ 4 1 2 2 2
Middle Atlantic States. ______ 4 6 6 5 3 5 3 3 3 3Maryland__________ _____New Jersey ______________ 1 1New York______________ 4 5 5 5 3 3 3 2 3 3Pennsylvania . . . _ _______ 1 2
Middle Western States, including California_____ _. 8 8 6 3 2 3 1 1California. _____________ . 1 1 1Illinois__________ ____ . . . 1 1 3Indiana _ ________ _M ich ig a n ..._________ ____M innesota1___ ______ _ 2Missouri _____ __________ 3 2 1 1Ohio . . ____________ . . _ 2 1 2 IWisconsin _______ ____ _ 2 3 2 1 1
Southern States_________ 1 1Georgia____ ________ ____ 1Tennessee2 ___ _______ 1Virginia____ _ _________1 Includes 1 plant in Iowa.2 Includes 2 plants in Kentucky.
Variations by Sex and SkillTo some extent the dispersion of hourly earnings in the boot and
shoe industry may be explained by variations in wage levels among the different sex-skill groups shown in table 4.
For male workers, the average hourly earnings were 66.4 cents for skilled, 52.4 cents for semiskilled, and 40.1 cents for unskilled. The hourly earnings of female employees, by contrast, averaged 44.4 cents for skilled, 39.4 cents for semiskilled, and only 33.7 cents for unskilled. In other words, the average for skilled females was not much higher than that for unskilled males. Semiskilled females averaged just below unskilled males, while unskilled females occupied the lowest rung in the wage ladder. Taking the 2 extremes, the average for skilled males was almost double that for unskilled females. The hourly earnings for all males averaged 57.1 cents, which may be compared with 39.0 cents for all females.
Naturally, the largest proportion of workers in the lower wage classes was found among females. There were 64.9 percent of the skilled, 78.3 percent of the semiskilled, and 91.6 percent of the unskilled females earning less than 47.5 cents. For males, the respective figures were 17.1, 43.0, and 76.7 percent. In each case, there was some concentration at exactly 25.0 cents, but this was most con-
Digitized for FRASER http://fraser.stlouisfed.org/ Federal Reserve Bank of St. Louis
M A N U F A C T U R E OF BOOTS A N D SH O E S 13
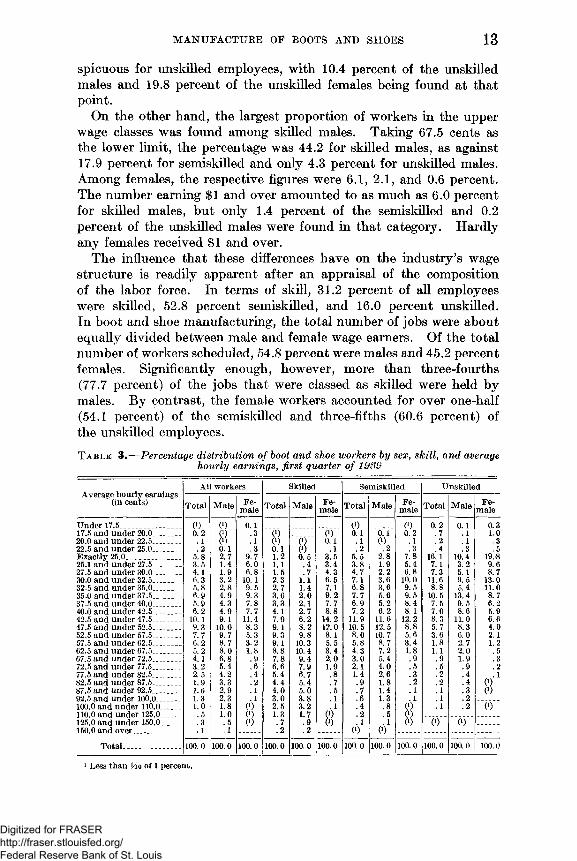
spicuous for unskilled employees, with 10.4 percent of the unskilled males and 19.8 percent of the unskilled females being found at that point.
On the other hand, the largest proportion of workers in the upper wage classes was found among skilled males. Taking 67.5 cents as the lower limit, the percentage was 44.2 for skilled males, as against17.9 percent for semiskilled and only 4.3 percent for unskilled males. Among females, the respective figures were 6.1, 2.1, and 0.6 percent. The number earning $1 and over amounted to as much as 6.0 percent for skilled males, but only 1.4 percent of the semiskilled and 0.2 percent of the unskilled males were found in that category. Hardly any females received $1 and over.
The influence that these differences have on the industry’s wage structure is readily apparent after an appraisal of the composition of the labor force. In terms of skill, 31.2 percent of all employees were skilled, 52.8 percent semiskilled, and 16.0 percent unskilled. In boot and shoe manufacturing, the total number of jobs were about equally divided between male and female wage earners. Of the total number of workers scheduled, 54.8 percent were males and 45.2 percent females. Significantly enough, however, more than three-fourths (77.7 percent) of the jobs that were classed as skilled were held by males. By contrast, the female workers accounted for over one-half (54.1 percent) of the semiskilled and three-fifths (60.6 percent) of the unskilled employees.T a b l e 3 .— Percentage distribution o f boot and shoe workers by sex, skill, and average
hourly earnings, first quarter of 1939
Average hourly earnings (in cents)All workers Skilled Semiskilled Unskilled
Total Male Female Total Male Female Total Male Female Total Male FemaleUnder 17.5 ___ (0 C1) 0 .1 0) (0 0 . 2 0 .1 0.317.5 and under 20.0 _ _ 0 . 2 (i) .3 0) 0) 0 .1 ~ ~6T 0 .2 . 7 . 1 1 .020.0 and under 22.5______ . 1 0) . 1 0) (f) 0 .1 .1 0) . 1 .2 . 1 .322.5 and under 25.0____ . 2 0 .1 .3 0 .1 (0 .1 . 2 . 2 .3 .4 .3 .5Exactly 25.0______ ____ 5.8 2.7 9.7 1 .2 0.5 3.5 5.5 2 .8 7.8 16.1 10.4 19.-825.1 and under 27.5______ 3.5 1.4 6 .0 1 .1 .4 3.4 3.8 1.9 5.4 7.1 3.2 9.627.5 and under 30.0______ 4.1 1.9 6 .8 1.5 .7 4.3 4.7 2 .2 6 .8 7.3 5.1 8.730.0 and under 32.5______ 6.3 3.2 1 0 .1 2.3 1 .1 6.5 7.1 3.6 1 0 .0 1 1 .6 9.5 13.032.5 and under 35.0______ 5.8 2 .8 9. 5 2.7 1.4 7.1 6 .8 3.6 9.5 8 .8 5.4 1 1 .035.0 and under 37.5____ _ 6.9 4.9 9.3 3.6 2 .0 9.2 7.7 5.6 9.5 10.5 13.4 8.737.5 and under 40.0______ 5.9 4.3 7.8 3.3 2 .1 7.7 6.9 5.2 8.4 7.5 9. 5 6 .240.0 and under 42.5______ 6 .2 4.9 7.7 4.1 2.7 8 .8 7.2 6 .2 8 .1 7.0 8 .6 5.942.5 and under 47.5,__ ___ 1 0 .1 9.1 11.4 7.9 6 .2 14.2 11.9 1 1 .6 1 2 .2 8.3 1 1 .0 6 .647.5 and under 52.5______ 9.3 1 0 .0 8.3 9.1 8 .2 1 2 .0 10.5 12.5 8 .8 5.7 8.3 4.052.5 and under 57.5____ . 7.7 9.7 5.3 9.3 9.8 8 .1 8 .0 10.7 5.6 3.6 6 .0 2 .157.5 and under 62.5______ 6 .2 8.7 3.2 9.1 10.3 5.5 5.8 8.7 3.4 1 .8 2.7 1 .262.5 and under 67.5______ 5.2 8 .0 1 .8 8.8 10.4 3.4 4.3 7.2 1 .8 1 .1 2 .0 .567.5 and under 72.5__.___ _ 4.1 6 .8 .9 7.8 9.4 2 .0 3.0 5.4 .9 .9 1.9 .372.5 and under 77.5______ 3.2 5.4 .6 6.6 7.9 1.9 2 .1 4.0 .5 .5 .9 . 277.5 and under 82.5______ 2.5 4.2 .4 5.4 6.7 .8 1.4 2 .6 .3 . 2 .4 .182.5 and under 87.5______ 1.9 3.3 . 2 4.4 5.4 .7 .9 1 .8 .2 .2 .4 0)87.5 and under 92.5____ _ 1 .6 2.9 .1 4.0 5.0 .5 .7 1.4 .1 .1 .3 0)92.5 and under 100.0 1.3 2.3 . 1 3.0 3. 8 . 1 .6 1.3 .1 . 1 .2100 .0 and under 110 .0____ 1.0 1 .8 0) 2.5 3.2 .1 .4 .8 0) . 1 .2 (0110.0 and under 125.0____ . 5 1.0 (!) 1.3 1.7 (l) .2 . 5 (0125.0 and under 150.0 .3 .5 0) . 7 .9 0) . 1 . 1 0) C1) 0)150 0 and over . l . 1 .2 . 2 (i) 0)
Total__________ 1 00 .0 1 0 0 .0 1 0 0 .0 1 0 0 .0 1 0 0 .0 1 00 .0 1 0 0 .0 1 0 0 .0 1 0 0 .0 1 00 .0 1 00 .0 1 00 .0
1 L ess th a n H o o f 1 p ercen t.
Digitized for FRASER http://fraser.stlouisfed.org/ Federal Reserve Bank of St. Louis

14 E A R N IN G S A N D H O U R S, SH O E A N D A LLIE D IN D U ST R IE S
T a b l e 4 .— Average hourly earnings of boot and shoe workers, by sex, skill, and region, first quarter of 1939
Sex and skill UnitedStatesNewEnglandStates
MiddleAtlanticStatesMiddle Western States 1
SouthernStates
All workers___________________________ $0.489 $0.491 $0. 525 $0.476 $0.427Skilled____________________________ .615 .620 .639 .607 .516Semiskilled____ _ _______________ .454 .454 .486 .445 .398Unskilled ______ _______________ .363 .343 .385 .366 .358Males_____________ ______ ____ .571 .573 .598 .564 .480Skilled____________________________ .664 .666 .682 .666 .558Semiskilled________________ ______ .524 .521 .559 .518 .440Unskilled ------------------------------------ .401 .378 .410 .415 .379F em ales_________ ____ _______ ______ .390 .396 .404 .382 .358Skilled____________________________ .444 .467 .450 .428 .371Semiskilled___________________ _____ .394 .400 .407 .388 .361Unskilled ________ _______ . . ----- .337 .324 .362 .336 .339
1 Includes 3 establishments in California.Variations by Plant Averages
In table 2, the boot and shoe establishments were grouped according to plant average hourly earnings, with 2.5 cents as a class interval. Table 5 shows the distribution of all workers in the country as a whole by hourly earnings separately for each of these groups of establishments.T a b l e 5 .— Percentage distribution of boot and shoe workers, by average hourly
earnings in plants with classified hourly earnings, first quarter o f 1989
Plants having average hourly earnings of—30.0 32.5 35.0 37.5 40.0 42.5 45.0 47.5Average hourly earnings Under and and and and and and and and30.0 under under under under under under under undercents 32.5 35.0 37.5 40.0 42.5 45.0 47.5 50.0cents cents cents cents cents cents cents cents
Under 17.5 c e n ts________ ______ 2.4 ' 0 .1 0 .117.5 and under 20.0 cents _ ____ _ . 6 7.8 . 1 0 ) 0 .1 (i)20.0 and under 22.5 cents- .3 1.3 0 .8 0 ) . 2 (i) (i) PI22.5 and under 25.0 cents_________ _ .5 .9 1 .2 0.4 .4 0 .2 .3 0.3 0 .1Exactly 25.0 cents_________________ 54.6 • 29.1 23.6 16.9 1 0 .8 9.2 3.6 4.4 2 .125.1 and under 27.5 cents._ ________ 6.9 1 0 .8 8.7 7.3 7.2 5.4 3.9 4.1 3.127.5 and under 30.0 cents. ____ ___ 1 1 .6 6 .1 9.4 1 1 .6 6.7 6 .0 6.3 5.3 3.130.0 and under 32.5 cents___________ 6 .0 7.5 1 1 .1 1 1 .6 11.4 1 0 .1 9.3 7.3 5.232.5 and under 35.0 cents___________ 3.9 7.4 1 0 .2 9.0 8.5 7.2 8.3 6.4 6 .635.0 and under 37.5 cents___________ 3.8 5.0 7.8 9.9 9.7 9.6 8.7 8 .6 7.837.5 and under 40.0 cents___________ 1 .2 4.1 5.9 5.5 7.1 7.0 7.6 6.3 6 .840.0 and under 42.5 cents___________ 1 .8 5.2 5.6 5.1 7.0 7.0 7.6 7.0 6.742.5 and under 47.5 cents___________ 3.0 5.9 6 .0 8 .0 9.4 10.7 1 1 .8 10.5 11.547.5 and under 52.5 cents___________ 1.1 5.0 4.3 5.6 6.7 9.1 8.9 9.2 1 0 .852.5 and under 57.5 cents____ _____ . 2 2.5 2.3 3.6 5.1 6.7 7.1 7.8 9.457.5 and under 62.5 cents___________ . 2 .5 1.4 1.7 3.5 4.2 5.8 5.6 7.562.5 and under 67.5 cents___________ .3 .5 .4 1 .6 2 .2 3.2 4.0 5.4 6.567.5 and under 72.5 cents.__________ .3 . 2 .5 .7 2 .0 1 .6 2.9 4.0 4.872.5 and under 77.5 cents . 2 .3 . 6 .7 1 .1 1.7 2. 4 3. 277.5 and under 82.5 cents___________ . 2 .1 . 2 .4 .5 .7 1 .1 2. 2 l! 882.5 and under 87.5 cents .1 .3 . 2 .4 1. 2 1 .187.5 and under 92.5 cents - _ __ . 2 . 2 . 2 . 3 . 3 . 9 . 992.5 and under 100.0 cents. _____ . 2 .1 .1 . 1 . 2 2 . 5 . 5100.0 and under 110.0 cents_________ .3 . 2 .1 .1 .2 0 ) '.4 .*2110.0 and under 125.0 c e n t s ._____ _ . 2 0 ) (i) . 1 . i . 2125.0 and under 150.0 cents_________ . 1 0 ) ! i 1150.0 cents and over______ ______ 6 )
Total________ _____________ 1 00 .0 1 00 .0 100 .0 100 .0 1 00 .0 1 00 .0 1 00 .0 1 00 .0 100 .0
Number of workers________________ 660 1,183 1, 320 2,761 4, 536 7, 364 5,098 5, 955 5, 2701 Less than Via of 1 percent
Digitized for FRASER http://fraser.stlouisfed.org/ Federal Reserve Bank of St. Louis
M A N U F A C T U R E OF BOOTS A N D SH O E S 15
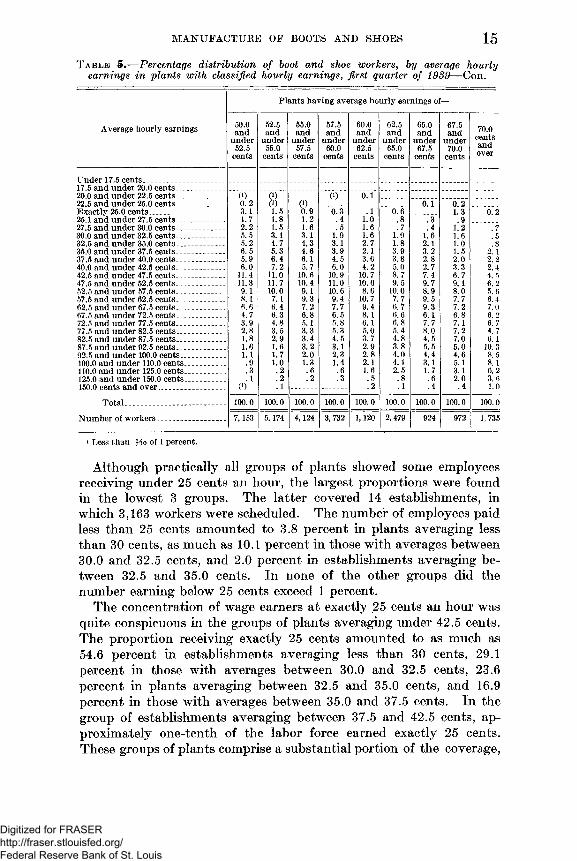
T a b l e 5 .— Percentage distribution of boot and shoe workers, by average hourly earnings in plants with classified hourly earnings, first quarter of 1939— Con.
Plants having average hourly earnings of—
Average hourly earnings 50.0andunder52.5cents
52.5andunder55.0cents
55.0andunder57.5cents
57.5andunder60.0cents
60.0andunder62.5cents
62.5andunder65.0cents
65.0andunder67.5cents
67.5andunder70.0cents
70.0centsandover
Under 17.5 cents. ______ -17.5 and under 20.0 cents-- __ ___ _-20.0 and under 22.5 cents _ _ _ . _ _ _ _ 0 ) (i) 0) 0.122.5 and under 25.0 cents-. _ _____ 0. 2 Q) 0) 0.1 0.2Exactly 25.0 cents ___ _ _____ _ 3.1 1.5 0.9 0.3 .1 0.6 1.3 6:225.1 and under 27.5 cents _ _______ 1.7 1.8 1.2 .4 1.0 .8 .3 .927.5 and under 30.0 cents___________ 2.2 1.5 1.6 .5 1.6 .7 .4 1.2 .730.0 and under 32.5 cents___________ 5.5 3.1 3.1 1.9 1.6 1.9 1.6 1.6 .532.5 and under 35.0 cents__________ 5.2 4.7 4.3 3.1 2.7 1.8 2.1 1.0 .835.0 and under 37.5 cents___________ 6.5 5.3 4.6 3.9 2.1 3.9 3.2 1.5 2.137.5 and under 40.0 cents___________ 5.9 6.4 6.1 4.5 3.6 3.8 2.8 2.0 2.240.0 and under 42.5 cents___________ 6.0 7.2 5.7 6.0 4.2 5.0 2.7 3.3 2.442.5 and under 47.5 cents___________ 11.4 11.0 10.6 10.9 10.7 8.7 7.4 6.7 4.547.5 and under 52.5 cents___________ 11.3 11.7 10.4 11.0 10.6 9.5 9.7 9.1 6.252.5 and under 57.5 cents__________ 9.1 10.0 9.1 10.6 8.6 10.0 8.9 8.0 5.657.5 and under 62.5 cents.__________ 8.1 7. 1 9.3 9.4 10.7 7.7 9.5 7.7 6.462.5 and under 67.5 cents___________ 6.6 6.4 7.2 7.7 9.4 6.7 9.3 7.2 7.067.5 and under 72.5 cents__________ 4.7 6.3 6.8 6.5 8.1 6.6 6.1 6.8 6.272.5 and under 77.5 cents___________ 3.9 4.8 5.1 5.8 6.1 6.8 7.7 7.1 6.777.5 and under 82.5 cents__________ 2.8 3.5 3.3 5.3 5.0 5.4 8.0 7.2 4.782.5 and under 87.5 cents___________ 1.8 2.9 3.4 4.5 3.7 4.8 4.5 7.0 6.187.5 and under 92.5 cents___________ 1.6 1.6 3.2 3.1 2.9 3.8 5.5 5.0 10.392.5 and under 100.0 cents__________ 1.1 1.7 2.0 2.3 2.8 4.0 4.4 4.6 8.5100.0 and under 110.0 cents_________ .9 1.0 1.3 1.4 2.1 4.1 3.1 5.1 8.1110.0 and under 125.0 cents_________ .3 .2 .6 .6 1.6 2.5 1.7 3.1 6.2125.0 and under 150.0 cents_________ .1 .2 .2 .3 .5 .8 .6 2.0 3.6150.0 cents and over_______________ 0) .1 .2 .1 .4 .4 1.0Total.. _ __________________ 100.0 100.0 100.0 100.0 100.0 100.0 100.0 100.0 100.0
Number of workers_______________ 7,153 5,174 4,124 3,732 1,120 2, 479 924 972 1,7351 Less than Ho of 1 percent.
Although practically all groups of plants showed some employees receiving under 25 cents an hour, the largest proportions were found in the lowest 3 groups. The latter covered 14 establishments, in which 3,163 workers were scheduled. The number of employees paid less than 25 cents amounted to 3.8 percent in plants averaging less than 30 cents, as much as 10.1 percent in those with averages between30.0 and 32.5 cents, and 2.0 percent in establishments averaging between 32.5 and 35.0 cents. In none of the other groups did the number earning below 25 cents exceed 1 percent.
The concentration of wage earners at exactly 25 cents an hour was quite conspicuous in the groups of plants averaging under 42.5 cents. The proportion receiving exactly 25 cents amounted to as much as54.6 percent in establishments averaging less than 30 cents, 29.1 percent in those with averages between 30.0 and 32.5 cents, 23.6 percent in plants averaging between 32.5 and 35.0 cents, and 16.9 percent in those with averages between 35.0 and 37.5 cents. In the group of establishments averaging between 37.5 and 42.5 cents, approximately one-tenth of the labor force earned exactly 25 cents. These groups of plants comprise a substantial portion of the coverage,
Digitized for FRASER http://fraser.stlouisfed.org/ Federal Reserve Bank of St. Louis
16 EARNINGS AND HOURS, SHOE AND ALLIED INDUSTRIES
including almost one-third of the establishments and three-tenths of the workers. In the remaining groups of plants, there was either a slight concentration or none at all at exactly 25 cents.
Geographical Differences
Unlike the situation in some other industries, there is no evidence that hourly earnings in the manufacture of boots and shoes vary significantly as between broad geographical regions.
Convincing evidence that geographical location is of minor importance was furnished by table 2, which presented the classification of plant averages by region and State. Thus, the 29 lowest-paid establishments, all of which averaged less than 37.5 cents, were scattered over 13 different States, located in the New England, Middle Atlantic, Middle Western, and Southern areas. Likewise, the 70 highest-paid plants, or those averaging 55.0 cents and over, were distributed over 12 different States, also found in each of these regions.
Even within a single State hourly earnings vary considerably. In most of the leading States in the industry, the plant averages covered a fairly wide range, with very little indication of a concentration toward a focal point. In fact, the heterogeneous nature of the data in these States is so pronounced that any broad generalization concerning their average hourly earnings should be made with caution. For example, the spread in plant averages in Massachusetts, which is still the most important State in this industry, was from 35.2 to63.6 cents. In New York, the second leading State, the range was even wider, namely from 35.1 to 90.0 cents. It was also fairly wide in Missouri, the third important State, where the plant averages covered a spread from 26.6 to 65.0 cents. The same is true in most of the other leading States, the plant averages ranging from 34.0 to73.3 cents in New Hampshire, from 33.1 to 64.5 cents in Illinois, from 31.3 to 62.9 cents in Pennsylvania, from 34.2 to 60.7 cents in Wisconsin, and from 38.9 to 61.7 cents in Ohio. In only one of the leading States, namely Maine, was the dispersion in plant averages relatively small, the figures ranging from 39.3 to 55.5 cents.
Table 6 presents. average hourly earnings by States. In some States, it should be remembered, the coverage is relatively small, which limits the significance of their averages. Moreover, it has been pointed out already that, in view of the wide spread in plant averages, the average hourly earnings of the States should be used with caution. For example, the average hourly earnings of plants surveyed in Missouri are higher than those in the three Southern States, two Middle Western States, two Middle Atlantic States, and one New England State. Despite this fact, the three lowest-wage plants found in the survey were in Missouri.
Digitized for FRASER http://fraser.stlouisfed.org/ Federal Reserve Bank of St. Louis
MANUFACTURE OF BOOTS AND SHOES 17
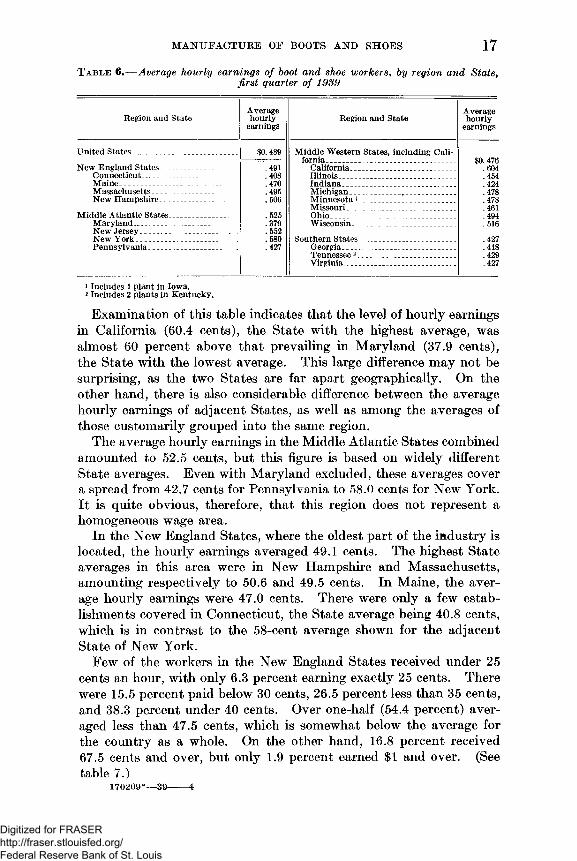
T a b l e 6 .— Average hourly earnings of hoot and shoe workers, hy region and State,first quarter o f 19S9
Region and State Averagehourlyearnings Region and State Averagehourlyearnings
United States __ __________ _ _ _ $0. 489 Middle Western States, including California $0. 476New England States. ., ___ ____ , . 491 California, _ ! 604Connecticut, . ___ . ___ ___ .408 Illinois _ _ _ , .454Maine___ , . 470 Indiana . 424Massachusetts___ __________ .495 Michigan____ _ _ ___ .478New Hampshire____ . .506 Minnesota 1_________ ____________ .478Missouri_______________ ____ .461Middle Atlantic States__ _____ ___ .525 Ohio_________ _____________ , .494Maryland, .379 Wisconsin . 516New Jersey, ____ _______ . .552New York , . 580 Southern States .427Pennsylvania- ___ - _ _, .427 Georgia, , .418Tennessee 2___ _____ . .. .429Virginia,.______ ______ _____ .... .4271 Includes 1 plant in Iowa.2 Includes 2 plants in Kentucky.Examination of this table indicates that the level of hourly earnings
in California (60.4 cents), the State with the highest average, was almost 60 percent above that prevailing in Maryland (37.9 cents), the State with the lowest average. This large difference may not be surprising, as the two States are far apart geographically. On the other hand, there is also considerable difference between the average hourly earnings of adjacent States, as well as among the averages of those customarily grouped into the same region.
The average hourly earnings in the Middle Atlantic States combined amounted to 52.5 cents, but this figure is based on widely different State averages. Even with Maryland excluded, these averages cover a spread from 42.7 cents for Pennsylvania to 58.0 cents for New York. It is quite obvious, therefore, that this region does not represent a homogeneous wage area.
In the New England States, where the oldest part of the industry is located, the hourly earnings averaged 49.1 cents. The highest State averages in this area were in New Hampshire and Massachusetts, amounting respectively to 50.6 and 49.5 cents. In Maine, the average hourly earnings were 47.0 cents. There were only a few establishments covered in Connecticut, the State average being 40.8 cents, which is in contrast to the 58-cent average shown for the adjacent State of New York.
Few of the workers in the New England States received under 25 cents an hour, with only 6.3 percent earning exactly 25 cents. There were 15.5 percent paid below 30 cents, 26.5 percent less than 35 cents, and 38.3 percent under 40 cents. Over one-half (54.4 percent) averaged less than 47.5 cents, which is somewhat below the average for the country as a whole. On the other hand, 16.8 percent received67.5 cents and over, but only 1.9 percent earned $1 and over. (See table 7.)
170209°— 39------4
Digitized for FRASER http://fraser.stlouisfed.org/ Federal Reserve Bank of St. Louis
18 EARNINGS AND HOURS, SHOE AND ALLIED INDUSTRIES
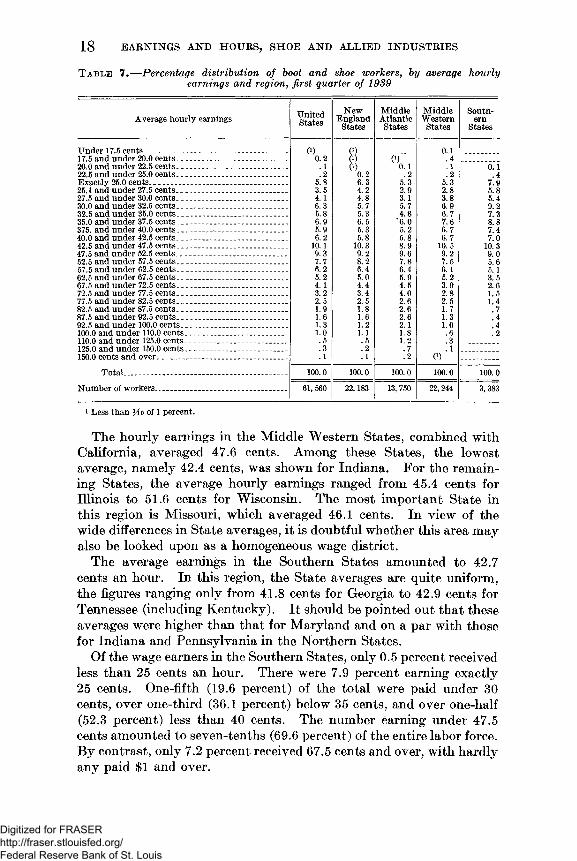
T a b l e 7 .— Percentage distribution of boot and shoe workers, by average hourly earnings and region, first quarter of 1939
Average hourly earnings UnitedStatesNewEnglandStates
MiddleAtlanticStatesMiddleWesternStates
SouthernStatesUnder 17.5 cents _______ _______ _________ __ (!) (i) 0.117.5 and under 20.0 cents, _ ______ __ ___________ 0.2 0) 0) .420.0 and under 22.5 cents_________________________ . 1 0) 0.1 . 1 0.122.5 and under 25.0 cents, _____________________ .2 0.2 .2 .2 .4Exactly 25.0 cents, ------------------------------------------- 5.8 6.3 5.3 5.3 7.925.1 and under 27.5 cents. ----------------------------------- 3.5 4.2 2.9 2.8 5.827.5 and under 30.0 cents, _______________________ 4.1 4.8 3.1 3.8 5.430.0 and under 32.5 cents. ______ _______________ 6.3 5.7 5.7 6.9 9.232.5 and under 35.0 cents______ _____ _____________ 5.8 5.3 4.8 6.7 7.335.0 and under 37.5 cents_________________________ 6.9 6.5 *6.0 7.6 8.8375. and under 40.0 cents. _______________ _____ _ 5.9 5.3 5.2 6.7 7.440.0 and under 42.5 cents. . . . _______ ____ ______ 6.2 5.8 5.8 6.7 7.042.5 and under 47.5 cents_________________________ 10.1 10.3 8.9 10.5 10.347.5 and under 52.5 cents. ______________________ 9.3 9.2 9.6 9.2 9.052.5 and under 57.5 cents. ______________________ 7.7 8.2 7.8 7.5 5.657.5 and under 62.5 cents. _______________________ 6.2 6.4 6.4 6.1 5.162.5 and under 67.5 cents_________________________ 5.2 5.0 5.9 5.2 3.567.5 and under 72.5 cents. .. _____ _________________ 4.1 4.4 4.5 3.9 2.672.5 and under 77.5 cents___ _______ _____________ 3.2 3.4 4.0 2.8 1.577.5 and under 82.5 cents______ _________________ 2.5 2.5 2.6 2.5 1.482.5 and under 87.5 cen ts.. ______________________ 1.9 1.8 2.6 1.7 .787.5 and under 92.5 cents. ______________________ 1.6 1.6 2.6 1.3 .492.5 and under 100.0 cents. _____________________ 1.3 1.2 2.1 1.0 .4100.0 and under 110.0 cents. -------------------------------- 1.0 1.1 1.8 .6 .2110.0 and under 125.0 cents. _. ________ ________ .5 .5 1.2 .3125.0 and under 150.0 cents___ ___ ___________ ____ .3 .2 . 7 . 1150.0 cents and over ________________ ______ ___ . 1 . 1 .2 0 )
Total______________________ . --------- . . 100.0 100.0 100.0 100.0 100.0Number of workers._____________________________ 61, 560 22,183 13, 750 22, 244 3, 383
i Less than Ho of 1 percent.
The hourly earnings in the Middle Western States, combined with California, averaged 47.6 cents. Among these States, the lowest average, namely 42.4 cents, was shown for Indiana. For the remaining States, the average hourly earnings ranged from 45.4 cents for Illinois to 51.6 cents for Wisconsin. The most important State in this region is Missouri, which averaged 46.1 cents. In view of the wide differences in State averages, it is doubtful whether this area may also be looked upon as a homogeneous wage district.
The average earnings in the Southern States amounted to 42.7 cents an hour. In this region, the State averages are quite uniform, the figures ranging only from 41.8 cents for Georgia to 42.9 cents for Tennessee (including Kentucky). It should be pointed out that these averages were higher than that for Maryland and on a par with those for Indiana and Pennsylvania in the Northern States.
Of the wage earners in the Southern States, only 0.5 percent received less than 25 cents an hour. There were 7.9 percent earning exactly 25 cents. One-fifth (19.6 percent) of the total were paid under 30 cents, over one-third (36.1 percent) below 35 cents, and over one-half (52.3 percent) less than 40 cents. The number earning under 47.5 cents amounted to seven-tenths (69.6 percent) of the entire labor force. By contrast, only 7.2 percent received 67.5 cents and over, with hardly any paid $1 and over.
Digitized for FRASER http://fraser.stlouisfed.org/ Federal Reserve Bank of St. Louis
MANUFACTURE OF BOOTS AND SHOES 19
Although hourly earnings in the Southern States are generally lower than those in the remainder of the country, it should be remembered that a very small part of the industry is located in the southern region. Of the total coverage, only 17 plants with 3,383 wage earners (5.5 percent) were in the Southern States. On the other hand, the survey included 108 establishments in New England and 87 in the Middle Western States, each territory covering approximately 22,000 employees, or 36 percent of the total. The remaining 72 plants, with 13,750 workers (22.3 percent), were located in the Middle Atlantic States.
If an attempt is made to establish wage districts on the basis of limited areas, comprising a portion of one State or contiguous portions of two or more States, there is also found a considerable degree of heterogeneity in the hourly earnings. This leads to the conclusion that, on the whole, other factors or combinations of factors than mere geographical location accounted for differences in wages within the industry.
Influence of Sise of Community
In selecting the sample for this survey, it will be remembered, the Bureau took into consideration the distribution of the boot and shoe industry by size of community.4 Analysis of the coverage for the country as a whole indicated that approximately one-half of the manufacture of boots and shoes is located in the larger metropolitan areas. Thus, 84 plants with 15,242 workers (24.7 percent of the total labor force) were found in communities with a population of 1,000,000 and over, and 63 plants with 15,553 workers (25.3 percent) were in centers having between 100,000 and 1,000,000. Of the remainder, 56 plants with 12,417 workers (20.2 percent) were in places with between 20,000 and 100,000 population, and 81 plants with 18,348 employees (29.8 percent) were in communities of less than 20,000 population. It should be pointed out, however, that only a relatively small part of the sample— 7 plants with 1,171 workers (1.9 percent)— was in rural territory (i. e., places with less than 2,500 population).
It is also significant to describe the distribution of the industry by size of community in different parts of the country.
In the New England States, considerably more than one-half (54.9 percent) of all workers were concentrated in metropolitan districts with a population of 100,000 and over. These cover such important shoe centers as Haverhill, Brockton, Worcester, Boston, and Lowell.
i By size of community is meant here the size of metropolitan area within which the plant is located. For places with a population of 100,000 or more, the Bureau utilized the metropolitan districts as defined by the U. S. Bureau of the Census. On the other hand, for communities with less than 100,000, similar metropolitan centers were set up including not only the population within a particular political subdivision but also that of the nearby areas. Roughly speaking, the metropolitan districts correspond to labor-market areas, within which there is competition among workers for jobs as well as among employers for workers.
Digitized for FRASER http://fraser.stlouisfed.org/ Federal Reserve Bank of St. Louis
2 0 EARNINGS AND HOURS, SHOE AND ALLIED INDUSTRIES
The remainder of the industry is scattered throughout the rest of Massachusetts and other New England States, with important concentrations in southern New Hampshire and southern Maine. While28.6 percent of the sample were found in communities with a population between 20,000 and 100,000, only one-sixth (16.5 percent) were located in places of under 20,000.
The proportion of the total coverage in the Middle Atlantic States situated in metropolitan areas of 100,000 population and over was even greater, namely seven-tenths (69.8 percent) of all employees. These communities include such important shoe centers as the Binghamton and New York City metropolitan districts, as well as the lesser ones of Philadelphia and Rochester. A considerable part (21.0 percent) of the sample, however, was found in places of less than 20,000 population. This is particularly true of southeastern Pennsylvania and western Maryland.
In the Middle Western States, there was also a concentration of the industry in the larger metropolitan areas, considerably more than one- third (37.0 percent) of the coverage being found in communities with a population of 100,000 and over. These places include the important shoe centers of St. Louis, Chicago, Milwaukee, Cincinnati, and Columbus. A much larger proportion (46.2 percent), however, was situated in communities under 20,000 in these States, as compared with other Northern States. This was especially true of places between 5,000 and 10,000 population, many of which are located in southern Illinois and throughout Missouri and Wisconsin.
There are no metropolitan areas with a population of 500,000 and over in the Southern States. However, nearly one-fourth (23.1 percent) of the total workers in the southern sample were located in communities between 100,000 and 500,000. Less than one-third (31.7 percent) of the coverage was concentrated in centers between 20,000 and 50,000, but nearly one-half (45.2 percent) was scattered over places of less than 20,000 population.
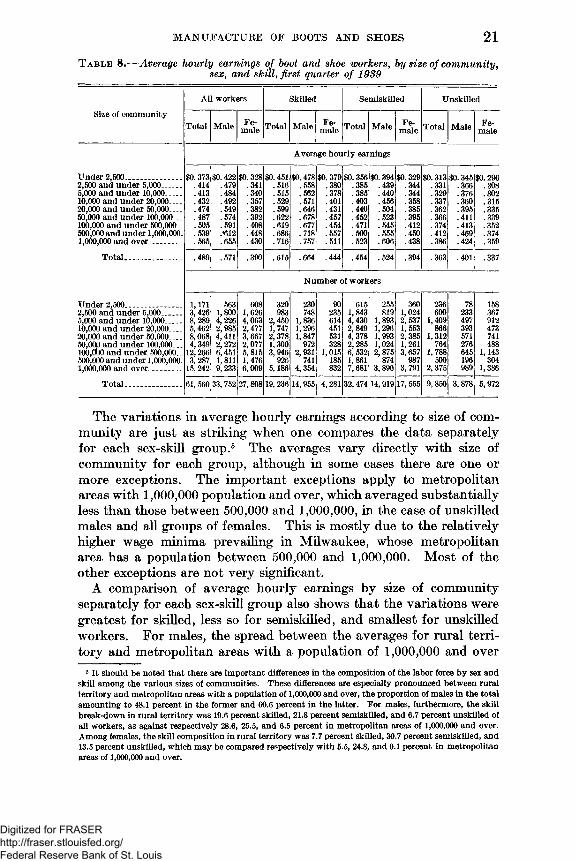
As may be seen from table 8, the average hourly earnings of all workers in this industry varied directly with size of community. In rural territory, the average amounted to 37.3 cents, which may be compared with 56.5 cents in metropolitan areas with a population of1,000,000 and over. This is a difference of as much as 19.2 cents. There was very little difference in hourly earnings between places of 2,500 and under 5,000 and those of 5,000 and less than 10,000, both averaging about 41 cents. On the other hand, each succeeding class of size of community shows an increase in the average over the class below it.
Digitized for FRASER http://fraser.stlouisfed.org/ Federal Reserve Bank of St. Louis
MANUFACTURE OF BOOTS AND SHOES 2 1
T a b l e 8 .— Average hourly earnings of hoot and shoe workers, by size o f community, sex, and skill, first quarter o f 1989
Size of community
All workers Skilled Semiskilled Unskilled
Total Male Female Total Male Fe
male Total Male Female Total Male Fe
male
Under 2,500_______________2.500 and under 5,000_____5.000 and under 10,000____10.000 and under 20,000___20.000 and under 50,000___50.000 and under 100,000...100.000 and under 500,000. _500.000 and under 1,000,000.1.000. 000 and over____________ . . .
Total_______________
Under 2,500_______________2.500 and under 5,000_____5.000 and under 10,000 . . .10.000 and under 20,000___20.000 and under 50,000___50.000 and under 100,000... 100,CfoO and under 500,000..500.000 and under 1,000,000.1.000. 000 and over____________ _____________
Total_______________
Average hourly earnings
$0.373 .414 .413 .432 .474 .487 .505 .539 .565
$0.422 .479 .484 .492 .549 .574 .591 .*612 .655
$0.328 .341 .340 .357 .382 .392 .408 .448 .430
$0.451 .516 .515 .529 .599 .622 .619 .686 .716
$0. 478 .558 .562 .571 .646 .678 .677 .718 .757
$0. 379 .380 .378 .401 .431 .457 .454 .557 .511
$0.356 .385 .385 .403 .440 .452 .471 .500 .523
$0.394 .439 .440 .456 .504 .523 .545 .555 .606
$0,329.344.344.358.385.395.412.450.438
$0. 313 .331 .329 .337 .362 .366 .374 .412 .386
$0.345 .366 .376 .360 .395 .411 .413 .469 .424
$0,296.308.302.315.335.339.352.374.359
.337.489 .571 .390 .615 .664 .444 .454 .524 .394 .363 .401
Number of workers
1,171 3,426 8, 289 5,462 8,068 4,349
12,266 3, 287
15,242
563 1,800 4,226 2,985 4,411 2,272 6,451 1,811 9,233
608 1,626 4,063 2,477 3,657 2,077 5,815 1,476 6,009
320 983
2,450 1,747 2,378 1,300 3,946
926 5,186
230 748
1,836 1,296 1,847
972 2,931
741 4,354
90235614451531328
1,015185832
615 1,843 4,430 2,849 4, 378 2,285 6, 532 1,861 7,681
255 819
1,893 1,296 1,993 1,024 2,875
874 3,890
360 1,024 2, 5371, 5532, 385 1,261 3,657
9873,791
236 600
1,409 866
1,312 764
1,788 500
2, 375
78233497393571276645196989
158 367 912 473 741 488
1,143 304
1,386
61, 560 33, 752 27, 808 19,236 14,955 4, 281 32,474 14,919 17, 555 9,850 3, 878 5,972
The variations in average hourly earnings according to size of community are just as striking when one compares the data separately for each sex-skill group.5 The averages vary directly with size of community for each group, although in some cases there are one or more exceptions. The important exceptions apply to metropolitan areas with 1,000,000 population and over, which averaged substantially less than those between 500,000 and 1,000,000, in the case of unskilled males and all groups of females. This is mostly due to the relatively higher wage minima prevailing in Milwaukee, whose metropolitan area has a population between 500,000 and 1,000,000. Most of the other exceptions are not very significant.
A comparison of average hourly earnings by size of community separately for each sex-skill group also shows that the variations were greatest for skilled, less so for semiskilled, and smallest for unskilled workers. For males, the spread between the averages for rural territory and metropolitan areas with a population of 1,000,000 and over
5 It should be noted that there are important differences in the composition of the labor force by sex and skill among the various sizes of communities. These differences are especially pronounced between rural territory and metropolitan areas with a population of 1,000,000 and over, the proportion of males in the total amounting to 48.1 percent in the former and 60.6 percent in the latter. For males, furthermore, the skill break-down in rural territory was 19.6 percent skilled, 21.8 percent semiskilled, and 6.7 percent unskilled of all workers, as against respectively 28.6, 25.5, and 6.5 percent in metropolitan areas of 1,000,000 and over. Among females, the skill composition in rural territory was 7.7 percent skilled, 30.7 percent semiskilled, and 13.5 percent unskilled, which may be compared respectively with 5.5, 24.8, and 9.1 percent in metropolitan areas of 1,000,000 and over.
Digitized for FRASER http://fraser.stlouisfed.org/ Federal Reserve Bank of St. Louis
2 2 EARNINGS AND HOURS, SHOE AND ALLIED INDUSTRIES
was 27.9 cents for skilled, 21.2 cents for semiskilled, and 7.9 cents for unskilled 6 employees. Among females, the range between the averages for rural territory and communities between 500,000 and 1,000,- 000, which showed the highest figures, amoimted to 17.8 cents for skilled, 12.1 cents for semiskilled, and 7.8 cents for unskilled workers.
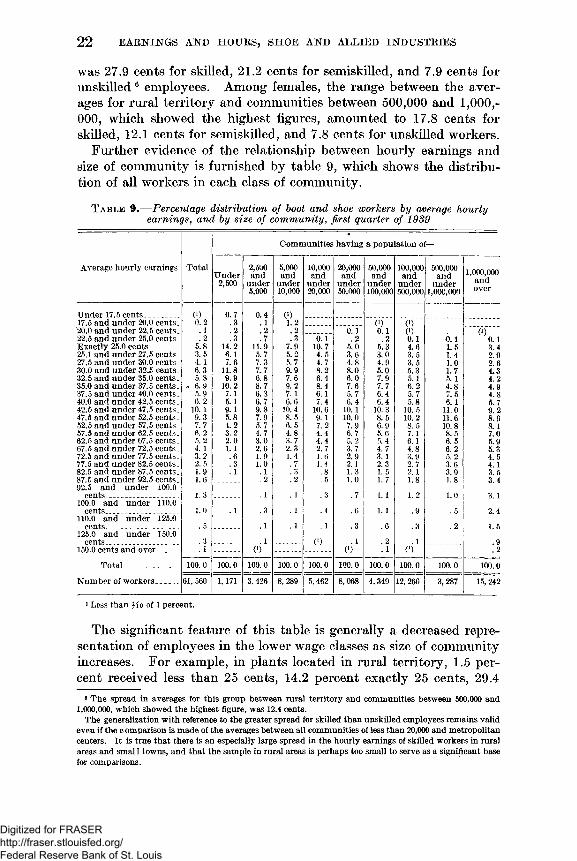
Further evidence of the relationship between hourly earnings and size of community is furnished by table 9, which shows the distribution of all workers in each class of community.
T a b l e 9 .— Percentage distribution of boot and shoe workers by average hourly earnings, and by size of com munity, first quarter of 1939
Communities having a population of—
Average hourly earnings TotalUnder
2,500
2,500and
under5,000
5.000 and
under10.000
10,000and
under20,000
20,000and
under50,000
50.000 and
under100.000
100,000and
under500,000
500,000and
under1,000,000
1,000,000andover
Under 17.5 cents_______ U) 0.7 0.4 0 )17.5 and under 20.0 cents. 0.2 .3 . 1 1.2 0 ) ( ! )
20.0 and under 22.5 cents. . 1 .2 .2 .2 0.1 0.1 0 ) (i)22.5 and under 25.0 cents. . 2 .3 .7 .3 0.1 .2 .2 0.1 0.1 0.1Exactly 25.0 cents________ 5.8 14.2 11.9 7.9 10.7 5.0 5.3 4.6 1.5 3.425.1 and under 27.5 cents. 3. 5 6.1 5.7 5.2 4.5 3.6 3.0 3.5 1.4 2.027.5 and under 30.0 cents.. 4. 1 7.6 7.3 5.7 4.7 4.8 4.9 3. 5 1.0 2.630.0 and under 32.5 cents. 6.3 11.8 7.7 9.9 8.2 8.0 5.0 5.3 1.7 4.332.5 and under 35.0 cents. 5.8 9.9 6.8 7.6 6.4 6.0 7.9 5.1 5. 1 4.235.0 and under 37.5 cents. - 6.9 10.2 8.7 9.2 8.4 7.6 7.7 6.2 4.8 4.937.5 and under 40.0 cents. 5.9 7.1 6.3 7. 1 6.1 5.7 6.4 5.7 7. 5 4.840.0 and under 42.5 cents. 6.2 5.1 6.7 6.6 7.4 6.4 6. 4 5.8 6.1 5.742.5 and under 47.5 cents. 10.1 9.1 9.8 10.4 10.6 10. 1 10.3 10. 5 11.0 9.247.5 and under 52.5 cents. 9.3 5.8 7.9 8; 5 9.1 10.0 8. 5 10. 2 11.6 8.952.5 and under 57.5 cents. 7.7 4.2 5.7 6.5 7. 2 7.9 6.9 8.5 10.8 8.157.5 and under 62.5 cents. 6. 2 3.2 4. 7 4.8 4. 4 6.7 5.6 7. 1 8.5 7.062.5 and under 67.5 cents. 5. 2 2.0 3.0 3.7 4.4 5 2 5.4 6. 1 6. 5 5.967.5 and under 72.5 cents . 4.1 1.1 2.6 2.3 2.7 i . i 4.7 4.8 6.2 5.372.5 and under 77.5 cents. 3. 2 .6 1.9 1. 4 1. 6 2.9 3. 1 3.9 5.2 4.577.5 and under 82.5 cents. 2. 5 . 3 1.0 . 7 1. 4 2. 1 2.3 2.7 3.6 4.182.5 and under 87.5 cents. 1.9 . 1 . 1 . 3 .8 1. 3 1. 5 2. 1 3.9 3.587.5 and under 92.5 cents. 1.6 2 . 2 . 5 1.0 1.7 1.8 1.8 3.492.5 and under 100.0
cents. .. __ __ 1. 3 , 1 . 1 . 3 . 7 1. 1 1. 2 1.0 S 3.1100.0 and under 110.0
cents,._ . _ . . . ______ 1.0 . 1 .3 . 1 .4 .6 1. 1 .9 .5 2.4110.0 and under 125.0
cents____________________ . 5 ____ . 1 . 1 . 1 .3 .6 .3 .2 1.5125.0 and under 150.0
cents. . 3 . 1 0 ) . 1 t 2 . 1 .9150.0 cents and over . 1 0 ) 0 ) ’. 1 o . 2
Total______ ________ 100.0 100.0 100.0 100.0 100.0 100.0 100.0 100.0 100.0 100.0
Number of workers ___ 61, 560 1,171 3,426 8,289 5, 462 8,068 4, 349 12, 266 3, 287 15, 242
1 Less than Y\o of 1 percent.
The significant feature of this table is generally a decreased representation of employees in the lower wage classes as size of community increases. For example, in plants located in rural territory, 1.5 percent received less than 25 cents, 14.2 percent exactly 25 cents, 29.4
6 The spread in averages for this group between rural territory and communities between 500,000 and 1,000,000, which showed the highest figure, was 12.4 cents.
The generalization with reference to the greater spread for skilled than unskilled employees remains valid even if the c omparison is made of the averages between all communities of less than 20,000 and metropolitan centers. It is true that there is an especially large spread in the hourly earnings of skilled workers in rural areas and smal 1 towns, and that the sample in rural areas is perhaps too small to serve as a significant base for comparisons.
Digitized for FRASER http://fraser.stlouisfed.org/ Federal Reserve Bank of St. Louis
MANUFACTURE OF BOOTS AND SHOES 23
percent below 30 cents, 51.1 percent under 35 cents, and 68.4 percent less than 40 cents. By contrast, in metropolitan areas with a population of 1,000,000 and over, hardly any were paid below 25 cents, 3.4 percent exactly 25 cents, 8.1 percent under 30 cents, 16.6 percent less than 35 cents, and 26.3 percent below 40 cents.
Conversely, there is on the whole an increased proportion of workers in the higher wage classes as size of community increases. In rural territory, the number earning 67.5 cents and over amounted to only2.2 percent, with very few employees receiving $1 and over. The respective figures for metropolitan areas with a population of 1,000,000 and over were 28.9 and 5.0 percent.
Comparisons w ith Wage Standards Provided in Fair Labor Standards Act
In accordance with the provisions of the Fair Labor Standards Act,7 a minimum of 25 cents per hour became effective on October 24, 1938. Hence, it is important to note how the wage structure of the industry has adjusted itself to this minimum. The 25-cent minimum will advance to 30 cents on October 24, 1939. In the meantime, it may be raised under conditions specified in the act to any point not to exceed 40 cents upon the recommendation of the Industry Committee and the approval of the Administrator of the Wage and Hour Division.8
As pointed out previously, relatively few (0.5 percent) workers in the boot and shoe industry were found earning under 25 cents an hour. Moreover, the effect of the law has been to cause some concentration of wage earners at exactly 25.0 cents, especially for unskilled females.
On October 24, 1939, when the 30-cent minimum goes into effect, it will affect directly 13.9 percent of all workers in the industry, who were earning less than 30 cents an hour at the time of the survey. The number of males paid under 30 cents amounted to only 6.1 percent, which may be compared with 23.3 percent of all females. For males, only 1.6 percent of the skilled and 7.2 percent of the semiskilled were found below that limit, as against 19.3 percent of the unskilled employees. The respective figures for females were 11.4,20.6, and 40.2 percent.
There were 26.0 percent of the workers in the industry receiving under 35 cents an hour, the figures amounting to only 12.1 percent for all males but as much as 42.9 percent for all females. The proportion was still relatively small for skilled males, namely 4.1 percent. It was not very substantial for semiskilled males, only 14.4 percent
7 It should be remembered that this law applies only to plants engaged in interstate commerce, s It should be remembered that any adjustment of the wage structure to the 25-cent minimum, as well
as to higher minima in the future, may affect not only the workers earning under these minima but also those in the higher wage classes. This is due to the fact that plants frequently find it necessary to maintain existing occupational and other differentials in hourly earnings.
Digitized for FRASER http://fraser.stlouisfed.org/ Federal Reserve Bank of St. Louis
24 EARNINGS AND HOURS, SHOE AND ALLIED INDUSTRIES
of whom were paid less than 35 cents. However, the proportions were considerable for unskilled males (34.2 percent) and for skilled (25.0 percent), semiskilled (40.1 percent), and unskilled (64.2 percent) females.
Almost two-fifths (38.8 percent) of employees in the industry were paid less than 40 cents an hour. The proportion of males found under that limit was about one-fifth (21.3 percent), while for females it amounted to exactly three-fifths. Only 8.2 percent of skilled males earned below 40 cents, but the proportions were relatively large for the remaining sex-skill groups, varying from one-fourth (25.2 percent) for semiskilled males to four-fifths (79.1 percent) for unskilled females.
It is important to note to what extent the wage structure of the various groups of establishments will have to be adjusted to conform to the 30-cent minimum on October 24, 1939. The lowest-paid plants, namely those with averages of less than 30 cents an hour, showed 76.9 percent of their employees paid under 30 cents. The proportion amounted to 56.1 percent in establishments averaging between 30.0 and 32.5 cents and 43.7 percent in those with averages between 32.5 and 35.0 cents. It varied from over one-third to one-fifth in the groups of plants averaging between 35.0 and 42.5 cents. Hence, the largest adjustment will also take place in establishments with averages below 42.5 cents. The proportion of workers earning less than 30 cents was only 14 percent in plants averaging between 42.5 and 47.5 cents and about 7 to 8 percent in those with averages between 47.5 and52.5 cents. In the remaining groups of establishments, the number receiving under 30 cents varied from 1 to 5 percent. (See table 5.)
If 35 cents is taken as the limit, the largest proportions of workers below that figure are found in the groups of plants averaging under 50 cents, the percentages ranging from 86.8 in establishments with averages below 30 cents to 20.2 in those averaging between 47.5 and 50.0 cents. These groups include 162 plants with 34,147 employees, which is well over one-half of the industry’s coverage. In the remaining groups of establishments, the number receiving less than 35 cents ranged from 17.9 percent in plants with averages between 50.0 and52.5 cents to 2.2 percent in those averaging 70 cents and over.
With 40 cents as the limit, the largest proportions of wage earnersbelow that figure were found in the groups of establishments with averages under 57.5 cents, the spread being from 91.8 percent in plants averaging below 30 cents to 21.8 percent in those with averages between 55.0 and 57.5 cents. In the remaining groups of establishments, the number earning less than 40 cents ranged from 14.6 percent in plants averaging between 57.5 and 60.0 cents to 6.5 percent in those with averages of 70 cents and over.
Digitized for FRASER http://fraser.stlouisfed.org/ Federal Reserve Bank of St. Louis
MANUFACTURE OF BOOTS AND SHOES 25
Comparisons w ith Wage Standards Provided in N R A Code
The minimum wages set by the code of fair competition under the NR A varied by sex, region, and size of city. Hence, it is interesting at this point to note to what extent the boot and shoe industry has deviated from the former wage minima of the NR A.
The Southern States covered here are part of a separate region defined in the NR A code, which provided for it a minimum hourly rate of 35 cents for males and 30 cents for females. This applied to all cities and towns. These rates also applied to northern cities of less than 20,000 population.
An analysis of the distributions by sex indicates that the plants in the Southern States and small northern cities have departed considerably from the former NRA wage standards. Thus, as many as three-tenths of the females in the southern sample earned under 30 cents an hour at the time of the survey. For males, the number receiving less than 35 cents amounted to over one-fifth (22.1 percent) of the total. In places with a population of under 20,000 in the North, the number of males earning less than 35 cents was over one- sixth (18.1 percent) of the total, while the number of females receiving below 30 cents was one-third of all women.
In the remaining cities of the Northern States, the NRA minimum hourly rates were 37.5 cents for males and 32.5 cents for females in cities with a population of over 250,000; 36.25 cents for males and31.25 cents for females in those between 20,000 and 250,000, inclusive; and, as has been noted, 35 cents for males and 30 cents for females in cities and towns of less than 20,000 population.
The establishments in the larger cities in the North have deviated from the former NRA wage minima only slightly less than plants in the smaller cities. In cities 9 with a population of 250,000 and over, the number of males paid below 37.5 cents amounted to over one- tenth (11.2 percent) of the total at the time of the survey, while nearly one-fourth (23.8 percent) of the females earned under 32.5 cents. Likewise, one-eighth (12.4 percent) of the males received less than36.25 cents and one-fourth (25.4 percent) of the females below 31.25 cents in communities between 20,000 and 250,000.10
In connection with this analysis, however, it should be pointed out that the code permitted paying apprentices during a 6-week period a rate not less than 80 percent of the minimum, limiting their number to not more than 5 percent of all workers in any establish-
9 It should be remembered that the figures here cover metropolitan areas, as defined in footnote 4 on p. 19, while the N R A analysis was on the basis of size of city. However, this distinction is not sufficiently important to invalidate the above comparisons.
19 These two percentages are estimates based on interpolation respectively within the class intervals of 35.0 to 37.5 and 30.0 to 32.5 cents, on the assumption that the number of workers in each class are evenly distributed throughout the interval. This is a fair assumption to make in the boot and shoe industry, in which most employees are piece workers, so that their average hourly earnings are apt to fall at any point.
170209°— 39— 5
Digitized for FRASER http://fraser.stlouisfed.org/ Federal Reserve Bank of St. Louis
2 6 EARNINGS AND HOURS, SHOE AND ALLIED INDUSTRIES
ment. Moreover, the code specified that “ employers and employees may make mutually satisfactory wage agreements covering the employment of the infirm, partially disabled, or physically handicapped, if such employees do not constitute more than 5 percent of the total number of employees.” It is fairly certain that these groups of workers would not account for the total number earning under the former code minima.
Earnings of Union and Nonunion Workers 11Of the 284 boot and shoe establishments included in the sample,
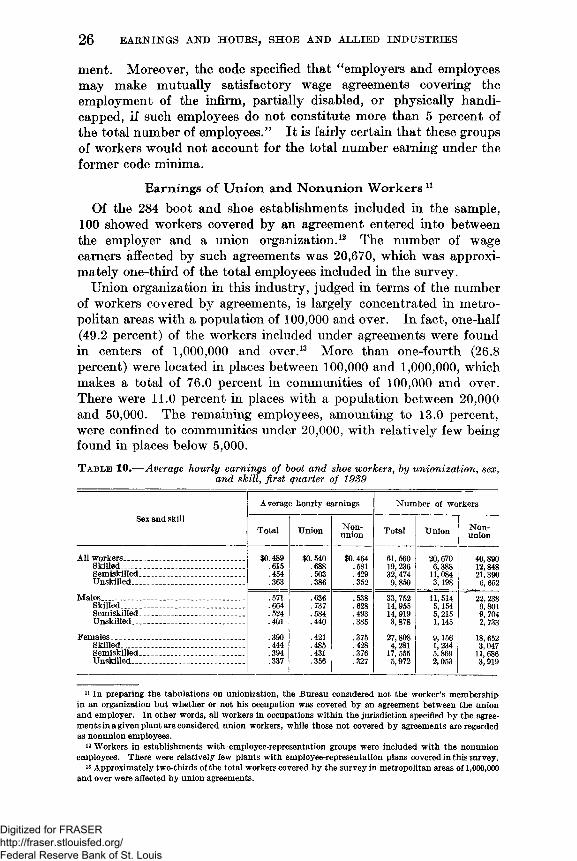
100 showed workers covered by an agreement entered into between the employer and a union organization.12 The number of wage earners affected by such agreements was 20,670, which was approximately one-third of the total employees included in the survey.
Union organization in this industry, judged in terms of the number of workers covered by agreements, is largely concentrated in metropolitan areas with a population of 100,000 and over. In fact, one-half (49.2 percent) of the workers included under agreements were found in centers of 1,000,000 and over.13 More than one-fourth (26.8 percent) were located in places between 100,000 and 1,000,000, which makes a total of 76.0 percent in communities of 100,000 and over. There were 11.0 percent in places with a population between 20,000 and 50,000. The remaining employees, amounting to 13.0 percent, were confined to communities under 20,000, with relatively few being found in places below 5,000.T a b l e 10 .— Average hourly earnings of boot and shoe workers, by unionization , sex,
and skill, first quarter of 1939
Average hourly earnings Number of workers
Sex and skillTotal Union Non
union Total Union Nonunion
All workers___ __________ ______ ___________ $0.489 $0,540 $0.464 61, 560 20,670 40,890Skilled_________________________________ .615 .688 .581 19,236 6,388 12,848Semiskilled________________________ ___ .454 .503 .429 32,474 11,084 21,390Unskilled______________ __________ ___ .363 .386 .352 9, 850 3,198 6, 652
Males______ . — _____________________ .571 .636 .538 33, 752 11, 514 22,238Skilled_________________________________ .664 .737 .628 14,955 5,154 9,801Semiskilled____________ _____ __________ .524 .584 .493 14, 919 5,215 9,704Unskilled_______________ _____________ .401 .440 .385 3,878 1,145 2, 733
Females___________________________ _______ .390 .421 .375 27,808 9,156 18, 652Skilled_________________________________ .444 .485 .428 4,281 1,234 3,047Semiskilled. ________ _ _________ . .394 .431 .376 17, 555 5,869 11, 686Unskilled____________________ ________ .337 .356 .327 5,972 2,053 3,919
11 In preparing the tabulations on unionization, the Bureau considered not the worker’s membership in an organization but whether or not his occupation was covered by an agreement between the union and employer. In other words, all workers in occupations within the jurisdiction specified by the agreements in a given plant are considered union workers, while those not covered by agreements are regarded as nonunion employees.
12 Workers in establishments with employee-representation groups were included with the nonunion employees. There were relatively few plants with employee-representation plans covered in this survey.
13 Approximately two-thirds of the total workers covered by the survey in metropolitan areas of 1,000,000 and over were affected by union agreements.
Digitized for FRASER http://fraser.stlouisfed.org/ Federal Reserve Bank of St. Louis
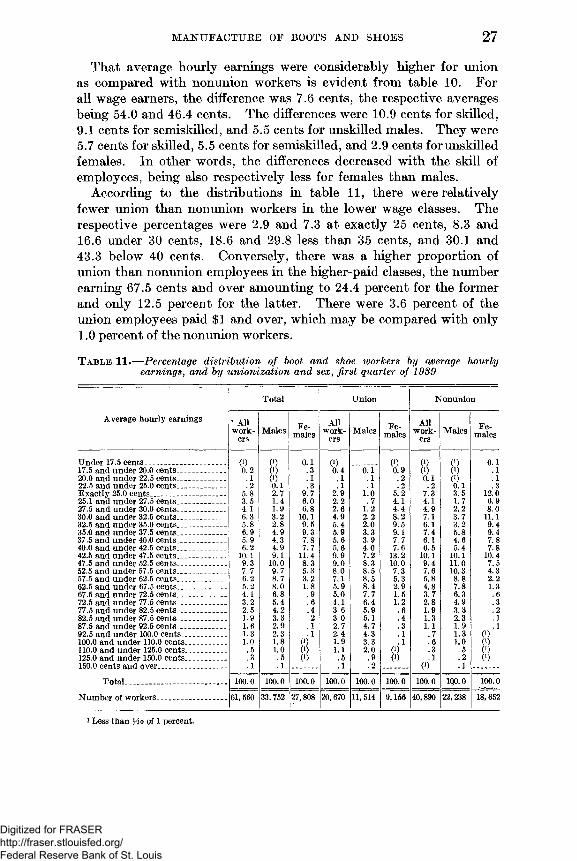
MANUFACTURE OF BOOTS AND SHOES 27That average hourly earnings were considerably higher for union
as compared with nonunion workers is evident from table 10. For all wage earners, the difference was 7.6 cents, the respective averages being 54.0 and 46.4 cents. The differences were 10.9 cents for skilled,9.1 cents for semiskilled, and 5.5 cents for unskilled males. They were5.7 cents for skilled, 5.5 cents for semiskilled, and 2.9 cents for unskilled females. In other words, the differences decreased with the skill of employees, being also respectively less for females than males.
According to the distributions in table 11, there were relatively fewer union than nonunion workers in the lower wage classes. The respective percentages were 2.9 and 7.3 at exactly 25 cents, 8.3 and16.6 under 30 cents, 18.6 and 29.8 less than 35 cents, and 30.1 and43.3 below 40 cents. Conversely, there was a higher proportion of union than nonunion employees in the higher-paid classes, the number earning 67.5 cents and over amounting to 24.4 percent for the former and only 12.5 perceut for the latter. There were 3.6 percent of the union employees paid $1 and over, which may be compared with only1.0 percent of the nonunion workers.
T a b l e 11 .— Percentage distribution of boot and shoe workers by average hourly earnings, and by unionization and sex, first quarter of 1989
Average hourly earnings
Total Union Nonunion
• All work
ersMales Fe
malesAll
workers
Males Females
Allwork
ersMales Fe
males
Under 17.5 cents _ _ _ __ _ _ 0 ) 0 ) 0.1 (i) (!) (i) (!) 0.117.5 and under 20.0 cents. _ __________ 0.2 0 ) .3 0.4 0.1 0.9 0 ) 0 ) .120.0 and under 22.5 cents _ ___ .1 0 ) .1 .1 .1 .2 0.1 0 ) .122.5 and under 25.0 cents. _____ _ _ .2 0.1 .3 .1 .1 .2 .2 0.1 .3Exactly 25.0 cents_______________ _____ 5.8 2.7 9.7 2.9 1.0 5.2 7.3 3.5 12.025.1 and under 27.5 cents ________ 3.5 1.4 6.0 2.2 .7 4.1 4.1 1.7 6.927.5 and under 30.0 cents_____________ 4.1 1.9 6.8 2.6 1.2 4.4 4.9 2.2 8.030.0 and under 32.5 cents________ 6.3 3.2 10.1 4.9 2.2 8.2 7.1 3.7 11.132.5 and under 35.0 cents_____________ 5.8 2.8 9.5 5.4 2.0 9.5 6.1 3.2 9.435.0 and under 37.5 cents_____ _______ 6.9 4.9 9.3 5.9 3.3 9.1 7.4 5.8 9.437.5 and under 40.0 cents_________ ___ 5.9 4.3 7.8 5.6 3.9 7.7 6.1 4.6 7.840.0 and under 42.5 cents___ _____ ___ 6.2 4.9 7.7 5.6 4.0 7.6 6.5 5.4 7.842.5 and under 47.5 cents___ ______ __ 10.1 9.1 11.4 9.9 7.2 13.2 10.1 10.1 10.447.5 and under 52.5 cents.---------___ _ 9.3 10.0 8.3 9.0 8.3 10.0 9.4 11.0 7.552.5 and under 57.5 cents ___ ---------- 7.7 9.7 5.3 8.0 8.5 7.3 7.6 10.3 4.357.5 and under 62.5 cents_____ __ _ 6.2 8.7 3.2 7.1 8.5 5.3 5.8 8.8 2.262.5 and under 67.5 cents._ ---------- _ 5.2 8.0 1.8 5.9 8.4 2.9 4.8 7.8 1.367.5 and under 72.5 cents___ __ __ __ 4.1 6.8 .9 5.0 7.7 1.5 3.7 6.3 .672.5 and under 77.5 cents_____________ 3.2 5.4 .6 4.1 6.4 1.2 2.8 4.9 .377.5 and under 82.5 cents_____________ 2.5 4.2 .4 3.6 5.9 .6 1.9 3.3 .282.5 and under 87.5 cents___ ---------- _ 1.9 3.3 .2 3.0 5.1 .4 1.3 2.3 .187.5 and under 92.5 cents___ ________ 1.6 2.9 .1 2.7 4.7 .3 1.1 1.9 .192.5 and under 100.0 cents._ . . . . .__ 1.3 2.3 .1 2.4 4.3 .1 .7 1.3 0 )100.0 and under 110.0 cents___ _______ 1.0 1.8 (0 1.9 3.3 .1 .6 1.0 0110.0 and under 125.0 cents__________ .5 1.0 0) 1.1 2.0 C1) .3 .5 0)125.0 and under 150.0 cents... ______ .3 .5 0) .5 .9 0) .1 .2 (l)150.0 cents and over __ ___. . 1 . 1 .1 .2 0) .1
Total ___________ . . . ------------ 100.0 100.0 100.0 100.0 100.0 100.0 100.0 1Q0.0 100.0
Number of workers----------------------------- 61, 560 33, 752 27,808 20, 670 11,514 9,156 40,890 22,238 18, 652
i Less than Ho of 1 percent.
Digitized for FRASER http://fraser.stlouisfed.org/ Federal Reserve Bank of St. Louis
2 8 EARNINGS AND HOURS, SHOE AND ALLIED INDUSTRIES
Variations by Retail Price of Shoes
Another factor that should be considered in connection with hourly earnings in this industry is the retail price of shoes manufactured in various plants. In analyzing the data on basis of retail price, however, it is necessary to exclude all establishments making slippers, as well as those engaged in manufacturing cut stock and findings for exclusive use by boot and shoe factories belonging to the same company. This reduces the total coverage to 241 plants with 56,249 wage earners, thus including only that part of the industry engaged in the production of boots and shoes.
Most establishments specialize in shoes falling within a narrow retail price range. Furthermore, it is possible to classify all plants into 4 price classes, which are “ under $2.51,” “ $2.51-$4.50,” “ $4.51-$7.50,” and “ over $7.50.” The first class covers cheap shoes, the second popular-priced, the third medium-priced, and the last fine shoes. In nearly all cases, an establishment was classified in a given price range provided most of its production consisted of shoes within that class.
That the largest portion of the industry is in the popular-priced field is indicated by the fact that, of 241 establishments, 90 with 23,090 workers (41.0 percent of the total) were engaged primarily in making this kind of shoes. Next in importance are the cheap shoes, which were manufactured largely by 89 plants covered in the survey, with 16,144 workers (28.7 percent). Of the remainder, 40 establishments with 10,739 employees (19.1 percent of the total) made primarily medium-priced shoes, while only 22 plants with 6,276 workers (11.2 percent) were engaged largely on fine shoes.
In the sample covered by the study, the proportions of employees manufacturing shoes with various retail price ranges differed considerably from one region to another. Of all workers covered in New England, 33.6 percent made cheap shoes, 51.2 percent popular-priced,13.1 percent medium-priced, and only 2.1 percent fine shoes. In the Middle Atlantic States, the distribution was 46.9 percent for cheap,22.6 percent for popular-priced, only 9.8 percent for medium-priced, and 20.7 percent for fine shoes. Popular-priced and medium-priced shoes predominated in the Middle Western States, the former absorbing 37.2 and the latter 31.6 percent of the total labor force, which may be compared with 14.6 percent for cheap and 16.6 percent for fine shoes. As many as 65.5 percent of all employees in the Southern States were engaged in manufacturing popular-priced shoes, as against 27.0 percent for cheap, 7.5 for medium-priced, and none for fine shoes.
As size of community increased, the proportion of total workers making either cheap or popular-priced shoes generally decreased, while exactly the opposite was true of either medium-priced or fine shoes. Of the total labor force covered in manufacturing cheap shoes,
Digitized for FRASER http://fraser.stlouisfed.org/ Federal Reserve Bank of St. Louis
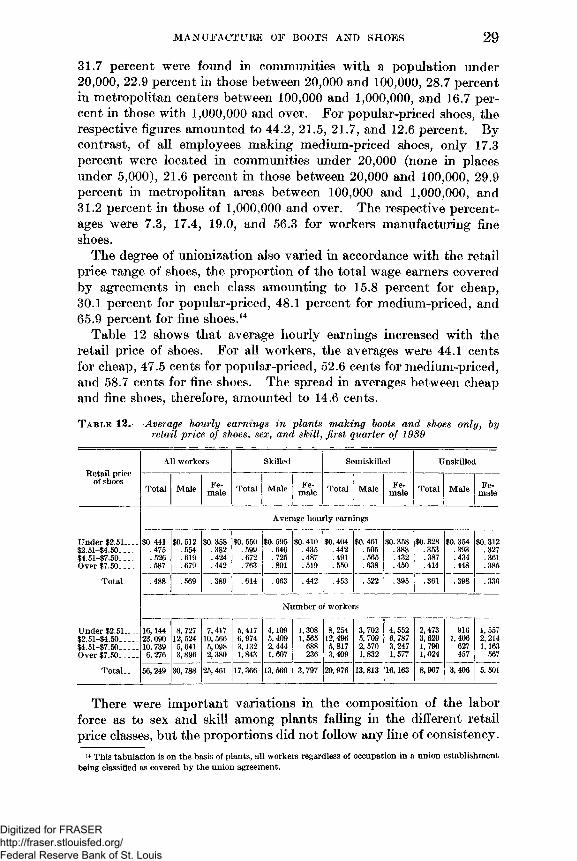
MANUFACTURE OF ROOTS AND SHOES 29
31.7 percent were found in communities with a population under20,000, 22.9 percent in those between 20,000 and 100,000, 28.7 percent in metropolitan centers between 100,000 and 1,000,000, and 16.7 percent in those with 1,000,000 and over. For popular-priced shoes, the respective figures amounted to 44.2, 21.5, 21.7, and 12.6 percent. By contrast, of all employees making medium-priced shoes, only 17.3 percent were located in communities under 20,000 (none in places under 5,000), 21.6 percent in those between 20,000 and 100,000, 29.9 percent in metropolitan areas between 100,000 and 1,000,000, and31.2 percent in those of 1,000,000 and over. The respective percentages were 7.3, 17.4, 19.0, and 56.3 for workers manufacturing fine shoes.
The degree of unionization also varied in accordance with the retail price range of shoes, the proportion of the total wage earners covered by agreements in each class amounting to 15.8 percent for cheap,30.1 percent for popular-priced, 48.1 percent for medium-priced, and65.9 percent for fine shoes.14
Table 12 shows that average hourly earnings increased with the retail price of shoes. For all workers, the averages were 44.1 cents for cheap, 47.5 cents for popular-priced, 52.6 cents for medium-priced, and 58.7 cents for fine shoes. The spread in averages between cheap and fine shoes, therefore, amounted to 14.6 cents.
T a b l e 1 2 .— Average hourly earnings in plants making boots and shoes only, by retail price of shoes, sex, and skill, first quarter of 1939
Retail price of shoes
All workers Skilled Semiskilled Unskilled
Total Male Female Total Male Fe
male Total Male Female Total Male Fe
male
Average hourly earnings
Under $2.51— $0.441 $0. 512 $0.358 $0. 550 $0. 595 $0.410 $0. 404 $0. 461 $0. 358 $0. 328 $0. 354 $0. 312$2.51-$4.50_____ .475 .554 .382 .599 .646 .435 .442 .505 .388 .353 .393 .327$4.51-$7.50_____ .526 .619 .424 .672 .725 .487 .491 .565 .432 .387 .434 .361Over $7.50_____ .587 .679 .442 .763 .801 . 519 .550 .638 .450 .414 .448 .385
Total. .488 .569 .389 .614 .663 .442 .453 . 522 .395 .361 .398 . 336
Number of workers
Under $2.51___ 16,144 8, 727 7, 417 5, 417 4,109 1,308 8, 254 3, 702 4, 552 2,473 916 1,557$2.51-$4.50_____ 23,090 12, 524 10, 566 6,974 5, 409 1,565 12,496 5, 709 6,787 3, 620 1,406 2, 214$4.51-$7.50_____ 10, 739 5,641 5,098 3,132 2, 444 688 5, 817 2, 570 3,247 1,790 627 1,163Over $7.50_____ 6, 276 3,896 2, 380 1,843 1,607 236 3, 409 1,832 1,577 1,024 457 567
Total___ 56,249 30, 788 25, 461 17, 366 13, 569 3,797 29,976 13,813 16,163 8,907 3,406 5, 501
There were important variations in the composition of the labor force as to sex and skill among plants falling in the different retail price classes, but the proportions did not follow any line of consistency.
n This tabulation is on the basis of plants, all workers regardless of occupation in a union establishment being classified as covered by the union agreement.
Digitized for FRASER http://fraser.stlouisfed.org/ Federal Reserve Bank of St. Louis
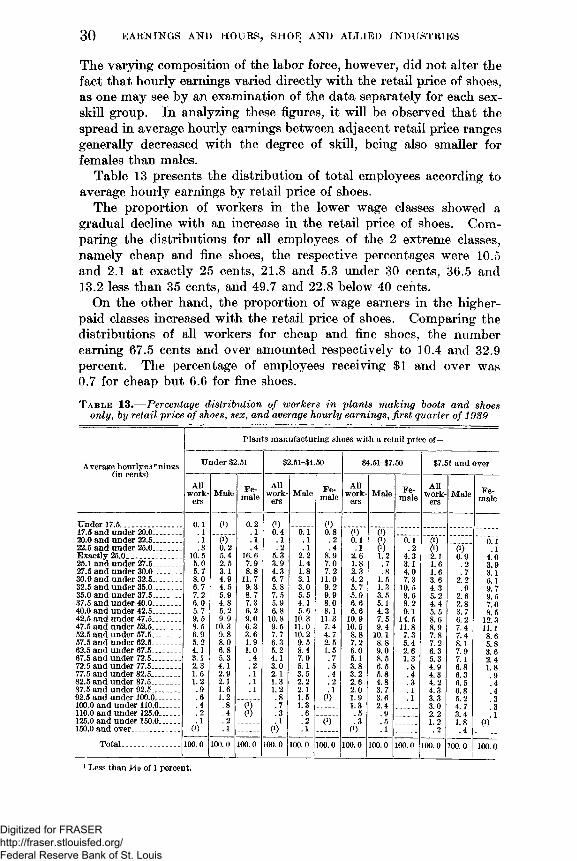
30 EARNINGS AND HOURS, SHOE AND ALLIED INDUSTRIES
The varying composition of the labor force, however, did not alter the fact that hourly earnings varied directly with the retail price of shoes, as one may see by an examination of the data separately for each sex- skill group. In analyzing these figures, it will be observed that the spread in average hourly earnings between adjacent retail price ranges generally decreased with the degree of skill, being also smaller for females than males.
Table 13 presents the distribution of total employees according to average hourly earnings by retail price of shoes.
The proportion of workers in the lower wage classes showed a gradual decline with an increase in the retail price of shoes. Comparing the distributions for all employees of the 2 extreme classes, namely cheap and fine shoes, the respective percentages were 10.5 and 2.1 at exactly 25 cents, 21.8 and 5.3 under 30 cents, 36.5 and13.2 less than 35 cents, and 49.7 and 22.8 below 40 cents.
On the other hand, the proportion of wage earners in the higher- paid classes increased with the retail price of shoes. Comparing the distributions of all workers for cheap and fine shoes, the number earning 67.5 cents and over amounted respectively to 10.4 and 32.9 percent. The percentage of employees receiving $1 and over was0.7 for cheap but 6.6 for fine shoes.T a b l e 13.— Percentage distribution of workers in plants making boots and shoes
only, by retail price o f shoes, sex, and average hourly earnings, first quarter o f 1939
Plants manufacturing shoes with a retail price of—
Average hourlye*rnings (in cents)
Under $2.51 $2.51-$4.50 $4.51-$7.50 $7.51 and over
Allwork
ersMale Fe
maleAll
workers
Male Female
Allwork
ersMale Fe
maleAll
workers
Male Female
Under 17.5___ - _ ______ 0.1 0) 0.2 0) 0)17.5 and under 20.0_____ . . 1 .1 0.4 0.1 0.8 0) 0)20.0 and under 22.5____ . _ . 1 0) .1 .1 .1 .2 0.1 0) 0.1 (}) 0.122.5 and under 25.0_______ .3 0.2 .4 .2 .1 .4 .1 0) .2 0) .1Exactly 25.0_____ _________ 10.5 5.4 16.6 5.3 2.2 8.9 2.6 1.2 4.3 2.1 0.9 4.025.1 and under 27.5____ __ 5.0 2.5 7.9 3.9 1.4 7.0 1.8 .7 3.1 1.6 .2 3.927.5 and under 30.0_______ 5.7 3.1 8.8 4.3 1.8 7.2 2.3 .8 4.0 1.6 .7 3.130.0 and under 32.5_______ 8.0 4.9 11. 7 6.7 3.1 11.0 4.2 1.5 7.3 3.6 2.2 6.132.5 and under 35.0_______ 6.7 4.5 9.3 5.8 3.0 9.2 5.7 1.3 10. 5 4.3 .9 9. 735.0 and under 37.5_______ 7.2 5.9 8.7 7.5 5.5 9.9 .5.9 3.5 8.6 5.2 2.6 9. 537.5 and under 40.0_______ 6.0 4.8 7.3 5.9 4.1 8.0 6.6 5.1 8.2 4.4 2.8 7.040.0 and under 42.5_______ 5.7 5.2 6.2 6.8 5.6 8.1 6.6 4.3 9.1 5.5 3.7 8. 542.5 and under 47.5_______ 9.5 9.9 9.0 10.8 10.3 11.3 10.9 7.5 14.5 8.6 6.2 12. 347.5 and under 52.5_______ 8.5 10.3 6.3 9.5 11.0 7.4 10.5 9.4 11.8 8.9 7.4 11.152.5 and under 57.5_______ 6.9 9.8 3.6 7.7 10.2 4.7 8.8 10.1 7.3 7.8 7.4 8.657.5 and under 62.5_______ 5.2 8.0 1.9 6.3 9.5 2.5 7.2 8.8 5.4 7.2 8.1 5.862.5 and under 67.5_______ 4.1 6.8 1.0 5.2 8.4 1.5 6.0 9.0 2.6 6.3 7.9 3. 667.5 and under 72.5_______ 3.1 5.3 .4 4.1 7.0 .7 5.1 8.5 1.3 5.3 7.1 2.472.5 and under 77.5_______ 2.3 4.1 .2 3.0 5.1 .5 3.8 6.5 .8 4.9 6.8 1.877.5 and under 82.5_______ 1.6 2.9 . 1 2.1 3.5 .4 3.2 5.8 .4 4.3 6.3 .982.5 and under 87.5_______ 1.2 2.1 .1 1.3 2.2 .2 2.6 4.8 .3 4.2 6.5 .487.5 and under 92.5________ .9 1.6 .1 1.2 2.1 .1 2.0 3.7 .1 4.3 6.8 .492.5 and under 100.0______ .6 1.2 .8 1.5 0) 1.9 3.6 .1 3.3 5.2 .3100.0 and under 110.0___ . .4 .8 (V) .7 1.3 1.3 2.4 3. 0 4. 7 . 3110.0 and under 125.0 __ _ .2 .4 0) .3 .6 . 5 . 9 2. 2 3.4 i125.0 and under 150.0. . 1 .2 . 1 .2 0) . 3 . 5 1* 2 1. 8 0)'150.0 and over_____________ (>) .1 (!) .1 0) .1 . 2 . 4
Total_______________ 100.0 100.0 100.0 100.0 100.0 100.0 100.0 100.0 100.0 100.0 100.0 100.0
1 Less than Mo of 1 percent.
Digitized for FRASER http://fraser.stlouisfed.org/ Federal Reserve Bank of St. Louis

M A N U F A C T U R E OF BOOTS AND SHOES 31
Individual Influence of Sizie of Community, Unionisation, and Retail Price of Shoes
In three previous sections of this report, it has been shown that(1) average hourly earnings varied directly with size of community,(2) they were higher for union than nonunion workers, and (3) they increased with the retail price of shoes. In each case, however, the analysis was confined to the relation between one factor and hourly earnings, with the other two factors still influencing the latter.
In analyzing the coverage, it has also been pointed out that the three factors are closely interrelated. Thus, as size of community increased, the proportion of all employees manufacturing either cheap or popular- priced shoes generally decreased, whereas the opposite tendency was found in connection with medium-priced and fine shoes. Furthermore, of the total workers engaged in making each class of retail price of shoes the proportion of wage earners covered by agreements increased with the price of shoes. Lastly, union organization was largely concentrated in metropolitan areas with a population of1,000,000 and over, the proportion of all workers covered by agreements decreasing on the whole as size of community became smaller.
Under the above circumstances, it is difficult to determine the extent to which each of the three factors independently affected average hourly earnings, unless the data are shown simultaneously by size of community, unionization, and retail price of shoes. Such an analysis is presented in table 14.15T a b l e 1 4 .— Average hourly earnings of specified skill groups, in plants making boots
and shoes on ly , by size o f com m unity, unionization , and retail price of shoes, first quarter of 1989
A L L W O R K E R S
Population of community and unionization 1 Total Under$2.50
$2.51-$4.50
$4.51-$7.50
Over$7.50
Total_________________________ ________________________ $0.488 $0.441 $0.475 $0. 526 $0. 587Union plants--- _ _ _ _ _ _ _ _ _ .538 .497 .493 .547 .622Nonunion plants.. _ ___ - _______ ___ .462 .431 .468 .505 .510
Under 20,000___________________________________________ .416 .375 .427 .471 (2)Union plants-- _____ _ _ - _________ .410 (2) .400 (2)Nonunion plants_____._ _______ ___________ _____ .417 .374 .433 .464 (2)
20,000 and under 100,000______________________________ .478 .446 .505 .473 .472Union plants ______ _ ____________ __________ .484 (2) .493 (2)Nonunion plants. _ ___________________________ .476 .446 .512 .460 (2)
100,000 and under 1,000,000________ _____ ______________ .516 .470 .518 .544 .608Union plants. ________ _______ __ ____________ _ .542 .489 .544 .539 (2)Nonunion plants____________ __ _______________ .500 .466 .497 .550 (2)
1,000,000 and over__________________ _____ __ ______ .571 .517 .526 .575 .642Union p l a n t s . _ _ ______ _________ __________ .587 .523 .543 .579 .650Nonunion plants._ _ __ ___ ______ . . . _ ___ .528 .510 (2) (2) (2)
See footnotes at end of table.15 Analysis by unionization is on the basis of plants, all workers regardless of occupation in a union estab
lishment being classified as covered by the union agreement.In view of the fact that the unions in this industry are organized on an industrial basis, the total number
of employees in the union plants is not very much different from the number confined only to occupations within the jurisdiction of the agreements in these establishments. Likewise, there is very little difference in average hourly earnings between the two coverages.
Digitized for FRASER http://fraser.stlouisfed.org/ Federal Reserve Bank of St. Louis
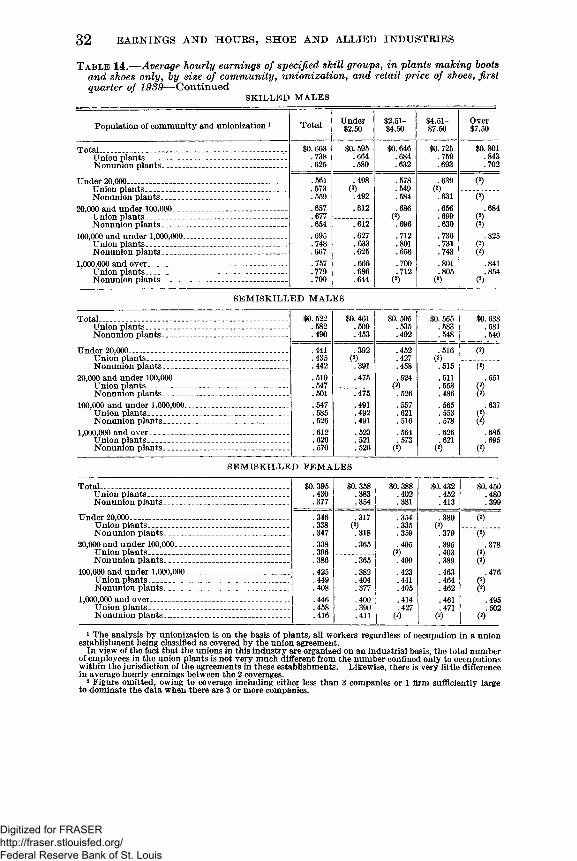
32 E A R N IN G S A N D H O U R S , SH O E A N D A LLIE D IN D U ST R IE S
T a b l e 14.— Average hourly earnings o f specified skill groups, in plants m aking hoots and shoes only, by size o f com m unity, unionization, and retail price o f shoes, first quarter o f 1939— C on tin u ed
SK IL L E D M A L E S
Population of community and unionization 1 Total Under$2.60
$2.51-$4.50
$4.51-$7.50
Over$7.50
Total_________________Union plants____Nonunion plants.
Under 20,000_________Union plants____Nonunion plants.
$0.663 .738 .625
$0.595 . 664 .580
$0.646 .684 .632
$0. 725 .759 .693
$0.801 .843 .702
.561
.573
.559
.498(2)
.492
.578
.549
.584
. 639 (2)(2) -----
. 631 (2)20,000 and under 100,000.
Union plants_______Nonunion plants.. .
. 657 .612
.677 __________
. 654 . 612
. I
(2).656.699.630
100,000 and under 1,000,000Union plants__________Nonunion plants______
.695
.748
.667
.627.633.625
.712
.801
.658
.736
.731
.743
.825
1,000,000 and over___Union plants____Nonunion plants.
.757
.779
.700
.666
.686
.644
.700
.712(2)
.801
.805(2)
.841
.854(2)
S E M IS K IL L E D M A L E S
Total___ - ----------------- ----------------- ----------- --- ----------- $0. 522 $0. 461 $0. 505 $0. 565 $0. 638Union plants.- ___________ _________________ .582 .500 .535 .583 .681Nonunion plants.. _ ________ _______________ .490 .453 ,492 .548 .540
Under 20,000___________________________________________ .441 .392 .452 .516 (2)Union plants._____ ___________ _________ _______ .435 (2) .427 (2)Nonunion plants_____________ __________ ________ .442 .391 .458 .515 (2)
20,000 and under 100,000_____ . . . _______ ______ . . .510 .475 .524 .511 .551Union plants __ _____ _____ ___________ .547 (2) . 553 (2)Nonunion plants____ _ _. . . __________ . . . .501 .475 . 526 .486 (2)
100,000 and under 1,000,000______________ ____________ .547 .491 .557 .565 .637Union plants._ . . . _ _______ __________________ .585 .492 .621 .553 (2)Nonunion plants._______ . . . _. __________________ .526 .491 .516 .578 (2)
1,000,000 and over_________ . . . . . . . . . ------ .612 .523 .564 .626 .685Union p la n t s . ._________ . . . . . . ________________ .626 .521 .573 .621 .695Nonunion plants_____ ________ . . . __________ .570 .526 (2) (2) (2)
S E M IS K IL L E D F E M A L E S
Total____ __ _ _________ ______ _ _____ _________ __ $0. 395 $0. 358 $0. 388 $0. 432 $0.450Union plants.. __ . -------------------------------------------- .430 .383 .402 .452 .480Nonunion p la n ts ... _____________ __ ___ ___ .377 .354 .381 .413 .399
Under 20,000_____________ __ _ __ __________ ______ .346 .317 .354 .380 (2)Union plants____________________ _ ____________ .338 (2) .335 (2)Nonunion plants___________ __ __________ __ .347 .318 .359 .379 (2)
20,000 and under 100,000_________________________ _____ .338 .365 .405 .395 .378Union plants.. __ ________ _____________________ .396 (2) .403 (2)Nonunion plants____________ ____________ _______ .386 .365 .409 .389 (2)
100,000 and under 1,000,000_________________ _________ .425 .382 .423 .463 .476Union plants_____________ __ ... _ . ____________ .449 .404 .441 .464 (2)Nonunion plants__________________________________ .408 .377 .405 .462 (2)
1,000,000 and over---------------------------------------------------------- .446 .400 .414 .461 .495Union plants ___ __ _________ _________ .458 .390 .427 .471 ..502Nonunion plants___ ______________ . ___________ .416 .411 (2) (2) (2)
1 The analysis by unionization is on the basis of plants, all workers regardless of occupation in a union establishment being classified as covered by the union agreement.
In view of the fact that the unions in this industry are organized on an industrial basis, the total number of employees in the union plants is not very much different from the number confined only to occupations within the jurisdiction of the agreements in these establishments. Likewise, there is very little difference in average hourly earnings between the 2 coverages.2 Figure omitted, owing to coverage including either less than 3 companies or 1 firm sufficiently large to dominate the data when there are 3 or more companies.
Digitized for FRASER http://fraser.stlouisfed.org/ Federal Reserve Bank of St. Louis
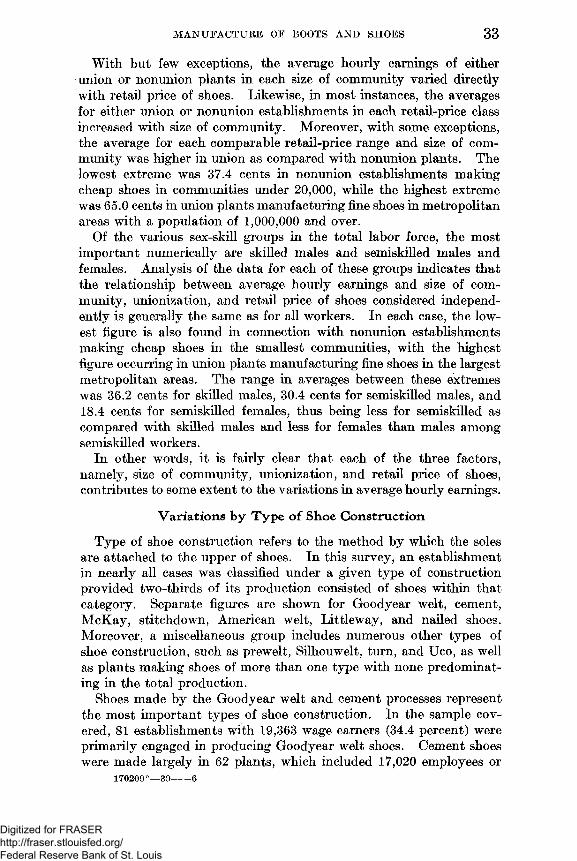
M A N U F A C T U R E OF ROOTS A N D SH OES 33
With but few exceptions, the average hourly earnings of either union or nonunion plants in each size of community varied directly with retail price of shoes. Likewise, in most instances, the averages for either union or nonunion establishments in each retail-price class increased with size of community. Moreover, with some exceptions, the average for each comparable retail-price range and size of community was higher in union as compared with nonunion plants. The lowest extreme was 37.4 cents in nonunion establishments making cheap shoes in communities under 20,000, while the highest extreme was 65.0 cents in union plants manufacturing fine shoes in metropolitan areas with a population of 1,000,000 and over.
Of the various sex-skill groups in the total labor force, the most important numerically are skilled males and semiskilled males and females. Analysis of the data for each of these groups indicates that the relationship between average hourly earnings and size of community, unionization, and retail price of shoes considered independently is generally the same as for all workers. In each case, the lowest figure is also found in connection with nonunion establishments making cheap shoes in the smallest communities, with the highest figure occurring in union plants manufacturing fine shoes in the largest metropolitan areas. The range in averages between these extremes was 36.2 cents for skilled males, 30.4 cents for semiskilled males, and18.4 cents for semiskilled females, thus being less for semiskilled as compared with skilled males and less for females than males among semiskilled workers.
In other words, it is fairly clear that each of the three factors, namely, size of community, unionization, and retail price of shoes, contributes to some extent to the variations in average hourly earnings.
Variations by Type of Shoe Construction
Type of shoe construction refers to the method by which the soles are attached to the upper of shoes. In this survey, an establishment in nearly all cases was classified under a given type of construction provided two-thirds of its production consisted of shoes within that category. Separate figures are shown for Goodyear welt, cement, McKay, stitchdown, American welt, Littleway, and nailed shoes. Moreover, a miscellaneous group includes numerous other types of shoe construction, such as prewelt, Silhouwelt, turn, and Uco, as well as plants making shoes of more than one type with none predominating in the total production.
Shoes made by the Goodyear welt and cement processes represent the most important types of shoe construction. In the sample covered, 81 establishments with 19,363 wage earners (34.4 percent) were primarily engaged in producing Goodyear welt shoes. Cement shoes were made largely in 62 plants, which included 17,020 employees or
170209°— 39------ 6
Digitized for FRASER http://fraser.stlouisfed.org/ Federal Reserve Bank of St. Louis
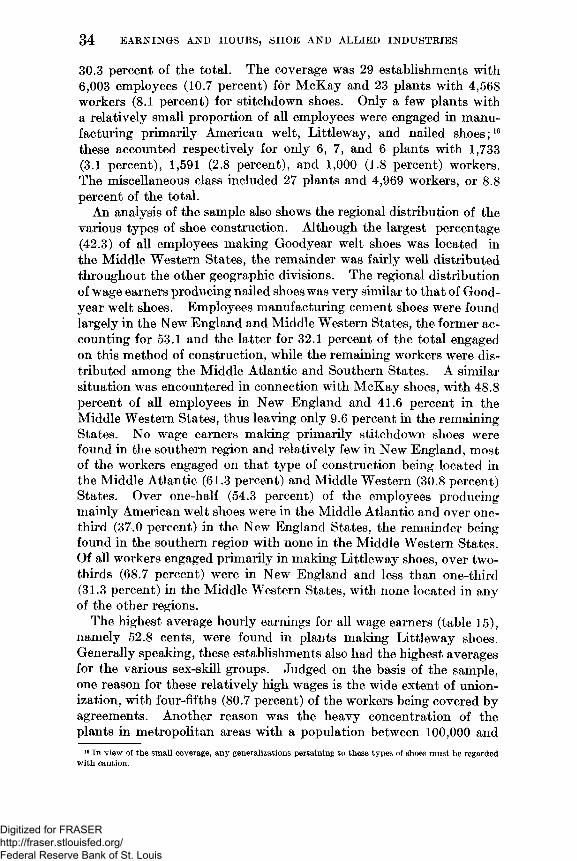
34 EARNINGS AND HOURS, SHOE AND ALLIED INDUSTRIES
30.3 percent of the total. The coverage was 29 establishments with6.003 employees (10.7 percent) for McKay and 23 plants with 4,568 workers (8.1 percent) for stitchdown shoes. Only a few plants with a relatively small proportion of all employees were engaged in manufacturing primarily American welt, Littleway, and nailed shoes;16 these accounted respectively for only 6, 7, and 6 plants with 1,733 (3.1 percent), 1,591 (2.8 percent), and 1,000 (1.8 percent) workers. The miscellaneous class included 27 plants and 4,969 workers, or 8.8 percent of the total.
An analysis of the sample also shows the regional distribution of the various types of shoe construction. Although the largest percentage (42.3) of all employees making Goodyear welt shoes was located in the Middle Western States, the remainder was fairly well distributed throughout the other geographic divisions. The regional distribution of wage earners producing nailed shoes was very similar to that of Goodyear welt shoes. Employees manufacturing cement shoes were found largely in the New England and Middle Western States, the former accounting for 53.1 and the latter for 32.1 percent of the total engaged on this method of construction, while the remaining workers were distributed among the Middle Atlantic and Southern States. A similar situation was encountered in connection with McKay shoes, with 48.8 percent of all employees in New England and 41.6 percent in the Middle Western States, thus leaving only 9.6 percent in the remaining States. No wage earners making primarily stitchdown shoes were found in the southern region and relatively few in New England, most of the workers engaged on that type of construction being located in the Middle Atlantic (61.3 percent) and Middle Western (30.8 percent) States. Over one-half (54.3 percent) of the employees producing mainly American welt shoes were in the Middle Atlantic and over one- third (37.0 percent) in the New England States, the remainder being found in the southern region with none in the Middle Western States. Of all workers engaged primarily in making Littleway shoes, over two- thirds (68.7 percent) were in New England and less than one-third (31.3 percent) in the Middle Western States, with none located in any of the other regions.
The highest average hourly earnings for all wage earners (table 15), namely 52.8 cents, were found in plants making Littleway shoes. Generally speaking, these establishments also had the highest averages for the various sex-skill groups. Judged on the basis of the sample, one reason for these relatively high wages is the wide extent of unionization, with four-fifths (80.7 percent) of the workers being covered by agreements. Another reason was the heavy concentration of the plants in metropolitan areas with a population between 100,000 and
16 In view of the small coverage, any generalizations pertaining to these types of shoes must be regarded with caution.
Digitized for FRASER http://fraser.stlouisfed.org/ Federal Reserve Bank of St. Louis
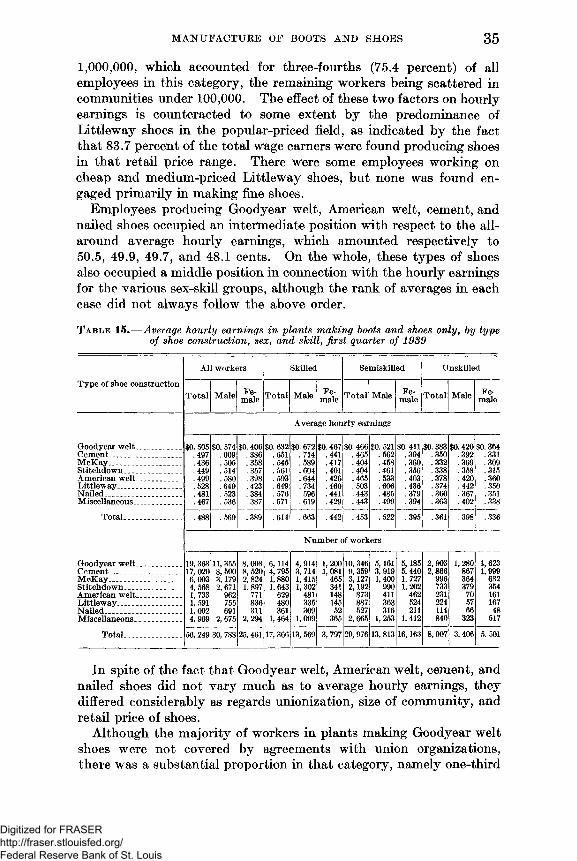
MANUFACTURE OF BOOTS AND SHOES 35
1,000,000, which accounted for three-fourths (75.4 percent) of all employees in this category, the remaining workers being scattered in communities under 100,000. The effect of these two factors on hourly earnings is counteracted to some extent by the predominance of Littleway shoes in the popular-priced field, as indicated by the fact that 83.7 percent of the total wage earners were found producing shoes in that retail price range. There were some employees working on cheap and medium-priced Littleway shoes, but none was found engaged primarily in making fine shoes.
Employees producing Goodyear welt, American welt, cement, and nailed shoes occupied an intermediate position with respect to the all- around average hourly earnings, which amounted respectively to50.5, 49.9, 49.7, and 48.1 cents. On the whole, these types of shoes also occupied a middle position in connection with the hourly earnings for the various sex-skill groups, although the rank of averages in each case did not always follow the above order.
T a b l e 15 . — Average hourly earnings in plants m aking hoots and shoes on ly, by type of shoe construction, sex, and skill, first quarter o f 1939
Type of shoe constructionAll workers Skilled Semiskilled Unskilled
Total Male Female Total Male Female Total Male Female Total Male FemaleAverage hourly earnings
Goodyear welt. _ _. _ ___ $0. 505 $0. 574 $0.406 $0.632 $0.672 $0. 467 $0. 466 $0. 521 $0.411 $0. 383 $0.420 $0. 364Cement__ ____ . . . . .497 .609 .386 .651 .714 .441 .465 .562 .394 .350 .392 .331McKay___ _______ .436 .505 .358 .545 .589 .417 .404 .458 .360 .332 .369 .309Stitchdown_____________ .449 .514 .357 . 561 .604 .401 .404 .461 .356 .338 .358 .315American welt_______ _ .499 .580 .398 .593 .644 .426 .465 .533 .403 .378 .420 .360Littleway______________ .528 .649 .423 . 649 .734 .460 .503 .606 .436 .374 .442 . 350N a ile d ._____ ________ .481 .523 .384 .576 .596 .441 .443 .485 .379 .360 .367 . 351Miscellaneous__ ______ .467 .536 .387 .571 .619 .429 .443 .499 .394 .363 .402 .338Total_____________ .488 .569 .389 .614 .663 .442 .453 .522 .395 .361 .398 .336
Number of workersGoodyear welt__________ 19, 363 11, 355 8,008 6,114 4, 914 1,200 10, 346 5,161 5,185 2,903 1,280 1, 623Cement _ ___________ 17, 020 8,500 8,520 4,795 3,714 1,081 9, 359 3, 919 5, 440 2,866 867 1,999M cK ay_______ ______ 6, 003 3,179 2, 824 1,880 1, 415 465 3,127 1, 400 1, 727 996 364 632Stitchdow n... _________ 4, 568 2, 671 1.897 1,643 1, 302 341 2,192 990 1,202 733 379 354American welt__________ 1,733 962 771 629 481 148 873 411 462 231 70 161Littleway_________ _____ 1, 591 755 836 480 335 145 887 363 524 224 57 167Nailed_________ ________ 1,002 691 311 361 309 52 527 316 211 114 66 48Miscellaneous. _______ 4, 969 2, 675 2,294 1,464 1,099 365 2, 665 1,253 1,412 840 323 517
Total_____________ 56, 249 30, 788 25,461 17, 366 13, 569 3,797 29, 976 13, 813 16,163 8,907 3,406 5. 501
In spite of the fact that Goodyear welt, American welt, cement, and nailed shoes did not vary much as to average hourly earnings, they differed considerably as regards unionization, size of community, and retail price of shoes.
Although the majority of workers in plants making Goodyear welt shoes were not covered by agreements with union organizations, there was a substantial proportion in that category, namely one-third
Digitized for FRASER http://fraser.stlouisfed.org/ Federal Reserve Bank of St. Louis

36 EARNINGS AND HOURS, SHOE AND ALLIED INDUSTRIES
of all employees. The distribution of wage earners by size of community was 31.7 percent in communities under 20,000, 27.6 percent between 20,000 and 100,000, 26.4 percent between 100,000 and1.000. 000, and only 14.3 percent in metropolitan areas of 1,000,000 and over, which means that a majority of employees were found in the smaller communities. Although over one-half (51.2 percent) of all workers were engaged in producing popular-priced shoes, there was a considerable proportion in higher-priced shoes, namely 26.6 percent in medium-priced and 14.3 percent in fine shoes. Only 7.9 percent were found making cheap shoes. In other words, each of the factors was found to exert a moderate influence on hourly earnings.
A more or less similar situation prevails in connection with cement shoes. Of the total wage earners engaged in manufacturing such shoes, two-fifths (40.6 percent) were covered by union agreements. Although as many as two-fifths (40.6 percent) of all workers were located in metropolitan areas with a population of 1,000,000 and over (unlike Goodyear welt shoes), there were substantial proportions distributed among the other community sizes, the figures being 23.8 percent in places under 20,000, 21.0 percent in those between 20,000 and 100,000, and 14.6 percent in communities between 100,000* and 1,000,000. The distribution of employees by retail price ranges was 23.2 percent for cheap, 43.5 percent for popular- priced, 18.4 percent for medium-priced, and 14.9 percent for fine shoes.
According to the sample, only a small proportion (8.7 percent) of the total wage earners making American welt shoes were covered by agreements with union organizations. Moreover all employees worked on cheap shoes. Both factors, therefore, would tend to reduce hourly earnings. The influence of these factors, however, is counteracted by the fact that all wage earners producing American welt shoes were located in metropolitan areas with a population of 100,000 and over, especially in those between 100,000 and 1,000,000.
As in American welt shoes, the sample indicates that only a small proportion (10.1 percent) of the total workers engaged in the production of nailed shoes was included under union agreements. Likewise, all employees were found making lower-priced shoes, the distribution being 42.0 percent for cheap and 58.0 percent for popular- priced shoes. On the other hand, the wage earners on this type of shoe construction were fairly scattered by size of community, the percentages being 33.7 under 20,000, 9.3 between 20,000 and 100,000,35.0 between 100,000 and 1,000,000, and 22.0 in metropolitan areas of1.000. 000 and over.
The lowest average hourly earnings for all workers were found in plants making stitchdown and McKay shoes, the respective figures amounting to 44.9 and 43.6 cents. In general, these establishments also had the lowest averages for the various sex-skill groups.
Digitized for FRASER http://fraser.stlouisfed.org/ Federal Reserve Bank of St. Louis

MANUFACTURE OF BOOTS AND SHOES 37
As many as 38.0 percent of all wage earners making stitchdown shoes were under the jurisdiction of union agreements. The influence of this factor, however, was counteracted by the predominance of employees in smaller communities and lower-priced shoes. Thus, of the total workers, 40.4 percent were found in communities with a population under 20,000 and 16.2 percent in those between 20,000 and 100,000, which may be compared with 20.3 percent in metropolitan areas between 100,000 and 1,000,000 and 23.1 percent in those with 1,000,000 and over. As regards retail price of shoes, the distribution was 74.1 percent for cheap, 22.7 percent for popular-priced, and only 3.2 percent for medium-priced shoes.
In making McKay shoes, all 3 factors operated in the same direction. Of the total wage earners, only 8.2 percent were covered by agreements with unions. As regards the distribution by size of community,53.0 percent were found in places with a population under 20,000 and 23.6 percent in those between 20,000 and 100,000, as against 13.9 percent in metropolitan areas between 100,000 and 1,000,000 and 9.5 percent in those with 1,000,000 and over. Exactly 90 percent of all workers were engaged in producing lower-priced shoes (62.1 percent for cheap and 27.9 percent for popular-priced), with the remainder distributed between medium-priced and fine shoes.
Table 16 gives a distribution of workers according to average hourly earnings, by type of shoe construction.
T a b l e 16 . — Percentage distribution o f workers in plants making boots and shoes only, by type o f shoe construction and average hourly earnings, first quarter of 1989
Average hourly earnings Total GoodyearweltCement McKay Stitchdown
AmericanweltLittleway Nailed M iscellaneous
Under 17.5 cents. _ . (!) 0) (i) 0.317.5 and under 20.0 cents. __ ____ 0.2 0.5 0) 0.1 . 120.0 and under 22.5 cents. . . . . . 1 . 1 0.1 0) 0.2 0.1 . 122.5 and under 25.0 cents. ____ .2 .2 .3 . 2 .2 0.1 0.1 . 1Exactly 25.0 cents___ _ ___ . . . 5.9 3.2 7.4 8.3 9.3 3.2 2.2 2.9 8.225.1 and under 27.5 cents_______ . . . 3.5 2.5 4.6 4.2 4.7 2.9 2.2 1.7 3.527.5 and under 30.0 cents___________ 4.0 2.9 5.1 5.3 4.9 3.8 2.1 2.0 3.430.0 and under 32.5 cents. _ _______ 6.3 5.1 6.4 9.5 7.9 5.4 3.1 3.8 7.132.5 and under 35.0 cents. _ ________ 5.9 5.2 6.2 7.4 6.3 5.1 5.9 6.4 5.235.0 and under 37.5 cents_____ _____ 6.9 6.4 6.1 8.7 7.7 5.7 8.0 9.2 7.837.5 and under 40.0 cents______ . . . 5.9 6.2 5.0 7.2 5.5 6.9 5.5 7.1 6.040.0 and under 42.5 cents----------------- 6.3 6.6 5.4 6.8 6.7 6.3 7.0 6.4 6.942.5 and under 47.5 cents _________ 10.0 10.6 8.9 9.6 10.4 10.8 13.5 13.5 10.547.5 and under 52.5 cents----------------- 9.2 10.5 8.2 8.6 8.4 9.9 7.8 10.5 10.052.5 and under 57.5 cents_____ ___ 7.7 8.6 7.1 7.6 6.3 9.0 7.3 10.8 6.957.5 and under 62.5 c e n t s . .___ __ _ 6.3 7.4 5.6 5.0 4.6 8.0 6.6 10.1 5.862.5 and under 67.5 cents----------------- 5.2 6.3 4.3 3.3 4.6 7.4 5.9 6.3 5.167.5 and under 72.5 cents______ . . . 4.1 5.0 4.0 2.3 3.3 4.6 5.2 3.8 3.572.5 and under 77.5 cents___________ 3.2 3.9 2.9 2.0 2.8 2.8 4.3 2.5 2.977.5 and under 82.5 cents. _________ 2.4 2.7 2.7 1.5 1.6 3.1 3.0 1.1 2.182.5 and under 87.5 cents___________ 1.8 2.2 2.1 .8 1.3 2.0 2.6 .6 1.287.5 and under 92.5 cents____ . . . 1.6 1.5 2.2 .5 1.2 1.5 3.2 .9 1.392.5 and under 100.0 cents__________ 1.3 1.1 1.9 .5 .9 1.0 2.2 .3 1.0100.0 and under 110.0 cents 1.0 .8 1.7 .3 6 .5 1.6 .6110 0 and under 125.0 cents . 5 .4 1.1 .2 .4 .6 .3125 0 and under 150.0 cents .3 . 1 .6 . 1 o . 1 . 1150.0 cents and over.._ ______ . . . . 1 (0 .1 0) 0) 0)Total............... ............................. 100.0 100.0 100.0 100.0 100.0 100.0 100.0 100.0 100.0
Number of workers.............. ............... 56,249 19,363 17,020 6,003 4, 568 1, 733 1,591 1,002 4,9691 Less than Mo of 1 percent.
Digitized for FRASER http://fraser.stlouisfed.org/ Federal Reserve Bank of St. Louis
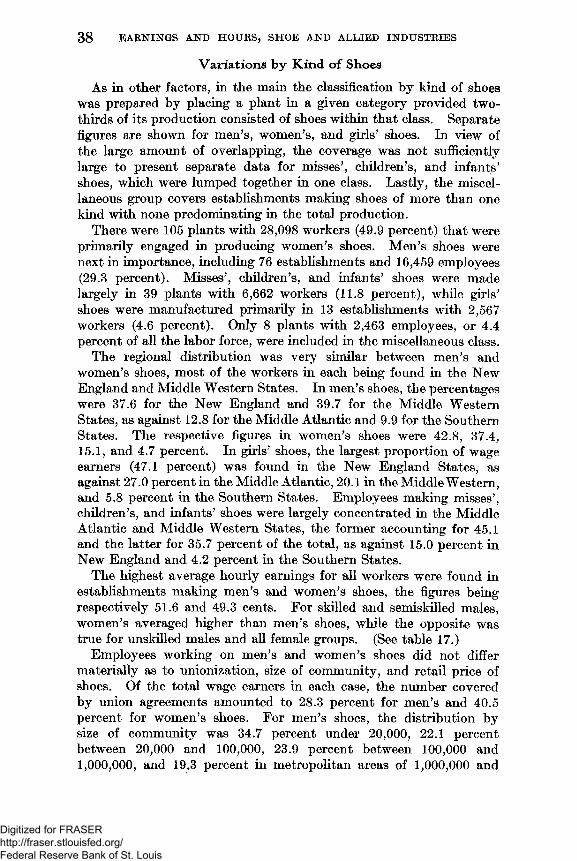
3 8 EARNINGS AND HOURS, SHOE AND ALLIED INDUSTRIES
Variations by Kind of Shoes
As in other factors, in the main the classification by kind of shoes was prepared by placing a plant in a given category provided two- thirds of its production consisted of shoes within that class. Separate figures are shown for men’s, women’s, and girls’ shoes. In view of the large amount of overlapping, the coverage was not sufficiently large to present separate data for misses’ , children’s, and infants’ shoes, which were lumped together in one class. Lastly, the miscellaneous group covers establishments making shoes of more than one kind with none predominating in the total production.
There were 105 plants with 28,098 workers (49.9 percent) that were primarily engaged in producing women’s shoes. Men’s shoes were next in importance, including 76 establishments and 16,459 employees (29.3 percent). Misses’, children’s, and infants’ shoes were made largely in 39 plants with 6,662 workers (11.8 percent), while girls’ shoes were manufactured primarily in 13 establishments with 2,567 workers (4.6 percent). Only 8 plants with 2,463 employees, or 4.4 percent of all the labor force, were included in the miscellaneous class.
The regional distribution was very similar between men’s and women’s shoes, most of the workers in each being found in the New England and Middle Western States. In men’s shoes, the percentages were 37.6 for the New England and 39.7 for the Middle Western States, as against 12.8 for the Middle Atlantic and 9.9 for the Southern States. The respective figures in women’s shoes were 42.8, 37.4, 15.1, and 4.7 percent. In girls’ shoes, the largest proportion of wage earners (47.1 percent) was found in the New England States, as against 27.0 percent in the Middle Atlantic, 20.1 in the Middle Western, and 5.8 percent in the Southern States. Employees making misses’ , children’s, and infants’ shoes were largely concentrated in the Middle Atlantic and Middle Western States, the former accounting for 45.1 and the latter for 35.7 percent of the total, as against 15.0 percent in New England and 4.2 percent in the Southern States.
The highest average hourly earnings for all workers were found in establishments making men’s and women’s shoes, the figures being respectively 51.6 and 49.3 cents. For skilled and semiskilled males, women’s averaged higher than men’s shoes, while the opposite was true for unskilled males and all female groups. (See table 17.)
Employees working on men’s and women’s shoes did not differ materially as to unionization, size of community, and retail price of shoes. Of the total wage earners in each case, the number covered by union agreements amounted to 28.3 percent for men’s and 40.5 percent for women’s shoes. For men’s shoes, the distribution by size of community was 34.7 percent under 20,000, 22.1 percent between 20,000 and 100,000, 23.9 percent between 100,000 and1,000,000, and 19,3 percent in metropolitan areas of 1,000,000 and
Digitized for FRASER http://fraser.stlouisfed.org/ Federal Reserve Bank of St. Louis
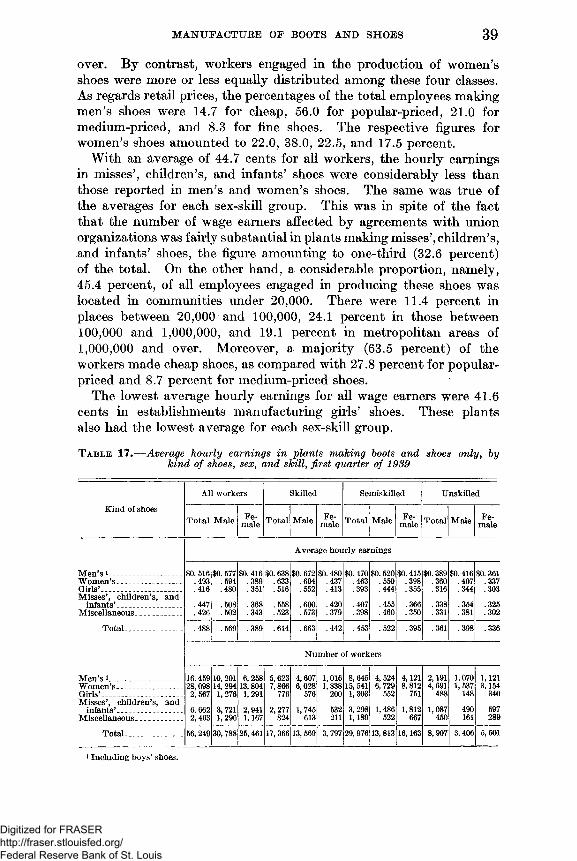
MANUFACTURE OF BOOTS AND SHOES 39
over. By contrast, workers engaged in the production of women’s shoes were more or less equally distributed among these four classes. As regards retail prices, the percentages of the total employees making men’s shoes were 14.7 for cheap, 56.0 for popular-priced, 21.0 for medium-priced, and 8.3 for fine shoes. The respective figures for women’s shoes amounted to 22.0, 38.0, 22.5, and 17.5 percent.
With an average of 44.7 cents for all workers, the hourly earnings in misses’, children’s, and infants’ shoes were considerably less than those reported in men’s and women’s shoes. The same was true of the averages for each sex-skill group. This was in spite of the fact that the number of wage earners affected by agreements with union organizations was fairly substantial in plants making misses’, children’s, and infants’ shoes, the figure amounting to one-third (32.6 percent) of the total. On the other hand, a considerable proportion, namely,45.4 percent, of all employees engaged in producing these shoes was located in communities under 20,000. There were 11.4 percent in places between 20,000 and 100,000, 24.1 percent in those between100,000 and 1,000,000, and 19.1 percent in metropolitan areas of1,000,000 and over. Moreover, a majority (63.5 percent) of the workers made cheap shoes, as compared with 27.8 percent for popular- priced and 8.7 percent for medium-priced shoes.
The lowest average hourly earnings for all wage earners were 41.6 cents in establishments manufacturing girls’ shoes. These plants also had the lowest average for each sex-skill group.
T a b l e 17 . — Average hourly earnings in plants making hoots and shoes on ly , hy kind o f shoes, sex , and skill, first quarter of 1989
Kind of shoesAll workers Skilled Semiskilled Unskilled
Total Male Female Total Male Female Total Male Female Total Male Female
Average hourly earningsMen’s 1________________ $0. 516 $0. 577 $0. 416 $0. 638 $0. 672 $0. 480 $0. 470 $0. 520 $0.415 $0.389 $0.416 $0.361Women’s .- - _ ___ - .493 .594 .389 .633 .694 .437 .463 .550 .398 .360 .407 .337Girls’__________________ .416 .480 .351 .516 .552 .413 .393 .444 .355 .316 .344 .303Misses’, children’s, andinfants’___________ ___ .447 .508 .368 .558 .600 .420 .407 .455 .366 .338 .354 .325Miscellaneous____ . _ _ .426 .502 .343 .523 .573 .379 .398 .460 .350 .331 .381 .302
Total_____________ .488 .569 .389 .614 .663 .442 .453 .522 .395 .361 .398 .336
Number of workers
Men’s 1______ _______ 16,459 10,201 6, 258 5, 623 4,607 1,016 8, 645 4, 524 4,121 2,191 1,070 1,121Women’s____ ___ __ 28,098 14,294 13,804 7,866 6,028 1,838 15, 541 6, 729 8,812 4,691 1, 537 3,154Girls’- ___ _________ ___Misses’, children’s, and 2, 567 1, 276 1,291 776 576 200 1,303 552 751 488 148 340infants’_______ _____ 6, 662 3, 721 2,941 2, 277 1,745 532 3,298 1,486 1,812 1,087 490 597Miscellaneous__________ 2,463 1, 296 1,167 824 613 211 1,189 522 667 450 161 289
Total_____________ 56, 249 30, 788 25,461 17, 366 13, 569 3, 797 29,976 13, 813 16,163 8,907 3,406 5,501
Including boys’ shoes.
Digitized for FRASER http://fraser.stlouisfed.org/ Federal Reserve Bank of St. Louis

4 0 EARNINGS AND HOURS, SHOE AND ALLIED INDUSTRIES
The distribution of all employees according to average hourly earnings by kind of shoes is shown in table 18.
Of all workers making men’s shoes, as many as four-fifths (79.9 percent) produced Goodyear welt shoes. Women’s shoes, on the other hand, are manufactured primarily by the cement method of construction, which is indicated by the fact that 57.8 percent of the total employees on women’s shoes used that type of construction. Girls’ shoes are primarily of the McKay and cement types, the former accounting for 42.0 and the latter for 27.5 percent of all wage earners on girls’ shoes. Misses’ , children’s, and infants’ shoes are primarily stitchdown and secondarily Goodyear welt, the proportion of employees in each case amounting to 54.1 and 21.3 percent of the total.
T a b l e 18 .— Percentage distribution o f workers in plants m aking boots and shoes only, by kind of shoes and average hourly earnings, first quarter o f 1939
Average hourly earnings Total M en’s 1 Women’s Girls’Misses’, children’s and infants’
Miscellaneous
Under 17.5 cents _____ __ _ _____ (2) (2) 0.1 (2)17.5 and under 20.0 cents_______________ 0.2 (2) . l 3.720.0 and under 22.5 cents____ _________ _ .1 (2) 0.1 (2) .1 .922.5 and under 25.0 cents_______________ .2 0.2 .2 0.1 .1 .6Exactly 25.0 cents______ _____ _________ 5.9 3.2 6.3 9.7 9.6 5.425.1 and under 27.5 cents-------------- ------ 3.6 2.1 4.1 4.6 4.4 3.927.5 and under 30.0 cents_______________ 4.0 2.7 4.3 7.6 4.5 5.030.0 and under 32.5 cents------------------------ 6.3 4.8 6.4 8.2 7.5 8.732.5 and under 35.0 cents. ______________ 5.9 4.8 5.9 8.2 6.4 8.435.0 and under 37.5 cents_______________ 6.9 6.2 6.9 8.5 7.7 6.937.5 and under 40.0 cents . __ _____ 5.9 5.9 5.6 6.7 6.1 6.940.0 and under 42.5 cents________ _______ 6.3 6.5 6.0 6.7 6.6 7.042.5 and under 47.5 cents_____ _________ 10.0 10.9 9.7 10.9 10.3 9.847.5 and under 52.5 cents_____ _________ 9.2 10.8 8.8 9.0 7.9 9.552.5 and under 57.5 cents_______________ 7.7 8.9 7.4 6.3 7.2 5.857.5 and under 62.5 cents _ ____ _____ 6.3 7.8 5.9 4.8 5.4 4.762.5 and under 67.5 cents------------------------ 5.2 6.6 4.8 2.8 4.5 4.467.5 and under 72.5 cents__________ ____ 4.1 5.2 4.1 1.9 3.5 1.972.5 and under 77.5 cents. _ _______ 3.2 4.2 3.0 1.5 2.4 1.977.5 and under 82.5 cents. . ___________ 2.4 2.8 2.5 1.0 1.7 1.482.5 and under 87.5 cents__________ .__ _ 1.8 2.2 1.9 .4 1.5 .987.5 and under 92.5 cents____ . . _____ 1.6 1.6 1.9 .5 1.1 .892.5 and under 100.0 cents______________ 1.3 1.2 1.6 .4 .6 .6100.0 and under 110.0 cents________ _____ 1.0 .9 1.3 .2 .4 .4110.0 and under 125.0 cents. . _ ________ .5 .4 .8 .2 . 2125.0 and under 150.0 c e n ts ._____ ______ .3 . 1 .4 . 1 .2150.0 cents and over__________________ . 1 (2) . 1 (2) . 1Total. . ________ ______________ 100.0 100.0 100.0 100.0 100. 0 100.0
Number of workers. __________ _______ 56,249 16,459 28,098 2, 567 6,662 2,4631 Including boys’ shoes.2 Less than Ho of 1 percent.
Differences by Sizie o f Company
Although the manufacture of boots and shoes is not dominated by large companies, the latter play an important part in the industry. Of the total coverage in the survey, 39 plants with 19.8 percent of the wage earners belonged to the 3 largest companies, each of which employed considerably over 5,000 workers. Moreover, 41 establishments with 18.9 percent of the wage earners belonged to companies each with a total employment between 2,000 and 5,000. There were 37 plants
Digitized for FRASER http://fraser.stlouisfed.org/ Federal Reserve Bank of St. Louis
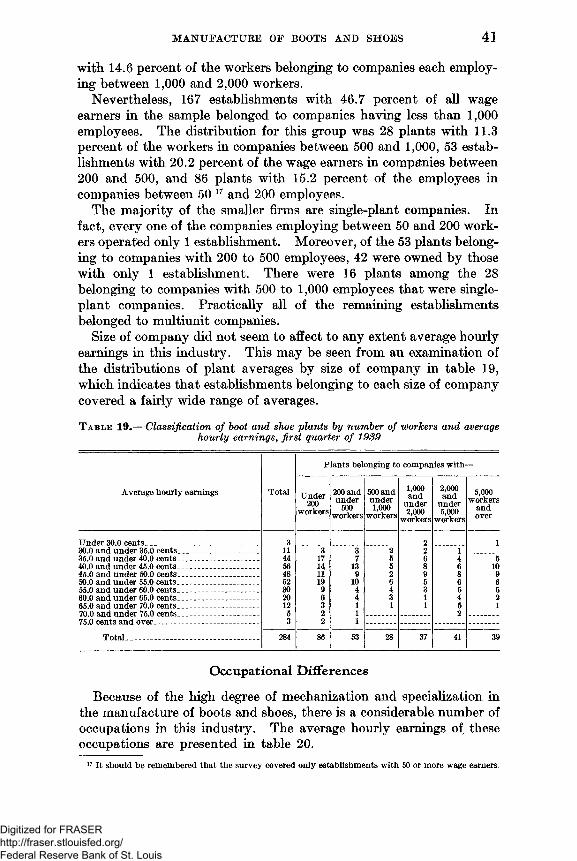
MANUFACTURE OF BOOTS AND SHOES 41
with 14.6 percent of the workers belonging to companies each employing between 1,000 and 2,000 workers.
Nevertheless, 167 establishments with 46.7 percent of all wage earners in the sample belonged to companies having less than 1,000 employees. The distribution for this group was 28 plants with 11.3 percent of the workers in companies between 500 and 1,000, 53 establishments with 20.2 percent of the wage earners in companies between 200 and 500, and 86 plants with 15.2 percent of the employees in companies between 50 17 and 200 employees.
The majority of the smaller firms are single-plant companies. In fact, every one of the companies employing between 50 and 200 workers operated only 1 establishment. Moreover, of the 53 plants belonging to companies with 200 to 500 employees, 42 were owned by those with only 1 establishment. There were 16 plants among the 28 belonging to companies with 500 to 1,000 employees that were singleplant companies. Practically all of the remaining establishments belonged to multiunit companies.
Size of company did not seem to affect to any extent average hourly earnings in this industry. This may be seen from an examination of the distributions of plant averages by size of company in table 19, which indicates that establishments belonging to each size of company covered a fairly wide range of averages.
T a b l e 19 . — Classification o f boot and shoe plants by num ber o f workers and average hourly earnings, first quarter o f 1939
Plants belonging to companies with—
Average hourly earnings Total Under200workers200 and under 500workers
500 and under 1,000 workers
1,000andunder2,000workers
2,000andunder5,000workers
5,000workersandover
Under 30.0 cents __________________ __ 3 2 130.0 and under 35.0 cents_____ _______ ___ 11 3 3 2 2 135.0 and under 40.0 cents__________________ 44 17 7 5 6 4 540.0 and under 45.0 c e n ts__ __ _________ 56 14 13 5 8 6 1045.0 and under 50.0 cents__________________ 48 11 9 2 9 8 950.0 and under 55.0 cents____________ __ 52 19 10 6 5 6 655.0 and under 60.0 cents._ ___ ____ 30 9 4 4 3 5 560.0 and under 65.0 cents ________ _______ 20 6 4 3 1 4 265.0 and under 70.0 cents ____ ___________ 12 3 1 1 1 5 170 0 and under 75.0 cents _ ___ _ 5 2 1 275 0 cents and over _ _ ___ __ 3 2 1Total -- _______________________ 284 86 53 28 37 41 39
Occupational Differences
Because of the high degree of mechanization and specialization in the manufacture of boots and shoes, there is a considerable number of occupations in this industry. The average hourly earnings of these occupations are presented in table 20.
17 It should be remembered that the survey covered only establishments with 50 or more wage earners.
Digitized for FRASER http://fraser.stlouisfed.org/ Federal Reserve Bank of St. Louis
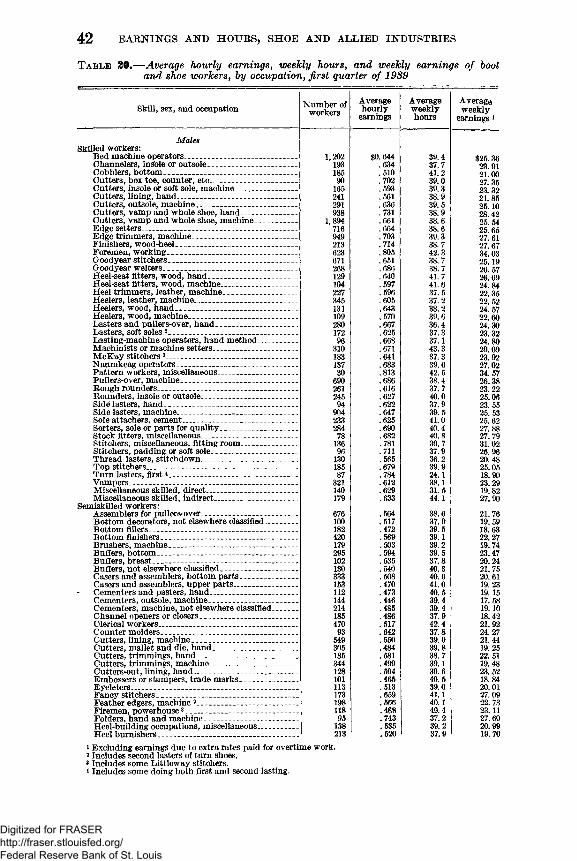
42 EARNINGS AND HOURS, SHOE AND ALLIED INDUSTRIES
T a b l e 20 .— Average hourly earnings, weekly hoursf and weekly earnings o f hoot and shoe workers, hy occupation , first quarter o f 1939
Skill, sex, and occupation Number of workersAveragehourlyearnings
AverageweeklyhoursAverage weekly earnings 1
MalesSkilled workers:Bed machine operators__________ ____________ 1,202 $0,644 39.4 $25.36Channelers, indole or outsole____________________ 193 .634 37.7 23.91Cobblers, bottom______________________________Cutters, box toe, counter, etc___________________ 185 .510 41.2 21.0090 .702 39.0 27. 35Cutters, insole or soft sole, machine ___________ 165 .593 39.3 23. 32Cutters, lining, hand___________________________ 241 .561 38.9 21. 85Cutters, outsole, machine_______________________ 291 .636 39.5 25.10Cutters, vamp and whole shoe, hand____________ 938 .731 38.9 28.42Cutters, vamp and whole shoe, machine_________ 1,894 .661 38.6 25. 54Edge setters_____________________ ___________ 716 .664 38.6 25. 65Edge trimmers, machine_______________________ 949 .703 39.3 27. 61Finishers, wood-heel__ __ _ _ _ __________________ 213 .714 38.7 27. 67Foremen, working___ ______ _________ ________ 623 .805 42.3 34.03Goodyear s t i t c h e r s . . . . _______________ ______ 671 .651 38.7 25.19Goodyear welters____ ____ _____________________ 268 .686 38.7 26. 57Heel-seat fitters, wood, hand. __________________ 129 .640 41.7 26.69Heel-seat fitters, wood, machine________________ 104 .597 41.6 24.84Heel trimmers, leather, machine________________ 227 .596 37.5 22.35Heelers, leather, m achine...______ ______________Heelers, wood, hand.____ _____ _________________ 345 .605 37.2 22. 52131 .643 38.2 24. 57Heelers, wood, machine________________________ 109 .570 39.6 22.60Lasters and pullers-over, hand__________________ 280 .667 36.4 24.30Lasters, soft soles 2_____________________________Lasting-machine operators, hand method___ _ __ 172 .625 37.3 23. 3296 .668 37.1 24.80Machinists or machine setters____ __ 310 .671 43.3 29.09McKay stitchers3_____ ________________________ 183 .641 37.3 23.92Naumkeag operators______ _____ . . . ____ _ 137 .683 39.6 27.02Pattern workers, miscellaneous ______ ___ . . 30 .813 42.5 34. 57Pullers-over, machine_______ _______________ 690 .686 38.4 26.38Rough rounders. . . . --------------------------------------- 261 .616 37.7 23. 22Rounders, insole or outsole------------------------- . . . 245 .627 40.0 25.06Side lasters, hand____________________________ _ 94 .622 37.9 23. 55Side lasters, machine__________________ _____ 904 .647 39.5 25.53Sole attachers, cement____ ____ _ _ ............... ....... 233 .625 41.0 25.62Sorters, sole or parts for quality_________________ 284 .690 40.4 27.88Stock fitters, miscellaneous. . . . 78 .682 40.8 27.79Stitchers, miscellaneous, fitting room.. _______ . 136 .781 39.7 31.02Stitchers, padding or soft so le._____ ________ . . . 96 .711 37.9 26. 96Thread lasters, stitchdown.. _. _____________ ... 130 .565 36.2 20.48Top stitchers_________________ ____________ . . 185 .679 39.9 25. 05Turn lasters, first4 . . . _________ _________ . . 87 .784 24.1 18.90Vampers____________________________ _______ 321 .612 38.1 23.29Miscellaneous skilled, direct__ _______________ 140 .629 31.5 19. 82Miscellaneous skilled, indirect___________________ 179 .633 44.1 27.90Semiskilled workers:Assemblers for pullers-over_________ _____ ___ 676 .564 38.6 21. 76Bottom decorators, not elsewhere classified____ . 100 .517 37.9 19.59Bottom fillers. ---------- ------ --------- ---------------------- 182 .472 39.5 18. 63Bottom finishers_______________________________ 420 .569 39.1 22.27Brushers, machine---------- ---------------- ---------- . . 179 .503 39.2 19.74Buffers, bottom_________________________ ____ 295 .594 39.5 23.47Buffers, breast___________ . ------------------------- 102 .535 37.8 20.24Buffers, not elsewhere classified . . . -------------------- 130 .540 40.3 21. 75Casers and assemblers, bottom parts_____ __ _ 333 .508 40.6 20. 61Casers and assemblers, upper parts______________ 153 .470 41.0 19. 23Cementers and pasters, hand_____ _____________ 112 .473 40.5 19. 15Cementers, outsole, machine__________ ______ 144 .446 39.4 17.58Cementers, machine, not elsewhere classified _ . . . 214 .485 39.4 19.10Channel openers or closers _____________________ 185 .486 37.9 18.42Clerical workers_______________________________ 470 .517 42.4 21. 92Counter molders______________ _______________ 93 .642 37.8 24. 27Cutters, lining, machine______ _____________ _ _ 549 .550 39.0 21. 44Cutters, mallet and die, hand.. _ . . . . _________ 305 .484 39.8 19. 25Cutters, trimmings, hand.. ___________ _____ 185 .581 38.7 22. 51Cutters, trimmings, machine.. . ________________ 344 .499 39.1 19. 48Cutters-out, lining, hand------------------------------------ 128 .594 39.6 23. 52Embossers or stampers, trade marks _____ . 101 .465 40.5 18.84Eyeleters______________________ _______ ____ 113 .513 39.0 20.01Fancy stitchers. _____________________________ 173 .659 41.1 27. 09Feather edgers, machine 2. . . ___________________ 198 .566 40.1 22. 73Firemen, powerhouse3--------- --------------------------- 118 .468 49.4 23.11Folders, hand and machine ___________________ 95 .743 37.2 27.60Heel-building occupations, miscellaneous-------------- 138 .535 39.2 20.99Heel burnishers._ ------------------------------------------- 213 .520 37.9 1 19.701 Excluding earnings due to extra rates paid for overtime work.2 Includes second lasters of turn shoes.3 Includes some Littleway stitchers.4 Includes some doing both first and second lasting.
Digitized for FRASER http://fraser.stlouisfed.org/ Federal Reserve Bank of St. Louis

MANUFACTURE OF BOOTS AND SHOES 43
T a b l e 2 0 . — Average hourly earnings, weekly hours, and weekly earnings o f hoot and shoe workers, hy occupation, first quarter o f 1939— Continued
Skill, sex, and occupation
Males—C ontinuedSemiskilled workers—Continued:Heel nailers, wood, machine_____________________Heel scourers__________________________________Heel-seat lasters, machine_______________________Heel-seat nailers, machine______________________Insole tackers, machine_________________________Inspectors________________________________ ____Ironers and pressers, hand______________ ________Last pickers________________________ __Last pullers__________________________ .. ____Levelers, sole, machine_________________________Maintenance workers__________________________Nailers and tackers, outsole, machine____________Perforators and cut-out machine operators________Pounders, bottom, machine_____________________Repairers_____________________________________Roughers for cement________________ ________Second lasters, except turn?_____________________Shank piece tackers____________________________Skivers, sole______________________________Skivers, upper and lining__________________ ___Sluggers, top lift, machine______________________Sole layers, hand____________________ _________Sole layers, machine_______________ ___________Sole molders___________________________________Stampers or markers, size___________ __________Stitch separators or wheelers____________________Stitchers, miscellaneous, fitting room____________Tack pullers, machine__________________________Treers________________________________________Trimmers, inseam, upper and lining, machine____Trimmers, miscellaneous, hand__________________Welt beaters__________________________________Miscellaneous hand workers, direct______________Miscellaneous machine operators, cut stock. _. . . Miscellaneous machine operators, other than cutstock_______________________________Miscellaneous, indirect_________________________Unskilled workers:Bottom stainers, hand__________________________Cementers, hand_______________________________Cripple chasers________________________________Elevator operators_____________________________Floor boys____________________________________Inkers, sole edge or heel, hand___________________Janitors_______________________________________Laborers, indirect___________ •__________________Learners______________________________________Shoe cleaners__________________________________Staplers, miscellaneous_________________________Tack pullers, hand_____________________________Watchmen____________________________________Wetters and dippers___________________________Miscellaneous, direct___________________________Miscellaneous, indirect_________________________
FemalesSkilled workers:Binding stitchers______________________________Cutters, vamp and whole shoe, machine_________Foreladies, working____________________________Stitchers, all-round_____________________________Stitchers, padding or soft sole___________________Top stitchers__________________________________Vampers______________________________________Miscellaneous, direct and indirect_______________Semiskilled workers:Back stay stitchers_____________________________Barrers_______________________________________Buckle sewers, machine________________________Buffers, brushers, and polishers, miscellaneous____Casers and assemblers, bottom parts_____________Casers and assemblers, upper parts______________Cementers, bottom and sole, machine____________Cementers, uppers, machine____________________Clerical workers_______________________________Closers, heel seam______________________________Dressers______________________________________
Number of workersAveragehourlyearnings
AverageweeklyhoursAverageweeklyearnings
103 $0. 541 40.5 $21. 95345 .549 38.1 20. 93274 . 505 39.6 20.01128 .516 39.1 20.20306 .493 39.6 19. 56411 .531 40. 7 21.62198 .457 39.2 17.94256 .490 40.0 19. 62386 .465 38.9 18.08312 . 535 38.8 20.80159 .444 42.6 18.91130 .502 39.7 19. 92185 .538 39.4 21.22207 .509 39.8 20. 2587 .612 41.2 25. 21250 . 578 41.0 23. 6991 .497 37.1 18. 45198 .453 38.9 17.60145 .524 39.5 20. 69115 .591 39.2 23.1792 .512 37.6 19. 26141 .502 38.2 19.15193 .512 39.4 20.18126 .575 39.9 22. 9797 .496 40.0 19. 8290 . 512 39.0 19. 97170 .573 36.8 21.07316 .443 38.4 17. 011,047 .549 40.3 22. 09215 .539 39.2 21. 15194 .559 39.5 22. 0996 .500 38.3 19.14349 .470 39.7 18. 65171 . ,543 39.9 21.68820 . 505 39.2 19. 7968 .504 41.5 20. 91142 . 515 40.0 20. 62353 .435 39.0 16.99197 .372 42.4 15.80109 .394 43.0 16.94733 .369 40.8 15. 04179 .418 36.9 15. 40268 .368 43.3 15. 92248 .380 42.4 16.14142 .316 38.9 12.30132 .478 39.8 19.04125 .422 36.9 15. 5786 .410 38.1 15.64228 .347 50.1 17. 41130 .481 40.4 19. 45680 .418 39.0 16. 29126 .459 41.3 18.96
440 .448 38.2 17.1290 .471 36.4 17.15192 .536 42.4 22.74285 .450 41.2 18. 55129 .495 34.7 17.171,836 .431 39.5 17.011,168 .440 39.2 17. 23141 .445 39.8 17. 75262 .397 39.1 15. 51121 .364 38.8 14.14109 .392 39.5 15. 46165 .390 38.4 14.99109 .401 39.3 15. 76334 .383 40.2 15. 41243 .384 39.5 15.17302 .367 39.7 14. 56169 .376 41.4 15. 60495 .398 38.0 15.10463 .377 39.7 14.96
Digitized for FRASER http://fraser.stlouisfed.org/ Federal Reserve Bank of St. Louis
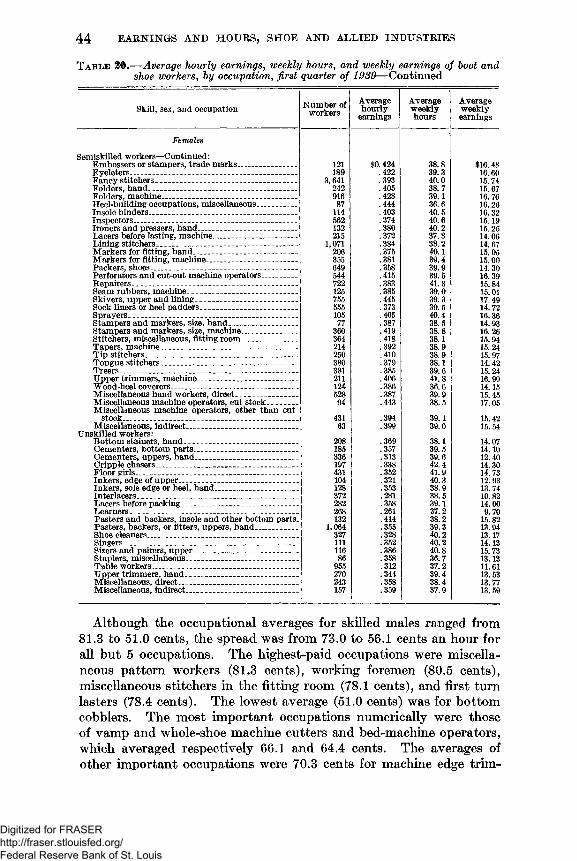
44 EARNINGS AND HOURS, SHOE AND ALLIED INDUSTRIES
T a b l e 20.— Average hourly earnings, weekly hours, and weekly earnings o f boot and shoe workers, by occupation, first quarter o f 1939— Continued
Skill, sex, and occupation Number of workersAveragehourlyearnings
AverageweeklyhoursAverageweeklyearnings
FemalesSemiskilled workers—Continued:Embossers or stampers, trade m arks____________ 121 $0.424 38.8 $16.48Eyeleters---------------------------------------------------------- 189 .422 39.3 16.60Fancy stitchers ______________________________ 3,641 .393 40.0 15. 74Folders, hand__________________________________ 242 .405 38.7 15. 67Folders, machine___ ________________________ 916 .428 39.1 16.76Heel-building occupations, miscellaneous_________ 87 .444 36.6 16. 26Insole binders. _ _____________________________ 114 .403 40.5 16. 32Inspectors------------ ------------------------------------ — 562 .374 40.6 15.19Ironers and pressers, hand . . . --------------------------- 132 .380 40.2 15. 26Lacers before lasting, machine___ _ _ _______ 215 .372 37.8 14.06Lining stitchers. _____________________________ 1,071206 .384 38.2 14. 67Markers for fitting, h a n d .._____ _ ----------- .375 40.1 15.05Markers for fitting, machine___ _______________ 355 .381 39.4 15.00Packers, shoes_____________________ _________ 649 .358 39.9 14.30Perforators and cut-out machine operators________ 544 .415 39.5 16.39Repairers_____________________________________ 722 .383 41.3 15.84Seam rubbers, machine________ __ _______ ._ 125 .385 39.0 15.01Skivers, upper and lining___ _ _ _____________ 755 .445 39.3 17.49Sock liners or heel padders___ _________ _____ 555 .373 39.5 14. 72Sprayers.__ __ _____ ______________________ . 105 .405 40.4 16.36Stampers and markers, size, h a n d _______________ 77 .387 38.5 14.93Stampers and markers, size, machine____________ 360 .419 38.8 16.26Stitchers, miscellaneous, fitting room____________ 364 .418 38.1 15.94Tapers, machine_________ _______________ — 214 .392 38.9 15. 24Tip stitchers__________________________________ 250 .410 38.9 15. 97Tongue stitchers_________________________ ___ 380 .379 38.1 14. 42T reers__________________ ________________ 381 .385 39.6 15. 24Upper trimmers, machine.. _________ _ _ _._ 211 .406 41.8 16.99Wood-heel coverers---- ------------ ----------------- 124 .386 36.6 14.15Miscellaneous hand workers, direct___ __ . . . . 528 .387 39.9 15. 45Miscellaneous machine operators, cut stock. _ 94 .443 38.5 17.05Miscellaneous machine operators, other than cutstock____ ______ ____ ____________ . . . __ 431 .394 39.1 15.42Miscellaneous, indirect________ _______________ 63 .399 39.0 15. 54Unskilled workers:Bottom stainers, hand_________________________ 208 .369 38.1 14.07Cementers, bottom p arts__________________ _ __ 185 .357 39.5 14.10Cementers, uppers, hand____ _____ _____________ 336 .313 39.6 12.40Cripple chasers_____ _______________________ 197 .338 42.4 14.30Floor girls_____________________________________ 431 .352 41.9 14. 73Inkers, edge of upper ._ _ _ ________ ______ __ 104 .321 40.3 12.93Inkers, sole edge or heel, hand ________________ 128 .353 38.9 13.74Interlaces__________ . . . _ _______ ________ 372 .281 38.5 10.82Lacers before packing.. _______ _ ________ __ 282 .358 39.1 14.00Learners________________________ ___ _____ 268 .261 37.2 9. 70Pasters and backers, insole and other bottom parts. 132 .414 38.2 15. 82Pasters, backers, or fitters, uppers, hand_________ 1,064 .355 39.3 13.94Shoe cleaners___ _ _ _ _ _ _ . . . ______ _______ 327 .328 40.2 13.17Singers____ __ _____ ________ ___ _______ 111 .352 40.2 14.13Sizers and pairers, upper_______________________Staplers, miscellaneous_____________________ 116 .386 40.8 15.7386 .358 36.7 13.13Table workers________ ______ _______________ 955 .312 37.2 11.61Upper trimmers, hand_________________________ 270 .344 39.4 13.53Miscellaneous, direct. _ ____________ _____ _____ 243 .358 38.4 13.77Miscellaneous, indirect___ _____________________ 157 .359 37.9 13. 59
Although the occupational averages for skilled males ranged from81.3 to 51.0 cents, the spread was from 73.0 to 56.1 cents an hour for all but 5 occupations. The highest-paid occupations were miscellaneous pattern workers (81.3 cents), working foremen (80.5 cents), miscellaneous stitchers in the fitting room (78.1 cents), and first turn lasters (78.4 cents). The lowest average (51.0 cents) was for bottom cobblers. The most important occupations numerically were those of vamp and whole-shoe machine cutters and bed-machine operators, which averaged respectively 66.1 and 64.4 cents. The averages of other important occupations were 70.3 cents for machine edge trim-
Digitized for FRASER http://fraser.stlouisfed.org/ Federal Reserve Bank of St. Louis
MANUFACTURE OF BOOTS AND SHOES 45
mers, 73.1 cents for vamp and whole-shoe hand cutters, 64.7 cents for machine side lasters, 66.4 cents for edge setters, 68.6 cents for machine pullers-over, 65.1 cents for Goodyear stitchers, and 80.5 for working foremen.
Among semiskilled males, the highest-paid occupation was that of hand and machine folders, which averaged 74.3 cents an hour.18 The next lower-paid occupations were those of fancy stitchers and counter molders, the averages for which were, respectively, 65.9 and 64.2 cents. For the remaining occupations, the range was from 61.2 cents for repairers to 44.3 cents for machine tack pullers. The most important occupations numerically were those of treers (54.9 cents), miscellaneous machine operators, other than cut stock (50.5 cents), assemblers for pullers-over (56.4 cents), and machine lining cutters (55.0 cents).
The highest- and lowest-paid occupations for unskilled males were those of hand bottom stainers and learners, in which the averages were, respectively, 51.5 and 31.6 cents an hour. If these two extremes are excluded, the averages ranged from 48.1 cents for wetters and dippers to 34.7 cents for watchmen. An important occupation numerically among unskilled males is that of floor boys, who averaged36.9 cents.
Foreladies were the highest paid of the skilled females, averaging53.6 cents an hour. The averages of the remaining occupations covered a narrow range, namely from 49.5 cents for padding or soft- sole stitchers to 43.1 cents for top stitchers, the latter being the most important occupation numerically. Another important occupation from the numerical standpoint was that of vampers, who averaged44.0 cents.
As regards the semiskilled females, the average hourly earnings ranged from 44.5 cents for upper and lining skivers to 35.8 cents for shoe packers. The most important occupation numerically in this group was that of fancy stitchers, who averaged 39.3 cents. Other important occupations from the numerical standpoint were lining stitchers (38.4 cents), machine folders (42.8 cents), upper and lining skivers (44.5 cents), repairers (38.3 cents), shoe packers (35.8 cents), inspectors (37.4 cents), sock liners or heel padders (37.3 cents), and perforators and cut-out machine operators (41.5 cents).
The highest-paid occupation among unskilled females was that of insole and other bottom parts pasters or backers, who averaged 41.4 cents an hour. The lowest-paid occupations were those of interlacers and learners, whose averages were, respectively, 28.1 and 26.1 cents. For the remaining occupations, the averages ranged from 38.6 cents for upper sizers and pairers to 31.2 cents for table workers. The most
is This high average is largely due to the fact that more than one-half of the male folders are located in New York City.
Digitized for FRASER http://fraser.stlouisfed.org/ Federal Reserve Bank of St. Louis
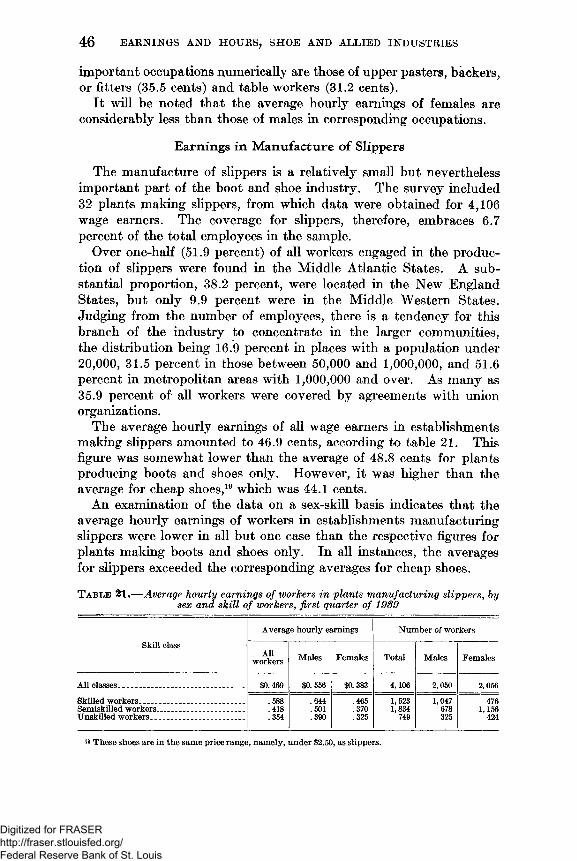
46 EARNINGS AND HOURS, SHOE AND ALLIED INDUSTRIES
important occupations numerically are those of upper pasters, backers, or fitters (35.5 cents) and table workers (31.2 cents).
It will be noted that the average hourly earnings of females are considerably less than those of males in corresponding occupations.
Earnings in Manufacture of Slippers
The manufacture of slippers is a relatively small but nevertheless important part of the boot and shoe industry. The survey included 32 plants making slippers, from which data were obtained for 4,106 wage earners. The coverage for slippers, therefore, embraces 6.7 percent of the total employees in the sample.
Over one-half (51.9 percent) of all workers engaged in the production of slippers were found in the Middle Atlantic States. A substantial proportion, 38.2 percent, were located in the New England States, but only 9.9 percent were in the Middle Western States. Judging from the number of employees, there is a tendency for this branch of the industry to concentrate in the larger communities, the distribution being 16.9 percent in places with a population under20,000, 31.5 percent in those between 50,000 and 1,000,000, and 51.6 percent in metropolitan areas with 1,000,000 and over. As many as35.9 percent of all workers were covered by agreements with union organizations.
The average hourly earnings of all wage earners in establishments making slippers amounted to 46.9 cents, according to table 21. This figure was somewhat lower than the average of 48.8 cents for plants producing boots and shoes only. However, it was higher than the average for cheap shoes,19 which was 44.1 cents.
An examination of the data on a sex-skill basis indicates that the average hourly earnings of workers in establishments manufacturing slippers were lower in all but one case than the respective figures for plants making boots and shoes only. In all instances, the averages for slippers exceeded the corresponding averages for cheap shoes.
T a b l e 21 . — Average hourly earnings o f workers in plants manufacturing slippers, by sex and skill o f workers, first quarter o f 1939
Average hourly earnings Number of workersSkill class Allworkers Males Females Total Males Females
All classes______ ____________________ $0.469 $0. 556 $0. 383 4,106 2,050 2,056Skilled workers______ _____ __________ .588 .644 .465 1,523 1,047 476Semiskilled workers____________________ .418 .501 .370 1,834749 678 1,156Unskilled workers____________ _________ .354 .390 .325 325 424
These shoes are in the same price range, namely, under $2.50, as slippers.
Digitized for FRASER http://fraser.stlouisfed.org/ Federal Reserve Bank of St. Louis
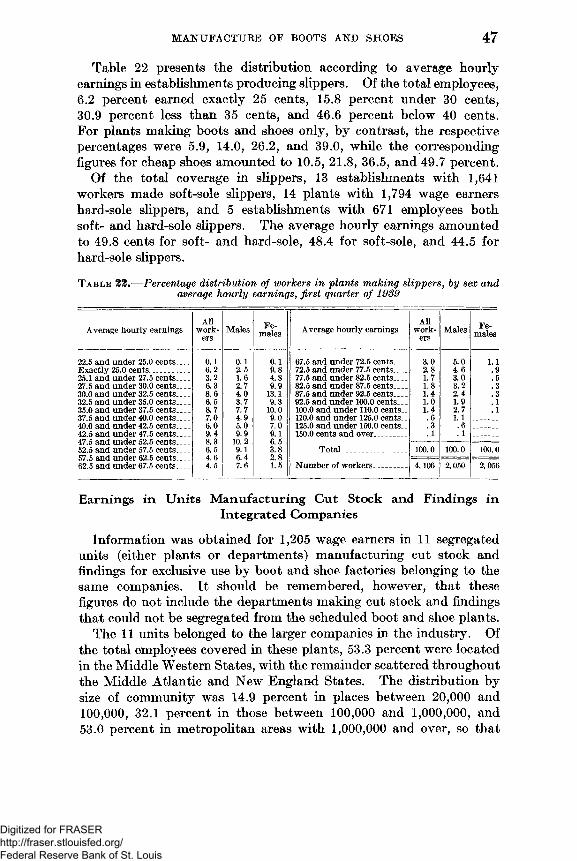
MANUFACTURE OF BOOTS AND SHOES 47
Table 22 presents the distribution according to average hourly earnings in establishments producing slippers. Of the total employees, 6.2 percent earned exactly 25 cents, 15.8 percent under 30 cents,30.9 percent less than 35 cents, and 46.6 percent below 40 cents. For plants making boots and shoes only, by contrast, the respective percentages were 5.9, 14.0, 26.2, and 39.0, while the corresponding figures for cheap shoes amounted to 10.5, 21.8, 36.5, and 49.7 percent.
Of the total coverage in slippers, 13 establishments with 1,641 workers made soft-sole slippers, 14 plants with 1,794 wage earners hard-sole slippers, and 5 establishments with 671 employees both soft- and hard-sole slippers. The average hourly earnings amounted to 49.8 cents for soft- and hard-sole, 48.4 for soft-sole, and 44.5 for hard-sole slippers.
Table 22.— Percentage distribution of workers in 'plants making slippers , by sex and average hourly earnings, first quarter of 1989
Average hourly earnings Allworkers Males Females Average hourly earnings Allworkers Males Females
22.5 and under 25.0 cents___ 0.1 0.1 0.1 67.5 and under 72.5 cents___ 3.0 5.0 1.1Exactly 25.0 cents_________ 6.2 2.5 9.8 72.5 and under 77.5 cents___ 2.8 4.6 .925.1 and under 27.5 cents___ 3.2 1.6 4.8 77.5 and under 82.5 cents___ 1.7 3.0 .527.5 and under 30.0 cents___ 6.3 2.7 9.9 82.5 and under 87.5 cents___ 1.8 3.2 .330.0 and under 32.5 cents___ 8.6 4.0 13.1 87.5 and under 92.5 cents___ 1.4 2.4 .332.5 and under 35.0 cents___ 6.5 3.7 9.3 92.5 and under 100.0 cents.. . 1.0 1.9 .135.0 and under 37.5 cents___ 8.7 7.7 10.0 100.0 and under 110.0 cents.. 1.4 2.7 .137.5 and under 40.0 cents___ 7.0 4.9 9.0 110.0 and under 125.0 cents. _ .6 1.140.0 and under 42.5 cents___ 6.0 5.0 7.0 125.0 and under 150.0 cents.. .3 .642.5 and under 47.5 cents___ 9.4 9.9 9.1 150.0 cents and over _ . _. . 1 . 147.5 and under 52.5 cents___ 8.3 10.2 6.552.5 and under 57.5 cents___ 6.5 9.1 3.8 Total______________ 100.0 100.0 100.057.5 and under 62.5 cents___ 4.6 6.4 2.862.5 and under 67.5 cents___ 4.5 7.6 1.5 Number of workers_______ 4,106 2,050 2,056
Earnings in Units Manufacturing Cut Stock and Findings in Integrated Companies
Information was obtained for 1,205 wage earners in 11 segregated units (either plants or departments) manufacturing cut stock and findings for exclusive use by boot and shoe factories belonging to the same companies. It should be remembered, however, that these figures do not include the departments making cut stock and findings that could not be segregated from the scheduled boot and shoe plants.
The 11 units belonged to the larger companies in the industry. Of the total employees covered in these plants, 53.3 percent were located in the Middle Western States, with the remainder scattered throughout the Middle Atlantic and New England States. The distribution by size of community was 14.9 percent in places between 20,000 and100,000, 32.1 percent in those between 100,000 and 1,000,000, and53.0 percent in metropolitan areas with 1,000,000 and over, so that
Digitized for FRASER http://fraser.stlouisfed.org/ Federal Reserve Bank of St. Louis

48 EARNINGS AND HOURS, SHOE AND ALLIED INDUSTRIES
by far the great majority of workers was found in the larger communities. There were 39.4 percent of the wage earners under the jurisdiction of agreements with union organizations.
The average hourly earnings of all employees in the integrated cut- stock and findings units amounted to 61.7 cents, as against 48.8 cents for establishments making boots and shoes only. (See table 23.) The averages in the former were higher than those in the latter for every sex-skill group.20
T a b l e 2 3 .— Average hourly earnings o f workers in cut stock units of integrated com panies , hy sex and skill} first quarter o f 1939
Skill classAverage hourly earnings Number of workers
Allworkers Males Females Total Males Females
All classes____________________________ $0.617 $0.657 $0.484 1,205 914 291Skilled workers____________ __________ .770 .775 0) 347 339 8Semiskilled workers------------------------------ .572 .619 .485 664 428 236Unskilled workers__________________ .493 .501 .469 194 147 47
1 Number of workers not sufficient to permit the presentation of an average.
As table 24 indicates, relatively few workers were found in the lower-wage classes in the integrated units producing cut stock and findings. There were only 1.3 percent earning under 30 cents, 4.4 percent less than 35 cents, and 10.3 percent below 40 cents, which may be compared respectively with 14.0, 26.2, and 39.0 percent in establishments making boots and shoes only. On the other hand, the integrated units making cut stock and findings showed as many as 35.6 percent receiving 67.5 cents and over, as against only 16.3 percent in boot and shoe factories.
T a b l e 2 4 .— Distribution o f workers in cut stock units o f integrated com panies, by sex and average hourly earnings, first quarter of 1939
Average hourly earnings Allworkers Males Females Average hourly earnings Allworkers Males Females
Exactly 25.0 cents_________ 0.7 0.3 1.7 67.5 and under 72.5 cents___ 8.0 10.2 1.425.1 and under 27.5 cents___ .2 .1 .3 72.5 and under 77.5 cents___ 7.9 10.1 1.027.5 and under 30.0 cents___ .4 .2 1.0 77.5 and under 82.5 cents___ 7.4 9.5 .730.0 and under 32.5 cents___ .9 .7 1.7 82.5 and under 87.5 cents___ 4.1 5.3 .332.5 and under 35.0 cents___ 2.2 .8 6.5 87.5 and under 92.5 cents___ 3.3 4.3 .335.0 and under 37.5 cents___ 2.1 .3 7.6 92.5 and under 100.0 cents___ 3.4 4.537.5 and under 40.0 cents___ 3.8 3.9 3.4 100.0 and under 110.0 cents.. .7 1.040.0 and under 42.5 cents___ 3.2 1.9 7.6 110.0 and under 125.0 cents.. .5 .742.5 and under 47.5 cents___ 9.1 6.1 18.7 125.0 and under 150.0 cents.. .3 .447.5 and under 52.5 cents___52.5 and under 57.5 cants___ 11.711.3 9.610.1 17.9 15.1 Total_______________ 100.0 100.0 100.057.5 and under 62.5 cents___62.5 and under 67.5 oents___ 10.28.6 10.69.4 8.66.2 Number of workers_______ 1,205 914 291
20 An outstanding fact about the 11 integrated plants producing cut stock and findings is the unusually large proportion of males, namely, 75.8 percent, which may be compared with 54.7 percent in establishments manufacturing boots and shoes only.
Digitized for FRASER http://fraser.stlouisfed.org/ Federal Reserve Bank of St. Louis
M A N U F A C T U R E OF BOOTS A N D SH O E S 49Extent of Earnings from Extra Rates for Overtime Work
The data on hourly earnings presented thus far are based only on work at regular rates, thus excluding the earnings due to the extra rates (usually time and one-half after 44 hours 21) paid for overtime. It is the object of this section to determine the extent to which the inclusion of the earnings due to the extra rates for overtime work would affect the hourly earnings.
Relatively few employees, namely 6.1 percent, worked overtime during the pay-roll period covered by the survey. Moreover, the extent of overtime worked by them was not very large, as is usually the tendency whenever the employer has to pay over the regular rate for this kind of work.
If the additional earnings due to the extra rates paid for overtime are considered in computing the average hourly earnings, the figure would be augmented by 0.15 cents for all workers, 0.19 cents for males, and 0.10 cents for females. The new average hourly earnings would then be 49.1 cents for all employees, 57.3 cents for males, and39.1 cents for females, which may be compared respectively with48.9, 57.1, and 39.0 cents, as computed from the regular rates only.
Similarly, the inclusion of the additional earnings due to the extra overtime rates would affect very little the various occupational averages, the largest amount that would be added to by far the great majority being about one-half of 1 cent.
Comparisons w ith Previous Surveys
Surveys of the boot and shoe industry have been made by the Bureau since 1903, with data for all occupations available every 2 years between 1914 and 1932, inclusive.
The definition of the industry used in the previous surveys conforms closely to that followed in the present one. One point of difference is that previous surveys generally included under the boot and shoe industry a few plants making some of the principal cut stock and findings for sale to boot and shoe factories, which are treated separately in the present survey. Moreover, most of the previous surveys did not cover any establishments whose product was chiefly nailed, pegged, or stitch-down shoes or slippers. Excluded also were such employees as powerhouse workers and watchmen. In spite of these differences, the figures for the previous years are fairly comparable with those of the present one.
According to table 25, the average hourly earnings of all workers in the boot and shoe industry were 24.3 cents in 1914. During the World War period, there was a rapid increase, the average amounting
31 As mentioned before, this rate is required under the provisions of the Fair Labor Standards Act. However, a number of plants voluntarily paid time and one-half after 40 hours.
Digitized for FRASER http://fraser.stlouisfed.org/ Federal Reserve Bank of St. Louis
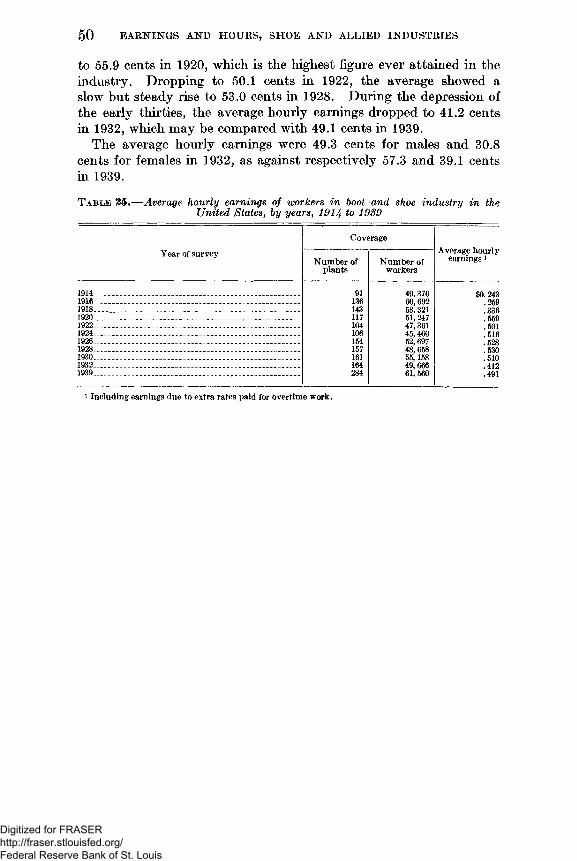
50 E A R N IN G S A N D H O U R S , SH O E A N D A L LIE D IN D U S T R IE S
to 55.9 cents in 1920, which is the highest figure ever attained in the industry. Dropping to 50.1 cents in 1922, the average showed a slow but steady rise to 53,0 cents in 1928. During the depression of the early thirties, the average hourly earnings dropped to 41.2 cents in 1932, which may be compared with 49.1 cents in 1939.
The average hourly earnings were 49.3 cents for males and 30.8 cents for females in 1932, as against respectively 57.3 and 39.1 cents in 1939.
T able 25.— Average hourly earnings of workers in hoot and shoe industry in the United States, by years, 1914 to 1989
Year of survey
CoverageAverage hourly
earnings 1Number of plants
Number of workers
1914____________________________________ __________ 91 49,376 $0,2431916_______________________________________________ 136 60,692 .2591918_______________________________________________ 143 58,321 .3361920_______________________________________________ 117 51, 247 .5591922_______________________________________________ 104 47,361 .5011924_______________________________________________ 106 45, 460 .5161926_______________________________________________ 154 52, 697 .5281928_______________________________________________ 157 48, 658 .5301930_______________________________________________ 161 55,158 .5101932_______________________________________________ 164 49, 666 .4121939______________________________ ________________ 284 61,560 .4911 Including earnings due to extra rates paid for overtime work.
Digitized for FRASER http://fraser.stlouisfed.org/ Federal Reserve Bank of St. Louis
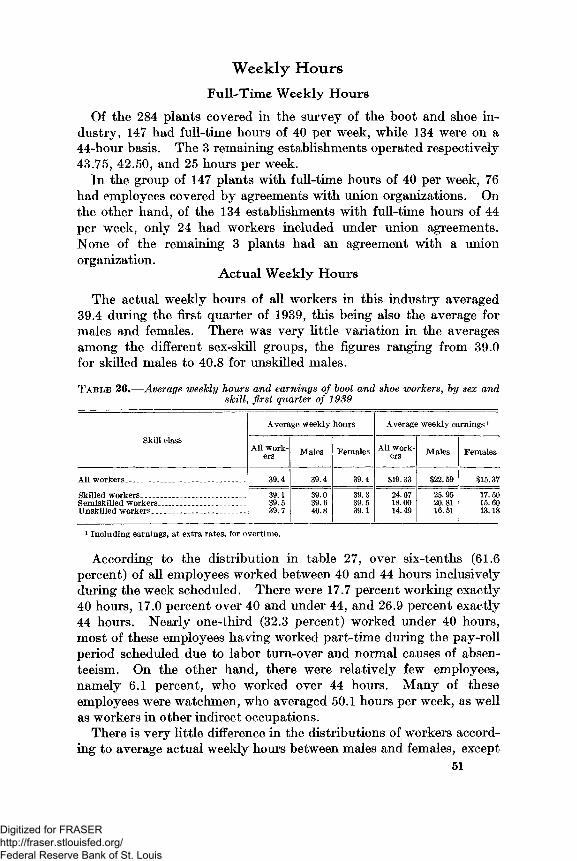
Weekly HoursFull-Time Weekly Hours
Of the 284 plants covered in the survey of the boot and shoe industry, 147 had full-time hours of 40 per week, while 134 were on a 44-hour basis. The 3 remaining establishments operated respectively 43.75, 42.50, and 25 hours per week.
In the group of 147 plants with full-time hours of 40 per week, 76 had employees covered by agreements with union organizations. On the other hand, of the 134 establishments with full-time hours of 44 per week, only 24 had workers included under union agreements. None of the remaining 3 plants had an agreement with a union organization.
Actual Weekly Hours
The actual weekly hours of all workers in this industry averaged39.4 during the first quarter of 1939, this being also the average for males and females. There was very little variation in the averages among the different sex-skill groups, the figures ranging from 39.0 for skilled males to 40.8 for unskilled males.
T a b l e 36.— Average weekly hours and earnings of boot and shoe workers, by sex andskill, first quarter of 1939
Average weekly hours Average weekly earnings1Skill class All workers Males Females All workers Males Females
All workers 39.4 39.4 39.4 $19.33 $22.59 $15.37Skilled workers 39.1 39.0 39.3 24.07 25.95 17.50Semiskilled workers . . ___________ _ - 39.5 39.6 39.5 18.00 20.81 15.60Unskilled workers ___ _ _____ 39.7 40.8 39.1 14.49 16.51 13.18
1 Including earnings, at extra rates, for overtime.
According to the distribution in table 27, over six-tenths (61.6 percent) of all employees worked between 40 and 44 hours inclusively during the week scheduled. There were 17.7 percent working exactly 40 hours, 17.0 percent over 40 and under 44, and 26.9 percent exactly 44 hours. Nearly one-third (32.3 percent) worked under 40 hours, most of these employees having worked part-time during the pay-roll period scheduled due to labor turn-over and normal causes of absenteeism. On the other hand, there were relatively few employees, namely 6.1 percent, who worked over 44 hours. Many of these employees were watchmen, who averaged 50.1 hours per week, as well as workers in other indirect occupations.
There is very little difference in the distributions of workers according to average actual weekly hours between males and females, except
51
Digitized for FRASER http://fraser.stlouisfed.org/ Federal Reserve Bank of St. Louis
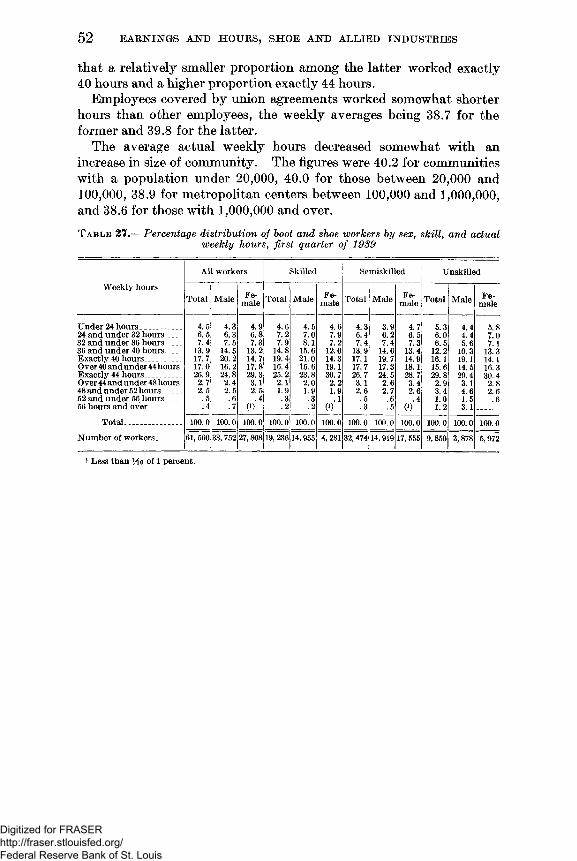
52 E A R N IN G S A N D H O U R S , S H O E A N D A L L IE D IN D U S T R IE S
that a relatively smaller proportion among the latter worked exactly 40 hours and a higher proportion exactly 44 hours.
Employees covered by union agreements worked somewhat shorter hours than other employees, the weekly averages being 38.7 for the former and 39.8 for the latter.
The average actual weekly hours decreased somewhat with an increase in size of community. The figures were 40.2 for communities with a population under 20,000, 40.0 for those between 20,000 and100,000, 38.9 for metropolitan centers between 100,000 and 1,000,000, and 38.6 for those with 1,000,000 and over.T a b l e 27 .— Percentage distribution of boot and shoe workers by sex, skill, and actual
weekly hours, first quarter of 1939
Weekly hoursAll workers Skilled Semiskilled Unskilled
Total Male Female Total Male Female Total Male Female Total Male FemaleUnder 24 hours _ _______ 4.5 4.3 4.9 4.6 4.5 4.6 4.3 3.9 4.7 5.3 4.4 5.824 and under 32 hours___ 6.5 6.3 6.8 7.2 7.0 7.9 6.4 6.2 6.5 6.0 4.4 7.032 and under 36 hours___ 7.4 7.5 7.3 7.9 8.1 7.2 7.4 7.4 7.3 6.5 5.6 7.136 and under 40 hours___ 13.9 14.5 13.2 14.8 15.6 12.0 13.9 14.6 13.4 12.2 10.3 13.3Exactly 40 hours-_ _____ 17.7 20.2 14.7 19.4 21.0 14.3 17.1 19.7 14.9 16.1 19.1 14.1Over 40 and under 44 hours 17.0 16.2 17.8 16.4 15.6 19.1 17.7 17.3 18.1 15.6 14.5 16.3Exactly 44 hours.- _____ 26.9 24.8 29.3 25.2 23.8 30.7 26.7 24.5 28.7 29.8 29.4 30.4Over 44 and under 48 hours - 2.7 2.4 3.1 2.1 2.0 2.2 3.1 2.6 3.4 2.9 3.1 2.848 and under 52 hours____ 2.5 2.5 2.5 1.9 1.9 1.9 2.6 2.7 2.6 3.4 4.6 2.652 and under 56 hours___ .5 .6 .4 .3 .3 .1 .5 .6 .4 1.0 1.5 .656 hours and o v e r ____ _ .4 .7 (*) .2 .2 0 ) .3 .5 0 ) 1.2 3.1
Total_____________ 100.0 100.0 100.0 100.0 100.0 100.0 100.0 100.0 100.0 100.0 100.0 100.0Number of workers_____ 61, 560 33, 752 27,808 19, 236 14, 955 4,281 32,474 14,919 17, 555 9,850 3,878 5,972
i Less than Ho of 1 percent.
Digitized for FRASER http://fraser.stlouisfed.org/ Federal Reserve Bank of St. Louis
Weekly Earnings 22
The average weekly earnings of all wage earners in the boot and shoe industry amounted to $19.33 during the first quarter of 1939. As indicated in table 28, over one-half (51.7 percent) of the total received between $10 and $20 a week. Another three-tenths (29.3 percent) were paid between $20 and $30. There were 8.1 percent earning below $10, many of these having worked part-time during the week scheduled. Over one-tenth (10.9 percent) received $30 and over, but less than 1 percent were paid $45 and over.
On the sex-skill basis, the average earnings per week were $25.95 for skilled, $20.81 for semiskilled, and $16.51 for unskilled males, which may be compared respectively with $17.50, $15.60, and $13.18 for females. Since there was very little variation in average weekly hours worked, these differences reflect largely those in average hourly earnings.
The average weekly earnings 23 increased with size of community, the figures amounting to $16.72 in places with a population under20.000, $19.13 in those between 20,000 and 100,000, $19.92 in metropolitan areas between 100,000 and 1,000,000, and $21.81 in those with1.000. 000 and over.
Workers covered by union agreements averaged $20.96 per week,23 which may be compared with $18.38 for other employees.
The average weekly earnings 23 also increased with the retail price of shoes, the figures being $17.16 for cheap (under $2.51), $18.93 for popular-priced ($2.51-$4.50), $20.97 for medium-priced ($4.51-$7.50), and $23.30 for fine (over $7.50) shoes. Employees working on slippers averaged $17.60, while those found in the segregated units making cut stock and findings of the integrated companies had an average of $23.77.
22 Unless otherwise specified, these figures include earnings due to extra rates paid for overtime work.22 Excluding earnings due to extra rates paid for overtime work.
53
Digitized for FRASER http://fraser.stlouisfed.org/ Federal Reserve Bank of St. Louis

54 E A R N IN G S A N D H O U R S , S H O E A N D A L L IE D IN D U S T R IE S
T a b l e 28 .-— Percentage distribution o f boot and shoe workers by sex, skill, and average weekly earnings, first quarter of 1989
Weekly earnings 1All workers Skilled Semiskilled Unskilled
Total Male Female Total Male Female Total Male Female Total Male FemaleUnder $5_______ ____ ___ 1.6 1.1 2.1 0.9 0.8 1.4 1.6 1.2 1.9 2.9 2.3 3.3$5 and under $10________ 6.5 3.6 10.1 3.3 2.3 6.9 6.8 4.2 9.0 12.0 6.5 15.5$10 and under $15_______ 25.3 14.0 38.9 11.6 7.2 27.2 27.9 16.6 37.6 43.4 30.8 51.6$15 and under $20_______ 26.4 22.8 30.8 19.1 15.1 33.3 30.1 26.7 33.1 28.4 37.5 22.4$20 and under $ 25______ 18.2 22.4 13.2 21.1 21.2 20.5 19.1 25.4 13.8 9.6 15.4 5.9$25 and under $30_______ 11.1 17.2 3.7 19.5 22.9 7.5 8.7 14.6 3.6 2.6 4.9 1.0$30 and under $35_______ 5.9 10.0 .9 12.8 15.6 2.5 3.4 6.5 .8 .7 1.4 .3$35 and under $40_______ 2.9 5.1 .2 6.6 8.4 .5 1.5 2.9 .2 .4 .9$40 and under $45_______ 1.2 2.2 .1 2.9 3.6 .2 .6 1.3 (2) (2) .1$45 and under $50_____ .5 .9 (2) 1.2 1.6 (2) .2 .4 (2) (2) .1 (2)$50 and over____________ .4 .7 (2) 1.0 1.3 (2) .1 .2 (2) (2) . 1
Total_____________ 100.0 100.0 100.0 100.0 100.0 100.0 100.0 100.0 100.0 100.0 100.0 100.0Number of workers.,- _ - 61, 560 33, 752 27,808 19, 236 14, 955 4,281 32,474 14,919 17, 555 9,850 3, 878 5,972
1 Includes earnings, at extra rates, for overtime work, a Less than Ho of 1 percent.
Digitized for FRASER http://fraser.stlouisfed.org/ Federal Reserve Bank of St. Louis
Part II.— Manufacture of Boot and Shoe Cut Stock and Findings
5 5
Digitized for FRASER http://fraser.stlouisfed.org/ Federal Reserve Bank of St. Louis

Digitized for FRASER http://fraser.stlouisfed.org/ Federal Reserve Bank of St. Louis
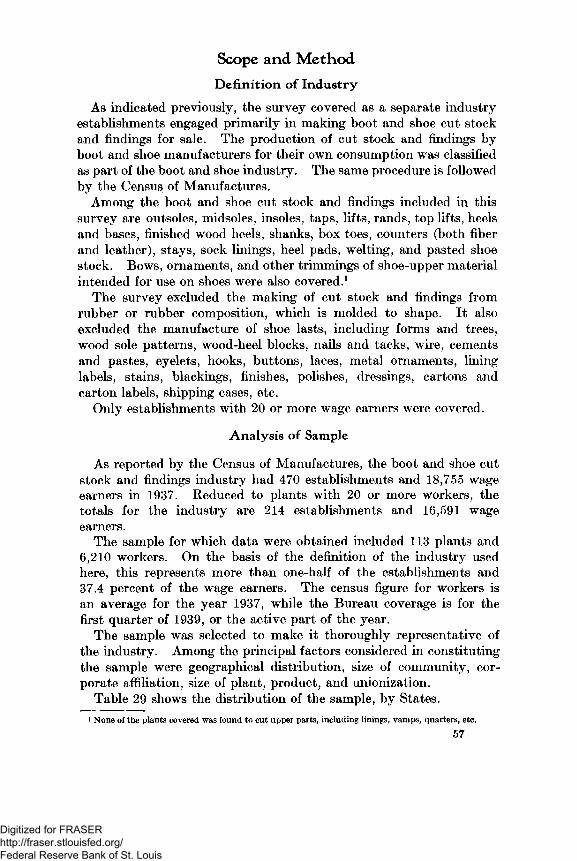
Scope and MethodDefinition of Industry
As indicated previously, the survey covered as a separate industry establishments engaged primarily in making boot and shoe cut stock and findings for sale. The production of cut stock and findings by boot and shoe manufacturers for their own consumption was classified as part of the boot and shoe industry. The same procedure is followed by the Census of Manufactures.
Among the boot and shoe cut stock and findings included in this survey are outsoles, midsoles, insoles, taps, lifts, rands, top lifts, heels and bases, finished wood heels, shanks, box toes, counters (both fiber and leather), stays, sock linings, heel pads, welting, and pasted shoe stock. Bows, ornaments, and other trimmings of shoe-upper material intended for use on shoes were also covered.1
The survey excluded the making of cut stock and findings from rubber or rubber composition, which is molded to shape. It also excluded the manufacture of shoe lasts, including forms and trees, wood sole patterns, wood-heel blocks, nails and tacks, wire, cements and pastes, eyelets, hooks, buttons, laces, metal ornaments, lining labels, stains, blackings, finishes, polishes, dressings, cartons and carton labels, shipping cases, etc.
Only establishments with 20 or more wage earners were covered.
Analysis of Sample
As reported by the Census of Manufactures, the boot and shoe cut stock and findings industry had 470 establishments and 18,755 wage earners in 1937. Reduced to plants with 20 or more workers, the totals for the industry are 214 establishments and 16,591 wage earners.
The sample for which data were obtained included 113 plants and 6,210 workers. On the basis of the definition of the industry used here, this represents more than one-half of the establishments and37.4 percent of the wage earners. The census figure for workers is an average for the year 1937, while the Bureau coverage is for the first quarter of 1939, or the active part of the year.
The sample was selected to make it thoroughly representative of the industry. Among the principal factors considered in constituting the sample were geographical distribution, size of community, corporate affiliation, size of plant, product, and unionization.
Table 29 shows the distribution of the sample, by States.i None of the plants covered was found to cut upper parts, including linings, vamps, quarters, etc.
57
Digitized for FRASER http://fraser.stlouisfed.org/ Federal Reserve Bank of St. Louis
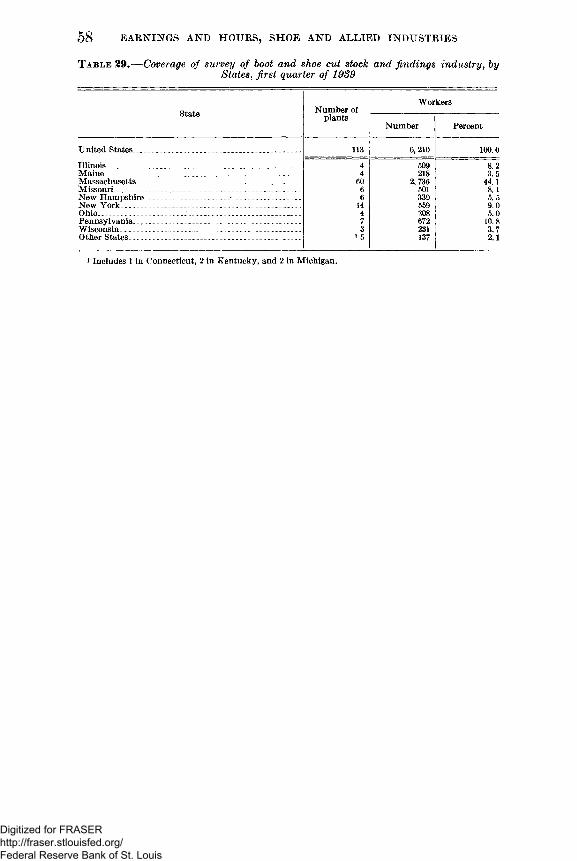
58 E A R N IN G S A N D H O U R S , SH O E A N D A L LIE D IN D U S T R IE S
T a b l e 29 .— Coverage of survey of boot and shoe cut stock and findings industry, by States, first quarter of 1939
State Number of plantsWorkers
Number PercentUnited States . ___________ ______ ________ . . . 113 6,210 100.0Illinois______ _ _____ _________ __ __ _____ _____ 4 509 8.2Maine___________ ___________ _ _______________ _ 4 218 3.5Massachusetts ___________ _____ . _____ 60 2, 736 44.1Missouri__ _____________________ . _ ___ _____ 6 501 8.1New Hampshire _. -. ___ ______ - ____ _______ _ 6 339 5.5New Y o rk ________ ___ _ _ ______ ___________ 14 559 9.0Ohio___________________ :______________________ 4 308 5.0Pennsylvania_________________ ___ ____ ___________ 7 672 10.8Wisconsin_________________ _______ __________ 3 231 3.7Other States_______________________________________ i 5 137 2.1
1 Includes 1 in Connecticut, 2 in Kentucky, and 2 in Michigan.
Digitized for FRASER http://fraser.stlouisfed.org/ Federal Reserve Bank of St. Louis
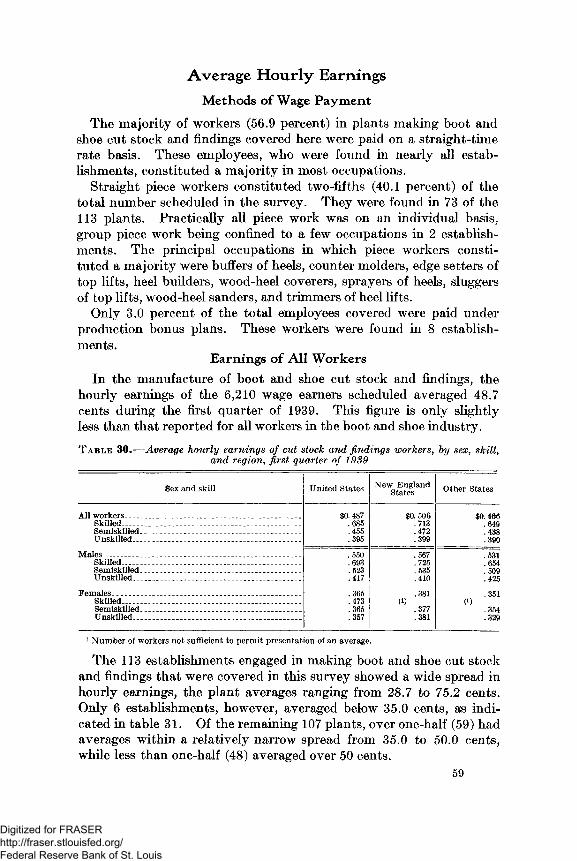
Average Hourly EarningsMethods o f Wage Payment
The majority of workers (56.9 percent) in plants making boot and shoe cut stock and findings covered here were paid on a straight-time rate basis. These employees, who were found in nearly all establishments, constituted a majority in most occupations.
Straight piece workers constituted two-fifths (40.1 percent) of the total number scheduled in the survey. They were found in 73 of the 113 plants. Practically all piece work was on an individual basis, group piece work being confined to a few occupations in 2 establishments. The principal occupations in which piece workers constituted a majority were buffers of heels, counter molders, edge setters of top lifts, heel builders, wood-heel coverers, sprayers of heels, sluggers of top lifts, wood-heel sanders, and trimmers of heel lifts.
Only 3.0 percent of the total employees covered were paid under production bonus plans. These workers were found in 8 establishments.
Earnings o f All WorkersIn the manufacture of boot and shoe cut stock and findings, the
hourly earnings of the 6,210 wage earners scheduled averaged 48.7 cents during the first quarter of 1939. This figure is only slightly less than that reported for all workers in the boot and shoe industry.T able 30.— Average hourly earnings of cut stock and findings workers, by sex, skill,
and region, first quarter of 1939
Sex and skill United States New England States Other States
All workers__________ ____________________________ $0. 487 $0. 506 $0. 466Skilled________________________________________ .685 .713 .649Semiskilled_____________________ _ ____________ .455 .472 .438Unskilled __ __ _ _____ _ _________ ____ .395 .399 .390Males_____ ______________________________________ .550 .567 .531Skilled________________________________________ .693 .725 .654Semiskilled-.. _ . ____________________ _____ .523 .535 .509Unskilled. __ _ ___________ _ ______ _ ____ .417 .410 .425Females. _______ ___ ____ _____ _____ .365 .381 .351Skilled________________________________________ .473 ( 9 ( 9Semiskilled____________________________________ .365 .377 .354Unskilled___________________ ______________ ____ .357 .381 .329
1 Number of workers not sufficient to permit presentation of an average.The 113 establishments engaged in making boot and shoe cut stock
and findings that were covered in this survey showed a wide spread in hourly earnings, the plant averages ranging from 28.7 to 75.2 cents. Only 6 establishments, however, averaged below 35.0 cents, as indicated in table 31. Of the remaining 107 plants, over one-half (59) had averages within a relatively narrow spread from 35.0 to 50.0 cents, while less than one-half (48) averaged over 50 cents.
59
Digitized for FRASER http://fraser.stlouisfed.org/ Federal Reserve Bank of St. Louis
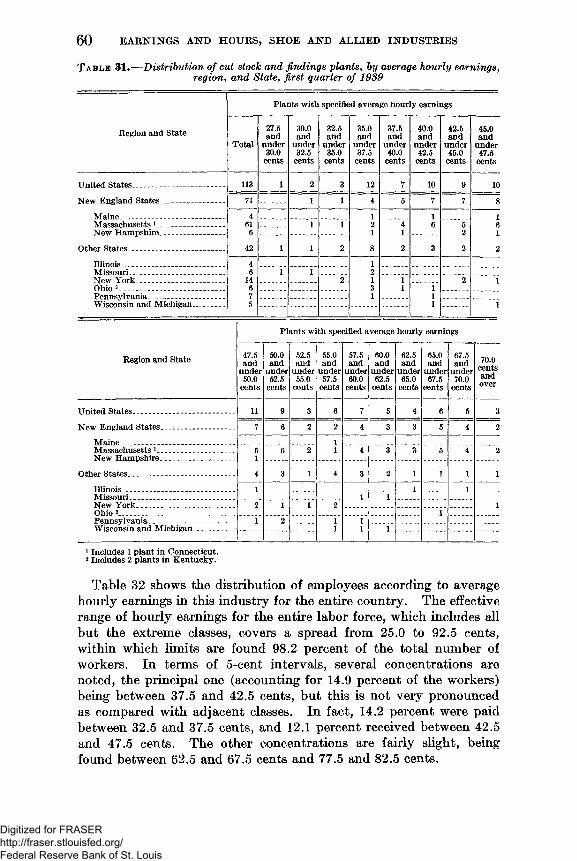
6 0 EARNINGS AND HOURS, SHOE AND ALLIED INDUSTRIES
T a b l e 31.— Distribution of cut stock and findings plants, by average hourly earnings, region, and State, first quarter o f 1939
Plants with specified average hourly earnings
Region and StateTotal
27.5andunder30.0cents
30.0andunder32.5cents
32.5andunder35.0cents
35.0andunder37.5cents
37.5andunder40.0cents
40.0andunder42.5cents
42.5andunder45.0cents
45.0andunder47.5centsUnited States-------------------------------- 113 1 2 3 12 7 10 9 10New England States- _ __ . _____ 71 1 1 4 5 7 7 8
Maine __- __ __________ __ 4 1 1 1Massachusetts 1 _ ______ _ 61 1 1 2 4 6 5 6New Hampshire _______ - 6 1 1 2 1Other States - .................... ... 42 1 1 2 8 2 3 2 2
Illinois __ _ _______ _____ ___ - 4 1Missouri.. _______ ____ 6 1 1 2New York - _ ___________ _ 14 2 1 1 2 1Ohio2 _____________________ 6 3 1 1Pennsylvania - ____ _ _ _ 7 1 1Wisconsin and Michigan__ - 6 1 1
Plants with specified average hourly earnings
Region and State 47.5andunder50.0cents
50.0andunder52.5cents
52.5andunder55.0cents
55.0andunder57.5cents
57.5andunder60.0cents
60.0andunder62.5cents
62.5andunder65.0cents
65.0andunder67.5cents
67.5andunder70.0cents
70.0centsandover
United States-----------------------------------New England States________________
Maine ___- ___ _________ ___
11 9 3 6 7 5 4 6 5 37 6 2 2 4 3 3 5 4 2
11Massachusetts1______ _ _ ___New Ham pshire.......... ................. 614
6 2 4 3 3 5 4 2Other States----------------------- --_
Illinois ____________________ ___3 1 4 3 2 1 1 1 1
1 1 1Missouri _________ - _________ - i 1New York,. _ _ ______ - _ 2 1 1 2 1Ohio 2_ - - - _ _____ _____ ___ - 1Pennsylvania- 1 2 11 11Wisconsin and Michigan. - . . . 11 Includes 1 plant in Connecticut.2 Includes 2 plants in Kentucky.
Table 32 shows the distribution of employees according to average hourly earnings in this industry for the entire country. The effective range of hourly earnings for the entire labor force, which includes all but the extreme classes, covers a spread from 25.0 to 92.5 cents, within which limits are found 98.2 percent of the total number of workers. In terms of 5-cent intervals, several concentrations are noted, the principal one (accounting for 14.9 percent of the workers) being between 37.5 and 42.5 cents, but this is not very pronounced as compared with adjacent classes. In fact, 14.2 percent were paid between 32.5 and 37.5 cents, and 12.1 percent received between 42.5 and 47.5 cents. The other concentrations are fairly slight, being found between 62.5 and 67.5 cents and 77.5 and 82.5 cents.
Digitized for FRASER http://fraser.stlouisfed.org/ Federal Reserve Bank of St. Louis
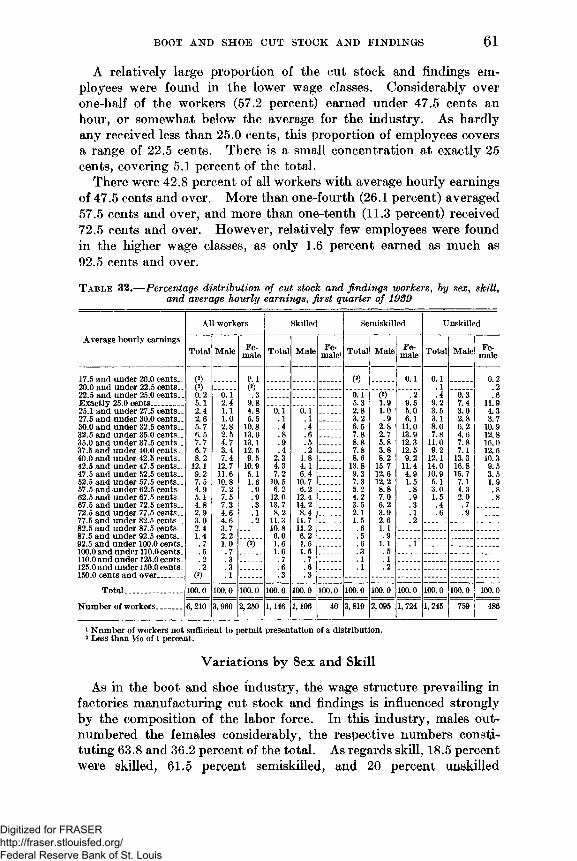
BOOT A N D SH O E C U T ST O C K A N D F IN D IN G S 61
A relatively large proportion of the cut stock and findings employees were found in the lower wage classes. Considerably over one-half of the workers (57.2 percent) earned under 47.5 cents an hour, or somewhat below the average for the industry. As hardly any received less than 25.0 cents, this proportion of employees covers a range of 22.5 cents. There is a small concentration at exactly 25 cents, covering 5.1 percent of the total.
There were 42.8 percent of all workers with average hourly earnings of 47.5 cents and over. More than one-fourth (26.1 percent) averaged57.5 cents and over, and more than one-tenth (11.3 percent) received72.5 cents and over. However, relatively few employees were found in the higher wage classes, as only 1.6 percent earned as much as92.5 cents and over.
T a b l e 3 2 .— Percentage distribution of cut stock and findings workers, by sex, skill, and average hourly earnings, first quarter o f 1989
Average hourly earningsAll workers Skilled Semiskilled Unskilled
Total Male Female Total Male Female1 Total Male Female Total Male Female17.5 and under 20.0 cents__ (2) 0.1 (2) 0.1 0.1 0.220.0 and under 22.5 cents.. (2) (2) .1 .222.5 and under 25.0 cents__ 0. 2 0.1 3 0.1 (2) . 2 .4 0.3 . 6Exactly 25.0 cents 5.1 2.4 9.8 5.3 1.9 9.5 9.2 7.4 1L925.1 and under 27.5 cents.. 2.4 1.1 4.8 0.1 0.1 2.8 1.0 5.0 3.5 3.0 4.327.5 and under 30.0 cents.. 2.6 1.0 5.5 .1 .1 3.2 .9 6.1 3.1 2.8 3.730.0 and under 32.5 cents.. 5.7 2.8 10.8 .4 .4 6.5 2.8 11.0 8.0 6.2 10.932.5 and under 35.0 cents.. 6.5 2.5 13.6 .8 .6 7.8 2.7 13.9 7.8 4.6 12.835.0 and under 37.5 cents.. 7.7 4.7 13.1 .9 .5 8.8 5.8 12.3 11.0 7.8 16.037.5 and under 40.0 cents.. 6.7 3.4 12.5 .4 .2 7.8 3.8 12.5 9.2 7.1 12.640.0 and under 42.5 cents.. 8.2 7.4 9.5 2.3 1.8 8.6 8.2 9.2 12.1 13.3 10.342.5 and under 47.5 cents.. 12.1 12.7 10.9 4.3 4.1 13.8 15.7 11.4 14.0 16.8 9.547.5 and under 52.5 cents.. 9.2 11.6 5.1 7.2 6.4 9.3 12.6 4.9 10.9 15.7 3.552.5 and under 57.5 cents.. 7.5 10.8 1.6 10.5 10.7 7.3 12.2 1.5 5.1 7.1 1.957.5 and under 62.5 cents.. 4.9 7.2 .9 6.2 6.2 5.2 8.8 .8 3.0 4.3 .862.5 and under 67.5 cents.. 5.1 7.5 .9 12.0 12.4 4.2 7.0 .9 1.5 2.0 .867.5 and under 72.5 cents.. 4.8 7.3 .3 13.7 14.2 3.5 6.2 .3 .4 .772.5 and under 77.5 cents.. 2.9 4.6 .1 8.2 8.4 2.1 3.9 .1 .6 .977.5 and under 82.5 cents.. 3.0 4.6 . 2 11.3 11.7 1.5 2.6 .282.5 and under 87.5 cents.. 2.4 3. 7 10.8 11. 2 .6 1.187.5 and under 92.5 cents.. 1.4 2.2 6.0 6.2 .5 .992.5 and under 100.0 cents. . 7 1.0 (») 1. 6 1. 6 . 6 1.1 .1100.0 and under 110.0 cents. . 5 .7 1.6 1.6 .3 .5110.0 and under 125.0 cents. . 2 .3 . 7 .7 .1 .1125.0 and under 150.0 cents. . 2 .3 .6 .6 . 1 .2150.0 cents and over (2) . 1 .3 .3
Total_____________ 100.0 100.0 100.0 100.0 100.0 100.0 100.0 100.0 100.0 100.0 100.0 100.0Number of workers______ 6, 210 3,960 2,250 1,146 1,106 40 3,819 2,095 1, 724 1, 245 759 1 486
1 Number of workers not sufficient to permit presentation of a distribution.2 Less than Ho of 1 percent.
Variations by Sex and Skill
As in the boot and shoe industry, the wage structure prevailing in factories manufacturing cut stock and findings is influenced strongly by the composition of the labor force. In this industry, males outnumbered the females considerably, the respective numbers constituting 63.8 and 36.2 percent of the total. As regards skill, 18.5 percent were skilled, 61,5 percent semiskilled, and 20 percent unskilled
Digitized for FRASER http://fraser.stlouisfed.org/ Federal Reserve Bank of St. Louis
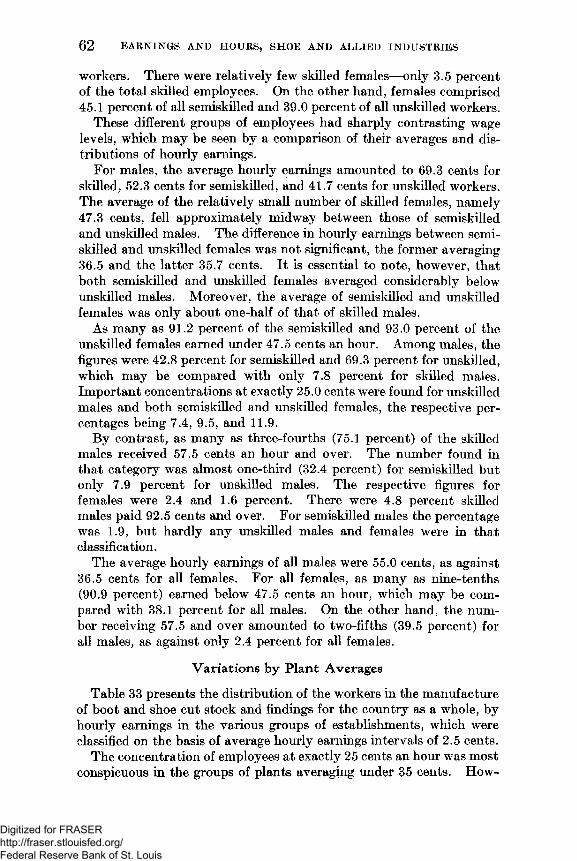
62 E A R N IN G S A N D H O U R S , SH O E A N D A L L IE D IN D U S T R IE S
workers. There were relatively few skilled females—only 3.5 percent of the total skilled employees. On the other hand, females comprised45.1 percent of all semiskilled and 39.0 percent of all unskilled workers.
These different groups of employees had sharply contrasting wage levels, which may be seen by a comparison of their averages and distributions of hourly earnings.
For males, the average hourly earnings amounted to 69.3 cents for skilled, 52.3 cents for semiskilled, and 41.7 cents for unskilled workers. The average of the relatively small number of skilled females, namely47.3 cents, fell approximately midway between those of semiskilled and unskilled males. The difference in hourly earnings between semiskilled and unskilled females was not significant, the former averaging36.5 and the latter 35.7 cents. It is essential to note, however, that both semiskilled and unskilled females averaged considerably below unskilled males. Moreover, the average of semiskilled and unskilled females was only about one-half of that of skilled males.
As many as 91.2 percent of the semiskilled and 93.0 percent of the unskilled females earned under 47.5 cents an hour. Among males, the figures were 42.8 percent for semiskilled and 69.3 percent for unskilled, which may be compared with only 7.8 percent for skilled males. Important concentrations at exactly 25.0 cents were found for unskilled males and both semiskilled and unskilled females, the respective percentages being 7.4, 9.5, and 11.9.
By contrast, as many as three-fourths (75.1 percent) of the skilled males received 57.5 cents an hour and over. The number found in that category was almost one-third (32.4 percent) for semiskilled but only 7.9 percent for unskilled males. The respective figures for females were 2.4 and 1.6 percent. There were 4.8 percent skilled males paid 92.5 cents and over. For semiskilled males the percentage was 1.9, but hardly any unskilled males and females were in that classification.
The average hourly earnings of all males were 55.0 cents, as against36.5 cents for all females. For all females, as many as nine-tenths (90.9 percent) earned below 47.5 cents an hour, which may be compared with 38.1 percent for all males. On the other hand, the number receiving 57.5 and over amounted to two-fifths (39.5 percent) for all males, as against only 2.4 percent for all females.
Variations by Plant Averages
Table 33 presents the distribution of the workers in the manufacture of boot and shoe cut stock and findings for the country as a whole, by hourly earnings in the various groups of establishments, which were classified on the basis of average hourly earnings intervals of 2.5 cents.
The concentration of employees at exactly 25 cents an hour was most conspicuous in the groups of plants averaging under 35 cents. How-
Digitized for FRASER http://fraser.stlouisfed.org/ Federal Reserve Bank of St. Louis

BOOT A N D SH O E C U T ST O C K A N D B IN D IN G S 63
ever, these groups account for only 6 establishments and 273 workers in the total coverage. The concentration was fairly striking in the group of plants with averages between 35.0 and 37.5 cents, which included 12 establishments with less than one-sixth of all employees scheduled. In the remaining groups of plants, there was either a slight concentration or none at all at exactly 25 cents.
When the 30-cent minimum goes into effect on October 24, 1939, the groups of establishments averaging below 40 cents will be most affected. In the 6 plants with the lowest averages, the number earning less than 30 cents was well over one-half of the total workers. By contrast, in the groups of establishments averaging between 35.0 and40.0 cents, over one-fifth of the employees were found receiving under 30 cents. The proportion amounted to only 13 percent in the groups of plants with averages between 40.0 and 45.0 cents, while in the remaining groups the number varied from none to 5 percent.
On the basis of a 35-cent minimum, the groups of establishments that would be most affected are those averaging below 47.5 cents an hour. The proportion of workers earning under 35 cents amounted to over seven-tenths in the groups of plants with averages of less than35.0 cents, over one-half in those averaging between 35.0 and 40.0 cents, one-third in establishments with averages between 40.0 and45.0 cents, and over one-sixth in those averaging between 45.0 and47.5 cents. Altogether, these groups account for 54 plants and 2,997 wage earners, which include less than one-half of the total coverage. In the remaining groups of establishments, the number receiving under 35 cents varied from none to about 7 percent.
The largest proportions of employees paid below 40 cents were found in the groups of plants with averages under 55 cents, the range being from 94.2 percent in the group of establishments averaging less than32.5 cents to about one-fifth in those with averages between 50.0 and55.0 cents. These groups of plants comprise about two-thirds of the industry’s coverage, including 77 establishments and 4,226 workers. In the remaining groups of plants, the number earning less than 40 cents varied from 2.2 to 15.0 percent.
By contrast, none of the groups of establishments averaging less than 47.5 cents showed any considerable number of employees with earnings of 57.5 cents and over, the figures ranging from 16.7 percent in plants with averages between 45.0 and 47.5 cents to less than 1 percent in those averaging below 32.5 cents. The proportions varied from over one-fifth (21.9 percent) in establishments with averages between 47.5 and 50.0 cents to almost one-half (48.8 percent) in those averaging between 57.5 and 60.0 cents. In the remaining groups of plants, the proportions ranged from 55.0 percent in establishments with averages between 60.0 and 62.5 cents to 72.7 percent in those averaging 70 cents and over. The only plants that had any appre-
Digitized for FRASER http://fraser.stlouisfed.org/ Federal Reserve Bank of St. Louis
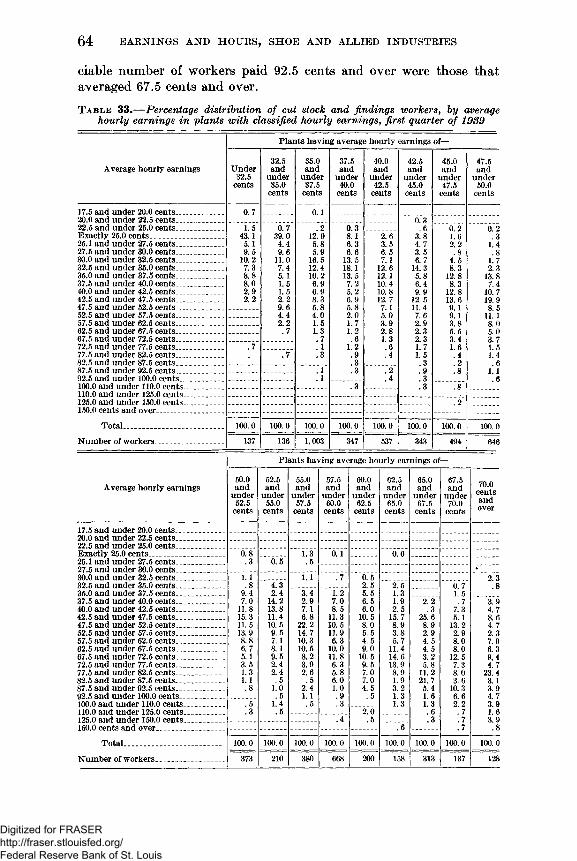
64 E A R N IN G S A N D H O U R S , SH O E A N D AL LIE D IN D U S T R IE S
ciable number of workers paid 92.5 cents and over were those that averaged 67.5 cents and over.T a b l e 33.— Percentage distribution of cut stock and findings workers, by average
hourly earnings in plants with classified hourly earnings, first quarter o f 1939
Plants having average hourly earnings of—32.5 35.0 37.5 40.0 42.5 45.0 47.5Average hourly earnings Under and and and and and and and32.5 under under under under under under undercents 35.0 37.5 40.0 42.5 45.0 47.5 50.0cents cents cents cents cents cents cents
17.5 and under 20.0 cents___________ 0.7 0.120.0 and under 22.5 cents__________ 0. 322.5 and under 25.0 cents____ _____ 1.5 0. 7 .2 0.3 . 6 0. 2 0. 2Exactly 25.0 cents_________________ 43.1 39.0 12.9 8.1 2.6 3.8 1.6 .325.1 and under 27.5 cents___________ 5.1 4.4 5.8 6.3 3.5 4.7 2. 2 1.427.5 and under 30.0 cents___________ 9.5 9.6 5.9 6.6 6.5 3. 5 .8 .830.0 and under 32.5 cents___________ 10.2 11.0 16.5 13.5 7.1 6.7 4.5 1. 732.5 and under 35.0 cents____ _____ 7.3 7.4 12.4 18.1 12.6 14.3 8.3 2.335.0 and under 37.5 cents___________ 8.8 5.1 10.2 13.5 12.1 5.8 12.8 13.837.5 and under 40.0 cents__________ 8.0 1.5 6.9 7.2 10.4 6.4 8.3 7.440.0 and under 42.5 cents_______ ___ 2.9 1.5 6.9 5.2 10.8 9.9 12.8 10.742.5 and under 47.5 cen ts_____ ____ 2.2 2.2 8.3 6.9 12. 7 12.5 13.6 19.947.5 and under 52.5 cents____ _ _ 9. 6 5.8 5.8 7.1 11.4 9.1 8. 552.5 and under 57.5 cents______ _ _ 4.4 4.0 2.0 5.0 7. 6 9.1 11. 157.5 and under 62.5 cents___________ 2.2 1.5 1.7 3.9 2.9 3. 8 8. 062.5 and under 67.5 cen ts__ _____ _ .7 1.3 1.2 2.8 2.3 5. 5 5. 067.5 and under 72.5 cents ... .7 .6 1. 3 2. 3 3. 4 3. 772.5 and under 77.5 cents_____ ___ .7 .1 1.2 .6 1. 7 1. 6 1. 577.5 and under 82.5 cents_________ .7 .3 .9 .4 1. 5 .4 1. 482.5 and under 87.5 cents .3 .3 . 2 . 687.5 and under 92.5 cents. _ _ _ .1 .3 .2 .9 .8 1.192.5 and under 100.0 cen ts__ _ __ _ .1 .4 .3 . 6100.0 and under 110.0 cents___ . _ .3 .3 .8110.0 and under 125.0 cents__ ______125.0 and under 150.0 cents _______ . 2150.0 cents and over___ __________Total______________ _______ 100.0 100.0 100.0 100.0 100.0 100.0 100.0 100.0
Number of workers. _ . _ _ ____ 137 136 1,003 347 537 343 494 646Plants having average hourly earnings of—
Average hourly earnings 50.0andunder52.5cents
52.5andunder55.0cents
55.0andunder57.5cents
57.5andunder60.0cents
60.0andunder62.5cents
62.5andunder65.0cents
65.0andunder67.5cents
67.5andunder70.0cents
70.0centsandover17.5 and under 20.0 cents_________ _20.0 and under 22.5 cents.. _________22.5 and under 25.0 cents __ _ __Exactly 25.0 cents _____ ____ _ 0.8 1.3 0.1 0.625.1 and under 27.5 cents _____ _. .3 6.5 .527.5 and under 30.0 cents _ _ .30.0 and under 32.5 cents___________ i .I i. i .7 0.5 2. 332.5 and under 35.0 cents.. _ _ _ . _ .8 4.3 2.5 2.5 0. 7 . 835.0 and under 37.5 cents. ______ 9.4 2.4 3.4 1.2 5.5 1.3 1. 537.5 and under 40.0 cents___________ 7.0 14.2 2.9 7.0 6.5 1.9 2.2 .7 3. 940.0 and under 42.5 cents. _______ 11.8 13.8 7.1 8.5 6.0 2.5 .3 7.3 4.742.5 and under 47.5 cents___________ 15.3 11.4 6.8 11.3 10.5 15.7 25.6 5.1 8.647.5 and under 52.5 cents___ ______ 11.5 10.5 22.2 10.5 8.0 8.9 8.9 13.2 4.752.5 and under 57.5 cents.. ___ __ _ 13.9 9.5 14.7 11.9 5.5 3.8 2.9 2.9 2.357.5 and under 62.5 cents _________ 8.8 7.1 10.3 6.3 4.5 5.7 4.5 8.0 7.062.5 and under 67.5 cents_______ . . . 6.7 8.1 10.5 10.0 9.0 11.4 4.5 8.0 6.367.5 and under 72.5 cents___________ 5.1 9.5 8.2 11.8 10.5 14.6 3.2 12.5 9.472.5 and under 77.5 cents______ ____ 3.5 2.4 3.9 6.3 9.5 13.9 5.8 7.3 4.777.5 and under 82.5 cents. . . . _ . 1.3 2.4 2.6 5.8 7.0 8.9 11.2 8.0 23.482.5 and under 87.5 cents . . . . . . . . . 1.1 .5 .5 6.0 7.0 1.9 21.7 3.6 3.187.5 and under 92.5 cen ts__________ .8 1.0 2.4 1.0 4.5 3.2 5.4 10.3 3.992.5 and under 100.0 cents. _ __ . . . .5 1.1 .9 . 5 1.3 1.6 6. 6 4. 7100.0 and under 110.0 cents .5 1.4 .5 .3 1.3 1.3 2.2 3.9110.0 and under 125.0 cents .3 .5 2.0 .6 . 7 1. 6125.0 and under 150.0 cents .4 .5 .3 . 7 3.9150.0 cents and over .6 .7 .8
Total_______________________ 100.0 100.0 100.0 100.0 100.0 100.0 100.0 100.0 100.0Number of workers . _______ 373 210 380 668 200 158 313 137 128
Digitized for FRASER http://fraser.stlouisfed.org/ Federal Reserve Bank of St. Louis
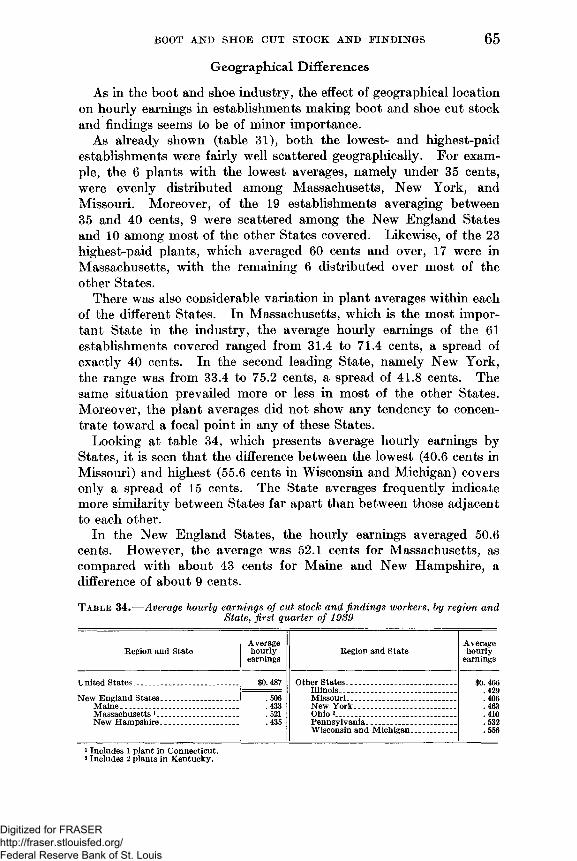
BOOT A N D SH O E C U T ST O C K A N D F IN D IN G S 65
Geographical Differences
As in the boot and shoe industry, the effect of geographical location on hourly earnings in establishments making boot and shoe cut stock and findings seems to be of minor importance.
As already shown (table 31), both the lowest- and highest-paid establishments were fairly well scattered geographically. For example, the 6 plants with the lowest averages, namely under 35 cents, were evenly distributed among Massachusetts, New York, and Missouri. Moreover, of the 19 establishments averaging between 35 and 40 cents, 9 were scattered among the New England States and 10 among most of the other States covered. Likewise, of the 23 highest-paid plants, which averaged 60 cents and over, 17 were in Massachusetts, with the remaining 6 distributed over most of the other States.
There was also considerable variation in plant averages within each of the different States. In Massachusetts, which is the most important State in the industry, the average hourly earnings of the 61 establishments covered ranged from 31.4 to 71.4 cents, a spread of exactly 40 cents. In the second leading State, namely New York, the range was from 33.4 to 75.2 cents, a spread of 41.8 cents. The same situation prevailed more or less in most of the other States. Moreover, the plant averages did not show any tendency to concentrate toward a focal point in any of these States.
Looking at table 34, which presents average hourly earnings by States, it is seen that the difference between the lowest (40.6 cents in Missouri) and highest (55.6 cents in Wisconsin and Michigan) covers only a spread of 15 cents. The State averages frequently indicate more similarity between States far apart than between those adjacent to each other.
In the New England States, the hourly earnings averaged 50.6 cents. However, the average was 52.1 cents for Massachusetts, as compared with about 43 cents for Maine and New Hampshire, a difference of about 9 cents.
T a b l e 34.— Average hourly earnings of cut stock and findings workers, by region andState, first quarter of 1939
Region and State Averagehourlyearnings Region and State AveragehourlyearningsUnited S ta te s ,__ ____ ______ $0. 487 Other S ta te s_______ ________________ $0. 466
Illinois . 429New England States. _______________ . 506 Missouri. ____________ _______ . 406Maine . __ ___ ___________ . 433 New York________ . . _______ _ . 463Massachusetts 1 __________ ___ . 521 Ohio 2___________________________ . 410New H am pshire________ ______ .435 Pennsylvania____________________ .532Wisconsin and Michigan. ________ .5561 Includes 1 plant in Connecticut.2 Includes 2 plants in Kentucky.
Digitized for FRASER http://fraser.stlouisfed.org/ Federal Reserve Bank of St. Louis
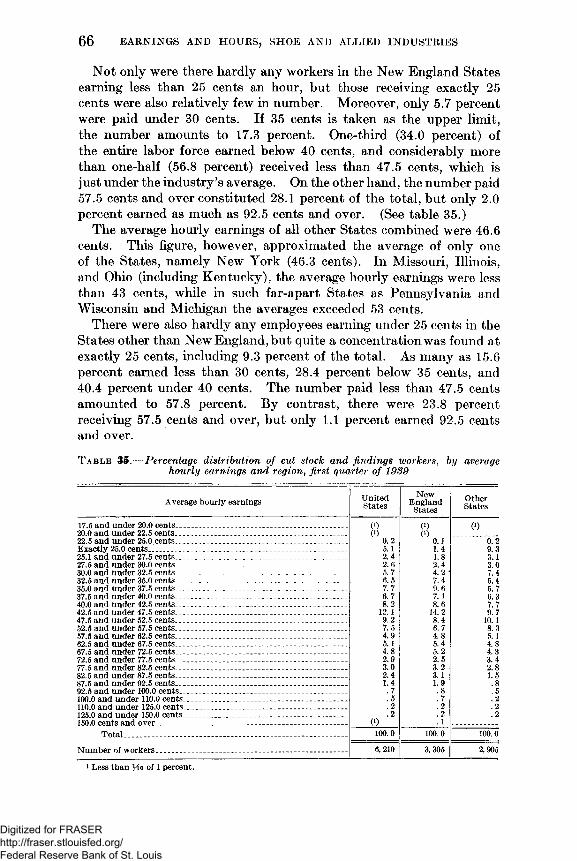
6 6 E A R N IN G S A N D H O U R S , SH O E A N D A L LIE D IN D U S T R IE S
Not only were there hardly any workers in the New England States earning less than 25 cents an hour, but those receiving exactly 25 cents were also relatively few in number. Moreover, only 5.7 percent were paid under 30 cents. If 35 cents is taken as the upper limit, the number amounts to 17.3 percent. One-third (34.0 percent) of the entire labor force earned below 40 cents, and considerably more than one-half (56.8 percent) received less than 47.5 cents, which is just under the industry’s average. On the other hand, the number paid57.5 cents and over constituted 28.1 percent of the total, but only 2.0 percent earned as much as 92.5 cents and over. (See table 35.)
The average hourly earnings of all other States combined were 46.6 cents. This figure, however, approximated the average of only one of the States, namely New York (46.3 cents). In Missouri, Illinois, and Ohio (including Kentucky), the average hourly earnings were less than 43 cents, while in such far-apart States as Pennsylvania and Wisconsin and Michigan the averages exceeded 53 cents.
There were also hardly any employees earning under 25 cents in the States other than New England, but quite a concentration was found at exactly 25 cents, including 9.3 percent of the total. As many as 15.6 percent earned less than 30 cents, 28.4 percent below 35 cents, and40.4 percent under 40 cents. The number paid less than 47.5 cents amounted to 57.8 percent. By contrast, there were 23.8 percent receiving 57.5 cents and over, but only 1.1 percent earned 92.5 cents and over.
T a b l e 35 .— Percentage distribution of cut stock and findings workers, by average hourly earnings and region, first quarter of 1939
Average hourly earnings UnitedStatesNewEnglandStates
OtherStates17.5 and under 20.0 cents. _________ ____________ ______ __ __ 0) 0) 0)20.0 and under 22.5 cents _ _ _ _ . _ _ _ _ _ _ _ _ _ . . . _ __ (i) (!)22.5 and under 25.0 cents_______________________________________ 0.2 0.1 6.2Exactly 25.0 cents_____________________________________________ 5.1 1.4 9.325.1 and under 27.5 cents_______________________________________ 2.4 1.8 3.127.5 and under 30.0 cents. _ ____________________________________ 2.6 2.4 3.030.0 and under 32.5 cents_______________________________________ 5. 7 4. 2 ‘ 7.432.5 and under 35.0 cents_______________________________________ 6.5 7.4 5.435.0 and under 37.5 cents_______________________________________ 7.7 9.6 5. 737.5 and under 40.0 cents_________ ____________________________ 6.7 7.1 6.340.0 and under 42.5 cents_______________________________________ 8.2 8.6 7.742.5 and under 47.5 cents______________________________________ 12. 1 14.2 9.747.5 and under 52.5 cents_______________________________________ 9,2 8.4 10.152.5 and under 57.5 cents_______________________________________ 7.5 6. 7 8.357.5 and under 62.5 cents,_ ________ _____ _____ ____ _______ 4.9 4.8 5.162.5 and under 67.5 cents__________________________ ___________ 5.1 5.4 4.867.5 and under 72.5 cents_______________________________________ 4.8 5.2 4.372.5 and under 77.5 cents_______________________________________ 2.9 2.5 3.477.5 and under 82.5 cents_________________________ ____________ 3.0 3.2 2.882.5 and under 87.5 cents_______________________________________ 2.4 3.1 1.587.5 and under 92.5 cents_________________ _________ _______ _ 1.4 1.9 .892.5 and under 100.0 cents______________________________________ .7 .8 .5100.0 and under 110.0 cents--------------------------------------------------------- .5 . 7 .2110.0 and under 125.0 cents __ ----------- ---------------------------------- ___ .2 .2 .2125.0 and under 150.0 cents_______________ _ __ --------------------- _ .2 .2 .2150.0 cents and over______________ ______ _____________________ 0) . 1
Total _ ___________ _______________ ___________ 100.0 100.0 100.0Number of workers________________________ _______ ____ ______ 6, 210 3,305 2,905
1 Less than Ho of 1 percent.
Digitized for FRASER http://fraser.stlouisfed.org/ Federal Reserve Bank of St. Louis

BOOT A N D SH O E C U T ST O C K A N D F IN D IN G S 67
Influence of Sizje of Community
An analysis of the coverage for the boot and shoe cut stock and findings industry in the country as a whole by size of community is presented in table 36.
By far the greater part of the industry is located in the larger metropolitan areas. Of the total, 54 plants with 2,693 workers (43.4 percent of the total) were in communities with a population of1,000,000 and over. There were 24 plants with 1,695 workers (27.3 percent) in places between 100,000 and 1,000,000. Of the remainder, 13 plants with 760 workers (12.2 percent) were in communities between 20,000 and 100,000 population, and 12 plants with 1,062 workers (17.1 percent) in those between 5,000 and 20,000.
A considerably higher proportion of the entire labor force was located in metropolitan areas with a population of 100,000 and over in New England than in the other States, these larger communities accounting for 81.7 percent in the former and 58.0 percent in the latter. There is a strong tendency for establishments making boot and shoe cut stock and findings to concentrate in boot and shoe manufacturing centers rather than at the sources of raw materials.
T a b l e 36.-— Average hourly earnings of cut stock and findings workers, hy size of community, sex, and skill, first quarter of 1989
Size of communityAll workers Skilled Semiskilled Unskilled
Total Male Female Total Male Female Total Male Female Total Male Female
5.000 and under 20,000___20.000 and under 100,000...100.000 and under 1,000,000.1.000. 000 and over__________Total_____________
5.000 and under '20,000__20.000 and under 100,000...100.000 and under 1,000,000.1.000. 000 and over--
Average hourly earnings$0.423 .502 .484 .511
$0. 484 . 561 .551 .571$0.334 .374 .377 .371
$0. 559 .646 .658 .742$0,563.656.662.753
(00)0)0)
$0. 403 .463 .475 .463$0.475 .527 .558 .517
$0:332.374.378.372$0,383.451.379.393
$0.414 .489 .383 .417$0.331 .374 .372 .356
.357.487 . 550 . 365 .685 .693 0) .455 .523 .365 .395 .417Number of workers
1,0627601, 6952, 6936245179921,827
438243703866
161171225589155166219566
65623
6824381,1851,514332251598914
350187587600219151285590
1371001753478251110243
Total_____________ 6,210 3,960 2,250 1,146 1,106 40 3,819 2, 095 1,724 1,245 759 486i Number of workers not sufficient to permit presentation of an average.
The average hourly earnings in metropolitan areas with a population of 1,000,000 and over were considerably higher than those in communities between 5,000 and 20,000, the respective figures being51.1 and 42.3 cents (table 36). On the other hand, places between100,000 and 1,000,000 averaged 48.4 cents, which is less than the 50.2-cent figure for communities between 20,000 and 100,000. This
Digitized for FRASER http://fraser.stlouisfed.org/ Federal Reserve Bank of St. Louis

6 8 E A R N IN G S A N D H O U R S , SH O E A N D A L LIE D IN D U S T R IE S
was due to the inclusion in the latter of a plant belonging to a relatively large concern engaged primarily in some other industry, which had a fairly high wage level. The removal of this establishment brings the average down to 45.7 cents.
This analysis of hourly earnings by size of community may be supplemented by that for each sex-skill group. For skilled males, the averages vary directly with size of community, but the picture is confused for semiskilled and unskilled males. As regards females, it is obvious that the average hourly earnings of places between 5,000 and 20,000 population are lower compared with those of the remaining classes of communities, all of which have a fairly uniform average.
Comparisons w ith Wage Standards Provided in Fair Labor Standards Act
In the preceding analysis, it has been indicated that at the time of the survey there was a well-defined tendency in the industry to hold to 25 cents an hour as the minimum wage, with only an insignificant fraction (0.2 percent) of the entire labor force earning less than this amount. On the other hand, hourly earnings of exactly 25 cents were shown for a small segment (5.1 percent) of all employees, although the concentration at this point was accounted for almost entirely by unskilled males and semiskilled and unskilled females.
The hourly earnings of 10.3 percent of the total labor force will have to be revised upward to meet the 30-cent minimum that will become effective on October 24, 1939. However, even with this minimum in force, relatively few skilled and semiskilled males will be directly affected. Among unskilled males and females however, the situation is considerably different, their proportions receiving below 30 cents at the time of the survey being respectively 13.5 and 20.9 percent.
Of all workers as many as 22.5 percent were paid under 35 cents an hour at the time of the survey. There were still relatively few skilled males in that category, namely 1.2 percent. On the other hand, the proportions were substantial for semiskilled and unskilled workers, amounting to 9.3 percent for semiskilled males, 24.3 percent for unskilled males, and approximately 45 percent for females.
If 40 cents an hour (which will become the statutory minimum on Oct. 24, 1945) is considered, more than one-third (36.9 percent) of the entire labor force is involved. At the time of the survey, hourly earnings of under this amount were reported for the great majority of female employees, namely 70.5 percent, nearly two-fifths (39.2 percent) of unskilled males, and less than one-fifth (18.9 percent) of semiskilled males. However, relatively few (1.9 percent) skilled males were paid below 40 cents.
Digitized for FRASER http://fraser.stlouisfed.org/ Federal Reserve Bank of St. Louis
BOOT A N D SH O E C U T ST O C K A N D F IN D IN G S 69
Comparisons w ith Wage Standards Provided in N R A Codes
Under the NRA, most of the products in the cut stock and findings industry were covered by several codes. It may be appropriate at this point, therefore, to note the extent to which this industry has deviated from the former wage minima of the NRA.
Many of the products in the cut stock and findings industry were included under the code for the leather industry. These products are outsoles (cut soles), welting, insoles, counters, box toes, and leather heels (including lifts). This code provided a minimum of 40 cents for males and 35 cents for females in the Northern States.2
Originally, the shoe shank manufacturing industry was included as part of the fabricated metal products manufacturing and metal finishing and metal coating industry, the code for which provided a minimum of 40 cents for males and 35 cents for females in the Northern States.3 Although a separate code was later drafted for the shoe shank manufacturing industry, its minimum wages were left as before.
Combining shoe shanks with the various products listed under the code for the leather industry, all of which have the same minima, it is found that over one-tenth of the males earned less than 40 cents at the time of the survey. The number of females paid under 35 cents constituted more than one-fourth of the total. In other words, establishments making these products have deviated considerably from the wage standards of the former NRA code.
The manufacture of finished wood heels was covered by the code for the wood-heel industry. This code provided a minimum of 37.5 cents for males in any city with a population over 250,000 and of 35 cents in any city or place of 250,000 or less. The minimum for female employees was 32.5 cents in all cities. An examination of the present data indicates that well over one-fifth of the males were paid under37.5 cents in the larger cities at the time of the survey, with about the same proportion receiving less than 35 cents in the smaller cities. As regards females, there were about two-fifths of the total paid less than32.5 cents.
The above codes contained the usual exemptions pertaining to learners as well as aged and handicapped workers, but it is fairly certain that these groups of employees would not account for the total number earning under the former code minima.
2 The code for the leather industry also provided a minimum of 32.5 cents for the Southern States. This survey covered only two plants in Kentucky, which were excluded from the tabulations in this section,
s This survey did not include any plants making shoe shanks in the Southern States.
Digitized for FRASER http://fraser.stlouisfed.org/ Federal Reserve Bank of St. Louis
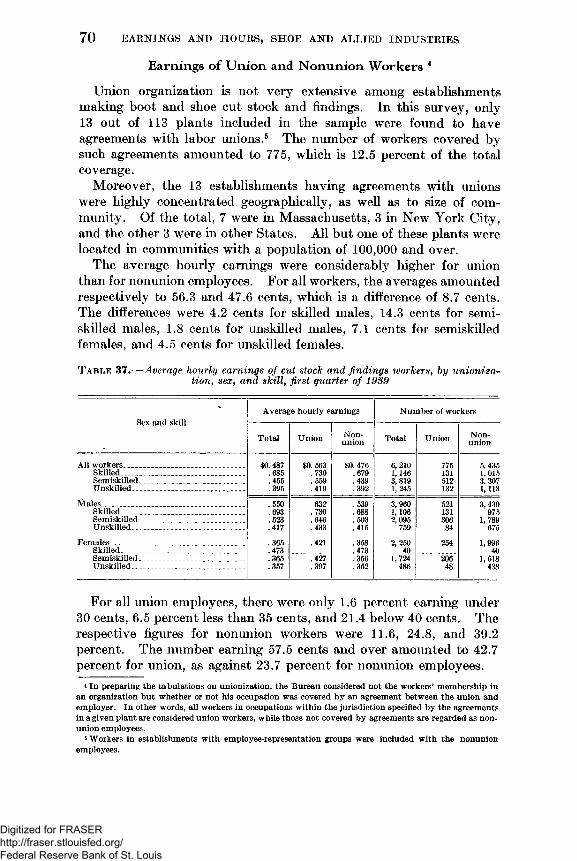
7 0 E A R N IN G S A N D H O U R S , SH O E A N D A L LIE D IN D U S T R IE S
Earnings of Union and Nonunion Workers 4
Union organization is not very extensive among establishments making boot and shoe cut stock and findings. In this survey, only 13 out of 113 plants included in the sample were found to have agreements with labor unions.6 The number of workers covered by such agreements amounted to 775, which is 12.5 percent of the total coverage.
Moreover, the 13 establishments having agreements with unions were highly concentrated geographically, as well as to size of community. Of the total, 7 were in Massachusetts, 3 in New York City, and the other 3 Were in other States. All but one of these plants were located in communities with a population of 100,000 and over.
The average hourly earnings were considerably higher for union than for nonunion employees. For all workers, the averages amounted respectively to 56.3 and 47.6 cents, which is a difference of 8.7 cents. The differences were 4.2 cents for skilled males, 14.3 cents for semiskilled males, 1.8 cents for unskilled males, 7.1 cents for semiskilled females, and 4.5 cents for unskilled females.
T a b l e §1. - Average hourly earnings of cut stock and findings workers, by unionization, sex , and skill, first quarter of 1939
Sex and skillAverage hourly earnings Number of workers
Total Union Nonunion Total Union NonunionAll workers_______ _____ _______ _ _ $0. 487 $0. 563 $0. 476 6,210 775 5, 435Skilled____________________________ .685 .730 .679 1,146 131 1,015Semiskilled________ ____ __________ .455 .559 .439 3, 819 512 3,307Unskilled_______ ____ _____________ .395 .419 .392 1,245 132 1,113Males ___ __________ _____ _____ .550 632 .539 3, 960 521 3, 439Skilled____________________________ .693 .730 .688 1,106 131 975Semiskilled_______ ________________ .523 .646 .503 2,095 306 1,789Unskilled. _________ ______ _______ .417 .433 .415 759 84 675Females____ ___ ____________ _________ .365 .421 .358 2,250 254 1,996Skilled____________________________ .473 .473 40 40Semiskilled___________ ___________ .365 .427 .356 1, 724 206 1, 518Unskilled________________________ .357 .397 .352 486 48 438
For all union employees, there were only 1.6 percent earning under 30 cents, 6.5 percent less than 35 cents, and 21.4 below 40 cents. The respective figures for nonunion workers were 11.6, 24.8, and 39.2 percent. The number earning 57.5 cents and over amounted to 42.7 percent for union, as against 23.7 percent for nonunion employees.
< In preparing the tabulations on unionization, the Bureau considered not the workers’ membership in an organization but whether or not his occupation was covered by an agreement between the union and employer. In other words, all workers in occupations within the jurisdiction specified by the agreements in a given plant are considered union workers, while those not covered by agreements are regarded as nonunion employees.
s Workers in establishments with employee-representation groups were included with the nonunion employees.
Digitized for FRASER http://fraser.stlouisfed.org/ Federal Reserve Bank of St. Louis
BOOT A N D SH O D C U T ST O C K A N D F IN D IN G S 71
Variations by Kind of Product
As already noted, the boot and shoe cut stock and findings industry covers a variety of products. A number of establishments specialize exclusively in one product, this being true of plants making finished wood heels, leather heels (and lifts), shanks, and welting; and they were classified accordingly. In other establishments, the manufacture of one or a group of closely related products predominated. Such establishments were classified on the basis of the major product or groups of closely related products. Still other plants, in which the output was not dominated by any one classified product, as well as those making distinct products, the coverage for which was not sufficiently large to present separate figures,6 were classified in the “ miscellaneous” group.
Of the various products, the most important is finished wood heels, which accounts for 24 establishments with 2,011 workers (32.4 percent of all in the sample). The manufacture of outsoles is next in importance, with 18 plants and 810 employees (13.0 percent) being primarily engaged in making that product. Among the remaining products, the coverage was 14 plants with 661 workers (10.6 percent) making counters, 12 establishments with 612 workers (9.9 percent) making leather heels, 13 plants with 437 workers (7.0 percent) making insoles, 10 establishments with 406 workers (6.5 percent) making ornaments, stays, and other trimmings, 6 plants with 246 workers (4.0 percent) making welting, 4 establishments with 233 workers (3.8 percent) making shanks, 4 plants with 93 workers (1.5 percent) making top lifts,7 and 8 plants with 701 employees (11.3 percent) making miscellaneous products.
The establishments included here under various products ̂differed somewhat according to geographical location, size of community, and unionization. Plants making finished wood heels, welting, and miscellaneous products are found primarily in the States other than New England, while those manufacturing the remaining products are located largely in the New England States. Establishments engaged mainly in the production of insoles, leather heels, ornaments, stay's and other trimmings, outsoles, and shanks are situated primarily in metropolitan areas with a population of 1,000,000 and over. Moreover, each product is largely concentrated in communities with 100,- 000 and over. In the sample, plants with union agreements are found in the manufacture of counters, finished wood heels, and insoles.
As indicated in table 38, the highest average hourly earnings for all workers were found in outsoles, the figure amounting to 61.7 cents. Establishments making welting, miscellaneous products, and counters,
6 Among other products, this group includes the making of sock linings, heel pads, box toes, etc.7 In view of the relatively small coverage for these products, any generalizations concerning them should
be considered with caution.
Digitized for FRASER http://fraser.stlouisfed.org/ Federal Reserve Bank of St. Louis
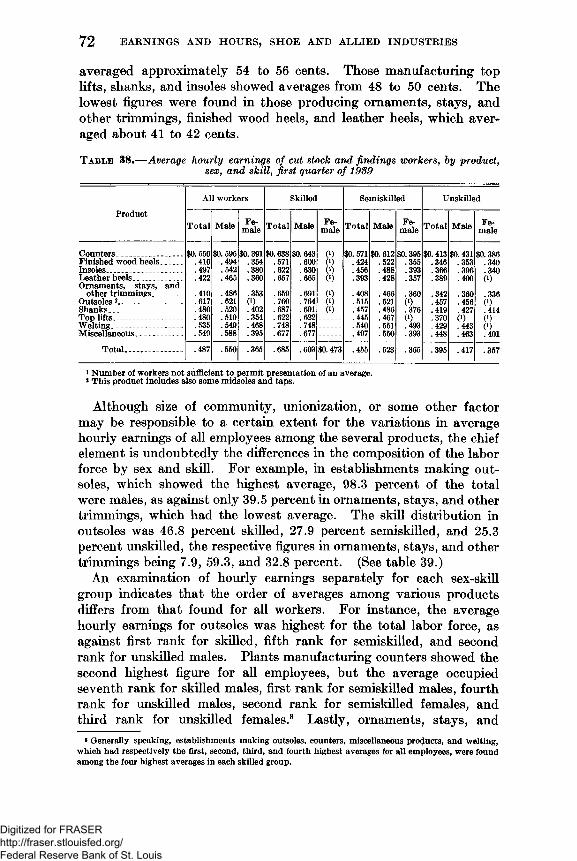
72 E A R N IN G S A N D H O U R S , SH O E A N D A L LIE D IN D U S T R IE S
averaged approximately 54 to 56 cents. Those manufacturing top lifts, shanks, and insoles showed averages from 48 to 50 cents. The lowest figures were found in those producing ornaments, stays, and other trimmings, finished wood heels, and leather heels, which averaged about 41 to 42 cents.
T a b l e 38.— Average hourly earnings of cut stock and findings workers, by product, sex, and skill, first quarter o f 1939
All workers Skilled Semiskilled UnskilledProduct
Total Male Female Total Male Female Total Male Female Total Male FemaleCounters_______________ $0. 556 $0. 595 $0.391 $0,638 $0,643 0 ) $0.571 $0. 612 $0.395 $0.413 $0,431 $0.386Finished wood heels____ .416 .494 .354 .571 .600 0 ) .424 .522 .355 .346 .353 .340Insoles_________________ .497 .542 .380 .622 .630 (9 .456 .488 .393 .366 .396 .340Leather heels___________Ornaments, stays, and .422 .465 .360 .657 .665 (9 .393 .428 . 367 .389 .400 (9
other trimmings______ .410 .486 .353 .659 .691 (9 .408 .466 .360 .342 .360 .336Outsoles 2_____________ - .617 .621 0 ) .760 .764 0 ) .515 .521 (9 .457 .456 (9Shanks_______________ .480 .520 .402 .687 .691 0 ) .457 .486 .376 .419 .427 .414Top lifts___ .480 .510 .354 .622 .622 .445 .467 (9.493 .370 (9. 443 (9(9.401Welting _____ _ ___ .535 .549 .468 .748 .748 .540 .551 . 429Miscellaneous. _ _______ .549 .588 .395 .677 .677 .497 .550 .393 .448 .463
Total_____________ .487 .550 .365 .685 .693 $0. 473 .455 .523 .365 .395 .417 .3571 Number of workers not sufficient to permit presentation of an average.2 This product includes also some midsoles and taps.
Although size of community, unionization, or some other factor may be responsible to a certain extent for the variations in average hourly earnings of all employees among the several products, the chief element is undoubtedly the differences in the composition of the labor force by sex and skill. For example, in establishments making out- soles, which showed the highest average, 98.3 percent of the total were males, as against only 39.5 percent in ornaments, stays, and other trimmings, which had the lowest average. The skill distribution in outsoles was 46.8 percent skilled, 27.9 percent semiskilled, and 25.3 percent unskilled, the respective figures in ornaments, stays, and other trimmings being 7.9, 59.3, and 32.8 percent. (See table 39.)
An examination of hourly earnings separately for each sex-skill group indicates that the order of averages among various products differs from that found for all workers. For instance, the average hourly earnings for outsoles was highest for the total labor force, as against first rank for skilled, fifth rank for semiskilled, and second rank for unskilled males. Plants manufacturing counters showed the second highest figure for all employees, but the average occupied seventh rank for skilled males, first rank for semiskilled males, fourth rank for unskilled males, second rank for semiskilled females, and third rank for unskilled females.8 Lastly, ornaments, stays, and
s Generally speaking, establishments making outsoles, counters, miscellaneous products, and welting, which had respectively the first, second, third, and fourth highest averages for all employees, were found among the four highest averages in each skilled group.
Digitized for FRASER http://fraser.stlouisfed.org/ Federal Reserve Bank of St. Louis
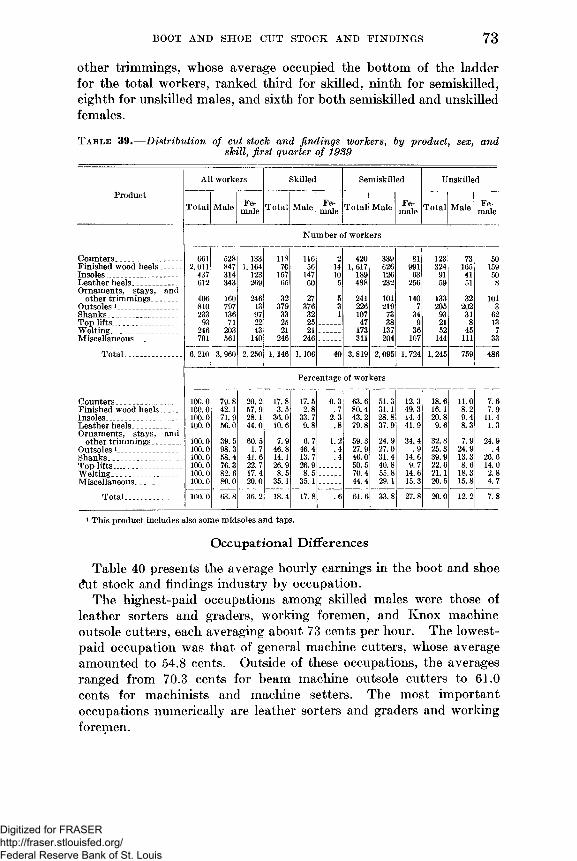
BOOT A N D SH O E C U T ST O C K A N D F IN D IN G S 73
other trimmings, whose average occupied the bottom of the ladder for the total workers, ranked third for skilled, ninth for semiskilled, eighth for unskilled males, and sixth for both semiskilled and unskilled females.
T a b l e 39.— Distribution of cut stock and findings workers, by product, sex, andskill, first quarter of 1989
ProductAll workers Skilled Semiskilled Unskilled
Total Male Female Total Male Female Total Male Female Total Male FemaleNumber of workers
Counters_______________ 661 528 133 118 116 2 420 339 81 123 73 50Finished wood heels_____ 2,011 847 1,164 70 56 14 1, 617 626 991 324 165 159Insoles _ - _______ 437 314 123 157 147 10 189 126 63 91 41 50Leather heels _. _______ _ 612 343 269 65 60 5 488 232 256 59 51 8Ornaments, stays, andother trimmings, . _ 406 160 246 32 27 5 241 101 140 133 32 101Outsoles 1______________ 810 797 13 379 376 3 226 219 7 205 202 3Shanks ___ __ ___ 233 136 97 33 32 1 107 73 34 93 31 62Top lifts_ _ _ . _ . 93 71 22 25 25 47 38 9 21 8 13Welting _ __ _ _ ___ _ 246 203 43 21 21 173 137 36 52 45 7Miscellaneous__________ 701 561 140 246 246 311 204 107 144 111 33Total_______ - . . . 6,210 3, 960 2, 250 1,146 1,106 40 3,819 2,095 1,724 1,245 759 486
Percentage of workers
Counters._ ___. . . 100.0 79.8 20.2 17.8 17.5 0.3 63.6 51.3 12.3 18.6 11.0 7.6Finished wood heels.____ 100.0 42.1 57.9 3.5 2.8 .7 80.4 31.1 49.3 16.1 8.2 7.9In soles____ . _ 100.0 71.9 28.1 36.0 33.7 2.3 43.2 28.8 14.4 20.8 9.4 11.4Leather heels___ 100.0 56.0 44.0 10.6 9.8 .8 79.8 37.9 41.9 9.6 8.3 1.3Ornaments, stays, andother trimmings __ __ 100.0 39.5 60.5 7.9 6.7 1.2 59.3 24.9 34.4 32.8 7.9 24.9Outsoles 1______________ 100.0 98.3 1.7 46.8 46.4 .4 27.9 27.0 .9 25.3 24.9 .4Shanks___ _____ -- - 100.0 58.4 41. 6 14.1 13.7 .4 46.0 31.4 14.6 39.9 13.3 26.6Top lifts 100.0 76.3 22.7 26.9 26.9 50.5 40.8 9.7 22.6 8.6 14.0Welting 100.0 82.6 17.4 8.5 8.5 70.4 55.8 14.6 21.1 18.3 2.8Miscellaneous._ _ . 100.0 80.0 20.0 35.1 35.1 — 44.4 29.1 15.3 20.5 15.8 4.7T otal.. ____ 100.0 63.8 36.2 18.4 17. 8 .6 61.6 33.8 27.8 20.0 12.2 7.8
1 This product includes also some midsoles and taps.
Occupational Differences
Table 40 presents the average hourly earnings in the boot and shoe (hit stock and findings industry by occupation.
The highest-paid occupations among skilled males were those of leather sorters and graders, working foremen, and Knox machine outsole cutters, each averaging about 73 cents per hour. The lowest- paid occupation was that of general machine cutters, whose average amounted to 54.8 cents. Outside of these occupations, the averages ranged from 70.3 cents for beam machine outsole cutters to 61.0 cents for machinists and machine setters. The most important occupations numerically are leather sorters and graders and working foremen.
Digitized for FRASER http://fraser.stlouisfed.org/ Federal Reserve Bank of St. Louis

74 E A R N IN G S A N D H O U R S , SH O E A N D A L L IE D IN D U S T R IE S
T a b l e 40.— Average hourly earnings, weekly hours, and weekly earnings o f cut stock and findings workers, by occupation , first quarter o f 1939
Skill, sex, and occupation Number of workersAveragehourlyearnings
AverageweeklyhoursAverage weekly earnings1
MalesSkilled workers:Cutters, counter, machine_________ _ __ _ 77 $0.667 37.4 $24.95Cutters, machine, general_____________________ 72 .548 41.3 22.66Cutters, insole or soft sole, machine______ . . . . 131 .655 36.5 23.91Cutters, outsole, beam machine__________ .. 120 .703 39.9 28.07Cutters, outsole, Knox machine______ _ _ __ 75 .731 40.3 29. 45Foremen, working ____________ _____ __ 213 .734 41.8 30. 71Machinists and machine setters_____ ___ __ 73 .610 41.3 25.21Sorters and graders, leather . _ _ _ _. __ 299 .735 38.8 28. 51Miscellaneous skilled, direct and indirect- ______ 46 .649 43.8 28. 43Semiskille d workers:Buffers, heel________________________ ____ _ 99 .529 35.8 18. 98Casers or sorters, other than soles _____________ 59 .491 41.0 20.14Casers, insole, outsole, and tap______________ .. 89 .453 39.5 17. 88Clerical workers__________ ____________________ 112 .553 43.1 23. 83Compressors, heel and top lift___________________ 49 .437 40.6 17. 74Countermolders ______________ . . . ________ . 261 .655 37.6 24. 60Counter rollers____ ________ _____ ____ . _ 17 .450 35.4 15. 92Cutters, heel and top lift, machine_____. . . . 123 .475 40.2 19.10Cutters, mallet and die, hand______________ 50 .416 39.9 16. 59Cutters, narrow strip, circular knife, machine_____ 57 .561 38.6 21.64Cutters, sole strip, guillotine machine____________ 65 .623 39.6 24. 66Cutters and trimmers, hand, miscellaneous_______ 24 .427 37.4 15. 96Cutters and trimmers, machine, miscellaneous___ 23 . 524 37.8 19.81Edge setters, top lift _______ ________________ 97 .558 40.0 22. 34Firemen, powerhouse.. . . . . ____ ___ ____ 26 . 527 45.4 23. 95Graders, outsole or insole, machine____ _ . _ ___ 34 .417 36.7 15. 29Graders and skivers, outsole or insole, machine___ 96 .437 39.3 17.18Groovers, welt strip, machine. _ ________________ 17 .595 41.0 24.40Heel-building occupations, miscellaneous . . . _____ 27 .454 40.4 18. 35Inspectors___________ _______________________ 19 .495 40.7 20.12Press operators, forming metal shanks.________ 35 .435 44.8 19. 48Repairers, welt______ _ __ ____ . . . . . 16 .484 40.3 19. 47Sanders, uncovered wood heel.. . . . . _ ________ 79 .595 40.1 23. 85Scarfers, welt and stripping__________ _____ . . . _ 17 .517 37.3 19. 26Skivers, counter___________ ____ ____ _ ______ 75 .543 39.7 21. 53Skivers, general . . . . _ _ 27 .415 42.2 17. 48Skivers, heel cover.. _. ____ . . . . . ____ ._ __ 17 .443 42.3 18. 72Skivers, welt and stripping__ . . . __________ _ 18 .645 41.3 26. 64Sluggers, top lift _____________________________ 91 .565 39.2 22.11Sprayers, heel _ _ . _ _ _ . . . ______ ______ 64 .431 41.7 17. 95Stainers and buffers, welt strip__________ ___ 24 .501 39.7 19. 87Strip-combining machine operators____ _______ _ 28 .511 40.1 20. 49Trimmers, heel or top lift, machine __ _ _ 83 .573 40.8 23. 39Winders and hankers, strips, machine___ ______ 24 .501 38.8 19. 42Miscellaneous semiskilled, hand, direct__ _ . . . _. 30 .396 41.6 16. 48Miscellaneous semiskilled, machine, direct.. . 83 .458 38.1 17. 45Miscellaneous semiskilled, in d irec t.._____. . . _. 40 .488 43.0 20. 99Unskilled workers:Baggers, insole or outsole._______ . . . _______ . _ _ 37 .481 39.7 19.11Breast liner-out, wood heel . __ _ __________. . . 26 .404 35.5 14. 36Catchers, outsole. _ . _ _ ______ __________ 46 .395 38.0 15.04Cementers and pasters, hand, miscellaneous . . . . . 18 .353 40.7 14.36Floor boys__________________ __. . . . _________ 224 .383 39.5 15.12Heel enamelers and inkers__ . __ _ ___ ______ _ 29 .405 38.3 15. 48Helpers, general_______ _ ___ 39 .395 43.0 16. TOJanitors_____ _______________ . . . . . . __ __ 33 .386 40.2 15. 54Laborers, indirect______________________________ 61 .460 38.9 17. 86Learners_______________ ___________________ 29 .392 38.5 15.06Packers.__ __ _ __________ ___________________ 48 .429 43.9 18. 86Pasters and joiners, strip______ ______ ________ 21 .462 39.8 18.41Scrap sorters.................... ............ ............ ............... . . . 29 .500 36.2 18.10Table workers_______ _____ _ __ ______________ 27 .464 41.3 19.17Watchmen.__ _ __ _ ________________ ________ 20 .427 46.7 19. 91Wetters and dippers___________________________ 17 .416 37.9 15. 77Miscellaneous, direct________________ ____ ______ 33 .460 32.2 14. 78Miscellaneous, indirect_________________________ 22 .505 38.2 19. 28FemalesSkilled workers:2Foreladies, working__________ _________________ 25 .472 43.2 20. 39Sorters and graders, leather_____________________ 14 .484 40.3 19. 49Semiskilled workers:Bevelers, box toe _____ _____ _______ _. . _. 14 . 284 41.5 11.80Bow makers, hand. . . . ________ ________ _____ 24 .331 29.9 . 9.92Casers and sorters, other than soles______________ 56 .354 38.0 13. 43
1 Excluding earnings at extra rates paid for overtime work.2 Exclusive of 1 instructor.
Digitized for FRASER http://fraser.stlouisfed.org/ Federal Reserve Bank of St. Louis
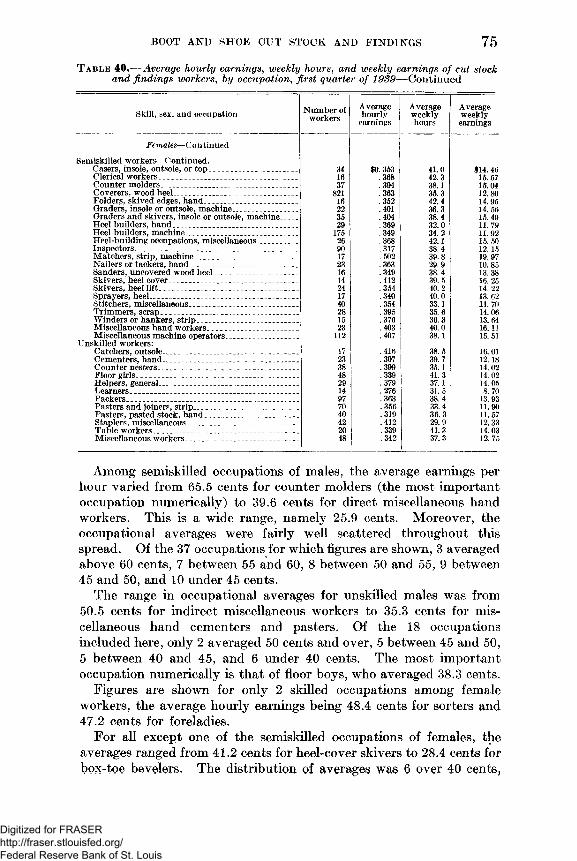
BOOT A N O SH O E C U T ST O C K A N D B IN D IN G S 75
T a b l e 40.— Average hourly earnings, weekly hours, and weekly earnings of cut stock and findings workers, by occupation, first quarter of 1939— Continued
Skill, sex, and occupation Number of workersAveragehourlyearnings
AverageweeklyhoursAverageweeklyearnings
Females—C o n tinued Semiskilled workers—C ontinued.Casers, insole, outsole, or top________________ ___ 34 $0. 353 41.0 $14. 46Clerical workers______________ ___________ ___ 16 .368 42.3 15. 57Counter molders_________ ______ __________ 37 .394 38.1 15. 04Coverers, wood heel ______ _ ___ ______ 821 .363 35.3 12. 80Folders, skived edges, hand___ _ __ ___ _________ 16 .352 42.4 14. 95Graders, insole or outsole, machine ______ _ _ __ 22 .401 36.3 14. 56Graders and skivers, insole or outsole, machine____ 35 .404 38.4 15. 49Heel builders, hand____________ ________ __ ___ 29 .369 32.0 11. 79Heel builders, machine___________ ________ ___ 175 .349 34. 2 11.92Heel-building occupations, miscellaneous .__ _____ 26 .368 42.1 15. 50Inspectors______ _ ___________ __ _ ___ 90 .317 38.4 12.15Matchers, strip, machine_______________________ 17 .502 39.8 19. 97Nailers or tackers, hand_______________ _____ _ 23 .363 29.9 10. 85Sanders, uncovered wood heel___________________ 16 .349 38.4 13. 38Skivers, heel cover___ .__ ___ _ _______ ___ _ 14 .412 39.5 16. 25Skivers, heel lift____ _____________ __ _________ 24 .354 40. 2 14. 22Sprayers, heel _________ __ _ _ ________ _____ 17 .340 40.0 13. 62Stitchers, miscellaneous________ _ ____ _ _ __ 40 .354 33.1 11. 70Trimmers, scrap_______________________________ 28 . 395 35.6 14. 06Winders or hankers, strip_________________ _____ 15 . 376 36.3 13. 64Miscellaneous hand workers_____ _ ____ __ „ 23 .403 40.0 16.11Miscellaneous machine operators________________ 112 . 407 38.1 15. 51Unskilled workers:Catchers, outsole_________ ____________________ 17 . 416 38.5 16. 01Cementers, hand_________ _______ ____ _______ 23 .307 39.7 12.18Counter nesters__________ ____________________ 38 .399 35.1 14. 02Floor girls___________ _________ _____ _____ 48 .339 41.3 14. 02Helpers, general__ ___________________________ 29 .379 37.1 14. 05Learners_____ ______________________________ 14 .276 31.5 8. 70Packers. _____ _ ___________ _ __ ________ 97 .363 38.4 13.93Pasters and joiners, strip______ _ _______ __ ___ 70 .356 33.4 11. 90Pasters, pasted stock, hand___ __________________ 40 .319 36. 3 11.57Staplers, miscellaneous_________________________ 42 .412 29.9 12. 33Table workers____ ____ _ _ _ _ _ _ _ _______ __ 20 .339 41.3 14. 03Miscellaneous workers ____________________ __ 48 .342 37.3 12. 75
Among semiskilled occupations of males, the average earnings per hour varied from 65.5 cents for counter molders (the most important occupation numerically) to 39.6 cents for direct miscellaneous hand workers. This is a wide range, namely 25.9 cents. Moreover, the occupational averages were fairly well scattered throughout this spread. Of the 37 occupations for which figures are shown, 3 averaged above 60 cents, 7 between 55 and 60, 8 between 50 and 55, 9 between 45 and 50, and 10 under 45 cents.
The range in occupational averages for unskilled males was from50.5 cents for indirect miscellaneous workers to 35.3 cents for miscellaneous hand cementers and pasters. Of the 18 occupations included here, only 2 averaged 50 cents and over, 5 between 45 and 50, 5 between 40 and 45, and 6 under 40 cents. The most important occupation numerically is that of floor boys, who averaged 38.3 cents.
Figures are shown for only 2 skilled occupations among female workers, the average hourly earnings being 48.4 cents for sorters and47.2 cents for foreladies.
For all except one of the semiskilled occupations of females, the averages ranged from 41.2 cents for heel-cover skivers to 28.4 cents for box-toe bevelers, The distribution of averages was 6 over 40 cents,
Digitized for FRASER http://fraser.stlouisfed.org/ Federal Reserve Bank of St. Louis
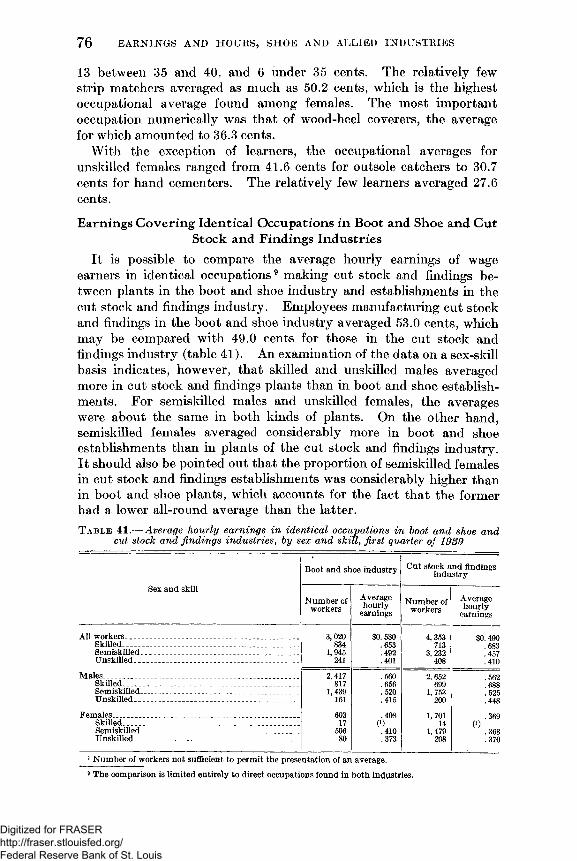
76 E A R N IN G S A N D H O U R S , SH O E A N D AL LIE D IN D U S T R IE S
13 between 35 and 40, and 6 under 35 cents. The relatively few strip matchers averaged as much as 50.2 cents, which is the highest occupational average found among females. The most important occupation numerically was that of wood-heel coverers, the average for which amounted to 36.3 cents.
With the exception of learners, the occupational averages for unskilled females ranged from 41.6 cents for outsole catchers to 30.7 cents for hand cementers. The relatively few learners averaged 27.6 cents.
Earnings Covering Identical Occupations in Boot and Shoe and Cut Stock and Findings Industries
It is possible to compare the average hourly earnings of wage earners in identical occupations9 making cut stock and findings between plants in the boot and shoe industry and establishments in the cut stock and findings industry. Employees manufacturing cut stock and findings in the boot and shoe industry averaged 53.0 cents, which may be compared with 49.0 cents for those in the cut stock and findings industry (table 41). An examination of the data on a sex-skill basis indicates, however, that skilled and unskilled males averaged more in cut stock and findings plants than in boot and shoe establishments. For semiskilled males and unskilled females, the averages were about the same in both kinds of plants. On the other hand, semiskilled females averaged considerably more in boot and shoe establishments than in plants of the cut stock and findings industry. It should also be pointed out that the proportion of semiskilled females in cut stock and findings establishments was considerably higher than in boot and shoe plants, which accounts for the fact that the former had a lower all-round average than the latter.T a b l e 41 .— Average hourly earnings in identical occupations in hoot and shoe and
cut stock and findings industries, by sex and skill, first quarter of 1989
Sex and skillBoot and shoe industry Cut stock and findings industry
Number of workersAveragehourlyearnings
Number of workersAveragehourlyearnings
All workers______ . __ _____ _____ ________ _ 3,020 $0. 530 4, 353 $0.490Skilled________________________________________ 834 .653 713 .683Semiskilled____________________________________ 1,945 .492 3, 232 .457Unskilled_____ __________ _ __ . _ 241 .401 408 .410Males-_ _________________________________________ 2,417 .560 2, 652 .562Skilled________________________________________ 817 .656 699 .688Semiskilled_________________________________ 1, 439 .520 1, 753 . 525U n sk illed .- .____ - __ ____ - . ____ .. . 161 .415 200 .448Females_____ ________ _ _ __ . _____ 603 .408 1,701 . 369Skilled________________________________________ 17 0) 14 0)Semiskilled ________ __ . . _________ __ 506 .410 1,479 .368Unskilled_____________________________________ 80 .373 208 .370
1 Number of workers not sufficient to permit the presentation of an average.
9 The comparison is limited entirely to direct occupations found in both industries.
Digitized for FRASER http://fraser.stlouisfed.org/ Federal Reserve Bank of St. Louis
BOOT A N D SH O E C U T ST O C K A N D F IN D IN G S 77
Extent of Earnings From Extra Rates for Overtime Work
Only 6.0 percent of the total wage earners covered in this industry worked overtime during the pay-roll period scheduled. Moreover, the total overtime worked by them was not very large.
The additional earnings per hour resulting from the extra rates paid for overtime are insignificant. With these earnings included, the averages were 48.8 cents for all workers, 55.2 cents for males, and 36.6 cents for females, which may be compared respectively with 48.7,55.0, and 36.5 cents with overtime earnings excluded.
Likewise, the inclusion of the additional earnings due to extra overtime rates affects very little most of the occupational averages.
Digitized for FRASER http://fraser.stlouisfed.org/ Federal Reserve Bank of St. Louis
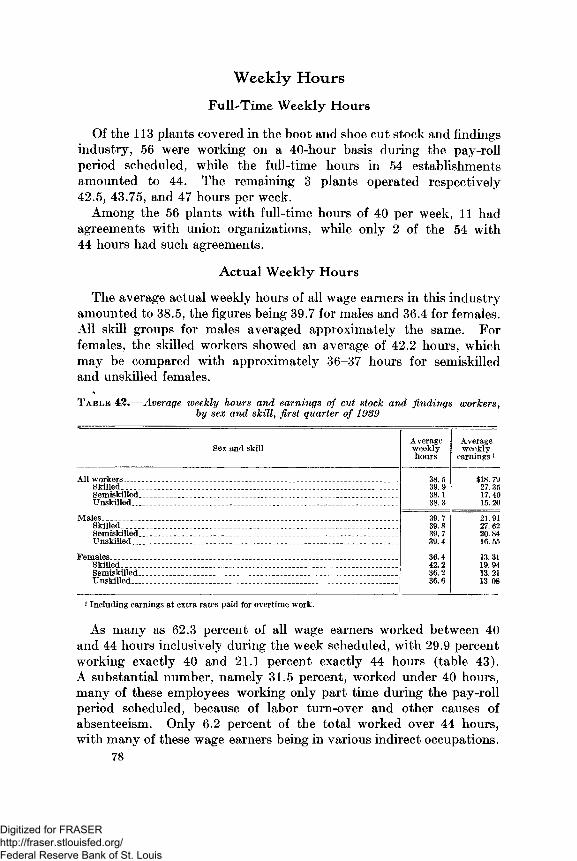
Weekly Hours
Full-Time Weekly Hours
Of the 113 plants covered in the boot and shoe cut stock and findings industry, 56 were working on a 40-hour basis during the pay-roll period scheduled, while the full-time hours in 54 establishments amounted to 44. The remaining 3 plants operated respectively42.5, 43.75, and 47 hours per week.
Among the 56 plants with full-time hours of 40 per week, 11 had agreements with union organizations, while only 2 of the 54 with 44 hours had such agreements.
Actual Weekly Hours
The average actual weekly hours of all wage earners in this industry amounted to 38.5, the figures being 39.7 for males and 36.4 for females. All skill groups for males averaged approximately the same. For females, the skilled workers showed an average of 42.2 hours, which may be compared with approximately 36-37 hours for semiskilled and unskilled females.
T a b l e 42 .— Average weekly hours and earnings of cut stock and findings workers, by sex and skill, first quarter of 1989
Sex and skill AverageweeklyhoursAverage weekly earnings 1
All workers.. _ . __ ____ ________ _______ _ _ _ _ ______ 38. 5 $18. 79Skilled_________________________________________________________ 39.9 27. 35Semiskilled - ______________ _ _ __ _ _ _ _______ 38.1 17. 40Unskilled _ __ __ ___ ___ . . . __ _______ ______ ____ _____ _ . 38.3 15.20Males _ __ ___ ____ _________ _ __ _ ____ _ _ _____ _ 39. 7 21.91Skilled____________________________ _______ ___________________ _ 39.8 27. 62Semiskilled.. ___ _ _ _ _ _ _ _ _ _ _ _ _ _ _ _ _ _ _ _ _ _ _ ___ __ _ 39.7 20. 84Unskilled ______ _____ _ __________ _ __ _ _______ _____ _____ 39.4 16. 55Females _____ _ ______ _____ ___________ ______ ________ ___________ 36.4 13. 31Skilled_______________________________________________________________ 42.2 19. 94Semiskilled____ ______ _____ ___ _ ________________ __ _ ______ 36.2 13. 21Unskilled ___________ _______ ________ _._............___ ___ ___ _______ 36.6 13.08
1 Including earnings at extra rates paid for overtime work.
As many as 62.3 percent of all wage earners worked between 40 and 44 hours inclusively during the week scheduled, with 29.9 percent working exactly 40 and 21.1 percent exactly 44 hours (table 43). A substantial number, namely 31.5 percent, worked under 40 hours, many of these employees working only part time during the pay-roll period scheduled, because of labor turn-over and other causes of absenteeism. Only 6.2 percent of the total worked over 44 hours, with many of these wage earners being in various indirect occupations.
78
Digitized for FRASER http://fraser.stlouisfed.org/ Federal Reserve Bank of St. Louis
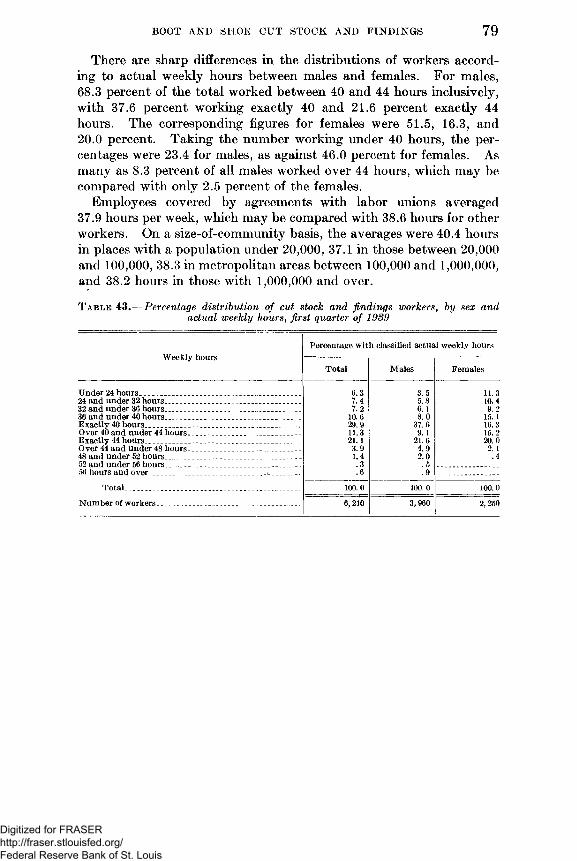
BOOT A N D SH O E C U T ST O C K A N D F IN D IN G S 79
There are sharp differences in the distributions of workers according to actual weekly hours between males and females. For males,68.3 percent of the total worked between 40 and 44 hours inclusively, with 37.6 percent working exactly 40 and 21.6 percent exactly 44 hours. The corresponding figures for females were 51.5, 16.3, and20.0 percent. Taking the number working under 40 hours, the percentages were 23.4 for males, as against 46.0 percent for females. As many as 8.3 percent of all males worked over 44 hours, which may be compared with only 2.5 percent of the females.
Employees covered by agreements with labor unions averaged37.9 hours per week, which may be compared with 38.6 hours for other workers. On a size-of-community basis, the averages were 40.4 hours in places with a population under 20,000, 37.1 in those between 20,000 and 100,000, 38.3 in metropolitan areas between 100,000 and 1,000,000, and 38.2 hours in those with 1,000,000 and over.
T a b l e 43 . - Percentage distribution of cut stock and findings workers, by sex and actual weekly hours, first quarter of 1939
Weekly hoursPercentage with classified actual weekly hours
Total Males FemalesUnder 24 hours____ _______________ ______________ . 6.3 3.5 11.324 and under 32 hours__________________ ________ _ 7.4 5.8 10.432 and under 36 hours. _ __________ . _________ ___ 7.2 6.1 9. 236 and under 40 hours__________________- ___ _______ 10.6 8.0 15. LExactly 40 hours __ __ ______ _____________ _ _____ 29.9 37.6 16.3Over 40 and under 44 hours__________ _______ ______ 11.3 9.1 15.2Exactly 44 hours.__ ________________________ _____ 21.1 21.6 20.0Over 44 and under 48 hours._ . . . _______ . . . . . 3.9 4.9 2. L48 and under 52 hours________________________ _____ 1.4 2.0 .452 and under 56 hours .. . .3 . 556 hours and over .6 .9
Total_____ _____ __ ______ . . . . . . 100.0 100. 0 100.0Number of workers________________________________ 6,210 3,960 2, 250
Digitized for FRASER http://fraser.stlouisfed.org/ Federal Reserve Bank of St. Louis

Weekly Earnings10
The average weekly earnings of all employees in the boot and shoe cut stock and findings industry amounted to $18.79 during the first quarter of 1939. On a sex-skill basis, the averages were $27.62 for skilled males, $20.84 for semiskilled, and $16.55 for unskilled, which may be compared respectively with $19.94, $13.21, and $13.08 for females. (See table 42.)
Over one-half (51.5 percent) received between $10 and $20, with over one-fourth (27.8 percent) being paid between $20 and $30. One-tenth of the total, namely 10.3 percent, earned under $10 per week, many of these having worked part-time during the week scheduled. A like proportion, 10.4 percent, received $30 and over, but only 1.1 percent earned as much as $40 and over. (See table 44.)
T a b l e 44.— Simple percentage distribution of workers according to weekly earnings in boot and shoe cut stock and findings industry in the United States, by sex and skill, during first quarter of 1939
Weekly earnings 1
All workers Males Females
3oEh
T3V3GO
Mtna©
cg
'd̂©3cnaP
'aoEH©̂
3CG
•d<03tn
1GO
'd©3pP
a©P'd©3m
'd̂©3wa©GG
'd©̂3pP
Under $5_______________$5 and under $10 _ _ - - $10 and under $15$15 and under $20______$20 and under $25_______$25 and under $30_ _ -------$30 and under $35_______$35 and under $40-----------$40 and under $45_______$45 and under $50
2.4 7.923.4 28.1 17.2 10.6 6.82.5 .6 .3 .2
0.3.32.7 10.6 23.324.724.79.7 1.9.7 1.1
2.89.426.330.516.69.0 3.61.1 .4 .2 . 1
2.910.433.4 36.8 13.32.5.5.1.1
1.13.012.726.824.016.1 10.73.81.0 .4 .4
0.4.32.59.0 23.225.425.4 9.92.0 .71 . 2
1.23.213.630.5 26.215.6 6.4 2.0.8 .4 . 1
1.86.325.342.819.03.8.8.1.-1
4.616.642.230.45.3.8.1(3) —
4.816.941.730.65.0.9.1
4.5 16.9 46. 1 27.64.5 .4
$50 and overTotal--- . - ___
Number of workers. _ _ _ _100.0 100.0 100.0 100.0 100.0 100.0 100.0 100.0 100.0 100.0 100.0 100.06, 210 1,146 3, 819 1,245 3, 960 1,106 2, 095 759 2, 250 40 1,724 486
1 Includes earnings due to extra rates paid for overtime work.2 Number of workers not sufficient to permit presentation of distribution.3 Less than Ho of 1 percent.
The average weekly earnings 11 of workers covered by agreements with union organizations amounted to $21.32, as against $18.37 for other employees. The averages were $17.09 for all wage earners in communities with a population under 20,000, $18.63 in those between 20,000 and 100,000, $18.55 in metropolitan areas between100,000 and 1,000,000, and $19.53 in those with 1,000,000 and over.
i° Unless otherwise specified, these figures include earnings at extra rates paid for overtime work, u Excluding earnings at extra rates paid for overtime work.
8 0
Digitized for FRASER http://fraser.stlouisfed.org/ Federal Reserve Bank of St. Louis
Part III.— Manufacture of Shoe Patterns
81
Digitized for FRASER http://fraser.stlouisfed.org/ Federal Reserve Bank of St. Louis

Digitized for FRASER http://fraser.stlouisfed.org/ Federal Reserve Bank of St. Louis
Scope and Method
Plants making shoe patterns are included by the Census of Manufactures along with other establishments under the designation of “Models and patterns, not including paper patterns.” No separate figures as to the total number of plants and wage earners are available for the shoe-pattern part of this industry.
The establishments engaged in making shoe patterns are small, but the Bureau did not include any plants with fewer than 5 workers. The total coverage of the survey, which was selected on the basis of a representative sample, includes 20 establishments with only 225 employees. There were 8 plants with 98 workers in Massachusetts,1 7 establishments with 49 workers in New York and Pennsylvania,2 and 5 plants with 78 workers in a number of Middle Western States.3
1 Includes one establishment in Maine.2 There were two plants in Pennsylvania.3 Of the five establishments, two were in Missouri and one each in Wisconsin, Illinois, and Ohio.
83
Digitized for FRASER http://fraser.stlouisfed.org/ Federal Reserve Bank of St. Louis
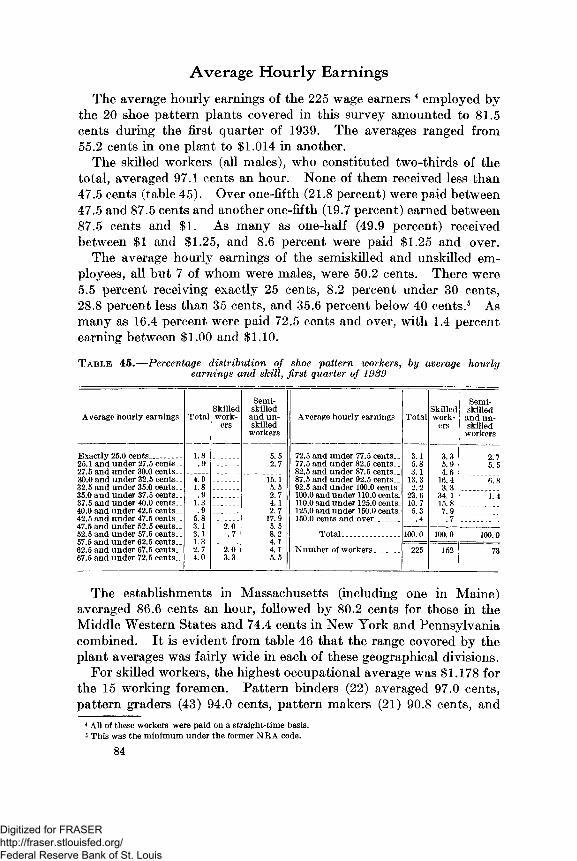
Average Hourly Earnings
The average hourly earnings of the 225 wage earners 4 employed by the 20 shoe pattern plants covered in this survey amounted to 81.5 cents during the first quarter of 1939. The averages ranged from55.2 cents in one plant to $1,014 in another.
The skilled workers (all males), who constituted two-thirds of the total, averaged 97.1 cents an hour. None of them received less than47.5 cents (table 45). Over one-fifth (21.8 percent) were paid between47.5 and 87.5 cents and another one-fifth (19.7 percent) earned between87.5 cents and $1. As many as one-half (49.9 percent) received between $1 and $1.25, and 8.6 percent were paid $1.25 and over.
The average hourly earnings of the semiskilled and unskilled employees, all but 7 of whom were males, were 50.2 cents. There were5.5 percent receiving exactly 25 cents, 8.2 percent under 30 cents,28.8 percent less than 35 cents, and 35.6 percent below 40 cents.5 As many as 16.4 percent were paid 72.5 cents and over, with 1.4 percent earning between $1.00 and $1.10.
T a b l e 45 .— Percentage distribution of shoe pattern workers, by average hourly earnings and skill, first quarter of 1989
Average hourly earnings Total Skilledworkers
Semiskilled and unskilled workersAverage hourly earnings Total Skilledworkers
Semiskilled and unskilled workersExactly 25.0 cents___________ 1.8 5.5 72.5 and under 77.5 cents, _ 3.1 3.3 2.725.1 and under 27.5 cents,. .9 2.7 77.5 and under 82.5 cents__ 5.8 5.9 5. 527.5 and under 30.0 cents, _ 82.5 and under 87.5 cents, _ 3.1 4. 630.0 and under 32.5 cents, _ 4.9 15.1 87.5 and under 92.5 cents., 13.3 16.4 6.832.5 and under 35.0 cents,, 1.8 5.5 92.5 and under 100.0 cents. 2.2 3.335.0 and under 37.5 cents,. .9 2.7 100.0 and under 110.0 cents, 23.6 34.1 ' 1.437.5 and under 40.0 cents,_ 1.3 4.1 110.0 and under 125.0 cents, 10. 7 15. 840.0 and under 42.5 cents. _ .9 2.7 125.0 and under 150.0 cents. 5.3 7. 942.5 and under 47.5 cents,_ 5.8 17.9 150.0 cents and over_____ .4 . 747.5 and under 52.5 cents,. 3. 1 2.0 5.552.5 and under 57.5 cents.. 3.1 .7 8.2 Total, _______ ___ 100.0 100.0 100.0K7 ̂onrl nriHor A9 ̂contG 1. 3 4.1Oi ,0 d iliU U i iU c l U C C iito __62.5 and under 67.5 cents.. 2. 7 2.0 A1 Number of workers,,, . _ 225 152 7367.5 and under 72.5 cents.. 4.0 3.3 5.5
The establishments in Massachusetts (including one in Maine) averaged 86.6 cents an hour, followed by 80.2 cents for those in the Middle Western States and 74.4 cents in New York and Pennsylvania combined. It is evident from table 46 that the range covered by the plant averages was fairly wide in each of these geographical divisions.
For skilled workers, the highest occupational average was $1,178 for the 15 working foremen. Pattern binders (22) averaged 97.0 cents, pattern graders (43) 94.0 cents, pattern makers (21) 90.8 cents, and
4 All of these workers were paid on a straight-time basis, s This was the minimum under the former NRA code.
84
Digitized for FRASER http://fraser.stlouisfed.org/ Federal Reserve Bank of St. Louis
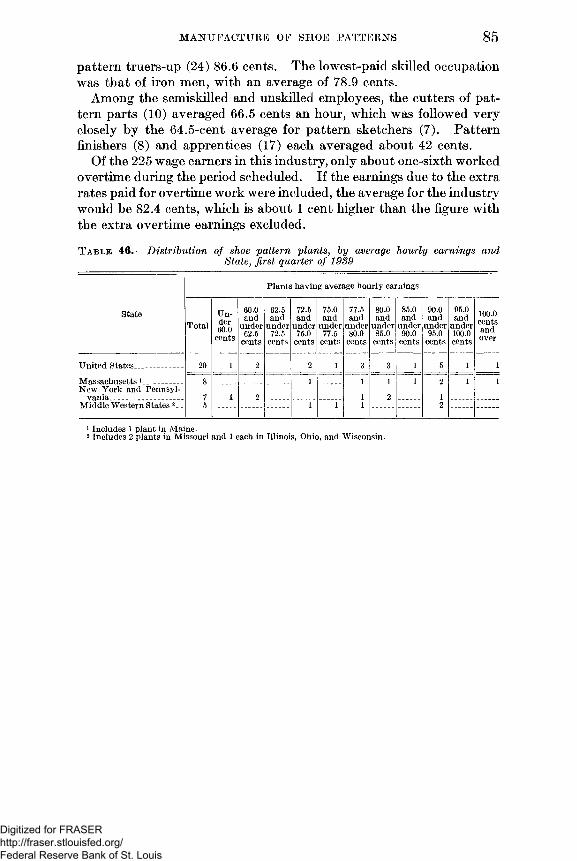
M A N U F A C T U R E OF SH O E P A T T E R N S 85pattern truers-up (24) 86.6 cents. The lowest-paid skilled occupation was that of iron men, with an average of 78.9 cents.
Among the semiskilled and unskilled employees, the cutters of pattern parts (10) averaged 66.5 cents an hour, which was followed very closely by the 64.5-cent average for pattern sketchers (7). Pattern finishers (8) and apprentices (17) each averaged about 42 cents.
Of the 225 wage earners in this industry, only about one-sixth worked overtime during the period scheduled. If the earnings due to the extra rates paid for overtime work were included, the average for the industry would be 82.4 cents, which is about 1 cent higher than the figure with the extra overtime earnings excluded.
T a b l e 46 .— Distribution of shoe pattern plants, by average hourly earnings andState, first quarter of 1939
Plants having average hourly earnings
StateTotal
Under60.0cents
60.0andunder62.5cents
62.5 andunder72.5 cents
72.5andunder75.0cents
75.0andunder77.5cents
77.5andunder80.0cents
80.0andunder85.0cents
85.0 andunder90.0 cents
90.0 andunder95.0cents
95.0 andunder100.0 cents
100.0centsandover
United States___________ 20 1 2 ____ 2 1 3 3 1 5 1 1Massachusetts1 _ ___ 8 1 1 1 1 2 1 1New York and Pennsylvania 7 1 2 1 2 1Middle Western States 2_ _ 5 1 1 1 2
1 Includes 1 plant in Maine.2 Includes 2 plants in Missouri and 1 each in Illinois, Ohio, and Wisconsin.
Digitized for FRASER http://fraser.stlouisfed.org/ Federal Reserve Bank of St. Louis

Weekly Hours and Earnings
Of the 20 plants covered in the survey, 9 had full-time hours of 40 per week, while 10 worked 44 hours. In the remaining establishment, the full-time hours amounted to 42.5 per week.
The actual weekly hours of all employees averaged 40.0. Of the total wage earners, 57.0 percent worked between 40 and 44 hours inclusively, with 26.8 percent working exactly 40, and 25.8 percent exactly 44 hours. There were 24.8 percent working under 40 hours, while 18.2 percent worked over 44 hours.
The average weekly earnings of all wage earners in this industry amounted to $32.93, the figures being $38.82 for skilled and $20.59 for semiskilled and unskilled combined. Of the total, 36.9 percent received under $30 a week, 43.6 percent between $30 and $45, 16.0 percent between $45 and $60, and 3.5 percent $60 and over. These figures include the earnings due to the extra rates received for overtime work.
The average weekly earnings by occupation were $49.32 for working foremen, $40.47 for pattern binders, $37.48 for pattern graders, $34.49 for iron men, $31.33 for pattern makers, $30.94 for pattern truers-up, $28.00 for pattern sketchers, $27.39 for cutters of pattern parts, $17.30 for apprentices, and $16.26 for pattern finishers. None of these figures include the earnings due to extra rates paid for overtime.
8 6o
Digitized for FRASER http://fraser.stlouisfed.org/ Federal Reserve Bank of St. Louis