Embed Size (px)
Citation preview
% CHG % CHG % CHG
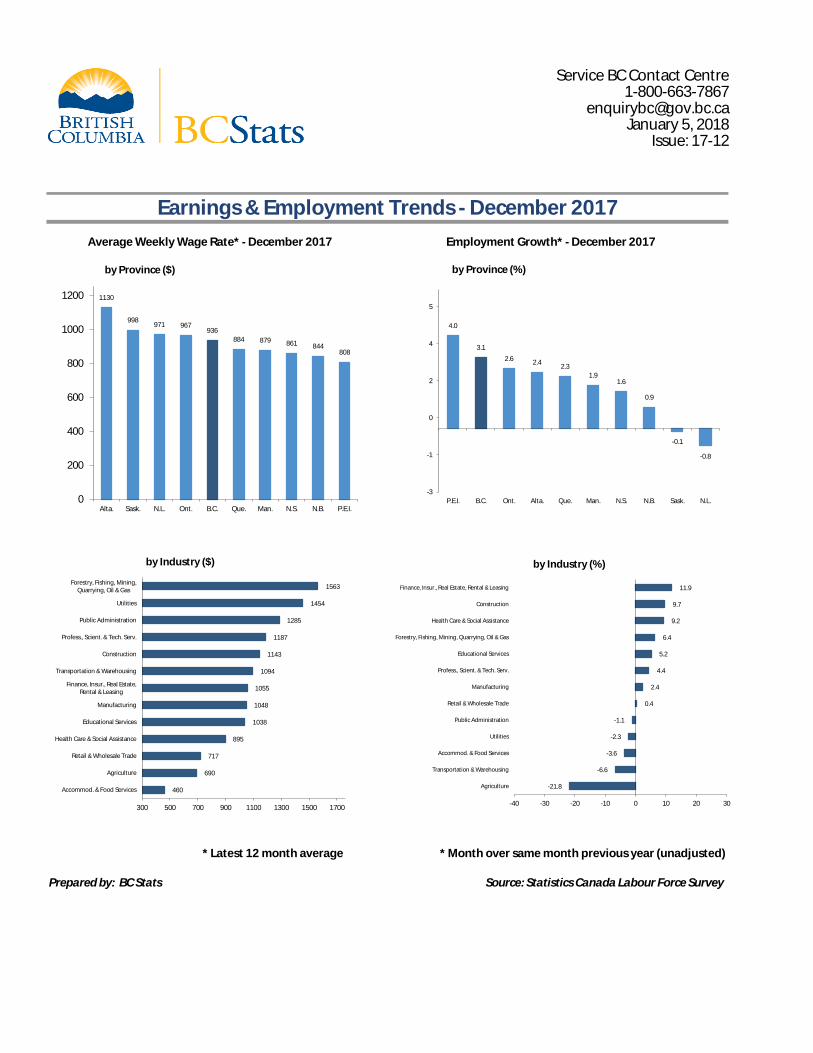
* Latest 12 month average * Month over same month previous year (unadjusted)
Prepared by: BC Stats Source: Statistics Canada Labour Force Survey
Earnings & Employment Trends - December 2017
Average Weekly Wage Rate* - December 2017 Employment Growth* - December 2017
1130
998 971 967
936
884 879 861 844 808
0
200
400
600
800
1000
1200
Alta. Sask. N.L. Ont. B.C. Que. Man. N.S. N.B. P.E.I.
by Province ($)
460
690
717
895
1038
1048
1055
1094
1143
1187
1285
1454
1563
300 500 700 900 1100 1300 1500 1700
Accommod. & Food Services
Agriculture
Retail & Wholesale Trade
Health Care & Social Assistance
Educational Services
Manufacturing
Finance, Insur., Real Estate,Rental & Leasing
Transportation & Warehousing
Construction
Profess., Scient. & Tech. Serv.
Public Administration
Utilities
Forestry, Fishing, Mining,Quarrying, Oil & Gas
by Industry ($)
4.0
3.1
2.6 2.4
2.3
1.9 1.6
0.9
-0.1
-0.8
-3
-1
0
2
4
5
P.E.I. B.C. Ont. Alta. Que. Man. N.S. N.B. Sask. N.L.
by Province (%)
-21.8
-6.6
-3.6
-2.3
-1.1
0.4
2.4
4.4
5.2
6.4
9.2
9.7
11.9
-40 -30 -20 -10 0 10 20 30
Agriculture
Transportation & Warehousing
Accommod. & Food Services
Utilities
Public Administration
Retail & Wholesale Trade
Manufacturing
Profess., Scient. & Tech. Serv.
Educational Services
Forestry, Fishing, Mining, Quarrying, Oil & Gas
Health Care & Social Assistance
Construction
Finance, Insur., Real Estate, Rental & Leasing
by Industry (%)
Service BC Contact Centre 1-800-663-7867
[email protected] January 5, 2018
Issue: 17-12
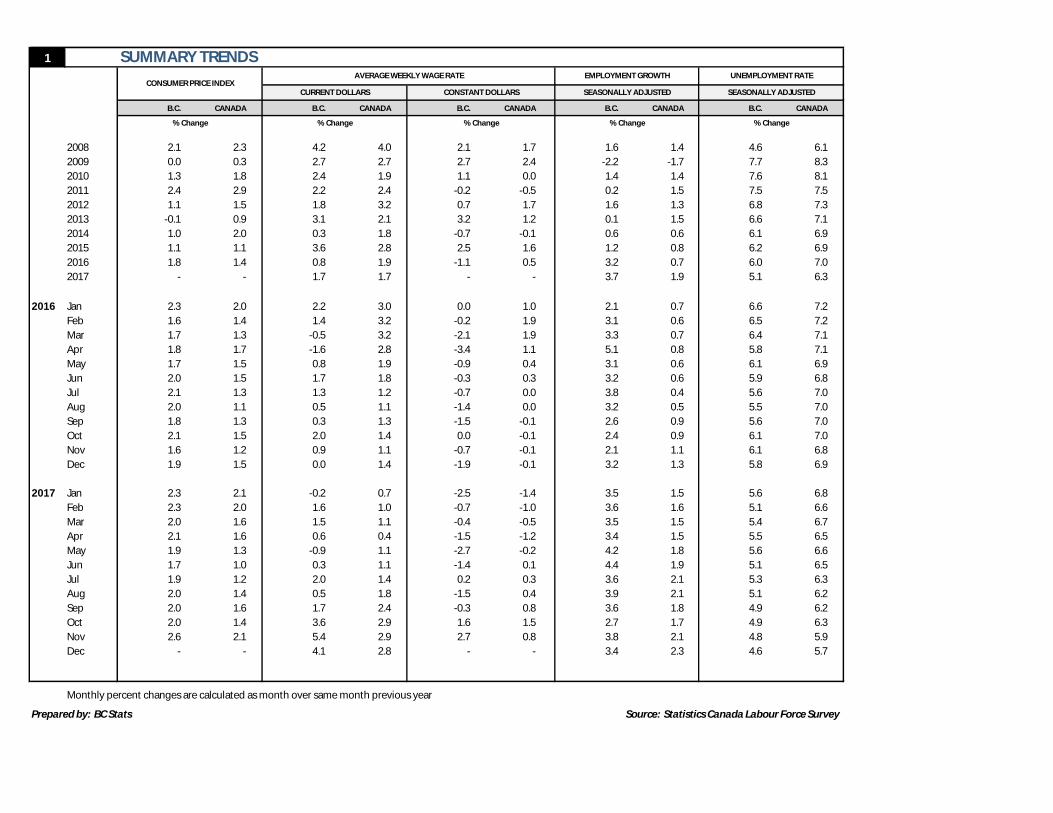
1 SUMMARY TRENDS
B.C. CANADA B.C. CANADA B.C. CANADA B.C. CANADA B.C. CANADA
2008 2.1 2.3 4.2 4.0 2.1 1.7 1.6 1.4 4.6 6.1
2009 0.0 0.3 2.7 2.7 2.7 2.4 -2.2 -1.7 7.7 8.3
2010 1.3 1.8 2.4 1.9 1.1 0.0 1.4 1.4 7.6 8.1
2011 2.4 2.9 2.2 2.4 -0.2 -0.5 0.2 1.5 7.5 7.5
2012 1.1 1.5 1.8 3.2 0.7 1.7 1.6 1.3 6.8 7.3
2013 -0.1 0.9 3.1 2.1 3.2 1.2 0.1 1.5 6.6 7.1
2014 1.0 2.0 0.3 1.8 -0.7 -0.1 0.6 0.6 6.1 6.9
2015 1.1 1.1 3.6 2.8 2.5 1.6 1.2 0.8 6.2 6.9
2016 1.8 1.4 0.8 1.9 -1.1 0.5 3.2 0.7 6.0 7.0
2017 - - 1.7 1.7 - - 3.7 1.9 5.1 6.3
2016 Jan 2.3 2.0 2.2 3.0 0.0 1.0 2.1 0.7 6.6 7.2
Feb 1.6 1.4 1.4 3.2 -0.2 1.9 3.1 0.6 6.5 7.2
Mar 1.7 1.3 -0.5 3.2 -2.1 1.9 3.3 0.7 6.4 7.1
Apr 1.8 1.7 -1.6 2.8 -3.4 1.1 5.1 0.8 5.8 7.1
May 1.7 1.5 0.8 1.9 -0.9 0.4 3.1 0.6 6.1 6.9
Jun 2.0 1.5 1.7 1.8 -0.3 0.3 3.2 0.6 5.9 6.8
Jul 2.1 1.3 1.3 1.2 -0.7 0.0 3.8 0.4 5.6 7.0
Aug 2.0 1.1 0.5 1.1 -1.4 0.0 3.2 0.5 5.5 7.0
Sep 1.8 1.3 0.3 1.3 -1.5 -0.1 2.6 0.9 5.6 7.0
Oct 2.1 1.5 2.0 1.4 0.0 -0.1 2.4 0.9 6.1 7.0
Nov 1.6 1.2 0.9 1.1 -0.7 -0.1 2.1 1.1 6.1 6.8
Dec 1.9 1.5 0.0 1.4 -1.9 -0.1 3.2 1.3 5.8 6.9
2017 Jan 2.3 2.1 -0.2 0.7 -2.5 -1.4 3.5 1.5 5.6 6.8
Feb 2.3 2.0 1.6 1.0 -0.7 -1.0 3.6 1.6 5.1 6.6
Mar 2.0 1.6 1.5 1.1 -0.4 -0.5 3.5 1.5 5.4 6.7
Apr 2.1 1.6 0.6 0.4 -1.5 -1.2 3.4 1.5 5.5 6.5
May 1.9 1.3 -0.9 1.1 -2.7 -0.2 4.2 1.8 5.6 6.6
Jun 1.7 1.0 0.3 1.1 -1.4 0.1 4.4 1.9 5.1 6.5
Jul 1.9 1.2 2.0 1.4 0.2 0.3 3.6 2.1 5.3 6.3
Aug 2.0 1.4 0.5 1.8 -1.5 0.4 3.9 2.1 5.1 6.2
Sep 2.0 1.6 1.7 2.4 -0.3 0.8 3.6 1.8 4.9 6.2
Oct 2.0 1.4 3.6 2.9 1.6 1.5 2.7 1.7 4.9 6.3
Nov 2.6 2.1 5.4 2.9 2.7 0.8 3.8 2.1 4.8 5.9
Dec - - 4.1 2.8 - - 3.4 2.3 4.6 5.7
Monthly percent changes are calculated as month over same month previous year
Prepared by: BC Stats Source: Statistics Canada Labour Force Survey
% Change % Change % Change % Change % Change
CONSUMER PRICE INDEXAVERAGE WEEKLY WAGE RATE EMPLOYMENT GROWTH UNEMPLOYMENT RATE
CURRENT DOLLARS CONSTANT DOLLARS SEASONALLY ADJUSTED SEASONALLY ADJUSTED
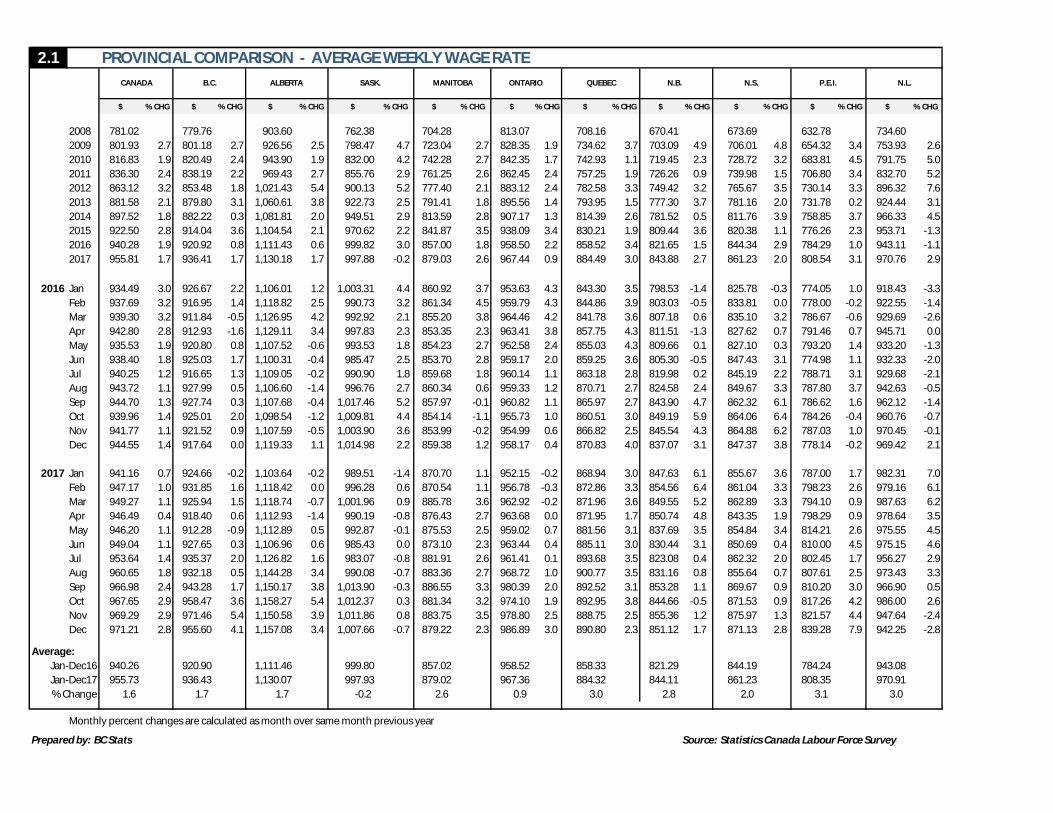
2.1 PROVINCIAL COMPARISON - AVERAGE WEEKLY WAGE RATE
$ % CHG $ % CHG $ % CHG $ % CHG $ % CHG $ % CHG $ % CHG $ % CHG $ % CHG $ % CHG $ % CHG
2008 781.02 779.76 903.60 762.38 704.28 813.07 708.16 670.41 673.69 632.78 734.60
2009 801.93 2.7 801.18 2.7 926.56 2.5 798.47 4.7 723.04 2.7 828.35 1.9 734.62 3.7 703.09 4.9 706.01 4.8 654.32 3.4 753.93 2.6
2010 816.83 1.9 820.49 2.4 943.90 1.9 832.00 4.2 742.28 2.7 842.35 1.7 742.93 1.1 719.45 2.3 728.72 3.2 683.81 4.5 791.75 5.0
2011 836.30 2.4 838.19 2.2 969.43 2.7 855.76 2.9 761.25 2.6 862.45 2.4 757.25 1.9 726.26 0.9 739.98 1.5 706.80 3.4 832.70 5.2
2012 863.12 3.2 853.48 1.8 1,021.43 5.4 900.13 5.2 777.40 2.1 883.12 2.4 782.58 3.3 749.42 3.2 765.67 3.5 730.14 3.3 896.32 7.6
2013 881.58 2.1 879.80 3.1 1,060.61 3.8 922.73 2.5 791.41 1.8 895.56 1.4 793.95 1.5 777.30 3.7 781.16 2.0 731.78 0.2 924.44 3.1
2014 897.52 1.8 882.22 0.3 1,081.81 2.0 949.51 2.9 813.59 2.8 907.17 1.3 814.39 2.6 781.52 0.5 811.76 3.9 758.85 3.7 966.33 4.5
2015 922.50 2.8 914.04 3.6 1,104.54 2.1 970.62 2.2 841.87 3.5 938.09 3.4 830.21 1.9 809.44 3.6 820.38 1.1 776.26 2.3 953.71 -1.3
2016 940.28 1.9 920.92 0.8 1,111.43 0.6 999.82 3.0 857.00 1.8 958.50 2.2 858.52 3.4 821.65 1.5 844.34 2.9 784.29 1.0 943.11 -1.1
2017 955.81 1.7 936.41 1.7 1,130.18 1.7 997.88 -0.2 879.03 2.6 967.44 0.9 884.49 3.0 843.88 2.7 861.23 2.0 808.54 3.1 970.76 2.9
2016 Jan 934.49 3.0 926.67 2.2 1,106.01 1.2 1,003.31 4.4 860.92 3.7 953.63 4.3 843.30 3.5 798.53 -1.4 825.78 -0.3 774.05 1.0 918.43 -3.3
Feb 937.69 3.2 916.95 1.4 1,118.82 2.5 990.73 3.2 861.34 4.5 959.79 4.3 844.86 3.9 803.03 -0.5 833.81 0.0 778.00 -0.2 922.55 -1.4
Mar 939.30 3.2 911.84 -0.5 1,126.95 4.2 992.92 2.1 855.20 3.8 964.46 4.2 841.78 3.6 807.18 0.6 835.10 3.2 786.67 -0.6 929.69 -2.6
Apr 942.80 2.8 912.93 -1.6 1,129.11 3.4 997.83 2.3 853.35 2.3 963.41 3.8 857.75 4.3 811.51 -1.3 827.62 0.7 791.46 0.7 945.71 0.0
May 935.53 1.9 920.80 0.8 1,107.52 -0.6 993.53 1.8 854.23 2.7 952.58 2.4 855.03 4.3 809.66 0.1 827.10 0.3 793.20 1.4 933.20 -1.3
Jun 938.40 1.8 925.03 1.7 1,100.31 -0.4 985.47 2.5 853.70 2.8 959.17 2.0 859.25 3.6 805.30 -0.5 847.43 3.1 774.98 1.1 932.33 -2.0
Jul 940.25 1.2 916.65 1.3 1,109.05 -0.2 990.90 1.8 859.68 1.8 960.14 1.1 863.18 2.8 819.98 0.2 845.19 2.2 788.71 3.1 929.68 -2.1
Aug 943.72 1.1 927.99 0.5 1,106.60 -1.4 996.76 2.7 860.34 0.6 959.33 1.2 870.71 2.7 824.58 2.4 849.67 3.3 787.80 3.7 942.63 -0.5
Sep 944.70 1.3 927.74 0.3 1,107.68 -0.4 1,017.46 5.2 857.97 -0.1 960.82 1.1 865.97 2.7 843.90 4.7 862.32 6.1 786.62 1.6 962.12 -1.4
Oct 939.96 1.4 925.01 2.0 1,098.54 -1.2 1,009.81 4.4 854.14 -1.1 955.73 1.0 860.51 3.0 849.19 5.9 864.06 6.4 784.26 -0.4 960.76 -0.7
Nov 941.77 1.1 921.52 0.9 1,107.59 -0.5 1,003.90 3.6 853.99 -0.2 954.99 0.6 866.82 2.5 845.54 4.3 864.88 6.2 787.03 1.0 970.45 -0.1
Dec 944.55 1.4 917.64 0.0 1,119.33 1.1 1,014.98 2.2 859.38 1.2 958.17 0.4 870.83 4.0 837.07 3.1 847.37 3.8 778.14 -0.2 969.42 2.1
2017 Jan 941.16 0.7 924.66 -0.2 1,103.64 -0.2 989.51 -1.4 870.70 1.1 952.15 -0.2 868.94 3.0 847.63 6.1 855.67 3.6 787.00 1.7 982.31 7.0
Feb 947.17 1.0 931.85 1.6 1,118.42 0.0 996.28 0.6 870.54 1.1 956.78 -0.3 872.86 3.3 854.56 6.4 861.04 3.3 798.23 2.6 979.16 6.1
Mar 949.27 1.1 925.94 1.5 1,118.74 -0.7 1,001.96 0.9 885.78 3.6 962.92 -0.2 871.96 3.6 849.55 5.2 862.89 3.3 794.10 0.9 987.63 6.2
Apr 946.49 0.4 918.40 0.6 1,112.93 -1.4 990.19 -0.8 876.43 2.7 963.68 0.0 871.95 1.7 850.74 4.8 843.35 1.9 798.29 0.9 978.64 3.5
May 946.20 1.1 912.28 -0.9 1,112.89 0.5 992.87 -0.1 875.53 2.5 959.02 0.7 881.56 3.1 837.69 3.5 854.84 3.4 814.21 2.6 975.55 4.5
Jun 949.04 1.1 927.65 0.3 1,106.96 0.6 985.43 0.0 873.10 2.3 963.44 0.4 885.11 3.0 830.44 3.1 850.69 0.4 810.00 4.5 975.15 4.6
Jul 953.64 1.4 935.37 2.0 1,126.82 1.6 983.07 -0.8 881.91 2.6 961.41 0.1 893.68 3.5 823.08 0.4 862.32 2.0 802.45 1.7 956.27 2.9
Aug 960.65 1.8 932.18 0.5 1,144.28 3.4 990.08 -0.7 883.36 2.7 968.72 1.0 900.77 3.5 831.16 0.8 855.64 0.7 807.61 2.5 973.43 3.3
Sep 966.98 2.4 943.28 1.7 1,150.17 3.8 1,013.90 -0.3 886.55 3.3 980.39 2.0 892.52 3.1 853.28 1.1 869.67 0.9 810.20 3.0 966.90 0.5
Oct 967.65 2.9 958.47 3.6 1,158.27 5.4 1,012.37 0.3 881.34 3.2 974.10 1.9 892.95 3.8 844.66 -0.5 871.53 0.9 817.26 4.2 986.00 2.6
Nov 969.29 2.9 971.46 5.4 1,150.58 3.9 1,011.86 0.8 883.75 3.5 978.80 2.5 888.75 2.5 855.36 1.2 875.97 1.3 821.57 4.4 947.64 -2.4
Dec 971.21 2.8 955.60 4.1 1,157.08 3.4 1,007.66 -0.7 879.22 2.3 986.89 3.0 890.80 2.3 851.12 1.7 871.13 2.8 839.28 7.9 942.25 -2.8
Average:
Jan-Dec16 940.26 920.90 1,111.46 999.80 857.02 958.52 858.33 821.29 844.19 784.24 943.08
Jan-Dec17 955.73 936.43 1,130.07 997.93 879.02 967.36 884.32 844.11 861.23 808.35 970.91
% Change 1.6 1.7 1.7 -0.2 2.6 0.9 3.0 2.8 2.0 3.1 3.0
Monthly percent changes are calculated as month over same month previous year
Prepared by: BC Stats Source: Statistics Canada Labour Force Survey
QUEBEC N.B. N.S. P.E.I. N.L.CANADA B.C. ALBERTA SASK. MANITOBA ONTARIO
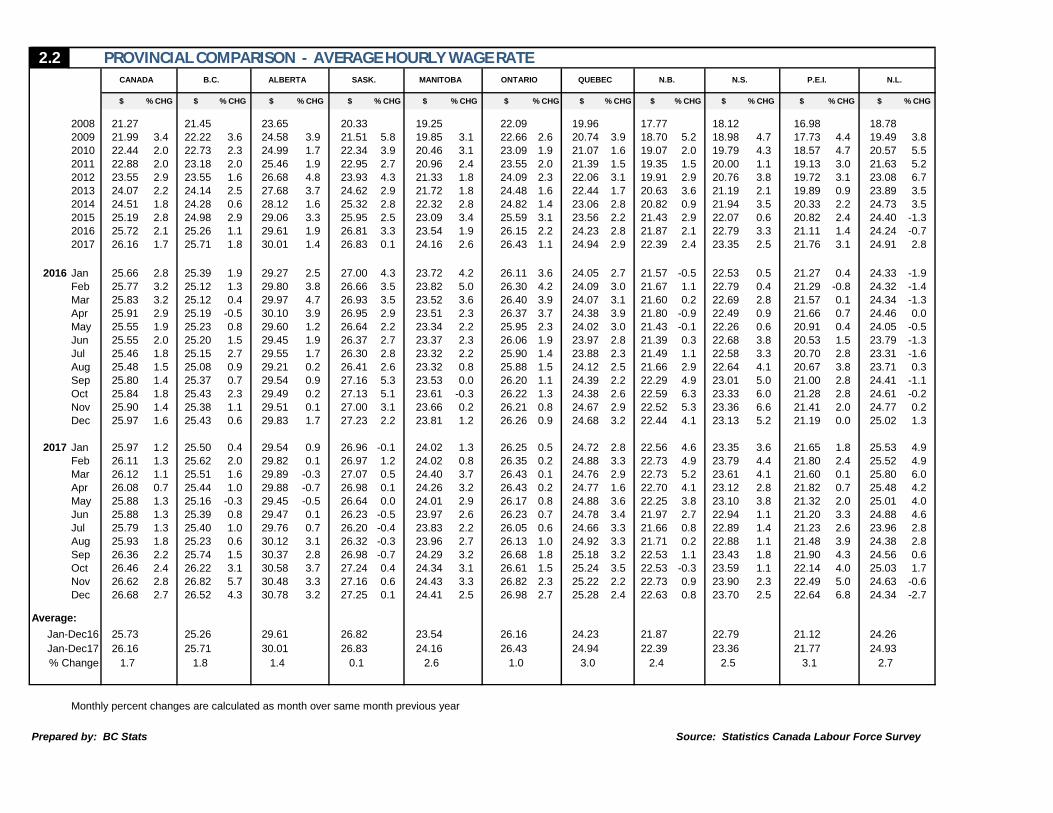
2.2 PROVINCIAL COMPARISON - AVERAGE HOURLY WAGE RATE
$ % CHG $ % CHG $ % CHG $ % CHG $ % CHG $ % CHG $ % CHG $ % CHG $ % CHG $ % CHG $ % CHG
2008 21.27 21.45 23.65 20.33 19.25 22.09 19.96 17.77 18.12 16.98 18.78
2009 21.99 3.4 22.22 3.6 24.58 3.9 21.51 5.8 19.85 3.1 22.66 2.6 20.74 3.9 18.70 5.2 18.98 4.7 17.73 4.4 19.49 3.8
2010 22.44 2.0 22.73 2.3 24.99 1.7 22.34 3.9 20.46 3.1 23.09 1.9 21.07 1.6 19.07 2.0 19.79 4.3 18.57 4.7 20.57 5.5
2011 22.88 2.0 23.18 2.0 25.46 1.9 22.95 2.7 20.96 2.4 23.55 2.0 21.39 1.5 19.35 1.5 20.00 1.1 19.13 3.0 21.63 5.2
2012 23.55 2.9 23.55 1.6 26.68 4.8 23.93 4.3 21.33 1.8 24.09 2.3 22.06 3.1 19.91 2.9 20.76 3.8 19.72 3.1 23.08 6.7
2013 24.07 2.2 24.14 2.5 27.68 3.7 24.62 2.9 21.72 1.8 24.48 1.6 22.44 1.7 20.63 3.6 21.19 2.1 19.89 0.9 23.89 3.5
2014 24.51 1.8 24.28 0.6 28.12 1.6 25.32 2.8 22.32 2.8 24.82 1.4 23.06 2.8 20.82 0.9 21.94 3.5 20.33 2.2 24.73 3.5
2015 25.19 2.8 24.98 2.9 29.06 3.3 25.95 2.5 23.09 3.4 25.59 3.1 23.56 2.2 21.43 2.9 22.07 0.6 20.82 2.4 24.40 -1.3
2016 25.72 2.1 25.26 1.1 29.61 1.9 26.81 3.3 23.54 1.9 26.15 2.2 24.23 2.8 21.87 2.1 22.79 3.3 21.11 1.4 24.24 -0.7
2017 26.16 1.7 25.71 1.8 30.01 1.4 26.83 0.1 24.16 2.6 26.43 1.1 24.94 2.9 22.39 2.4 23.35 2.5 21.76 3.1 24.91 2.8
2016 Jan 25.66 2.8 25.39 1.9 29.27 2.5 27.00 4.3 23.72 4.2 26.11 3.6 24.05 2.7 21.57 -0.5 22.53 0.5 21.27 0.4 24.33 -1.9
Feb 25.77 3.2 25.12 1.3 29.80 3.8 26.66 3.5 23.82 5.0 26.30 4.2 24.09 3.0 21.67 1.1 22.79 0.4 21.29 -0.8 24.32 -1.4
Mar 25.83 3.2 25.12 0.4 29.97 4.7 26.93 3.5 23.52 3.6 26.40 3.9 24.07 3.1 21.60 0.2 22.69 2.8 21.57 0.1 24.34 -1.3
Apr 25.91 2.9 25.19 -0.5 30.10 3.9 26.95 2.9 23.51 2.3 26.37 3.7 24.38 3.9 21.80 -0.9 22.49 0.9 21.66 0.7 24.46 0.0
May 25.55 1.9 25.23 0.8 29.60 1.2 26.64 2.2 23.34 2.2 25.95 2.3 24.02 3.0 21.43 -0.1 22.26 0.6 20.91 0.4 24.05 -0.5
Jun 25.55 2.0 25.20 1.5 29.45 1.9 26.37 2.7 23.37 2.3 26.06 1.9 23.97 2.8 21.39 0.3 22.68 3.8 20.53 1.5 23.79 -1.3
Jul 25.46 1.8 25.15 2.7 29.55 1.7 26.30 2.8 23.32 2.2 25.90 1.4 23.88 2.3 21.49 1.1 22.58 3.3 20.70 2.8 23.31 -1.6
Aug 25.48 1.5 25.08 0.9 29.21 0.2 26.41 2.6 23.32 0.8 25.88 1.5 24.12 2.5 21.66 2.9 22.64 4.1 20.67 3.8 23.71 0.3
Sep 25.80 1.4 25.37 0.7 29.54 0.9 27.16 5.3 23.53 0.0 26.20 1.1 24.39 2.2 22.29 4.9 23.01 5.0 21.00 2.8 24.41 -1.1
Oct 25.84 1.8 25.43 2.3 29.49 0.2 27.13 5.1 23.61 -0.3 26.22 1.3 24.38 2.6 22.59 6.3 23.33 6.0 21.28 2.8 24.61 -0.2
Nov 25.90 1.4 25.38 1.1 29.51 0.1 27.00 3.1 23.66 0.2 26.21 0.8 24.67 2.9 22.52 5.3 23.36 6.6 21.41 2.0 24.77 0.2
Dec 25.97 1.6 25.43 0.6 29.83 1.7 27.23 2.2 23.81 1.2 26.26 0.9 24.68 3.2 22.44 4.1 23.13 5.2 21.19 0.0 25.02 1.3
2017 Jan 25.97 1.2 25.50 0.4 29.54 0.9 26.96 -0.1 24.02 1.3 26.25 0.5 24.72 2.8 22.56 4.6 23.35 3.6 21.65 1.8 25.53 4.9
Feb 26.11 1.3 25.62 2.0 29.82 0.1 26.97 1.2 24.02 0.8 26.35 0.2 24.88 3.3 22.73 4.9 23.79 4.4 21.80 2.4 25.52 4.9
Mar 26.12 1.1 25.51 1.6 29.89 -0.3 27.07 0.5 24.40 3.7 26.43 0.1 24.76 2.9 22.73 5.2 23.61 4.1 21.60 0.1 25.80 6.0
Apr 26.08 0.7 25.44 1.0 29.88 -0.7 26.98 0.1 24.26 3.2 26.43 0.2 24.77 1.6 22.70 4.1 23.12 2.8 21.82 0.7 25.48 4.2
May 25.88 1.3 25.16 -0.3 29.45 -0.5 26.64 0.0 24.01 2.9 26.17 0.8 24.88 3.6 22.25 3.8 23.10 3.8 21.32 2.0 25.01 4.0
Jun 25.88 1.3 25.39 0.8 29.47 0.1 26.23 -0.5 23.97 2.6 26.23 0.7 24.78 3.4 21.97 2.7 22.94 1.1 21.20 3.3 24.88 4.6
Jul 25.79 1.3 25.40 1.0 29.76 0.7 26.20 -0.4 23.83 2.2 26.05 0.6 24.66 3.3 21.66 0.8 22.89 1.4 21.23 2.6 23.96 2.8
Aug 25.93 1.8 25.23 0.6 30.12 3.1 26.32 -0.3 23.96 2.7 26.13 1.0 24.92 3.3 21.71 0.2 22.88 1.1 21.48 3.9 24.38 2.8
Sep 26.36 2.2 25.74 1.5 30.37 2.8 26.98 -0.7 24.29 3.2 26.68 1.8 25.18 3.2 22.53 1.1 23.43 1.8 21.90 4.3 24.56 0.6
Oct 26.46 2.4 26.22 3.1 30.58 3.7 27.24 0.4 24.34 3.1 26.61 1.5 25.24 3.5 22.53 -0.3 23.59 1.1 22.14 4.0 25.03 1.7
Nov 26.62 2.8 26.82 5.7 30.48 3.3 27.16 0.6 24.43 3.3 26.82 2.3 25.22 2.2 22.73 0.9 23.90 2.3 22.49 5.0 24.63 -0.6
Dec 26.68 2.7 26.52 4.3 30.78 3.2 27.25 0.1 24.41 2.5 26.98 2.7 25.28 2.4 22.63 0.8 23.70 2.5 22.64 6.8 24.34 -2.7
Average:
Jan-Dec16 25.73 25.26 29.61 26.82 23.54 26.16 24.23 21.87 22.79 21.12 24.26
Jan-Dec17 26.16 25.71 30.01 26.83 24.16 26.43 24.94 22.39 23.36 21.77 24.93
% Change 1.7 1.8 1.4 0.1 2.6 1.0 3.0 2.4 2.5 3.1 2.7
Monthly percent changes are calculated as month over same month previous year
Prepared by: BC Stats Source: Statistics Canada Labour Force Survey
QUEBEC N.B. N.S. P.E.I. N.L.CANADA B.C. ALBERTA SASK. MANITOBA ONTARIO
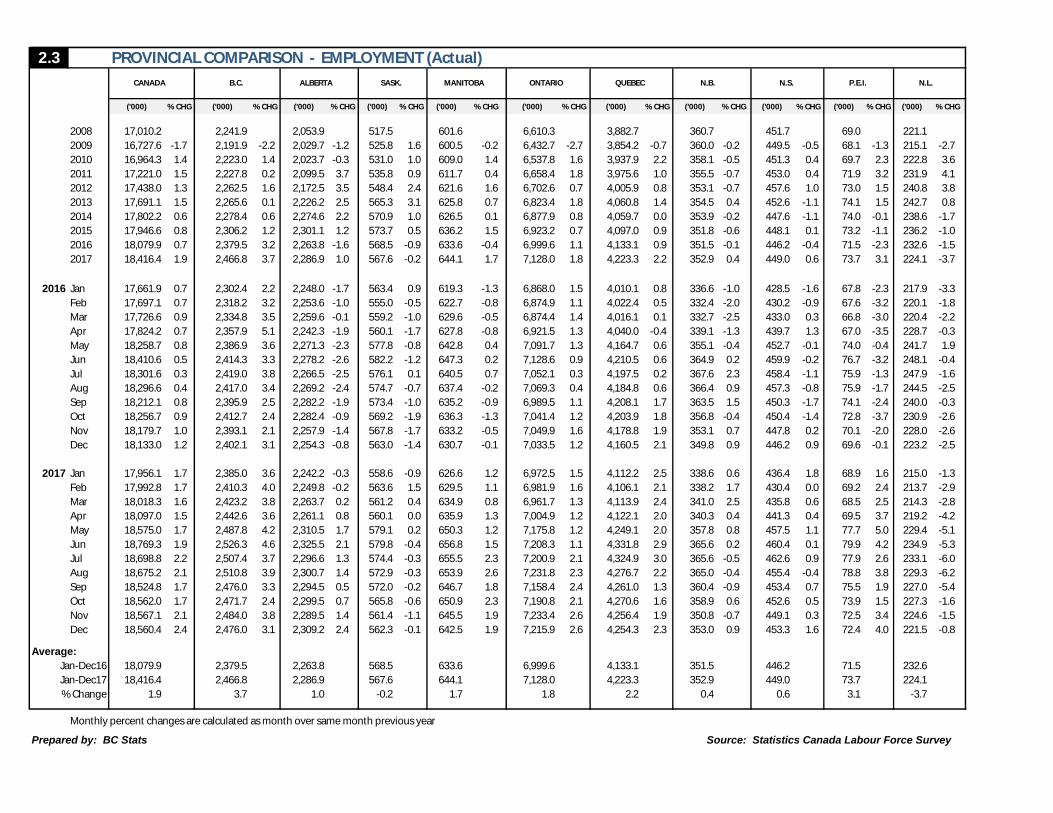
2.3 PROVINCIAL COMPARISON - EMPLOYMENT (Actual)
('000) % CHG ('000) % CHG ('000) % CHG ('000) % CHG ('000) % CHG ('000) % CHG ('000) % CHG ('000) % CHG ('000) % CHG ('000) % CHG ('000) % CHG
2008 17,010.2 2,241.9 2,053.9 517.5 601.6 6,610.3 3,882.7 360.7 451.7 69.0 221.1
2009 16,727.6 -1.7 2,191.9 -2.2 2,029.7 -1.2 525.8 1.6 600.5 -0.2 6,432.7 -2.7 3,854.2 -0.7 360.0 -0.2 449.5 -0.5 68.1 -1.3 215.1 -2.7
2010 16,964.3 1.4 2,223.0 1.4 2,023.7 -0.3 531.0 1.0 609.0 1.4 6,537.8 1.6 3,937.9 2.2 358.1 -0.5 451.3 0.4 69.7 2.3 222.8 3.6
2011 17,221.0 1.5 2,227.8 0.2 2,099.5 3.7 535.8 0.9 611.7 0.4 6,658.4 1.8 3,975.6 1.0 355.5 -0.7 453.0 0.4 71.9 3.2 231.9 4.1
2012 17,438.0 1.3 2,262.5 1.6 2,172.5 3.5 548.4 2.4 621.6 1.6 6,702.6 0.7 4,005.9 0.8 353.1 -0.7 457.6 1.0 73.0 1.5 240.8 3.8
2013 17,691.1 1.5 2,265.6 0.1 2,226.2 2.5 565.3 3.1 625.8 0.7 6,823.4 1.8 4,060.8 1.4 354.5 0.4 452.6 -1.1 74.1 1.5 242.7 0.8
2014 17,802.2 0.6 2,278.4 0.6 2,274.6 2.2 570.9 1.0 626.5 0.1 6,877.9 0.8 4,059.7 0.0 353.9 -0.2 447.6 -1.1 74.0 -0.1 238.6 -1.7
2015 17,946.6 0.8 2,306.2 1.2 2,301.1 1.2 573.7 0.5 636.2 1.5 6,923.2 0.7 4,097.0 0.9 351.8 -0.6 448.1 0.1 73.2 -1.1 236.2 -1.0
2016 18,079.9 0.7 2,379.5 3.2 2,263.8 -1.6 568.5 -0.9 633.6 -0.4 6,999.6 1.1 4,133.1 0.9 351.5 -0.1 446.2 -0.4 71.5 -2.3 232.6 -1.5
2017 18,416.4 1.9 2,466.8 3.7 2,286.9 1.0 567.6 -0.2 644.1 1.7 7,128.0 1.8 4,223.3 2.2 352.9 0.4 449.0 0.6 73.7 3.1 224.1 -3.7
2016 Jan 17,661.9 0.7 2,302.4 2.2 2,248.0 -1.7 563.4 0.9 619.3 -1.3 6,868.0 1.5 4,010.1 0.8 336.6 -1.0 428.5 -1.6 67.8 -2.3 217.9 -3.3
Feb 17,697.1 0.7 2,318.2 3.2 2,253.6 -1.0 555.0 -0.5 622.7 -0.8 6,874.9 1.1 4,022.4 0.5 332.4 -2.0 430.2 -0.9 67.6 -3.2 220.1 -1.8
Mar 17,726.6 0.9 2,334.8 3.5 2,259.6 -0.1 559.2 -1.0 629.6 -0.5 6,874.4 1.4 4,016.1 0.1 332.7 -2.5 433.0 0.3 66.8 -3.0 220.4 -2.2
Apr 17,824.2 0.7 2,357.9 5.1 2,242.3 -1.9 560.1 -1.7 627.8 -0.8 6,921.5 1.3 4,040.0 -0.4 339.1 -1.3 439.7 1.3 67.0 -3.5 228.7 -0.3
May 18,258.7 0.8 2,386.9 3.6 2,271.3 -2.3 577.8 -0.8 642.8 0.4 7,091.7 1.3 4,164.7 0.6 355.1 -0.4 452.7 -0.1 74.0 -0.4 241.7 1.9
Jun 18,410.6 0.5 2,414.3 3.3 2,278.2 -2.6 582.2 -1.2 647.3 0.2 7,128.6 0.9 4,210.5 0.6 364.9 0.2 459.9 -0.2 76.7 -3.2 248.1 -0.4
Jul 18,301.6 0.3 2,419.0 3.8 2,266.5 -2.5 576.1 0.1 640.5 0.7 7,052.1 0.3 4,197.5 0.2 367.6 2.3 458.4 -1.1 75.9 -1.3 247.9 -1.6
Aug 18,296.6 0.4 2,417.0 3.4 2,269.2 -2.4 574.7 -0.7 637.4 -0.2 7,069.3 0.4 4,184.8 0.6 366.4 0.9 457.3 -0.8 75.9 -1.7 244.5 -2.5
Sep 18,212.1 0.8 2,395.9 2.5 2,282.2 -1.9 573.4 -1.0 635.2 -0.9 6,989.5 1.1 4,208.1 1.7 363.5 1.5 450.3 -1.7 74.1 -2.4 240.0 -0.3
Oct 18,256.7 0.9 2,412.7 2.4 2,282.4 -0.9 569.2 -1.9 636.3 -1.3 7,041.4 1.2 4,203.9 1.8 356.8 -0.4 450.4 -1.4 72.8 -3.7 230.9 -2.6
Nov 18,179.7 1.0 2,393.1 2.1 2,257.9 -1.4 567.8 -1.7 633.2 -0.5 7,049.9 1.6 4,178.8 1.9 353.1 0.7 447.8 0.2 70.1 -2.0 228.0 -2.6
Dec 18,133.0 1.2 2,402.1 3.1 2,254.3 -0.8 563.0 -1.4 630.7 -0.1 7,033.5 1.2 4,160.5 2.1 349.8 0.9 446.2 0.9 69.6 -0.1 223.2 -2.5
2017 Jan 17,956.1 1.7 2,385.0 3.6 2,242.2 -0.3 558.6 -0.9 626.6 1.2 6,972.5 1.5 4,112.2 2.5 338.6 0.6 436.4 1.8 68.9 1.6 215.0 -1.3
Feb 17,992.8 1.7 2,410.3 4.0 2,249.8 -0.2 563.6 1.5 629.5 1.1 6,981.9 1.6 4,106.1 2.1 338.2 1.7 430.4 0.0 69.2 2.4 213.7 -2.9
Mar 18,018.3 1.6 2,423.2 3.8 2,263.7 0.2 561.2 0.4 634.9 0.8 6,961.7 1.3 4,113.9 2.4 341.0 2.5 435.8 0.6 68.5 2.5 214.3 -2.8
Apr 18,097.0 1.5 2,442.6 3.6 2,261.1 0.8 560.1 0.0 635.9 1.3 7,004.9 1.2 4,122.1 2.0 340.3 0.4 441.3 0.4 69.5 3.7 219.2 -4.2
May 18,575.0 1.7 2,487.8 4.2 2,310.5 1.7 579.1 0.2 650.3 1.2 7,175.8 1.2 4,249.1 2.0 357.8 0.8 457.5 1.1 77.7 5.0 229.4 -5.1
Jun 18,769.3 1.9 2,526.3 4.6 2,325.5 2.1 579.8 -0.4 656.8 1.5 7,208.3 1.1 4,331.8 2.9 365.6 0.2 460.4 0.1 79.9 4.2 234.9 -5.3
Jul 18,698.8 2.2 2,507.4 3.7 2,296.6 1.3 574.4 -0.3 655.5 2.3 7,200.9 2.1 4,324.9 3.0 365.6 -0.5 462.6 0.9 77.9 2.6 233.1 -6.0
Aug 18,675.2 2.1 2,510.8 3.9 2,300.7 1.4 572.9 -0.3 653.9 2.6 7,231.8 2.3 4,276.7 2.2 365.0 -0.4 455.4 -0.4 78.8 3.8 229.3 -6.2
Sep 18,524.8 1.7 2,476.0 3.3 2,294.5 0.5 572.0 -0.2 646.7 1.8 7,158.4 2.4 4,261.0 1.3 360.4 -0.9 453.4 0.7 75.5 1.9 227.0 -5.4
Oct 18,562.0 1.7 2,471.7 2.4 2,299.5 0.7 565.8 -0.6 650.9 2.3 7,190.8 2.1 4,270.6 1.6 358.9 0.6 452.6 0.5 73.9 1.5 227.3 -1.6
Nov 18,567.1 2.1 2,484.0 3.8 2,289.5 1.4 561.4 -1.1 645.5 1.9 7,233.4 2.6 4,256.4 1.9 350.8 -0.7 449.1 0.3 72.5 3.4 224.6 -1.5
Dec 18,560.4 2.4 2,476.0 3.1 2,309.2 2.4 562.3 -0.1 642.5 1.9 7,215.9 2.6 4,254.3 2.3 353.0 0.9 453.3 1.6 72.4 4.0 221.5 -0.8
Average:
Jan-Dec16 18,079.9 2,379.5 2,263.8 568.5 633.6 6,999.6 4,133.1 351.5 446.2 71.5 232.6
Jan-Dec17 18,416.4 2,466.8 2,286.9 567.6 644.1 7,128.0 4,223.3 352.9 449.0 73.7 224.1
% Change 1.9 3.7 1.0 -0.2 1.7 1.8 2.2 0.4 0.6 3.1 -3.7
Monthly percent changes are calculated as month over same month previous year
Prepared by: BC Stats Source: Statistics Canada Labour Force Survey
QUEBEC N.B. N.S. P.E.I. N.L.CANADA B.C. ALBERTA SASK. MANITOBA ONTARIO
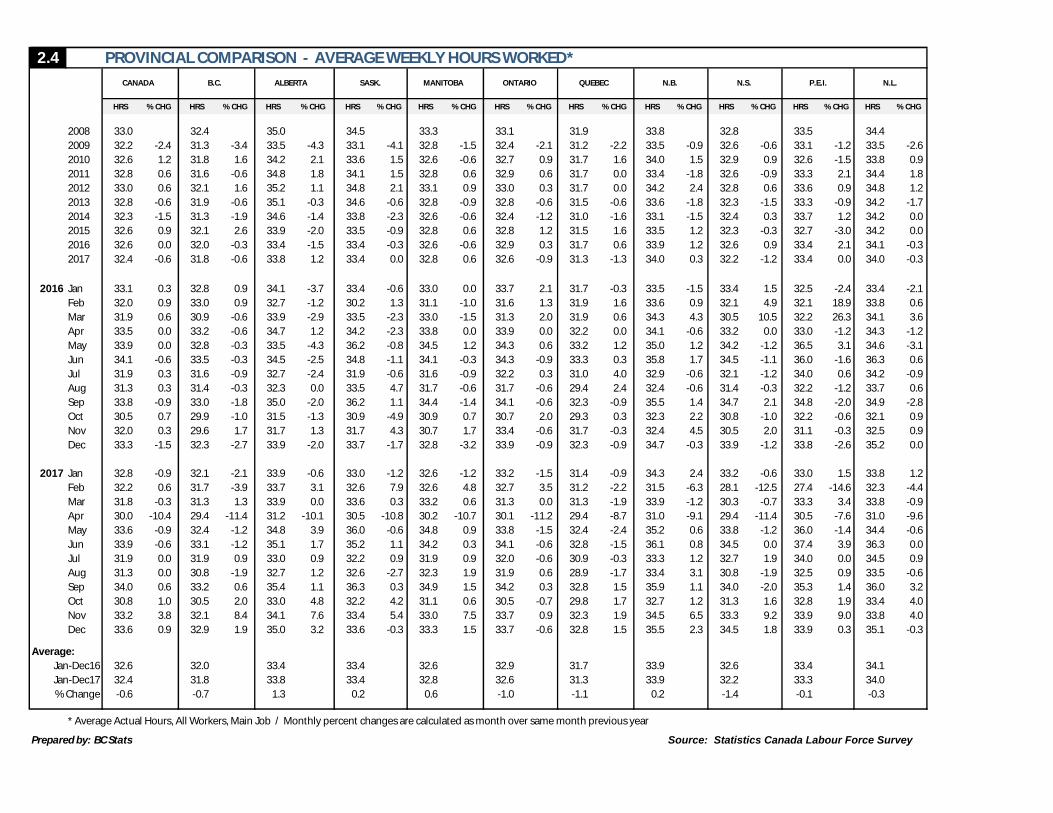
2.4 PROVINCIAL COMPARISON - AVERAGE WEEKLY HOURS WORKED*
HRS % CHG HRS % CHG HRS % CHG HRS % CHG HRS % CHG HRS % CHG HRS % CHG HRS % CHG HRS % CHG HRS % CHG HRS % CHG
2008 33.0 32.4 35.0 34.5 33.3 33.1 31.9 33.8 32.8 33.5 34.4
2009 32.2 -2.4 31.3 -3.4 33.5 -4.3 33.1 -4.1 32.8 -1.5 32.4 -2.1 31.2 -2.2 33.5 -0.9 32.6 -0.6 33.1 -1.2 33.5 -2.6
2010 32.6 1.2 31.8 1.6 34.2 2.1 33.6 1.5 32.6 -0.6 32.7 0.9 31.7 1.6 34.0 1.5 32.9 0.9 32.6 -1.5 33.8 0.9
2011 32.8 0.6 31.6 -0.6 34.8 1.8 34.1 1.5 32.8 0.6 32.9 0.6 31.7 0.0 33.4 -1.8 32.6 -0.9 33.3 2.1 34.4 1.8
2012 33.0 0.6 32.1 1.6 35.2 1.1 34.8 2.1 33.1 0.9 33.0 0.3 31.7 0.0 34.2 2.4 32.8 0.6 33.6 0.9 34.8 1.2
2013 32.8 -0.6 31.9 -0.6 35.1 -0.3 34.6 -0.6 32.8 -0.9 32.8 -0.6 31.5 -0.6 33.6 -1.8 32.3 -1.5 33.3 -0.9 34.2 -1.7
2014 32.3 -1.5 31.3 -1.9 34.6 -1.4 33.8 -2.3 32.6 -0.6 32.4 -1.2 31.0 -1.6 33.1 -1.5 32.4 0.3 33.7 1.2 34.2 0.0
2015 32.6 0.9 32.1 2.6 33.9 -2.0 33.5 -0.9 32.8 0.6 32.8 1.2 31.5 1.6 33.5 1.2 32.3 -0.3 32.7 -3.0 34.2 0.0
2016 32.6 0.0 32.0 -0.3 33.4 -1.5 33.4 -0.3 32.6 -0.6 32.9 0.3 31.7 0.6 33.9 1.2 32.6 0.9 33.4 2.1 34.1 -0.3
2017 32.4 -0.6 31.8 -0.6 33.8 1.2 33.4 0.0 32.8 0.6 32.6 -0.9 31.3 -1.3 34.0 0.3 32.2 -1.2 33.4 0.0 34.0 -0.3
2016 Jan 33.1 0.3 32.8 0.9 34.1 -3.7 33.4 -0.6 33.0 0.0 33.7 2.1 31.7 -0.3 33.5 -1.5 33.4 1.5 32.5 -2.4 33.4 -2.1
Feb 32.0 0.9 33.0 0.9 32.7 -1.2 30.2 1.3 31.1 -1.0 31.6 1.3 31.9 1.6 33.6 0.9 32.1 4.9 32.1 18.9 33.8 0.6
Mar 31.9 0.6 30.9 -0.6 33.9 -2.9 33.5 -2.3 33.0 -1.5 31.3 2.0 31.9 0.6 34.3 4.3 30.5 10.5 32.2 26.3 34.1 3.6
Apr 33.5 0.0 33.2 -0.6 34.7 1.2 34.2 -2.3 33.8 0.0 33.9 0.0 32.2 0.0 34.1 -0.6 33.2 0.0 33.0 -1.2 34.3 -1.2
May 33.9 0.0 32.8 -0.3 33.5 -4.3 36.2 -0.8 34.5 1.2 34.3 0.6 33.2 1.2 35.0 1.2 34.2 -1.2 36.5 3.1 34.6 -3.1
Jun 34.1 -0.6 33.5 -0.3 34.5 -2.5 34.8 -1.1 34.1 -0.3 34.3 -0.9 33.3 0.3 35.8 1.7 34.5 -1.1 36.0 -1.6 36.3 0.6
Jul 31.9 0.3 31.6 -0.9 32.7 -2.4 31.9 -0.6 31.6 -0.9 32.2 0.3 31.0 4.0 32.9 -0.6 32.1 -1.2 34.0 0.6 34.2 -0.9
Aug 31.3 0.3 31.4 -0.3 32.3 0.0 33.5 4.7 31.7 -0.6 31.7 -0.6 29.4 2.4 32.4 -0.6 31.4 -0.3 32.2 -1.2 33.7 0.6
Sep 33.8 -0.9 33.0 -1.8 35.0 -2.0 36.2 1.1 34.4 -1.4 34.1 -0.6 32.3 -0.9 35.5 1.4 34.7 2.1 34.8 -2.0 34.9 -2.8
Oct 30.5 0.7 29.9 -1.0 31.5 -1.3 30.9 -4.9 30.9 0.7 30.7 2.0 29.3 0.3 32.3 2.2 30.8 -1.0 32.2 -0.6 32.1 0.9
Nov 32.0 0.3 29.6 1.7 31.7 1.3 31.7 4.3 30.7 1.7 33.4 -0.6 31.7 -0.3 32.4 4.5 30.5 2.0 31.1 -0.3 32.5 0.9
Dec 33.3 -1.5 32.3 -2.7 33.9 -2.0 33.7 -1.7 32.8 -3.2 33.9 -0.9 32.3 -0.9 34.7 -0.3 33.9 -1.2 33.8 -2.6 35.2 0.0
2017 Jan 32.8 -0.9 32.1 -2.1 33.9 -0.6 33.0 -1.2 32.6 -1.2 33.2 -1.5 31.4 -0.9 34.3 2.4 33.2 -0.6 33.0 1.5 33.8 1.2
Feb 32.2 0.6 31.7 -3.9 33.7 3.1 32.6 7.9 32.6 4.8 32.7 3.5 31.2 -2.2 31.5 -6.3 28.1 -12.5 27.4 -14.6 32.3 -4.4
Mar 31.8 -0.3 31.3 1.3 33.9 0.0 33.6 0.3 33.2 0.6 31.3 0.0 31.3 -1.9 33.9 -1.2 30.3 -0.7 33.3 3.4 33.8 -0.9
Apr 30.0 -10.4 29.4 -11.4 31.2 -10.1 30.5 -10.8 30.2 -10.7 30.1 -11.2 29.4 -8.7 31.0 -9.1 29.4 -11.4 30.5 -7.6 31.0 -9.6
May 33.6 -0.9 32.4 -1.2 34.8 3.9 36.0 -0.6 34.8 0.9 33.8 -1.5 32.4 -2.4 35.2 0.6 33.8 -1.2 36.0 -1.4 34.4 -0.6
Jun 33.9 -0.6 33.1 -1.2 35.1 1.7 35.2 1.1 34.2 0.3 34.1 -0.6 32.8 -1.5 36.1 0.8 34.5 0.0 37.4 3.9 36.3 0.0
Jul 31.9 0.0 31.9 0.9 33.0 0.9 32.2 0.9 31.9 0.9 32.0 -0.6 30.9 -0.3 33.3 1.2 32.7 1.9 34.0 0.0 34.5 0.9
Aug 31.3 0.0 30.8 -1.9 32.7 1.2 32.6 -2.7 32.3 1.9 31.9 0.6 28.9 -1.7 33.4 3.1 30.8 -1.9 32.5 0.9 33.5 -0.6
Sep 34.0 0.6 33.2 0.6 35.4 1.1 36.3 0.3 34.9 1.5 34.2 0.3 32.8 1.5 35.9 1.1 34.0 -2.0 35.3 1.4 36.0 3.2
Oct 30.8 1.0 30.5 2.0 33.0 4.8 32.2 4.2 31.1 0.6 30.5 -0.7 29.8 1.7 32.7 1.2 31.3 1.6 32.8 1.9 33.4 4.0
Nov 33.2 3.8 32.1 8.4 34.1 7.6 33.4 5.4 33.0 7.5 33.7 0.9 32.3 1.9 34.5 6.5 33.3 9.2 33.9 9.0 33.8 4.0
Dec 33.6 0.9 32.9 1.9 35.0 3.2 33.6 -0.3 33.3 1.5 33.7 -0.6 32.8 1.5 35.5 2.3 34.5 1.8 33.9 0.3 35.1 -0.3
Average:
Jan-Dec16 32.6 32.0 33.4 33.4 32.6 32.9 31.7 33.9 32.6 33.4 34.1
Jan-Dec17 32.4 31.8 33.8 33.4 32.8 32.6 31.3 33.9 32.2 33.3 34.0
% Change -0.6 -0.7 1.3 0.2 0.6 -1.0 -1.1 0.2 -1.4 -0.1 -0.3
* Average Actual Hours, All Workers, Main Job / Monthly percent changes are calculated as month over same month previous year
Prepared by: BC Stats Source: Statistics Canada Labour Force Survey
QUEBEC N.B. N.S. P.E.I. N.L.CANADA B.C. ALBERTA SASK. MANITOBA ONTARIO
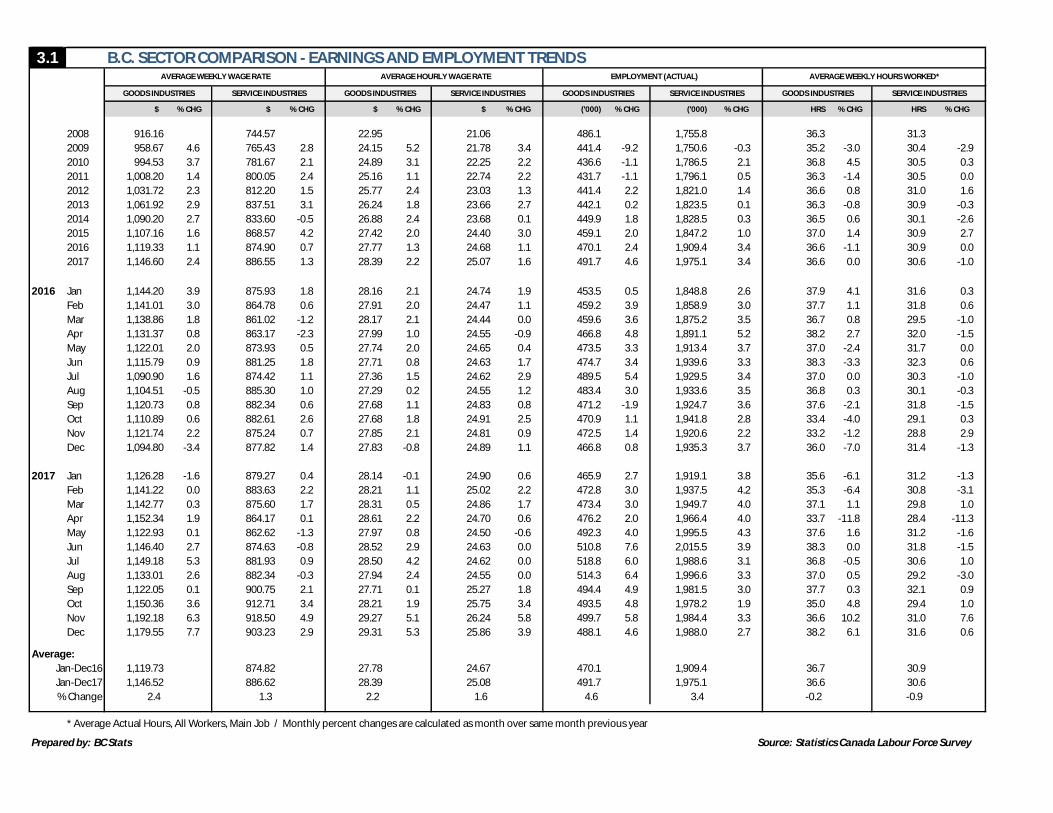
3.1 B.C. SECTOR COMPARISON - EARNINGS AND EMPLOYMENT TRENDS
$ % CHG $ % CHG $ % CHG $ % CHG ('000) % CHG ('000) % CHG HRS % CHG HRS % CHG
2008 916.16 744.57 22.95 21.06 486.1 1,755.8 36.3 31.3
2009 958.67 4.6 765.43 2.8 24.15 5.2 21.78 3.4 441.4 -9.2 1,750.6 -0.3 35.2 -3.0 30.4 -2.9
2010 994.53 3.7 781.67 2.1 24.89 3.1 22.25 2.2 436.6 -1.1 1,786.5 2.1 36.8 4.5 30.5 0.3
2011 1,008.20 1.4 800.05 2.4 25.16 1.1 22.74 2.2 431.7 -1.1 1,796.1 0.5 36.3 -1.4 30.5 0.0
2012 1,031.72 2.3 812.20 1.5 25.77 2.4 23.03 1.3 441.4 2.2 1,821.0 1.4 36.6 0.8 31.0 1.6
2013 1,061.92 2.9 837.51 3.1 26.24 1.8 23.66 2.7 442.1 0.2 1,823.5 0.1 36.3 -0.8 30.9 -0.3
2014 1,090.20 2.7 833.60 -0.5 26.88 2.4 23.68 0.1 449.9 1.8 1,828.5 0.3 36.5 0.6 30.1 -2.6
2015 1,107.16 1.6 868.57 4.2 27.42 2.0 24.40 3.0 459.1 2.0 1,847.2 1.0 37.0 1.4 30.9 2.7
2016 1,119.33 1.1 874.90 0.7 27.77 1.3 24.68 1.1 470.1 2.4 1,909.4 3.4 36.6 -1.1 30.9 0.0
2017 1,146.60 2.4 886.55 1.3 28.39 2.2 25.07 1.6 491.7 4.6 1,975.1 3.4 36.6 0.0 30.6 -1.0
2016 Jan 1,144.20 3.9 875.93 1.8 28.16 2.1 24.74 1.9 453.5 0.5 1,848.8 2.6 37.9 4.1 31.6 0.3
Feb 1,141.01 3.0 864.78 0.6 27.91 2.0 24.47 1.1 459.2 3.9 1,858.9 3.0 37.7 1.1 31.8 0.6
Mar 1,138.86 1.8 861.02 -1.2 28.17 2.1 24.44 0.0 459.6 3.6 1,875.2 3.5 36.7 0.8 29.5 -1.0
Apr 1,131.37 0.8 863.17 -2.3 27.99 1.0 24.55 -0.9 466.8 4.8 1,891.1 5.2 38.2 2.7 32.0 -1.5
May 1,122.01 2.0 873.93 0.5 27.74 2.0 24.65 0.4 473.5 3.3 1,913.4 3.7 37.0 -2.4 31.7 0.0
Jun 1,115.79 0.9 881.25 1.8 27.71 0.8 24.63 1.7 474.7 3.4 1,939.6 3.3 38.3 -3.3 32.3 0.6
Jul 1,090.90 1.6 874.42 1.1 27.36 1.5 24.62 2.9 489.5 5.4 1,929.5 3.4 37.0 0.0 30.3 -1.0
Aug 1,104.51 -0.5 885.30 1.0 27.29 0.2 24.55 1.2 483.4 3.0 1,933.6 3.5 36.8 0.3 30.1 -0.3
Sep 1,120.73 0.8 882.34 0.6 27.68 1.1 24.83 0.8 471.2 -1.9 1,924.7 3.6 37.6 -2.1 31.8 -1.5
Oct 1,110.89 0.6 882.61 2.6 27.68 1.8 24.91 2.5 470.9 1.1 1,941.8 2.8 33.4 -4.0 29.1 0.3
Nov 1,121.74 2.2 875.24 0.7 27.85 2.1 24.81 0.9 472.5 1.4 1,920.6 2.2 33.2 -1.2 28.8 2.9
Dec 1,094.80 -3.4 877.82 1.4 27.83 -0.8 24.89 1.1 466.8 0.8 1,935.3 3.7 36.0 -7.0 31.4 -1.3
2017 Jan 1,126.28 -1.6 879.27 0.4 28.14 -0.1 24.90 0.6 465.9 2.7 1,919.1 3.8 35.6 -6.1 31.2 -1.3
Feb 1,141.22 0.0 883.63 2.2 28.21 1.1 25.02 2.2 472.8 3.0 1,937.5 4.2 35.3 -6.4 30.8 -3.1
Mar 1,142.77 0.3 875.60 1.7 28.31 0.5 24.86 1.7 473.4 3.0 1,949.7 4.0 37.1 1.1 29.8 1.0
Apr 1,152.34 1.9 864.17 0.1 28.61 2.2 24.70 0.6 476.2 2.0 1,966.4 4.0 33.7 -11.8 28.4 -11.3
May 1,122.93 0.1 862.62 -1.3 27.97 0.8 24.50 -0.6 492.3 4.0 1,995.5 4.3 37.6 1.6 31.2 -1.6
Jun 1,146.40 2.7 874.63 -0.8 28.52 2.9 24.63 0.0 510.8 7.6 2,015.5 3.9 38.3 0.0 31.8 -1.5
Jul 1,149.18 5.3 881.93 0.9 28.50 4.2 24.62 0.0 518.8 6.0 1,988.6 3.1 36.8 -0.5 30.6 1.0
Aug 1,133.01 2.6 882.34 -0.3 27.94 2.4 24.55 0.0 514.3 6.4 1,996.6 3.3 37.0 0.5 29.2 -3.0
Sep 1,122.05 0.1 900.75 2.1 27.71 0.1 25.27 1.8 494.4 4.9 1,981.5 3.0 37.7 0.3 32.1 0.9
Oct 1,150.36 3.6 912.71 3.4 28.21 1.9 25.75 3.4 493.5 4.8 1,978.2 1.9 35.0 4.8 29.4 1.0
Nov 1,192.18 6.3 918.50 4.9 29.27 5.1 26.24 5.8 499.7 5.8 1,984.4 3.3 36.6 10.2 31.0 7.6
Dec 1,179.55 7.7 903.23 2.9 29.31 5.3 25.86 3.9 488.1 4.6 1,988.0 2.7 38.2 6.1 31.6 0.6
Average:
Jan-Dec16 1,119.73 874.82 27.78 24.67 470.1 1,909.4 36.7 30.9
Jan-Dec17 1,146.52 886.62 28.39 25.08 491.7 1,975.1 36.6 30.6
% Change 2.4 1.3 2.2 1.6 4.6 3.4 -0.2 -0.9
* Average Actual Hours, All Workers, Main Job / Monthly percent changes are calculated as month over same month previous year
Prepared by: BC Stats Source: Statistics Canada Labour Force Survey
GOODS INDUSTRIES SERVICE INDUSTRIES
AVERAGE WEEKLY WAGE RATE AVERAGE HOURLY WAGE RATE EMPLOYMENT (ACTUAL) AVERAGE WEEKLY HOURS WORKED*
GOODS INDUSTRIES SERVICE INDUSTRIES GOODS INDUSTRIES SERVICE INDUSTRIES GOODS INDUSTRIES SERVICE INDUSTRIES
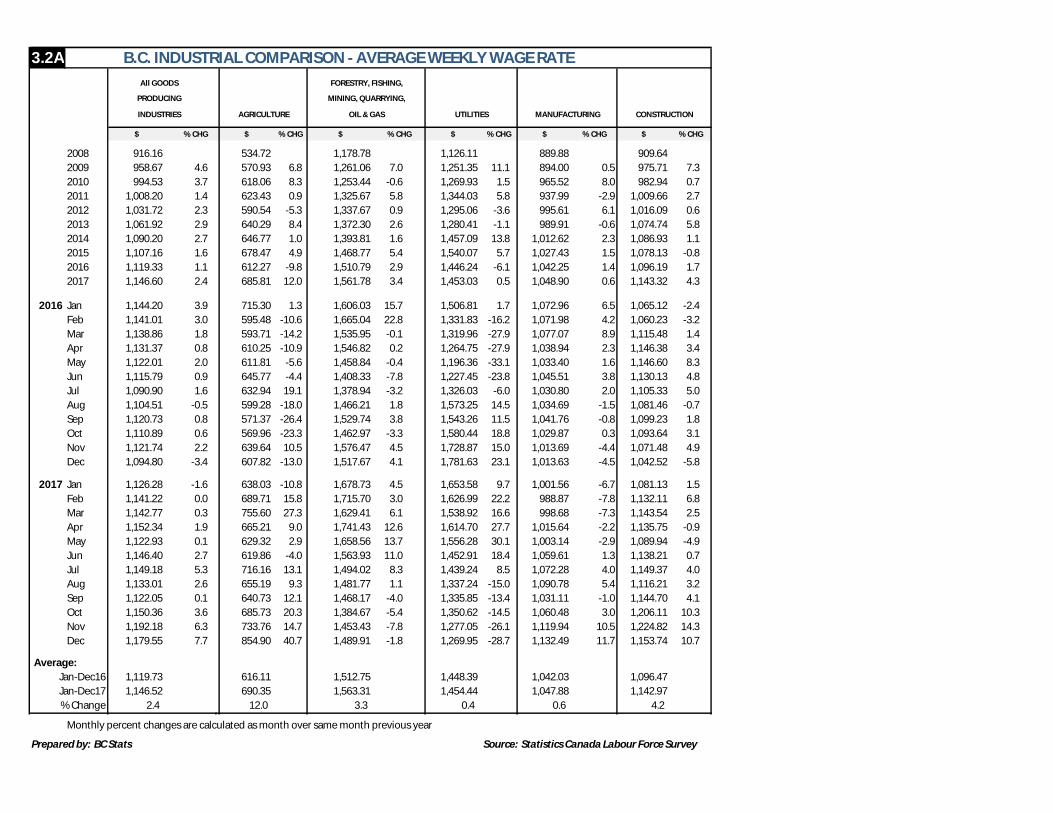
3.2A B.C. INDUSTRIAL COMPARISON - AVERAGE WEEKLY WAGE RATE
$ % CHG $ % CHG $ % CHG $ % CHG $ % CHG $ % CHG
2008 916.16 534.72 1,178.78 1,126.11 889.88 909.64
2009 958.67 4.6 570.93 6.8 1,261.06 7.0 1,251.35 11.1 894.00 0.5 975.71 7.3
2010 994.53 3.7 618.06 8.3 1,253.44 -0.6 1,269.93 1.5 965.52 8.0 982.94 0.7
2011 1,008.20 1.4 623.43 0.9 1,325.67 5.8 1,344.03 5.8 937.99 -2.9 1,009.66 2.7
2012 1,031.72 2.3 590.54 -5.3 1,337.67 0.9 1,295.06 -3.6 995.61 6.1 1,016.09 0.6
2013 1,061.92 2.9 640.29 8.4 1,372.30 2.6 1,280.41 -1.1 989.91 -0.6 1,074.74 5.8
2014 1,090.20 2.7 646.77 1.0 1,393.81 1.6 1,457.09 13.8 1,012.62 2.3 1,086.93 1.1
2015 1,107.16 1.6 678.47 4.9 1,468.77 5.4 1,540.07 5.7 1,027.43 1.5 1,078.13 -0.8
2016 1,119.33 1.1 612.27 -9.8 1,510.79 2.9 1,446.24 -6.1 1,042.25 1.4 1,096.19 1.7
2017 1,146.60 2.4 685.81 12.0 1,561.78 3.4 1,453.03 0.5 1,048.90 0.6 1,143.32 4.3
2016 Jan 1,144.20 3.9 715.30 1.3 1,606.03 15.7 1,506.81 1.7 1,072.96 6.5 1,065.12 -2.4
Feb 1,141.01 3.0 595.48 -10.6 1,665.04 22.8 1,331.83 -16.2 1,071.98 4.2 1,060.23 -3.2
Mar 1,138.86 1.8 593.71 -14.2 1,535.95 -0.1 1,319.96 -27.9 1,077.07 8.9 1,115.48 1.4
Apr 1,131.37 0.8 610.25 -10.9 1,546.82 0.2 1,264.75 -27.9 1,038.94 2.3 1,146.38 3.4
May 1,122.01 2.0 611.81 -5.6 1,458.84 -0.4 1,196.36 -33.1 1,033.40 1.6 1,146.60 8.3
Jun 1,115.79 0.9 645.77 -4.4 1,408.33 -7.8 1,227.45 -23.8 1,045.51 3.8 1,130.13 4.8
Jul 1,090.90 1.6 632.94 19.1 1,378.94 -3.2 1,326.03 -6.0 1,030.80 2.0 1,105.33 5.0
Aug 1,104.51 -0.5 599.28 -18.0 1,466.21 1.8 1,573.25 14.5 1,034.69 -1.5 1,081.46 -0.7
Sep 1,120.73 0.8 571.37 -26.4 1,529.74 3.8 1,543.26 11.5 1,041.76 -0.8 1,099.23 1.8
Oct 1,110.89 0.6 569.96 -23.3 1,462.97 -3.3 1,580.44 18.8 1,029.87 0.3 1,093.64 3.1
Nov 1,121.74 2.2 639.64 10.5 1,576.47 4.5 1,728.87 15.0 1,013.69 -4.4 1,071.48 4.9
Dec 1,094.80 -3.4 607.82 -13.0 1,517.67 4.1 1,781.63 23.1 1,013.63 -4.5 1,042.52 -5.8
2017 Jan 1,126.28 -1.6 638.03 -10.8 1,678.73 4.5 1,653.58 9.7 1,001.56 -6.7 1,081.13 1.5
Feb 1,141.22 0.0 689.71 15.8 1,715.70 3.0 1,626.99 22.2 988.87 -7.8 1,132.11 6.8
Mar 1,142.77 0.3 755.60 27.3 1,629.41 6.1 1,538.92 16.6 998.68 -7.3 1,143.54 2.5
Apr 1,152.34 1.9 665.21 9.0 1,741.43 12.6 1,614.70 27.7 1,015.64 -2.2 1,135.75 -0.9
May 1,122.93 0.1 629.32 2.9 1,658.56 13.7 1,556.28 30.1 1,003.14 -2.9 1,089.94 -4.9
Jun 1,146.40 2.7 619.86 -4.0 1,563.93 11.0 1,452.91 18.4 1,059.61 1.3 1,138.21 0.7
Jul 1,149.18 5.3 716.16 13.1 1,494.02 8.3 1,439.24 8.5 1,072.28 4.0 1,149.37 4.0
Aug 1,133.01 2.6 655.19 9.3 1,481.77 1.1 1,337.24 -15.0 1,090.78 5.4 1,116.21 3.2
Sep 1,122.05 0.1 640.73 12.1 1,468.17 -4.0 1,335.85 -13.4 1,031.11 -1.0 1,144.70 4.1
Oct 1,150.36 3.6 685.73 20.3 1,384.67 -5.4 1,350.62 -14.5 1,060.48 3.0 1,206.11 10.3
Nov 1,192.18 6.3 733.76 14.7 1,453.43 -7.8 1,277.05 -26.1 1,119.94 10.5 1,224.82 14.3
Dec 1,179.55 7.7 854.90 40.7 1,489.91 -1.8 1,269.95 -28.7 1,132.49 11.7 1,153.74 10.7
Average:
Jan-Dec16 1,119.73 616.11 1,512.75 1,448.39 1,042.03 1,096.47
Jan-Dec17 1,146.52 690.35 1,563.31 1,454.44 1,047.88 1,142.97
% Change 2.4 12.0 3.3 0.4 0.6 4.2
Monthly percent changes are calculated as month over same month previous year
Prepared by: BC Stats Source: Statistics Canada Labour Force Survey
INDUSTRIES AGRICULTURE OIL & GAS UTILITIES MANUFACTURING CONSTRUCTION
All GOODS FORESTRY, FISHING,
PRODUCING MINING, QUARRYING,
3.2B B.C. INDUSTRIAL COMPARISON - AVERAGE WEEKLY WAGE RATE
$ $ $ $ $ $ $ $ $ $
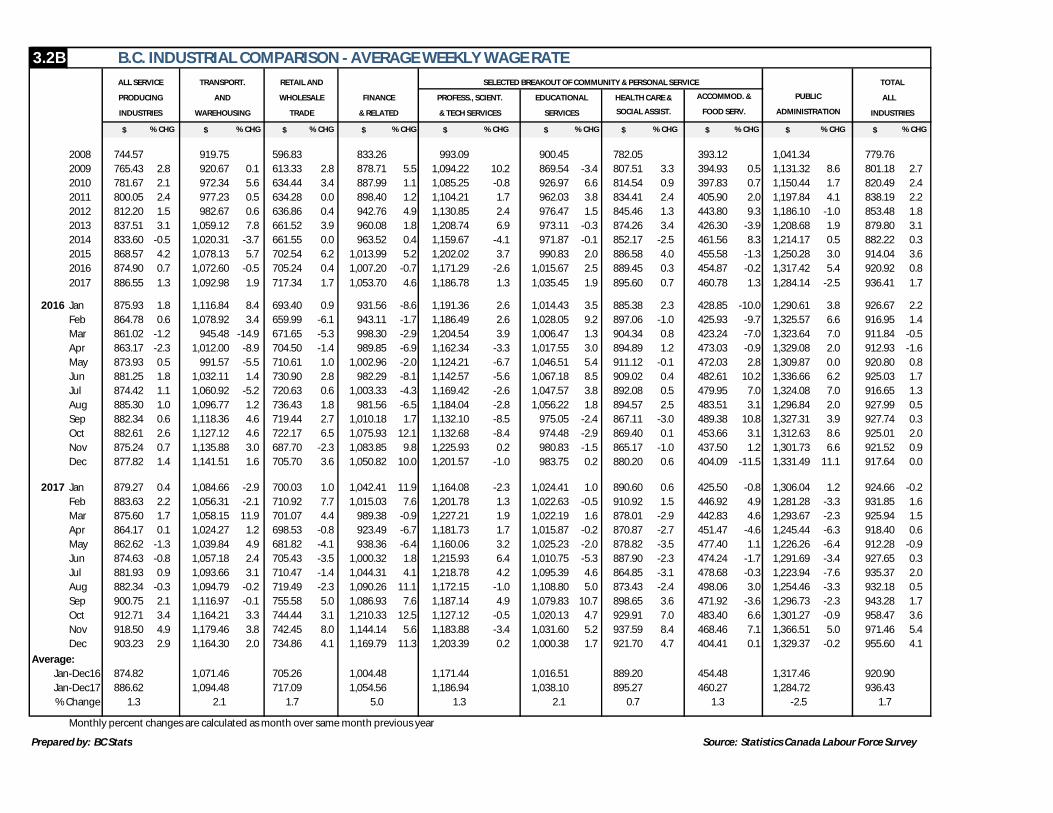
2008 744.57 919.75 596.83 833.26 993.09 900.45 782.05 393.12 1,041.34 779.76
2009 765.43 2.8 920.67 0.1 613.33 2.8 878.71 5.5 1,094.22 10.2 869.54 -3.4 807.51 3.3 394.93 0.5 1,131.32 8.6 801.18 2.7
2010 781.67 2.1 972.34 5.6 634.44 3.4 887.99 1.1 1,085.25 -0.8 926.97 6.6 814.54 0.9 397.83 0.7 1,150.44 1.7 820.49 2.4
2011 800.05 2.4 977.23 0.5 634.28 0.0 898.40 1.2 1,104.21 1.7 962.03 3.8 834.41 2.4 405.90 2.0 1,197.84 4.1 838.19 2.2
2012 812.20 1.5 982.67 0.6 636.86 0.4 942.76 4.9 1,130.85 2.4 976.47 1.5 845.46 1.3 443.80 9.3 1,186.10 -1.0 853.48 1.8
2013 837.51 3.1 1,059.12 7.8 661.52 3.9 960.08 1.8 1,208.74 6.9 973.11 -0.3 874.26 3.4 426.30 -3.9 1,208.68 1.9 879.80 3.1
2014 833.60 -0.5 1,020.31 -3.7 661.55 0.0 963.52 0.4 1,159.67 -4.1 971.87 -0.1 852.17 -2.5 461.56 8.3 1,214.17 0.5 882.22 0.3
2015 868.57 4.2 1,078.13 5.7 702.54 6.2 1,013.99 5.2 1,202.02 3.7 990.83 2.0 886.58 4.0 455.58 -1.3 1,250.28 3.0 914.04 3.6
2016 874.90 0.7 1,072.60 -0.5 705.24 0.4 1,007.20 -0.7 1,171.29 -2.6 1,015.67 2.5 889.45 0.3 454.87 -0.2 1,317.42 5.4 920.92 0.8
2017 886.55 1.3 1,092.98 1.9 717.34 1.7 1,053.70 4.6 1,186.78 1.3 1,035.45 1.9 895.60 0.7 460.78 1.3 1,284.14 -2.5 936.41 1.7
2016 Jan 875.93 1.8 1,116.84 8.4 693.40 0.9 931.56 -8.6 1,191.36 2.6 1,014.43 3.5 885.38 2.3 428.85 -10.0 1,290.61 3.8 926.67 2.2
Feb 864.78 0.6 1,078.92 3.4 659.99 -6.1 943.11 -1.7 1,186.49 2.6 1,028.05 9.2 897.06 -1.0 425.93 -9.7 1,325.57 6.6 916.95 1.4
Mar 861.02 -1.2 945.48 -14.9 671.65 -5.3 998.30 -2.9 1,204.54 3.9 1,006.47 1.3 904.34 0.8 423.24 -7.0 1,323.64 7.0 911.84 -0.5
Apr 863.17 -2.3 1,012.00 -8.9 704.50 -1.4 989.85 -6.9 1,162.34 -3.3 1,017.55 3.0 894.89 1.2 473.03 -0.9 1,329.08 2.0 912.93 -1.6
May 873.93 0.5 991.57 -5.5 710.61 1.0 1,002.96 -2.0 1,124.21 -6.7 1,046.51 5.4 911.12 -0.1 472.03 2.8 1,309.87 0.0 920.80 0.8
Jun 881.25 1.8 1,032.11 1.4 730.90 2.8 982.29 -8.1 1,142.57 -5.6 1,067.18 8.5 909.02 0.4 482.61 10.2 1,336.66 6.2 925.03 1.7
Jul 874.42 1.1 1,060.92 -5.2 720.63 0.6 1,003.33 -4.3 1,169.42 -2.6 1,047.57 3.8 892.08 0.5 479.95 7.0 1,324.08 7.0 916.65 1.3
Aug 885.30 1.0 1,096.77 1.2 736.43 1.8 981.56 -6.5 1,184.04 -2.8 1,056.22 1.8 894.57 2.5 483.51 3.1 1,296.84 2.0 927.99 0.5
Sep 882.34 0.6 1,118.36 4.6 719.44 2.7 1,010.18 1.7 1,132.10 -8.5 975.05 -2.4 867.11 -3.0 489.38 10.8 1,327.31 3.9 927.74 0.3
Oct 882.61 2.6 1,127.12 4.6 722.17 6.5 1,075.93 12.1 1,132.68 -8.4 974.48 -2.9 869.40 0.1 453.66 3.1 1,312.63 8.6 925.01 2.0
Nov 875.24 0.7 1,135.88 3.0 687.70 -2.3 1,083.85 9.8 1,225.93 0.2 980.83 -1.5 865.17 -1.0 437.50 1.2 1,301.73 6.6 921.52 0.9
Dec 877.82 1.4 1,141.51 1.6 705.70 3.6 1,050.82 10.0 1,201.57 -1.0 983.75 0.2 880.20 0.6 404.09 -11.5 1,331.49 11.1 917.64 0.0
2017 Jan 879.27 0.4 1,084.66 -2.9 700.03 1.0 1,042.41 11.9 1,164.08 -2.3 1,024.41 1.0 890.60 0.6 425.50 -0.8 1,306.04 1.2 924.66 -0.2
Feb 883.63 2.2 1,056.31 -2.1 710.92 7.7 1,015.03 7.6 1,201.78 1.3 1,022.63 -0.5 910.92 1.5 446.92 4.9 1,281.28 -3.3 931.85 1.6
Mar 875.60 1.7 1,058.15 11.9 701.07 4.4 989.38 -0.9 1,227.21 1.9 1,022.19 1.6 878.01 -2.9 442.83 4.6 1,293.67 -2.3 925.94 1.5
Apr 864.17 0.1 1,024.27 1.2 698.53 -0.8 923.49 -6.7 1,181.73 1.7 1,015.87 -0.2 870.87 -2.7 451.47 -4.6 1,245.44 -6.3 918.40 0.6
May 862.62 -1.3 1,039.84 4.9 681.82 -4.1 938.36 -6.4 1,160.06 3.2 1,025.23 -2.0 878.82 -3.5 477.40 1.1 1,226.26 -6.4 912.28 -0.9
Jun 874.63 -0.8 1,057.18 2.4 705.43 -3.5 1,000.32 1.8 1,215.93 6.4 1,010.75 -5.3 887.90 -2.3 474.24 -1.7 1,291.69 -3.4 927.65 0.3
Jul 881.93 0.9 1,093.66 3.1 710.47 -1.4 1,044.31 4.1 1,218.78 4.2 1,095.39 4.6 864.85 -3.1 478.68 -0.3 1,223.94 -7.6 935.37 2.0
Aug 882.34 -0.3 1,094.79 -0.2 719.49 -2.3 1,090.26 11.1 1,172.15 -1.0 1,108.80 5.0 873.43 -2.4 498.06 3.0 1,254.46 -3.3 932.18 0.5
Sep 900.75 2.1 1,116.97 -0.1 755.58 5.0 1,086.93 7.6 1,187.14 4.9 1,079.83 10.7 898.65 3.6 471.92 -3.6 1,296.73 -2.3 943.28 1.7
Oct 912.71 3.4 1,164.21 3.3 744.44 3.1 1,210.33 12.5 1,127.12 -0.5 1,020.13 4.7 929.91 7.0 483.40 6.6 1,301.27 -0.9 958.47 3.6
Nov 918.50 4.9 1,179.46 3.8 742.45 8.0 1,144.14 5.6 1,183.88 -3.4 1,031.60 5.2 937.59 8.4 468.46 7.1 1,366.51 5.0 971.46 5.4
Dec 903.23 2.9 1,164.30 2.0 734.86 4.1 1,169.79 11.3 1,203.39 0.2 1,000.38 1.7 921.70 4.7 404.41 0.1 1,329.37 -0.2 955.60 4.1
Average:
Jan-Dec16 874.82 1,071.46 705.26 1,004.48 1,171.44 1,016.51 889.20 454.48 1,317.46 920.90
Jan-Dec17 886.62 1,094.48 717.09 1,054.56 1,186.94 1,038.10 895.27 460.27 1,284.72 936.43
% Change 1.3 2.1 1.7 5.0 1.3 2.1 0.7 1.3 -2.5 1.7
Monthly percent changes are calculated as month over same month previous year
Prepared by: BC Stats Source: Statistics Canada Labour Force Survey
% CHG % CHG % CHG % CHG % CHG
SERVICES SOCIAL ASSIST. FOOD SERV. ADMINISTRATION INDUSTRIES
% CHG % CHG % CHG % CHG % CHG
EDUCATIONAL HEALTH CARE & ACCOMMOD. & PUBLIC ALL
INDUSTRIES WAREHOUSING TRADE & RELATED & TECH SERVICES
ALL SERVICE TRANSPORT. RETAIL AND SELECTED BREAKOUT OF COMMUNITY & PERSONAL SERVICE TOTAL
PRODUCING AND WHOLESALE FINANCE PROFESS., SCIENT.
3.3A B.C. INDUSTRIAL COMPARISON - AVERAGE HOURLY WAGE RATE
$ $ $ $ $ $
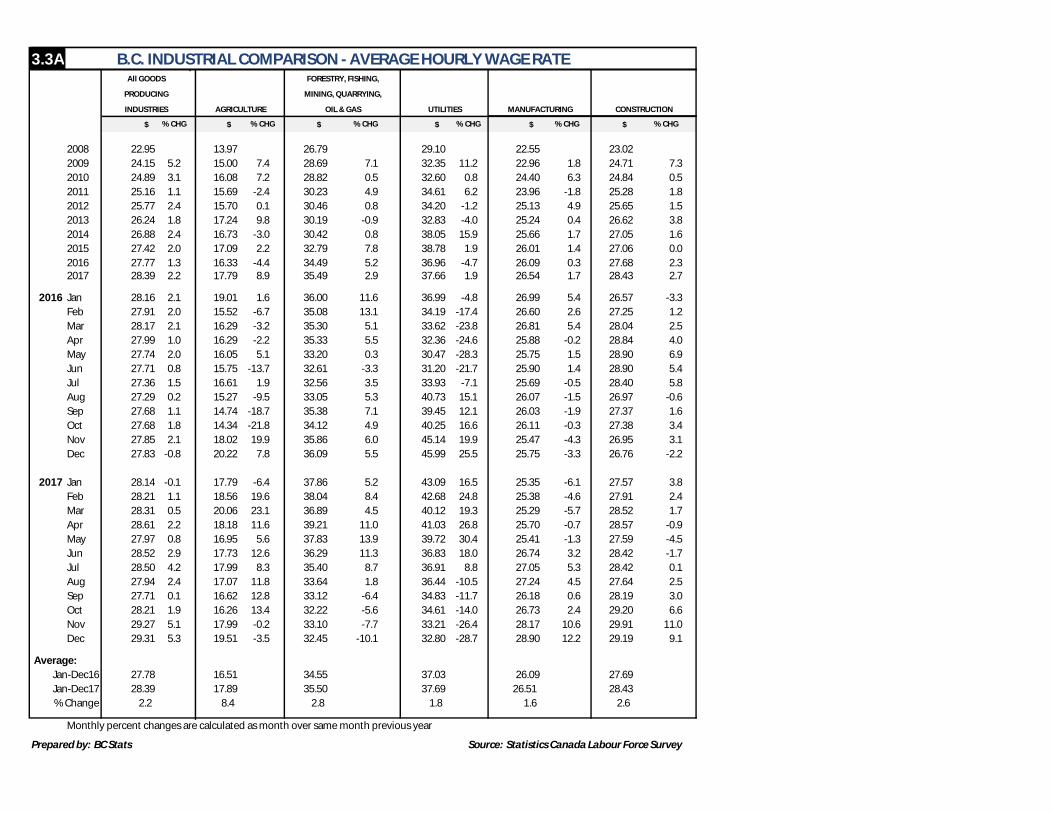
2008 22.95 13.97 26.79 29.10 22.55 23.02
2009 24.15 5.2 15.00 7.4 28.69 7.1 32.35 11.2 22.96 1.8 24.71 7.3
2010 24.89 3.1 16.08 7.2 28.82 0.5 32.60 0.8 24.40 6.3 24.84 0.5
2011 25.16 1.1 15.69 -2.4 30.23 4.9 34.61 6.2 23.96 -1.8 25.28 1.8
2012 25.77 2.4 15.70 0.1 30.46 0.8 34.20 -1.2 25.13 4.9 25.65 1.5
2013 26.24 1.8 17.24 9.8 30.19 -0.9 32.83 -4.0 25.24 0.4 26.62 3.8
2014 26.88 2.4 16.73 -3.0 30.42 0.8 38.05 15.9 25.66 1.7 27.05 1.6
2015 27.42 2.0 17.09 2.2 32.79 7.8 38.78 1.9 26.01 1.4 27.06 0.0
2016 27.77 1.3 16.33 -4.4 34.49 5.2 36.96 -4.7 26.09 0.3 27.68 2.32017 28.39 2.2 17.79 8.9 35.49 2.9 37.66 1.9 26.54 1.7 28.43 2.7
2016 Jan 28.16 2.1 19.01 1.6 36.00 11.6 36.99 -4.8 26.99 5.4 26.57 -3.3
Feb 27.91 2.0 15.52 -6.7 35.08 13.1 34.19 -17.4 26.60 2.6 27.25 1.2
Mar 28.17 2.1 16.29 -3.2 35.30 5.1 33.62 -23.8 26.81 5.4 28.04 2.5
Apr 27.99 1.0 16.29 -2.2 35.33 5.5 32.36 -24.6 25.88 -0.2 28.84 4.0
May 27.74 2.0 16.05 5.1 33.20 0.3 30.47 -28.3 25.75 1.5 28.90 6.9
Jun 27.71 0.8 15.75 -13.7 32.61 -3.3 31.20 -21.7 25.90 1.4 28.90 5.4
Jul 27.36 1.5 16.61 1.9 32.56 3.5 33.93 -7.1 25.69 -0.5 28.40 5.8
Aug 27.29 0.2 15.27 -9.5 33.05 5.3 40.73 15.1 26.07 -1.5 26.97 -0.6
Sep 27.68 1.1 14.74 -18.7 35.38 7.1 39.45 12.1 26.03 -1.9 27.37 1.6
Oct 27.68 1.8 14.34 -21.8 34.12 4.9 40.25 16.6 26.11 -0.3 27.38 3.4
Nov 27.85 2.1 18.02 19.9 35.86 6.0 45.14 19.9 25.47 -4.3 26.95 3.1
Dec 27.83 -0.8 20.22 7.8 36.09 5.5 45.99 25.5 25.75 -3.3 26.76 -2.2
2017 Jan 28.14 -0.1 17.79 -6.4 37.86 5.2 43.09 16.5 25.35 -6.1 27.57 3.8
Feb 28.21 1.1 18.56 19.6 38.04 8.4 42.68 24.8 25.38 -4.6 27.91 2.4
Mar 28.31 0.5 20.06 23.1 36.89 4.5 40.12 19.3 25.29 -5.7 28.52 1.7
Apr 28.61 2.2 18.18 11.6 39.21 11.0 41.03 26.8 25.70 -0.7 28.57 -0.9
May 27.97 0.8 16.95 5.6 37.83 13.9 39.72 30.4 25.41 -1.3 27.59 -4.5
Jun 28.52 2.9 17.73 12.6 36.29 11.3 36.83 18.0 26.74 3.2 28.42 -1.7
Jul 28.50 4.2 17.99 8.3 35.40 8.7 36.91 8.8 27.05 5.3 28.42 0.1
Aug 27.94 2.4 17.07 11.8 33.64 1.8 36.44 -10.5 27.24 4.5 27.64 2.5
Sep 27.71 0.1 16.62 12.8 33.12 -6.4 34.83 -11.7 26.18 0.6 28.19 3.0
Oct 28.21 1.9 16.26 13.4 32.22 -5.6 34.61 -14.0 26.73 2.4 29.20 6.6
Nov 29.27 5.1 17.99 -0.2 33.10 -7.7 33.21 -26.4 28.17 10.6 29.91 11.0
Dec 29.31 5.3 19.51 -3.5 32.45 -10.1 32.80 -28.7 28.90 12.2 29.19 9.1
Average:
Jan-Dec16 27.78 16.51 34.55 37.03 26.09 27.69
Jan-Dec17 28.39 17.89 35.50 37.69 26.51 28.43
% Change 2.2 8.4 2.8 1.8 1.6 2.6
Monthly percent changes are calculated as month over same month previous year
Prepared by: BC Stats Source: Statistics Canada Labour Force Survey
% CHG % CHG % CHG % CHG % CHG % CHG
INDUSTRIES AGRICULTURE OIL & GAS UTILITIES MANUFACTURING CONSTRUCTION
All GOODS FORESTRY, FISHING,
PRODUCING MINING, QUARRYING,
3.3B B.C. INDUSTRIAL COMPARISON - AVERAGE HOURLY WAGE RATE
$ % CHG $ % CHG $ % CHG $ % CHG $ % CHG $ % CHG $ % CHG $ % CHG $ % CHG $ % CHG
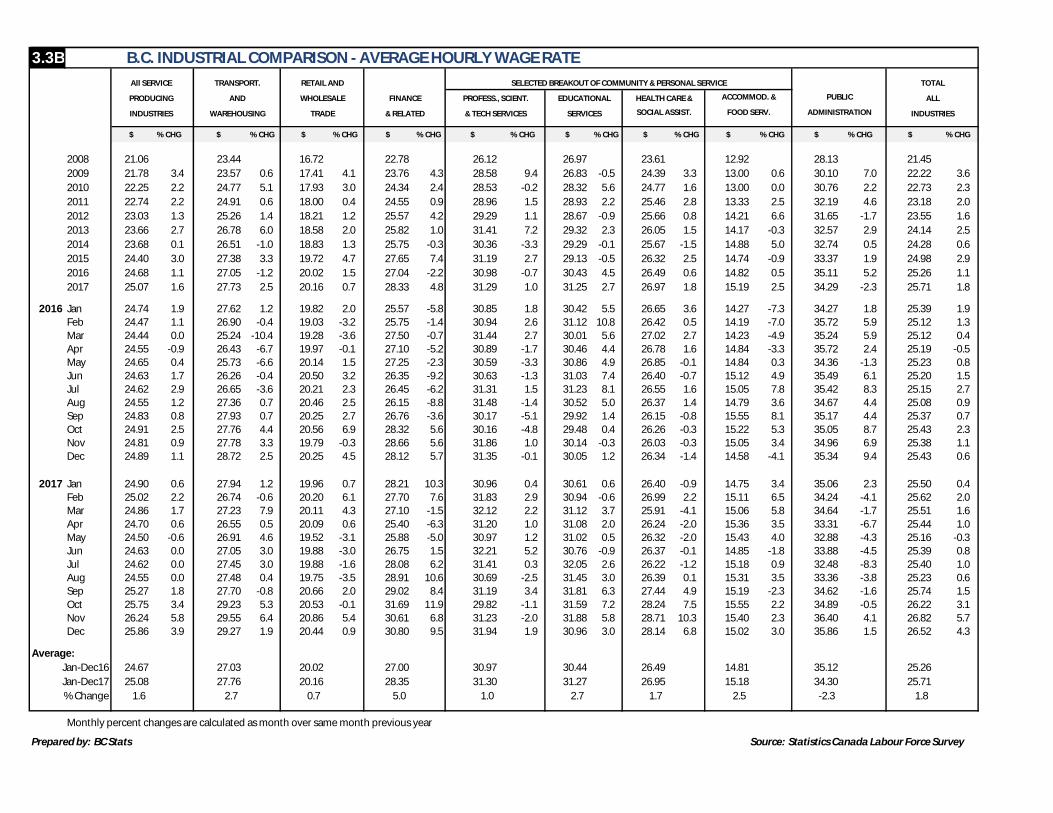
2008 21.06 23.44 16.72 22.78 26.12 26.97 23.61 12.92 28.13 21.45
2009 21.78 3.4 23.57 0.6 17.41 4.1 23.76 4.3 28.58 9.4 26.83 -0.5 24.39 3.3 13.00 0.6 30.10 7.0 22.22 3.6
2010 22.25 2.2 24.77 5.1 17.93 3.0 24.34 2.4 28.53 -0.2 28.32 5.6 24.77 1.6 13.00 0.0 30.76 2.2 22.73 2.3
2011 22.74 2.2 24.91 0.6 18.00 0.4 24.55 0.9 28.96 1.5 28.93 2.2 25.46 2.8 13.33 2.5 32.19 4.6 23.18 2.0
2012 23.03 1.3 25.26 1.4 18.21 1.2 25.57 4.2 29.29 1.1 28.67 -0.9 25.66 0.8 14.21 6.6 31.65 -1.7 23.55 1.6
2013 23.66 2.7 26.78 6.0 18.58 2.0 25.82 1.0 31.41 7.2 29.32 2.3 26.05 1.5 14.17 -0.3 32.57 2.9 24.14 2.5
2014 23.68 0.1 26.51 -1.0 18.83 1.3 25.75 -0.3 30.36 -3.3 29.29 -0.1 25.67 -1.5 14.88 5.0 32.74 0.5 24.28 0.6
2015 24.40 3.0 27.38 3.3 19.72 4.7 27.65 7.4 31.19 2.7 29.13 -0.5 26.32 2.5 14.74 -0.9 33.37 1.9 24.98 2.9
2016 24.68 1.1 27.05 -1.2 20.02 1.5 27.04 -2.2 30.98 -0.7 30.43 4.5 26.49 0.6 14.82 0.5 35.11 5.2 25.26 1.1
2017 25.07 1.6 27.73 2.5 20.16 0.7 28.33 4.8 31.29 1.0 31.25 2.7 26.97 1.8 15.19 2.5 34.29 -2.3 25.71 1.8
2016 Jan 24.74 1.9 27.62 1.2 19.82 2.0 25.57 -5.8 30.85 1.8 30.42 5.5 26.65 3.6 14.27 -7.3 34.27 1.8 25.39 1.9
Feb 24.47 1.1 26.90 -0.4 19.03 -3.2 25.75 -1.4 30.94 2.6 31.12 10.8 26.42 0.5 14.19 -7.0 35.72 5.9 25.12 1.3
Mar 24.44 0.0 25.24 -10.4 19.28 -3.6 27.50 -0.7 31.44 2.7 30.01 5.6 27.02 2.7 14.23 -4.9 35.24 5.9 25.12 0.4
Apr 24.55 -0.9 26.43 -6.7 19.97 -0.1 27.10 -5.2 30.89 -1.7 30.46 4.4 26.78 1.6 14.84 -3.3 35.72 2.4 25.19 -0.5
May 24.65 0.4 25.73 -6.6 20.14 1.5 27.25 -2.3 30.59 -3.3 30.86 4.9 26.85 -0.1 14.84 0.3 34.36 -1.3 25.23 0.8
Jun 24.63 1.7 26.26 -0.4 20.50 3.2 26.35 -9.2 30.63 -1.3 31.03 7.4 26.40 -0.7 15.12 4.9 35.49 6.1 25.20 1.5
Jul 24.62 2.9 26.65 -3.6 20.21 2.3 26.45 -6.2 31.31 1.5 31.23 8.1 26.55 1.6 15.05 7.8 35.42 8.3 25.15 2.7
Aug 24.55 1.2 27.36 0.7 20.46 2.5 26.15 -8.8 31.48 -1.4 30.52 5.0 26.37 1.4 14.79 3.6 34.67 4.4 25.08 0.9
Sep 24.83 0.8 27.93 0.7 20.25 2.7 26.76 -3.6 30.17 -5.1 29.92 1.4 26.15 -0.8 15.55 8.1 35.17 4.4 25.37 0.7
Oct 24.91 2.5 27.76 4.4 20.56 6.9 28.32 5.6 30.16 -4.8 29.48 0.4 26.26 -0.3 15.22 5.3 35.05 8.7 25.43 2.3
Nov 24.81 0.9 27.78 3.3 19.79 -0.3 28.66 5.6 31.86 1.0 30.14 -0.3 26.03 -0.3 15.05 3.4 34.96 6.9 25.38 1.1
Dec 24.89 1.1 28.72 2.5 20.25 4.5 28.12 5.7 31.35 -0.1 30.05 1.2 26.34 -1.4 14.58 -4.1 35.34 9.4 25.43 0.6
2017 Jan 24.90 0.6 27.94 1.2 19.96 0.7 28.21 10.3 30.96 0.4 30.61 0.6 26.40 -0.9 14.75 3.4 35.06 2.3 25.50 0.4
Feb 25.02 2.2 26.74 -0.6 20.20 6.1 27.70 7.6 31.83 2.9 30.94 -0.6 26.99 2.2 15.11 6.5 34.24 -4.1 25.62 2.0
Mar 24.86 1.7 27.23 7.9 20.11 4.3 27.10 -1.5 32.12 2.2 31.12 3.7 25.91 -4.1 15.06 5.8 34.64 -1.7 25.51 1.6
Apr 24.70 0.6 26.55 0.5 20.09 0.6 25.40 -6.3 31.20 1.0 31.08 2.0 26.24 -2.0 15.36 3.5 33.31 -6.7 25.44 1.0
May 24.50 -0.6 26.91 4.6 19.52 -3.1 25.88 -5.0 30.97 1.2 31.02 0.5 26.32 -2.0 15.43 4.0 32.88 -4.3 25.16 -0.3
Jun 24.63 0.0 27.05 3.0 19.88 -3.0 26.75 1.5 32.21 5.2 30.76 -0.9 26.37 -0.1 14.85 -1.8 33.88 -4.5 25.39 0.8
Jul 24.62 0.0 27.45 3.0 19.88 -1.6 28.08 6.2 31.41 0.3 32.05 2.6 26.22 -1.2 15.18 0.9 32.48 -8.3 25.40 1.0
Aug 24.55 0.0 27.48 0.4 19.75 -3.5 28.91 10.6 30.69 -2.5 31.45 3.0 26.39 0.1 15.31 3.5 33.36 -3.8 25.23 0.6
Sep 25.27 1.8 27.70 -0.8 20.66 2.0 29.02 8.4 31.19 3.4 31.81 6.3 27.44 4.9 15.19 -2.3 34.62 -1.6 25.74 1.5
Oct 25.75 3.4 29.23 5.3 20.53 -0.1 31.69 11.9 29.82 -1.1 31.59 7.2 28.24 7.5 15.55 2.2 34.89 -0.5 26.22 3.1
Nov 26.24 5.8 29.55 6.4 20.86 5.4 30.61 6.8 31.23 -2.0 31.88 5.8 28.71 10.3 15.40 2.3 36.40 4.1 26.82 5.7
Dec 25.86 3.9 29.27 1.9 20.44 0.9 30.80 9.5 31.94 1.9 30.96 3.0 28.14 6.8 15.02 3.0 35.86 1.5 26.52 4.3
Average:
Jan-Dec16 24.67 27.03 20.02 27.00 30.97 30.44 26.49 14.81 35.12 25.26
Jan-Dec17 25.08 27.76 20.16 28.35 31.30 31.27 26.95 15.18 34.30 25.71
% Change 1.6 2.7 0.7 5.0 1.0 2.7 1.7 2.5 -2.3 1.8
Monthly percent changes are calculated as month over same month previous year
Prepared by: BC Stats Source: Statistics Canada Labour Force Survey
SERVICES SOCIAL ASSIST. FOOD SERV. ADMINISTRATION INDUSTRIES
EDUCATIONAL HEALTH CARE & ACCOMMOD. & PUBLIC ALL
INDUSTRIES WAREHOUSING TRADE & RELATED & TECH SERVICES
All SERVICE TRANSPORT. RETAIL AND SELECTED BREAKOUT OF COMMUNITY & PERSONAL SERVICE TOTAL
PRODUCING AND WHOLESALE FINANCE PROFESS., SCIENT.
3.4A B.C. INDUSTRIAL COMPARISON - EMPLOYMENT (Actual)
FISHING
('000) % CHG ('000) % CHG ('000) % CHG ('000) % CHG ('000) % CHG ('000) % CHG ('000) % CHG ('000) % CHG ('000) % CHG ('000) % CHG
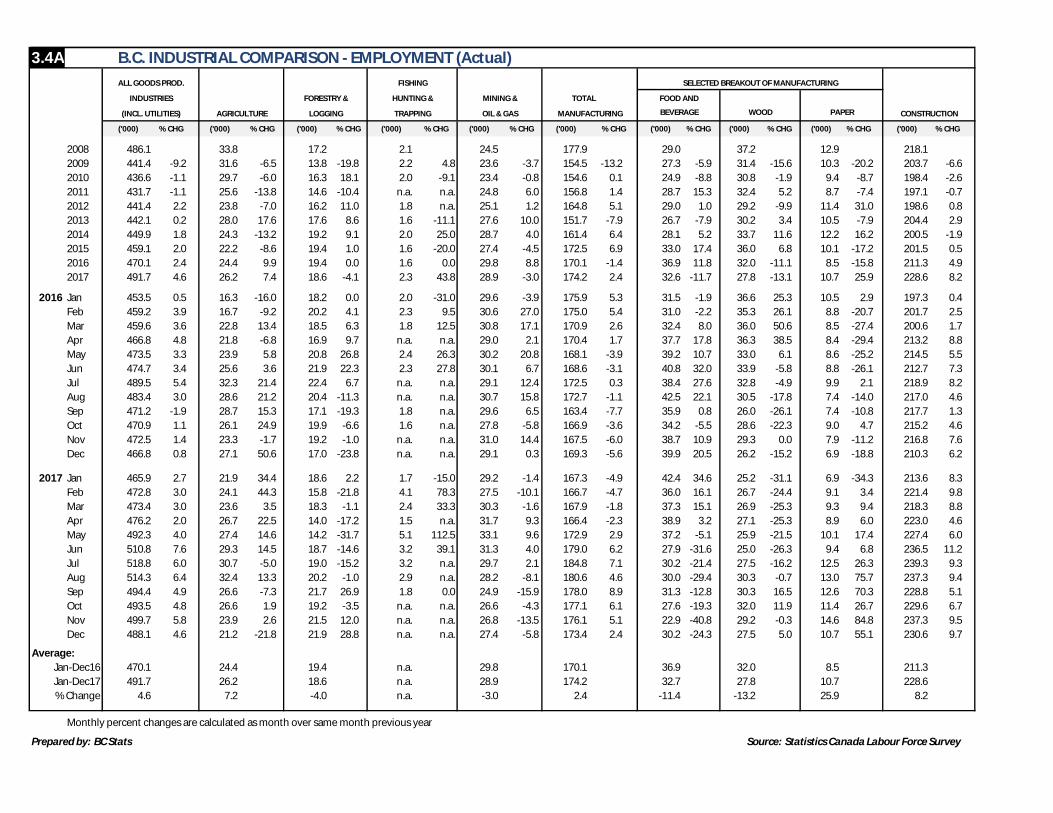
2008 486.1 33.8 17.2 2.1 24.5 177.9 29.0 37.2 12.9 218.1
2009 441.4 -9.2 31.6 -6.5 13.8 -19.8 2.2 4.8 23.6 -3.7 154.5 -13.2 27.3 -5.9 31.4 -15.6 10.3 -20.2 203.7 -6.6
2010 436.6 -1.1 29.7 -6.0 16.3 18.1 2.0 -9.1 23.4 -0.8 154.6 0.1 24.9 -8.8 30.8 -1.9 9.4 -8.7 198.4 -2.6
2011 431.7 -1.1 25.6 -13.8 14.6 -10.4 n.a. n.a. 24.8 6.0 156.8 1.4 28.7 15.3 32.4 5.2 8.7 -7.4 197.1 -0.7
2012 441.4 2.2 23.8 -7.0 16.2 11.0 1.8 n.a. 25.1 1.2 164.8 5.1 29.0 1.0 29.2 -9.9 11.4 31.0 198.6 0.8
2013 442.1 0.2 28.0 17.6 17.6 8.6 1.6 -11.1 27.6 10.0 151.7 -7.9 26.7 -7.9 30.2 3.4 10.5 -7.9 204.4 2.9
2014 449.9 1.8 24.3 -13.2 19.2 9.1 2.0 25.0 28.7 4.0 161.4 6.4 28.1 5.2 33.7 11.6 12.2 16.2 200.5 -1.9
2015 459.1 2.0 22.2 -8.6 19.4 1.0 1.6 -20.0 27.4 -4.5 172.5 6.9 33.0 17.4 36.0 6.8 10.1 -17.2 201.5 0.5
2016 470.1 2.4 24.4 9.9 19.4 0.0 1.6 0.0 29.8 8.8 170.1 -1.4 36.9 11.8 32.0 -11.1 8.5 -15.8 211.3 4.9
2017 491.7 4.6 26.2 7.4 18.6 -4.1 2.3 43.8 28.9 -3.0 174.2 2.4 32.6 -11.7 27.8 -13.1 10.7 25.9 228.6 8.2
2016 Jan 453.5 0.5 16.3 -16.0 18.2 0.0 2.0 -31.0 29.6 -3.9 175.9 5.3 31.5 -1.9 36.6 25.3 10.5 2.9 197.3 0.4
Feb 459.2 3.9 16.7 -9.2 20.2 4.1 2.3 9.5 30.6 27.0 175.0 5.4 31.0 -2.2 35.3 26.1 8.8 -20.7 201.7 2.5
Mar 459.6 3.6 22.8 13.4 18.5 6.3 1.8 12.5 30.8 17.1 170.9 2.6 32.4 8.0 36.0 50.6 8.5 -27.4 200.6 1.7
Apr 466.8 4.8 21.8 -6.8 16.9 9.7 n.a. n.a. 29.0 2.1 170.4 1.7 37.7 17.8 36.3 38.5 8.4 -29.4 213.2 8.8
May 473.5 3.3 23.9 5.8 20.8 26.8 2.4 26.3 30.2 20.8 168.1 -3.9 39.2 10.7 33.0 6.1 8.6 -25.2 214.5 5.5
Jun 474.7 3.4 25.6 3.6 21.9 22.3 2.3 27.8 30.1 6.7 168.6 -3.1 40.8 32.0 33.9 -5.8 8.8 -26.1 212.7 7.3
Jul 489.5 5.4 32.3 21.4 22.4 6.7 n.a. n.a. 29.1 12.4 172.5 0.3 38.4 27.6 32.8 -4.9 9.9 2.1 218.9 8.2
Aug 483.4 3.0 28.6 21.2 20.4 -11.3 n.a. n.a. 30.7 15.8 172.7 -1.1 42.5 22.1 30.5 -17.8 7.4 -14.0 217.0 4.6
Sep 471.2 -1.9 28.7 15.3 17.1 -19.3 1.8 n.a. 29.6 6.5 163.4 -7.7 35.9 0.8 26.0 -26.1 7.4 -10.8 217.7 1.3
Oct 470.9 1.1 26.1 24.9 19.9 -6.6 1.6 n.a. 27.8 -5.8 166.9 -3.6 34.2 -5.5 28.6 -22.3 9.0 4.7 215.2 4.6
Nov 472.5 1.4 23.3 -1.7 19.2 -1.0 n.a. n.a. 31.0 14.4 167.5 -6.0 38.7 10.9 29.3 0.0 7.9 -11.2 216.8 7.6
Dec 466.8 0.8 27.1 50.6 17.0 -23.8 n.a. n.a. 29.1 0.3 169.3 -5.6 39.9 20.5 26.2 -15.2 6.9 -18.8 210.3 6.2
2017 Jan 465.9 2.7 21.9 34.4 18.6 2.2 1.7 -15.0 29.2 -1.4 167.3 -4.9 42.4 34.6 25.2 -31.1 6.9 -34.3 213.6 8.3
Feb 472.8 3.0 24.1 44.3 15.8 -21.8 4.1 78.3 27.5 -10.1 166.7 -4.7 36.0 16.1 26.7 -24.4 9.1 3.4 221.4 9.8
Mar 473.4 3.0 23.6 3.5 18.3 -1.1 2.4 33.3 30.3 -1.6 167.9 -1.8 37.3 15.1 26.9 -25.3 9.3 9.4 218.3 8.8
Apr 476.2 2.0 26.7 22.5 14.0 -17.2 1.5 n.a. 31.7 9.3 166.4 -2.3 38.9 3.2 27.1 -25.3 8.9 6.0 223.0 4.6
May 492.3 4.0 27.4 14.6 14.2 -31.7 5.1 112.5 33.1 9.6 172.9 2.9 37.2 -5.1 25.9 -21.5 10.1 17.4 227.4 6.0
Jun 510.8 7.6 29.3 14.5 18.7 -14.6 3.2 39.1 31.3 4.0 179.0 6.2 27.9 -31.6 25.0 -26.3 9.4 6.8 236.5 11.2
Jul 518.8 6.0 30.7 -5.0 19.0 -15.2 3.2 n.a. 29.7 2.1 184.8 7.1 30.2 -21.4 27.5 -16.2 12.5 26.3 239.3 9.3
Aug 514.3 6.4 32.4 13.3 20.2 -1.0 2.9 n.a. 28.2 -8.1 180.6 4.6 30.0 -29.4 30.3 -0.7 13.0 75.7 237.3 9.4
Sep 494.4 4.9 26.6 -7.3 21.7 26.9 1.8 0.0 24.9 -15.9 178.0 8.9 31.3 -12.8 30.3 16.5 12.6 70.3 228.8 5.1
Oct 493.5 4.8 26.6 1.9 19.2 -3.5 n.a. n.a. 26.6 -4.3 177.1 6.1 27.6 -19.3 32.0 11.9 11.4 26.7 229.6 6.7
Nov 499.7 5.8 23.9 2.6 21.5 12.0 n.a. n.a. 26.8 -13.5 176.1 5.1 22.9 -40.8 29.2 -0.3 14.6 84.8 237.3 9.5
Dec 488.1 4.6 21.2 -21.8 21.9 28.8 n.a. n.a. 27.4 -5.8 173.4 2.4 30.2 -24.3 27.5 5.0 10.7 55.1 230.6 9.7
Average:
Jan-Dec16 470.1 24.4 19.4 n.a. 29.8 170.1 36.9 32.0 8.5 211.3
Jan-Dec17 491.7 26.2 18.6 n.a. 28.9 174.2 32.7 27.8 10.7 228.6
% Change 4.6 7.2 -4.0 n.a. -3.0 2.4 -11.4 -13.2 25.9 8.2
Monthly percent changes are calculated as month over same month previous year
Prepared by: BC Stats Source: Statistics Canada Labour Force Survey
MANUFACTURING BEVERAGE WOOD PAPER CONSTRUCTION
TOTAL FOOD AND
(INCL. UTILITIES) AGRICULTURE LOGGING TRAPPING OIL & GAS
ALL GOODS PROD. SELECTED BREAKOUT OF MANUFACTURING
INDUSTRIES FORESTRY & HUNTING & MINING &
3.4B B.C. INDUSTRIAL COMPARISON - EMPLOYMENT (Actual)
('000) % CHG ('000) % CHG ('000) % CHG ('000) % CHG ('000) % CHG ('000) % CHG ('000) % CHG ('000) % CHG ('000) % CHG ('000) % CHG
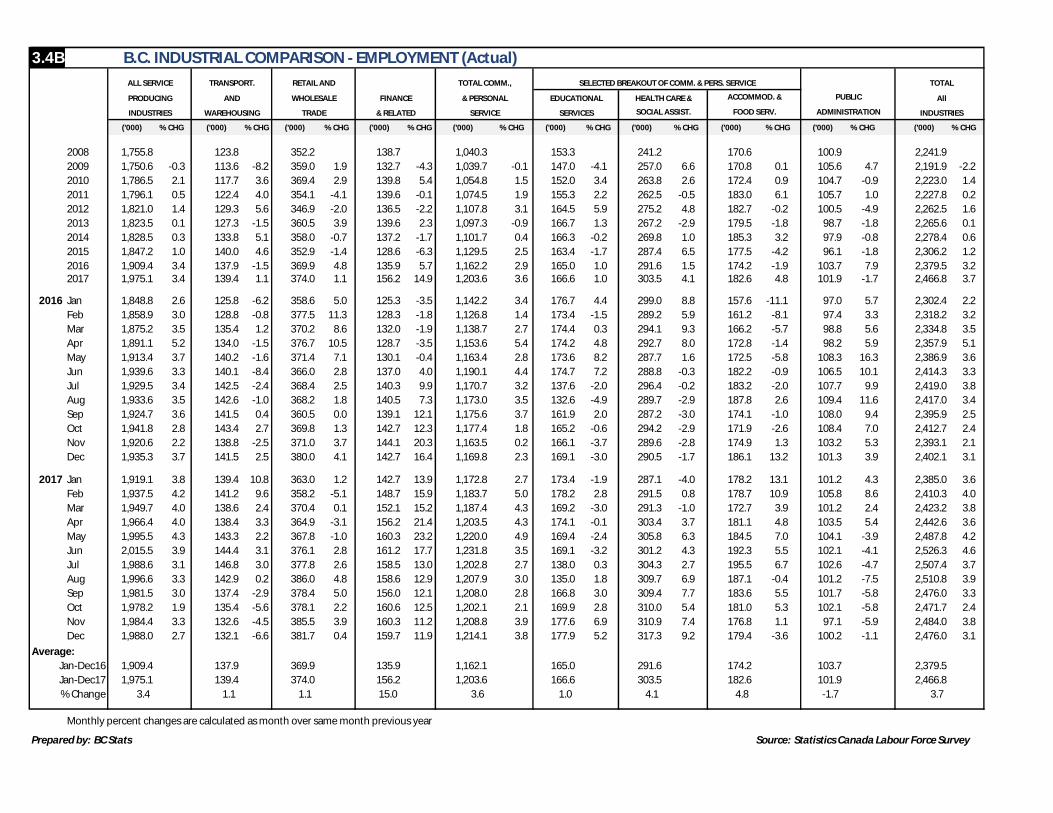
2008 1,755.8 123.8 352.2 138.7 1,040.3 153.3 241.2 170.6 100.9 2,241.9
2009 1,750.6 -0.3 113.6 -8.2 359.0 1.9 132.7 -4.3 1,039.7 -0.1 147.0 -4.1 257.0 6.6 170.8 0.1 105.6 4.7 2,191.9 -2.2
2010 1,786.5 2.1 117.7 3.6 369.4 2.9 139.8 5.4 1,054.8 1.5 152.0 3.4 263.8 2.6 172.4 0.9 104.7 -0.9 2,223.0 1.4
2011 1,796.1 0.5 122.4 4.0 354.1 -4.1 139.6 -0.1 1,074.5 1.9 155.3 2.2 262.5 -0.5 183.0 6.1 105.7 1.0 2,227.8 0.2
2012 1,821.0 1.4 129.3 5.6 346.9 -2.0 136.5 -2.2 1,107.8 3.1 164.5 5.9 275.2 4.8 182.7 -0.2 100.5 -4.9 2,262.5 1.6
2013 1,823.5 0.1 127.3 -1.5 360.5 3.9 139.6 2.3 1,097.3 -0.9 166.7 1.3 267.2 -2.9 179.5 -1.8 98.7 -1.8 2,265.6 0.1
2014 1,828.5 0.3 133.8 5.1 358.0 -0.7 137.2 -1.7 1,101.7 0.4 166.3 -0.2 269.8 1.0 185.3 3.2 97.9 -0.8 2,278.4 0.6
2015 1,847.2 1.0 140.0 4.6 352.9 -1.4 128.6 -6.3 1,129.5 2.5 163.4 -1.7 287.4 6.5 177.5 -4.2 96.1 -1.8 2,306.2 1.2
2016 1,909.4 3.4 137.9 -1.5 369.9 4.8 135.9 5.7 1,162.2 2.9 165.0 1.0 291.6 1.5 174.2 -1.9 103.7 7.9 2,379.5 3.22017 1,975.1 3.4 139.4 1.1 374.0 1.1 156.2 14.9 1,203.6 3.6 166.6 1.0 303.5 4.1 182.6 4.8 101.9 -1.7 2,466.8 3.7
2016 Jan 1,848.8 2.6 125.8 -6.2 358.6 5.0 125.3 -3.5 1,142.2 3.4 176.7 4.4 299.0 8.8 157.6 -11.1 97.0 5.7 2,302.4 2.2
Feb 1,858.9 3.0 128.8 -0.8 377.5 11.3 128.3 -1.8 1,126.8 1.4 173.4 -1.5 289.2 5.9 161.2 -8.1 97.4 3.3 2,318.2 3.2
Mar 1,875.2 3.5 135.4 1.2 370.2 8.6 132.0 -1.9 1,138.7 2.7 174.4 0.3 294.1 9.3 166.2 -5.7 98.8 5.6 2,334.8 3.5
Apr 1,891.1 5.2 134.0 -1.5 376.7 10.5 128.7 -3.5 1,153.6 5.4 174.2 4.8 292.7 8.0 172.8 -1.4 98.2 5.9 2,357.9 5.1
May 1,913.4 3.7 140.2 -1.6 371.4 7.1 130.1 -0.4 1,163.4 2.8 173.6 8.2 287.7 1.6 172.5 -5.8 108.3 16.3 2,386.9 3.6
Jun 1,939.6 3.3 140.1 -8.4 366.0 2.8 137.0 4.0 1,190.1 4.4 174.7 7.2 288.8 -0.3 182.2 -0.9 106.5 10.1 2,414.3 3.3
Jul 1,929.5 3.4 142.5 -2.4 368.4 2.5 140.3 9.9 1,170.7 3.2 137.6 -2.0 296.4 -0.2 183.2 -2.0 107.7 9.9 2,419.0 3.8
Aug 1,933.6 3.5 142.6 -1.0 368.2 1.8 140.5 7.3 1,173.0 3.5 132.6 -4.9 289.7 -2.9 187.8 2.6 109.4 11.6 2,417.0 3.4
Sep 1,924.7 3.6 141.5 0.4 360.5 0.0 139.1 12.1 1,175.6 3.7 161.9 2.0 287.2 -3.0 174.1 -1.0 108.0 9.4 2,395.9 2.5
Oct 1,941.8 2.8 143.4 2.7 369.8 1.3 142.7 12.3 1,177.4 1.8 165.2 -0.6 294.2 -2.9 171.9 -2.6 108.4 7.0 2,412.7 2.4
Nov 1,920.6 2.2 138.8 -2.5 371.0 3.7 144.1 20.3 1,163.5 0.2 166.1 -3.7 289.6 -2.8 174.9 1.3 103.2 5.3 2,393.1 2.1
Dec 1,935.3 3.7 141.5 2.5 380.0 4.1 142.7 16.4 1,169.8 2.3 169.1 -3.0 290.5 -1.7 186.1 13.2 101.3 3.9 2,402.1 3.1
2017 Jan 1,919.1 3.8 139.4 10.8 363.0 1.2 142.7 13.9 1,172.8 2.7 173.4 -1.9 287.1 -4.0 178.2 13.1 101.2 4.3 2,385.0 3.6
Feb 1,937.5 4.2 141.2 9.6 358.2 -5.1 148.7 15.9 1,183.7 5.0 178.2 2.8 291.5 0.8 178.7 10.9 105.8 8.6 2,410.3 4.0
Mar 1,949.7 4.0 138.6 2.4 370.4 0.1 152.1 15.2 1,187.4 4.3 169.2 -3.0 291.3 -1.0 172.7 3.9 101.2 2.4 2,423.2 3.8
Apr 1,966.4 4.0 138.4 3.3 364.9 -3.1 156.2 21.4 1,203.5 4.3 174.1 -0.1 303.4 3.7 181.1 4.8 103.5 5.4 2,442.6 3.6
May 1,995.5 4.3 143.3 2.2 367.8 -1.0 160.3 23.2 1,220.0 4.9 169.4 -2.4 305.8 6.3 184.5 7.0 104.1 -3.9 2,487.8 4.2
Jun 2,015.5 3.9 144.4 3.1 376.1 2.8 161.2 17.7 1,231.8 3.5 169.1 -3.2 301.2 4.3 192.3 5.5 102.1 -4.1 2,526.3 4.6
Jul 1,988.6 3.1 146.8 3.0 377.8 2.6 158.5 13.0 1,202.8 2.7 138.0 0.3 304.3 2.7 195.5 6.7 102.6 -4.7 2,507.4 3.7
Aug 1,996.6 3.3 142.9 0.2 386.0 4.8 158.6 12.9 1,207.9 3.0 135.0 1.8 309.7 6.9 187.1 -0.4 101.2 -7.5 2,510.8 3.9
Sep 1,981.5 3.0 137.4 -2.9 378.4 5.0 156.0 12.1 1,208.0 2.8 166.8 3.0 309.4 7.7 183.6 5.5 101.7 -5.8 2,476.0 3.3
Oct 1,978.2 1.9 135.4 -5.6 378.1 2.2 160.6 12.5 1,202.1 2.1 169.9 2.8 310.0 5.4 181.0 5.3 102.1 -5.8 2,471.7 2.4
Nov 1,984.4 3.3 132.6 -4.5 385.5 3.9 160.3 11.2 1,208.8 3.9 177.6 6.9 310.9 7.4 176.8 1.1 97.1 -5.9 2,484.0 3.8
Dec 1,988.0 2.7 132.1 -6.6 381.7 0.4 159.7 11.9 1,214.1 3.8 177.9 5.2 317.3 9.2 179.4 -3.6 100.2 -1.1 2,476.0 3.1
Average:
Jan-Dec16 1,909.4 137.9 369.9 135.9 1,162.1 165.0 291.6 174.2 103.7 2,379.5
Jan-Dec17 1,975.1 139.4 374.0 156.2 1,203.6 166.6 303.5 182.6 101.9 2,466.8
% Change 3.4 1.1 1.1 15.0 3.6 1.0 4.1 4.8 -1.7 3.7
Monthly percent changes are calculated as month over same month previous year
Prepared by: BC Stats Source: Statistics Canada Labour Force Survey
SOCIAL ASSIST. FOOD SERV. ADMINISTRATION INDUSTRIES
HEALTH CARE & ACCOMMOD. & PUBLIC All
INDUSTRIES WAREHOUSING TRADE & RELATED SERVICE SERVICES
PRODUCING AND WHOLESALE FINANCE & PERSONAL EDUCATIONAL
ALL SERVICE TRANSPORT. RETAIL AND TOTAL COMM., SELECTED BREAKOUT OF COMM. & PERS. SERVICE TOTAL
3.5A B.C. INDUSTRIAL COMPARISON - AVERAGE WEEKLY HOURS WORKED*
HRS HRS % CHG HRS % CHG HRS % CHG HRS % CHG HRS
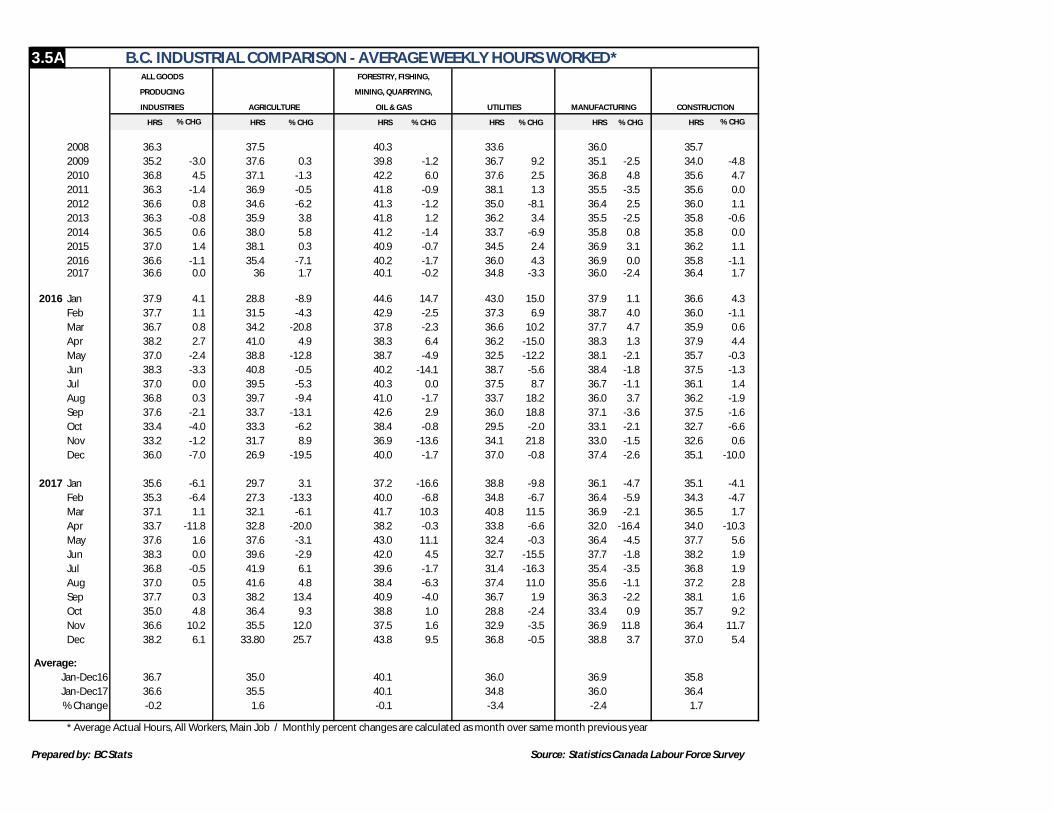
2008 36.3 37.5 40.3 33.6 36.0 35.7
2009 35.2 -3.0 37.6 0.3 39.8 -1.2 36.7 9.2 35.1 -2.5 34.0 -4.8
2010 36.8 4.5 37.1 -1.3 42.2 6.0 37.6 2.5 36.8 4.8 35.6 4.7
2011 36.3 -1.4 36.9 -0.5 41.8 -0.9 38.1 1.3 35.5 -3.5 35.6 0.0
2012 36.6 0.8 34.6 -6.2 41.3 -1.2 35.0 -8.1 36.4 2.5 36.0 1.1
2013 36.3 -0.8 35.9 3.8 41.8 1.2 36.2 3.4 35.5 -2.5 35.8 -0.6
2014 36.5 0.6 38.0 5.8 41.2 -1.4 33.7 -6.9 35.8 0.8 35.8 0.0
2015 37.0 1.4 38.1 0.3 40.9 -0.7 34.5 2.4 36.9 3.1 36.2 1.1
2016 36.6 -1.1 35.4 -7.1 40.2 -1.7 36.0 4.3 36.9 0.0 35.8 -1.12017 36.6 0.0 36 1.7 40.1 -0.2 34.8 -3.3 36.0 -2.4 36.4 1.7
2016 Jan 37.9 4.1 28.8 -8.9 44.6 14.7 43.0 15.0 37.9 1.1 36.6 4.3
Feb 37.7 1.1 31.5 -4.3 42.9 -2.5 37.3 6.9 38.7 4.0 36.0 -1.1
Mar 36.7 0.8 34.2 -20.8 37.8 -2.3 36.6 10.2 37.7 4.7 35.9 0.6
Apr 38.2 2.7 41.0 4.9 38.3 6.4 36.2 -15.0 38.3 1.3 37.9 4.4
May 37.0 -2.4 38.8 -12.8 38.7 -4.9 32.5 -12.2 38.1 -2.1 35.7 -0.3
Jun 38.3 -3.3 40.8 -0.5 40.2 -14.1 38.7 -5.6 38.4 -1.8 37.5 -1.3
Jul 37.0 0.0 39.5 -5.3 40.3 0.0 37.5 8.7 36.7 -1.1 36.1 1.4
Aug 36.8 0.3 39.7 -9.4 41.0 -1.7 33.7 18.2 36.0 3.7 36.2 -1.9
Sep 37.6 -2.1 33.7 -13.1 42.6 2.9 36.0 18.8 37.1 -3.6 37.5 -1.6
Oct 33.4 -4.0 33.3 -6.2 38.4 -0.8 29.5 -2.0 33.1 -2.1 32.7 -6.6
Nov 33.2 -1.2 31.7 8.9 36.9 -13.6 34.1 21.8 33.0 -1.5 32.6 0.6
Dec 36.0 -7.0 26.9 -19.5 40.0 -1.7 37.0 -0.8 37.4 -2.6 35.1 -10.0
2017 Jan 35.6 -6.1 29.7 3.1 37.2 -16.6 38.8 -9.8 36.1 -4.7 35.1 -4.1
Feb 35.3 -6.4 27.3 -13.3 40.0 -6.8 34.8 -6.7 36.4 -5.9 34.3 -4.7
Mar 37.1 1.1 32.1 -6.1 41.7 10.3 40.8 11.5 36.9 -2.1 36.5 1.7
Apr 33.7 -11.8 32.8 -20.0 38.2 -0.3 33.8 -6.6 32.0 -16.4 34.0 -10.3
May 37.6 1.6 37.6 -3.1 43.0 11.1 32.4 -0.3 36.4 -4.5 37.7 5.6
Jun 38.3 0.0 39.6 -2.9 42.0 4.5 32.7 -15.5 37.7 -1.8 38.2 1.9
Jul 36.8 -0.5 41.9 6.1 39.6 -1.7 31.4 -16.3 35.4 -3.5 36.8 1.9
Aug 37.0 0.5 41.6 4.8 38.4 -6.3 37.4 11.0 35.6 -1.1 37.2 2.8
Sep 37.7 0.3 38.2 13.4 40.9 -4.0 36.7 1.9 36.3 -2.2 38.1 1.6
Oct 35.0 4.8 36.4 9.3 38.8 1.0 28.8 -2.4 33.4 0.9 35.7 9.2
Nov 36.6 10.2 35.5 12.0 37.5 1.6 32.9 -3.5 36.9 11.8 36.4 11.7
Dec 38.2 6.1 33.80 25.7 43.8 9.5 36.8 -0.5 38.8 3.7 37.0 5.4
Average:
Jan-Dec16 36.7 35.0 40.1 36.0 36.9 35.8
Jan-Dec17 36.6 35.5 40.1 34.8 36.0 36.4
% Change -0.2 1.6 -0.1 -3.4 -2.4 1.7
* Average Actual Hours, All Workers, Main Job / Monthly percent changes are calculated as month over same month previous year
Prepared by: BC Stats Source: Statistics Canada Labour Force Survey
% CHG % CHG
INDUSTRIES AGRICULTURE OIL & GAS UTILITIES MANUFACTURING CONSTRUCTION
ALL GOODS FORESTRY, FISHING,
PRODUCING MINING, QUARRYING,
3.5B B.C. INDUSTRIAL COMPARISON - AVERAGE WEEKLY HOURS WORKED*
HRS HRS % CHG HRS % CHG HRS % CHG HRS HRS % CHG HRS % CHG HRS % CHG HRS % CHG HRS % CHG
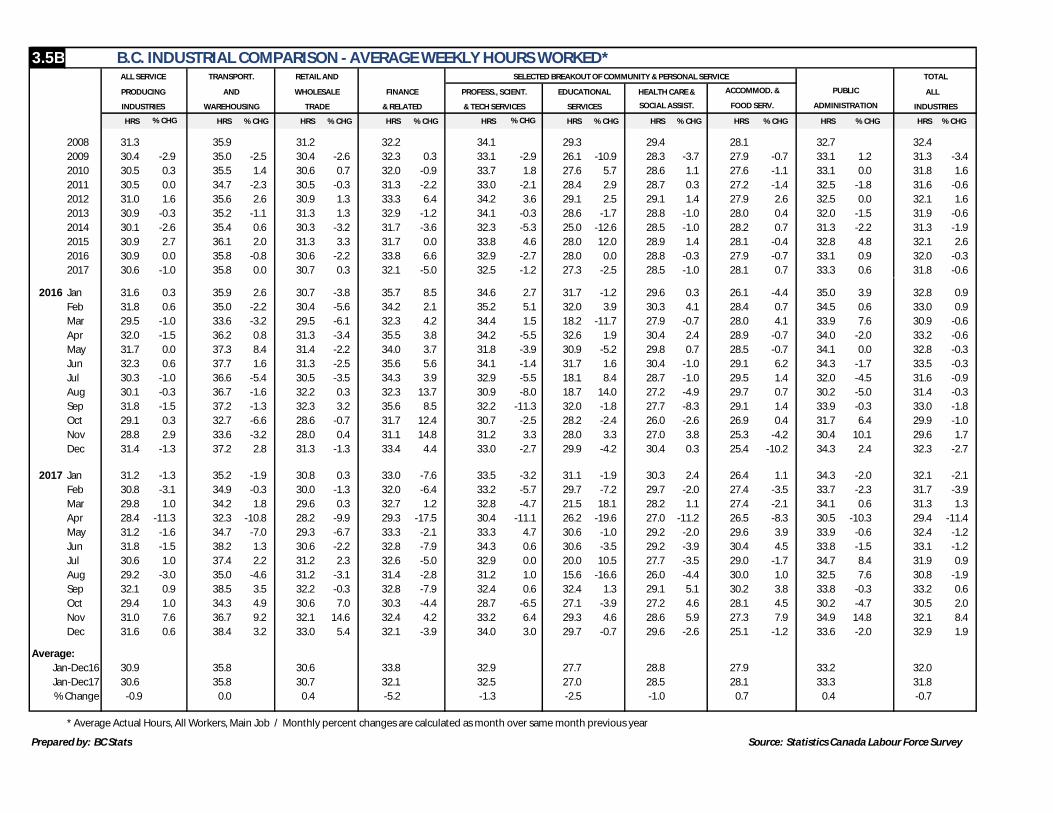
2008 31.3 35.9 31.2 32.2 34.1 29.3 29.4 28.1 32.7 32.4
2009 30.4 -2.9 35.0 -2.5 30.4 -2.6 32.3 0.3 33.1 -2.9 26.1 -10.9 28.3 -3.7 27.9 -0.7 33.1 1.2 31.3 -3.4
2010 30.5 0.3 35.5 1.4 30.6 0.7 32.0 -0.9 33.7 1.8 27.6 5.7 28.6 1.1 27.6 -1.1 33.1 0.0 31.8 1.6
2011 30.5 0.0 34.7 -2.3 30.5 -0.3 31.3 -2.2 33.0 -2.1 28.4 2.9 28.7 0.3 27.2 -1.4 32.5 -1.8 31.6 -0.6
2012 31.0 1.6 35.6 2.6 30.9 1.3 33.3 6.4 34.2 3.6 29.1 2.5 29.1 1.4 27.9 2.6 32.5 0.0 32.1 1.6
2013 30.9 -0.3 35.2 -1.1 31.3 1.3 32.9 -1.2 34.1 -0.3 28.6 -1.7 28.8 -1.0 28.0 0.4 32.0 -1.5 31.9 -0.6
2014 30.1 -2.6 35.4 0.6 30.3 -3.2 31.7 -3.6 32.3 -5.3 25.0 -12.6 28.5 -1.0 28.2 0.7 31.3 -2.2 31.3 -1.9
2015 30.9 2.7 36.1 2.0 31.3 3.3 31.7 0.0 33.8 4.6 28.0 12.0 28.9 1.4 28.1 -0.4 32.8 4.8 32.1 2.6
2016 30.9 0.0 35.8 -0.8 30.6 -2.2 33.8 6.6 32.9 -2.7 28.0 0.0 28.8 -0.3 27.9 -0.7 33.1 0.9 32.0 -0.3
2017 30.6 -1.0 35.8 0.0 30.7 0.3 32.1 -5.0 32.5 -1.2 27.3 -2.5 28.5 -1.0 28.1 0.7 33.3 0.6 31.8 -0.6
2016 Jan 31.6 0.3 35.9 2.6 30.7 -3.8 35.7 8.5 34.6 2.7 31.7 -1.2 29.6 0.3 26.1 -4.4 35.0 3.9 32.8 0.9
Feb 31.8 0.6 35.0 -2.2 30.4 -5.6 34.2 2.1 35.2 5.1 32.0 3.9 30.3 4.1 28.4 0.7 34.5 0.6 33.0 0.9
Mar 29.5 -1.0 33.6 -3.2 29.5 -6.1 32.3 4.2 34.4 1.5 18.2 -11.7 27.9 -0.7 28.0 4.1 33.9 7.6 30.9 -0.6
Apr 32.0 -1.5 36.2 0.8 31.3 -3.4 35.5 3.8 34.2 -5.5 32.6 1.9 30.4 2.4 28.9 -0.7 34.0 -2.0 33.2 -0.6
May 31.7 0.0 37.3 8.4 31.4 -2.2 34.0 3.7 31.8 -3.9 30.9 -5.2 29.8 0.7 28.5 -0.7 34.1 0.0 32.8 -0.3
Jun 32.3 0.6 37.7 1.6 31.3 -2.5 35.6 5.6 34.1 -1.4 31.7 1.6 30.4 -1.0 29.1 6.2 34.3 -1.7 33.5 -0.3
Jul 30.3 -1.0 36.6 -5.4 30.5 -3.5 34.3 3.9 32.9 -5.5 18.1 8.4 28.7 -1.0 29.5 1.4 32.0 -4.5 31.6 -0.9
Aug 30.1 -0.3 36.7 -1.6 32.2 0.3 32.3 13.7 30.9 -8.0 18.7 14.0 27.2 -4.9 29.7 0.7 30.2 -5.0 31.4 -0.3
Sep 31.8 -1.5 37.2 -1.3 32.3 3.2 35.6 8.5 32.2 -11.3 32.0 -1.8 27.7 -8.3 29.1 1.4 33.9 -0.3 33.0 -1.8
Oct 29.1 0.3 32.7 -6.6 28.6 -0.7 31.7 12.4 30.7 -2.5 28.2 -2.4 26.0 -2.6 26.9 0.4 31.7 6.4 29.9 -1.0
Nov 28.8 2.9 33.6 -3.2 28.0 0.4 31.1 14.8 31.2 3.3 28.0 3.3 27.0 3.8 25.3 -4.2 30.4 10.1 29.6 1.7
Dec 31.4 -1.3 37.2 2.8 31.3 -1.3 33.4 4.4 33.0 -2.7 29.9 -4.2 30.4 0.3 25.4 -10.2 34.3 2.4 32.3 -2.7
2017 Jan 31.2 -1.3 35.2 -1.9 30.8 0.3 33.0 -7.6 33.5 -3.2 31.1 -1.9 30.3 2.4 26.4 1.1 34.3 -2.0 32.1 -2.1
Feb 30.8 -3.1 34.9 -0.3 30.0 -1.3 32.0 -6.4 33.2 -5.7 29.7 -7.2 29.7 -2.0 27.4 -3.5 33.7 -2.3 31.7 -3.9
Mar 29.8 1.0 34.2 1.8 29.6 0.3 32.7 1.2 32.8 -4.7 21.5 18.1 28.2 1.1 27.4 -2.1 34.1 0.6 31.3 1.3
Apr 28.4 -11.3 32.3 -10.8 28.2 -9.9 29.3 -17.5 30.4 -11.1 26.2 -19.6 27.0 -11.2 26.5 -8.3 30.5 -10.3 29.4 -11.4
May 31.2 -1.6 34.7 -7.0 29.3 -6.7 33.3 -2.1 33.3 4.7 30.6 -1.0 29.2 -2.0 29.6 3.9 33.9 -0.6 32.4 -1.2
Jun 31.8 -1.5 38.2 1.3 30.6 -2.2 32.8 -7.9 34.3 0.6 30.6 -3.5 29.2 -3.9 30.4 4.5 33.8 -1.5 33.1 -1.2
Jul 30.6 1.0 37.4 2.2 31.2 2.3 32.6 -5.0 32.9 0.0 20.0 10.5 27.7 -3.5 29.0 -1.7 34.7 8.4 31.9 0.9
Aug 29.2 -3.0 35.0 -4.6 31.2 -3.1 31.4 -2.8 31.2 1.0 15.6 -16.6 26.0 -4.4 30.0 1.0 32.5 7.6 30.8 -1.9
Sep 32.1 0.9 38.5 3.5 32.2 -0.3 32.8 -7.9 32.4 0.6 32.4 1.3 29.1 5.1 30.2 3.8 33.8 -0.3 33.2 0.6
Oct 29.4 1.0 34.3 4.9 30.6 7.0 30.3 -4.4 28.7 -6.5 27.1 -3.9 27.2 4.6 28.1 4.5 30.2 -4.7 30.5 2.0
Nov 31.0 7.6 36.7 9.2 32.1 14.6 32.4 4.2 33.2 6.4 29.3 4.6 28.6 5.9 27.3 7.9 34.9 14.8 32.1 8.4
Dec 31.6 0.6 38.4 3.2 33.0 5.4 32.1 -3.9 34.0 3.0 29.7 -0.7 29.6 -2.6 25.1 -1.2 33.6 -2.0 32.9 1.9
Average:
Jan-Dec16 30.9 35.8 30.6 33.8 32.9 27.7 28.8 27.9 33.2 32.0
Jan-Dec17 30.6 35.8 30.7 32.1 32.5 27.0 28.5 28.1 33.3 31.8
% Change -0.9 0.0 0.4 -5.2 -1.3 -2.5 -1.0 0.7 0.4 -0.7
* Average Actual Hours, All Workers, Main Job / Monthly percent changes are calculated as month over same month previous year
Prepared by: BC Stats Source: Statistics Canada Labour Force Survey
SERVICES SOCIAL ASSIST. FOOD SERV. ADMINISTRATION INDUSTRIES
% CHG % CHG
EDUCATIONAL HEALTH CARE & ACCOMMOD. & PUBLIC ALL
INDUSTRIES WAREHOUSING TRADE & RELATED & TECH SERVICES
ALL SERVICE TRANSPORT. RETAIL AND SELECTED BREAKOUT OF COMMUNITY & PERSONAL SERVICE TOTAL
PRODUCING AND WHOLESALE FINANCE PROFESS., SCIENT.
This is a monthly report designed to assist analysts monitoring changes in inter-provincial and inter-industrial earnings and employment levels. The report
provides figures on persons employed and actual dollars earned. Primary emphasis, however, is placed on the 'percentage change' data to help highlight
recent trends and/or structural shifts.
Definitions and Explanatory Notes
Average Hourly Wage Rate & Average Weekly Wage Rate
Beginning January 1997, information is collected on the usual wages or salary of employees at their main job.
Respondents are asked to report their wage/salary before taxes and other deductions, and include tips,
commissions and bonuses.
Average Weekly Hours Worked
Average actual number of hours worked per week, main job, is calculated by dividing total hours by the total
number of employed persons. When a respondent holds more than one job or business, the job or business
involving the greatest number of usual hours worked is considered to be the main job.
Constant Dollar or Real (after inflation) Average Weekly Wage Rate
Average weekly wage rates, as defined above, minus the rate of inflation as measured by the applicable
B.C. or Canada consumer price index.
Employment (derived from Labour Force Survey, Cat No. 71-001) (Actual)
All persons during the reference week who either a) did any work for pay or profit, or b) had a job but were
absent because of illness, weather, vacation, labour disputes, or personal or family responsibility.
Employment by Industry
Employment by industry is based on the North American Industrial Classification System (NAICS).
B.C. EARNINGS AND EMPLOYMENT TRENDS