Embed Size (px)
Citation preview
The views expressed in this paper do not necessarily reflect the views or policy of the International Energy Agency (IEA) Secretariat or of its individual member countries. The paper does not constitute advice on any specific issue or situation. The IEA makes no representation or warranty, express or implied, in respect of the paper’s content (including its completeness or accuracy) and shall not be responsible for any use of, or reliance on, the paper. Comments are welcome, directed to [email protected].
Early-stage venture capital for energy innovation
Financing models, trends and implications for policy
Peter Sopher

INTERNATIONAL ENERGY AGENCY
The International Energy Agency (IEA), an autonomous agency, was established in November 1974. Its primary mandate was – and is – two-fold: to promote energy security amongst its member
countries through collective response to physical disruptions in oil supply, and provide authoritative research and analysis on ways to ensure reliable, affordable and clean energy for its 29 member countries and beyond. The IEA carries out a comprehensive programme of energy co-operation among its member countries, each of which is obliged to hold oil stocks equivalent to 90 days of its net imports. The Agency’s aims include the following objectives:
n Secure member countries’ access to reliable and ample supplies of all forms of energy; in particular,through maintaining effective emergency response capabilities in case of oil supply disruptions.
n Promote sustainable energy policies that spur economic growth and environmental protectionin a global context – particularly in terms of reducing greenhouse-gas emissions that contributeto climate change.
n Improve transparency of international markets through collection and analysis ofenergy data.
n Support global collaboration on energy technology to secure future energy supplies and mitigate their environmental impact, including through improved energy
efficiency and development and deployment of low-carbon technologies.
n Find solutions to global energy challenges through engagement anddialogue with non-member countries, industry, international
organisations and other stakeholders.IEA member countries:
Australia Austria
Belgium Canada
Czech RepublicDenmark
EstoniaFinland
FranceGermany
GreeceHungary
Ireland Italy
JapanKoreaLuxembourgNetherlandsNew Zealand NorwayPolandPortugalSlovak RepublicSpainSweden
SwitzerlandTurkey
United KingdomUnited States
The European Commission also participates in
the work of the IEA.
© OECD/IEA, 2017 International Energy Agency
9 rue de la Fédération 75739 Paris Cedex 15, France
www.iea.org
Please note that this publication is subject to specific restrictions that limit its use and distribution.
The terms and conditions are available online at www.iea.org/t&c/
© OECD/IEA 2017 Early-stage venture capital for energy Financing models, trends and policy implications
Page | 1
Table of contents Acknowledgements ................................................................................................................. 2
Executive Summary ................................................................................................................. 3
Introduction ............................................................................................................................ 4
Importance of early-stage VC financing to the energy industry ............................................... 4
Overview of the traditional VC model ....................................................................................... 5
Macro trends in early-stage energy VC financing ..................................................................... 7
Methodology .......................................................................................................................... 8
Results .................................................................................................................................... 9
Discussion ............................................................................................................................. 10
Sectors and sub-sectors of the energy landscape ................................................................... 11
Digitalization: trends in software versus hardware................................................................. 12
Investor type ............................................................................................................................ 13
Policy implications ................................................................................................................... 14
References ............................................................................................................................ 16
Other sources that informed the analysis ............................................................................... 17
Annex 1: Data ........................................................................................................................ 18
Annex 2: Technical regression interpretation ......................................................................... 20
Annex 3: Location’s impact on company success .................................................................... 23
Annex 4: Limitations of this analysis ....................................................................................... 25
Acronyms, abbreviations and units of measure ...................................................................... 26
List of figures
Figure 1 • Early-stage energy sector VC trends for deal flow and investment, global and selected sectors .............................................................................................................................. 7
Figure 2 • Company status and mean/median exit valuation, by sector ....................................... 10 Figure 3a • Selected energy subsectors on the rise for early-stage VC .......................................... 11 Figure 3b • Selected energy subsectors on the decline for early-stage VC .................................... 11 Figure 4 • Average annual early-stage investment and deals, split by hardware and software
companies ...................................................................................................................... 12 Figure 5 • Deal status and mean/median exit valuation, by type of lead investor ........................ 13 Figure 6 • Total investment and number of companies and deals (2007-16), by sector ............... 18 Figure 7 • Total investment and number of deals (2007-16), by lead investor type ...................... 19 Figure 8 • Company status and mean/median exit valuation, by location .................................... 23 Figure 9 • Annual early-stage energy VC investment (2007-16), by geography ............................. 24
List of tables
Table 1 • Regressions summary: impact of deal and company features on company status .......... 9 Table 2 • Full regression results: impact of deal and company features on company status ........ 20
Early-stage venture capital for energy © OECD/IEA 2017 Financing models, trends and policy implications
Page | 2
Acknowledgements This paper was developed in the IEA Economics and Investments Office, headed by Laszlo Varro, IEA Chief Economist. Simon Bennett and Michael Waldron contributed guidance and input. The analysis was undertaken with the support the University of Pennsylvania’s Kleinman Center for Energy Policy during the author’s fellowship placement at the IEA.
The paper’s perspective was shaped by: Joseph Lipscomb (Arborview Capital LLC); Benjamin Gaddy and Ian Adams (Clean Energy Trust); Matthew Hantzmon (Hexagon Energy); Manvi Goel, Yann Manibog, Ndidi Obaji, Steve Rizoli, and William Saborio (The Wharton School); and Madhav Acharya, Michael Olsen, and Michelle Molloy (US Department of Energy ARPA-E). Valuable feedback was provided by Sankalp Gosain, Philip Sopher, Paige Sprague and Peter D. Wood.
Astrid Dumond and Katie Russell provided essential support in the publication of this paper.
Comments and questions on this report are welcome and should be addressed to [email protected].
© OECD/IEA 2017 Early-stage venture capital for energy Financing models, trends and policy implications
Page | 3
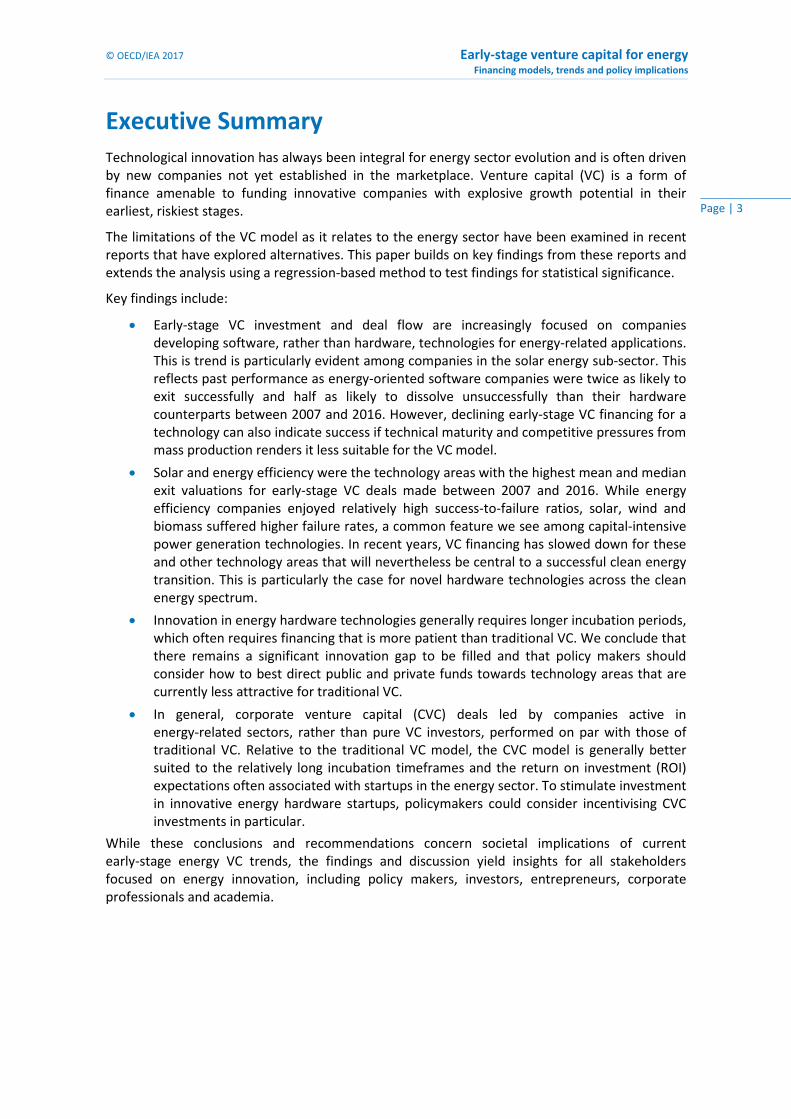
Executive Summary Technological innovation has always been integral for energy sector evolution and is often driven by new companies not yet established in the marketplace. Venture capital (VC) is a form of finance amenable to funding innovative companies with explosive growth potential in their earliest, riskiest stages.
The limitations of the VC model as it relates to the energy sector have been examined in recent reports that have explored alternatives. This paper builds on key findings from these reports and extends the analysis using a regression-based method to test findings for statistical significance.
Key findings include:
• Early-stage VC investment and deal flow are increasingly focused on companies developing software, rather than hardware, technologies for energy-related applications. This is trend is particularly evident among companies in the solar energy sub-sector. This reflects past performance as energy-oriented software companies were twice as likely to exit successfully and half as likely to dissolve unsuccessfully than their hardware counterparts between 2007 and 2016. However, declining early-stage VC financing for a technology can also indicate success if technical maturity and competitive pressures from mass production renders it less suitable for the VC model.
• Solar and energy efficiency were the technology areas with the highest mean and median exit valuations for early-stage VC deals made between 2007 and 2016. While energy efficiency companies enjoyed relatively high success-to-failure ratios, solar, wind and biomass suffered higher failure rates, a common feature we see among capital-intensive power generation technologies. In recent years, VC financing has slowed down for these and other technology areas that will nevertheless be central to a successful clean energy transition. This is particularly the case for novel hardware technologies across the clean energy spectrum.
• Innovation in energy hardware technologies generally requires longer incubation periods, which often requires financing that is more patient than traditional VC. We conclude that there remains a significant innovation gap to be filled and that policy makers should consider how to best direct public and private funds towards technology areas that are currently less attractive for traditional VC.
• In general, corporate venture capital (CVC) deals led by companies active in energy-related sectors, rather than pure VC investors, performed on par with those of traditional VC. Relative to the traditional VC model, the CVC model is generally better suited to the relatively long incubation timeframes and the return on investment (ROI) expectations often associated with startups in the energy sector. To stimulate investment in innovative energy hardware startups, policymakers could consider incentivising CVC investments in particular.
While these conclusions and recommendations concern societal implications of current early-stage energy VC trends, the findings and discussion yield insights for all stakeholders focused on energy innovation, including policy makers, investors, entrepreneurs, corporate professionals and academia.
Early-stage venture capital for energy © OECD/IEA 2017 Financing models, trends and policy implications
Page | 4
Introduction Technological innovation has always been a key driver of energy sector evolution (IEA, 2017a). As communities around the world increasingly embrace shared policy objectives that pursue new models for energy supply and demand – including affordable access to power in the world’s poorest regions and climate change mitigation – the energy sector will raise its reliance on innovation that can drive transformative change.
This report explores recent trends in early-stage venture capital (VC) financing for energy innovation. It considers the sectors in which startup1 companies have been most successful in attracting funds and achieving satisfactory returns to investors, and how these have changed over time. The work builds on other recent reports that have examined the limitations of the VC model as it relates to the energy sector and explored alternatives (Gaddy et al., 2016; Saha and Muro, 2017). Our approach differs in methodology and scope by using a regression-based method to test findings for statistical significance.
The findings and discussion are framed to provide insights for all stakeholders focused on energy innovation, including policymakers, investors, entrepreneurs, corporate professionals and academia.
The report summarises the role of VC funding in energy innovation and how VC funding typically operates. The following section introduces the methodology and then the results are presented in three areas: sectoral and sub-sectoral trends; comparative performance of software and hardware companies; and trends in terms of investor type. Two of the key findings are a clear trend towards companies with software-based technologies and the potential advantages of corporate venture capital (CVC) over traditional VC funds for the financing of capital-intensive and longer-development energy technologies. We follow those sections with a discussion of the policy relevance of the results. Annexes include a description of our dataset,2 a technical interpretation of our regression results, and a summary of this paper’s limitations.
Importance of early-stage VC financing to the energy industry
Alongside other forms of research, development and demonstration (RD&D) funding from governments and the private sector, startups play a key role in taking innovative ideas to their first commercial stages.3 This is in part because new companies are less encumbered by customer retention, labour relations, shareholder expectations and other factors that make it hard to deviate radically from the status quo, making them more innovative in general (Henderson, 2006).
For companies in their earliest stages of commercialising innovative new technologies, access to capital is vital. The early-stage VC model features a higher risk appetite than most other, well-established financing models. But while early-stage VC funds4 stand out for their willingness
1 We define a “startup” as a newly established, private business determined to grow quickly and usually in need of investor financing to facilitate such growth. 2 Notably, a strength of this report is our dataset’s level of precision, resulting from company-by-company research on company’ status (exited, possibly exited, dissolved, or likely active) as of June 2017. 3 These innovative ideas often arise from other sources of RD&D finance, such as public funding for basic research, showing the symbiotic nature of different sources of public and private finance for innovation. 4 A VC fund is an investment vehicle, usually a limited liability business entity, that pools capital from third-party investors and allocates it among to enterprises that are considered too risky for the standard capital markets or bank loans. Investors in VC funds are typically very large institutions such as pension funds, financial firms, insurance companies, and university endowments. These investments represent such a tiny part of the institutional investor’s portfolio, which give VC fund managers considerable latitude in pursuing their strategies (Zider, 1998).
© OECD/IEA 2017 Early-stage venture capital for energy Financing models, trends and policy implications
Page | 5
to invest millions of dollars to fund high potential yet unproven ideas, VC funds’ risk-taking is balanced by deal terms that are usually far more expensive to entrepreneurs than other sources of funds. Historically, many types of energy startups have featured low internal cash flows and limited access to more risk-averse, entrepreneur-friendly sources of funds, such as debt finance, so they have needed VC funding to get themselves launched (Saha and Muro, 2017). The VC model is structured to identify startups with explosive growth potential, i.e. companies with innovative value propositions that are potentially disruptive, and thus further promotes innovation. By contrast, startups with less innovative ideas tend be less risky propositions and are more successful at raising funds from diverse sources that are less expensive than VC financing.
The preference of VC funds for startups with higher disruptive potential is observed in the data, as VC financing provides a much larger share of innovation spending for clean energy technologies than for other types of energy. Based on a bottom-up estimation of RD&D spending, early-stage clean energy VC financing was USD 3 billion (nominal United States dollar) in 2016 and represented about 40% of global clean energy corporate R&D spending and 11% of total clean energy RD&D spending including public funding (IEA, 2017b).5 In contrast, early-stage VC financing for conventional fuels, at about USD 65 million, amounted to the equivalent of less than 0.2% of corporate R&D spending in this area (IEA, 2017a).
Early-stage VC represents an important but not critical link in the innovation chain. While it has enabled the launch of many innovative companies, others have succeeded without VC funding and for mature sectors like oil and gas, corporate R&D is a more common financer of innovation. Public finance can also support risky companies and can apply public-interest criteria. It might therefore prioritise societally beneficial technologies that are a decade away from viability above the near-term revenue needs of VCs and private finance, or seek to cultivate a local entrepreneurial culture. For example, the United States Department of Energy’s Advanced Research Project Agency (ARPA-E) defines its mission as advancing “high-potential, high-impact energy technologies that are too early for private-sector investment” (US DOE, 2017). Start-Up Chile is a public startup accelerator that provides entrepreneurs with favourable early-stage financing deals with the goal of establishing a vibrant Chilean startup ecosystem. Mission Innovation is an example of a multi-government push for key clean energy innovations that highlights the role of public financing (Mission Innovation, 2017). Nevertheless, we believe that an effective VC financing model for clean energy technologies, whether supported by public policy or not, can play an efficient role in taking novel ideas from the lab to the marketplace and it is important for policy makers to analyse and understand VC trends and outcomes.
Overview of the traditional VC model
The VC model is a portfolio approach, targeting an average rate of return across the portfolio in a specific timeframe. VC funds typically operate with ten-year time horizons. The first few years entail vetting and investing in potential portfolio companies, and during the remainder of the fund’s lifespan VC firms facilitate their companies’ success. The desired time horizon for investments is about five years and, as track record disproportionately determines a VC fund’s ability to raise future funds, they aim to earn high returns on investment (ROI) of over 20% annually (Zider, 1998). Investors earn a gross value multiple – or ROI to all of a fund’s
5 This compares VC investments in clean energy technology areas with research and development (R&D) spending by companies (including subsidiaries) that are active in those technology areas. The comparison is imprecise because companies may not allocate R&D spending in accordance with revenues from each technology area, but we believe it is an informative first order approximation. It is also possible that the comparison underplays the role of VC financing because not all corporate R&D spending focuses on innovation – companies might use R&D funds to develop capabilities competitors already possess – and corporate R&D departments generally complement the company’s core values and do not seek to disrupt them.
Early-stage venture capital for energy © OECD/IEA 2017 Financing models, trends and policy implications
Page | 6
stakeholders6 – of zero for about 50% of early-stage VC deals and less than one for about 75% of such investments; and, they earn multiples of greater than 5x and 10x on 12% and 6% of investments, respectively (Metrick and Yasuda, 2011). Over 60% of a firm’s value comes from investments that return greater than 10x multiples, and over 70% of value comes from investments returning multiples of greater than 5x (Ghosh and Namada, 2010). Diversification is therefore integral to the VC model; a typical fund makes 10-20 investments hoping that one or two will deliver wild success and a few others will succeed moderately (Zider, 1998).
The main goal of a traditional early-stage energy VC fund manager is to identify startup companies with high potential for generating ROI of greater than 10x through an exit7 within five years. We define early-stage investments as comprising seed, Series A and Series B.8 These are the investment rounds at which startups are at their riskiest and have their most difficulty attracting less expensive, more entrepreneurially friendly sources of finance. Examples of successful investments are DBL Investors’ 2013 leadership in a USD 7.1 million Series A round and SJF Ventures’ 2015 leadership in a USD 25 million Series B round financing of NEXTracker, a California-based solar company. NEXTracker sold itself to Flextronics International in September 2015 for USD 330 million after having raised a total of USD 47.6 million in equity financing (Crunchbase, 2017; Cleantech Group, 2017). In these cases, investors likely earned around a 6x multiple from their deals.
A corporate VC (CVC) fund operates slightly differently. As it involves a more reliable source of funds from parent companies that often have multi-billion dollar balance sheets, CVC funds are generally less nervous than traditional VC funds about devoting tens or hundreds of millions of dollars to long-term, illiquid investments. As such, the CVC model is less reliant on 10-year fund structures and five-year investment time horizons. Furthermore, as a CVC fund’s lifecycle usually does not entail external fundraising, CVC fund managers’ reputations and their abilities to raise future funds are less dependent on annual ROIs that dwarf market return rates. In fact, ROI is only one motivator for CVC. A second motivator is developing close relationships with potential acquisition targets. A third is gaining insight into emerging sectors. Moreover, the goal for many CVC funds is to diversify the company’s R&D methods and shield a portion of R&D budgets from internal bureaucracy. An example of a successful CVC investment that took slightly longer than five years to exit was Qualcomm Ventures’ leadership in a 2009 seed round of USD 250 000 in the Israeli energy efficiency company Panoramic Power. After having raised USD 19.5 million, Panoramic Power sold itself for USD 60 million to Direct Energy in November 2015, meaning investors likely earned around a 3x return. In addition, an example of a parent company buying a CVC portfolio company is General Electric’s 2016 USD 153 million acquisition of Canadian-based utility smart grid analytics provider, Bit Stew Systems, following a 2015 Series B financing round for the company that was led by GE Ventures (Crunchbase, 2017; Cleantech Group, 2017).
Another variation on the traditional VC model is private impact investments, which are increasingly targeting clean energy startups. The Breakthrough Energy Coalition is an idea proposed by influential, high net worth individuals, including Bill Gates, Jeff Bezos, and Michael Bloomberg in late 2015 with a mission of deploying patient capital in new energy companies (Breakthrough Energy, 2017). Traditional style VC-type funds with explicit missions for energy-oriented impact include UK-based Bridges Ventures and California-based Obvious Ventures, as well as family offices such as Massachusetts-based Blue Haven Initiative and Colorado-based Zoma Capital. However, although social impact is emphasised in these funds’ due
6 These usually comprise General Partners who are investors with management control of a fund’s daily operations and Limited Partners who are investors that do not actively manage fund operations. 7 As expressed in the Data Annex, we define an “exit” as an acquisition by a larger company or an Initial Public Offering (IPO). 8 The riskiest investments are “seed,” as these tend to be ideas that entrepreneurs can sell as promising. To receive Series A and Series B funds, startups must demonstrate positive traction, and Series B is more advanced than Series A.
© OECD/IEA 2017 Early-stage venture capital for energy Financing models, trends and policy implications
Page | 7
diligence when considering prospective investments, the returns they seek are comparable to traditional VC funds. By contrast, other impact investing funds, such as Acumen, are more oriented towards making impactful investments few others would make, even if it means sacrificing returns.
Macro trends in early-stage energy VC financing
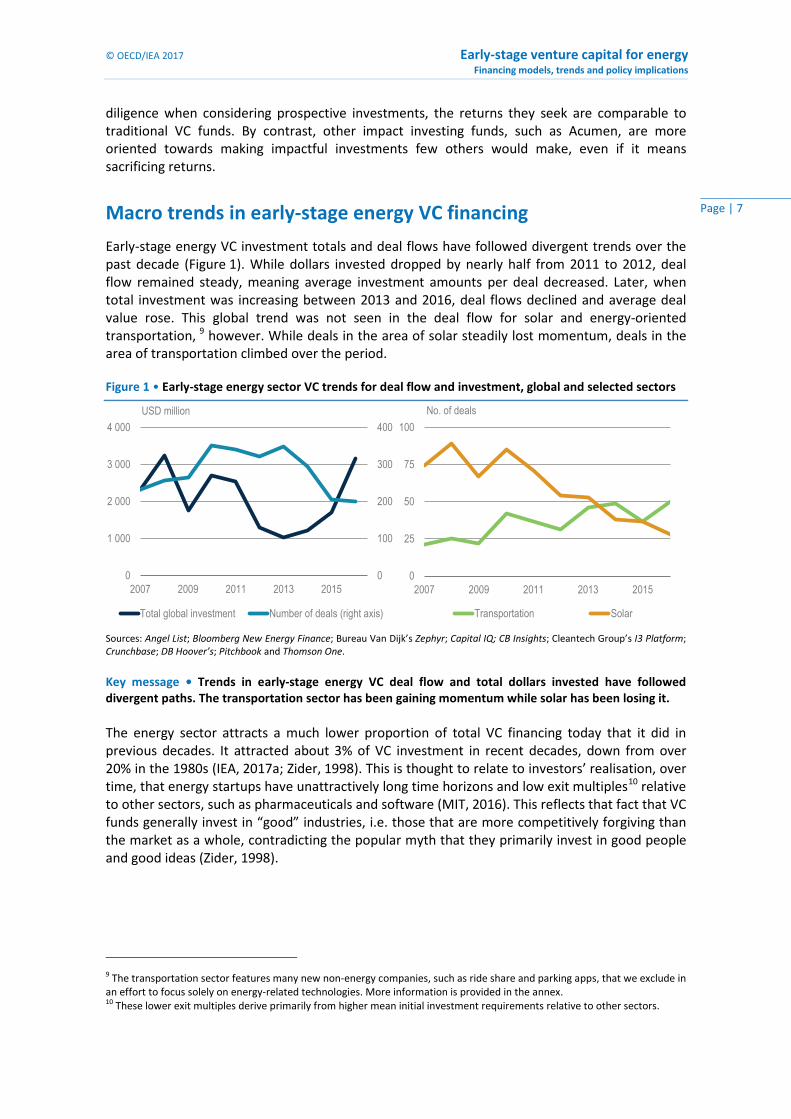
Early-stage energy VC investment totals and deal flows have followed divergent trends over the past decade (Figure 1). While dollars invested dropped by nearly half from 2011 to 2012, deal flow remained steady, meaning average investment amounts per deal decreased. Later, when total investment was increasing between 2013 and 2016, deal flows declined and average deal value rose. This global trend was not seen in the deal flow for solar and energy-oriented transportation, 9 however. While deals in the area of solar steadily lost momentum, deals in the area of transportation climbed over the period.
Figure 1 • Early-stage energy sector VC trends for deal flow and investment, global and selected sectors
Sources: Angel List; Bloomberg New Energy Finance; Bureau Van Dijk’s Zephyr; Capital IQ; CB Insights; Cleantech Group’s I3 Platform; Crunchbase; DB Hoover’s; Pitchbook and Thomson One.
Key message • Trends in early-stage energy VC deal flow and total dollars invested have followed divergent paths. The transportation sector has been gaining momentum while solar has been losing it. The energy sector attracts a much lower proportion of total VC financing today that it did in previous decades. It attracted about 3% of VC investment in recent decades, down from over 20% in the 1980s (IEA, 2017a; Zider, 1998). This is thought to relate to investors’ realisation, over time, that energy startups have unattractively long time horizons and low exit multiples10 relative to other sectors, such as pharmaceuticals and software (MIT, 2016). This reflects that fact that VC funds generally invest in “good” industries, i.e. those that are more competitively forgiving than the market as a whole, contradicting the popular myth that they primarily invest in good people and good ideas (Zider, 1998).
9 The transportation sector features many new non-energy companies, such as ride share and parking apps, that we exclude in an effort to focus solely on energy-related technologies. More information is provided in the annex. 10 These lower exit multiples derive primarily from higher mean initial investment requirements relative to other sectors.
0
100
200
300
400
0
1 000
2 000
3 000
4 000
2007 2009 2011 2013 2015
USD million
Total global investment Number of deals (right axis)
0
25
50
75
100
2007 2009 2011 2013 2015
No. of deals
Transportation Solar
Early-stage venture capital for energy © OECD/IEA 2017 Financing models, trends and policy implications
Page | 8
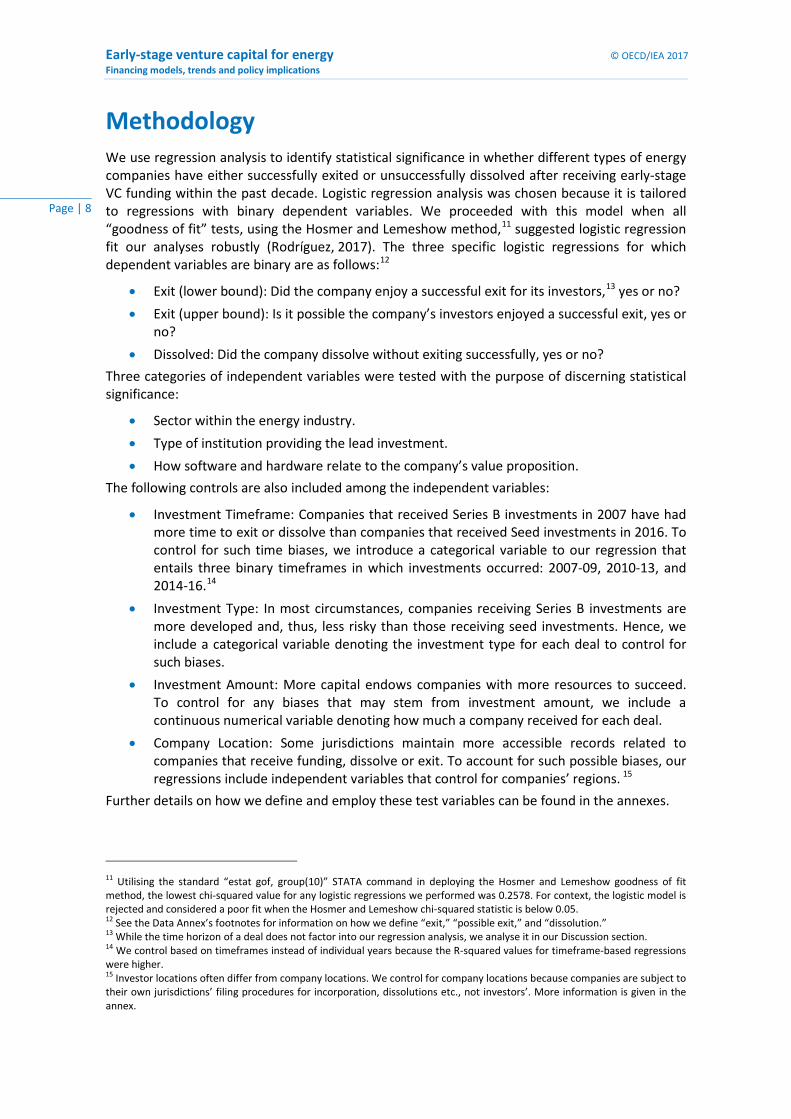
Methodology We use regression analysis to identify statistical significance in whether different types of energy companies have either successfully exited or unsuccessfully dissolved after receiving early-stage VC funding within the past decade. Logistic regression analysis was chosen because it is tailored to regressions with binary dependent variables. We proceeded with this model when all “goodness of fit” tests, using the Hosmer and Lemeshow method,11 suggested logistic regression fit our analyses robustly (Rodríguez, 2017). The three specific logistic regressions for which dependent variables are binary are as follows:12
• Exit (lower bound): Did the company enjoy a successful exit for its investors,13 yes or no?
• Exit (upper bound): Is it possible the company’s investors enjoyed a successful exit, yes or no?
• Dissolved: Did the company dissolve without exiting successfully, yes or no?
Three categories of independent variables were tested with the purpose of discerning statistical significance:
• Sector within the energy industry.
• Type of institution providing the lead investment.
• How software and hardware relate to the company’s value proposition.
The following controls are also included among the independent variables:
• Investment Timeframe: Companies that received Series B investments in 2007 have had more time to exit or dissolve than companies that received Seed investments in 2016. To control for such time biases, we introduce a categorical variable to our regression that entails three binary timeframes in which investments occurred: 2007-09, 2010-13, and 2014-16.14
• Investment Type: In most circumstances, companies receiving Series B investments are more developed and, thus, less risky than those receiving seed investments. Hence, we include a categorical variable denoting the investment type for each deal to control for such biases.
• Investment Amount: More capital endows companies with more resources to succeed. To control for any biases that may stem from investment amount, we include a continuous numerical variable denoting how much a company received for each deal.
• Company Location: Some jurisdictions maintain more accessible records related to companies that receive funding, dissolve or exit. To account for such possible biases, our regressions include independent variables that control for companies’ regions. 15
Further details on how we define and employ these test variables can be found in the annexes.
11 Utilising the standard “estat gof, group(10)” STATA command in deploying the Hosmer and Lemeshow goodness of fit method, the lowest chi-squared value for any logistic regressions we performed was 0.2578. For context, the logistic model is rejected and considered a poor fit when the Hosmer and Lemeshow chi-squared statistic is below 0.05. 12 See the Data Annex’s footnotes for information on how we define “exit,” “possible exit,” and “dissolution.” 13 While the time horizon of a deal does not factor into our regression analysis, we analyse it in our Discussion section. 14 We control based on timeframes instead of individual years because the R-squared values for timeframe-based regressions were higher. 15 Investor locations often differ from company locations. We control for company locations because companies are subject to their own jurisdictions’ filing procedures for incorporation, dissolutions etc., not investors’. More information is given in the annex.
© OECD/IEA 2017 Early-stage venture capital for energy Financing models, trends and policy implications
Page | 9
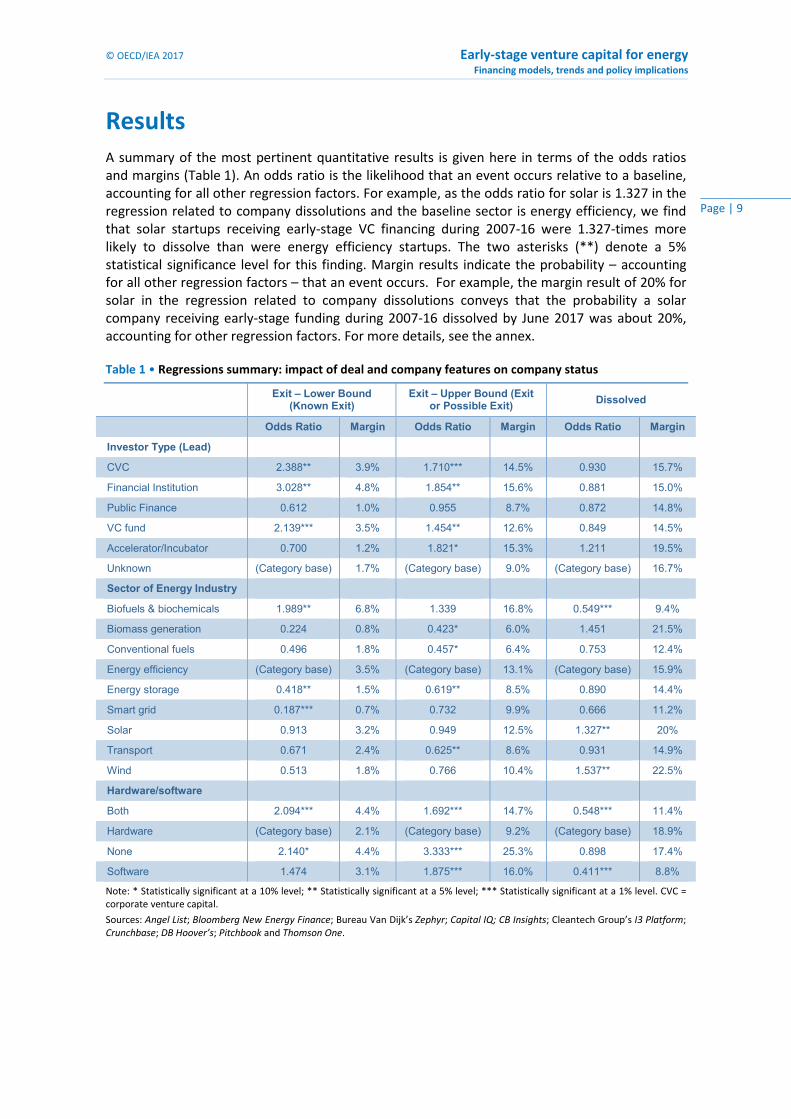
Results A summary of the most pertinent quantitative results is given here in terms of the odds ratios and margins (Table 1). An odds ratio is the likelihood that an event occurs relative to a baseline, accounting for all other regression factors. For example, as the odds ratio for solar is 1.327 in the regression related to company dissolutions and the baseline sector is energy efficiency, we find that solar startups receiving early-stage VC financing during 2007-16 were 1.327-times more likely to dissolve than were energy efficiency startups. The two asterisks (**) denote a 5% statistical significance level for this finding. Margin results indicate the probability – accounting for all other regression factors – that an event occurs. For example, the margin result of 20% for solar in the regression related to company dissolutions conveys that the probability a solar company receiving early-stage funding during 2007-16 dissolved by June 2017 was about 20%, accounting for other regression factors. For more details, see the annex.
Table 1 • Regressions summary: impact of deal and company features on company status
Exit – Lower Bound
(Known Exit) Exit – Upper Bound (Exit
or Possible Exit) Dissolved
Odds Ratio Margin Odds Ratio Margin Odds Ratio Margin
Investor Type (Lead)
CVC 2.388** 3.9% 1.710*** 14.5% 0.930 15.7%
Financial Institution 3.028** 4.8% 1.854** 15.6% 0.881 15.0%
Public Finance 0.612 1.0% 0.955 8.7% 0.872 14.8%
VC fund 2.139*** 3.5% 1.454** 12.6% 0.849 14.5%
Accelerator/Incubator 0.700 1.2% 1.821* 15.3% 1.211 19.5%
Unknown (Category base) 1.7% (Category base) 9.0% (Category base) 16.7%
Sector of Energy Industry
Biofuels & biochemicals 1.989** 6.8% 1.339 16.8% 0.549*** 9.4%
Biomass generation 0.224 0.8% 0.423* 6.0% 1.451 21.5%
Conventional fuels 0.496 1.8% 0.457* 6.4% 0.753 12.4%
Energy efficiency (Category base) 3.5% (Category base) 13.1% (Category base) 15.9%
Energy storage 0.418** 1.5% 0.619** 8.5% 0.890 14.4%
Smart grid 0.187*** 0.7% 0.732 9.9% 0.666 11.2%
Solar 0.913 3.2% 0.949 12.5% 1.327** 20%
Transport 0.671 2.4% 0.625** 8.6% 0.931 14.9%
Wind 0.513 1.8% 0.766 10.4% 1.537** 22.5%
Hardware/software
Both 2.094*** 4.4% 1.692*** 14.7% 0.548*** 11.4%
Hardware (Category base) 2.1% (Category base) 9.2% (Category base) 18.9%
None 2.140* 4.4% 3.333*** 25.3% 0.898 17.4%
Software 1.474 3.1% 1.875*** 16.0% 0.411*** 8.8%
Note: * Statistically significant at a 10% level; ** Statistically significant at a 5% level; *** Statistically significant at a 1% level. CVC = corporate venture capital.
Sources: Angel List; Bloomberg New Energy Finance; Bureau Van Dijk’s Zephyr; Capital IQ; CB Insights; Cleantech Group’s I3 Platform; Crunchbase; DB Hoover’s; Pitchbook and Thomson One.
Early-stage venture capital for energy © OECD/IEA 2017 Financing models, trends and policy implications
Page | 10
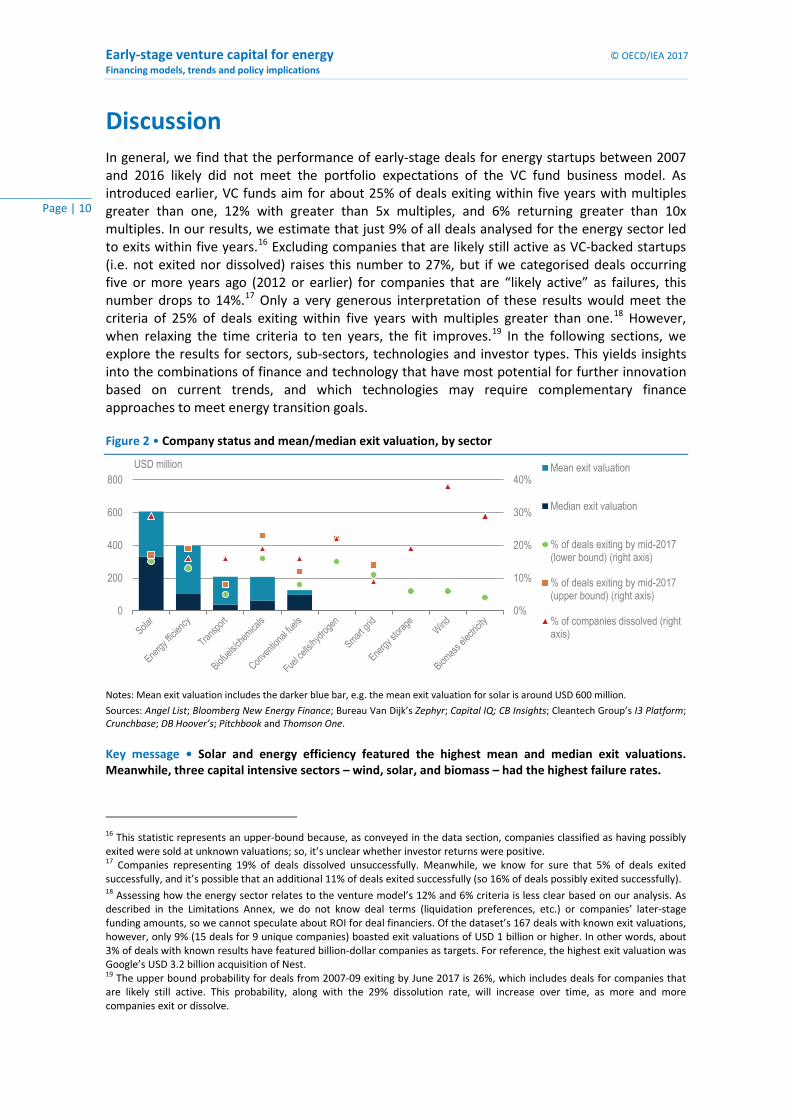
Discussion In general, we find that the performance of early-stage deals for energy startups between 2007 and 2016 likely did not meet the portfolio expectations of the VC fund business model. As introduced earlier, VC funds aim for about 25% of deals exiting within five years with multiples greater than one, 12% with greater than 5x multiples, and 6% returning greater than 10x multiples. In our results, we estimate that just 9% of all deals analysed for the energy sector led to exits within five years.16 Excluding companies that are likely still active as VC-backed startups (i.e. not exited nor dissolved) raises this number to 27%, but if we categorised deals occurring five or more years ago (2012 or earlier) for companies that are “likely active” as failures, this number drops to 14%.17 Only a very generous interpretation of these results would meet the criteria of 25% of deals exiting within five years with multiples greater than one.18 However, when relaxing the time criteria to ten years, the fit improves.19 In the following sections, we explore the results for sectors, sub-sectors, technologies and investor types. This yields insights into the combinations of finance and technology that have most potential for further innovation based on current trends, and which technologies may require complementary finance approaches to meet energy transition goals.
Figure 2 • Company status and mean/median exit valuation, by sector
Notes: Mean exit valuation includes the darker blue bar, e.g. the mean exit valuation for solar is around USD 600 million.
Sources: Angel List; Bloomberg New Energy Finance; Bureau Van Dijk’s Zephyr; Capital IQ; CB Insights; Cleantech Group’s I3 Platform; Crunchbase; DB Hoover’s; Pitchbook and Thomson One.
Key message • Solar and energy efficiency featured the highest mean and median exit valuations. Meanwhile, three capital intensive sectors – wind, solar, and biomass – had the highest failure rates.
16 This statistic represents an upper-bound because, as conveyed in the data section, companies classified as having possibly exited were sold at unknown valuations; so, it’s unclear whether investor returns were positive. 17 Companies representing 19% of deals dissolved unsuccessfully. Meanwhile, we know for sure that 5% of deals exited successfully, and it’s possible that an additional 11% of deals exited successfully (so 16% of deals possibly exited successfully). 18 Assessing how the energy sector relates to the venture model’s 12% and 6% criteria is less clear based on our analysis. As described in the Limitations Annex, we do not know deal terms (liquidation preferences, etc.) or companies’ later-stage funding amounts, so we cannot speculate about ROI for deal financiers. Of the dataset’s 167 deals with known exit valuations, however, only 9% (15 deals for 9 unique companies) boasted exit valuations of USD 1 billion or higher. In other words, about 3% of deals with known results have featured billion-dollar companies as targets. For reference, the highest exit valuation was Google’s USD 3.2 billion acquisition of Nest. 19 The upper bound probability for deals from 2007-09 exiting by June 2017 is 26%, which includes deals for companies that are likely still active. This probability, along with the 29% dissolution rate, will increase over time, as more and more companies exit or dissolve.
0%
10%
20%
30%
40%
0
200
400
600
800USD million Mean exit valuation
Median exit valuation
% of deals exiting by mid-2017(lower bound) (right axis)
% of deals exiting by mid-2017(upper bound) (right axis)
% of companies dissolved (rightaxis)
© OECD/IEA 2017 Early-stage venture capital for energy Financing models, trends and policy implications
Page | 11
Sectors and sub-sectors of the energy landscape
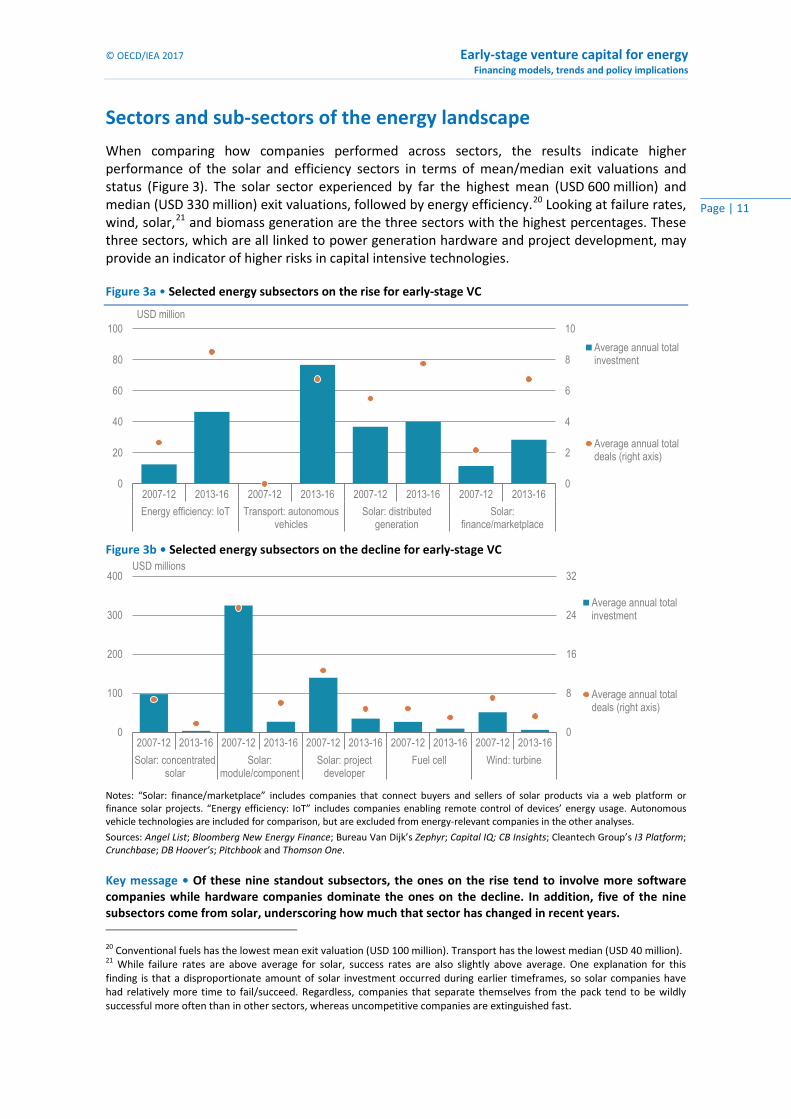
When comparing how companies performed across sectors, the results indicate higher performance of the solar and efficiency sectors in terms of mean/median exit valuations and status (Figure 3). The solar sector experienced by far the highest mean (USD 600 million) and median (USD 330 million) exit valuations, followed by energy efficiency.20 Looking at failure rates, wind, solar,21 and biomass generation are the three sectors with the highest percentages. These three sectors, which are all linked to power generation hardware and project development, may provide an indicator of higher risks in capital intensive technologies.
Figure 3a • Selected energy subsectors on the rise for early-stage VC
Figure 3b • Selected energy subsectors on the decline for early-stage VC
Notes: “Solar: finance/marketplace” includes companies that connect buyers and sellers of solar products via a web platform or finance solar projects. “Energy efficiency: IoT” includes companies enabling remote control of devices’ energy usage. Autonomous vehicle technologies are included for comparison, but are excluded from energy-relevant companies in the other analyses.
Sources: Angel List; Bloomberg New Energy Finance; Bureau Van Dijk’s Zephyr; Capital IQ; CB Insights; Cleantech Group’s I3 Platform; Crunchbase; DB Hoover’s; Pitchbook and Thomson One.
Key message • Of these nine standout subsectors, the ones on the rise tend to involve more software companies while hardware companies dominate the ones on the decline. In addition, five of the nine subsectors come from solar, underscoring how much that sector has changed in recent years.
20 Conventional fuels has the lowest mean exit valuation (USD 100 million). Transport has the lowest median (USD 40 million). 21 While failure rates are above average for solar, success rates are also slightly above average. One explanation for this finding is that a disproportionate amount of solar investment occurred during earlier timeframes, so solar companies have had relatively more time to fail/succeed. Regardless, companies that separate themselves from the pack tend to be wildly successful more often than in other sectors, whereas uncompetitive companies are extinguished fast.
0
2
4
6
8
10
0
20
40
60
80
100
2007-12 2013-16 2007-12 2013-16 2007-12 2013-16 2007-12 2013-16Energy efficiency: IoT Transport: autonomous
vehiclesSolar: distributed
generationSolar:
finance/marketplace
USD million
Average annual totalinvestment
Average annual totaldeals (right axis)
0
8
16
24
32
0
100
200
300
400
2007-12 2013-16 2007-12 2013-16 2007-12 2013-16 2007-12 2013-16 2007-12 2013-16Solar: concentrated
solarSolar:
module/componentSolar: project
developerFuel cell Wind: turbine
USD millions
Average annual totalinvestment
Average annual totaldeals (right axis)
Early-stage venture capital for energy © OECD/IEA 2017 Financing models, trends and policy implications
Page | 12
Of these nine standout subsectors, five come from the solar sector. This indicates an enduring perception that solar has a bright future, but the sub-sectoral composition has changed considerably over the period of study. Solar project development and solar modules and components (panels, materials, cells, inverters, and wafers) have now successfully matured such that: (a) early-stage companies can more easily raise funds that are less expensive than VC financing; and, (b) opportunities for radical new companies to quickly become giants have dwindled. By contrast, the decline for concentrated solar power is likely related to the market growth being below earlier expectations. Solar sub-sectors that have been on the rise in recent years include distributed generation companies, such as those powering cell phones, lights, etc. in the developing world, and software-based marketplaces connecting solar power producers and buyers.
Digitalization: trends in software versus hardware
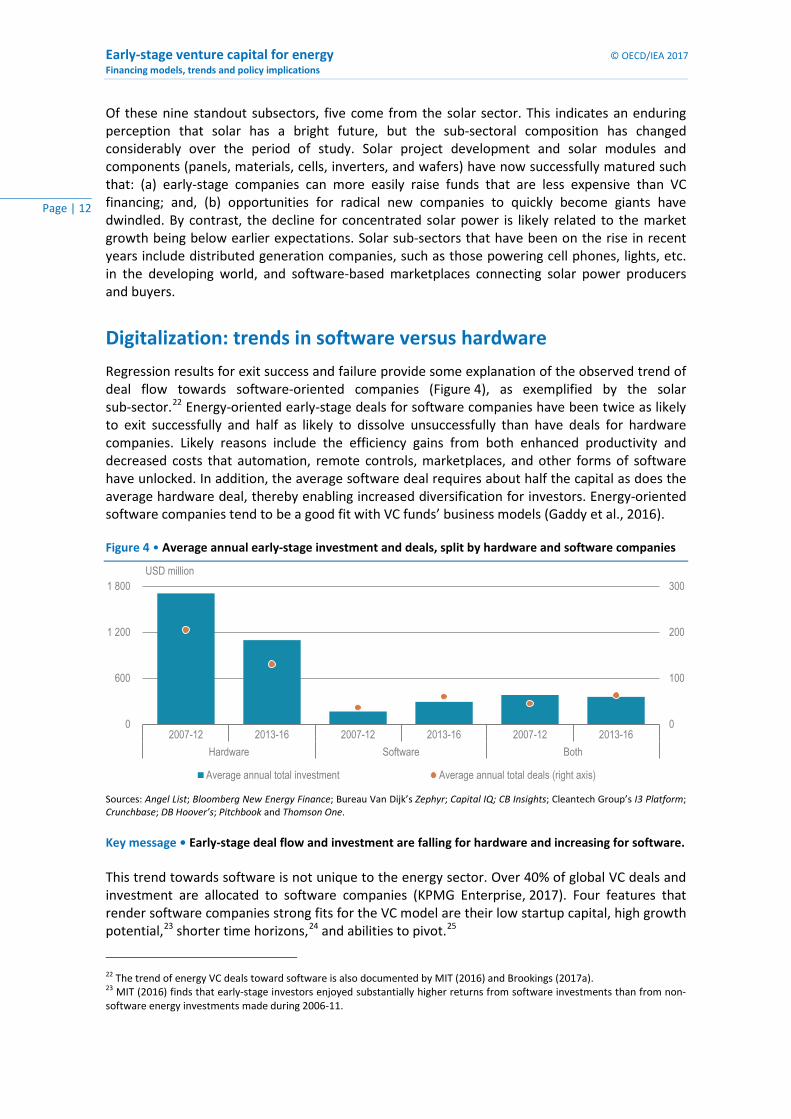
Regression results for exit success and failure provide some explanation of the observed trend of deal flow towards software-oriented companies (Figure 4), as exemplified by the solar sub-sector.22 Energy-oriented early-stage deals for software companies have been twice as likely to exit successfully and half as likely to dissolve unsuccessfully than have deals for hardware companies. Likely reasons include the efficiency gains from both enhanced productivity and decreased costs that automation, remote controls, marketplaces, and other forms of software have unlocked. In addition, the average software deal requires about half the capital as does the average hardware deal, thereby enabling increased diversification for investors. Energy-oriented software companies tend to be a good fit with VC funds’ business models (Gaddy et al., 2016).
Figure 4 • Average annual early-stage investment and deals, split by hardware and software companies
Sources: Angel List; Bloomberg New Energy Finance; Bureau Van Dijk’s Zephyr; Capital IQ; CB Insights; Cleantech Group’s I3 Platform; Crunchbase; DB Hoover’s; Pitchbook and Thomson One.
Key message • Early-stage deal flow and investment are falling for hardware and increasing for software. This trend towards software is not unique to the energy sector. Over 40% of global VC deals and investment are allocated to software companies (KPMG Enterprise, 2017). Four features that render software companies strong fits for the VC model are their low startup capital, high growth potential,23 shorter time horizons,24 and abilities to pivot.25
22 The trend of energy VC deals toward software is also documented by MIT (2016) and Brookings (2017a). 23 MIT (2016) finds that early-stage investors enjoyed substantially higher returns from software investments than from non-software energy investments made during 2006-11.
0
100
200
300
0
600
1 200
1 800
2007-12 2013-16 2007-12 2013-16 2007-12 2013-16Hardware Software Both
USD million
Average annual total investment Average annual total deals (right axis)
© OECD/IEA 2017 Early-stage venture capital for energy Financing models, trends and policy implications
Page | 13
This trend is of concern from a societal perspective. A great deal of progress with energy hardware is essential for enabling a global transition to clean energy, yet allocation of VC financing to ‘deep technology’ companies, whose innovations will be vital to the energy transition, appears to have stalled (Brookings, 2017a). As these sub-sectors have previously relied on VC funding, especially in the United States, there is a possible negative feedback signalling to entrepreneurs that their efforts are not needed or valued. This gap in private sector activity can potentially be filled by governments via direct support for bringing promising, innovative, energy technology hardware ideas to market, by government policy to encourage VC fund activity in socially desirable technologies, or by other types of private sector actors. Other private sector actors might include strategic VC investors backed by corporations and governments, as explored in the next section.
Investor type
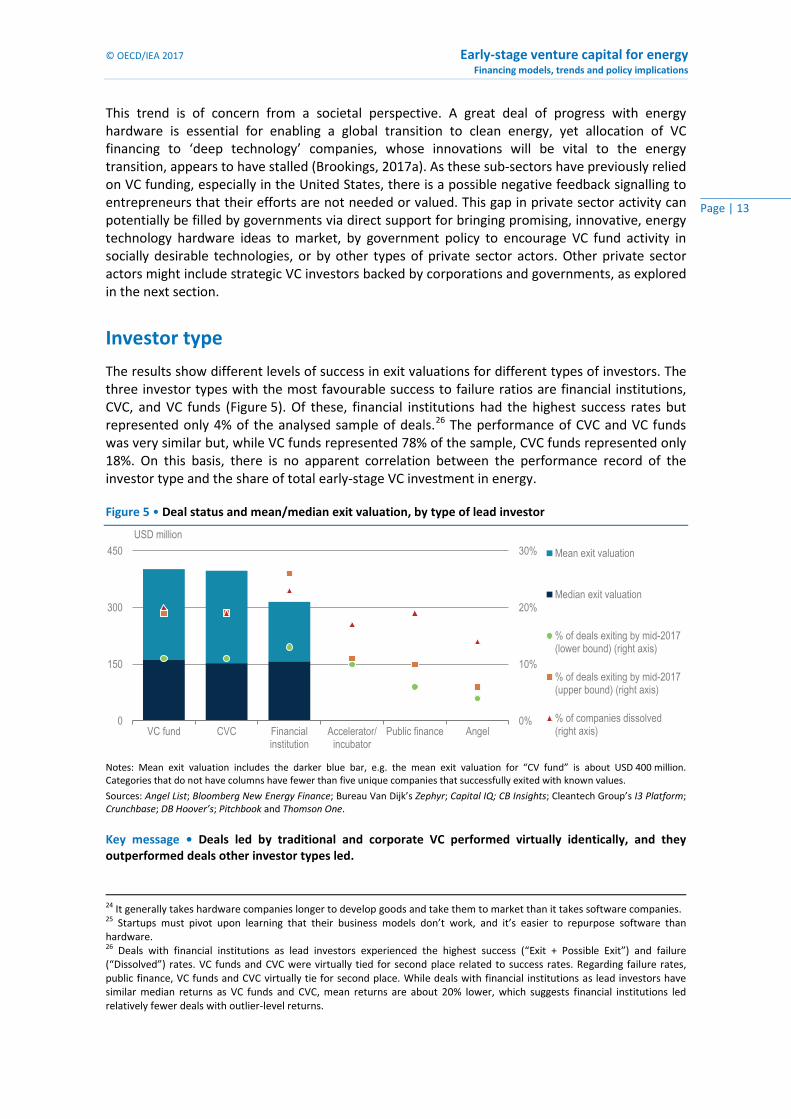
The results show different levels of success in exit valuations for different types of investors. The three investor types with the most favourable success to failure ratios are financial institutions, CVC, and VC funds (Figure 5). Of these, financial institutions had the highest success rates but represented only 4% of the analysed sample of deals.26 The performance of CVC and VC funds was very similar but, while VC funds represented 78% of the sample, CVC funds represented only 18%. On this basis, there is no apparent correlation between the performance record of the investor type and the share of total early-stage VC investment in energy.
Figure 5 • Deal status and mean/median exit valuation, by type of lead investor
Notes: Mean exit valuation includes the darker blue bar, e.g. the mean exit valuation for “CV fund” is about USD 400 million. Categories that do not have columns have fewer than five unique companies that successfully exited with known values.
Sources: Angel List; Bloomberg New Energy Finance; Bureau Van Dijk’s Zephyr; Capital IQ; CB Insights; Cleantech Group’s I3 Platform; Crunchbase; DB Hoover’s; Pitchbook and Thomson One.
Key message • Deals led by traditional and corporate VC performed virtually identically, and they outperformed deals other investor types led.
24 It generally takes hardware companies longer to develop goods and take them to market than it takes software companies. 25 Startups must pivot upon learning that their business models don’t work, and it’s easier to repurpose software than hardware. 26 Deals with financial institutions as lead investors experienced the highest success (“Exit + Possible Exit”) and failure (“Dissolved”) rates. VC funds and CVC were virtually tied for second place related to success rates. Regarding failure rates, public finance, VC funds and CVC virtually tie for second place. While deals with financial institutions as lead investors have similar median returns as VC funds and CVC, mean returns are about 20% lower, which suggests financial institutions led relatively fewer deals with outlier-level returns.
0%
10%
20%
30%
0
150
300
450
VC fund CVC Financialinstitution
Accelerator/incubator
Public finance Angel
USD millionMean exit valuation
Median exit valuation
% of deals exiting by mid-2017(lower bound) (right axis)
% of deals exiting by mid-2017(upper bound) (right axis)
% of companies dissolved(right axis)
Early-stage venture capital for energy © OECD/IEA 2017 Financing models, trends and policy implications
Page | 14
Of particular relevance is the lower level of CVC activity relative to VC funds, despite their similar levels of performance, in terms of exit valuations, success ratios and probability of successfully exiting within 5-10 years. This is because there are several qualitative factors that suggest the CVC model may be a better match for the types of energy hardware innovation identified in the previous section as being important to the energy transition. These factors include:
• Time horizon. CVC is more amenable than traditional VC funds to investments extending beyond five years. Our regression results reveal that such patience improves the VC model’s fit with energy, i.e. the chances of successful exits for energy startups after ten years are a much better fit with VC expectations than after five years, which is VC funds’ target time horizon.
• Expectations. In contrast to the traditional VC model, the CVC model does not require returns as high as 20% or more annually to satisfy investors. The typical ROI on early-stage VC investments are lower for energy than for other sectors (MIT, 2016).
• Access to parent company resources. Energy is a complex, technical sector. An advantage of CVC over traditional VC related to due diligence is the close tie with a parent company that often possesses expertise. Moreover, parent companies often empower companies in their VC portfolios with access to resources useful for pilots, demonstrations, etc.
Policy implications
From a policy standpoint, we have identified a possible gap in the provision of financing to innovative startup companies seeking to bring clean energy hardware to market. This is a critical stage in the innovation journey, and requires a big step-up in risk capital outlay to move a technology from laboratory to manufacturing for demanding, commercial customers. Trends in energy sub-sector preferences of traditional VC funds indicate that the need for government intervention to support software and less capital-intensive energy technologies is likely lower.
For energy hardware technologies, in addition to government RD&D funding and policy measures to create and support new markets, we identify CVC capital as being more patient and having the potential to nurture these technologies without any detriment to financial performance compared to VC funds. Thus, policymakers might consider constructing programs that incentivise early-stage CVC and “impact” investment in clearly-defined, high-impact types of energy-related hardware startups. Governments can also set up their own public VC funds that target specific technology areas. Our results are unable to assess the likely performance of such an approach because of the small sample of deals led by public funds. Within this small sample, the relatively poor performance in terms of exit success may reflect government selection of riskier startups, which would be consistent with their potential role as makers of new markets.
Encouraging more CVC activity would be consistent with current trends. Many corporations have raised their spending on VC portfolios and reduced their spending on corporate research labs partly because venturing can involve a lower level of commitment to a technological solution than corporate R&D, which involves owning research facilities and training researchers. Half of clean energy VC activity now has at least one corporate investor, up from one-third in 2013 (IEA, 2017b).
In addition, there is a growing trend toward the use by startups of emerging techniques of crowdfunding and initial coin offerings (ICOs) to raise capital. Such sources of capital may support clean energy hardware innovation if they attract patient, impact investors. It is currently too early – the markets remain relatively risky and underdeveloped – to have sufficient data in this area.
© OECD/IEA 2017 Early-stage venture capital for energy Financing models, trends and policy implications
Page | 15
Policy tools to encourage CVC and impact investment could include tax incentives, loans or bonuses for successful exits such that investors perceive higher upside from specified technology types. However, such an approach is not without hazards and faces the following challenges:
• Public selection of technology in a rapidly changing technological environment. While there is no a priori reason why the public sector should be worse at technology selection than the private sector, it is often the case that it can take longer to set up and fund a public programme, during which time initial technology selection could be superseded.
• Political risk of change in government or policy. A greater involvement of government in addition to market rules and regulations raises the level of potential political risk.
• Status quo preference and incentive misalignment. CVC firms’ parent companies are, in general, thriving in the current environment but the types of target portfolio companies policymakers would wish to incentivise would be potentially disruptive to incumbents’ current business models. An effective policy could ensure that CVC firms dedicate resources to accelerating the success of startups that meet programme criteria.
• Moral hazard and overcompensation. Government support for certain types of risky investment may encourage firms to take on more risk than is socially optimal, or shift risks that they would have taken in any case onto the public balance sheet.
Support schemes would need to be structured in a way that clearly distinguishes them from other forms of public finance that involve technology selection and can sometimes excessively reduce exposure to selection of the best performing companies by the market.27 Policymakers would need to ensure that incentives preserve the CVC and impact investment models’ strongpoints, including rigorous due diligence and freedom to choose the types of technologies they consider to have high potential.
27 Noting, of course, that in the case of clean energy technologies the market itself is likely to be shaped by policy to integrate environmental externalities into decision-making and facilitate new entrants.
Early-stage venture capital for energy © OECD/IEA 2017 Financing models, trends and policy implications
Page | 16
References Angel List (2017), Find a Startup, https://angel.co/jobs/signup
Breakthrough Energy (2017), Breakthrough Energy Coalition, http://www.b-t.energy/coalition/
Bureau Van Dijk (2017), Zephyr, https://www.bvdinfo.com/en-us/our-products/economic-and-m- a/m-a-data
CB Insights (2017), Platform, https://www.cbinsights.com/investor-analytics
Cleantech Group (2017), i3 Platform, https://www.cleantech.com/
D&B Hoover’s (2017), D&B Hoovers Advantage, http://www.hoovers.com/
EYGM Limited (2016), Back to reality: EY global venture capital trends 2015, http://www.ey.com/Publication/vwLUAssets/ey-global-venture-capital-trends-2015/%24FILE/ey-global-venture-capital-trends-2015.pdf
Gaddy et al. (2016), Venture Capital and Cleantech: The Wrong Model for Clean Energy Innovation, Massachusetts Institute of Technology (MIT) Energy Initiative, https://energy.mit.edu/wp-content/uploads/2016/07/MITEI-WP-2016-06.pdf
Ghosh, S. and R. Nanda (2010), Venture Capital Investment in the Clean Energy Sector, Harvard Business School, http://www.hbs.edu/faculty/Publication%20Files/11-020.pdf
Henderson, R. (2006). Innovator’s Dilemma as a Problem of Organizational Competence. The Journal of Innovation Management. http://www.people.hbs.edu/rhenderson/jpim_175.pdf
IEA (International Energy Agency) (2017a), Tracking Clean Energy Innovation Progress, http://www.iea.org/media/etp/tracking2017/TrackingCleanEnergyInnovationProgress.pdf?utm_content=buffer53c6b&utm_medium=social&utm_source=linkedin.com&utm_campaign=buffer
IEA (2017b), World Energy Investment 2017, http://www.iea.org/publications/wei2017/
KPMG Enterprise (2017), Venture Pulse Q1 2017, https://assets.kpmg.com/content/dam/kpmg/xx/pdf/2017/04/venture-pulse-q1-2017.pdf
Metrick and Yasuda (2011), Venture Capital & the Finance of Innovation, John Wiley & Sons, Inc., http://eu.wiley.com/WileyCDA/WileyTitle/productCd-EHEP001755.html
Mission Innovation (2017), Mission Innovation Challenges: Progress and Highlights, http://mission-innovation.net/wp-content/uploads/2017/06/Innovation-Challenges-Progress-and-Highlights.pdf
Pitchbook (2017), The Pitchbook Platform, https://pitchbook.com/products/platform
Rodríguez, G. (2017), 3.8 Regression Diagnostics for Binary Data, Princeton University, http://data.princeton.edu/wws509/stata/c3s8.html
S&P Global Market Intelligence (2017), S&P Capital IQ Platform, http://marketintelligence.spglobal.com/
Saha, D. and M. Muro (2017), Cleantech venture capital: Continued declines and narrow geography limit prospects, The Brookings Institution, https://www.brookings.edu/research/cleantech-venture-capital-continued-declines-and-narrow-geography-limit-prospects/
© OECD/IEA 2017 Early-stage venture capital for energy Financing models, trends and policy implications
Page | 17
Thomson Reuters (2017), Thomson One, https://www.thomsonone.com/DirectoryServices/2006-04-01/Web.Public/Login.aspx
US Department of Energy (US DOE) (2017), ARPA-E, https://arpa-e.energy.gov/
Zider, B. (1998), How Venture Capital Works, Harvard Business Review, http://mengwong.com/school/HarvardBusinessReview/how_venture_works.pdf
Other sources that informed the analysis
Eckel, S. (2008), Interpreting logistic regression models, USC Health Science Campus, http://www-hsc.usc.edu/~eckel/biostat2/notes/notes14.pdf
Hartmans, A. (2017), The $10 Billion Club: Meet the 7 most valuable startups in the US, Business Insider, http://www.businessinsider.fr/us/most-valuable-us-startups-10-billion-decacorns-2017-6/
Livieratos, A. D. and P. Lepeniotis (2017), Corporate venture capital programs of European electric utilities: Motives, trends, strategies and challenges, The Electricity Journal, Volume 30, Issue 2, Pages 30-40, http://www.sciencedirect.com/science/article/pii/S1040619016302585
Marcus et al. (2013), The Promise and Pitfalls of Venture Capital as an Asset Class for Clean Energy Investment, SAGE Publications, http://journals.sagepub.com/doi/pdf/10.1177/1086026612474956
Saha, D. and M. Muro (2017), Patenting invention: Clean energy innovation trends and priorities for the Trump administration and Congress, The Brookings Institution, https://www.brookings.edu/research/patenting-invention-clean-energy-innovation-trends-and-priorities-for-the-trump-administration-and-congress/
Teppo, T. and R. Wustenhagen (2004), Corporate Venture Capital in the Energy Sector: A key driver for commercializing sustainable technologies?, ResearchGate, https://www.researchgate.net/publication/36384513_Corporate_Venture_Capital_in_the_Energy_Sector_A_key_driver_for_commercializing_sustainable_technologies
Victor, D. G. and K. Yanosek (2017), The Next Energy Revolution: The Promise and Peril of High-Tech Innovation, Foreign Affairs, https://www.foreignaffairs.com/articles/2017-06-13/next-energy-revolution
Early-stage venture capital for energy © OECD/IEA 2017 Financing models, trends and policy implications
Page | 18
Annex 1: Data Our dataset contains 3 340 Seed, Series A, and Series B venture capital deals between 2007 and 2016 for 2 076 unique energy startups with core value propositions directly applicable to the energy sector.28 Furthermore, the dataset contains 524 deals for which investment amounts are unknown; so, for analyses involving investment means, medians, etc. these deals are excluded. In addition, 802 deals come from anonymous investors; so, analyses relating to investor characteristics exclude these investors unless otherwise noted.
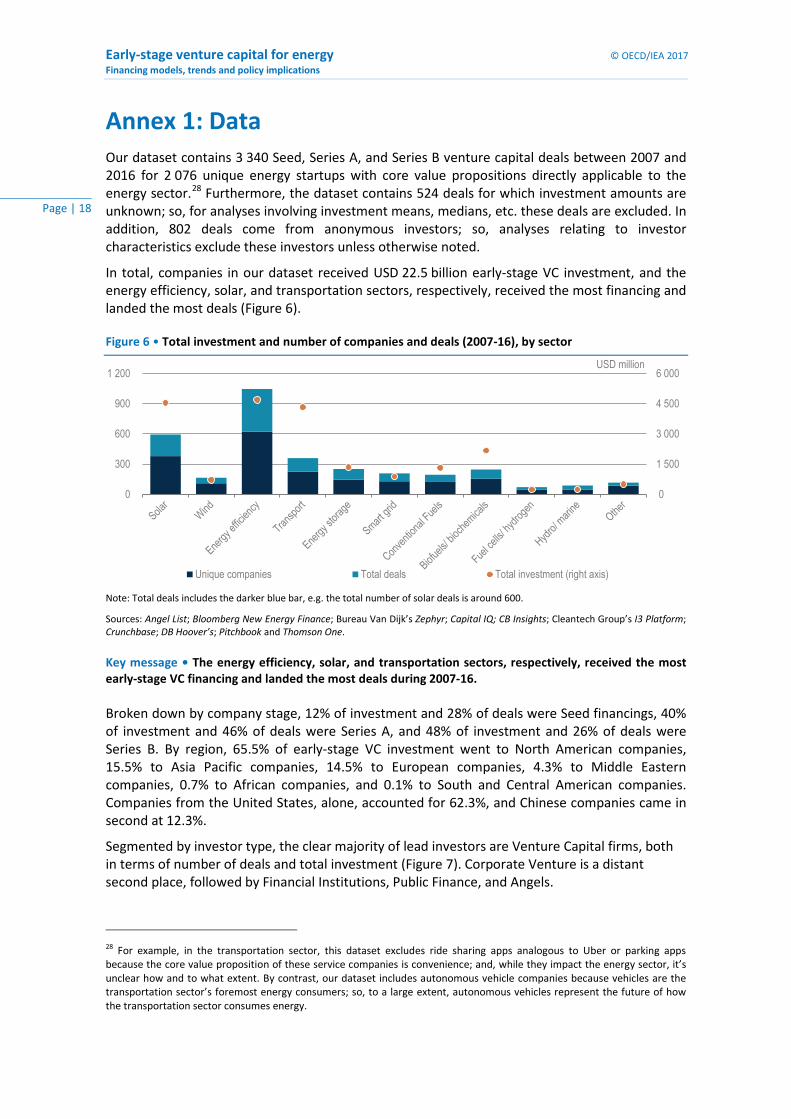
In total, companies in our dataset received USD 22.5 billion early-stage VC investment, and the energy efficiency, solar, and transportation sectors, respectively, received the most financing and landed the most deals (Figure 6).
Figure 6 • Total investment and number of companies and deals (2007-16), by sector
Note: Total deals includes the darker blue bar, e.g. the total number of solar deals is around 600. Sources: Angel List; Bloomberg New Energy Finance; Bureau Van Dijk’s Zephyr; Capital IQ; CB Insights; Cleantech Group’s I3 Platform; Crunchbase; DB Hoover’s; Pitchbook and Thomson One.
Key message • The energy efficiency, solar, and transportation sectors, respectively, received the most early-stage VC financing and landed the most deals during 2007-16. Broken down by company stage, 12% of investment and 28% of deals were Seed financings, 40% of investment and 46% of deals were Series A, and 48% of investment and 26% of deals were Series B. By region, 65.5% of early-stage VC investment went to North American companies, 15.5% to Asia Pacific companies, 14.5% to European companies, 4.3% to Middle Eastern companies, 0.7% to African companies, and 0.1% to South and Central American companies. Companies from the United States, alone, accounted for 62.3%, and Chinese companies came in second at 12.3%.
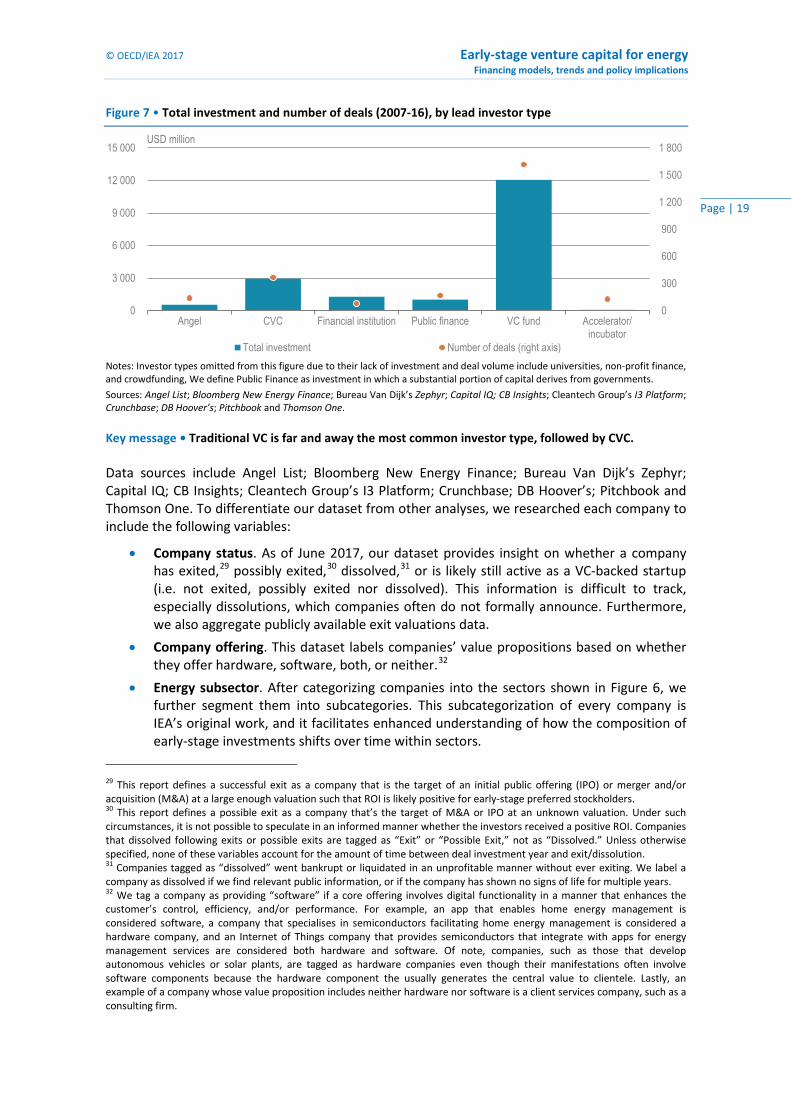
Segmented by investor type, the clear majority of lead investors are Venture Capital firms, both in terms of number of deals and total investment (Figure 7). Corporate Venture is a distant second place, followed by Financial Institutions, Public Finance, and Angels.
28 For example, in the transportation sector, this dataset excludes ride sharing apps analogous to Uber or parking apps because the core value proposition of these service companies is convenience; and, while they impact the energy sector, it’s unclear how and to what extent. By contrast, our dataset includes autonomous vehicle companies because vehicles are the transportation sector’s foremost energy consumers; so, to a large extent, autonomous vehicles represent the future of how the transportation sector consumes energy.
0
1 500
3 000
4 500
6 000
0
300
600
900
1 200USD million
Unique companies Total deals Total investment (right axis)
© OECD/IEA 2017 Early-stage venture capital for energy Financing models, trends and policy implications
Page | 19
Figure 7 • Total investment and number of deals (2007-16), by lead investor type
Notes: Investor types omitted from this figure due to their lack of investment and deal volume include universities, non-profit finance, and crowdfunding, We define Public Finance as investment in which a substantial portion of capital derives from governments.
Sources: Angel List; Bloomberg New Energy Finance; Bureau Van Dijk’s Zephyr; Capital IQ; CB Insights; Cleantech Group’s I3 Platform; Crunchbase; DB Hoover’s; Pitchbook and Thomson One.
Key message • Traditional VC is far and away the most common investor type, followed by CVC. Data sources include Angel List; Bloomberg New Energy Finance; Bureau Van Dijk’s Zephyr; Capital IQ; CB Insights; Cleantech Group’s I3 Platform; Crunchbase; DB Hoover’s; Pitchbook and Thomson One. To differentiate our dataset from other analyses, we researched each company to include the following variables:
• Company status. As of June 2017, our dataset provides insight on whether a company has exited,29 possibly exited,30 dissolved,31 or is likely still active as a VC-backed startup (i.e. not exited, possibly exited nor dissolved). This information is difficult to track, especially dissolutions, which companies often do not formally announce. Furthermore, we also aggregate publicly available exit valuations data.
• Company offering. This dataset labels companies’ value propositions based on whether they offer hardware, software, both, or neither.32
• Energy subsector. After categorizing companies into the sectors shown in Figure 6, we further segment them into subcategories. This subcategorization of every company is IEA’s original work, and it facilitates enhanced understanding of how the composition of early-stage investments shifts over time within sectors.
29 This report defines a successful exit as a company that is the target of an initial public offering (IPO) or merger and/or acquisition (M&A) at a large enough valuation such that ROI is likely positive for early-stage preferred stockholders. 30 This report defines a possible exit as a company that’s the target of M&A or IPO at an unknown valuation. Under such circumstances, it is not possible to speculate in an informed manner whether the investors received a positive ROI. Companies that dissolved following exits or possible exits are tagged as “Exit” or “Possible Exit,” not as “Dissolved.” Unless otherwise specified, none of these variables account for the amount of time between deal investment year and exit/dissolution. 31 Companies tagged as “dissolved” went bankrupt or liquidated in an unprofitable manner without ever exiting. We label a company as dissolved if we find relevant public information, or if the company has shown no signs of life for multiple years. 32 We tag a company as providing “software” if a core offering involves digital functionality in a manner that enhances the customer’s control, efficiency, and/or performance. For example, an app that enables home energy management is considered software, a company that specialises in semiconductors facilitating home energy management is considered a hardware company, and an Internet of Things company that provides semiconductors that integrate with apps for energy management services are considered both hardware and software. Of note, companies, such as those that develop autonomous vehicles or solar plants, are tagged as hardware companies even though their manifestations often involve software components because the hardware component the usually generates the central value to clientele. Lastly, an example of a company whose value proposition includes neither hardware nor software is a client services company, such as a consulting firm.
0
300
600
900
1 200
1 500
1 800
0
3 000
6 000
9 000
12 000
15 000
Angel CVC Financial institution Public finance VC fund Accelerator/incubator
USD million
Total investment Number of deals (right axis)
Early-stage venture capital for energy © OECD/IEA 2017 Financing models, trends and policy implications
Page | 20
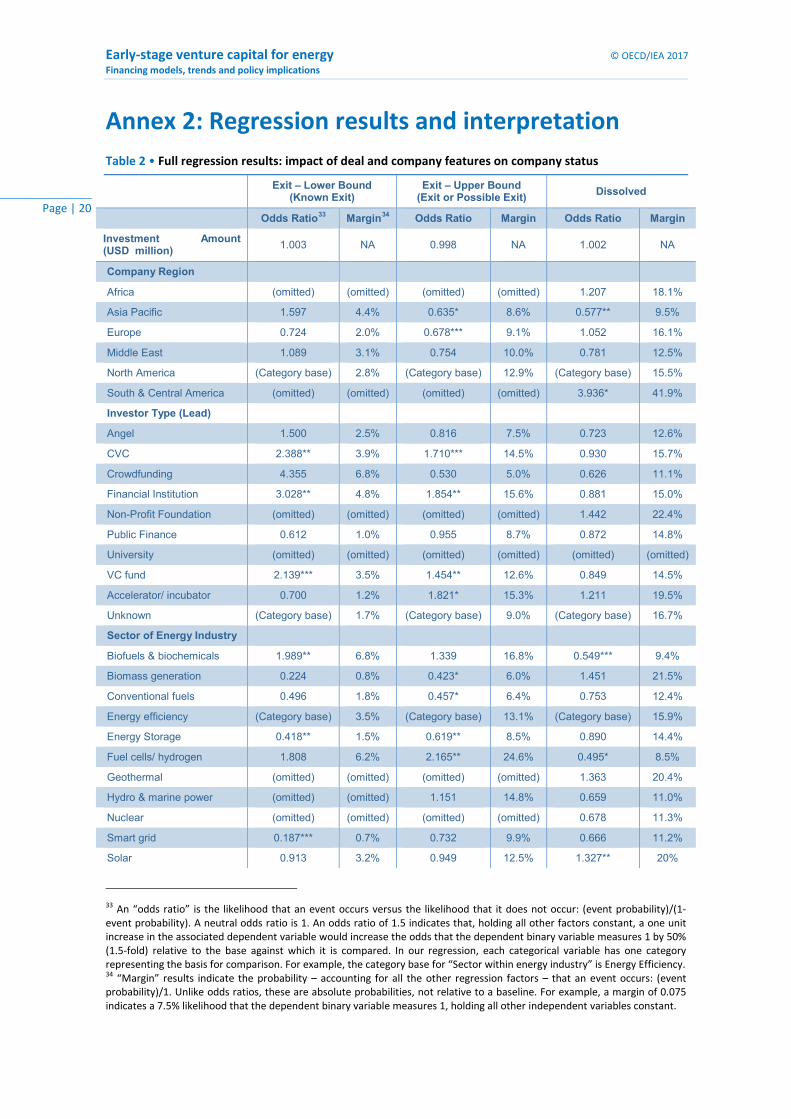
Annex 2: Regression results and interpretation Table 2 • Full regression results: impact of deal and company features on company status
Exit – Lower Bound
(Known Exit) Exit – Upper Bound
(Exit or Possible Exit) Dissolved
Odds Ratio33 Margin34 Odds Ratio Margin Odds Ratio Margin
Investment Amount (USD million) 1.003 NA 0.998 NA 1.002 NA
Company Region
Africa (omitted) (omitted) (omitted) (omitted) 1.207 18.1%
Asia Pacific 1.597 4.4% 0.635* 8.6% 0.577** 9.5%
Europe 0.724 2.0% 0.678*** 9.1% 1.052 16.1%
Middle East 1.089 3.1% 0.754 10.0% 0.781 12.5%
North America (Category base) 2.8% (Category base) 12.9% (Category base) 15.5%
South & Central America (omitted) (omitted) (omitted) (omitted) 3.936* 41.9%
Investor Type (Lead)
Angel 1.500 2.5% 0.816 7.5% 0.723 12.6%
CVC 2.388** 3.9% 1.710*** 14.5% 0.930 15.7%
Crowdfunding 4.355 6.8% 0.530 5.0% 0.626 11.1%
Financial Institution 3.028** 4.8% 1.854** 15.6% 0.881 15.0%
Non-Profit Foundation (omitted) (omitted) (omitted) (omitted) 1.442 22.4%
Public Finance 0.612 1.0% 0.955 8.7% 0.872 14.8%
University (omitted) (omitted) (omitted) (omitted) (omitted) (omitted)
VC fund 2.139*** 3.5% 1.454** 12.6% 0.849 14.5%
Accelerator/ incubator 0.700 1.2% 1.821* 15.3% 1.211 19.5%
Unknown (Category base) 1.7% (Category base) 9.0% (Category base) 16.7%
Sector of Energy Industry
Biofuels & biochemicals 1.989** 6.8% 1.339 16.8% 0.549*** 9.4%
Biomass generation 0.224 0.8% 0.423* 6.0% 1.451 21.5%
Conventional fuels 0.496 1.8% 0.457* 6.4% 0.753 12.4%
Energy efficiency (Category base) 3.5% (Category base) 13.1% (Category base) 15.9%
Energy Storage 0.418** 1.5% 0.619** 8.5% 0.890 14.4%
Fuel cells/ hydrogen 1.808 6.2% 2.165** 24.6% 0.495* 8.5%
Geothermal (omitted) (omitted) (omitted) (omitted) 1.363 20.4%
Hydro & marine power (omitted) (omitted) 1.151 14.8% 0.659 11.0%
Nuclear (omitted) (omitted) (omitted) (omitted) 0.678 11.3%
Smart grid 0.187*** 0.7% 0.732 9.9% 0.666 11.2%
Solar 0.913 3.2% 0.949 12.5% 1.327** 20%
33 An “odds ratio” is the likelihood that an event occurs versus the likelihood that it does not occur: (event probability)/(1-event probability). A neutral odds ratio is 1. An odds ratio of 1.5 indicates that, holding all other factors constant, a one unit increase in the associated dependent variable would increase the odds that the dependent binary variable measures 1 by 50% (1.5-fold) relative to the base against which it is compared. In our regression, each categorical variable has one category representing the basis for comparison. For example, the category base for “Sector within energy industry” is Energy Efficiency. 34 “Margin” results indicate the probability – accounting for all the other regression factors – that an event occurs: (event probability)/1. Unlike odds ratios, these are absolute probabilities, not relative to a baseline. For example, a margin of 0.075 indicates a 7.5% likelihood that the dependent binary variable measures 1, holding all other independent variables constant.
© OECD/IEA 2017 Early-stage venture capital for energy Financing models, trends and policy implications
Page | 21
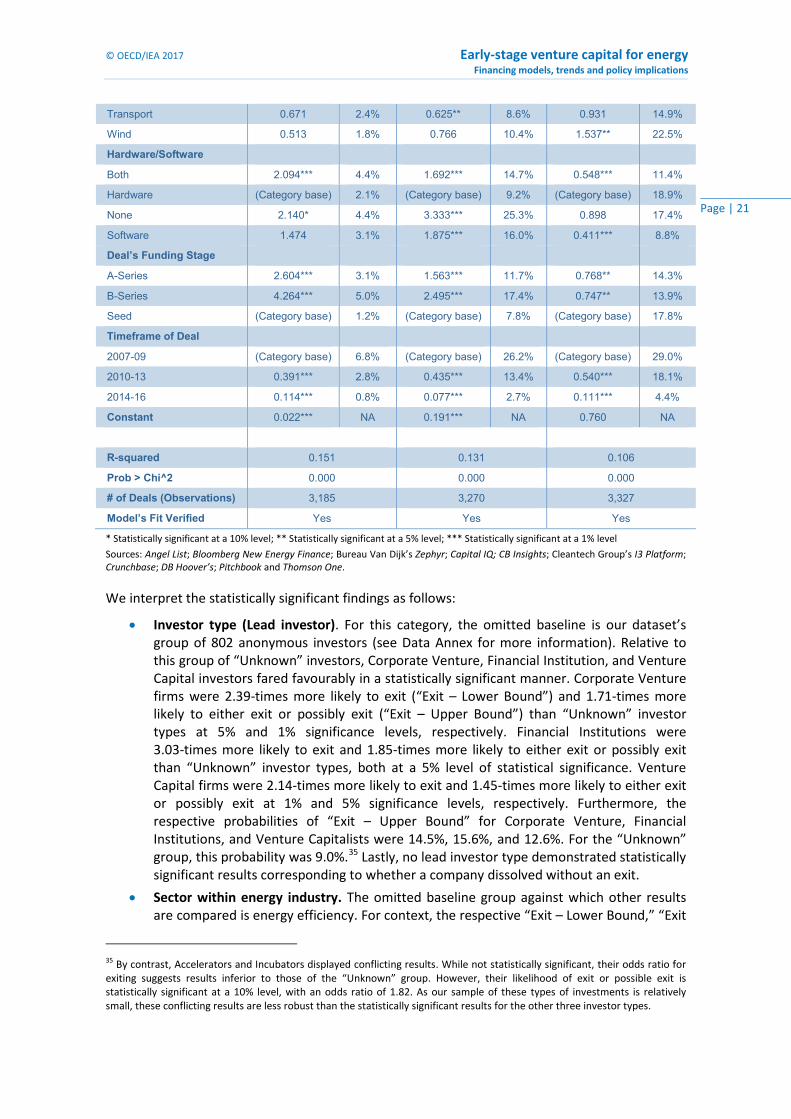
Transport 0.671 2.4% 0.625** 8.6% 0.931 14.9%
Wind 0.513 1.8% 0.766 10.4% 1.537** 22.5%
Hardware/Software
Both 2.094*** 4.4% 1.692*** 14.7% 0.548*** 11.4%
Hardware (Category base) 2.1% (Category base) 9.2% (Category base) 18.9%
None 2.140* 4.4% 3.333*** 25.3% 0.898 17.4%
Software 1.474 3.1% 1.875*** 16.0% 0.411*** 8.8%
Deal’s Funding Stage
A-Series 2.604*** 3.1% 1.563*** 11.7% 0.768** 14.3%
B-Series 4.264*** 5.0% 2.495*** 17.4% 0.747** 13.9%
Seed (Category base) 1.2% (Category base) 7.8% (Category base) 17.8%
Timeframe of Deal
2007-09 (Category base) 6.8% (Category base) 26.2% (Category base) 29.0%
2010-13 0.391*** 2.8% 0.435*** 13.4% 0.540*** 18.1%
2014-16 0.114*** 0.8% 0.077*** 2.7% 0.111*** 4.4%
Constant 0.022*** NA 0.191*** NA 0.760 NA
R-squared 0.151 0.131 0.106
Prob > Chi^2 0.000 0.000 0.000
# of Deals (Observations) 3,185 3,270 3,327
Model’s Fit Verified Yes Yes Yes
* Statistically significant at a 10% level; ** Statistically significant at a 5% level; *** Statistically significant at a 1% level
Sources: Angel List; Bloomberg New Energy Finance; Bureau Van Dijk’s Zephyr; Capital IQ; CB Insights; Cleantech Group’s I3 Platform; Crunchbase; DB Hoover’s; Pitchbook and Thomson One.
We interpret the statistically significant findings as follows:
• Investor type (Lead investor). For this category, the omitted baseline is our dataset’s group of 802 anonymous investors (see Data Annex for more information). Relative to this group of “Unknown” investors, Corporate Venture, Financial Institution, and Venture Capital investors fared favourably in a statistically significant manner. Corporate Venture firms were 2.39-times more likely to exit (“Exit – Lower Bound”) and 1.71-times more likely to either exit or possibly exit (“Exit – Upper Bound”) than “Unknown” investor types at 5% and 1% significance levels, respectively. Financial Institutions were 3.03-times more likely to exit and 1.85-times more likely to either exit or possibly exit than “Unknown” investor types, both at a 5% level of statistical significance. Venture Capital firms were 2.14-times more likely to exit and 1.45-times more likely to either exit or possibly exit at 1% and 5% significance levels, respectively. Furthermore, the respective probabilities of “Exit – Upper Bound” for Corporate Venture, Financial Institutions, and Venture Capitalists were 14.5%, 15.6%, and 12.6%. For the “Unknown” group, this probability was 9.0%.35 Lastly, no lead investor type demonstrated statistically significant results corresponding to whether a company dissolved without an exit.
• Sector within energy industry. The omitted baseline group against which other results are compared is energy efficiency. For context, the respective “Exit – Lower Bound,” “Exit
35 By contrast, Accelerators and Incubators displayed conflicting results. While not statistically significant, their odds ratio for exiting suggests results inferior to those of the “Unknown” group. However, their likelihood of exit or possible exit is statistically significant at a 10% level, with an odds ratio of 1.82. As our sample of these types of investments is relatively small, these conflicting results are less robust than the statistically significant results for the other three investor types.
Early-stage venture capital for energy © OECD/IEA 2017 Financing models, trends and policy implications
Page | 22
– Upper Bound,” and “Dissolved” probabilities for energy efficiency companies were 3.5%, 13.1% and 15.9%. Energy storage was the only sector to demonstrate statistically significant results corresponding to both “Exit – Lower Bound” and “Exit – Upper Bound” Energy storage startups were 58% less likely to exit and 38% less likely to exit or possibly exit than energy efficiency companies at a 5% significance level. Probabilities regarding storage companies’ likelihood of “Exit – Lower Bound” and “Exit – Upper Bound” are 1.5% and 8.5%. Additional sectors with statistically significant results corresponding to “Exit – Lower Bound” were biofuels & biochemicals and smart grid, which, respectively, were 1.99-times more and 81.3% less likely to exit than EE companies. Sectors with statistically significant results corresponding to “Exit – Upper Bound” are fuel cells & hydrogen, biomass generation, conventional fuels, and transportation, which, respectively, were 2.16-times more, 58% less, 54% less, and 39% less likely to exit or possibly exit than were energy efficiency companies. Sectors demonstrating statistical significance related to dissolution were solar, wind, biofuels & biochemicals, and fuel cells/hydrogen, which, respectively, were 1.33-times more, 1.54-times more, 45% less, and 51% less likely to dissolve than energy efficiency companies.
• Hardware/software. The omitted baseline group against which others are compared is “Hardware.” At a 1% significance level, companies with both hardware and software (“Both”) as part of their core value propositions are 2.09-times more likely to exit, 1.69-times more likely to exit or possibly exit, and 45% less likely to dissolve than hardware companies. These “Both” companies have “Exit – Lower Bound,” “Exit – Upper Bound,” and “Dissolution” probabilities of 4.4%, 14.7%, and 11.4%, respectively. For context, hardware companies’ probabilities of “Exit – Lower Bound,” “Exit – Upper Bound,” and “Dissolution” are 2.1%, 9.2%, and 18.9%, respectively. Also at a 1% significance level, software companies are 1.87-times more likely to exit or possibly exit and 59% less likely to dissolve than hardware companies. Corresponding “Exit – Upper Bound” and “Dissolution” probabilities for software companies are 16.0% and 8.8%, respectively. Companies with neither software nor hardware as core elements of their value proposition are statistically significantly more likely to exit than are hardware companies, but there is no statistical significance regarding their likelihood of dissolution.
Our control variables reveal statistical significance as we would expect:
• Deal’s stage of funding. At a 1% significance level, Series A and Series B deals are more likely to enjoy exits or possible exits than are Seed deals. At a 5% significance level, Series A and Series B deals are less likely to unsuccessfully dissolve than are Seed deals.
• Timeframe of deal. At 1% significance, deals during 2010-13 and 2014-16 were less likely to experience exits or possible exits than deals from 2007-09. At 1% significance, deals from 2010-13 and 2014-16 were less likely to fail than deals from 2007-09.
• Investment amount. This does not display statistical significance in any regressions.36
• Company region. As explained in the Methodology section and Limitations Annex, we need to proceed with caution when interpreting geography-related results due to possible data-related inconsistencies. Nevertheless, our results find that European and Asia Pacific companies were respectively 32% and 36% less likely to exit or possibly exit than were North American companies. The respective probabilities of “Exit – Upper Bound” for North American, European, and Asia Pacific companies were 12.9%, 9.1%, and 8.6%. With statistical significance, Asia Pacific and South & Central America37 companies, are 32% less and 3.93-times more likely to dissolve than North American companies.
36 A possible limitation for this control variable is that over 500 deals had unknown valuations (see Limitations Annex). 37 We advise caution when interpreting the South and Central America results, as the sample size is very small.
© OECD/IEA 2017 Early-stage venture capital for energy Financing models, trends and policy implications
Page | 23
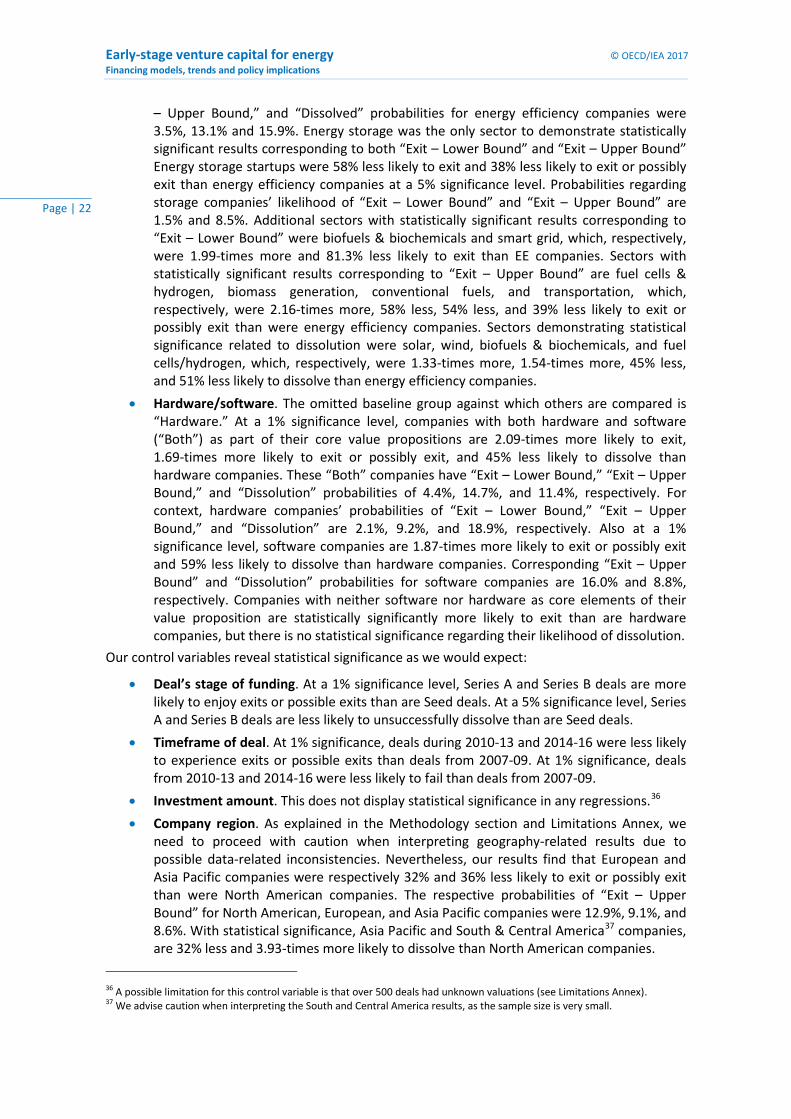
Annex 3: Location’s impact on company success As expressed in the Methodology section and the Limitations Annex, readers should proceed with caution when interpreting these location-oriented results due to likely data-related inconsistencies.38 Even with this disclaimer, however, it’s difficult to ignore China’s success as it relates to early-stage energy sector investments, especially relative to its peers (Figure 8).
Figure 8 • Company status and mean/median exit valuation, by location
Notes: Mean exit valuation includes the darker blue bar, e.g. the mean exit valuation for United States is about USD 400 million.
Sources: Angel List; Bloomberg New Energy Finance; Bureau Van Dijk’s Zephyr; Capital IQ; CB Insights; Cleantech Group’s I3 Platform; Crunchbase; DB Hoover’s; Pitchbook and Thomson One.
Key message • While it’s prudent to interpret these results with caution, Chinese energy startups in our dataset performed far above the rest of the world in every way we measure. Median and mean exit valuations of successful Chinese companies dwarf those of counterparts. In addition, deal status data reveal that Chinese companies boast rates of company dissolution, company exit or possible exit, and deal exit or possible exit within the past five years of 14%, 24%, and 26%, respectively; these rates are all far superior to the respective global averages of 20%, 16%, and 11%. One explanation for this result is date related. We use non-Chinese sources that may have limitations in their coverage of which Chinese startups have experienced success, especially those that are not well-known outside China. However, although the particularities of the Chinese VC market are not well known to us, it cannot be ruled out that the models of early-stage energy investment in China are successful and could be partly replicated elsewhere to global benefit.
Figure 8 also signals European companies’ lack of success relative to the rest of the world; they have the highest failure rates, lowest success rates, and lowest mean and median exit valuations. One explanation for their high failure rates is, again, data related. France and the UK, in particular, feature state of the art registries for publicizing whether a company is active or dissolved. The low success rates for European companies are more difficult to explain, though.
These regional success and failure trends may be influencing the trajectory of regional early-stage energy VC investment (Figure 9). In 2016, China saw a dramatic spike in total early-stage energy VC investment, moving it past the United States as the world’s top country as it relates to companies receiving such financing. While USD 1 billion of the USD 1.7 billion 2016 total
38 For some regions of the world it’s more difficult than in others to obtain data on company dissolution, early-stage investments in companies that fail relatively quickly, etc.
0%
5%
10%
15%
20%
25%
30%
0
200
400
600
800
1 000
1 200
United States Europe China Rest of world
USD million Mean exit valuation
Median exit valuation
Total % of companies exiting(upper bound) (right axis)
% of companies exiting <5years (upper bound) (right axis)
% of companies dissolved (rightaxis)
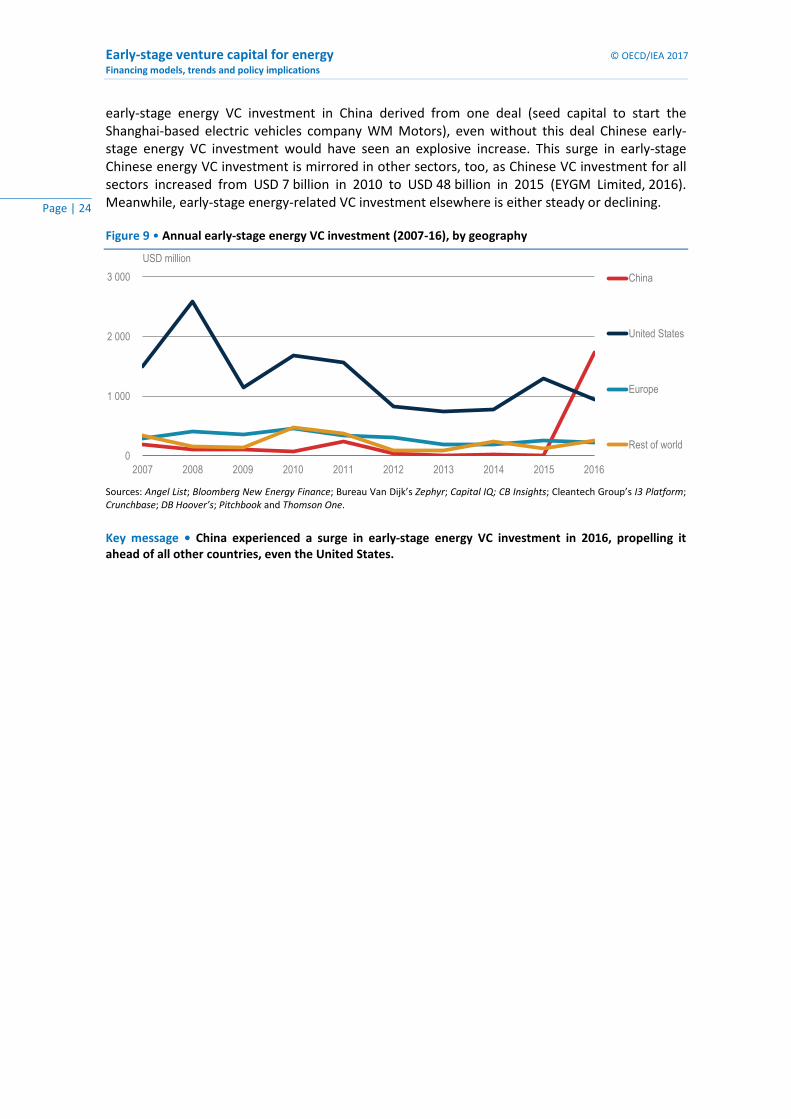
Early-stage venture capital for energy © OECD/IEA 2017 Financing models, trends and policy implications
Page | 24
early-stage energy VC investment in China derived from one deal (seed capital to start the Shanghai-based electric vehicles company WM Motors), even without this deal Chinese early-stage energy VC investment would have seen an explosive increase. This surge in early-stage Chinese energy VC investment is mirrored in other sectors, too, as Chinese VC investment for all sectors increased from USD 7 billion in 2010 to USD 48 billion in 2015 (EYGM Limited, 2016). Meanwhile, early-stage energy-related VC investment elsewhere is either steady or declining.
Figure 9 • Annual early-stage energy VC investment (2007-16), by geography
Sources: Angel List; Bloomberg New Energy Finance; Bureau Van Dijk’s Zephyr; Capital IQ; CB Insights; Cleantech Group’s I3 Platform; Crunchbase; DB Hoover’s; Pitchbook and Thomson One.
Key message • China experienced a surge in early-stage energy VC investment in 2016, propelling it ahead of all other countries, even the United States.
0
1 000
2 000
3 000
2007 2008 2009 2010 2011 2012 2013 2014 2015 2016
USD million
China
United States
Europe
Rest of world
© OECD/IEA 2017 Early-stage venture capital for energy Financing models, trends and policy implications
Page | 25
Annex 4: Limitations of the analysis Limitations of our analysis mostly related to our dataset. First, as conveyed in the Data Annex, our dataset includes 524 deals with unknown investment amounts and 802 deals with anonymous lead investors. These unknown parameters reduce the sample sizes of some of our analyses. In addition, the presence of unknown investment amounts means we inherently undervalue the amount of early-stage investment; our dataset represents a large sample, not the full population, of early-stage energy-oriented startup financing. Also related to investors, our dataset focuses solely on the characteristics of lead investors, whereas financing rounds often have multiple major investors.
The second limitation of our dataset is the degree of subjectivity involved in classifying exit performance. This analysis does not incorporate information on capital allocation tables and investment terms (for example, liquidation preference), so we do not have clear knowledge of how well/poorly investors and founders fare in exits. In addition, many of our dataset’s deals have unknown valuations, and we do not account for the amount of financing received in future rounds; so, it is often difficult to know whether an exit valuation exceeded the total amount of investment the company received. Furthermore, many merger and acquisition (M&A) exits do not reveal valuations publicly, so it is difficult to assess whether such M&A represents an exit in which investors recover their capital, or a liquidation for salvage value.
A third limitation to our dataset relates to company geography. Our data sources are all based in the developed western world, and comprehensive data from the developing world is difficult to obtain irrespective of sources. While we are confident that we use the premier resources for this analysis, we recommend readers exercise caution when analysing location-related results. For example, the rate at which this sample’s Chinese investments result in successful exits is far above the average. While it is possible that factors unique to China render the country favourable for incubating early-stage energy startups, it is also possible that our data sources are disproportionately more likely to know about Chinese companies that succeed compared to those that fail. In addition, some countries, namely France and the UK, are better than others at maintaining public, accessible, up-to-date information on whether companies have dissolved. For such countries, it is more likely that we could definitively determine whether small companies were active or dissolved.
A methodological limitation is that the R-squared range for our three regressions is 0.11-0.15. While our model fits our data in a robust manner, and this R-squared value meets passable standards, higher R-squared values would be desirable.
Early-stage venture capital for energy © OECD/IEA 2017 Financing models, trends and policy implications
Page | 26
Acronyms, abbreviations and units of measure
Acronyms and abbreviations ARPA-E United States Department of Energy Advanced Research Project Agency CVC Corporate venture capital ICO Initial Coin Offering IEA International Energy Agency IoT Internet of things M&A Mergers and Acquisitions MIT Massachusetts Institute of Technology R&D Research and development ROI Return on investment VC Venture capital
Units of measure
USD United States dollar (nominal)
This document and any map included herein are without prejudice to the status of or sovereignty over any territory, to the delimitation of international frontiers and boundaries and to the name of any territory, city or area.
IEA PUBLICATIONS, International Energy Agency
Website: www.iea.org Contact information: www.iea.org/aboutus/contactus
Cover design: IEA. Photo credits: © Graphic Obsession
Typeset in France by IEA, October 2017

Onl
in
e bookshopPDF versions at 20%
discountw
ww
.iea
.org/books
Inte
rnat
iona
l Energy Agency
Secure Sustain
able T
oget
her
World Energy Outlook series
World Energy
Investment series
Energy Statistics series
Energy Policiesof IEA
Countriesseries
Energy Technology
Perspectives series
E-mail: books@
iea.org
Market ReportSeries
Oil
Coal
RenewableEnergy Energy
Efficiency
Gas
Global Gas Security series
EnergyPolicies
Beyond IEA Countriesseries


![EARLY STAGE VENTURE CAPITAL LIMITED PARTNERSHIPS … · ESVCLP Customer Information Guide – July 2016 Page 5 of 27 5.4 Permitted loans [s9 -10 VCA] ... 6.2 Venture capital management](https://img.pdfslide.us/doc/110x75/600e41df7deded4a0819525a/early-stage-venture-capital-limited-partnerships-esvclp-customer-information-guide.jpg)