Embed Size (px)
Citation preview
Research ArticleEarly-Stage Estimated Value of Blend Sign on the Prognosis ofPatients with Intracerebral Hemorrhage
WeijunWang , Ningquan Zhou, and ChaoWang
Department of Neurosurgery, Qiannan People’s Hospital, Guizhou 558000, China
Correspondence should be addressed to Weijun Wang; [email protected]
Received 27 September 2017; Revised 9 February 2018; Accepted 25 March 2018; Published 6 May 2018
Academic Editor: Robert M. Starke
Copyright © 2018 Weijun Wang et al. This is an open access article distributed under the Creative Commons Attribution License,which permits unrestricted use, distribution, and reproduction in any medium, provided the original work is properly cited.
Background and Purpose. This study aimed to explore the relationship between blend sign and prognosis of patients withintracerebral hemorrhage (ICH).Methods. Between January 2014 and December 2016, the results of cranial computed tomographyimaging within 24 h after the onset of symptoms from 275 patients with ICH were retrospectively analyzed. The patients with orwithout blend signwere compared to observe and analyze the difference in coagulation function abnormality, rebleeding, mortality,and bad prognosis rates in the early stages.Results. Of the 275 patientswith ICH, 47 patients hadBlend Sign I (17.09%) and 17 patientshad Blend Sign II (6.18%). The coagulation function abnormality rate had no statistical difference among Blend Sign I, Blend SignII, and conventional groups (𝑃 > 0.05). In the Blend Sign I group, the rebleeding rate was 4.26%, bad prognosis rate was 25.53%,and mortality rate was 6.38%, which were not statistically significantly different compared with those in the conventional group(𝑃 > 0.05). The rebleeding rate in the Blend Sign II group was 47.06%, bad prognosis rate was 82.35%, and mortality rate was47.06%, which were statistically significantly different compared with those in the conventional and Blend Sign I groups (𝑃 < 0.05).Conclusions. For the patients associated with Blend Sign I, the prognosis was equivalent to that in the conventional group, with nostatistically significant difference. The rebleeding, bad prognosis, and mortality rates were higher in the Blend Sign II group thanin the conventional group and deserved more attention.
1. Introduction
Intracerebral hemorrhage (ICH) is a common cerebrovas-cular disease with high mortality and disability rates [1–3],accounting for about 10%–30% of all strokes [4]. Severalfactors influence prognosis. The commonly used evaluationmethods include Glasgow Coma Scale (GCS) score duringhospitalization, gender, coagulation function, and volumeof hematoma [5–7]. The lower GCS score, older age, moreabnormal coagulation function, and larger bleeding volumeeasily lead to poor prognosis. However, in clinic, even thecombination of various evaluation indexes cannot accuratelypredict patient prognosis. In particular, at the early stageof disease onset, the prognosis is hard to predict. Li et al.[8] first proposed a blend sign phenomenon based on theimaging morphology of hematoma in patients with ICH.The hematoma in the acute stage comprised two hematomaswith different densities, as revealed by cranial computedtomography (CT). The boundary between the hematomas
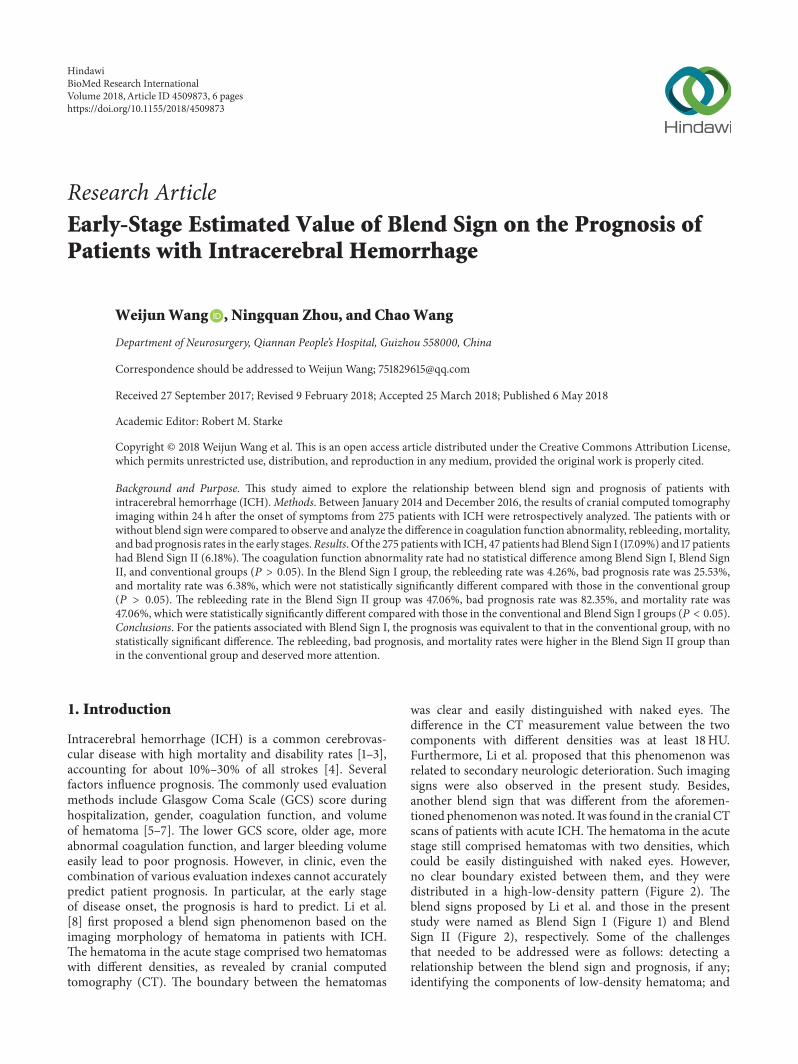
was clear and easily distinguished with naked eyes. Thedifference in the CT measurement value between the twocomponents with different densities was at least 18HU.Furthermore, Li et al. proposed that this phenomenon wasrelated to secondary neurologic deterioration. Such imagingsigns were also observed in the present study. Besides,another blend sign that was different from the aforemen-tioned phenomenonwas noted. It was found in the cranial CTscans of patients with acute ICH.The hematoma in the acutestage still comprised hematomas with two densities, whichcould be easily distinguished with naked eyes. However,no clear boundary existed between them, and they weredistributed in a high-low-density pattern (Figure 2). Theblend signs proposed by Li et al. and those in the presentstudy were named as Blend Sign I (Figure 1) and BlendSign II (Figure 2), respectively. Some of the challengesthat needed to be addressed were as follows: detecting arelationship between the blend sign and prognosis, if any;identifying the components of low-density hematoma; and
HindawiBioMed Research InternationalVolume 2018, Article ID 4509873, 6 pageshttps://doi.org/10.1155/2018/4509873
2 BioMed Research International
(a) (b) (c)
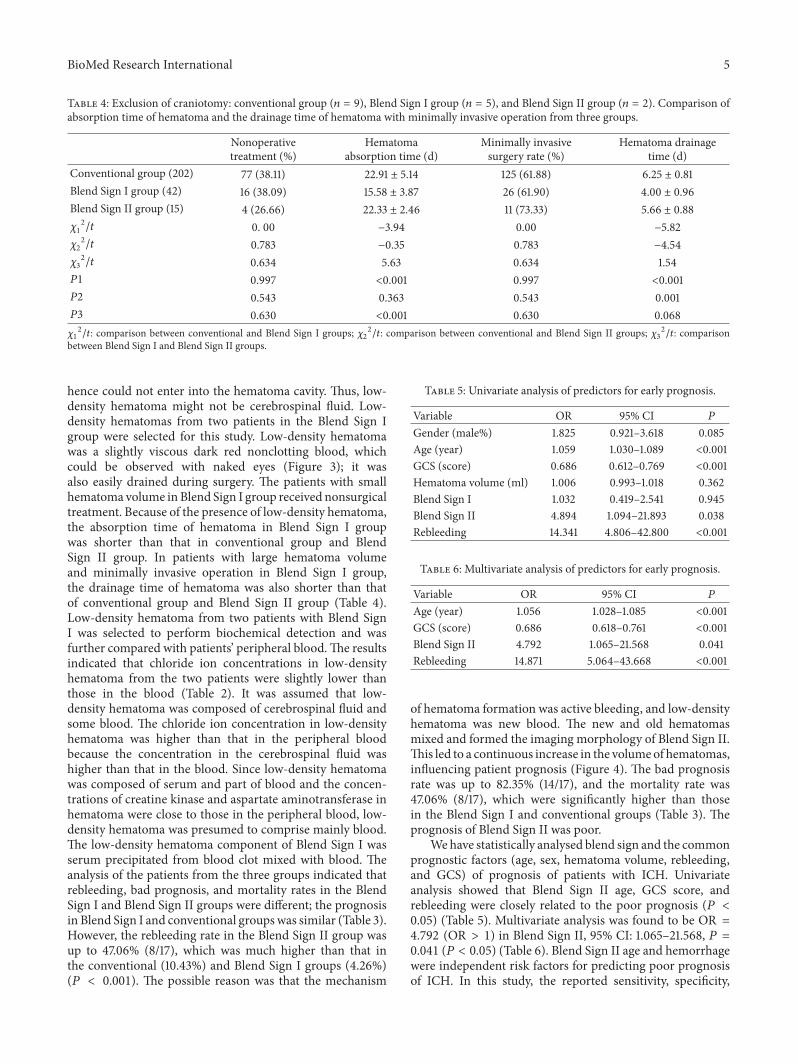
Figure 1: Classic cranial CT scans of Blend Sign I. The whole hematoma was composed of low-density and high-density hematomas with aclear boundary, The difference in the CT measurement value was higher than 18HU.
(a) (b) (c)
Figure 2: Classic cranial CT scans of Blend Sign II.Thewhole hematoma was composed of low-density and high-density hematomas withouta clear boundary (crossing each other). The difference in the CT measurement value was higher than 10HU.
exploring whether the component with density lower thanthat of acute hematomawas possibly cerebrospinal fluid, freshblood, or a mixture of these. The present study exploredthe significance of the two blend signs, the evaluation onprognosis, and the possible mechanism of occurrence ofBlend Sign.
2. Methods
2.1. Patients. A total of 275 patients with ICH were admittedand cured in the Neurosurgery Department, the People’sHospital of Qiannan, from January 2014 to December 2016.Patients with hematoma morphology Blend Sign I on thecranial CT scan were placed in the Blend Sign I group, thosewith hematoma morphology Blend Sign II in the Blend SignII group, and those without blend sign in the conventionalgroup. Subsequently, the incidence, rebleeding, mortality,and bad prognosis rates at the time of discharge among
the three groups were compared and analyzed. Low-densityhematomas from two patients were selected to performbiochemical detection and were compared with the compo-nents in the blood.
2.2. Inclusion Criteria. The inclusion criteria were as follows:patients with spontaneous ICH confirmed by 64-row cranialCT; patients who received cranial CT examination within24 h of disease onset and had no diagnosed hemorrhagicdisorders or severe underlying diseases; and patients whosefamily did not give up therapy.
2.3. Exclusion Criteria. Theexclusion criteria were as follows:patients with causes of hemorrhage including cerebrovascu-lar malformation, arterial aneurysm, tumor bleeding, cere-bral trauma, and bleeding tendency such as hemophiliaand disseminated intravascular coagulation; patients withintraventricular hemorrhage and spontaneous subarachnoid
BioMed Research International 3
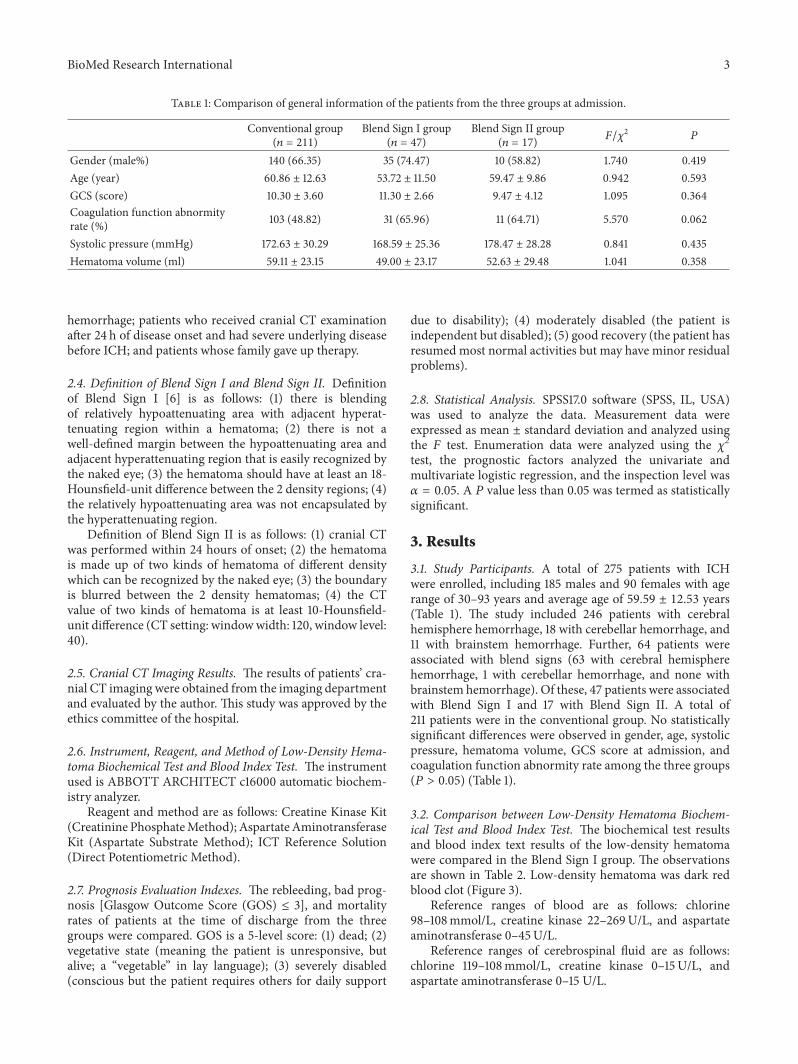
Table 1: Comparison of general information of the patients from the three groups at admission.
Conventional group(𝑛 = 211)
Blend Sign I group(𝑛 = 47)
Blend Sign II group(𝑛 = 17) 𝐹/𝜒2 𝑃
Gender (male%) 140 (66.35) 35 (74.47) 10 (58.82) 1.740 0.419Age (year) 60.86 ± 12.63 53.72 ± 11.50 59.47 ± 9.86 0.942 0.593GCS (score) 10.30 ± 3.60 11.30 ± 2.66 9.47 ± 4.12 1.095 0.364Coagulation function abnormityrate (%) 103 (48.82) 31 (65.96) 11 (64.71) 5.570 0.062
Systolic pressure (mmHg) 172.63 ± 30.29 168.59 ± 25.36 178.47 ± 28.28 0.841 0.435Hematoma volume (ml) 59.11 ± 23.15 49.00 ± 23.17 52.63 ± 29.48 1.041 0.358
hemorrhage; patients who received cranial CT examinationafter 24 h of disease onset and had severe underlying diseasebefore ICH; and patients whose family gave up therapy.
2.4. Definition of Blend Sign I and Blend Sign II. Definitionof Blend Sign I [6] is as follows: (1) there is blendingof relatively hypoattenuating area with adjacent hyperat-tenuating region within a hematoma; (2) there is not awell-defined margin between the hypoattenuating area andadjacent hyperattenuating region that is easily recognized bythe naked eye; (3) the hematoma should have at least an 18-Hounsfield-unit difference between the 2 density regions; (4)the relatively hypoattenuating area was not encapsulated bythe hyperattenuating region.
Definition of Blend Sign II is as follows: (1) cranial CTwas performed within 24 hours of onset; (2) the hematomais made up of two kinds of hematoma of different densitywhich can be recognized by the naked eye; (3) the boundaryis blurred between the 2 density hematomas; (4) the CTvalue of two kinds of hematoma is at least 10-Hounsfield-unit difference (CT setting: windowwidth: 120, window level:40).
2.5. Cranial CT Imaging Results. The results of patients’ cra-nial CT imaging were obtained from the imaging departmentand evaluated by the author. This study was approved by theethics committee of the hospital.
2.6. Instrument, Reagent, and Method of Low-Density Hema-toma Biochemical Test and Blood Index Test. The instrumentused is ABBOTT ARCHITECT c16000 automatic biochem-istry analyzer.
Reagent and method are as follows: Creatine Kinase Kit(Creatinine PhosphateMethod); AspartateAminotransferaseKit (Aspartate Substrate Method); ICT Reference Solution(Direct Potentiometric Method).
2.7. Prognosis Evaluation Indexes. The rebleeding, bad prog-nosis [Glasgow Outcome Score (GOS) ≤ 3], and mortalityrates of patients at the time of discharge from the threegroups were compared. GOS is a 5-level score: (1) dead; (2)vegetative state (meaning the patient is unresponsive, butalive; a “vegetable” in lay language); (3) severely disabled(conscious but the patient requires others for daily support
due to disability); (4) moderately disabled (the patient isindependent but disabled); (5) good recovery (the patient hasresumed most normal activities but may have minor residualproblems).
2.8. Statistical Analysis. SPSS17.0 software (SPSS, IL, USA)was used to analyze the data. Measurement data wereexpressed as mean ± standard deviation and analyzed usingthe 𝐹 test. Enumeration data were analyzed using the 𝜒2test, the prognostic factors analyzed the univariate andmultivariate logistic regression, and the inspection level was𝛼 = 0.05. A 𝑃 value less than 0.05 was termed as statisticallysignificant.
3. Results
3.1. Study Participants. A total of 275 patients with ICHwere enrolled, including 185 males and 90 females with agerange of 30–93 years and average age of 59.59 ± 12.53 years(Table 1). The study included 246 patients with cerebralhemisphere hemorrhage, 18 with cerebellar hemorrhage, and11 with brainstem hemorrhage. Further, 64 patients wereassociated with blend signs (63 with cerebral hemispherehemorrhage, 1 with cerebellar hemorrhage, and none withbrainstem hemorrhage). Of these, 47 patients were associatedwith Blend Sign I and 17 with Blend Sign II. A total of211 patients were in the conventional group. No statisticallysignificant differences were observed in gender, age, systolicpressure, hematoma volume, GCS score at admission, andcoagulation function abnormity rate among the three groups(𝑃 > 0.05) (Table 1).
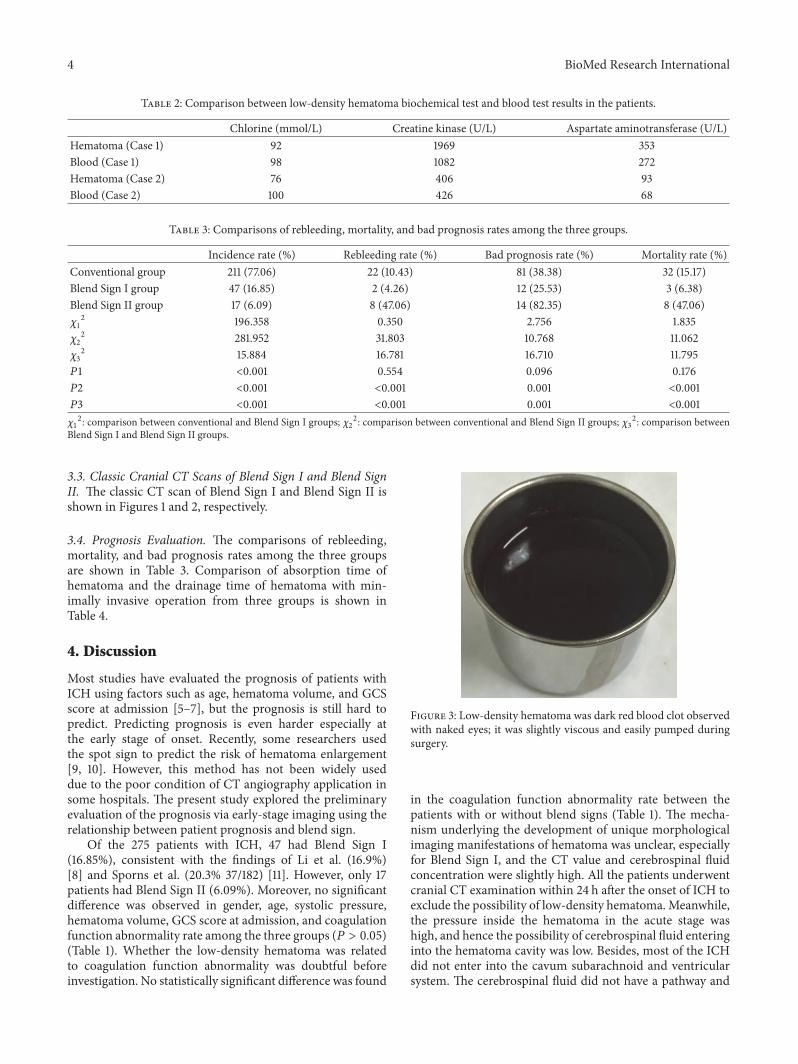
3.2. Comparison between Low-Density Hematoma Biochem-ical Test and Blood Index Test. The biochemical test resultsand blood index text results of the low-density hematomawere compared in the Blend Sign I group. The observationsare shown in Table 2. Low-density hematoma was dark redblood clot (Figure 3).
Reference ranges of blood are as follows: chlorine98–108mmol/L, creatine kinase 22–269U/L, and aspartateaminotransferase 0–45U/L.
Reference ranges of cerebrospinal fluid are as follows:chlorine 119–108mmol/L, creatine kinase 0–15U/L, andaspartate aminotransferase 0–15 U/L.
4 BioMed Research International
Table 2: Comparison between low-density hematoma biochemical test and blood test results in the patients.
Chlorine (mmol/L) Creatine kinase (U/L) Aspartate aminotransferase (U/L)Hematoma (Case 1) 92 1969 353Blood (Case 1) 98 1082 272Hematoma (Case 2) 76 406 93Blood (Case 2) 100 426 68
Table 3: Comparisons of rebleeding, mortality, and bad prognosis rates among the three groups.
Incidence rate (%) Rebleeding rate (%) Bad prognosis rate (%) Mortality rate (%)Conventional group 211 (77.06) 22 (10.43) 81 (38.38) 32 (15.17)Blend Sign I group 47 (16.85) 2 (4.26) 12 (25.53) 3 (6.38)Blend Sign II group 17 (6.09) 8 (47.06) 14 (82.35) 8 (47.06)𝜒12 196.358 0.350 2.756 1.835𝜒22 281.952 31.803 10.768 11.062𝜒32 15.884 16.781 16.710 11.795𝑃1 <0.001 0.554 0.096 0.176𝑃2 <0.001 <0.001 0.001 <0.001𝑃3 <0.001 <0.001 0.001 <0.001𝜒12: comparison between conventional and Blend Sign I groups; 𝜒2
2: comparison between conventional and Blend Sign II groups; 𝜒32: comparison between
Blend Sign I and Blend Sign II groups.
3.3. Classic Cranial CT Scans of Blend Sign I and Blend SignII. The classic CT scan of Blend Sign I and Blend Sign II isshown in Figures 1 and 2, respectively.
3.4. Prognosis Evaluation. The comparisons of rebleeding,mortality, and bad prognosis rates among the three groupsare shown in Table 3. Comparison of absorption time ofhematoma and the drainage time of hematoma with min-imally invasive operation from three groups is shown inTable 4.
4. Discussion
Most studies have evaluated the prognosis of patients withICH using factors such as age, hematoma volume, and GCSscore at admission [5–7], but the prognosis is still hard topredict. Predicting prognosis is even harder especially atthe early stage of onset. Recently, some researchers usedthe spot sign to predict the risk of hematoma enlargement[9, 10]. However, this method has not been widely useddue to the poor condition of CT angiography application insome hospitals. The present study explored the preliminaryevaluation of the prognosis via early-stage imaging using therelationship between patient prognosis and blend sign.
Of the 275 patients with ICH, 47 had Blend Sign I(16.85%), consistent with the findings of Li et al. (16.9%)[8] and Sporns et al. (20.3% 37/182) [11]. However, only 17patients had Blend Sign II (6.09%). Moreover, no significantdifference was observed in gender, age, systolic pressure,hematoma volume, GCS score at admission, and coagulationfunction abnormality rate among the three groups (𝑃 > 0.05)(Table 1). Whether the low-density hematoma was relatedto coagulation function abnormality was doubtful beforeinvestigation. No statistically significant difference was found
Figure 3: Low-density hematoma was dark red blood clot observedwith naked eyes; it was slightly viscous and easily pumped duringsurgery.
in the coagulation function abnormality rate between thepatients with or without blend signs (Table 1). The mecha-nism underlying the development of unique morphologicalimaging manifestations of hematoma was unclear, especiallyfor Blend Sign I, and the CT value and cerebrospinal fluidconcentration were slightly high. All the patients underwentcranial CT examination within 24 h after the onset of ICH toexclude the possibility of low-density hematoma.Meanwhile,the pressure inside the hematoma in the acute stage washigh, and hence the possibility of cerebrospinal fluid enteringinto the hematoma cavity was low. Besides, most of the ICHdid not enter into the cavum subarachnoid and ventricularsystem. The cerebrospinal fluid did not have a pathway and
BioMed Research International 5
Table 4: Exclusion of craniotomy: conventional group (𝑛 = 9), Blend Sign I group (𝑛 = 5), and Blend Sign II group (𝑛 = 2). Comparison ofabsorption time of hematoma and the drainage time of hematoma with minimally invasive operation from three groups.
Nonoperativetreatment (%)
Hematomaabsorption time (d)
Minimally invasivesurgery rate (%)
Hematoma drainagetime (d)
Conventional group (202) 77 (38.11) 22.91 ± 5.14 125 (61.88) 6.25 ± 0.81Blend Sign I group (42) 16 (38.09) 15.58 ± 3.87 26 (61.90) 4.00 ± 0.96Blend Sign II group (15) 4 (26.66) 22.33 ± 2.46 11 (73.33) 5.66 ± 0.88𝜒12/𝑡 0. 00 −3.94 0.00 −5.82𝜒22/𝑡 0.783 −0.35 0.783 −4.54𝜒32/𝑡 0.634 5.63 0.634 1.54𝑃1 0.997 <0.001 0.997 <0.001𝑃2 0.543 0.363 0.543 0.001𝑃3 0.630 <0.001 0.630 0.068𝜒12/𝑡: comparison between conventional and Blend Sign I groups; 𝜒2
2/𝑡: comparison between conventional and Blend Sign II groups; 𝜒32/𝑡: comparison
between Blend Sign I and Blend Sign II groups.
hence could not enter into the hematoma cavity. Thus, low-density hematoma might not be cerebrospinal fluid. Low-density hematomas from two patients in the Blend Sign Igroup were selected for this study. Low-density hematomawas a slightly viscous dark red nonclotting blood, whichcould be observed with naked eyes (Figure 3); it wasalso easily drained during surgery. The patients with smallhematoma volume inBlend Sign I group received nonsurgicaltreatment. Because of the presence of low-density hematoma,the absorption time of hematoma in Blend Sign I groupwas shorter than that in conventional group and BlendSign II group. In patients with large hematoma volumeand minimally invasive operation in Blend Sign I group,the drainage time of hematoma was also shorter than thatof conventional group and Blend Sign II group (Table 4).Low-density hematoma from two patients with Blend SignI was selected to perform biochemical detection and wasfurther compared with patients’ peripheral blood.The resultsindicated that chloride ion concentrations in low-densityhematoma from the two patients were slightly lower thanthose in the blood (Table 2). It was assumed that low-density hematoma was composed of cerebrospinal fluid andsome blood. The chloride ion concentration in low-densityhematoma was higher than that in the peripheral bloodbecause the concentration in the cerebrospinal fluid washigher than that in the blood. Since low-density hematomawas composed of serum and part of blood and the concen-trations of creatine kinase and aspartate aminotransferase inhematoma were close to those in the peripheral blood, low-density hematoma was presumed to comprise mainly blood.The low-density hematoma component of Blend Sign I wasserum precipitated from blood clot mixed with blood. Theanalysis of the patients from the three groups indicated thatrebleeding, bad prognosis, and mortality rates in the BlendSign I and Blend Sign II groups were different; the prognosisin Blend Sign I and conventional groupswas similar (Table 3).However, the rebleeding rate in the Blend Sign II group wasup to 47.06% (8/17), which was much higher than that inthe conventional (10.43%) and Blend Sign I groups (4.26%)(𝑃 < 0.001). The possible reason was that the mechanism
Table 5: Univariate analysis of predictors for early prognosis.
Variable OR 95% CI 𝑃
Gender (male%) 1.825 0.921–3.618 0.085Age (year) 1.059 1.030–1.089 <0.001GCS (score) 0.686 0.612–0.769 <0.001Hematoma volume (ml) 1.006 0.993–1.018 0.362Blend Sign I 1.032 0.419–2.541 0.945Blend Sign II 4.894 1.094–21.893 0.038Rebleeding 14.341 4.806–42.800 <0.001
Table 6: Multivariate analysis of predictors for early prognosis.
Variable OR 95% CI 𝑃
Age (year) 1.056 1.028–1.085 <0.001GCS (score) 0.686 0.618–0.761 <0.001Blend Sign II 4.792 1.065–21.568 0.041Rebleeding 14.871 5.064–43.668 <0.001
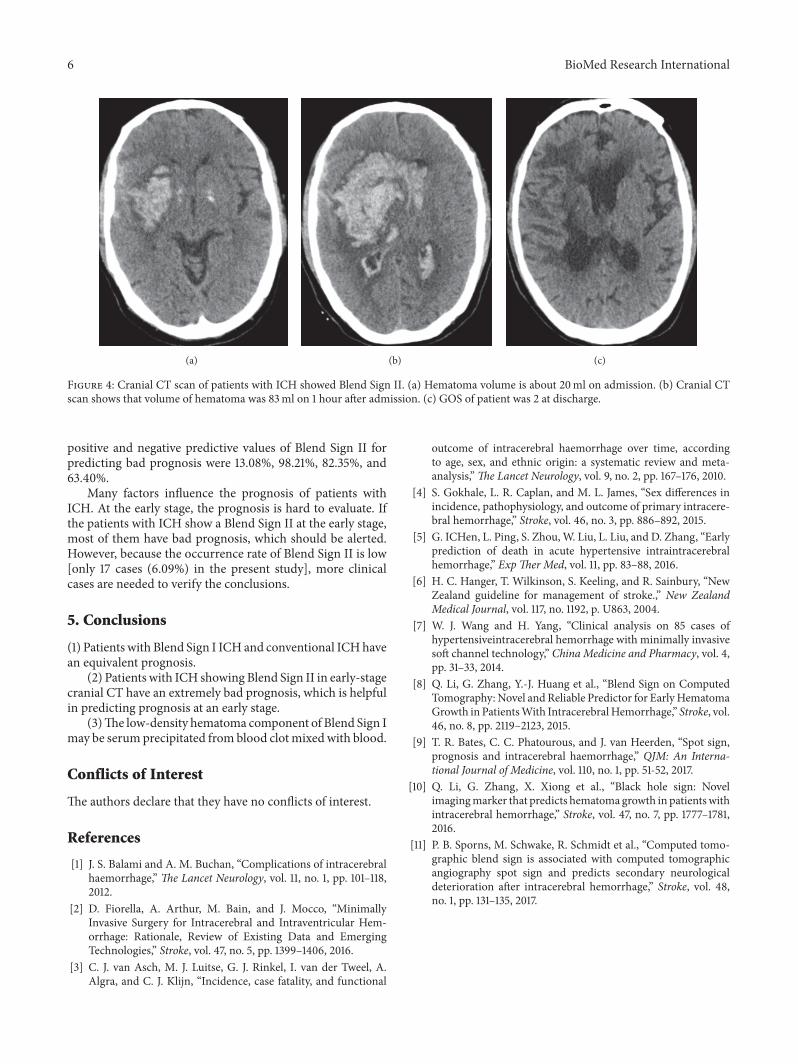
of hematoma formation was active bleeding, and low-densityhematoma was new blood. The new and old hematomasmixed and formed the imaging morphology of Blend Sign II.This led to a continuous increase in the volumeof hematomas,influencing patient prognosis (Figure 4). The bad prognosisrate was up to 82.35% (14/17), and the mortality rate was47.06% (8/17), which were significantly higher than thosein the Blend Sign I and conventional groups (Table 3). Theprognosis of Blend Sign II was poor.
We have statistically analysed blend sign and the commonprognostic factors (age, sex, hematoma volume, rebleeding,and GCS) of prognosis of patients with ICH. Univariateanalysis showed that Blend Sign II age, GCS score, andrebleeding were closely related to the poor prognosis (𝑃 <0.05) (Table 5). Multivariate analysis was found to be OR =4.792 (OR > 1) in Blend Sign II, 95% CI: 1.065–21.568, 𝑃 =0.041 (𝑃 < 0.05) (Table 6). Blend Sign II age and hemorrhagewere independent risk factors for predicting poor prognosisof ICH. In this study, the reported sensitivity, specificity,
6 BioMed Research International
(a) (b) (c)
Figure 4: Cranial CT scan of patients with ICH showed Blend Sign II. (a) Hematoma volume is about 20ml on admission. (b) Cranial CTscan shows that volume of hematoma was 83ml on 1 hour after admission. (c) GOS of patient was 2 at discharge.
positive and negative predictive values of Blend Sign II forpredicting bad prognosis were 13.08%, 98.21%, 82.35%, and63.40%.
Many factors influence the prognosis of patients withICH. At the early stage, the prognosis is hard to evaluate. Ifthe patients with ICH show a Blend Sign II at the early stage,most of them have bad prognosis, which should be alerted.However, because the occurrence rate of Blend Sign II is low[only 17 cases (6.09%) in the present study], more clinicalcases are needed to verify the conclusions.
5. Conclusions
(1) Patients with Blend Sign I ICH and conventional ICHhavean equivalent prognosis.
(2) Patients with ICH showing Blend Sign II in early-stagecranial CT have an extremely bad prognosis, which is helpfulin predicting prognosis at an early stage.
(3)The low-density hematoma component of Blend Sign Imay be serum precipitated from blood clotmixed with blood.
Conflicts of Interest
The authors declare that they have no conflicts of interest.
References
[1] J. S. Balami and A. M. Buchan, “Complications of intracerebralhaemorrhage,” The Lancet Neurology, vol. 11, no. 1, pp. 101–118,2012.
[2] D. Fiorella, A. Arthur, M. Bain, and J. Mocco, “MinimallyInvasive Surgery for Intracerebral and Intraventricular Hem-orrhage: Rationale, Review of Existing Data and EmergingTechnologies,” Stroke, vol. 47, no. 5, pp. 1399–1406, 2016.
[3] C. J. van Asch, M. J. Luitse, G. J. Rinkel, I. van der Tweel, A.Algra, and C. J. Klijn, “Incidence, case fatality, and functional
outcome of intracerebral haemorrhage over time, accordingto age, sex, and ethnic origin: a systematic review and meta-analysis,”The Lancet Neurology, vol. 9, no. 2, pp. 167–176, 2010.
[4] S. Gokhale, L. R. Caplan, and M. L. James, “Sex differences inincidence, pathophysiology, and outcome of primary intracere-bral hemorrhage,” Stroke, vol. 46, no. 3, pp. 886–892, 2015.
[5] G. ICHen, L. Ping, S. Zhou,W. Liu, L. Liu, and D. Zhang, “Earlyprediction of death in acute hypertensive intraintracerebralhemorrhage,” ExpTher Med, vol. 11, pp. 83–88, 2016.
[6] H. C. Hanger, T. Wilkinson, S. Keeling, and R. Sainbury, “NewZealand guideline for management of stroke.,” New ZealandMedical Journal, vol. 117, no. 1192, p. U863, 2004.
[7] W. J. Wang and H. Yang, “Clinical analysis on 85 cases ofhypertensiveintracerebral hemorrhage with minimally invasivesoft channel technology,” China Medicine and Pharmacy, vol. 4,pp. 31–33, 2014.
[8] Q. Li, G. Zhang, Y.-J. Huang et al., “Blend Sign on ComputedTomography: Novel and Reliable Predictor for EarlyHematomaGrowth in PatientsWith IntracerebralHemorrhage,” Stroke, vol.46, no. 8, pp. 2119–2123, 2015.
[9] T. R. Bates, C. C. Phatourous, and J. van Heerden, “Spot sign,prognosis and intracerebral haemorrhage,” QJM: An Interna-tional Journal of Medicine, vol. 110, no. 1, pp. 51-52, 2017.
[10] Q. Li, G. Zhang, X. Xiong et al., “Black hole sign: Novelimagingmarker that predicts hematoma growth in patientswithintracerebral hemorrhage,” Stroke, vol. 47, no. 7, pp. 1777–1781,2016.
[11] P. B. Sporns, M. Schwake, R. Schmidt et al., “Computed tomo-graphic blend sign is associated with computed tomographicangiography spot sign and predicts secondary neurologicaldeterioration after intracerebral hemorrhage,” Stroke, vol. 48,no. 1, pp. 131–135, 2017.
Stem Cells International
Hindawiwww.hindawi.com Volume 2018
Hindawiwww.hindawi.com Volume 2018
MEDIATORSINFLAMMATION
of
EndocrinologyInternational Journal of
Hindawiwww.hindawi.com Volume 2018
Hindawiwww.hindawi.com Volume 2018
Disease Markers
Hindawiwww.hindawi.com Volume 2018
BioMed Research International
OncologyJournal of
Hindawiwww.hindawi.com Volume 2013
Hindawiwww.hindawi.com Volume 2018
Oxidative Medicine and Cellular Longevity
Hindawiwww.hindawi.com Volume 2018
PPAR Research
Hindawi Publishing Corporation http://www.hindawi.com Volume 2013Hindawiwww.hindawi.com
The Scientific World Journal
Volume 2018
Immunology ResearchHindawiwww.hindawi.com Volume 2018
Journal of
ObesityJournal of
Hindawiwww.hindawi.com Volume 2018
Hindawiwww.hindawi.com Volume 2018
Computational and Mathematical Methods in Medicine
Hindawiwww.hindawi.com Volume 2018
Behavioural Neurology
OphthalmologyJournal of
Hindawiwww.hindawi.com Volume 2018
Diabetes ResearchJournal of
Hindawiwww.hindawi.com Volume 2018
Hindawiwww.hindawi.com Volume 2018
Research and TreatmentAIDS
Hindawiwww.hindawi.com Volume 2018
Gastroenterology Research and Practice
Hindawiwww.hindawi.com Volume 2018
Parkinson’s Disease
Evidence-Based Complementary andAlternative Medicine
Volume 2018Hindawiwww.hindawi.com
Submit your manuscripts atwww.hindawi.com