Embed Size (px)
Citation preview
Florida International UniversityFIU Digital Commons
HWCOM Faculty Publications Herbert Wertheim College of Medicine
4-18-2019
Early Lifestyle Interventions in People withImpaired Glucose Tolerance in NorthernColombia: The DEMOJUAN ProjectNoel C. BarengoHerbert Wertheim College of Medicine, Florida International University, [email protected]
Tania AcostaUniversidad del Norte - Colombia
Astrid ArrietaCentro de Investigation Sanitaria
Carlos RicaurteCentro de Investigation Sanitaria
Dins SmitsRiga Stradins University
See next page for additional authors
This work is licensed under a Creative Commons Attribution 4.0 License.Follow this and additional works at: https://digitalcommons.fiu.edu/com_facpub
Part of the Physical Sciences and Mathematics Commons
This work is brought to you for free and open access by the Herbert Wertheim College of Medicine at FIU Digital Commons. It has been accepted forinclusion in HWCOM Faculty Publications by an authorized administrator of FIU Digital Commons. For more information, please [email protected].
Recommended CitationBarengo, Noel C.; Acosta, Tania; Arrieta, Astrid; Ricaurte, Carlos; Smits, Dins; Florez, Karen; and Tuomilehto, Jaakko O., "EarlyLifestyle Interventions in People with Impaired Glucose Tolerance in Northern Colombia: The DEMOJUAN Project" (2019).HWCOM Faculty Publications. 146.https://digitalcommons.fiu.edu/com_facpub/146

AuthorsNoel C. Barengo, Tania Acosta, Astrid Arrieta, Carlos Ricaurte, Dins Smits, Karen Florez, and Jaakko O.Tuomilehto
This article is available at FIU Digital Commons: https://digitalcommons.fiu.edu/com_facpub/146
International Journal of
Environmental Research
and Public Health
Article
Early Lifestyle Interventions in People with ImpairedGlucose Tolerance in Northern Colombia: TheDEMOJUAN Project
Noël C. Barengo 1,2,* , Tania Acosta 3 , Astrid Arrieta 4, Carlos Ricaurte 4, Dins Smits 5 ,Karen Florez 6 and Jaakko O. Tuomilehto 2,7,8
1 Department of Medical and Population Health Research, Herbert Wertheim College of Medicine,Florida International University, Miami, FL 33178, USA
2 Department of Public Health, Faculty of Medicine, University of Helsinki, 00100 Helsinki, Finland;[email protected]
3 Department of Public Health, Universidad del Norte, Barranquilla 080001, Colombia;[email protected]
4 Centro de Investigation Sanitaria, Barranquilla 080001, Colombia; [email protected] (A.A.);[email protected] (C.R.)
5 Faculty of Medicine, Riga Stradins University, LV-1007 Riga, Latvia; [email protected] Departamento de Matemáticas y Estadística, Universidad del Norte, Barranquilla 080001, Colombia;
[email protected] Department of Public Health Solutions, National Institute for Health and Welfare, 00271 Helsinki, Finland8 Saudi Diabetes Research Group, King Abdulaziz University, Jeddah 21589, Saudi Arabia* Correspondence: [email protected]; Tel.: +1-305-842-8793
Received: 22 February 2019; Accepted: 15 April 2019; Published: 18 April 2019�����������������
Abstract: Background: The objective of the demonstration project for type 2 diabetes prevention in theBarranquilla and Juan Mina (DEMOJUAN) study was to investigate the extent to which it is possibleto reach normal glucose metabolism with early lifestyle interventions in people at high risk of type 2diabetes (prediabetes), compared with those who receive standard usual care. Methods: DEMOJUANwas a randomized controlled trial conducted in Juan Mina and Barranquilla, Northern Colombia.Eligible participants were randomized into one of three groups (control group, initial nutritionalintervention, and initial physical activity intervention). The duration of the intervention was 24months. The main study outcome in the present analysis was reversion to normoglycemia. Relativerisks and their corresponding 95% confidence intervals were calculated for reversal to normoglycemiaand T2D incidence. Results: There was no statistically significant association between the interventiongroups and reversion to normoglycemia. The relative risk of reversion to normoglycemia was 0.88(95% CI 0.70–1.12) for the initial nutritional intervention group participants and 0.95 (95% CI 0.75–1.20)for the initial physical activity intervention group participants. Conclusions: Our study did not findany statistically significant differences in reversion to normoglycemia or the development of type 2diabetes between the intervention groups and the control group in this population.
Keywords: glucose metabolism disorders; primary prevention; South America; population; field trial
1. Introduction
The International Diabetes Federation (IDF) has estimated that the number of adults with diabetesis expected to rise from 425 million in 2017 to 629 million by 2045 [1]. According to recent data in2017, the national prevalence of type 2 diabetes (T2D) in Colombia was 8.1% for the 20- to 79-year-oldpopulation, imposing a heavy financial burden on the primary healthcare system [1]. Prematuremortality caused by T2D may lead to 12–14 years of life lost [2].
Int. J. Environ. Res. Public Health 2019, 16, 1403; doi:10.3390/ijerph16081403 www.mdpi.com/journal/ijerph
Int. J. Environ. Res. Public Health 2019, 16, 1403 2 of 13
Randomized controlled trials carried out in different populations have successfully revealedthat, in people with impaired glucose tolerance (IGT), the progression to T2D can be prevented ordelayed by lifestyle intervention [3–9]. These studies have revealed that nutritional and physicalactivity interventions can decrease the relative risk of T2D by 30–60% in people with IGT in controlledsettings [3–9]. The length of the interventions of previously mentioned trials varied between 2.5 and6 years [3–9]. However, none of these studies included Latin American populations.
Several studies have investigated whether the results of these randomized clinical trials can beimplemented within the primary healthcare system [10–18]. However, the main outcome assessed bythese translational research projects was weight loss, not conversion to normoglycemia, which shouldhave been the main target. Weight loss was greater, in almost all studies, in the intervention groupsthan with the controls. In addition, the majority of the studies did not find differences in blood glucoseor waist circumference. Scientific evidence regarding T2D prevention is lacking from Latin America.
While previous findings offer a compelling evidence base, it is necessary to learn how theprevention of T2D works in real life in different settings and population groups. In addition, it isimportant to find out how well the lifestyle interventions work within the primary healthcare systemin Latin America. Thus far, such trials have not been carried out in the Caribbean region of LatinAmerica and it is not known whether these lifestyle interventions will work well in a hot and humidclimate, particularly in the physical activity component. The extreme weather conditions seen in theCaribbean region (thunder storms and humid conditions) may need special logistics and motivation toimprove daily physical activity of the study population.
The main objective of this analysis of the data from the demonstration project for T2D diabetesprevention in the Barranquilla and Juan Mina (DEMOJUAN) study was to investigate the extent towhich it is possible to reach normal glucose metabolism with early lifestyle interventions in people athigh risk of T2D, compared with those who receive standard therapy (usual care).
2. Materials and Methods
2.1. Study Design and Oversight
The design of the DEMOJUAN study was a three-arm, parallel-group, randomized, and controlledfield trial, using individual random allocation, and was carried out in Juan Mina and Barranquilla,Northern Colombia [19]. The study site had approximately 1 million inhabitants at the time ofparticipant recruitment. A trial coordinating center in Barranquilla served as a data and statisticalanalysis center and supervised all study sites where patients were recruited and included in the trial.
This project was supported by a BRIDGES Grant from the Global Diabetes Foundation. BRIDGES,an International Diabetes Federation project, is supported by an educational grant from Lilly Diabetes.This study followed the Good Clinical Practice guidelines and the guidelines of the Helsinki Declaration.All data were collected using previously tested questionnaires and methods as much as possible. Asidefrom blood samples, no invasive methods were used. The study protocol was approved by the researchethics committee of the University Pontificia Javeriana, Bogota, Colombia. All the participants gavetheir written informed consent prior to participation in the study. The steering committee designed thestudy, gathered the data (in collaboration with investigators at the local clinics and other study units),made the decision to submit the manuscript for publication, and guaranteed the compliance of thestudy with the protocol.
The trial was registered at https://clinicaltrials.gov/ (NCT01296100 (2/12/2011)). This work hasbeen developed following the guidelines of the CONSORT statement, the evidence-based minimumset of recommendations for reporting randomized trials [20].
2.2. Study Population
The study participants were recruited in the study sites (Juan Mina and Barranquilla) by populationscreening, using the Finnish Diabetes Risk Score (FINDRISC) [21–23]. The FINDRISC is based on easily
Int. J. Environ. Res. Public Health 2019, 16, 1403 3 of 13
available information using eight parameters with categorized answers. The total risk score valueranges from 0 to 26. A FINDRISC of >13 points was considered to be a high risk of having IGT/IFGor diabetes. The FINDRISC was originally shown to predict the 10-year risk of drug-treated T2Dwith a sensitivity of 78–81% and a specificity of 76–77% [21]. Furthermore, it also detects reasonablyprevalent asymptomatic T2D and other disorders of glucose metabolism [23]. The FINDRISC has beenvalidated in many populations with good results [24–27] and has been successfully applied in primarycare in Barcelona, Spain [19]. It is recommended by the International Diabetes Federation and in theguideline by the European Society for the Study of Diabetes and the European Society of Cardiology asa screening tool for T2D [28,29]. In our study, all people with more than 13 FINDRISC points wereinvited to an oral glucose tolerance test (OGTT).
Participants 34–69 years of age with a 2-h post-challenge glucose level of 140–200 mg/dL (IGT) ora fasting plasma glucose level between 100 and 126 mg/dL (impaired fasting glucose) were includedin the study. In addition to the initially defined inclusion criteria when registering the trial, we alsoaccepted participants with isolated impaired fasting glucose (n = 109) into the study. The reasons forthese changes were numerous. Firstly, people with IFG have a similar risk of progressing to diabetes aspeople with IGT. Secondly, there is a lack of knowledge regarding the prevention potential in peoplewith IFG, since almost all diabetes prevention trials have used IGT as the entry criterion. People withpharmacologically treated diabetes and hypertriglyceridemia while undergoing drug treatment, ahistory of life-limiting diseases or events, and an unwillingness to sign the informed consent wereexcluded from the study.
2.3. Randomization and Interventions
Eligible participants were randomly allocated to one of three groups (A, B, or C) with 1:1:1allocation. The sequences for the random allocation groups were generated by IBM SPSS statisticsversion 19.0 for Windows (IBM Corp.: Armonk, NY, USA). The randomization list was prepared by anindependent statistician. Participants and study personnel were aware of the study-group assignments,but outcome adjudicators were not.
During the following 24 months, the control group (A) received standard treatment (usual care:Lifestyle advice prescribed by his/her physician). In addition, the participants in the control groupwere told about their high risk of T2D and received a “mini-intervention” to improve their lifestyle.The two intervention groups (Groups B and C) received early intensive lifestyle interventions. GroupB received first a nutritional intervention for 6 months, followed by the physical activity intervention(6 months), and a combined nutritional and physical activity intervention (12 months). They were alsoprovided with individual advice about how to achieve the intervention goals. These goals were (i)reduction in weight of >5%, (ii) total fat intake less than 30% of energy consumed, (iii) saturated fatintake less than 10 % of energy consumed, and (iv) fruit or vegetable intake of at least 500 g per day.The participants of group C started with the physical activity intervention (6 months) followed by thenutritional intervention (6 months). The physical activity intervention consisted of individual visitswith a physical activity specialist and monthly group seminars. Each participant had six individualvisits with a physical activity specialist (four times during the first year and twice in the second year),where each participant received an individual physical activity prescription. The goal of the physicalactivity intervention was to practice moderate-intensity exercise for 30 min a day or more. In addition,the participants of Groups B and C were divided into groups of 10 participants for the group seminars,too. The group seminars were held monthly during the first 12 months of the intervention and thenevery second month during the second year of the intervention. The group seminars were givenby a nutritionist and physical activity specialist. During the lifestyle intervention period, the studyparticipants had two study visits at month 1 and 24, respectively. The OGTT was done at month 1 andmonth 24. In order to reduce the possibility of bias due to visiting schedule, both intervention groupshad their group sessions and individual visits in parallel, at the same time. However, the seminars
Int. J. Environ. Res. Public Health 2019, 16, 1403 4 of 13
were held independently for the participants of Groups B and C. The description of the topics of thelifestyle intervention program are presented in Supplementary file S2.
2.4. Study Measurements
2.4.1. Non-Invasive Measurements
Lifestyle habits and risk factors for T2D were assessed by an interview, using a questionnaireconsisting of information regarding sociodemographic factors, history of T2D, medical history, tobaccoconsumption, hypertension, and nutritional and physical activity habits. The instruments appliedwere designed based on FINDRISC, the World Health Organization Stepwise approach to surveillance(STEPS) of non-communicable disease risk factors, and International Physical Activity Questionnaire(IPAQ) [30,31]. All questionnaires have been successfully validated in large international studies [32–36].Physical activity measured with the questionnaire shows a high correlation with physical fitness,measured by maximal oxygen uptake [34–36]. Dietary habits were assessed by 16 questions (e.g.,dietary pattern, quality and quantity of dietary fat, consumption of fruit and vegetables, grains, milkand meat products, desserts, sweets, and alcoholic beverages). In addition, 6 questions were related toperceived needs and intentions to make dietary changes. Scientific validation of the diet questionnairewas carried out in the National Institute for Health and Welfare in Helsinki, Finland [37]. The studyquestionnaire can be found in Supplementary file S1.
All measurements followed a standardized protocol and the staff taking the measurements wereprofessionals with long-standing experience in measuring anthropometry and blood pressure. Heightand weight were measured without shoes and with light clothing. BMI was calculated as weight (kg)divided by height2 (m2). Waist circumference (to the nearest cm) was measured at the approximatemidpoint between the lower margin of the last palpable rib and the top of the iliac crest. The categories,<94 cm vs. ≥94 cm in men and <90 cm vs. ≥90 cm in women, were used to identify abdominal obesityin the Latin American population [38]. Blood pressure (2 mm Hg precision) was recorded twice with amercury sphygmomanometer in a seated position.
2.4.2. Biochemical Measurements
All participants underwent an OGTT that was carried out according to the World HealthOrganization (WHO) recommendations [39]. The test started after at least 12 h of fasting, and thefasting and 2-h blood samples were obtained after oral ingestion of water solution with 75 g anhydrousglucose. The glucose tolerance status was classified according to the criteria of the American DiabetesAssociation [40]. Individuals who had a fasting plasma glucose level ≥126 mg/dL or 2 h plasmaglucose (2hPG) level ≥200 mg/dL were classified as having T2D. Those with 2hPG ≥ 140 mg/dLbut <200 mg/dL, and FPG < 100 mg/dL were classified as having isolated IGT. Isolated IFG was definedas FPG ≥ 100 but <126 mg/dL, and 2hPG < 140 mg/dL. People with 2hPG ≥ 140 mg/dL but <200 mg/dL,and FPG ≥ 100 but <126 mg/dL were defined as having combined IGT and IFG. People with T2D, IGT,or IFG were classified as having IGT.
2.5. Study Outcomes
The main study hypothesis was that the lifestyle interventions would lead to a higher reversion tonormoglycemia, defined as FPG < 100 mg/dL and 2hPG < 140 mg/dL, compared with the control group.
We also evaluated the development of T2D in the study participants.
2.6. Statistical Analysis
The study was designed to have a 90% power to detect a 20% percentage unit difference in recoveryfrom IGT (comparing 70% vs. 50% recovery rates) between the treatment groups at 5% significancelevel. This estimate was chosen due to previous scientific evidence revealing that, as compared withthe placebo, pharmaceutical intervention might increase the conversion rate to normoglycemia from
Int. J. Environ. Res. Public Health 2019, 16, 1403 5 of 13
50 to 70% in people with IGT [7,41–43]. Assuming a 30% loss to follow up at the end of the 24-monthintervention, a total of 200 participants were needed in both treatment groups (total sample size of 600individuals). The estimated drop-out of 30% was decided according to the results and experiencesof previous randomized controlled diabetes trials in Europe and the Unites States [6,11,44]. Thedata was analyzed using SPSS statistics version 19.0 for Windows with use of the intention-to-treatapproach for all randomly assigned participants. The variables were checked for normality usingKolmogorov–Smirnoff tests. The χ2 test was used to test differences in the distribution betweencategorized variables. Collinearity diagnostics were used to check for correlations between thevariables. Relative risks and their corresponding 95% confidence intervals for the intervention groupscompared with the control groups were calculated for reversal to normoglycemia and T2D incidence.Differences in FPG and 2hPG among the three groups were assessed using mixed-design analysis ofvariance models in order to adjust the estimates for the difference in glucose status at baseline. Theresults are expressed as percentages, means, and standard errors/standard deviations. The thresholdfor statistical significance was set to 0.05.
3. Results
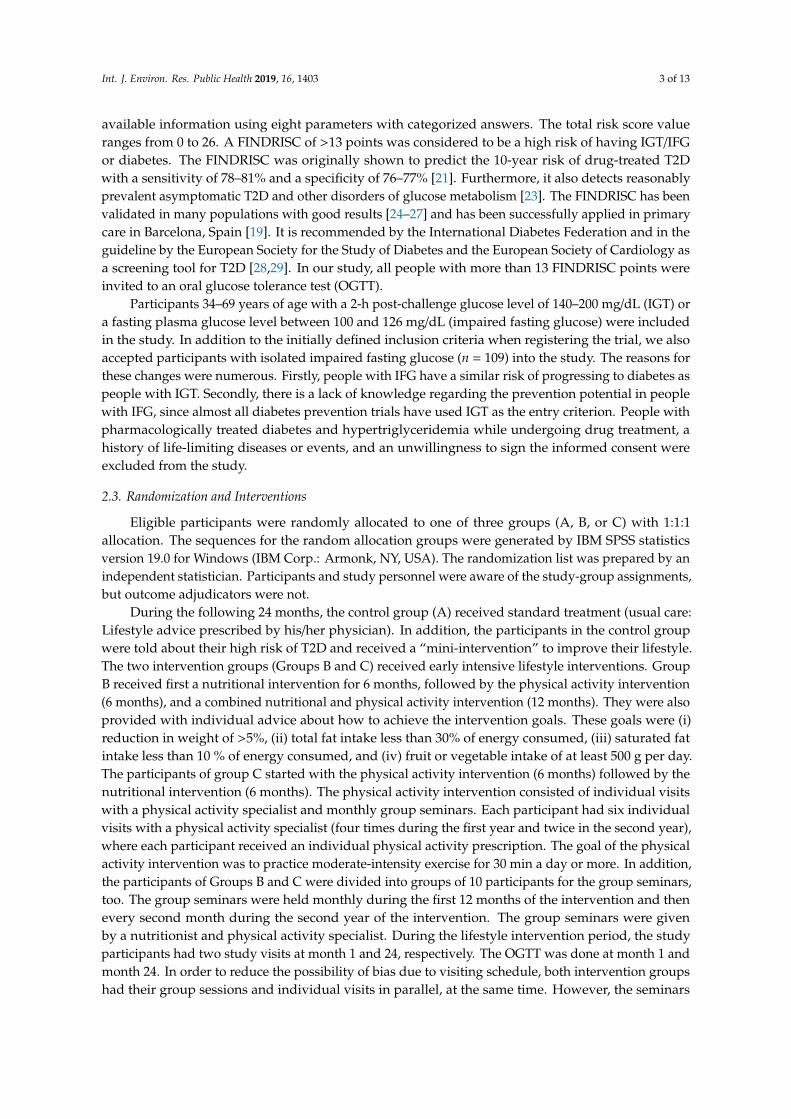
Figure 1 shows the eligibility, random allocation, and follow-up of the study participants. In total,14,193 people from the community were screened using the FINDRISC. Those with a FINDRISC of atleast 13 points were invited to an OGTT (n = 4915) and approximately 50% of those invited attended.Among those with an OGTT result, 1535 did not fulfill the entry criteria of the study, as they had eithernormoglycemia or screen-detected T2D. A total of 772 participants were randomly allocated to thethree groups: (A) Control group (n = 246); (B) initial nutritional intervention group (n = 261); and (C)initial physical activity intervention group (n = 265), respectively. Half of the study participants werelost during the follow-up of at least 18 months, the final number of study participants that entered thedata analysis process was 122 for the control group (50%), 136 in the nutritional intervention group(52%), and 132 in the physical activity intervention group (50%).
Figure 1. Eligibility, random allocation, and follow-up of the study participants. Discontinuedintervention refers to participants who discontinued, due to being lost in the follow-up.
Int. J. Environ. Res. Public Health 2019, 16, 1403 6 of 13
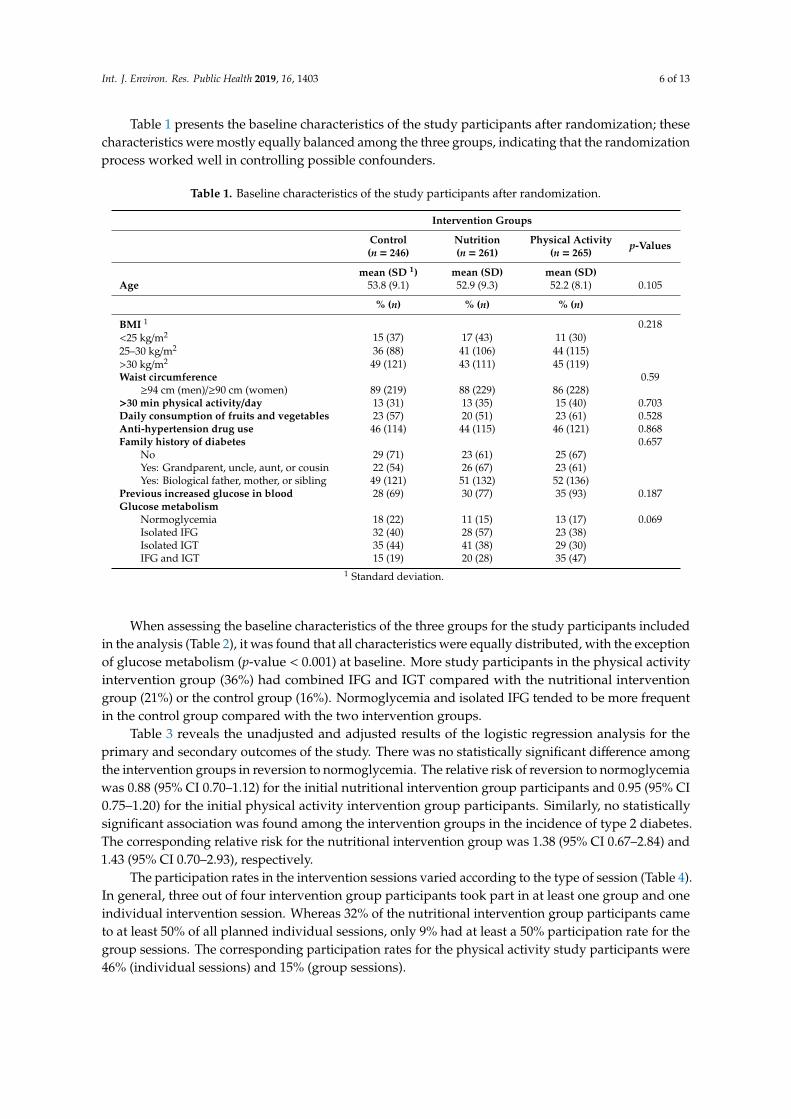
Table 1 presents the baseline characteristics of the study participants after randomization; thesecharacteristics were mostly equally balanced among the three groups, indicating that the randomizationprocess worked well in controlling possible confounders.
Table 1. Baseline characteristics of the study participants after randomization.
Intervention Groups
Control Nutrition Physical Activity p-Values(n = 246) (n = 261) (n = 265)
mean (SD 1) mean (SD) mean (SD)Age 53.8 (9.1) 52.9 (9.3) 52.2 (8.1) 0.105
% (n) % (n) % (n)
BMI 1 0.218<25 kg/m2 15 (37) 17 (43) 11 (30)25–30 kg/m2 36 (88) 41 (106) 44 (115)>30 kg/m2 49 (121) 43 (111) 45 (119)Waist circumference 0.59
≥94 cm (men)/≥90 cm (women) 89 (219) 88 (229) 86 (228)>30 min physical activity/day 13 (31) 13 (35) 15 (40) 0.703Daily consumption of fruits and vegetables 23 (57) 20 (51) 23 (61) 0.528Anti-hypertension drug use 46 (114) 44 (115) 46 (121) 0.868Family history of diabetes 0.657
No 29 (71) 23 (61) 25 (67)Yes: Grandparent, uncle, aunt, or cousin 22 (54) 26 (67) 23 (61)Yes: Biological father, mother, or sibling 49 (121) 51 (132) 52 (136)
Previous increased glucose in blood 28 (69) 30 (77) 35 (93) 0.187Glucose metabolism
Normoglycemia 18 (22) 11 (15) 13 (17) 0.069Isolated IFG 32 (40) 28 (57) 23 (38)Isolated IGT 35 (44) 41 (38) 29 (30)IFG and IGT 15 (19) 20 (28) 35 (47)
1 Standard deviation.
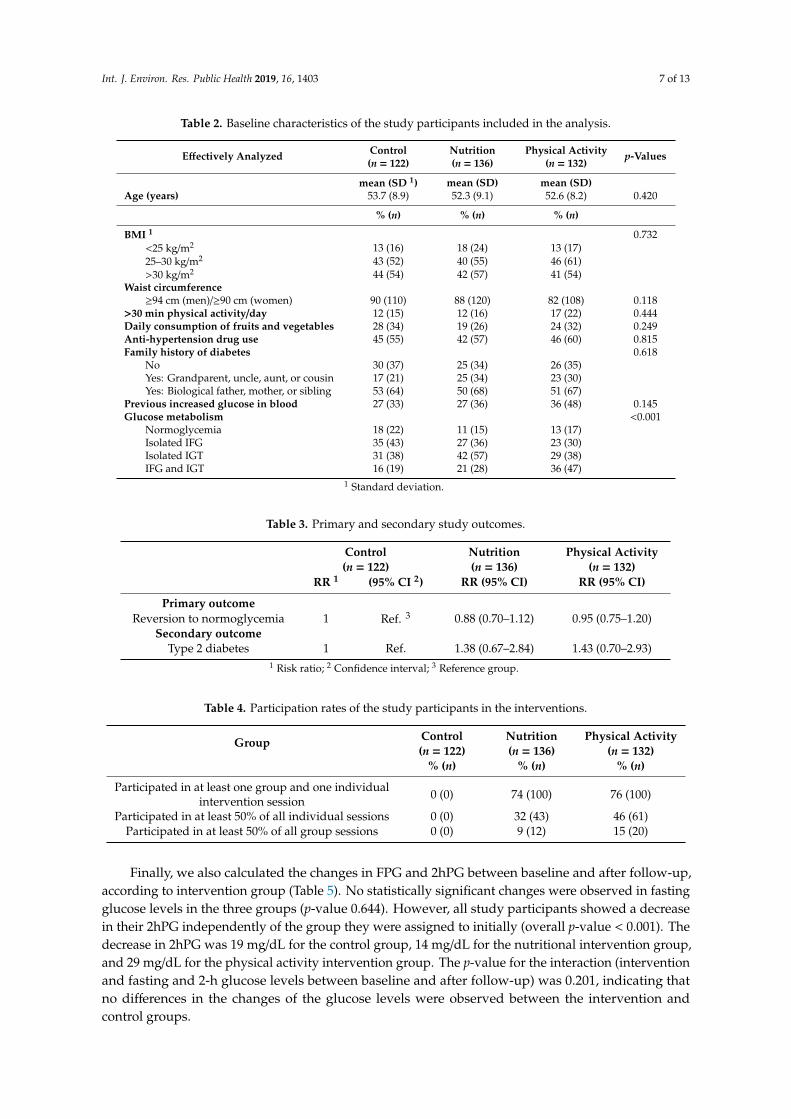
When assessing the baseline characteristics of the three groups for the study participants includedin the analysis (Table 2), it was found that all characteristics were equally distributed, with the exceptionof glucose metabolism (p-value < 0.001) at baseline. More study participants in the physical activityintervention group (36%) had combined IFG and IGT compared with the nutritional interventiongroup (21%) or the control group (16%). Normoglycemia and isolated IFG tended to be more frequentin the control group compared with the two intervention groups.
Table 3 reveals the unadjusted and adjusted results of the logistic regression analysis for theprimary and secondary outcomes of the study. There was no statistically significant difference amongthe intervention groups in reversion to normoglycemia. The relative risk of reversion to normoglycemiawas 0.88 (95% CI 0.70–1.12) for the initial nutritional intervention group participants and 0.95 (95% CI0.75–1.20) for the initial physical activity intervention group participants. Similarly, no statisticallysignificant association was found among the intervention groups in the incidence of type 2 diabetes.The corresponding relative risk for the nutritional intervention group was 1.38 (95% CI 0.67–2.84) and1.43 (95% CI 0.70–2.93), respectively.
The participation rates in the intervention sessions varied according to the type of session (Table 4).In general, three out of four intervention group participants took part in at least one group and oneindividual intervention session. Whereas 32% of the nutritional intervention group participants cameto at least 50% of all planned individual sessions, only 9% had at least a 50% participation rate for thegroup sessions. The corresponding participation rates for the physical activity study participants were46% (individual sessions) and 15% (group sessions).
Int. J. Environ. Res. Public Health 2019, 16, 1403 7 of 13
Table 2. Baseline characteristics of the study participants included in the analysis.
Effectively Analyzed Control Nutrition Physical Activity p-Values(n = 122) (n = 136) (n = 132)
mean (SD 1) mean (SD) mean (SD)Age (years) 53.7 (8.9) 52.3 (9.1) 52.6 (8.2) 0.420
% (n) % (n) % (n)
BMI 1 0.732<25 kg/m2 13 (16) 18 (24) 13 (17)25–30 kg/m2 43 (52) 40 (55) 46 (61)>30 kg/m2 44 (54) 42 (57) 41 (54)
Waist circumference≥94 cm (men)/≥90 cm (women) 90 (110) 88 (120) 82 (108) 0.118
>30 min physical activity/day 12 (15) 12 (16) 17 (22) 0.444Daily consumption of fruits and vegetables 28 (34) 19 (26) 24 (32) 0.249Anti-hypertension drug use 45 (55) 42 (57) 46 (60) 0.815Family history of diabetes 0.618
No 30 (37) 25 (34) 26 (35)Yes: Grandparent, uncle, aunt, or cousin 17 (21) 25 (34) 23 (30)Yes: Biological father, mother, or sibling 53 (64) 50 (68) 51 (67)
Previous increased glucose in blood 27 (33) 27 (36) 36 (48) 0.145Glucose metabolism <0.001
Normoglycemia 18 (22) 11 (15) 13 (17)Isolated IFG 35 (43) 27 (36) 23 (30)Isolated IGT 31 (38) 42 (57) 29 (38)IFG and IGT 16 (19) 21 (28) 36 (47)
1 Standard deviation.
Table 3. Primary and secondary study outcomes.
Control Nutrition Physical Activity(n = 122) (n = 136) (n = 132)
RR 1 (95% CI 2) RR (95% CI) RR (95% CI)
Primary outcomeReversion to normoglycemia 1 Ref. 3 0.88 (0.70–1.12) 0.95 (0.75–1.20)
Secondary outcomeType 2 diabetes 1 Ref. 1.38 (0.67–2.84) 1.43 (0.70–2.93)
1 Risk ratio; 2 Confidence interval; 3 Reference group.
Table 4. Participation rates of the study participants in the interventions.
Group Control Nutrition Physical Activity(n = 122) (n = 136) (n = 132)
% (n) % (n) % (n)
Participated in at least one group and one individualintervention session 0 (0) 74 (100) 76 (100)
Participated in at least 50% of all individual sessions 0 (0) 32 (43) 46 (61)Participated in at least 50% of all group sessions 0 (0) 9 (12) 15 (20)
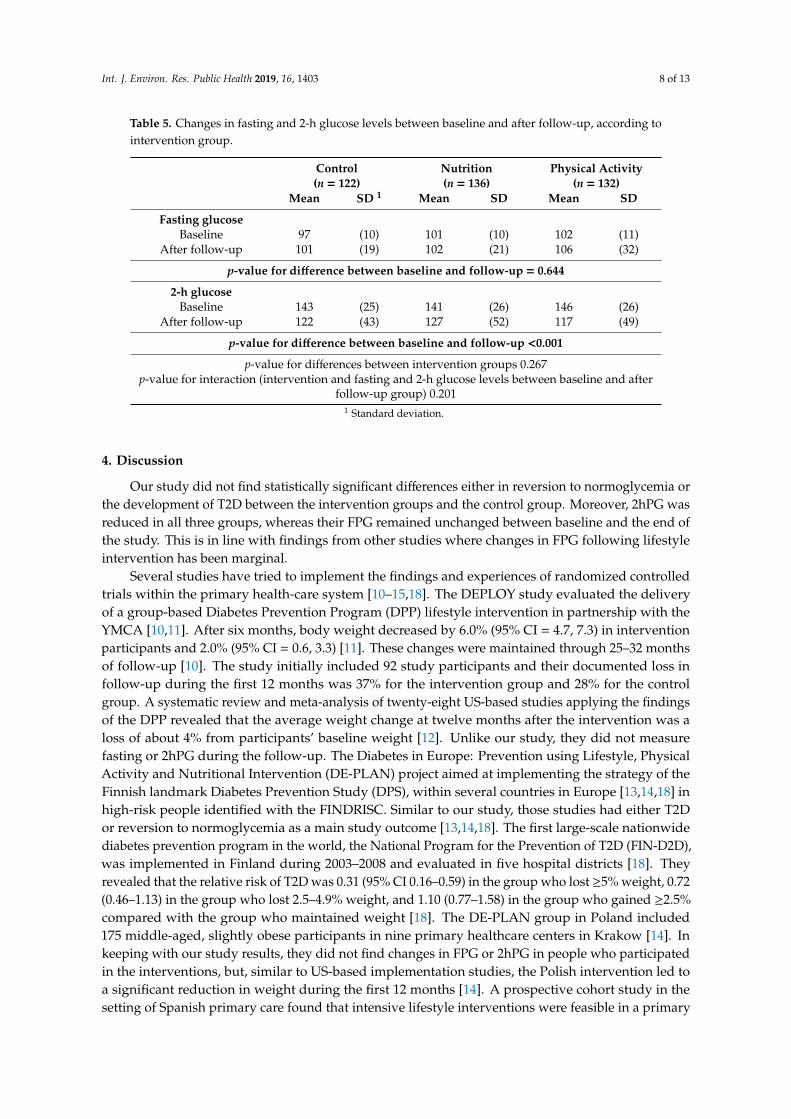
Finally, we also calculated the changes in FPG and 2hPG between baseline and after follow-up,according to intervention group (Table 5). No statistically significant changes were observed in fastingglucose levels in the three groups (p-value 0.644). However, all study participants showed a decreasein their 2hPG independently of the group they were assigned to initially (overall p-value < 0.001). Thedecrease in 2hPG was 19 mg/dL for the control group, 14 mg/dL for the nutritional intervention group,and 29 mg/dL for the physical activity intervention group. The p-value for the interaction (interventionand fasting and 2-h glucose levels between baseline and after follow-up) was 0.201, indicating thatno differences in the changes of the glucose levels were observed between the intervention andcontrol groups.
Int. J. Environ. Res. Public Health 2019, 16, 1403 8 of 13
Table 5. Changes in fasting and 2-h glucose levels between baseline and after follow-up, according tointervention group.
Control Nutrition Physical Activity(n = 122) (n = 136) (n = 132)
Mean SD 1 Mean SD Mean SD
Fasting glucoseBaseline 97 (10) 101 (10) 102 (11)
After follow-up 101 (19) 102 (21) 106 (32)
p-value for difference between baseline and follow-up = 0.644
2-h glucoseBaseline 143 (25) 141 (26) 146 (26)
After follow-up 122 (43) 127 (52) 117 (49)
p-value for difference between baseline and follow-up <0.001
p-value for differences between intervention groups 0.267p-value for interaction (intervention and fasting and 2-h glucose levels between baseline and after
follow-up group) 0.2011 Standard deviation.
4. Discussion
Our study did not find statistically significant differences either in reversion to normoglycemia orthe development of T2D between the intervention groups and the control group. Moreover, 2hPG wasreduced in all three groups, whereas their FPG remained unchanged between baseline and the end ofthe study. This is in line with findings from other studies where changes in FPG following lifestyleintervention has been marginal.
Several studies have tried to implement the findings and experiences of randomized controlledtrials within the primary health-care system [10–15,18]. The DEPLOY study evaluated the deliveryof a group-based Diabetes Prevention Program (DPP) lifestyle intervention in partnership with theYMCA [10,11]. After six months, body weight decreased by 6.0% (95% CI = 4.7, 7.3) in interventionparticipants and 2.0% (95% CI = 0.6, 3.3) [11]. These changes were maintained through 25–32 monthsof follow-up [10]. The study initially included 92 study participants and their documented loss infollow-up during the first 12 months was 37% for the intervention group and 28% for the controlgroup. A systematic review and meta-analysis of twenty-eight US-based studies applying the findingsof the DPP revealed that the average weight change at twelve months after the intervention was aloss of about 4% from participants’ baseline weight [12]. Unlike our study, they did not measurefasting or 2hPG during the follow-up. The Diabetes in Europe: Prevention using Lifestyle, PhysicalActivity and Nutritional Intervention (DE-PLAN) project aimed at implementing the strategy of theFinnish landmark Diabetes Prevention Study (DPS), within several countries in Europe [13,14,18] inhigh-risk people identified with the FINDRISC. Similar to our study, those studies had either T2Dor reversion to normoglycemia as a main study outcome [13,14,18]. The first large-scale nationwidediabetes prevention program in the world, the National Program for the Prevention of T2D (FIN-D2D),was implemented in Finland during 2003–2008 and evaluated in five hospital districts [18]. Theyrevealed that the relative risk of T2D was 0.31 (95% CI 0.16–0.59) in the group who lost ≥5% weight, 0.72(0.46–1.13) in the group who lost 2.5–4.9% weight, and 1.10 (0.77–1.58) in the group who gained ≥2.5%compared with the group who maintained weight [18]. The DE-PLAN group in Poland included175 middle-aged, slightly obese participants in nine primary healthcare centers in Krakow [14]. Inkeeping with our study results, they did not find changes in FPG or 2hPG in people who participatedin the interventions, but, similar to US-based implementation studies, the Polish intervention led toa significant reduction in weight during the first 12 months [14]. A prospective cohort study in thesetting of Spanish primary care found that intensive lifestyle interventions were feasible in a primary
Int. J. Environ. Res. Public Health 2019, 16, 1403 9 of 13
care setting and substantially reduced T2D incidence among high-risk individuals [13]. During a4.2-year median follow-up, they revealed a 36.5% relative risk reduction in the incidence of T2Dbetween the intervention and control group. The study in the Greater Green Triangle of SouthwestVictoria and Southeast South Australia in 2004–2006 using general practices provided evidence that aT2D prevention program using lifestyle intervention was feasible in primary health care settings, withreductions in risk factors approaching those observed in clinical trials, observing T2D in adults withIGT [15]. Unlike in our study, they reported reductions in FPG and 2hPG in their study participantsduring their 12-month intervention.
One important factor explaining the differences of the results between randomized controlledclinical trials and their implementation in the general population is length of intervention. Whereasthe length of the interventions of the randomized clinical trials varied between 2.5 and 6 years [3–9],the duration of the interventions of the pragmatic or field trials in the “real world” were of shorterduration [10–18]. Implementing randomized controlled clinical trials in the population setting hasbeen shown to have less impact, among others, due to a higher heterogeneity of the study populationand compliance with the interventions. Furthermore, compared with randomized controlled trials,it is very difficult to reach a very high compliance (or participation rate) with the interventions inreal–life field trials as the study population cannot be controlled in a similar way. However, our studyshowed that interventions can be implemented within the primary healthcare system and that at leastreaching reasonable compliance rates for individual sessions may be achieved. Naturally, the reasonsfor non-compliance need to be assessed further in order to adapt the program. Thus, this and our shortlength of intervention may be some additional reasons why we were not able to show any differencesin changes of the glucose levels between the intervention and the control group.
The problem with translational research in implementing principles of the proof-of-conceptrandomized clinical controlled trials in real-life settings is that many factors that can be controlled intrials cannot be done in routine clinical practice. The political agenda to work on diabetes prevention,what we believe triggered our project, affects the entire population. Nevertheless, it was of surprisethat an improvement in the glucose profile was observed in both the intervention and control group.Several reasons may explain these findings. Firstly, probably just participating in this study mayencourage people in the control group to adopt a healthier lifestyle, as also observed in previousstudies (Hawthorne effect). Actually, the participants in our control group were told about their highrisk of T2D, and they also received a “mini-intervention” to improve their lifestyle. Moreover, insome instances, members of the three groups were from the same community, thus, a dilution ofthe intervention from the intervention groups to the control group participants may have occurred.Secondly, during the study, many activities were carried out by the city of Barranquilla targeting peoplewith glucose metabolism disorders. For instance, environmental changes were implemented in thecity in the form of creating parks and special sites where people could practice physical activity. Inaddition, there were steady information campaigns targeting people with overweight and obesityto adopt a healthier lifestyle to avoid T2D. Diabetes as a health topic was omnipresent during thelast four years in Barranquilla, until the Ministry of Health of Colombia declared Barranquilla thenational demonstration area for diabetes prevention. Yet another potential explanation of the resultsmay be partly a regression to the mean of the 2hPG that cannot be fully excluded. However, as studyparticipants were randomly allocated to the intervention and comparison groups, the impact of theintervention would be equally affected by regression to the mean [45].
One of the strengths of our study was that we managed to design and implement a field trialwithin a primary healthcare system of a country in economic transition. Close to 50% of the peoplewith prediabetes at the beginning of the study had their glucose values normalized at the end of thestudy. This shows that early lifestyle intervention programs may prevent or delay the development ofT2D and can be successfully integrated into the primary healthcare system. Lifestyle intervention trialsconducted in a controlled research setting have successfully shown that the incidence of T2D in high-riskindividuals with IGT can be approximately halved (DPS and DPP studies). Transversal implementations
Int. J. Environ. Res. Public Health 2019, 16, 1403 10 of 13
of the DPP within YMCA have shown similar results to ours, revealing an improvement especially inthe risk factors of T2D, such as overweight/obesity and levels of physical activity [11,12].
As a limitation, we were not able to assess changes in lifestyle or anthropometric measurementsin all of the study participants. In addition, the follow-up time of the participants ranged between 18and 24 months only. Furthermore, the lack of generalizability to populations not included in the study,such as persons from other provinces of Colombia, may limit external validity to the entire Colombianpopulation. Finally, as we lost close to 50% of the study participants during the follow-up, our studymay not have sufficient power to show a difference in reversion to normoglycemia or developmentof T2D.
5. Conclusions
In conclusion, the DEMOJUAN project showed some benefits for glycaemia with significant 2hPGfall, but failed to link it with the lifestyle interventions provided, compared with the control group.Nevertheless, it has to be kept in mind that various factors affect the outcome of intervention programsin a real population setting, as the conditions cannot be adequately controlled, such as in clinicalcontrolled trials. Therefore, this study adds an important piece of information to existing knowledgeresulting from lifestyle interventions of clinically controlled trials that can successfully be implementedin real-life settings. Future studies should include an OGTT, combined with information on changes oflifestyle and risk factors of T2D, of the study participants even when conducted within the primaryhealthcare system.
Supplementary Materials: The following are available online at http://www.mdpi.com/1660-4601/16/8/1403/s1,File S1: Study questionnaire, file S2: Description of the topics of the lifestyle intervention program.
Author Contributions: Conceptualization, N.C.B., T.A., A.A., C.R., D.S., K.F., and J.O.T.; Methodology, N.C.B.,T.A., and J.O.T.; software, K.F.; validation, N.C.B., T.A., A.A., C.R., D.S., K.F., and J.O.T.; formal analysis,N.C.B.; investigation, N.C.B., T.A., A.A., C.R., and J.O.T.; resources, X.X.; data curation, N.C.B., K.F., and T.A.;writing—original draft preparation, N.C.B.; writing—review and editing, N.C.B., T.A., A.A., C.R., D.S., K.F., andJ.O.T.; visualization, N.C.B., T.A., A.A., C.R., D.S., K.F., and J.O.T.; supervision, J.T; project administration, N.C.B.,T.A., A.A., C.R., and J.O.T.; funding acquisition, N.C.B., T.A., A.A., C.R., and J.O.T. All authors have read andapproved the final version of the manuscript.
Funding: This project was supported by a BRIDGES Grant from the Global Diabetes Foundation. BRIDGES, aGlobal Diabetes Foundation project, is supported by an educational grant from Lilly Diabetes.
Conflicts of Interest: The authors declare no conflict of interest.
References
1. Diabetes Atlas, 7th ed.; International Diabetes Federation (IDF): Brussels, Belgium, 2017.2. Manuel, D.; Schultz, S. Health-related quality of life and health-adjusted life expectancy of people with
diabetes mellitus in Ontario, Canada 1996–1997. Diabetes Care 2004, 27, 407–414. [CrossRef]3. Pan, X.R.; Li, G.W.; Hu, Y.H.; Wang, J.X.; Yang, W.Y.; An, Z.X.; Hu, Z.X.; Lin, J.; Xiao, J.Z.; Cao, H.B.; et al.
Effects of diet and exercise in preventing NIDDM in people with impaired glucose tolerance. The Da QingIGT and Diabetes Study. Diabetes Care 1997, 20, 537–544. [CrossRef]
4. Ramachandran, A.; Snehalatha, C.; Mary, S.; Mukesh, B.; Bhaskar, A.D.; Vijay, V.; Indian Diabetes PreventionProgramme (IDPP). The Indian Diabetes Prevention Programme shows that lifestyle modification andmetformin prevent type 2 diabetes in Asian Indian subjects with impaired glucose tolerance (IDPP-1).Diabetologia 2006, 4, 289–297. [CrossRef]
5. Turner, R.C.; Cull, C.A.; Frighi, V.; Holman, R.R. Glycemic control with diet, sulfonylurea, metformin, orinsulin in patients with type 2 diabetes mellitus. Progressive requirement for multiple therapies (UKPDS 49).JAMA 1999, 281, 2005–2012. [CrossRef]
6. Tuomilehto, J.; Lindström, J.; Eriksson, J.; Valle, T.T.; Hämäläinen, H.; Ilanne-Parikka, P.;Keinänen-Kiukaanniemi, S.; Laakso, M.; Louheranta, A.; Rastas, M.; et al. Prevention of type 2 diabetesmellitus by changes in lifestyle among subjects with impaired glucose tolerance. N. Engl. J. Med. 2001, 344,1343–1350. [CrossRef] [PubMed]
Int. J. Environ. Res. Public Health 2019, 16, 1403 11 of 13
7. Knowler, W.C.; Barrett-Connor, E.; Fowler, S.E. Reduction in the incidence of type 2 diabetes with lifestyleintervention or metformin. N. Engl. J. Med. 2002, 346, 393–403.
8. Kosaka, K.; Noda, M.; Kuzuya, T. Prevention of type 2 diabetes by lifestyle intervention: A Japanese trial inIGTmales. Diabetes Res. Clin. Pract. 2005, 67, 152–162. [CrossRef]
9. Roumen, C.; Corpeleijn, E.; Feskens, E.J.; Mensink, M.; Saris, W.H.; Blaak, E.E. Impact of 3-year lifestyleintervention on postprandial glucose metabolism: The SLIM study. Diabetes Med. 2008, 25, 597–605.[CrossRef]
10. Ackermann, R.T.; Finch, E.A.; Caffrey, H.M.; Lipscomb, E.R.; Hays, L.M.; Saha, C. Long-term effects of acommunity-based lifestyle intervention to prevent type 2 diabetes: The DEPLOY extension pilot study.Chronic Illn. 2011, 7, 279–290. [CrossRef]
11. Ackermann, R.T.; Finch, E.A.; Brizendine, E.; Zhou, H.; Marrero, D.G. Translating the Diabetes PreventionProgram into the community. The DEPLOY Pilot Study. Am. J. Prev. Med. 2008, 35, 357–363. [CrossRef][PubMed]
12. Ali, M.K.; Echouffo-Tcheugui, J.; Williamson, D.F. How effective were lifestyle interventions in real-worldsettings that were modeled on the Diabetes Prevention Program? Health Aff. (Millwood) 2012, 31, 67–75.[CrossRef] [PubMed]
13. Costa, B.; Barrio, F.; Cabré, J.J.; Piñol, J.L.; Cos, X.; Solé, C.; Bolíbar, B.; Basora, J.; Castell, C.; Solà-Morales, O.;et al. Delaying progression to type 2 diabetes among high-risk Spanish individuals is feasible in real-lifeprimary healthcare settings using intensive lifestyle intervention. Diabetologia 2012, 55, 1319–1328. [CrossRef][PubMed]
14. Gilis-Januszewska, A.; Lindström, J.; Tuomilehto, J.; Piwonska-Solska, B.; Topór-Madry, R.; Szybinski, Z.;Peltonen, M.; Schwarz, P.E.; Windak, A.; Hubalewska-Dydejczyk, A. Sustained diabetes risk reduction afterreal life and primary health care setting implementation of the diabetes in Europe prevention using lifestyle,physical activity and nutritional intervention (DE-PLAN) project. BMC Public Health 2017, 17, 198. [CrossRef][PubMed]
15. Kosaka, K.; Noda, M.; Kuzuya, T.; Kilkkinen, A.; Vartiainen, E.; Heistaro, S.; Philpot, B.; Absetz, P.; Bunker, S.;O’Neil, A.; et al. Prevention of type 2 diabetes by lifestyle intervention in an Australian primary healthcare setting: Greater Green Triangle (GGT) Diabetes Prevention Project. BMC Public Health 2007, 7, 249.[CrossRef]
16. Nilsen, V.; Bakke, P.S.; Gallefoss, F. Effects of lifestyle intervention in persons at risk for type 2 diabetesmellitus—Results from a randomised, controlled trial. BMC Public Health 2011, 11, 893. [CrossRef]
17. Penn, L.; White, M.; Oldroyd, J.; Walker, M.; Alberti, K.G.; Mathers, J.C. Prevention of type 2 diabetes inadults with impaired glucose tolerance: The European Diabetes Prevention RCT in Newcastle upon Tyne,UK. BMC Public Health 2009, 9, 277–283. [CrossRef]
18. Saaristo, T.; Moilanen, L.; Korpi-Hyövälti, E.; Vanhala, M.; Saltevo, J.; Niskanen, L.; Jokelainen, J.; Peltonen, M.;Oksa, H.; Tuomilehto, J. Lifestyle intervention for prevention of type 2 diabetes in primary health care:One-year follow-up of the Finnish National Diabetes Prevention Program (FIN-D2D). Diabetes Care 2010, 33,2146–2151. [CrossRef]
19. Acosta, T.; Barengo, N.C.; Arrieta, A.; Ricaurte, C.; Tuomilehto, J.O. A demonstration area for type 2 diabetesprevention in Barranquilla and Juan Mina (Colombia): Baseline characteristics of the study participants.Medicine 2018, 97, e9285. [CrossRef] [PubMed]
20. Pandis, N.; Chung, B.; Scherer, R.W.; Elbourne, D.; Altman, D.G. CONSORT 2010 statement: Extensionchecklist for reporting within person randomised trials. BMJ 2017, 357, 2835. [CrossRef]
21. Lindström, J.; Tuomilehto, J. The diabetes risk score: A practical tool to predict type 2 diabetes risk.Diabetes Care 2003, 26, 725–731. [CrossRef]
22. Barengo, N.C.; Acosta, T.; Arrieta, A.; Ricaurte, C.; Mayor, D.; Tuomilehto, J.O.; The DEMOJUAN StudyGroup. Screening for people with glucose metabolism disorders within the framework of the DEMOJUANproject (DEMOnstration area for primary prevention of type 2 diabetes, JUAN Mina and Barranquilla,Colombia). Diabetes Metab. Res. Rev. 2013. [CrossRef] [PubMed]
23. Saaristo, T.; Peltonen, M.; Lindström, J.; Saarikoski, L.; Sundvall, J.; Eriksson, J.G.; Tuomilehto, J.Cross-sectional evaluation of the Finnish Diabetes Risk Score: A tool to identify undetected type 2 diabetes,abnormal glucose tolerance and metabolic syndrome. Diabetes Vasc. Dis. Res. 2005, 2, 67–72. [CrossRef][PubMed]
Int. J. Environ. Res. Public Health 2019, 16, 1403 12 of 13
24. Franciosi, M.; De Berardis, G.; Rossi, M.C.; Sacco, M.; Belfiglio, M.; Pellegrini, F.; Tognoni, G.; Valentini, M.;Nicolucci, A. Use of the diabetes risk score for opportunistic screening of undiagnosed diabetes and impairedglucose tolerance: The IGLOO (Impaired Glucose Tolerance and Long-Term Outcomes Observational) study.Diabetes Care 2005, 28, 1187–1194. [CrossRef] [PubMed]
25. Makrilakis, K.; Liatis, S.; Grammatikou, S.; Perrea, D.; Stathi, C.; Tsiligros, P.; Katsilambros, N. Validationof the Finnish diabetes risk score (FINDRISC) questionnaire for screening forundiagnosed type 2 diabetes,dysglycaemia and the metabolic syndrome in Greece. Diabetes Metab. 2011, 37, 144–151. [CrossRef] [PubMed]
26. Kengne, A.P.; Beulens, J.W.; Peelen, L.M.; Moons, K.G.; van der Schouw, Y.T.; Schulze, M.B.; Spijkerman, A.M.;Griffin, S.J.; Grobbee, D.E.; Palla, L.; et al. Non-invasive risk scores for prediction of type 2 diabetes(EPIC-InterAct): A validation of existing models. Lancet Diabetes Endocrinol. 2014, 2, 19–29. [CrossRef]
27. Barengo, N.C.; Tamayo, D.C.; Tono, T.; Tuomilehto, J.A. Colombian diabetes risk score for detectingundiagnosed diabetes and impaired glucose regulation. Prim Care Diabetes 2017, 11, 86–93. [CrossRef]
28. Schwarz, P.E.; Lindström, J.; Kissimova-Scarbeck, K.; Szybinski, Z.; Barengo, N.C.; Peltonen, M.;Tuomilehto, J.; DE-PLAN project. The European Perspective of Type 2 Diabetes Prevention: Diabetesin Europe—Prevention using lifestyle, physical activity and nutritional intervention (DE-PLAN) project.Exp. Clin. Endocrinol. Diabetes 2008, 116, 167–172. [CrossRef] [PubMed]
29. Rydén, L.; Standl, E.; Bartnik, M.; Van den Berghe, G.; Betteridge, J.; de Boer, M.J.; Cosentino, F.; Jönsson, B.;Laakso, M.; Malmberg, K.; et al. Guidelines on diabetes, pre-diabetes, and cardiovascular diseases: TheTask Force on Diabetes and Cardiovascular Diseases of the European Society of Cardiology (ESC) and of theEuropean Association for the Study of Diabetes (EASD). Eur. Heart J. 2007, 28, 88–136. [PubMed]
30. Craig, C.L.; Marshall, A.L.; Sjöström, M.; Bauman, A.E.; Booth, M.L.; Ainsworth, B.E.; Pratt, M.; Ekelund, U.;Yngve, A.; Sallis, J.F.; et al. International physical activity questionnaire: 12-country reliability and validity.Med. Sci. Sports Exerc. 2003, 35, 1381–1395. [CrossRef]
31. Bonita, R.; de Courten, M.; Dwyer, T.; Jamrozik, K.; Winkelmann, R. Surveillance of Risk Factorsfor Noncommunicable Diseases: The WHO STEP Wise Approach; World Health Organization: Geneva,Switzerland, 2002.
32. Ekelund, U.; Sepp, H.; Brage, S.; Becker, W.; Jakes, R.; Hennings, M.; Wareham, N.J. Criterion-relatedvalidity of the last 7-day, short form of the International Physical Activity Questionnaire in Swedish adults.Public Health Nutr. 2006, 9, 258–265. [CrossRef]
33. Hu, G.; Barengo, N.C.; Tuomilehto, J.; Lakka, T.A.; Nissinen, A.; Jousilahti, P. Relationship of physical activityand body mass index to the risk of hypertension: A prospective study in Finland. Hypertension 2004, 43,25–30. [CrossRef]
34. Hu, G.; Qiao, Q.; Silventoinen, K.; Eriksson, J.G.; Jousilahti, P.; Lindström, J.; Valle, T.T.; Nissinen, A.;Tuomilehto, J. Occupational, commuting, and leisure-time physical activity in relation to risk for type 2diabetes in middle-aged Finnish men and women. Diabetologia 2003, 46, 322–329. [CrossRef]
35. Albanes, D.; Conway, J.M.; Taylor, P.R.; Moe, P.W.; Judd, J. Validation and comparison of eight physicalactivity questionnaires. Epidemiology 1990, 1, 65–71. [CrossRef]
36. Salonen, J.T.; Slater, J.S.; Tuomilehto, J.; Rauramaa, R. Leisure time and occupational physical activity: Riskof death from ischemic heart disease. Am. J. Epidemiol. 1988, 127, 87–94. [CrossRef]
37. Hemiö, K.; Pölönen, A.; Ahonen, K.; Kosola, M.; Viitasalo, K.; Lindström, J. A simple tool for diet evaluationin primary health care: Validation of a 16-item food intake questionnaire. Int. J. Environ. Res. Public Health2014, 11, 2683–2697. [CrossRef]
38. Guía de práctica clínica para el diagnóstico, tratamiento y seguimiento de diabetes tipo 1, diabetes tipo 2 en mayoresde 18 años y diabetes gestacional [Clinical Practice Guideline for the Diagnosis, Treatment and Monitoring of Type1 Diabetes, Type 2 Diabetes and Gestational Diabetes in People Aged 18 and Older]; Alianza Cinets; Ministry ofHealth and Social Protection: Bogotá, Colombia, 2015. Available online: http://med.javeriana.edu.co/publi/vniversitas/serial/v54n4/Recomendaciones%20Diabetes%20tipo%202.pdf (accessed on 16 April 2019).
39. WHO Consultation Definition. Diagnosis and Classification of Diabetes Mellitus and Its Complications. Part1: Diagnosis and Classification of Diabetes Mellitus; World Health Organisation: Geneva, Switzerland, 1999;Report No. 99.2.
40. American Diabetes Association Position Statement. Diagnosis and classification of diabetes mellitus.Diabetes Care 2010, 33, S62–S69. [CrossRef]
Int. J. Environ. Res. Public Health 2019, 16, 1403 13 of 13
41. Torgerson, J.S.; Hauptman, J.; Boldrin, M.N.; Sjöström, L. XENical in the Prevention of Diabetes in ObeseSubjects (XENDOS) study: A randomized study of orlistat as an adjunct to lifestyle changes for the preventionof type 2 diabetes in obese patients. Diabetes Care 2004, 27, 155–161. [CrossRef]
42. Knowler, W.C.; Hamman, R.F.; Edelstein, S.L.; Barrett-Connor, E.; Ehrmann, D.A.; Walker, E.A.; Fowler, S.E.;Nathan, D.M.; Kahn, S.E. Diabetes Prevention Program Research Group. Prevention of type 2 diabetes withtroglitazone in the Diabetes Prevention Program. Diabetes 2005, 54, 1150–1156.
43. Gerstein, H.C.; Yusuf, S.; Bosch, J.; Pogue, J.; Sheridan, P.; Dinccag, N.; Hanefeld, M.; Hoogwerf, B.; Laakso, M.;Mohan, V.; et al. Effect of rosiglitazone on the frequency of diabetes in patients with impaired glucosetolerance or impaired fasting glucose: A randomised controlled trial. Lancet 2006, 368, 1096–1105. [PubMed]
44. Adams, R.; Hebert, C.J.; Mcvey, L.; Williams, R. Implementation of the YMCA Diabetes Prevention Programthroughout an Integrated Health System: A Translational Study. Perm J 2016, 20, 82–86. [CrossRef] [PubMed]
45. Barnett, A.G.; van der Pols, J.C.; Dobson, A.J. Regression to the mean: What it is and how to deal with it.Int. J. Epidemiol. 2005, 34, 215–220. [CrossRef] [PubMed]
© 2019 by the authors. Licensee MDPI, Basel, Switzerland. This article is an open accessarticle distributed under the terms and conditions of the Creative Commons Attribution(CC BY) license (http://creativecommons.org/licenses/by/4.0/).