Embed Size (px)
Citation preview
Early Labor-Force Withdrawal of Men: Participants .and Nonparticipants Aged 5 8-63
Who is out of the labor force early: the unhealthy or the healthy; the @.urwially fortunate or the u* fortunate? To answer these and other questions about retzrement in the United states, personal interviezc-a toere conducted in 1969 with &.lSS men representing the noninstitutionalized populattin aged 5S-6.9 The interviews revealed that 17 per- cent of the men were out of the labor force at the time of the interview. Over half of these “ltonpar- G.&pants” had been &thout work 3 year8 or longer. Hoat men out of the labor force cited poor health aa the reason for leaving their 2ast regular job. Health-imposed work limitatio~a, education, occupational background, and race were all related to labor-force participation, but health appeared to be the underlying factor. Nonparticipants tended to have lower incomes and fewer assets than participants in the labor force.
WHAT TYPES OF MEN are out of the labor force early? What is their financial situation once they leave! The answers to these questions are of vital interest to the Social Security Adminis- tration as well as to other agencies and persons ini;olved with the matter of retirement. They are of particular interest in view of the growth in the number of men leaving the labor force before age 65. From 1947 to 1972, the proportion of men aged 55-64 out of the labor force gradu- ally increased, going from 10.4 percent in 1947 to 19.5 percent in 1972.l
Men out of the labor force early may be out for any number of reasons and combinations of reasons. Obsolescence of skills in our fast-paced technological society, poor health, attainment of age 62 (when reduced social security benefits become available) and a desire for additional
+ Division of Retirement and Survivor Studies, Ofllce of Research and Statistics
“‘In the labor force,” ‘out of the labor force,” and “unemployed” have been defined in a joint publication of the Bureau of the Census and the Bureau of Labor Statistics, “Concepts and Methods Used in Manpower Statistics from the Current Population Survey,” Current Population Reports, Series P-23, No. 22, June 1967. The percentages of men out of the labor force were derived from table A-2, Hanpower Report of the President, Department of Labor, March 1973.
14
by KAREN SCHWAB*
years of leisure are a few. Information about those withdrawing -early from the labor force and their financial situation can aid planners in determining what kinds of program adaptations, if any, are warranted in dealing with the popula- tion younger than age 65.
The Retirement History Study of the Social Security Administration allows some comparison of the men no longer participating in the labor force with those remaining. In the spring of 1969, a representative sample of noninstitutionalized, civilian men in the country aged 58-63 was inter- viewed. A comparable safiple of single, widowed, separated, and divorced women was interviewed simultaneously. The Social Security Administra- tion is studying these individuals as they pass into and through retirement. The 1969 interviews constitute the first wave of data for the studym2
Information in this report was drawn from in- terviews conducted in 1969 with the 8,133 men in the study. Since women and men of those ages differ in their patterns of labor-force participa- tion, a separate report will be presented on the women. s The sample was weighted to provide statistical estimates descriptive of all the 4.8 million noninstitutionalized, civilian men in the country aged 58-63 in 1969.’
Since the data refer to only one point in time, t,hey cannot be used to determine causal factors in the trend toward earlier retirement. They can be and are used in this report to examine the factors associated with early retirement at present.
This article first studies the availability of retired-worker benefits under the social security
“For a description of the population sampled, see Lola Al. Irelan, “Retirement History Study : Introduction,” Social Security Bulletin, November 1972. An unpublished working paper by D. Bruce Bell and Lola Irelan of the Division of Retirement and Survivor Studies provided helpful preliminary descriptions of early retirees and workers.
’ Sally R. Sherman, “Labor-Force Status of Nonmar- ried Women on the Threshhold of Retirement” (to appear in the September 10’74 issue of the Bftlletin).
‘The technical note (pages 37-38) discusses the con- fidence intervals that may be applied to projections made to the population from this sample.
SOCIAL SECURITY
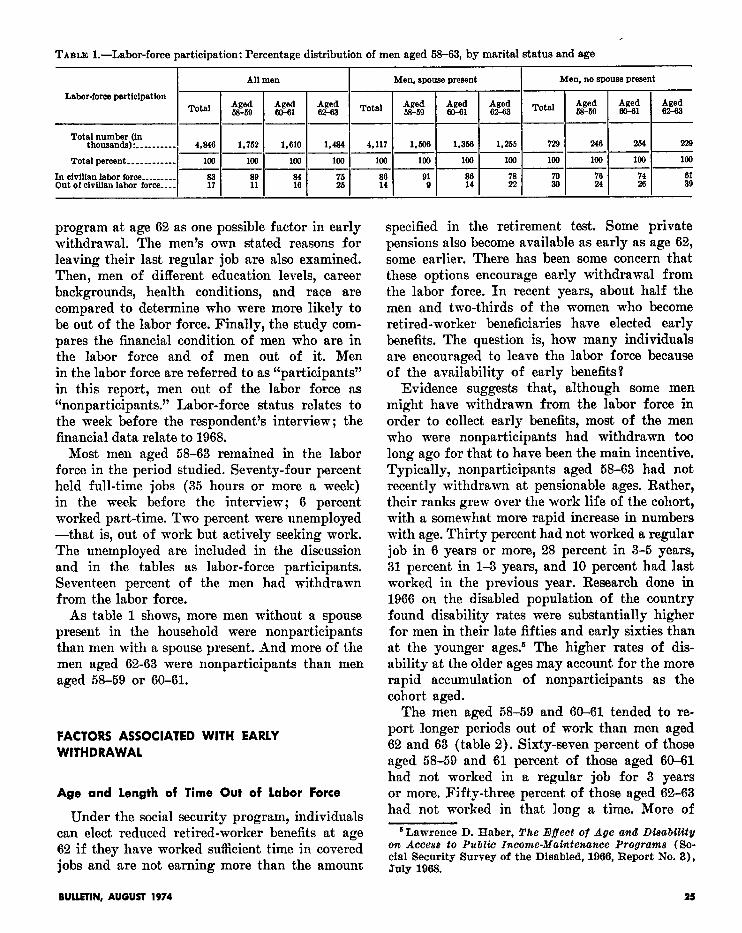
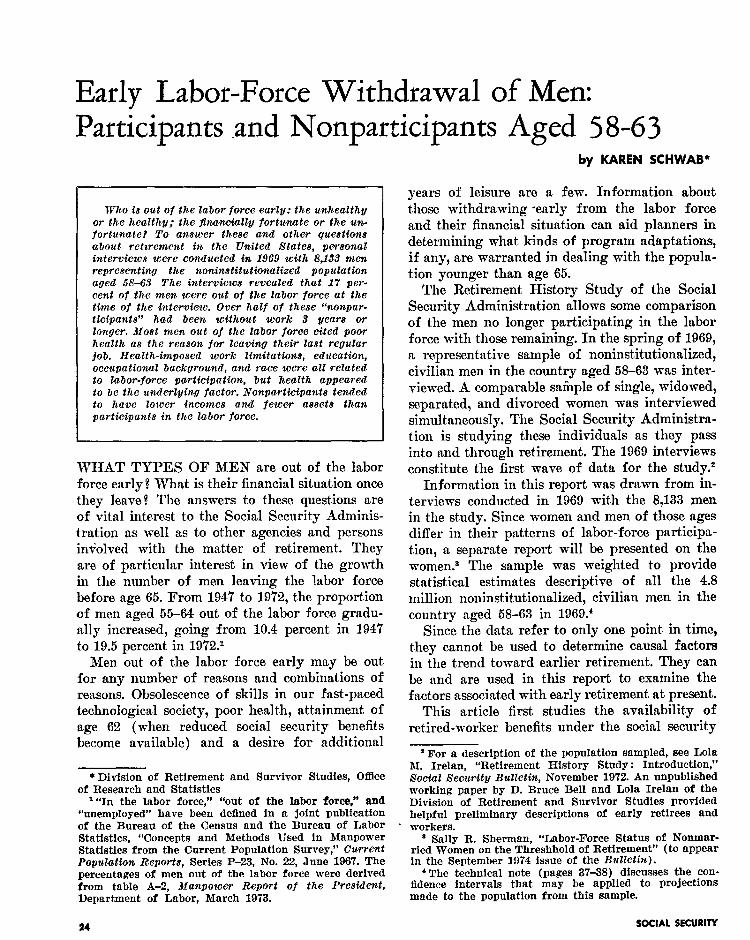
TABLE I.-Labor-force participation: Percentage distribution of men aged 68-63, by marital status and age
All men Men, spouse present Men, no spouse present
Total number (in thousands): _.________ 4.346 1,752 1.610 1,434 4,117 1,&X 1,356 1,255 729 246 254 229
-----P-P--- Total percent....--...... 100 100 loo 100 100 100 1ClQ loo 100 100 loo 100
-----P--Y-- In civilian labor force _________
z f! !i ii i‘i 91
Out of civilian labor force-- 9 :: ii ii ii 74 26 ii
program at age 62 as one possible factor in early withdrawal. The men’s own stated reasons for leaving their last regular job are also examined. Then, men of different education levels, career backgrounds, health conditions, and race are compared to determine who were more likely to be out of the labor force. Finally, the study com- pares the financial condition of men who are in the labor force and of men out of it. Men in the labor force are referred to as “participants” in t,his report, men out of the labor force ns “nonparticipants. ” Labor-force status relates to the week before the respondent’s interview; the financial data relate to 1968.
Most men aged 58-63 remained in the labor force in the period studied. Seventy-four percent held full-time jobs (35 hours or more a week) in the week before the interview; 6 percent worked part-time. Two percent were unemployed -that is, out of work but actively seeking work. The unemployed are included in the discussion and in the tables as labor-force participants. Seventeen percent of the men had withdrawn from the labor force.
As table 1 shows, more men without a spouse present in the household were nonparticipants than men with a spouse present. And more of the men aged 62-63 were nonparticipants than men aged 58-59 or 60-61.
FACTORS ASSOCIATED WITH EARLY WITHDRAWAL
Age and Length of Time Out of labor Force
Under the social security program, individuals can elect reduced retired-worker benefits at age 62 if they have worked sufficient time in covered jobs and are not earning more than the amount
BULLETIN, AUGUST 1974 25
specified in the retirement test. Some private pensions also become available as early as age 62, some earlier. There has been some concern that these options encourage early withdrawal from the labor force. In recent years, about half the men and two-thirds of the women who become retired-worker beneficiaries have elected early benefits. The question is, how many individuals are encouraged to leave the labor force because of the availability of early benefits?
Evidence suggests that, although some men might have withdrawn from the labor force in order to collect early benefits, most of the men who were nonparticipants had withdrawn too long ago for that to have been the main incentive. Typically, nonparticipants aged 58-63 had not recently withdrawn at pensionable ages. Rather, their ranks grew over the work life of the cohort, with a somewhat more rapid increase in numbers with age. Thirty percent had not worked a regular job in 6 years or more, 28 percent in 3-5 years, 31 percent in 1-3 years, and 10 percent had last worked in the previous year. Research done in 1966 on the disabled population of the country found disability rates were subst,antially higher for men in their late fifties and early sixties than at the younger agesP The higher rates of dis- ability at the older ages may account for the more rapid accumulation of nonparticipants as the cohort aged.
The men aged 58-59 and 60-61 tended to re- port longer periods out of work than men aged 62 and 63 (table 2). Sixty-seven percent of those aged 58-59 and 61 percent of those aged 60-61 had not worked in a regular job for 3 years or more. Fifty-three percent of those aged 62-63 had not worked in that long a time. More of
‘Lawrence D. Haber, The Hffect of Age ancl DtiabZZity on Access to Public Income-Maintenance Programs (So- cial Security Survey of the Disabled, 1966, Report No. 3), July 1968.
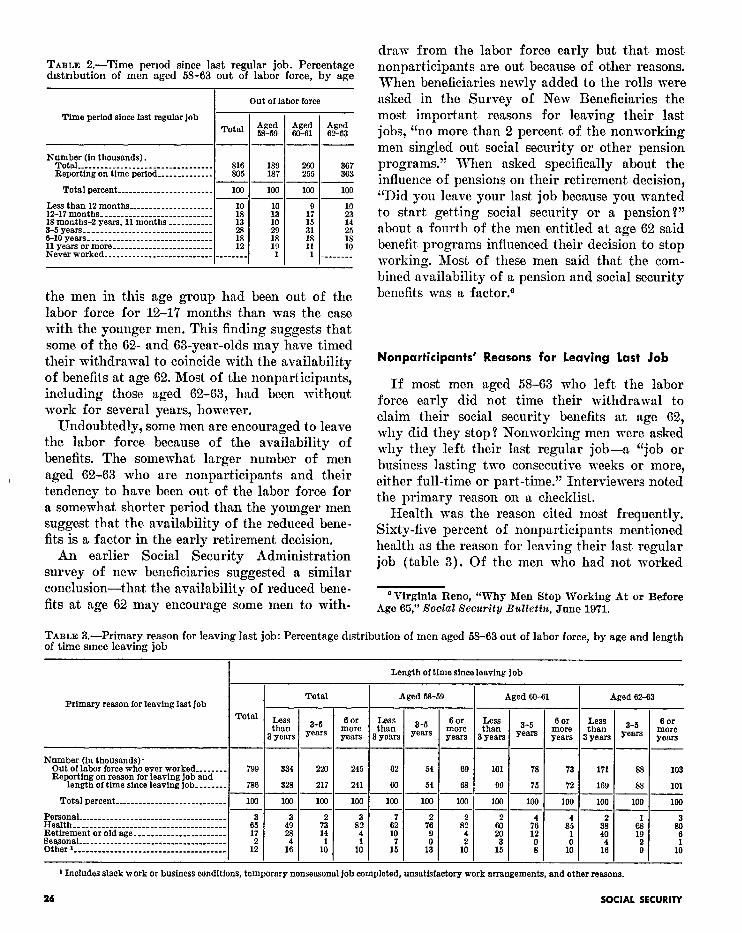
TABLE 2.-Time period since last regular job. Percentage dlstrlbution of men aged 58-63 out of labor force, by age
I Out of labor force
Time period since last regular job
I I
Total $$, --
Number (In thousands). Total __________________________________
I I 816 189
Reporting on time period ______________ 305 187 -- Total percent ________________________ 100 100
-- Less than 12 months _____________________ 12-17months..-....-.------------------- :: :3” 18 months-2 years, 11 months L__________ 36yesrs.---...---..-..----------------- iii ii 6-10 years _______________________________ 11 years or more _________________________ :“z :i Never worked....--...------------------ ________ 1
260 367 255 363
loo
9
:: 31
:: 1
199
the men in this age group had been out of the labor force for 12-17 months than was the case with the younger men. This finding suggests that some of the 62- and 63-year-olds may have timed their withdrawal to coincide with the availability of benefits at age 62. Most of the nonparticipants, including those aged 62-63, had been without work for several years, however.
Undoubtedly, some men are encouraged to leave the labor force because of the availability of benefits. The somewhat larger number of men aged 62-63 who are nonparticipants and their tendency to have been out of the labor force for a somewhat shorter period than the younger men suggest that the availability of the reduced bene- fits is a factor in the early retirement decision.
An earlier Social Security Administration survey of new beneficiaries suggested a similar conclusion-that the availability of reduced bene- fits at age 62 may encourage some men to with-
draw from the labor force early but that most nonparticipants are out because of other reasons. When beneficiaries newly added to the rolls were asked in the Survey of New Beneficiaries the most important reasons for leaving their last jobs, “no more than 2 percent of the nonworking men singled out social security or other pension programs.” When asked specifically about the influence of pensions on their retirement decision, “Did you leave your last job because you wanted to start getting social security or a pension?” about a fourth of the men entitled at age 62 said benefit programs influenced their decision to stop working. Most of these men said that the com- bined availability of a pension and social security benefits was a factor.6
Nonparticipants’ Reasons for leaving last Job
If most men aged 58-63 who left the labor force early did not time their withdrawal to claim their social security benefits at age 62, why did they stop? Nonworking men were asked n-hy they left their last regular job-a “job or business lasting two consecutive weeks or more, either full-time or part-time.” Interviewers noted the primary reason on a checklist.
Health was the reason cited most frequently. Sixty-five percent of nonparticipants mentioned health as the reason for leaving their last regular job (table 3). Of the men who had not worked
‘Virginia Reno, “Why Men Stop Working At or Before Age 65,” Social Seourity Bulletin, June 1971.
TABLE 3.-Primary reason for leaving last job: Percentage distribution of men aged 58-63 out of labor force, by age and length of time smce leaving job
Length of time since leaving job
I I Total Primary reason for leaving I--’ ‘-L I Aged 58-59 Aged 60-61 Aged 62-63
lubJ”” t Tota1 1 Less 1 D c t 6or 1 Less 1 n = 1 6or Less 1 n = t 6or Less 1 n S 1 6or
put of labor force who ever worked ________ -deporting on reason for leaving job and
length of time since leaving job ________
Total percent ____________________________
/
------------- Personal _____________ _ _ ________ ___ ___ ________ 2 7 2 4 2 Health ______________________________________ Retirement or old age __.________.___________
6: 4: :: 832 % 8; 2 :; 8; f 17 28 4 iit
~t4&rIl$--- ““““““““““““““““““““““““““““““““.””””” ________ __-____ __._ _- _____________ 1; 1: 1: 1: 1: 1: 10 : 1: ii 1: 1: ‘i 9 1;
1 Includes slack work or business conditions, temporary nonseasonal job completed, unsatisfactory work srrangements, 8nd other reasons.
26 SOCIAL SECURITY
6 years or longer, the proportion mentioning health was even higher-82 percent. The younger the man had been at the time of withdrawal- that is, the longer he had been out of the labor force-the more likely he was to give health as the primary reason for leaving his last job.
The second most prevalent reason for leaving was “retirement or old age,” but only 17 percent of the nonparticipants gave this reason. The per- centage listing retirement varied with age and length of time out. Few of the nonparticipants who had last worked regularly 6 or more years before the interview listed retirement. On the other hand, the more recently the job had ended and the older the man at that point, the more likely he was to give retirement as the reason for leaving. Forty percent of the 62- and 63-year- olds leaving their last regular job less than 3 years previously gave retirement as the reason. Except for those aged 62-63 who had withdrawn from the labor force a relatively short time before, most nonparticipants said, as noted earlier, that poor health-not retirement-made them leave their last regular job.
The aspect of health with the most relevance in a discussion of labor-force participat,ion is the extent to which the health problems of nonpar- ticipants interfered with their ability to work. People can work with some health problems but not with others. Moreover, jobs vary in their capacity to accommodate workers with health problems. Persons in the sample were asked whether their health limited the kind or amount of work they could do, or whether it left them unable to work at all.’
A considerably higher proportion of nonpar- ticipants than of participants reported that their health-imposed limits on ability to work. Eighty percent of the nonparticipants reported such limitations, compared with 26 percent of the par- ticipants. In summary, more nonparticipants reported having health problems and receiving care, and considerably more nonparticipants re- ported that poor health interfered with their ability to work. The finding that health problems are an important reason for the nonparticipation of men younger than age 65 is consistent with findings from a number of studies?
Health
Was it really poor health that kept nonpar- Occupation of longest Job ticipants out of the labor force? A large propor- tion had not worked in some time. Fifty-eight percent had not worked a regular job in 3 years or more, and only 10 percent had left their last regular job within the previous year.
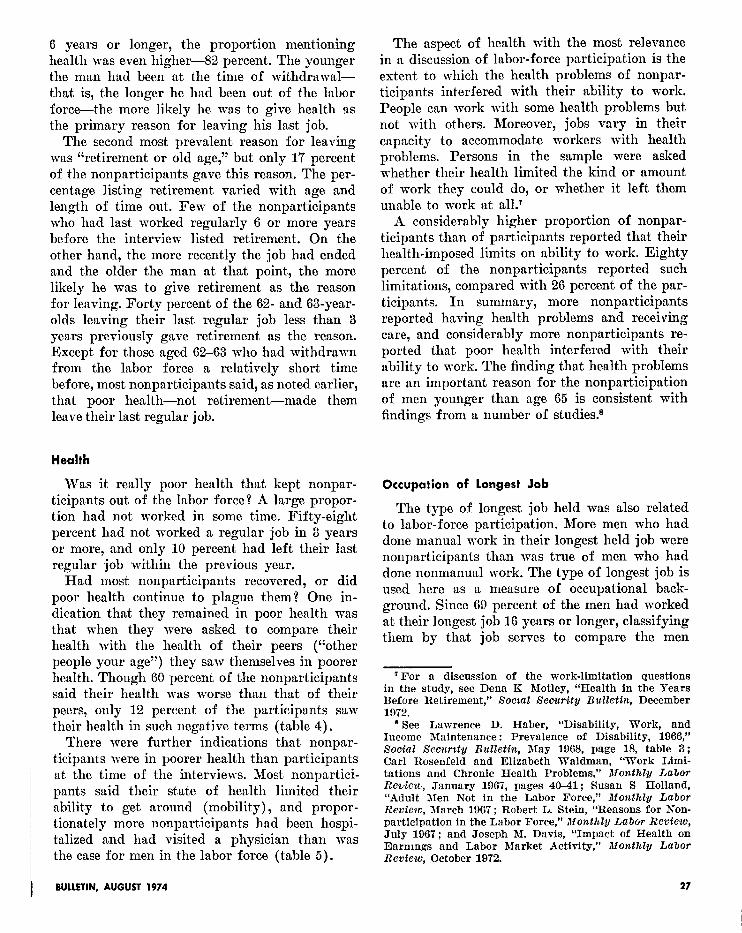
Had most nonparticipants recovered, or did poor health continue to plague them? One in- dication that they remained in poor health was that when they mere asked to compare their health with the health of their peers (“other people your age”) they saw themselves in poorer health. Though 60 percent of the nonparticipants said their health was worse than that of their peers, only 12 percent of the participants saw their health in such negative terms (table 4).
There were further indications that nonpar- ticipants were in poorer health than participants at the time of the interviews. Most nonpartici- pants said their state of healt,h limited their ability to get around (mobility), and propor- tionately more nonparticipants had been hospi- talized and had visited a physician than was the case for men in the labor force (table 5).
The type of longest job held was also related to labor-force participation. More men who had done manual work in their longest held job were nonparticipants than was true of men who had done nonmanual work. The type of longest job is used here as a measure of occupational back- ground. Since 60 percent of the men had worked at their longest job 16 years or longer, classifying them by that job serves to compare the men
‘For a discussion of the work-limitation questions in the study, see Dena R Motley, “Health in the Years Before Retirement,” Soczal Security Bulletin, December 1972.
B See Lawrence D. Haber, “Disability, Work, and Income Maintenance : Prevalence of Disability, 1966,” Social Securzty Bulletin, May 1968, page 18, table 3; Carl Rosenfeld and Elizabeth Waldman, “Work Limi- tations and Chronic Health Problems,” Monthly Labor Reoim, January 1967, pages 40-41; Susan S Holland, “Adult Xen Not in the Labor Force,” Monthly Labor Review, March 1967; Robert L. Stein, “Reasons for Non- participation in the Labor Force,” Uonthly Labor Review, July 1967; and Joseph N. Davis, “Impact of Health on Earnmgs and Labor Market Activity,” Monthly Labor Review, October 1972.
BULLETIN, AUGUST 1974 27
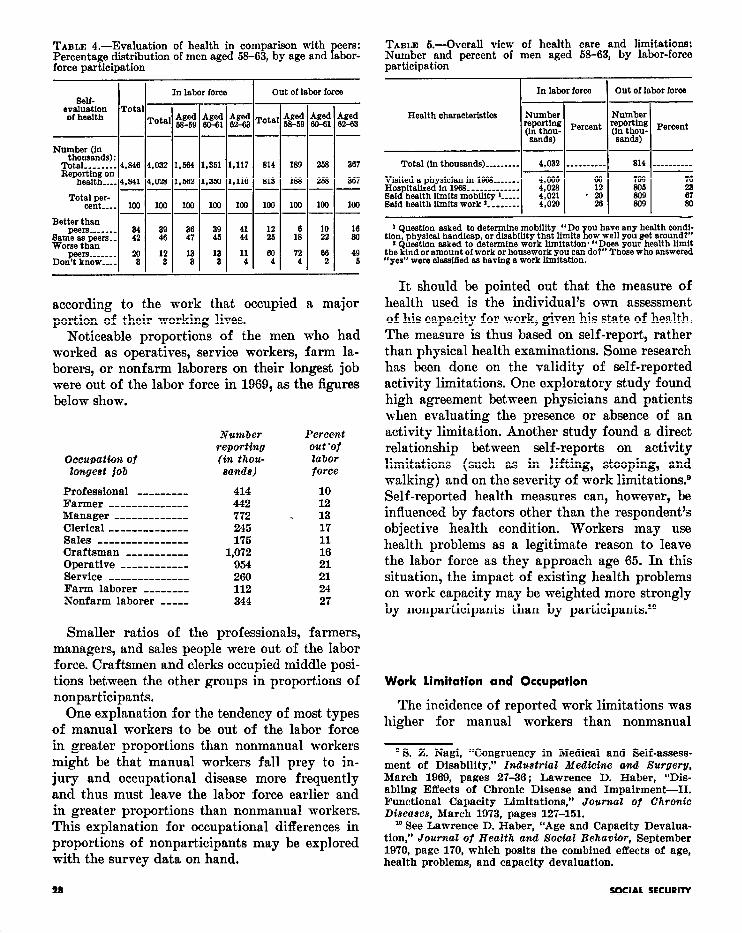
TABLE 4.-Evaluation of health in comparison with P
eers: TABLE &-Overall view of health care and limitations: Percentage distribution of men aged 53-63, by age and abor- Number and percent of men aged 6&63, by labor-force force participation participation
In labor force
Total per- cent.J loo I loo I loo I 100 I 100 I 100 I INI
Better than peers -______
Same as peers.. ii :: “4; 2 41 44 2 1:
Worse than peers _____-- Don’t know.... : 13” 1; 1; 11 4 tYj 7;
263 337
263 367 --
loo loo --
;!. :
66 2 “i
according to the work that occupied a major portion of their working lives.
Noticeable proportions of the men who had worked as operatives, service workers, farm la- borers, or nonfarm laborers on their longest job were out of the labor force in 1969, as the figures below show.
Occupatim of longeet job
Number reporting (in thou- eande)
Percent out-of labor force
Professional _________ 414 10 Farmer ______________ 442 12 Manager _____________ 772 - 13 Clerical ______________ 245 17 Sales ___-___--__- 175 11 Craftsman ___________ 1,072 16 Operative ________-_- 954 21 Service _- ____________ 260 21 Farm laborer ________ 112 24 Nonfarm laborer _____ 344 27
Smaller ratios of the professionals, farmers, managers, and sales people were out of the labor force. Craftsmen and clerks occupied middle posi- tions between the other groups in proportions of nonparticipants.
One explanation for the tendency of most types of manual workers to be out of the labor force in greater proportions than nonmanual workers might be that manual workers fall prey to in- jury and occupational disease more frequently and thus must leave the labor force earlier and in greater proportions than nonmanual workers. This explanation for occupational differences in proportions of nonparticipants may be explored with the survey data on hand.
In labor force Out of labor force , I
Total (in thousands) _________ 4,032 ~~~~~~.~-- 814 .___--_-__ ---
Visited B physician in 1963 _-- 4.00‘5 e4l Hospitalized in 1963 ____________. Said health limits mobility *-- “4% .g iI5 2
67 Said health limits work f ________ 4:oal 26 % 80
1 Question esked to determine mobility “Do tlon, physical handicap, or disability that limits K
ou have sny health condl- ow well you get around?”
a Question asked to determine work limitation* “Does your health limit the kind or amount of work or housework you oan do?” Those who answered r‘yes” were oleesifled as having B work Umltatlon.
It should be pointed out that the measure of health used is the individual’s own assessment of his capacity for work, given his state of health. The measure is thus based on self-report, rather than physical health examinations. Some research has been done on the validity of self-reported activity limitations. One exploratory study found high agreement between physicians and patients when evaluating the presence or absence of an activity limitation. Another study found a direct relationship between self-reports on activity limitations (such as in lifting, stooping, and walking) and on the severity of work limitations.e Self-reported health measures can, however, be influenced by factors other than the respondent’s objective health condition. Workers may use health problems as a legitimate reason to leave the labor force as they approach age 65. In this situation, the impact of existing health problems on work capacity may be weighted more strongly by nonparticipants than by participants.1°
Work limitation and Occupation
The incidence of report,ed work limitations was higher for manual workers than nonmanual
OS. Z. Nagi, “Congruency in Medical and Self-assess- ment of Disability,” Industrial Medicine and Surgery, March 1969, pages 27-36 ; Lawrence D. Haber, “Dis- abling Effects of Chronic Disease and Impairment-II. Functional Capacity Limitations,” Journal of Chronic Dbeaaes, March 1973, pages 127-151.
m See Lawrence D. Haber, “Age and Capacity Devalua- tion,” Journal of Health and Social Behavior, September 1970, page 170, which posits the combined effects of age, health problems, and capacity devaluation.
18 SOCIAL SECURITY
workers.11 For 43 percent of the nonfarm laborers, 49 percent of the farm laborers, and 38 percent of the service workers, their health condition limited the kind or amount of work they could do or prevented their working altogether (table 6). Only 21 percent of the professionals, and 28 per- cent of the managers reported work limitations.
It is also the case that men reporting health- imposed work limitations were out of the labor force in greater proportions than men without them. Nearly eight times as large a proportion of the men with health-imposed work limitations as of men without limitations were nonpartici- pants, as the following figures show.
Health-imposed work limitation _------- l No heleth-imposed work limitatlon--.--
1,676 3,164 I
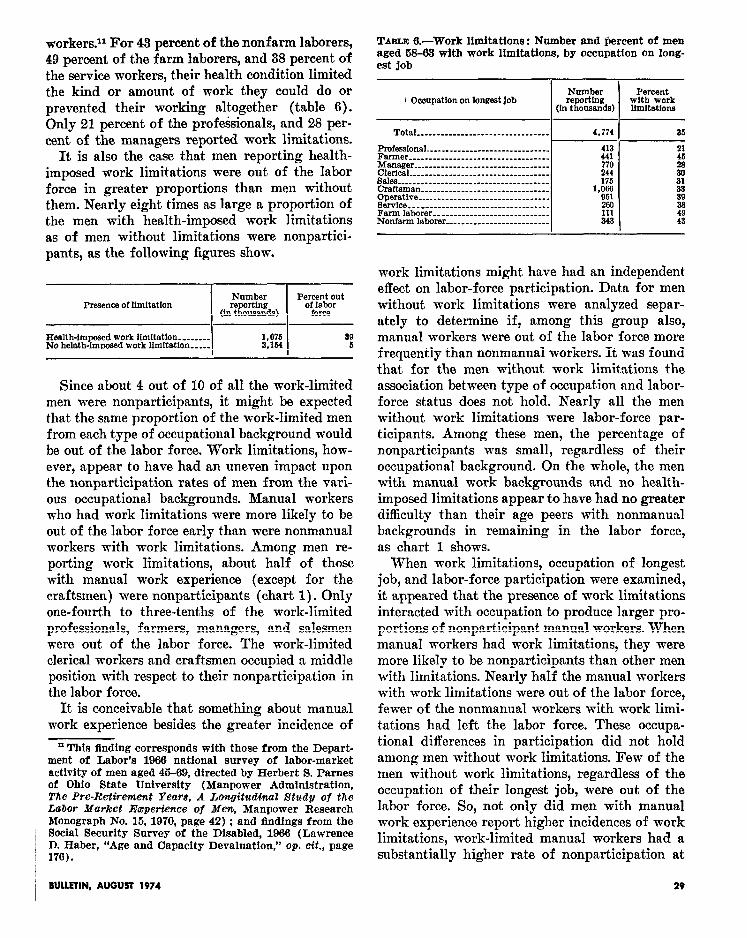
Since about 4 out of 10 of all the work-limited men were nonparticipants, it might be expected that the same proportion of the work-limited men from each type of occupational background would be out of the labor force. Work limitations, how- ever, appear to have had an uneven impact upon the nonparticipation rates of men from the vari- ous occupational backgrounds. Manual workers who had work limitations were more likely to be out of the labor force early than were nonmanual workers with work limitat,ions. Among men re- porting work limitations, about half of those with manual work experience (except for the craftsmen) were nonparticipants (chart 1). Only one-fourth to three-tenths of the work-limited professionals, farmers, managers, and salesmen were out of the labor force. The work-limited clerical workers and craftsmen occupied a middle position with respect to their nonparticipation in t,he labor force.
It is conceivable that something about manual work experience besides the greater incidence of
1l This finding corresponds with those from the Depart- ment of Labor’s 1966 national survey of labor-market activity of men aged 45-69, directed by Herbert S. Parnes of Ohio State University (Manpower Administration, The Pre-Retirement Yeare, A LolzgCtudhuzl Study of the Labor Market E@per&me of Me%, Manpower Research Monograph No. 16, 1970, page 42) ; and findings from the Social Security Survey of the Disabled, 1965 (Lawrence D. Haber, “Age and Capacity Devaluation,” op. cit., page 176).
TABLE B.-Work limitations: Number and percent of men aged 68-83 with work limitations, by occupation on long- est job
Total-.....---.-..-.------------------ 4,774
gQfe&O~Sl-- -- -- ------ ------ - - -- - -- - -- - -- 413 . _....._________.......~~~~~~.~... 441
Manager ___________________ _______________ 770 Clerical _-------_--------.----------------- 244 sales _.___._..___._._..._.~~~~~~~~~~...~..- 175 Cransman.------........-.-.-.----.-.-....,.... 1,068 Opmtiva -_-------_------------------.-.-- 961 serviea. _- .-~~~-...._-__~~-~~-~.~..- * ..-.- 260 Farm laborer--------------------~-------- 111 Nonfarm laborer---..-.....---...----....- 343
work limitations might have had an independent effect on labor-force participation. Data for men without work limitations were analyzed separ- ately to determine if, among this group also, manual workers were out of the labor force more frequently than nonmanual workers. It was found that for the men without work limitations the association between type of occupation and labor- force status does not hold. Nearly all the men without work limitations were labor-force par- ticipants. Among these men, the percentage of nonparticipants was small, regardless of their occupational background. On t,he whole, the men with manual work backgrounds and no health- imposed limitations appear to have had no greater difficulty than their age peers with nonmanunl backgrounds in remaining in the labor force, as chart 1 shows.
When work limitations, occupation of longest job, and labor-force participation were examined, it appeared that the presence of work limitations interacted with occupation to produce larger pro- portions of nonparticipant manual workers. When manual workers had work limitations, they were more likely to be nonparticipants than other men with limitations. Nearly half the manual workers with work limitations were out of the labor force, fewer of the nonmanual workers with work limi- tations had left the labor force. These occupa- tional differences in participation did not hold among men without work limitations. Few of the men without work limitations, regardless of the occupation of their longest job, were out of the labor force. So, not only did men with manual work experience report higher incidences of work limitations, work-limited manual workers had a substantially higher rate of nonparticipation at
BULLETIN, AUGUR 1974 29
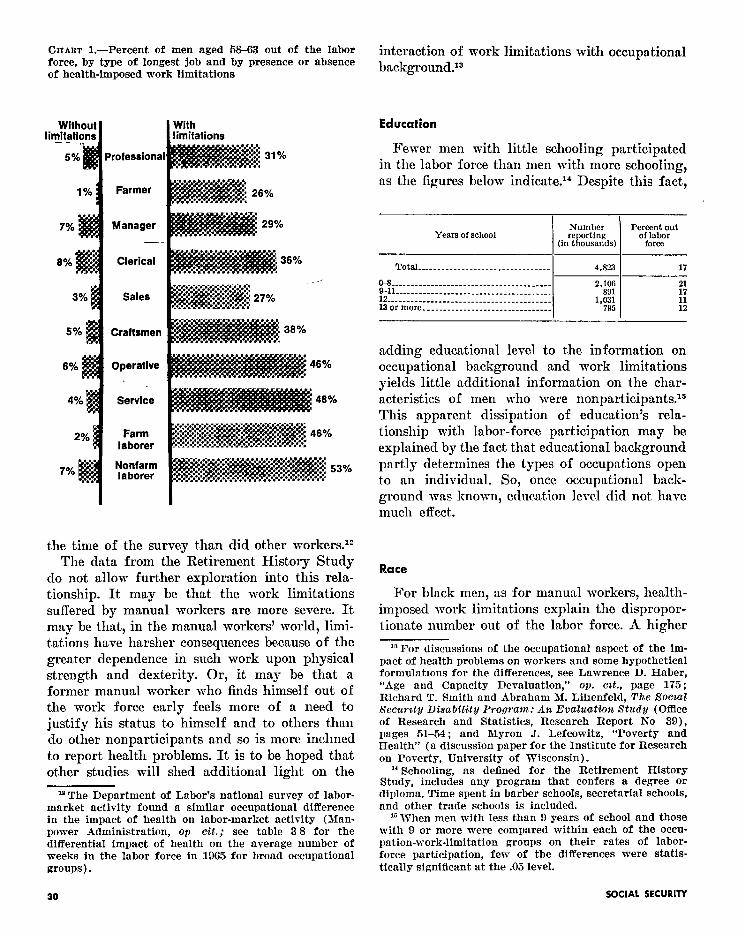
CIIART l.-Percent of men aged X-63 out of the labor force, by type of longest job and by presence or absence of health-imposed work limitations
Professional
Farmer
Manager -
Clerical
Sales
Craftsmen
Operative
Service
Farm laborer
Nonfarm laborer
the time of the survey than did other workers.** The data from the Retirement History Study
do not allow further exploration into this rela- tionship. It may be that the work limitations suffered by manual workers are more severe. It may be that, in the manual workers’ world, limi- tations have harsher consequences because of the greater dependence in such work upon physical strength and dexterity. Or, it may be that a former manual worker who finds himself out of the work force early feels more of a need to justify his status to himself and to others than do other nonparticipants and so is more inclined to report health problems. It is to be hoped that other studies will shed additional light on the
=The Department of Labor’s national survey of labor- market activity found a similar occupational difference in the impact of health on labor-market activity (Man- power Administration, op cit.; see table 3 8 for the differential impact of health on the average number of weeks in the labor force in 1965 for broad occupational groups).
interaction of work limitations with occups tional background.13
Education
Fewer men with little schooling participated in the labor force than men with more schooling, as the figures below indicate.14 Despite this fact,
Number Years of school reporting
PeorfxLrLo;llt
(in thousands) force
Total __________ _ _________ ____ _________ 4,823 17
o-8. - - - - - - - _ _ _ _ - - - - _ _ _ - - - - - - - - - - - - - - - _ _ - _ - - Q-11 _----__--_________-____________________
2,106 801
12 -__-__-_________________________________- 13ormore--..--............-....-_---..-. I I
21
1,031 :: 795 12
adding educational level to the information on occupational background and work limitations yields little additional information on the char- acteristics of men who were nonparticipants.15 This apparent dissipation of education’s rela- tionship with labor-force participation may be explained by the fact that educational background partly determines the types of occupations open to an individual. So, once occupational back- ground was known, education level did not have much effect.
Race
For black men, as for manual workers, health- imposed work limitations explain the dispropor- tionate number out of the labor force. A higher
I3 For discussions of the occupational aspect of the im- pact of health problems on workers and some hypothetical formulatmns for the differences, see Lawrence D. Haber, “Age and Capacity Devaluation,” op. cat., page 175; Richard T. Smith and Abraham M. Lihenfeld, Tke Social Sccurzty Disability Program: A?z Evaluation Study (Office of Research and Statistics, Research Report No 39). pages 51-54 ; and Myron J. Lefcowitz, “Poverty and Health” (a discussion paper for the Institute for Research on Poverty, University of Wisconsin).
I4 Schooling, as defined for the Retirement History Study, includes any program that confers a degree or diploma. Time spent in barber schools, secretarial schools, and other trade schools is included.
G When men with less than 9 years of school and those with 9 or more were compared within each of the occu- pation-work-limitation groups on their rates of labor- force participation, few of the differences were statis- tically significant at the .05 level.
30 SOCIAL SECURITY
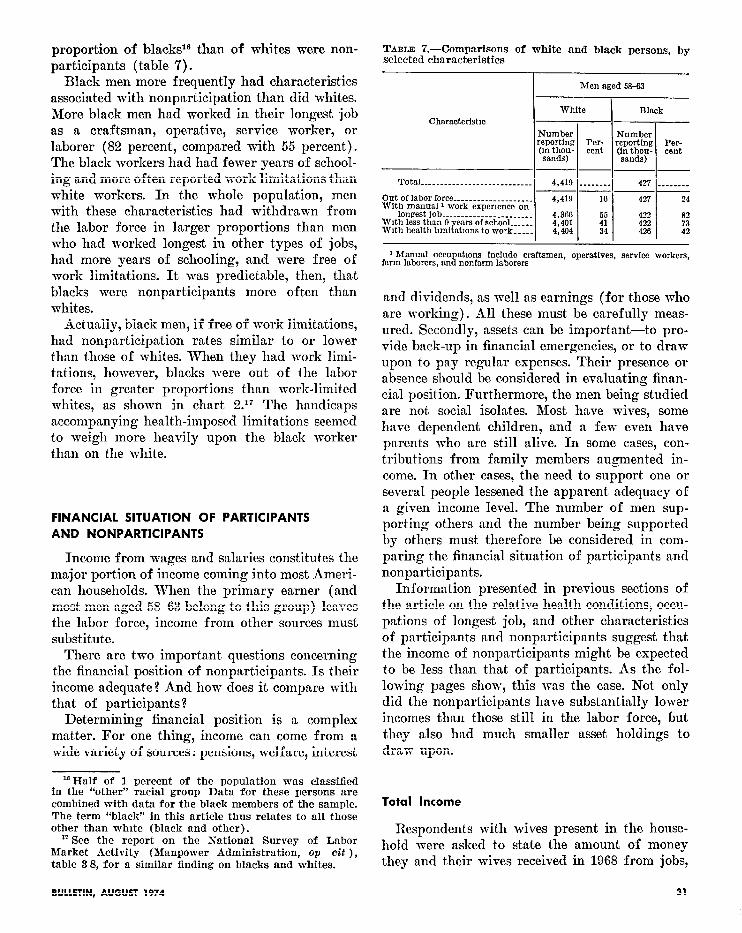
proportion of blackP than of whites were non- participants (table 7).
Black men more frequently had characteristics associated with nonparticipation than did whites. More black men had worked in their longest job as a craftsman, operative, service worker, or laborer (82 percent, compared with 55 percent). The black workers had had fewer years of school- ing and more often reported work limitations than white workers. In the whole population, men with these characteristics had withdrawn from the labor force in larger proportions than men who had worked longest in other types of jobs, had more years of schooling, and were free of work limitations. It was predictable, then, that blacks were nonparticipants more often than whites.
Actually, black men, if free of work limitations, had nonparticipation rates similar to or lower than those of whites. When they had work limi- tations, however, blacks were out of the labor force in greater proportions than work-limited whites, as shown in chart 2.17 The handicaps accompanying health-imposed limitations seemed to weigh more heavily upon the black worker than on the white.
FINANCIAL SITUATION OF PARTICIPANTS AND NONPARTICIPANTS
Income from wages and salaries constitutes the major portion of income coming into most Ameri- can households. When the primary earner (and most men aged 58-63 belong to this group) leaves the labor force, income from other sources must substitute.
There are two important questions concerning the financial position of nonparticipants. Is their income adequate? And how does it compare with that of participants?
Determining financial position is a complex matter. For one thing, income can come from a wide variety of sources : pensions, welfare, interest
I8 Half of 1 percent of the population was classified in the “other” racial group Data for these persons are combined with data for the black members of the sample. The term “black” in this article thus relates to all those other than white (black and other).
*‘See the report on the National Survey of Labor Market Activity (Manpower Administration, op cil ), table 3 8, for a similar finding on blacks and whites.
TABLE 7.-Comparisons of white and black persons, by selected characteristics
I Men aged 68-63
Chnracteristx Number reporting Per- reporting Per-
TOtal .---------_-_---____________ 4,419 ____--_- I-
Out of labor force ____________________ With manual 1 work experience on
longest job .______________________ WAh less than 9 years of school-.---- With health hmitatlons to work-.-..
--- 4,419 16
% 4:404
:I 34
-- 427 24
:ii 82 73
426 42
1. Manual occupations include craftsmen, operatives, service workers, farm laborers, and nonfarm laborers
and dividends, as well as earnings (for those who are working). All these must be carefully meas- ured. Secondly, assets can be important-to pro- vide back-up in financial emergencies, or to draw upon to pay regular expenses. Their presence or absence should be considered in evaluating finan- cial position. Furthermore, the men being studied are not social isolates. Most have wives, some have dependent children, and a few even have parents who are still alive. In some cases, con- tributions from family members augmented in- come. In other cases, the need to support one or several people lessened the apparent adequacy of a given income level. The number of men sup- port,ing others and the number being supported by others must therefore be considered in com- paring the financial situation of participants and nonparticipants.
Information presented in previous sections of the article on the relative health conditions, occu- pations of longest job, and other characteristics of participants and nonparticipants suggest that the income of nonparticipants might be expected to be less than that of participants. As the fol- lowing pages show, this was the case. Not only did the nonparticipants have substantially lower incomes than those still in the labor force, but they also had much smaller asset holdings to draw upon.
Total Income
Respondents with wives present in the house- hold were asked to state the amount of money they and their wives received in 1968 from jobs,
BULLETIN, AUGUST 1974 31
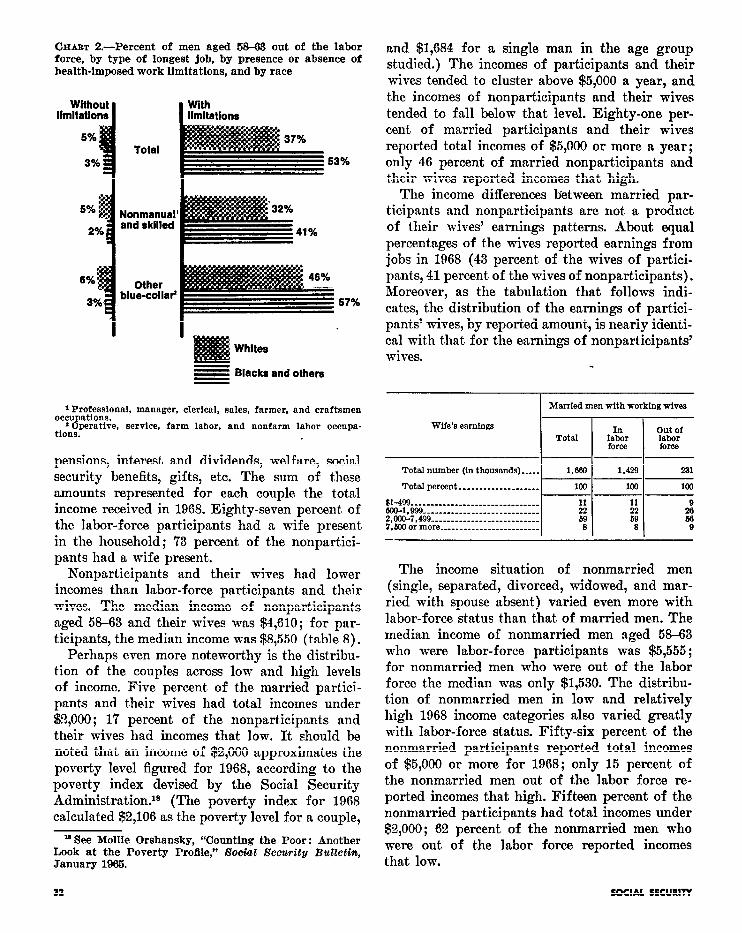
CRAET P.-Percent of men aged 68-83 out of the labor force, by type of longest job, by presence or absence of health-imposed work limitations, and by race
Without limitations I I KiFations
Total
Nonmanual’ and skilled
Other blue-colla?
w Blacks and others
1 Professional, manager, clerical, sales, farmer, and craftsmen occupations.
*Operative, service, farm labor, and nonfarm labor occupa- tions.
pensions, interest and dividends, welfare, social security benefits, gifts, etc. The sum of these amounts represented for each couple the total income received in 1968. Eighty-seven percent of the labor-force participants had a wife present in the household; 73 percent of the nonpartici- pants had a wife present.
Nonparticipants and their wives had lower incomes than labor-force participants and their wives. The median income of nonparticipants aged 58-63 and their wives was $4,610; for par- ticipants, the median income was $8,550 (table 8).
Perhaps even more noteworthy is the distribu- tion of the couples across low and high levels of income. Five percent of the married partici- pants and their wives had total incomes under $2,000; 17 percent of the nonparticipants and their wives had incomes that low. It should be noted that an income of $2,000 approximates the poverty level figured for 1968, according to the poverty index devised by the Social Security Administration.ls (The poverty index for 1968 calculated $2,106 as the poverty level for a couple,
U See Mollie Orshansky, “Counting the Poor: Another Look at the Poverty Proflle,” Boo&l Security Bulletin, January 1965.
and $1,684 for a single man in the age group studied.) The incomes of participants and their wives tended to cluster above $5,000 a year, and the incomes of nonparticipants and their wives tended to fall below that level. Eighty-one per- cent of married participants and their wives reported total incomes of $5,000 or more a year; only 46 percent of married nonparticipants and their wives reported incomes that high.
The income differences between married par- ticipants and nonparticipants are not a product of their wives’ earnings patterns. About equal percentages of the wives reported earnings from jobs in 1968 (43 percent of the wives of partici- pants, 41 percent of the wives of nonparticipants). Moreover, as the tabulation that follows indi- cates, the distribution of the earnings of partici- pants’ wives, by reported amount, is nearly identi- cal with that for the earnings of nonparticipants’ wives. ”
Married men with work@ wlvea
Total number (in thousands)-.-.. 1,880 1,429 231
Total percent ____________________ 100 100 100
$1499 ------____--_-__--_------------ _ 9 Km-l,999 --_---_______________________ E it z,ocHJ-7,499 -__________________________ 69 ii ?.tmormore __-__--__________________ 8 8 9
The income situation of nonmarried men (single, separated, divorced, widowed, and mar- ried with spouse absent) varied even more with labor-force status than that of married men. The median income of nonmarried men a,ged 58-63 who were labor-force participants was $5,555 ; for nonmarried men who were out of the labor force the median was only $1,530. The distribu- tion of nonmarried men in low and relatively high 1968 income categories also varied greatly with labor-force status. Fifty-six percent of the nonmarried participants reported total incomes of $5,000 or more for 1968 ; only 15 percent of the nonmarried men out of the labor force re- ported incomes that high. Fifteen percent of the nonmarried participants had total incomes under $2,000 ; 62 percent of the nonmarried men who were out of the labor force reported incomes that low.
22 SOCIAL SECURITY
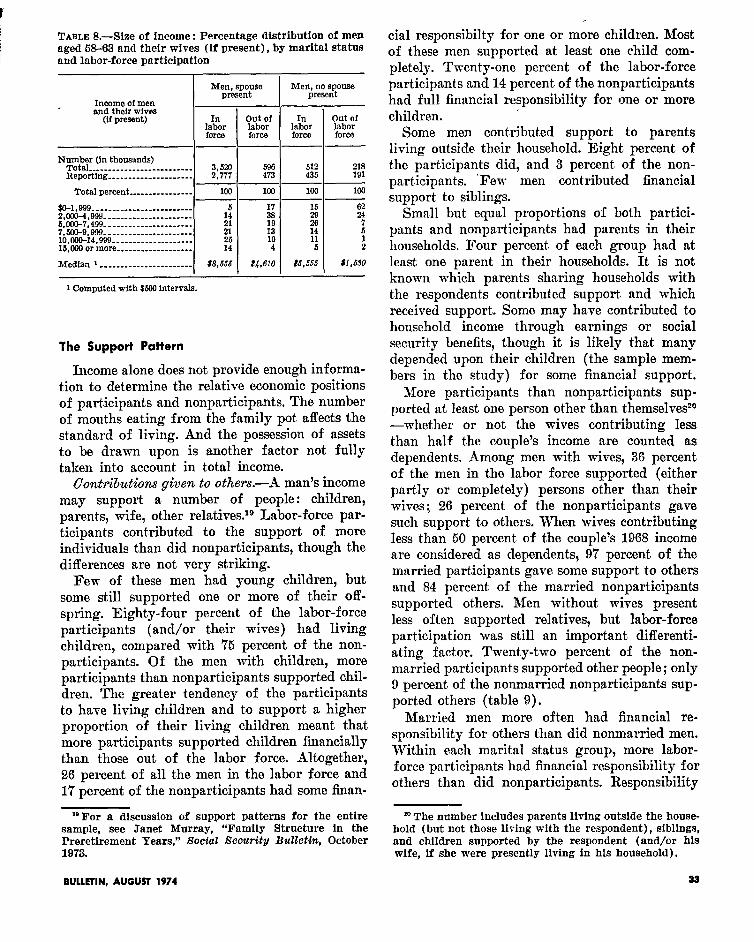
TABLE 8.-Size of income : Percentage distribution of men aged 5H3.3 and their wives (if present), by marital status and labor-force participation
Income of men and their wives
(if present)
Number (in thousands) Total _________.________________ Reporting _____________________ I --
Total percent ________________ -100 100 100 100 ---
SC-1,999. _--____-_--___---------- 6 2.cKo-4.999 ____________-_-_-_.--- i;: ti ii 5,m-7,499 ____________-____-.--- M 7,m-9,939 ~-___~~~~~~_-~~~~~~--- 21 :i 2 i lO,lW-14.999 ___----*------------ 15,ooO or more __._______-____~~~
:: 10 4 ‘i i
Medfan I_._____________________ $8,666 64,610 $6,666 $1 , mo
1 Computed with $593 intervals.
The Support Pattern
Income alone does not provide enough informa- tion to determine the relative economic positions of participants and nonparticipants. The number of mouths eating from the family pot affects the standard of living. And the possession of assets to be drawn upon is another factor not fully taken into account in total income.
Small but equal proportions of both partici- pants and nonparticipants had parents in their households. Four percent of each group had at least one parent in their households. It is not known which parents sharing households with the respondents contributed support and which received support. Some may have contributed to household income through earnings or social security benefits, though it is likely that many depended upon their children (the sample mem- bers in the study) for some financial support.
Conttibutions given to others.-A man’s income may support a number of people: children, parents, wife, other relatives.lg Labor-force par- ticipants contributed to the support of more individuals than did nonparticipants, though the differences are not very striking.
Few of these men had young children, but some still supported one or more of their off- spring. Eighty-four percent of the labor-force participants (and/or their wives) had living children, compared with ‘75 percent of the non- participants. Of the men with children, more participants than nonparticipants supported chil- dren. The greater tendency of the participants to have living children and to support a higher proportion of their living children meant that more participants supported children financially than those out of the labor force. Altogether, 26 percent of all the men in the labor force and 17 percent of the nonparticipants had some finan-
More participants than nonparticipants sup-, ported at least one person other than themselveszo -whether or not the wives contributing less than half the couple’s income are counted as dependents. Among men with wives, 36 percent of the men in the labor force supported (either partly or completely) persons other than their wives; 26 percent of the nonparticipants gave such support to others. When wives contributing less than 50 percent of the couple’s 1968 income are considered as dependents, 97 percent of the married participants gave some support to others and 84 percent of the married nonparticipants supported others. Men without wives present less often supported relatives, but labor-force participation was still an important differenti- ating factor. Twenty-two percent of the non- married participants supported other people ; only 9 percent of the nonmarried nonparticipants sup- ported others (table 9).
Married men more often had financial re- sponsibility for others than did nonmarried men. Within each marital status group, more labor- force participants had financial responsibility for others than did nonparticipants. Responsibility
“For a discussion of support patterns for the entire m The number includes parents living outside the house- sample, see Janet Murray, “Family Structure in the hold (but not those living with the respondent), siblings, Preretirement Years,” Social 6ecurity Bulletin, October and children supported by the respondent (and/or his 1973. wife, if she were presently living in his household).
cial responsibilty for one or more children. Most of these men supported at least one child com- pletely. Twenty-one percent of the labor-force participants and 14 percent of the nonparticipants had full financial responsibility for one or more children.
Some men contributed support to parents living outside their household. Eight percent of the participants did, and 3 percent of the non- participants. ‘Few men contributed financial support to siblings.
BULLETIN, AUGUST 1974
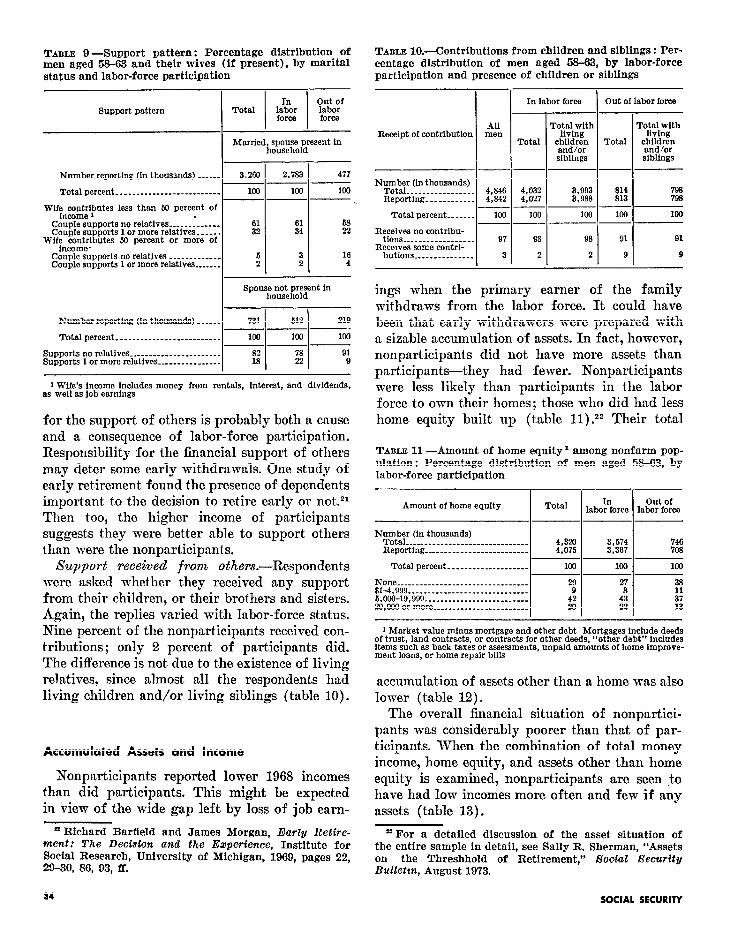
TABLE 9 -Support pattern : Percentage distribution of men aged 58-63 and their wives (if present), by marital status and labor-force participation
support pattern
Married, spouse present in household
Number reporting (in thousands) ______ 3,260 -2.733 477
Total percent __________________________ ----ii7 lflll 100 -~
Wif~n~mtipntes less than SO percent of Couple supports no relatives ______ I_____. Couple supports 1 or more relatives.-.... i:: :: El
Wif;nx$ibutes W percent or more of
C011ple supports no relatives _____________ Oouple supports 1 or more relatives...-.. i
3 16 2 4
Spolmnen~ R
o’$nt in
Number reporting (in thousands) ______ 731 512 219 ---.
Total percent.......------------------- 100 I I 100 100
Supports no relatives _______________________ Supports 1 or more relatives ____________.___ 1 El ::I “i
1 Wife’s Income includes money from rentals, interest, and dividends, as well as job earnings
for the support of others is probably both a cause and a consequence of labor-force participation. Responsibility for the financial support of others may deter some early withdrawals. One study of early retirement found the presence of dependents important to the decision to retire early or not.21 Then too, the higher income of participants suggests they were better able to support others than were the nonparticipants.
Support received from others.-Respondents were asked whether they received any support from their children, or their brothers and sisters. Again, the replies varied with labor-force status. Nine percent of the nonparticipants received con- tributions; only 2 percent of participants did. The difference is not due to the existence of living relatives, since almost all the respondents had living children and/or living siblings (table 10).
Accumulated Assets and Income
Nonparticipants reported lower 1968 incomes than did participants. This might be expected in view of the wide gap left by loss of job earn-
The overall financial situation of nonpartici- pants was considerably poorer than that of par- ticipants. When the combination of total money income, home equity, and assets other than home equity is examined, nonparticipants are seen -to have had low incomes more often and few if any assets (table 13).
s Richard Barfleld and James Morgan, Early Retke- B For a detailed discussion of the asset situation of ment: The Decision alzd the Experience, Institute for Social Research, University of Michigan, lQ69, pages 22,
the entire sample in detail, see Sally R. Sherman, “Assets
2Q-30, 86, 93, ff. on the Threshhold of Retirement,” social security Bulletam, August 1973.
TABLE lO.-Contributions from children and siblings : Per- centage distribution of men aged 63-63, by labor-force participation and presence of children or siblings
I I In labor force
I I Out of labor force
1 All
Receipt of contribution men Tolt$-$“th Tqtvl$th
Total children Total children and/or and/or siblings siblings
ings when the primary earner of the family withdraws from the labor force. It could have been that early withdrawers were prepared with a sizable accumulation of assets. In fact, however, nonparticipants did not have more assets than participants-they had fewer. Nonparticipants were less likely than participants in the labor force to own their homes; those who did had less home equity built up (table 11) .22 Their total
TABLE 11 -Amount of home equity * among nonfarm pop- ulation: Percentage distribution of men aged 58-63, by labor-force participation
Amount of home equity Total In out of labor force labor force
Number (in thousands) Total _______________________________ Reporting __________________________
Total percent ____________________
None----.-..-.....-.----------------- 814999 -_-----_----------__---------- 5,000-19.999 -_--__-__-_________-______ 2o.WO or more _____________ ___________
4,32u 3.674 4,075 3.367 ET!
109 100 100
29 27 33 9 8
42 20 2:
1 Market value minus mortgage and other debt Mortgages include deeds of trust, land contracts, or contracts for other deeds, “other debt” includes items such as back taxes or assessments, unpaid amounts of home improve- ment loans, or home repair bills
accumulation of assets other than a home was also lower (table 12).
SOCIAL SECURITY
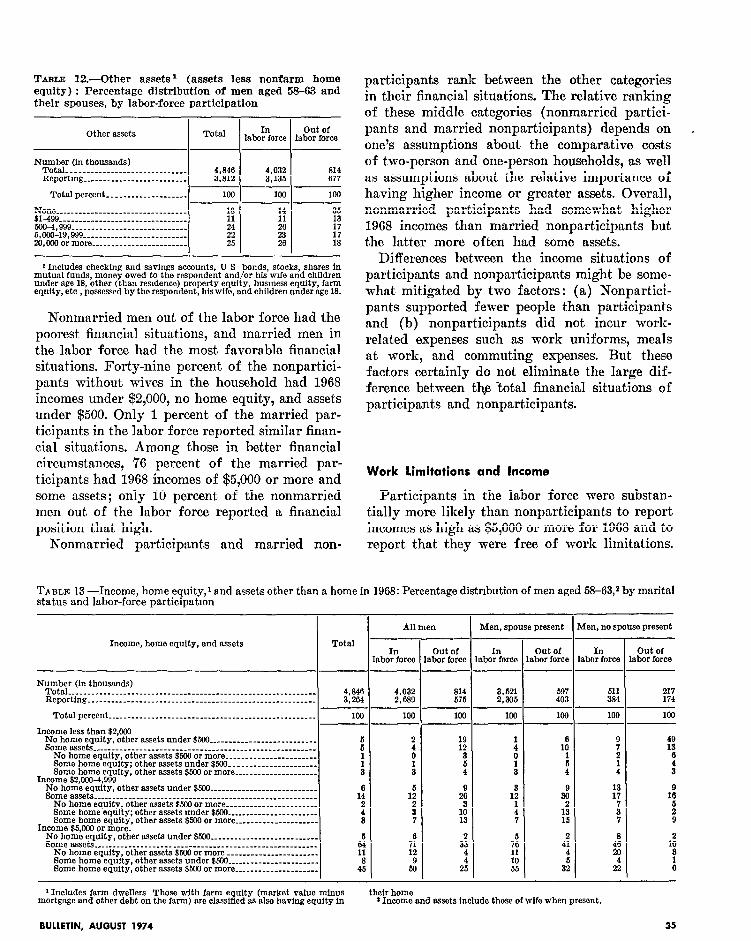
TABLE 12.-Other assets ’ (assets less nonfarm home equity) : Percentage distribution of men aged 58-63 and their spouses, by labor-force participation
participants rank between the other categories in their financial situations. The relative ranking of these middle categories (nonmarried partici- pants and married nonparticipants) depends on I one’s assumptions about the comparative costs of two-person and one-person households, as well as assumptions about the relative importance of having higher income or greater assets. Overall, nonmarried participants had somewhat higher 1968 incomes than married nonparticipants but the latter more often had some assets.
Differences between the income situations of participants and nonparticipants might be some- what mitigated by two factors: (a) Nonpartici- pants supported fewer people than participants and (b) nonparticipants did not incur work- related expenses such as work uniforms, meals at work, and commuting expenses. But these factors certainly do not eliminate the large dif- ference between tb total financial situations of participants and nonparticipants.
Number (in thousands) Total ______________________________ Reportmg __________________________
Total percent ____________________ 1 100 I 100 I None _____ ____________________________ a-499- - ____-_-__--___-__--_---------- :Yi :: :i m-4,999 ---__-----___-----_---------- 26 6.000-19.999 __---______-______-_------ E z :: 2o,oaJormore -_-__-_____--___-------- 25 18
1 Includes checking and savings accounts, TJ S bonds, stocks, shares in mutual funds, money owed to the respondent and/or his wife and children under age 18, other (than residence) property equity, busmess equity, farm equity, etc , possessed by the respondent, his wife, and children under age 18.
Nonmarried men out of the labor force had the poorest financial situations, and married men in the labor force had the most favorable financial situations. Forty-nine percent of the nonpartici- pants without wives in the household had 1968 incomes under $2,000, no home equity, and assets under $500. Only 1 percent of the married par- ticipants in the labor force reported simjlar finan- cial situations. Among those in better financial circumstances, 76 percent of the married par- ticipants had 1968 incomes of $5,000 or more and some assets; only 10 percent of the nonmarried men out of the labor force reported a financial position that high.
Nonmarried participants and married non-
Work limitations and Income
Participants in the labor force were substan- tially more likely than nonparticipants to report incomes as high as $5,000 or more for 1968 and to report that they were free of work limitations.
TABLE 13 -Income, home equity,’ and assets other than a home in 1968: Percentage distribution of men aged 5%63,* by marital status and labor-force participation
i- All men L lea, no spouse present Men, spouse present
In out of In out of In out Of rbor force ibor force ibor force sbor force %bor force rbor force
-
Ir --
--
--
Income, home equity, and assets Total
Number (in thousands) Total ________________________________________- _ ____________._______ Reporting _________________________ ________________________________
4,345 3,264
597 403
611 217 384 174
100 100
814 576
100
3,621 2,305
100 Total percent _____-__________________________________------------ 1 100 100 100 Income less than $Z,OO+l
No home eauits. other assets under $500 ___________________________ I 5 Some assets‘___________________ _ __________________________L_________ 6
No home equity, other assets $5Oil or more _______________________ Some home equity; other assets under $500 ______________________ : Some home equity, other assets $500 or more _____________________ 3
Income $2,ooO-4,999 No home equity, other assets under $500 ___________________________ Some assets ________________________________________---------------- 1:
No home equity, other assets WI or more ____________ I__________ Eome home equity; other assets under $500 _______________________ : Some home equity, other assets $500 or more _____________________ 8
Income $5,ooO or more. No home eauity. other assets under $500 ___________________________ 6 Eome assetL-ll________________________________________---------- I 64
No home equity, other assets $500 or more _______________________ Some home equity, other assets under $500 _______________________ Some home equity, other assets $500 or more _____________________
11
4:
* Includes farm dwellers Those with farm equity (market value minus mortgage and other debt on the farm) are classified as also having equity in
BULLETIN, AUGU5T 1974
their home *Income and assets include those of wife when present.
35
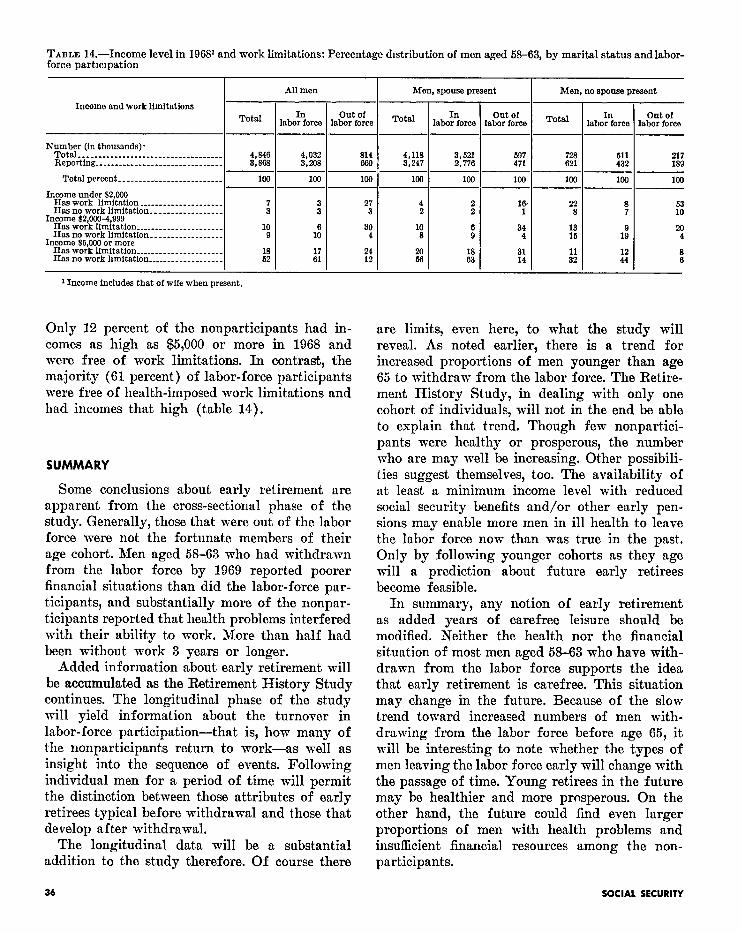
TABLE 14.-Income level in 196F and work limitations: Percentage dxstribution of men aged 58-63, by marital status andlabor- force participation
All men Men, spouse present Men, no spouse present
Income and work limitations Total Iu out of Total Iu out of Iu out of
labor force labor force labor force labor force Total labor force labor force
Number (in thousands). Total-..--.-.-......--------------------- 4,346 4,032 814 4,118 697 723 till 217 Reporttug ________________________________
3,521 3,863 3,208 660 3,247 2,776 471 621 432 139
Total percent __________________________ 100 100 100 100 100 100 100 100 100
Income under $2,000 Has work limitation _____________________ Has no work limitation __________________ i i:
27 4 l& 22 8 3 2 i 1 3
Income $2,C40-4,999 7 E
Has work limitation ______________________ 10 1:
30 10 Has no work limitation __________________
34 20 9 4 8
Income $5,ooO or more : 4 :i 1: 4
Has work limitation ______________________ Has no work hmitatiou ___________________ ii 2 ::
20 Ai
31 56 14 ii Ei
8 e
1 Income includes that of wife when present.
Only 12 percent of the nonparticipants had in- comes as high as $5,000 or more in 1968 and were free of work limitations. In contrast, the majority (61 percent) of labor-force participants were free of health-imposed work limitations and had incomes that high (table 14).
SUMMARY
Some conclusions about early retirement are apparent from the cross-sectional phase of the study. Generally, those that were out of the labor force were not the fortunate members of their age cohort. Men aged 58-63 who had withdrawn from the labor force by 1969 reported poorer financial situations than did the labor-force par- ticipants, and substantially more of the nonpar- ticipants reported that health problems interfered with their ability to work. More than half had been without work 3 years or longer.
Added information about early retirement will be accumulated as the Retirement History Study continues. The longitudinal phase of the study will yield information about the turnover in labor-force participation-that is, how many of the nonparticipants return to work-as well as insight into the sequence of events. Following individual men for a period of time will permit the distinction between those attributes of early retirees typical before withdrawal and those that develop after withdrawal.
The longitudinal data will be a substantial addition to the study therefore. Of course there
36
are limits, even here, to what the study will reveal. As noted earlier, there is a trend for increased proportions of men younger than age 65 to withdraw from the labor force. The Retire- ment History Study, in dealing with only one cohort of individuals, will not in the end be able to explain that trend. Though few nonpartici- pants were healthy or prosperous, the number who are may well be increasing. Other possibili- ties suggest themselves, too. The availability of at least a minimum income level with reduced social security benefits and/or other early pen- sions may enable more men in ill health to leave the labor force now than was true in the past. Only by following younger cohorts as they age will a prediction about future early retirees become feasible.
In summary, any notion of early retirement as added years of carefree leisure should be modified. Neither the health nor the financial situation of most men aged 58-63 who have with- drawn from the labor force supports the idea that early retirement is carefrw. This situation may change in the future. Because of the slow trend toward increased numbers of men with- drawing from the labor force before age 65, it will be interesting to note whether the types of men leaving the labor force early will change with the passage of time. Young retirees in the future may be healthier and more prosperous. On the other hand, the future could find even larger proportions of men with health problems and insufficient financial resources among the non- participants.
SOCIAL SECURITY
Technical Note TABLE I.-Reason for noninterview
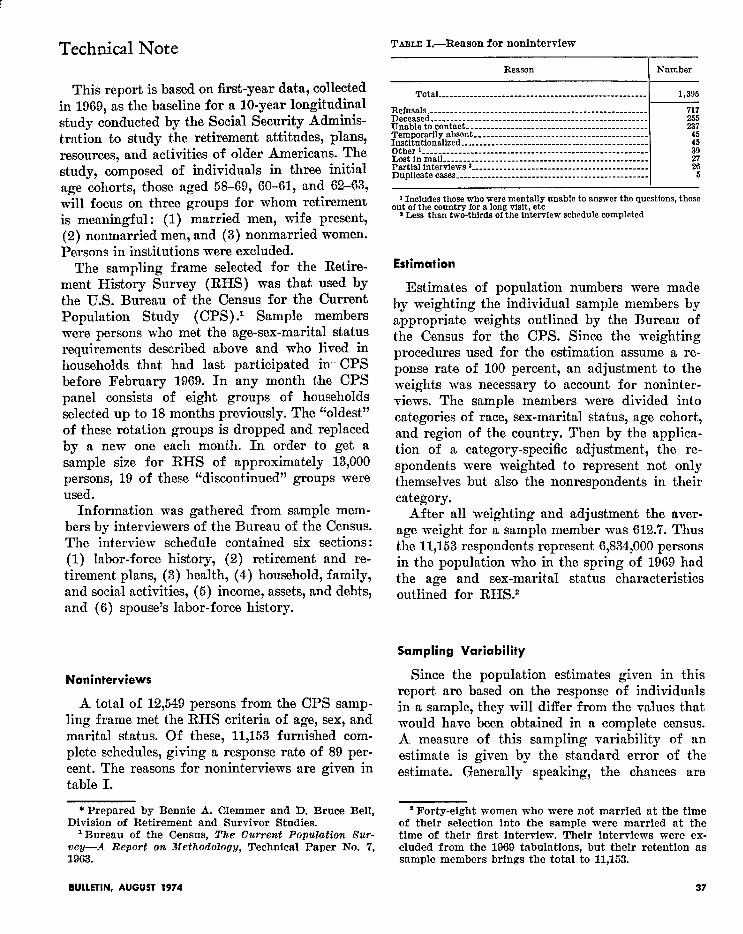
This report is based on first-year data, collected in 1969, as the baseline for a lo-year longitudinal study conducted by the Social Security Adminis- tration to study the retirement attitudes, plans, resources, and activities of older Americans. The study, composed of individuals in three initial age cohorts, those aged 58-69, 60-61, and 62-63, will focus on three groups for whom retirement is meaningful : (1) married men, wife present, (2) nonmarried men, and (3) nonmarried women. Persons in institutions were excluded.
The sampling frame selected for the Retire- ment, History Survey (RHS) was that used by the U.S. Bureau of the Census for the Current Population Study (CPS) 2 Sample members were persons who met the age-sex-marital status requirements described above and who lived in households that had last participated ixr- CPS before February 1969. In any month t,he CPS panel consists of eight groups of households selected up to 18 months previously. The “oldest” of these rotation groups is dropped and replaced by a new one each month. In order to get a sample size for RHS of approximately 13,000 persons, 19 of these “discontinued” groups were used.
Information was gathered from sample mem- bers by interviewers of the Bureau of the Census. The interview schedule contained six sections: (1) labor-force history, (2) retirement and re- tirement plans, (3) health, (4) household, family, and social activities, (5) income, assets, and debts, and (6) spouse’s labor-force history.
Noninterviews
A total of 12,549 persons from the CPS samp- ling frame met the RHS criteria of age, sex, and marital status. Of these, 11,153 furnished com- plete schedules, giving a response rate of 89 per- cent. The reasons for noninterviews are given in table I.
Since the population estimates given in this report are based on the response of individuals in a sample, they will differ from the values that would have been obtained in a complete census. A measure of this sampling variability of an estimate is given by the standard error of the estimate. Generally speaking, the chances are
* Prepared by Bennie A. Clemmer and D. Bruce Bell, ‘Forty-eight women who were not married at the time Division of Retirement and Survivor Studies. of their selection into the sample were married at the
‘Bureau of the Census, The Current Population b‘ur- time of their flrst interview. Their interviews were ex- vey-A Report on. ilfethodolog2/, Technical Paper No. 7, cluded from the 1969 tabulations, but their retention as 1963. sample members brings the total to 11,153.
Reason Number
Total...-----------.-------------------------------------
Refusals.-.-.--.....------------------------------------------- Deceased---.-.-..--------------------------------------------- Unable to contact--------------------------------------------- Temporarily absent ________________________________________--- Institutionalized ____________________________ ___________________ Other 1________________________________________---------------- Lost In mail ________________________________________----------- Partial interviews * ________________________________________---- Duplicate cases ________________________________________--------
1,385
717 255 237
:“5 39
1 Includes those who were mentally unable to answer the questions, those out of the country for a long visit, etc
* Less than two-thlrda of the interview schedule completed
Estimation
Estimates of population numbers were made by weighting the individual sample members by appropriate weights outlined by the Bureau of the Census for the CPS. Since the weighting procedures used for the estimation assume a re- ponse rate of 100 percent, an adjustment to the weights was necessary to account for noninter- views. The sample members were divided into categories of race, sex-marital status, age cohort, and region of the country. Then by the applica- tion of a category-specific adjustment, the re- spondents were weighted to represent not only themselves but also the nonrespondents in their category.
After all weighting and adjustment the aver- age weight for a sample member was 612.7. Thus the 11,153 respondents represent 6,834,OOO persons in the population who in the spring of 1969 had the age and sex-marital status characteristics outlined for RHS.2
Sampling Variability
BULLETIN, AUGUST 1974 37
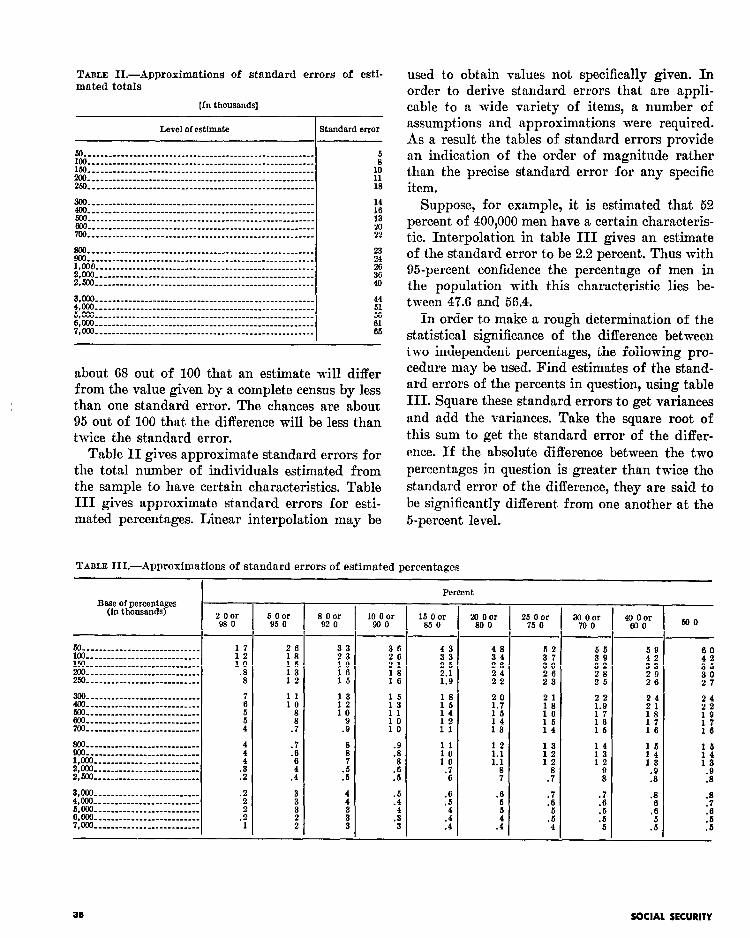
TABLE II.-Approximations of standard errors of esti- mated totals
[In thousands]
Level of estimate Standard error
so00 _____-__________________________________-------------- I
about 68 out of 100 that an estimate will differ from the value given by a complete census by less than one standard error. The chances are about 95 out of 100 that the difference will be less than twice the standard error.
Table II gives approximate standard errors for the total number of individuals estimated from the sample to have certain characteristics. Table III gives approximate standard errors for esti- mated percentages. Linear interpolation may be
used to obtain values not specifically given. In order to derive standard errors that are appli- cable to a wide variety of items, a number of assumptions and approximations were required. As a result the tables of standard errors provide an indication of the order of magnitude rather than the precise standard error for any specific item.
Suppose, for example, it is estimated that 52 percent of 400,000 men have a certain characteris- tic. Interpolation in table III gives an estimate of the standard error to be 2.2 percent. Thus with 95-percent confidence the percentage of men in the population with this characteristic lies be- tween 47.6 and 56.4.
In order to make a rough determination of the statistical significance of the difference between two independent percentages, the following pro- cedure may be used. Find estimates of the stand- ard errors of the percents in question, using table III. Square these standard errors to get variances and add the variances. Take the square root of t,his sum to get the standard error of the differ- ence. If the absolute difference between the two percentages in question is greater than twice the standard error of the difference, they are said to be significantly different from one another at the B-percent level.
TABLE III.-Approximations of standard errors of estimated percentages
I Percent Base of percentages -
(in thousands) I “9: “d
8 oar 92 0
16 Oor 85 0
:Z
.:
.4
"8O"o"
SOCIAL SECURITY