Embed Size (px)
Citation preview
Early key findings from a study of
older people in Northern Ireland
The NICOLA Study
November 2017
Editors
Sharon Cruise
Frank Kee
Northern Ireland Cohort for the Longitudinal Study of Ageing
… Understanding today for a healthier tomorrow
Contributors
Frances Burns1, Gemma M. Carney2, Sharon Cruise1,3, Paula Devine2,
Anne Devlin4,3, Michael Donnelly1,3, Declan French4,3, Frank Kee1,3, Lorna
Montgomery2, Dermot O’Reilly1,3, Angie Scott1, Mark A. Tully1,3.
1 Centre for Public Health, School of Medicine, Dentistry and Biomedical Sciences, Queen’s University Belfast
2 School of Social Sciences, Education and Social Work, Queen’s University Belfast
3 UKCRC Centre of Excellence for Public Health Northern Ireland, Centre for Public Health, Queen’s
University Belfast
4 Queen’s Management School, Queen’s University Belfast
ForewordAs someone once said: “I want to die young, as old as possible”, surely a sentiment that we all share. The fact that life expectancy is increasing in Northern Ireland means that the fastest growing segment of our population is older people and, as we approach pensionable age, we want to think that we can enjoy good health and continue to contribute to society. That certainly coincides with what government wants for all of us too. Although older age is a time when mental and physical function may decline, we need to know more about the factors in our lives that delay dependency, find ways to improve the quality of older people’s lives, and how we can sustain their social, cultural and economic contribution.
The promotion of active healthy ageing is a global challenge and one that is being grasped by all government departments. We have an Active Aging Strategy (https://www.communities-ni.gov.uk/sites/default/files/publications/ofmdfm/active-ageing-strategy.pdf) that is designed to ensure that Northern Ireland is an age friendly region in which people, as they get older, are valued and supported to live actively to their fullest potential; with their rights respected and their dignity protected.
However, as we move to collective accountability for outcomes across government, we have come to realise that we need data with which to understand why and how certain socio-economic and biological factors are changing outcomes among older people, such as the length of their working lives, their experience of disability or their health.
Longitudinal studies like NICOLA help us do just that, and a study such as this, which follows a similar design to its sister studies in England and the Republic of Ireland, is long overdue. Over time, as the study matures, its value to policy makers will increase as it sheds more light about the transitions that we will face as we age. Also, it will help us to evaluate policies and keep us focussed on what counts and what works.
The study deserves our support and I am very grateful to Professor Ian Young, the study’s original Principal Investigator, and to the research team at QUB for their tireless energy and direction, but also to the NICOLA participants who have contributed so generously with their time and interest for the public good.
Dr Michael McBride Chief Medical Officer, Department of Health
182726 Nicola Study report__Wave__2.indb 1 20/11/2017 10:23
ForewordI am delighted to write a foreword for this first report on NICOLA findings.We know that our population is changing, and that life expectancy is rising. The latest population figures published in October 2017 suggest that by 2041, almost one in four people will be aged 64 or over. Indeed, by mid-2028, it is estimated that the number of people in this age group will exceed the number of children for the first time. The statistics also suggest that by 2041, 4% of the population will be aged 85 years or over.
We need to celebrate that many people are now living longer and often healthier lives. Older people make a huge contribution to their families and wider society, for example, in paid work, by volunteering, and by providing childcare for their grandchildren. Moreover, whilst we often think of older people requiring care from their families, the reverse is often true, with older people providing care for their partners, siblings or other family members.
At the same time, large numbers of older people are suffering due to poorer health, poverty and lack of appropriate care. Too many are experiencing loneliness for a host of reasons, including loss of relationships and social networks, often features of the ageing journey.
Against this backdrop, it is important that we acknowledge that older people are not a homogenous group, but rather as diverse in factors such as identity, experience and location as any other group in our society. This means that we need to understand the different aspects of people’s lives as they get older.
That is why we are very pleased to see the findings of the NICOLA survey. In particular, it is important that the survey explores not just the medical and health aspects of ageing, but also the social context of people’s lives, such as social participation and social connectedness.
The findings of this first wave of NICOLA data will provide a major resource for organisations working with and for older people. Within Age NI, we look forward to using these findings to inform and support our work. The data will also provide vital evidence for policy makers in planning for the future.
We also need to think of ageing as a process. The real strength of a longitudinal study such as NICOLA is that Northern Ireland now has the opportunity to explore older people’s lives as they age. We look forward to using the NICOLA findings in years to come.
Duane Farrell Charity Director, Age NI
182726 Nicola Study report__Wave__2.indb 2 20/11/2017 10:23
AcknowledgementsNICOLA would not have been possible without the contributions and support of many groups and individuals.
Firstly, we would like to acknowledge the vision and commitment of our funders:
the Atlantic Philanthropies, the Economic and Social Research Council, the UKCRC Centre of Excellence for Public Health Northern Ireland, the Centre for Ageing Research and Development in Ireland, the Office of the First Minister and Deputy First Minister, the Health and Social Care Research and Development Division of the Public Health Agency, the Wellcome Trust/Wolfson Foundation and Queen’s University Belfast. We would also like to state that any views expressed in this report are not necessarily those of the funders.
NICOLA’s first Principal Investigator was Professor Ian Young. He established a broadly based academic team in QUB to take the study forward through its first wave, and this report is also testament to his leadership and vision.
We would like to acknowledge the significant contributions made by members of the NICOLA Scientific Steering Committee, and the valuable advice and insight offered to the study team by the NICOLA Stakeholder Council. We thank the members of the NICOLA team who are involved in the ongoing, day-to-day management and administration of the NICOLA study, especially the two Project Managers, Frances Burns and Amanda Coulter – the hard work and dedication of all these individuals has enabled the study to deliver its objectives.
We are grateful to Ipsos MORI who conducted the NICOLA fieldwork, and who have co-ordinated a large team of dedicated and committed interviewers. Although not featured in this initial report on the first wave of interviews, we are also grateful to the staff of Wellcome Trust-Wolfson Northern Ireland Clinical Research Facility for facilitating the physical examinations of our NICOLA participants.
Finally, we must thank our participants among the over 50s of Northern Ireland, who have exceeded our expectations in their enthusiasm and participation in all components of the study, and the vast majority of whom have agreed to be re-contacted for later waves of the project. Without their time and effort, neither this report, nor the resource for future research offered by NICOLA would have been possible.
182726 Nicola Study report__Wave__2.indb 3 20/11/2017 10:23
ContentsForeword by Chief Medical Officer .......................................................................................1
Foreword by the Charity Director of AgeNI .......................................................................2
Acknowledgements .................................................................................................................3
Chapter 1 IntroductionFrank Kee .................................................................................................... 6
Chapter 2 Socio-demographic characteristics of older people in Northern Ireland
Dermot O’Reilly and Sharon Cruise ........................................................9
Chapter 3 Labour market participation of older people in Northern Ireland
Anne Devlin and Declan French ............................................................. 19
Chapter 4 Social connectedness: Older people as members of their families and communities
Paula Devine and Gemma M. Carney ....................................................32
Chapter 5 Social engagement of older peoplePaula Devine and Lorna Montgomery .................................................. 46
Chapter 6 Alcohol use, smoking and physical activity among older adults
Mark A. Tully, Angie Scott and Sharon Cruise ..................................... 56
182726 Nicola Study report__Wave__2.indb 4 20/11/2017 10:23
Chapter 7 Variations in self-reported health statusDermot O’Reilly and Sharon Cruise ......................................................72
Chapter 8 Health service utilisation by older peopleMichael Donnelly, Sharon Cruise and Dermot O’Reilly .....................80
Chapter 9 MethodologyFrances Burns, Frank Kee ....................................................................... 89
182726 Nicola Study report__Wave__2.indb 5 20/11/2017 10:23
Chapter 1
6
1 Introduction
Frank Kee
1.0 Among the challenging issues facing our society and the economy in Northern Ireland, one above all is pervasive and will affect virtually every aspect of our lives – the fact that people are living longer and the population is ageing. This trend is good news. However, it poses major societal and policy challenges, regarding, for example, how to maintain independence and health, organise and fund the delivery of care services for older people and plan for pension provision and the employment-related consequences of an increasing population of retirees.
It would be wrong to use easy and all too common stereotypes about older people. While many perceive older age as a time of declining mental and physical function, worse health, and economic and social dependency, what is striking about the health and social circumstances of older people is the variability of the picture. Therefore, there are few reasons why we should not find ways to sustain our older people’s social, cultural and economic contribution to society.
The promotion of active healthy ageing is a global challenge and one that is now being grasped by our government. The Office of the First Minister and Deputy First Minister is committed to working with other government departments to ensure optimum implementation of its Active Ageing Strategy (http://www.lawcentreni.org/news/recent-news/1-news/1283-ofmdfm-active-ageing-strategy-launched-today.html) to ensure that Northern Ireland is an age friendly region in which people, as they get older, are valued and supported to live actively to their fullest potential; with their rights respected and their dignity protected. However, it is widely acknowledged that existing government statistical data are not well designed to understand why and how certain social, economic and biological factors are changing outcomes among older people, such as the length of their working lives, their experience of disability, or their health itself. That is why many
182726 Nicola Study report__Wave__2.indb 6 20/11/2017 10:23
Early key findings from a study of older people in Northern Ireland (The NICOLA Study)
7
other countries have supported longitudinal studies of large samples of older people in which they are surveyed and followed over time with the aim to characterise and better understand why some people become dependent while others continue to enjoy mental and physical vigour into old age. In the Republic of Ireland, The Irish Longitudinal Study on Ageing (TILDA), and in England, the English Longitudinal Study of Ageing (ELSA), are already achieving these aims, and the Northern Ireland Cohort for the Longitudinal Study of Ageing (NICOLA) will complement those and help us hold up a mirror on what it is like to grow old in Northern Ireland.
1.1 The NICOLA project is thus the first large scale longitudinal study of ageing in Northern Ireland. It will help us gain a better understanding of the factors that affect social and health outcomes in the older Northern Ireland population. Over time, it will inform new prevention strategies, new interventions, new models of health and social care delivery, and ultimately contribute to how society should change to ensure a better quality of life for all.
It has been designed to maximise comparability with other well-established international longitudinal studies, in particular the Health and Retirement Survey (HRS) in the United States, ELSA, and TILDA, thereby facilitating cross-country comparisons. The present summary report refers specifically to some of the key findings from NICOLA Wave 1, but the intention is that the sample is re-surveyed every 2 to 3 years (the Wave 2 survey is currently ongoing). A broad group of academics from a wide range of disciplines, working with key stake-holders including the Commissioner for Older People for Northern Ireland and advisors from several government departments have contributed to the design of the study. Sampling people over the age of 50 years living in their own homes, in its first wave the study had three main components: a Computer-Assisted Personal Interview (CAPI) conducted in the person’s own home by Ipsos MORI; a self-completion questionnaire; and an objective health assessment conducted in the Wellcome Trust-Wolfson Northern Ireland Clinical Research Facility in Belfast. The present report deals mainly with preliminary findings from the CAPI. More precise detail on the NICOLA study’s methodology is offered in Chapter 9. Though much richer analyses will follow in subsequent reports, the reasons why we are highlighting the specific topics covered in this report are briefly given below.
1.2 In Chapter 2, we describe the socio-demographic characteristics of the sample of people included in the study. These alone are often very telling influences on whether we maintain our independence as we age, but it is also important that we contextualise our data so that we appreciate better how we can generalise our findings to the older population in Northern Ireland.
In Chapter 3, we highlight key issues pertaining to the participation of older people in the labour market in Northern Ireland. Government and independent bodies such as the Institute of Fiscal Studies have acknowledged that radical re-design of pensions policy is long overdue if we are to sustain our welfare provision. Therefore, it is
182726 Nicola Study report__Wave__2.indb 7 20/11/2017 10:23
Chapter 1
8
important that we understand the net economic contribution of our older people and how it varies across the population.
In Chapters 4 and 5, we describe the social connectedness and social engagement of older people. It is perhaps too easily forgotten that our older people often play vital roles in extended families and in the lives of local communities, making real contributions to the welfare of others and of the economy. At the same time, many older people will eventually live alone and loneliness is a major risk factor of a range of chronic disease, including poor mental health, cognitive decline and cardiovascular disease. Thus, it is vital that we design the right sorts of policies to mitigate the risks of a remediable social factor that has as much impact on the health of older people as high blood pressure or raised cholesterol.
In Chapter 6, we highlight some important health behaviours, including smoking and alcohol intake, and physical inactivity. While life expectancy has increased over recent decades, morbidity and disability have not declined and these lifestyle behaviours not only impact on mortality risks but sadly can leave our older people with significant disability. Thus, we must understand what determines their distribution in our population and the factors that may help us promote healthier lifestyles.
In Chapter 7, we focus on how people report their own health. Although this provides a subjective view, we know from a considerable scientific literature that such self-reports can produce surprisingly robust predictions of the morbidity and mortality that will be experienced by different groups of people. That is why we focus here on some of the obvious inequalities in this measure across social groups, and the data help paint a picture of the gain in public health that could be achieved if the health reported by the well-off were to be experienced by the most disadvantaged older people in Northern Ireland.
In Chapter 8, we report on important differences in the utilisation of some health services across socio-demographic groups in our NICOLA cohort. Such utilisation is clearly linked to self-reported health, but it also provides a different perspective on health inequalities. In some cases, this sort of data can give clues to the potential for redesigning or redirecting our health care, while in others it may suggest how our services could become more efficient.
In Chapter 9, we give a fuller account of the design of the study and an outline of all the major modules of questions that are covered in the first wave and some of the new topics that will be reported in Wave 2.
Overall, these initial results will become even richer when we follow-up the cohort to find out about the life experiences our participants have had over the coming years. It is this unfolding of their lives, over time, which will vastly strengthen the power and policy relevance of this important resource.
182726 Nicola Study report__Wave__2.indb 8 20/11/2017 10:23
Early key findings from a study of older people in Northern Ireland (The NICOLA Study)
9
2 Socio-demographic characteristics of older people in Northern Ireland
Dermot O’Reilly and Sharon CruiseKey Findings
• The proportion of women in the NICOLA cohort increases with age.
• Almost two-thirds were married; less than 10% never married.
• Widowhood increases with age: 54% of women aged 75 and over are widows.
• Overall, one quarter of NICOLA Study participants were living alone; the proportion living alone rose to almost 50% for people aged 75 years and older.
• Living alone is twice as common in the most deprived areas compared to the least deprived areas and three times as common in larger conurbations than in the most rural areas.
182726 Nicola Study report__Wave__2.indb 9 20/11/2017 10:23
Chapter 2
10
IntroductionAge and sex are the most important facets of the population that determine health, mortality risk and the use of health and social services. Other factors that play a pivotal role are household structure and socio-economic status. This chapter describes the main demographic characteristics of the NICOLA Study participants. We examine what sorts of people are included in the study, where they are living and who they are living with. We also describe some aspects of their socio-economic status (though other aspects such as economic activity will be described in Chapter 3).
BackgroundThe NICOLA Wave 1 cohort members were recruited from lists of people living in private households; residents of nursing or residential homes were not included in this wave of the study. In addition, the response rate was not uniform, but the responding sample has been ‘re-weighted’ to better reflect the balance of the Northern Ireland population according to age, sex and broad geographical distribution. These processes are described in more detail in Chapter 9 (Methodology). The percentages described in this chapter are based on these re-weighted distributions and are therefore more representative of the older population in Northern Ireland.
The data for this chapter also comes primarily from the home interview carried out by Ipsos MORI and relates to the basic demographic details of the participants, their family and household structure. It also incorporates religious affiliation, where appropriate, and level of educational attainment. Ethnicity is not included in this report for two reasons: firstly, Northern Ireland has traditionally been a very homogeneous population, with much lower levels of ethnic minorities than in other parts of the UK; and secondly, because these populations tend to be younger, with proportionally fewer in the NICOLA age range. The data have been further enhanced by addition of other information that is related to the participant’s residential address. First, we included data from the Land and Property Services relating to the approximate year when the house was built and its estimated capital value at 1st January 2005, based on an exercise to produce rateable valuations. House value is thought to be a good indicator of accumulated wealth and has been shown to be an independent indicator of health and mortality risk (1). Second, the postcode of the cohort member’s residence was also linked to the appropriate administrative datasets to describe the characteristics of the area in which they lived. Each NICOLA participant was thus assigned an indicator of urban or rural living based on an urban-rural classification of settlements in 2005 by the Northern Ireland Statistics and Research Agency (NISRA) (2). This eight-fold stratification was reclassified into three groups, the first group representing the areas containing and surrounding Belfast and Derry/Londonderry (called ‘urban’), the last group representing settlement bands with less than 1,000 people (called ‘rural’), and the intermediate
182726 Nicola Study report__Wave__2.indb 10 20/11/2017 10:23
Early key findings from a study of older people in Northern Ireland (The NICOLA Study)
11
areas (called ‘intermediate’). Third, an indicator of area deprivation based on the Northern Ireland Multiple Deprivation Measure was added to the data (3); this was divided into five equal groups ranging from most deprived to least deprived.
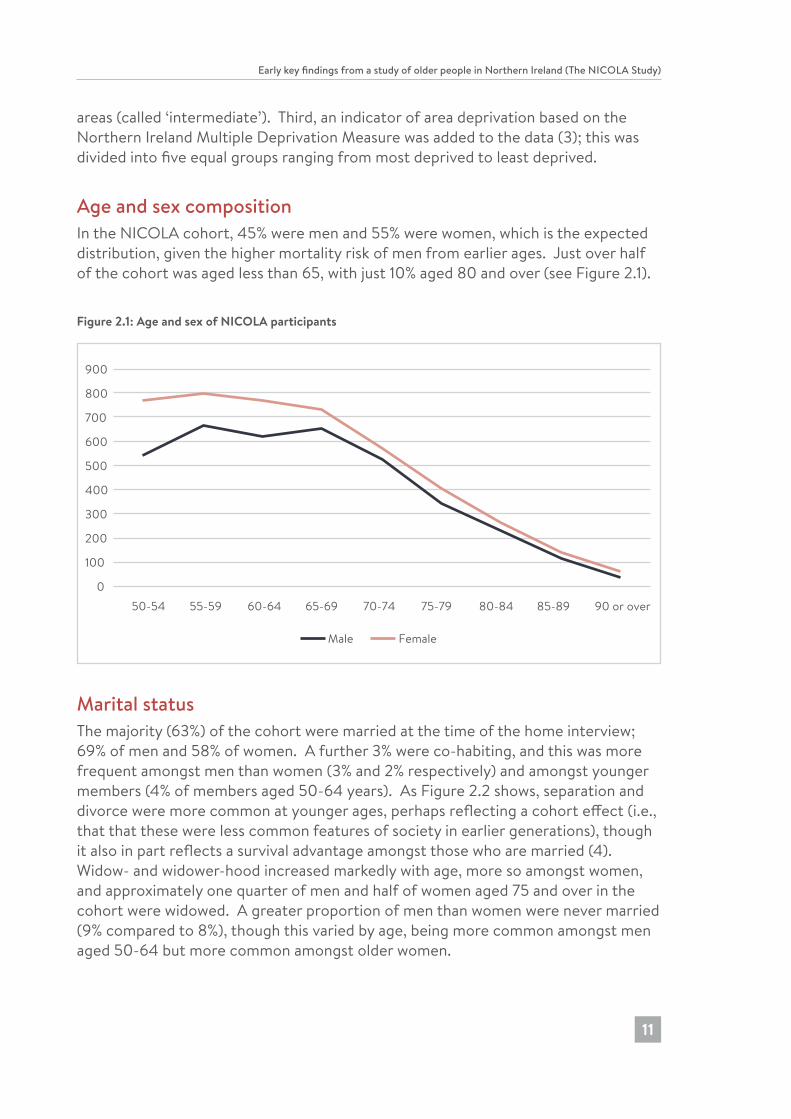
Age and sex compositionIn the NICOLA cohort, 45% were men and 55% were women, which is the expected distribution, given the higher mortality risk of men from earlier ages. Just over half of the cohort was aged less than 65, with just 10% aged 80 and over (see Figure 2.1).
Figure 2.1: Age and sex of NICOLA participants
0
100
200
300
400
500
600
700
800
900
50-54 55-59 60-64 65-69 70-74 75-79 80-84 85-89 90 or over
Male Female
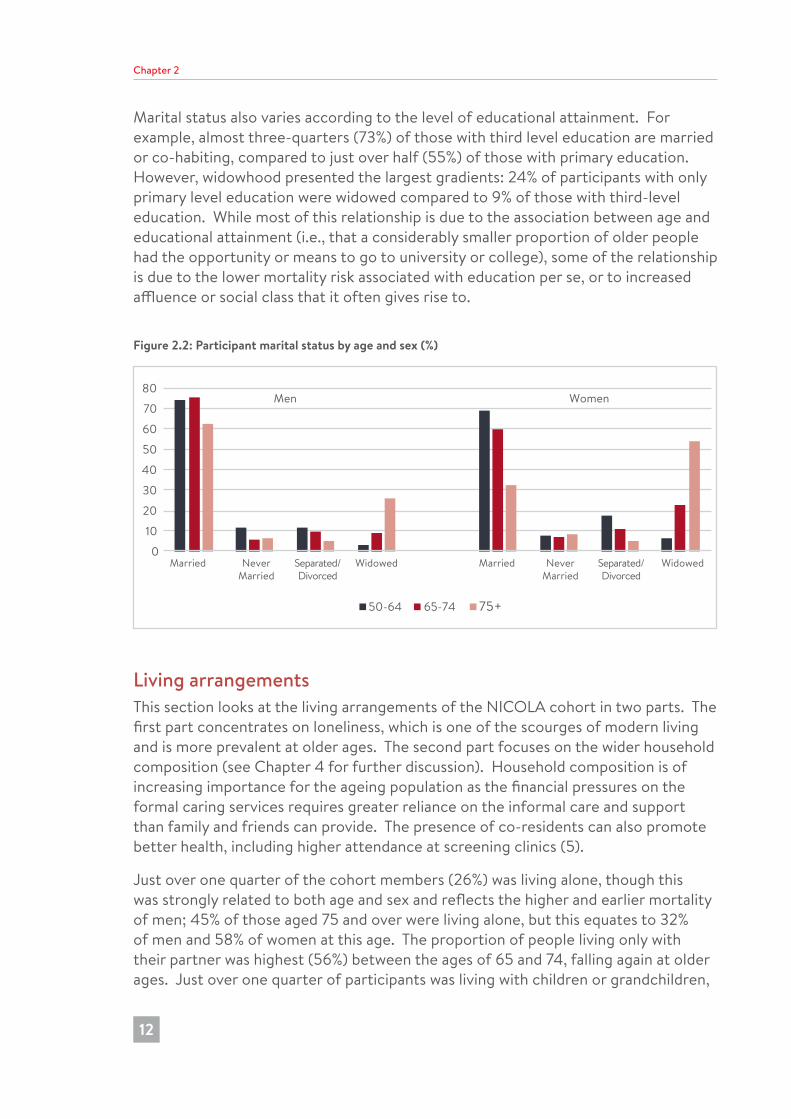
Marital statusThe majority (63%) of the cohort were married at the time of the home interview; 69% of men and 58% of women. A further 3% were co-habiting, and this was more frequent amongst men than women (3% and 2% respectively) and amongst younger members (4% of members aged 50-64 years). As Figure 2.2 shows, separation and divorce were more common at younger ages, perhaps reflecting a cohort effect (i.e., that that these were less common features of society in earlier generations), though it also in part reflects a survival advantage amongst those who are married (4). Widow- and widower-hood increased markedly with age, more so amongst women, and approximately one quarter of men and half of women aged 75 and over in the cohort were widowed. A greater proportion of men than women were never married (9% compared to 8%), though this varied by age, being more common amongst men aged 50-64 but more common amongst older women.
182726 Nicola Study report__Wave__2.indb 11 20/11/2017 10:23
Chapter 2
12
Marital status also varies according to the level of educational attainment. For example, almost three-quarters (73%) of those with third level education are married or co-habiting, compared to just over half (55%) of those with primary education. However, widowhood presented the largest gradients: 24% of participants with only primary level education were widowed compared to 9% of those with third-level education. While most of this relationship is due to the association between age and educational attainment (i.e., that a considerably smaller proportion of older people had the opportunity or means to go to university or college), some of the relationship is due to the lower mortality risk associated with education per se, or to increased affluence or social class that it often gives rise to.
Figure 2.2: Participant marital status by age and sex (%)
0
10
20
30
40
50
60
70
80
Married NeverMarried
Separated/Divorced
Widowed Married NeverMarried
Separated/Divorced
Widowed
50-64 65-74 75+
Men Women
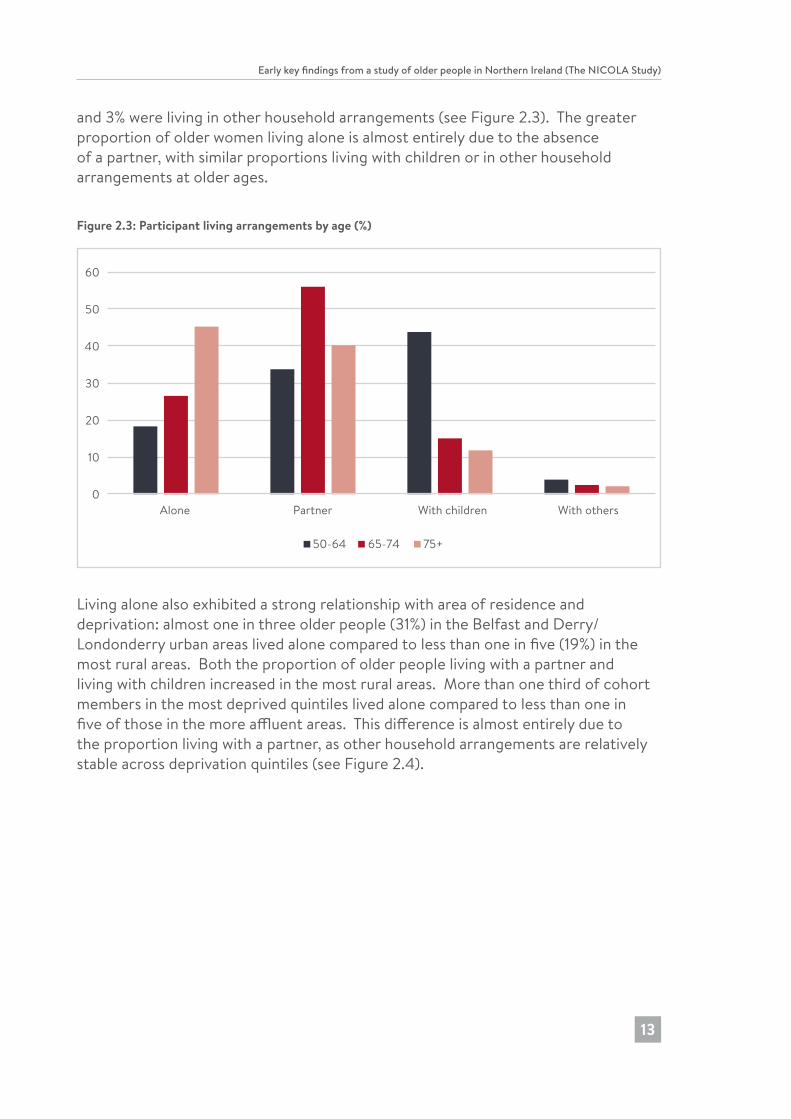
Living arrangementsThis section looks at the living arrangements of the NICOLA cohort in two parts. The first part concentrates on loneliness, which is one of the scourges of modern living and is more prevalent at older ages. The second part focuses on the wider household composition (see Chapter 4 for further discussion). Household composition is of increasing importance for the ageing population as the financial pressures on the formal caring services requires greater reliance on the informal care and support than family and friends can provide. The presence of co-residents can also promote better health, including higher attendance at screening clinics (5).
Just over one quarter of the cohort members (26%) was living alone, though this was strongly related to both age and sex and reflects the higher and earlier mortality of men; 45% of those aged 75 and over were living alone, but this equates to 32% of men and 58% of women at this age. The proportion of people living only with their partner was highest (56%) between the ages of 65 and 74, falling again at older ages. Just over one quarter of participants was living with children or grandchildren,
182726 Nicola Study report__Wave__2.indb 12 20/11/2017 10:23
Early key findings from a study of older people in Northern Ireland (The NICOLA Study)
13
and 3% were living in other household arrangements (see Figure 2.3). The greater proportion of older women living alone is almost entirely due to the absence of a partner, with similar proportions living with children or in other household arrangements at older ages.
Figure 2.3: Participant living arrangements by age (%)
0
10
20
30
40
50
60
Alone Partner With children With others
50-64 65-74 75+
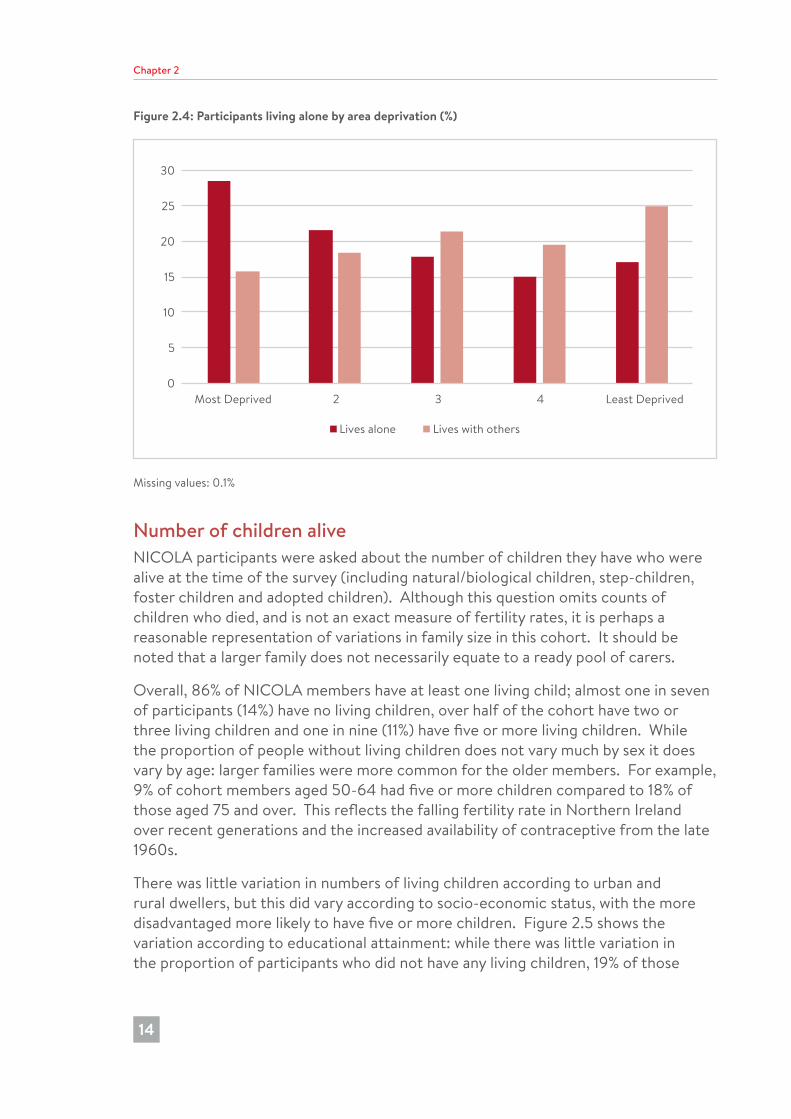
Living alone also exhibited a strong relationship with area of residence and deprivation: almost one in three older people (31%) in the Belfast and Derry/Londonderry urban areas lived alone compared to less than one in five (19%) in the most rural areas. Both the proportion of older people living with a partner and living with children increased in the most rural areas. More than one third of cohort members in the most deprived quintiles lived alone compared to less than one in five of those in the more affluent areas. This difference is almost entirely due to the proportion living with a partner, as other household arrangements are relatively stable across deprivation quintiles (see Figure 2.4).
182726 Nicola Study report__Wave__2.indb 13 20/11/2017 10:23
Chapter 2
14
Figure 2.4: Participants living alone by area deprivation (%)
0
5
10
15
20
25
30
Most Deprived 2 3 4 Least Deprived
Lives alone Lives with others
Missing values: 0.1%
Number of children aliveNICOLA participants were asked about the number of children they have who were alive at the time of the survey (including natural/biological children, step-children, foster children and adopted children). Although this question omits counts of children who died, and is not an exact measure of fertility rates, it is perhaps a reasonable representation of variations in family size in this cohort. It should be noted that a larger family does not necessarily equate to a ready pool of carers.
Overall, 86% of NICOLA members have at least one living child; almost one in seven of participants (14%) have no living children, over half of the cohort have two or three living children and one in nine (11%) have five or more living children. While the proportion of people without living children does not vary much by sex it does vary by age: larger families were more common for the older members. For example, 9% of cohort members aged 50-64 had five or more children compared to 18% of those aged 75 and over. This reflects the falling fertility rate in Northern Ireland over recent generations and the increased availability of contraceptive from the late 1960s.
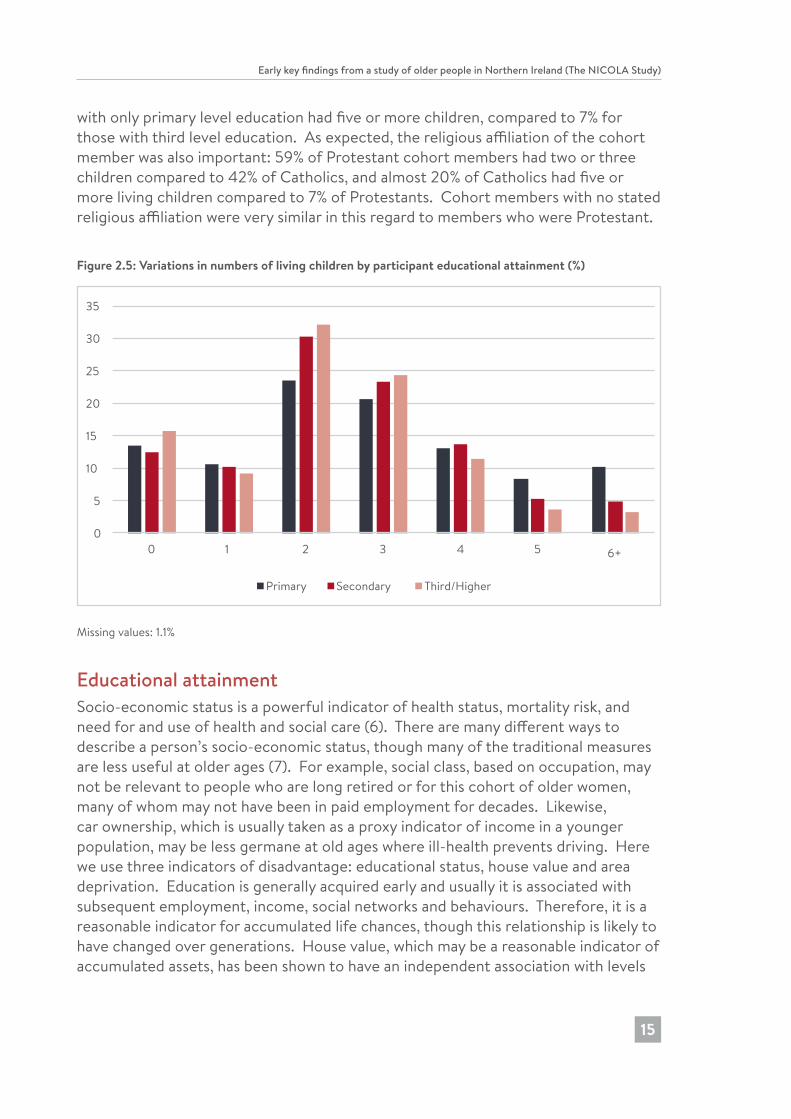
There was little variation in numbers of living children according to urban and rural dwellers, but this did vary according to socio-economic status, with the more disadvantaged more likely to have five or more children. Figure 2.5 shows the variation according to educational attainment: while there was little variation in the proportion of participants who did not have any living children, 19% of those
182726 Nicola Study report__Wave__2.indb 14 20/11/2017 10:23
Early key findings from a study of older people in Northern Ireland (The NICOLA Study)
15
with only primary level education had five or more children, compared to 7% for those with third level education. As expected, the religious affiliation of the cohort member was also important: 59% of Protestant cohort members had two or three children compared to 42% of Catholics, and almost 20% of Catholics had five or more living children compared to 7% of Protestants. Cohort members with no stated religious affiliation were very similar in this regard to members who were Protestant.
Figure 2.5: Variations in numbers of living children by participant educational attainment (%)
0
5
10
15
20
25
30
35
0 1 2 3 4 5 6+
Primary Secondary Third/Higher
Missing values: 1.1%
Educational attainmentSocio-economic status is a powerful indicator of health status, mortality risk, and need for and use of health and social care (6). There are many different ways to describe a person’s socio-economic status, though many of the traditional measures are less useful at older ages (7). For example, social class, based on occupation, may not be relevant to people who are long retired or for this cohort of older women, many of whom may not have been in paid employment for decades. Likewise, car ownership, which is usually taken as a proxy indicator of income in a younger population, may be less germane at old ages where ill-health prevents driving. Here we use three indicators of disadvantage: educational status, house value and area deprivation. Education is generally acquired early and usually it is associated with subsequent employment, income, social networks and behaviours. Therefore, it is a reasonable indicator for accumulated life chances, though this relationship is likely to have changed over generations. House value, which may be a reasonable indicator of accumulated assets, has been shown to have an independent association with levels
182726 Nicola Study report__Wave__2.indb 15 20/11/2017 10:23
Chapter 2
16
of self-reported health status and mortality (1). Finally the characteristics of the area of residence may play a significant role; it is well recognised that people who live in more disadvantaged areas have shorter life expectancies and spend longer proportions of their lives in poor health (8). While some of this is due to residential selection effects, it is thought that the quality of the physical and social environment is important, including access to services and assets that are more conducive to healthy lifestyles.
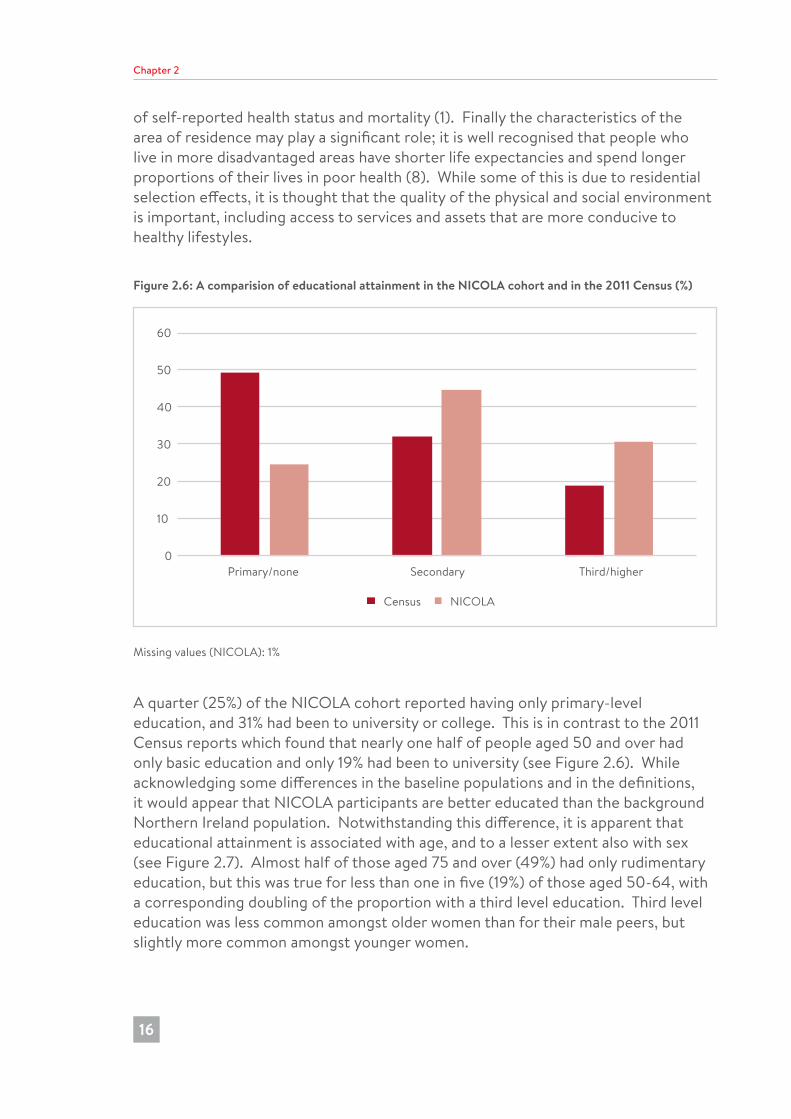
Figure 2.6: A comparision of educational attainment in the NICOLA cohort and in the 2011 Census (%)
0
10
20
30
40
50
60
Primary/none Secondary Third/higher
Census NICOLA
Missing values (NICOLA): 1%
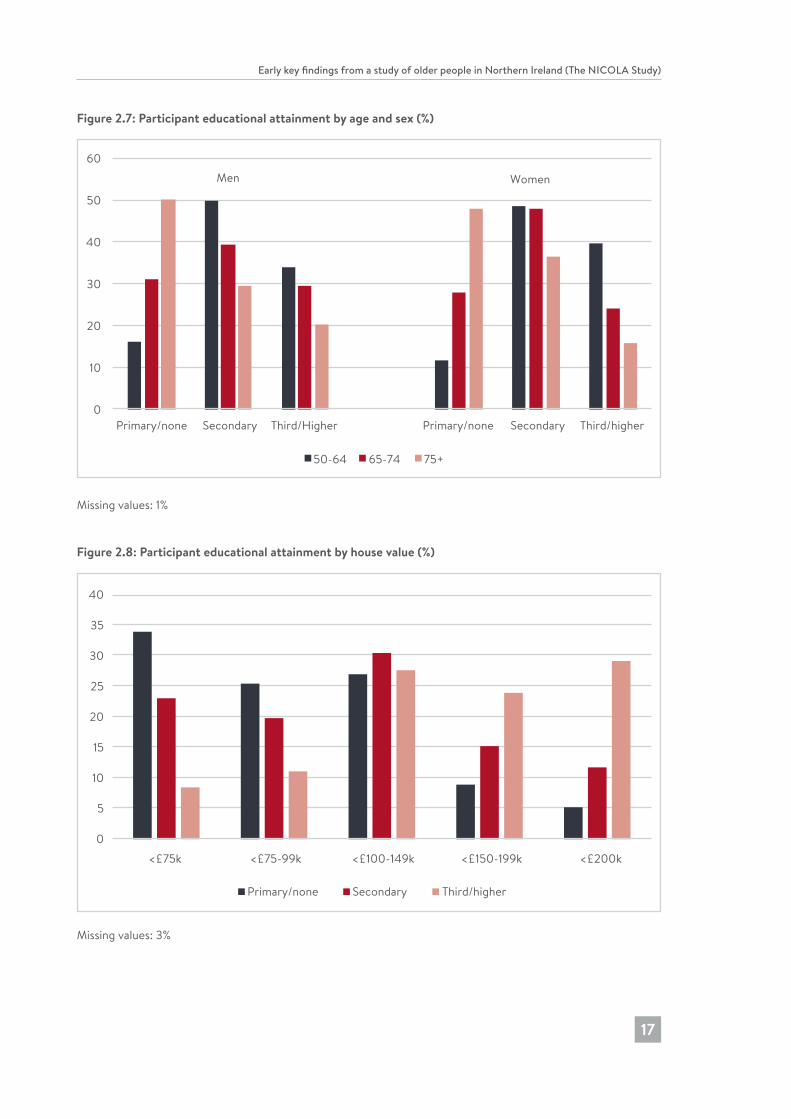
A quarter (25%) of the NICOLA cohort reported having only primary-level education, and 31% had been to university or college. This is in contrast to the 2011 Census reports which found that nearly one half of people aged 50 and over had only basic education and only 19% had been to university (see Figure 2.6). While acknowledging some differences in the baseline populations and in the definitions, it would appear that NICOLA participants are better educated than the background Northern Ireland population. Notwithstanding this difference, it is apparent that educational attainment is associated with age, and to a lesser extent also with sex (see Figure 2.7). Almost half of those aged 75 and over (49%) had only rudimentary education, but this was true for less than one in five (19%) of those aged 50-64, with a corresponding doubling of the proportion with a third level education. Third level education was less common amongst older women than for their male peers, but slightly more common amongst younger women.
182726 Nicola Study report__Wave__2.indb 16 20/11/2017 10:23
Early key findings from a study of older people in Northern Ireland (The NICOLA Study)
17
Figure 2.7: Participant educational attainment by age and sex (%)
0
10
20
30
40
50
60
Primary/none Secondary Third/Higher Primary/none Secondary Third/higher
50-64 65-74 75+
Men Women
Missing values: 1%
Figure 2.8: Participant educational attainment by house value (%)
0
5
10
15
20
25
30
35
40
<£75k <£75-99k <£100-149k <£200k<£150-199k
Primary/none Secondary Third/higher
Missing values: 3%
182726 Nicola Study report__Wave__2.indb 17 20/11/2017 10:23
Chapter 2
18
Educational attainment is strongly associated with area of residence, and also the value of the house in which the cohort member lives. About a quarter of those with primary level education (26%) live in the most deprived fifth of areas in Northern Ireland, and only 12% live in the most affluent areas. The pattern for those with third-level education is almost the reverse: over one third (35%) live in the most affluent areas, and 11% live in the more disadvantaged areas. The relationship between education and house value is even more stark (see Figure 2.8): the majority (59%) of people with primary-level education live in houses valued at less than £100,000 while 53% of those with third-level education live in houses valued at £200,000 or more.
References1. Connolly S, O’Reilly D, Rosato M. House value as an indicator of cumulative
wealth is strongly related to morbidity and mortality risk in older people: a census-based cross-sectional and longitudinal study. Int J Epidemiol. 2010;39:383-91.
2. Northern Ireland Statistics and Research Agency. Report of the Inter-Departmental Urban-Rural Definition Group. Statistical classification and delineation of settlements. Belfast: NISRA; 2005.
3. Northern Ireland Statistics and Research Agency: Northern Ireland Multiple Deprivation Measure. Belfast: NISRA; 2010.
4. Manzoli L, Villari P, Pirone GM, Boccia A. Marital status and mortality in the elderly: a systematic review and meta-analysis. Soc Sci Med. 2007;64:77-94.
5. van Jaarsveld CH, Miles A, Edwards R, Wardle J. Marriage and cancer prevention: does marital status and inviting both spouses together influence colorectal cancer screening participation? J Med Screen. 2006;13:172-6.
6. Joshi PK, et al. Genome-wide meta-analysis associates HLA-DQA1/DRB1 and LPA and lifestyle factors with human longevity. Nat Commun. 2017;doi:10.1038/s41467-017-00934-5
7. Grundy E, Holt G. The socioeconomic status of older adults: how should we measure it in studies of health inequalities? J Epidemiol Community Health. 2001;55:895-904.
8. Office for National Statistics. Inequality in healthy life expectancy at birth by national deciles of area deprivation: England (2009-11).
182726 Nicola Study report__Wave__2.indb 18 20/11/2017 10:23
Early key findings from a study of older people in Northern Ireland (The NICOLA Study)
19
3 Labour market participation of older people in Northern Ireland
Anne Devlin and Declan FrenchKey findings
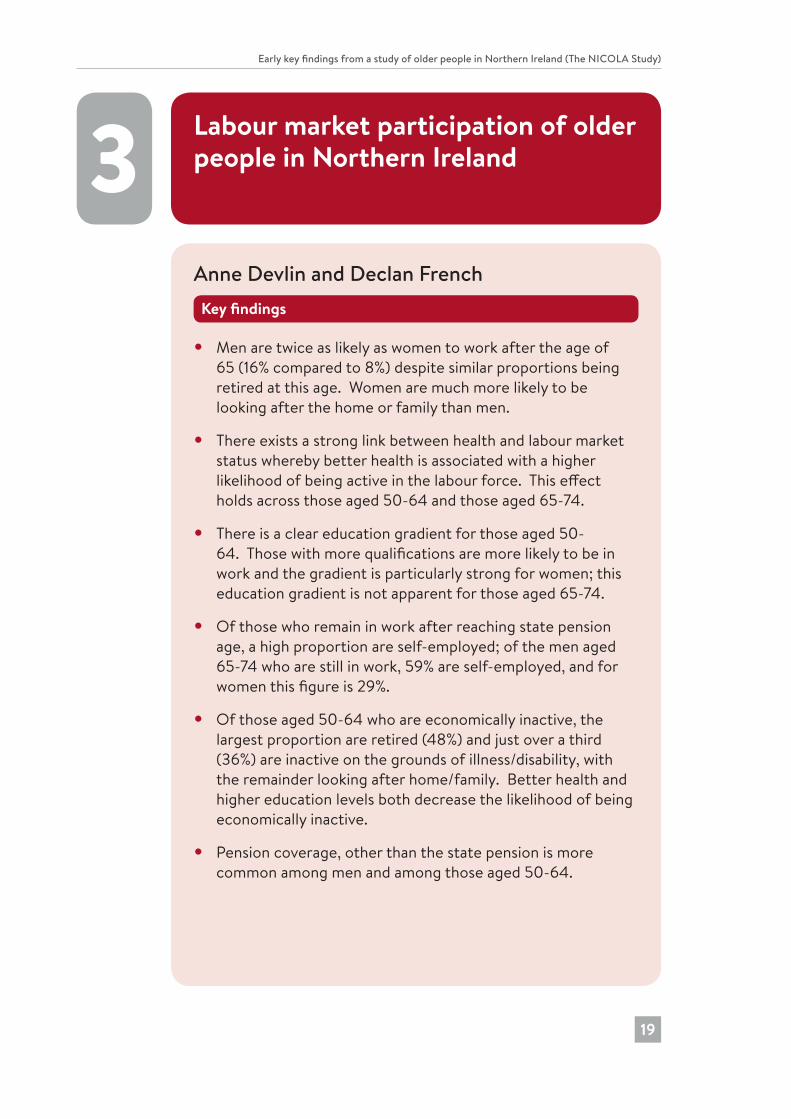
• Men are twice as likely as women to work after the age of 65 (16% compared to 8%) despite similar proportions being retired at this age. Women are much more likely to be looking after the home or family than men.
• There exists a strong link between health and labour market status whereby better health is associated with a higher likelihood of being active in the labour force. This effect holds across those aged 50-64 and those aged 65-74.
• There is a clear education gradient for those aged 50-64. Those with more qualifications are more likely to be in work and the gradient is particularly strong for women; this education gradient is not apparent for those aged 65-74.
• Of those who remain in work after reaching state pension age, a high proportion are self-employed; of the men aged 65-74 who are still in work, 59% are self-employed, and for women this figure is 29%.
• Of those aged 50-64 who are economically inactive, the largest proportion are retired (48%) and just over a third (36%) are inactive on the grounds of illness/disability, with the remainder looking after home/family. Better health and higher education levels both decrease the likelihood of being economically inactive.
• Pension coverage, other than the state pension is more common among men and among those aged 50-64.
182726 Nicola Study report__Wave__2.indb 19 20/11/2017 10:23

Chapter 3
20
IntroductionThis chapter will focus on the labour market status of older people in Northern Ireland and their planning for retirement. The labour market participation of older people is of increasing social and political importance in Northern Ireland as in the rest of the UK. Increasing life expectancy and falling birth rates in the UK are creating an older population with a diminishing proportion active in the labour force.
This demographic transition will have consequences for individual lifecycle planning and the economy more widely. Individuals will need to work longer and save more for retirement; taxes may have to rise to pay for greater healthcare costs and there may be less entrepreneurial or innovative activity (1).
The policy responses available to government are to increase taxation, to reduce welfare payments, to improve health, to improve public sector productivity or to increase employment (2). Enforced retirement at age 65 was abolished in 2011 and the state pension age will increase to 67 for men and women between 2016 and 2018 (3,4). Occupational pension coverage has been widened by the introduction of auto-enrolment, and transferring pensions when changing jobs has become easier (5).
UK employment among older adults has been increasing among both men and women. The English Longitudinal Study of Ageing (ELSA) has found that over time people are more likely to be working into their 50s and 60s, and younger groups of individuals expect to be working longer. Also, between 2002/03 and 2014/15, the proportion of men working in the five years after reaching state pension age nearly doubled while the equivalent proportion of women increased by 50% (6,7).
This chapter will examine the labour force participation of older adults in Northern Ireland, with a particular emphasis on those between the ages of 50 and 64 and between the ages of 65 and 74. We will explore the impact of health, sex and education level on labour force participation.
OverviewNorthern Ireland has the second lowest employment rate of older adults in the UK (8). Just over one third of those in Northern Ireland over the age of 50 are in work whether that is employed or self-employed. Labour market participation among older people is determined by a complex and multidimensional set of factors, including but not limited to: health, education, employment history, wealth, pension coverage and family commitments.
Participants in NICOLA are asked what best describes their current situation: retired, employed, self-employed, unemployed, permanently sick/disabled, looking after home/family, in education or training and other. In Table A3.1, we list the employed and the self-employed as ‘at work’. The column labelled ‘other’ includes those who are in education/training and those who are permanently sick/disabled. Those who
182726 Nicola Study report__Wave__2.indb 20 20/11/2017 10:23
Early key findings from a study of older people in Northern Ireland (The NICOLA Study)
21
answered ‘don’t know’, something other than the categories mentioned, or refused this question (2% of the sample) are not included in Table A3.1.
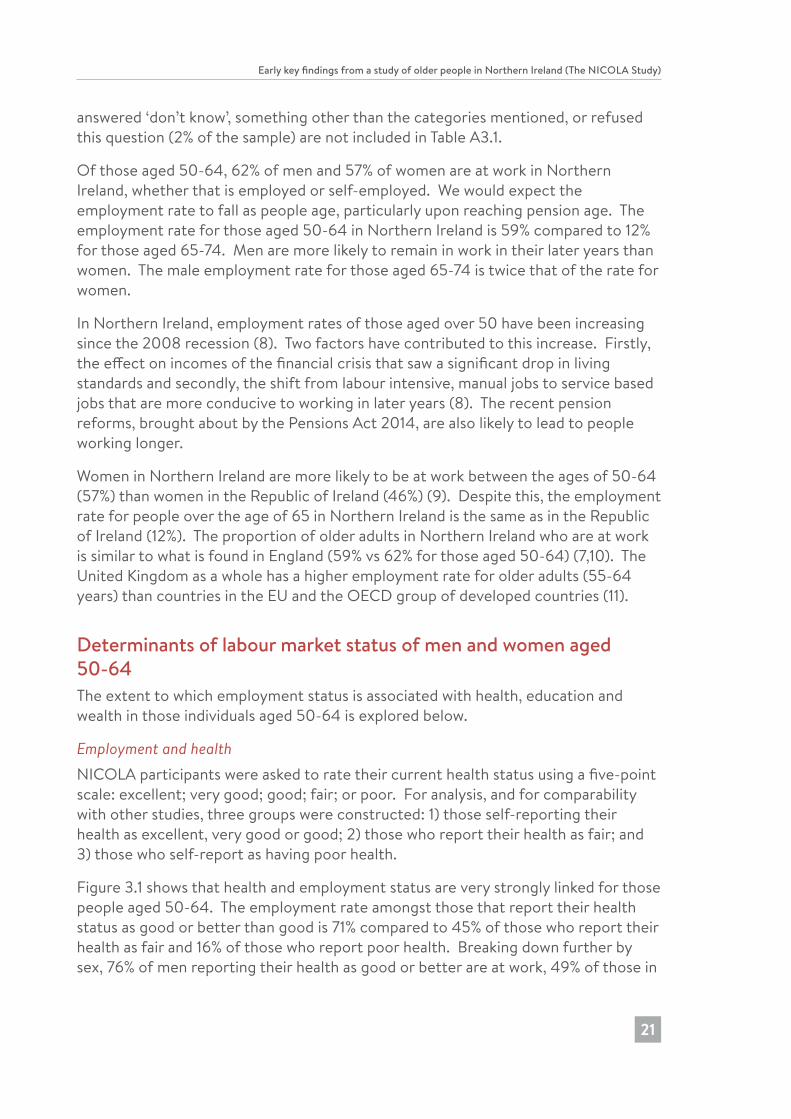
Of those aged 50-64, 62% of men and 57% of women are at work in Northern Ireland, whether that is employed or self-employed. We would expect the employment rate to fall as people age, particularly upon reaching pension age. The employment rate for those aged 50-64 in Northern Ireland is 59% compared to 12% for those aged 65-74. Men are more likely to remain in work in their later years than women. The male employment rate for those aged 65-74 is twice that of the rate for women.
In Northern Ireland, employment rates of those aged over 50 have been increasing since the 2008 recession (8). Two factors have contributed to this increase. Firstly, the effect on incomes of the financial crisis that saw a significant drop in living standards and secondly, the shift from labour intensive, manual jobs to service based jobs that are more conducive to working in later years (8). The recent pension reforms, brought about by the Pensions Act 2014, are also likely to lead to people working longer.
Women in Northern Ireland are more likely to be at work between the ages of 50-64 (57%) than women in the Republic of Ireland (46%) (9). Despite this, the employment rate for people over the age of 65 in Northern Ireland is the same as in the Republic of Ireland (12%). The proportion of older adults in Northern Ireland who are at work is similar to what is found in England (59% vs 62% for those aged 50-64) (7,10). The United Kingdom as a whole has a higher employment rate for older adults (55-64 years) than countries in the EU and the OECD group of developed countries (11).
Determinants of labour market status of men and women aged 50-64The extent to which employment status is associated with health, education and wealth in those individuals aged 50-64 is explored below.
Employment and healthNICOLA participants were asked to rate their current health status using a five-point scale: excellent; very good; good; fair; or poor. For analysis, and for comparability with other studies, three groups were constructed: 1) those self-reporting their health as excellent, very good or good; 2) those who report their health as fair; and 3) those who self-report as having poor health.
Figure 3.1 shows that health and employment status are very strongly linked for those people aged 50-64. The employment rate amongst those that report their health status as good or better than good is 71% compared to 45% of those who report their health as fair and 16% of those who report poor health. Breaking down further by sex, 76% of men reporting their health as good or better are at work, 49% of those in
182726 Nicola Study report__Wave__2.indb 21 20/11/2017 10:23
Chapter 3
22
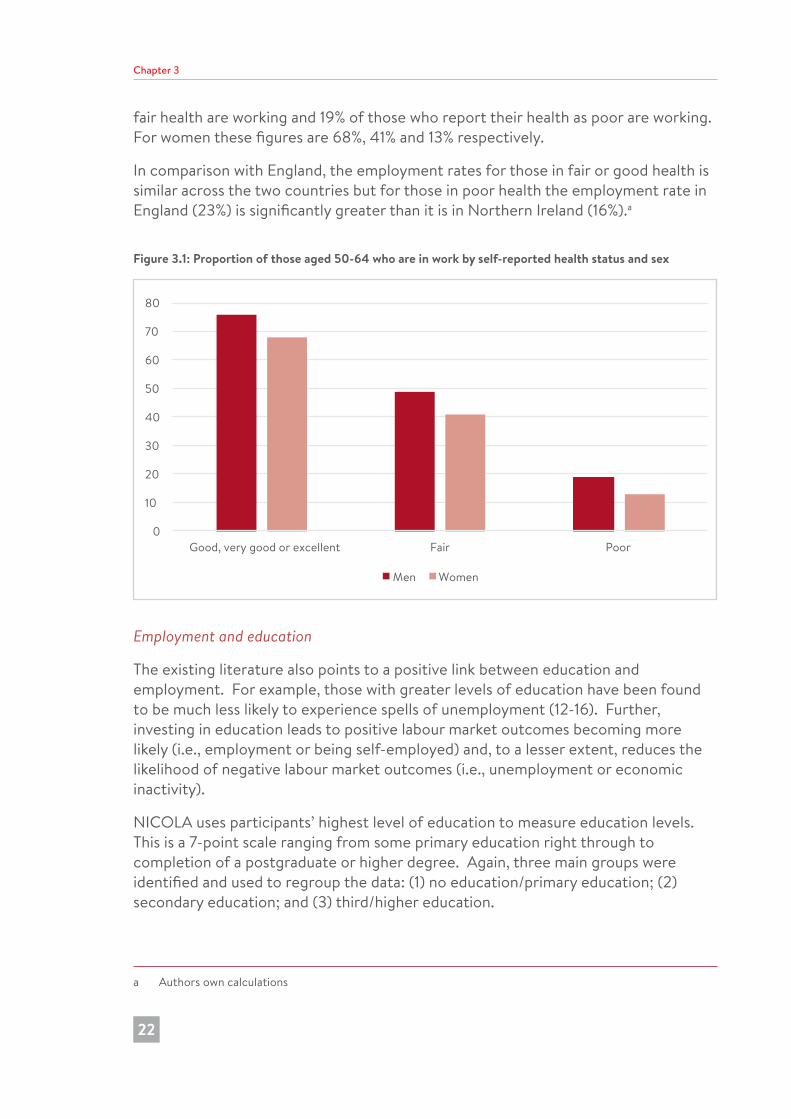
fair health are working and 19% of those who report their health as poor are working. For women these figures are 68%, 41% and 13% respectively.
In comparison with England, the employment rates for those in fair or good health is similar across the two countries but for those in poor health the employment rate in England (23%) is significantly greater than it is in Northern Ireland (16%).a
Figure 3.1: Proportion of those aged 50-64 who are in work by self-reported health status and sex
0
10
20
30
40
50
60
70
80
Good, very good or excellent Fair Poor
Men Women
Employment and education
The existing literature also points to a positive link between education and employment. For example, those with greater levels of education have been found to be much less likely to experience spells of unemployment (12-16). Further, investing in education leads to positive labour market outcomes becoming more likely (i.e., employment or being self-employed) and, to a lesser extent, reduces the likelihood of negative labour market outcomes (i.e., unemployment or economic inactivity).
NICOLA uses participants’ highest level of education to measure education levels. This is a 7-point scale ranging from some primary education right through to completion of a postgraduate or higher degree. Again, three main groups were identified and used to regroup the data: (1) no education/primary education; (2) secondary education; and (3) third/higher education.
a Authors own calculations
182726 Nicola Study report__Wave__2.indb 22 20/11/2017 10:23
Early key findings from a study of older people in Northern Ireland (The NICOLA Study)
23
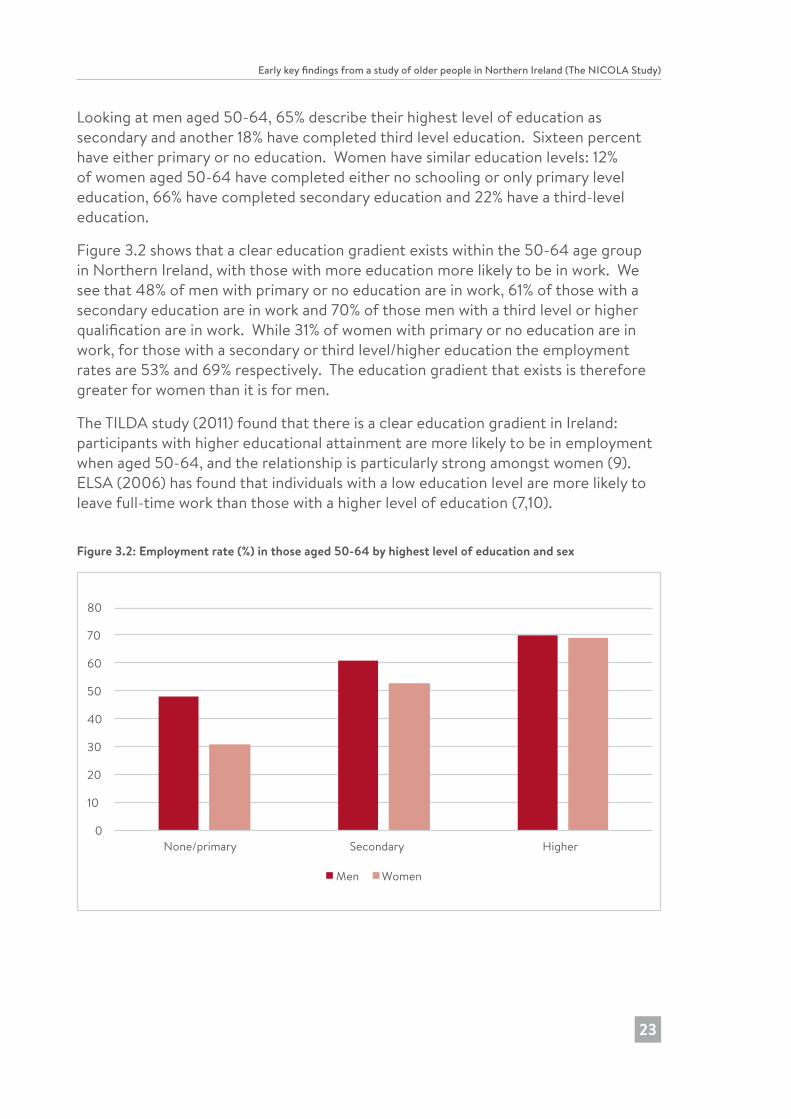
Looking at men aged 50-64, 65% describe their highest level of education as secondary and another 18% have completed third level education. Sixteen percent have either primary or no education. Women have similar education levels: 12% of women aged 50-64 have completed either no schooling or only primary level education, 66% have completed secondary education and 22% have a third-level education.
Figure 3.2 shows that a clear education gradient exists within the 50-64 age group in Northern Ireland, with those with more education more likely to be in work. We see that 48% of men with primary or no education are in work, 61% of those with a secondary education are in work and 70% of those men with a third level or higher qualification are in work. While 31% of women with primary or no education are in work, for those with a secondary or third level/higher education the employment rates are 53% and 69% respectively. The education gradient that exists is therefore greater for women than it is for men.
The TILDA study (2011) found that there is a clear education gradient in Ireland: participants with higher educational attainment are more likely to be in employment when aged 50-64, and the relationship is particularly strong amongst women (9). ELSA (2006) has found that individuals with a low education level are more likely to leave full-time work than those with a higher level of education (7,10).
Figure 3.2: Employment rate (%) in those aged 50-64 by highest level of education and sex
0
10
20
30
40
50
60
70
80
None/primary Secondary Higher
Men Women
182726 Nicola Study report__Wave__2.indb 23 20/11/2017 10:23
Chapter 3
24
Labour market status of those aged 65-74This section explores the labour market status of men and women aged 65-74. This age group were beyond the state pension age, with much greater numbers in retirement. However, some remain in the workforce. Over four-fifths of men aged 65-74 are retired (82%), with 16% remaining in work while for women these figures are 81% and 8%, respectively, with 6% looking after home or family. Of those men at work in this age bracket, 59% are self-employed (29% for women).
Like those under the state pension age, the link between health and employment is still apparent in this older group. Of men aged 65-74 who report their health as good or better than good, 22% are at work compared to 4% of those who report their health as poor. For women, 12% of those in good or better than good health and 1% of those in poor health are working.
In the 65-74 age group, we can see significant differences in education level among participants: nearly twice as many men report their highest education level as none or primary compared to the 50-64 age group, and women aged 65-74 are half as likely as those below state pension age to have received a third level education.
Amongst those aged 65-74, 17% of men who received at most a primary education are in employment; 17% of those with a secondary level education are in work and 15% those with a higher level education are at work (Figure 3.3). For women, these figures are 6%, 10% and 9% respectively. The same education gradient does not hold here as it does for those aged 50-64. It is possible that those with a higher education level retire earlier than others as they have had better incomes over their working lives and have better pension provision.
182726 Nicola Study report__Wave__2.indb 24 20/11/2017 10:23
Early key findings from a study of older people in Northern Ireland (The NICOLA Study)
25
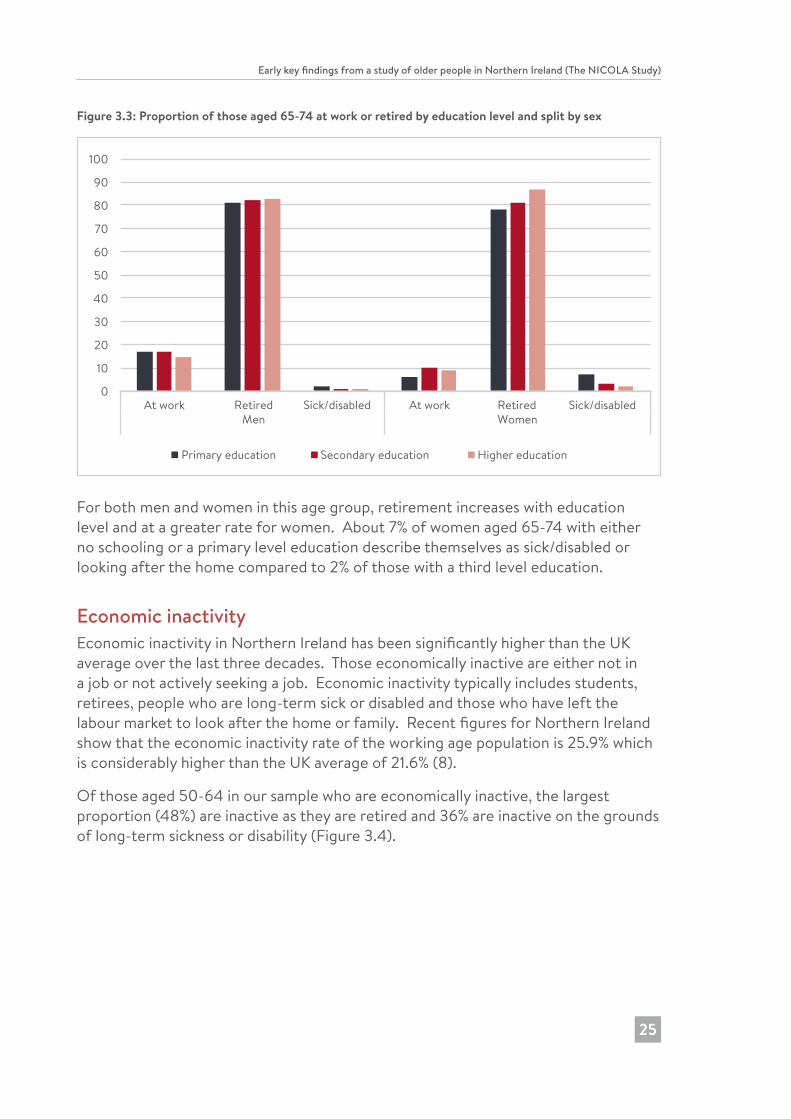
Figure 3.3: Proportion of those aged 65-74 at work or retired by education level and split by sex
0
10
20
30
40
50
60
70
80
90
100
At work RetiredMen
Sick/disabled At work RetiredWomen
Sick/disabled
Primary education Secondary education Higher education
For both men and women in this age group, retirement increases with education level and at a greater rate for women. About 7% of women aged 65-74 with either no schooling or a primary level education describe themselves as sick/disabled or looking after the home compared to 2% of those with a third level education.
Economic inactivityEconomic inactivity in Northern Ireland has been significantly higher than the UK average over the last three decades. Those economically inactive are either not in a job or not actively seeking a job. Economic inactivity typically includes students, retirees, people who are long-term sick or disabled and those who have left the labour market to look after the home or family. Recent figures for Northern Ireland show that the economic inactivity rate of the working age population is 25.9% which is considerably higher than the UK average of 21.6% (8).
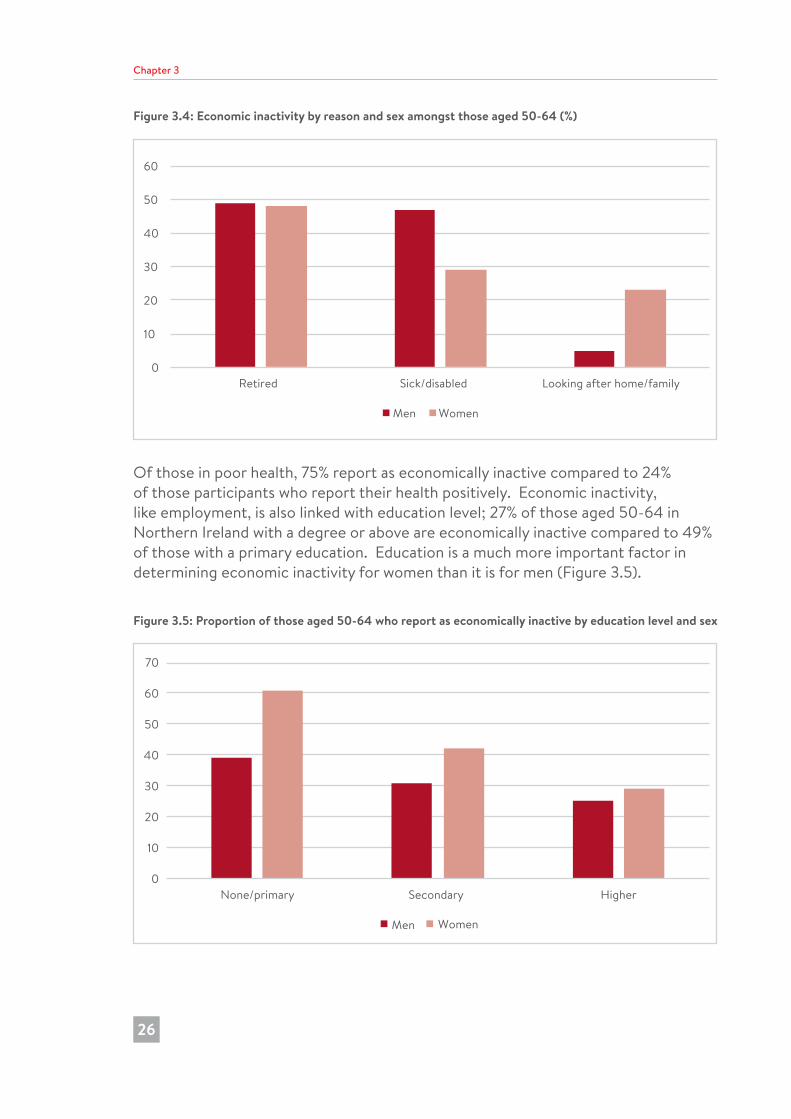
Of those aged 50-64 in our sample who are economically inactive, the largest proportion (48%) are inactive as they are retired and 36% are inactive on the grounds of long-term sickness or disability (Figure 3.4).
182726 Nicola Study report__Wave__2.indb 25 20/11/2017 10:23
Chapter 3
26
Figure 3.4: Economic inactivity by reason and sex amongst those aged 50-64 (%)
0
10
20
30
40
50
60
Retired Sick/disabled Looking after home/family
Men Women
Of those in poor health, 75% report as economically inactive compared to 24% of those participants who report their health positively. Economic inactivity, like employment, is also linked with education level; 27% of those aged 50-64 in Northern Ireland with a degree or above are economically inactive compared to 49% of those with a primary education. Education is a much more important factor in determining economic inactivity for women than it is for men (Figure 3.5).
Figure 3.5: Proportion of those aged 50-64 who report as economically inactive by education level and sex
0
10
20
30
40
50
60
70
None/primary Secondary Higher
Men Women
182726 Nicola Study report__Wave__2.indb 26 20/11/2017 10:23
Early key findings from a study of older people in Northern Ireland (The NICOLA Study)
27
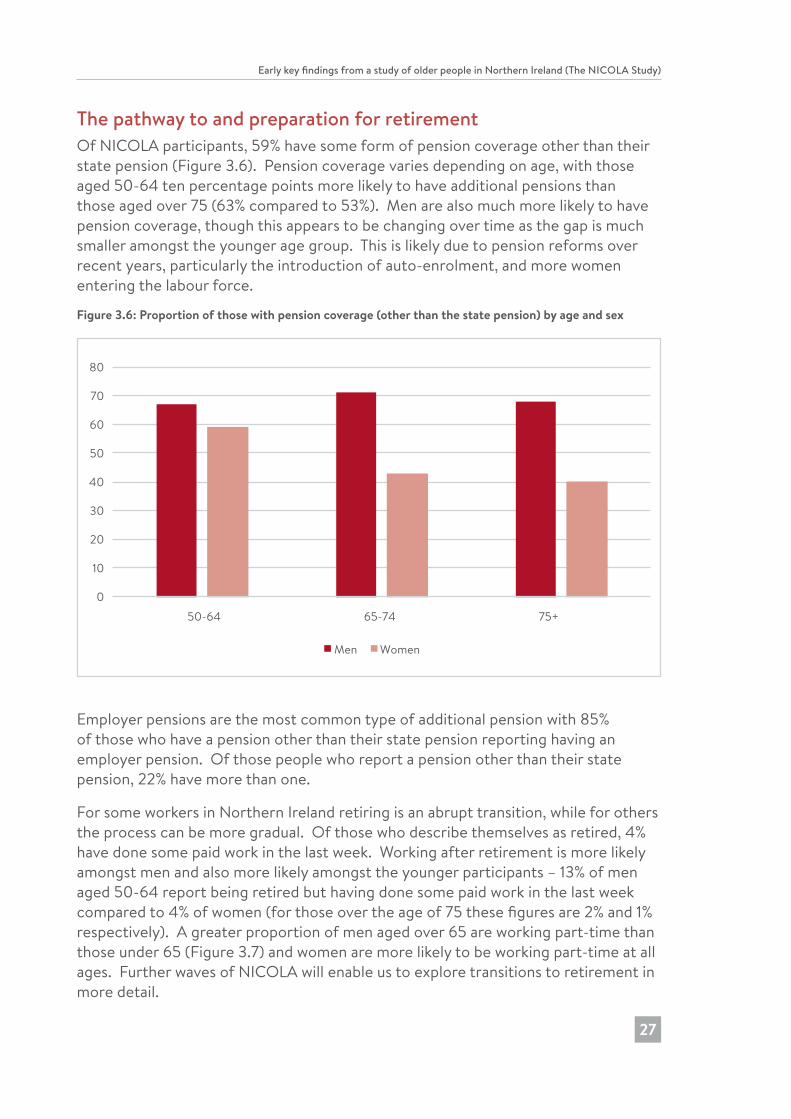
The pathway to and preparation for retirementOf NICOLA participants, 59% have some form of pension coverage other than their state pension (Figure 3.6). Pension coverage varies depending on age, with those aged 50-64 ten percentage points more likely to have additional pensions than those aged over 75 (63% compared to 53%). Men are also much more likely to have pension coverage, though this appears to be changing over time as the gap is much smaller amongst the younger age group. This is likely due to pension reforms over recent years, particularly the introduction of auto-enrolment, and more women entering the labour force.
Figure 3.6: Proportion of those with pension coverage (other than the state pension) by age and sex
0
10
20
30
40
50
60
70
80
50-64 65-74 75+
Men Women
Employer pensions are the most common type of additional pension with 85% of those who have a pension other than their state pension reporting having an employer pension. Of those people who report a pension other than their state pension, 22% have more than one.
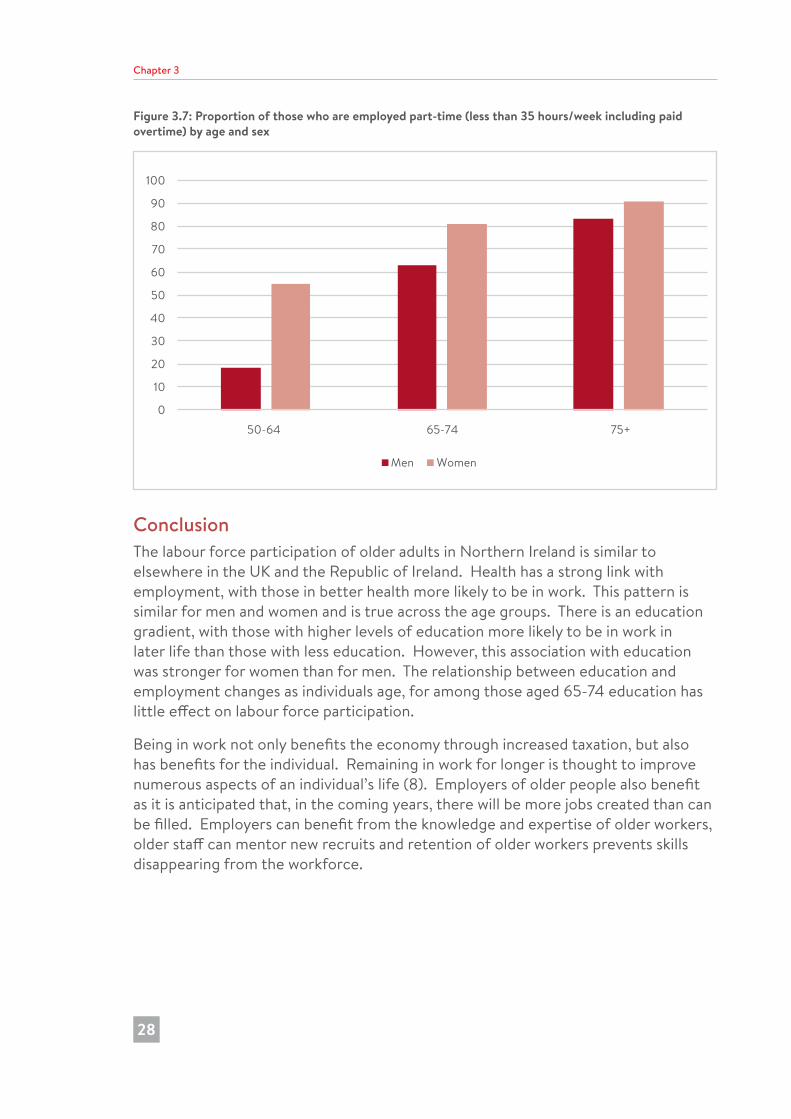
For some workers in Northern Ireland retiring is an abrupt transition, while for others the process can be more gradual. Of those who describe themselves as retired, 4% have done some paid work in the last week. Working after retirement is more likely amongst men and also more likely amongst the younger participants – 13% of men aged 50-64 report being retired but having done some paid work in the last week compared to 4% of women (for those over the age of 75 these figures are 2% and 1% respectively). A greater proportion of men aged over 65 are working part-time than those under 65 (Figure 3.7) and women are more likely to be working part-time at all ages. Further waves of NICOLA will enable us to explore transitions to retirement in more detail.
182726 Nicola Study report__Wave__2.indb 27 20/11/2017 10:23
Chapter 3
28
Figure 3.7: Proportion of those who are employed part-time (less than 35 hours/week including paid overtime) by age and sex
0
10
20
30
40
50
60
70
80
90
100
50-64 65-74 75+
Men Women
ConclusionThe labour force participation of older adults in Northern Ireland is similar to elsewhere in the UK and the Republic of Ireland. Health has a strong link with employment, with those in better health more likely to be in work. This pattern is similar for men and women and is true across the age groups. There is an education gradient, with those with higher levels of education more likely to be in work in later life than those with less education. However, this association with education was stronger for women than for men. The relationship between education and employment changes as individuals age, for among those aged 65-74 education has little effect on labour force participation.
Being in work not only benefits the economy through increased taxation, but also has benefits for the individual. Remaining in work for longer is thought to improve numerous aspects of an individual’s life (8). Employers of older people also benefit as it is anticipated that, in the coming years, there will be more jobs created than can be filled. Employers can benefit from the knowledge and expertise of older workers, older staff can mentor new recruits and retention of older workers prevents skills disappearing from the workforce.
182726 Nicola Study report__Wave__2.indb 28 20/11/2017 10:23
Early key findings from a study of older people in Northern Ireland (The NICOLA Study)
29
References1. ONS. Older workers in the labour market, 2012 [online document]. Office
of National Statistics; 2012 [cited 2/11/17]. Available from: http://webarchive. nationalarchives.gov.uk/20160105160709/http://www.ons.gov.uk/ons/ dcp171776_267809.pdf
2. UK Parliament. Political challenges relating to an aging population: key issues for the 2015 Parliament [online document]. House of Commons Library; 2015 [cited 2/11/17]. Available from: https://www.parliament.uk/business/publications/ research/key-issues-parliament-2015/social-change/ageing-population/
3. Department of Work and Pensions (DWP) Pensions Act 2014 [webpage]. DWP; 2013 [updated May 2014] [cited 10/9/17]. Available from: https://www.gov.uk/ government/collections/pensions-bill
4. Thurley, D. State pension reform [online document]. House of Commons Library; 2013 [cited 15/10/17]. Available from: http://researchbriefings.parliament.uk/ ResearchBriefing/Summary/SN05787
5. Department for Business, Innovation and Skills (DBIS). Default retirement age to end this year [webpage]. DBIS; 2011 [cited 20/10/17]. Available from: https://www. gov.uk/government/news/default-retirement-age-to-end-this-year
6. Department of Work and Pensions (DWP), Webb S. Older People’s Day: 1 million in work over 65: 3 years since end of default retirement age [webpage]. DWP; 2014 [cited 20/10/17]. Available from: https://www.gov.uk/government/news/ older-peoples-day-1-million-in-work-over-65-3-years-since-end-of-default-retirement-age
7. Banks J, Batty GD, Begum N, Demakakos P, de Oliveira C, Head J, et al. The dynamics of ageing: evidence from the English Longitudinal Study of Ageing 2002-15 [online document]. ELSA; 2016 [cited 25/10/17]. Available from: https:// www.ifs.org.uk/uploads/elsa/docs_w7/ELSA%20Wave%207%20report.pdf
8. Northern Ireland Statistics and Research Agency (NISRA). Northern Ireland Labour Market Report February 2017 [online document]. NISRA; 2017 [cited 1/10/17]. Available from: https://www.economy-ni.gov.uk/sites/default/files/ publications/economy/labour-market-report-february-2017.PDF
9. Mosca I, Barrett A. Retirement and labour market participation. In: Barrett A, Savva G, Timonen, V, Kenny RA, editors. Fifty plus in Ireland: first results from the Irish Longitudinal Study on Ageing (TILDA). Dublin: Trinity College Dublin; 2011. p. 219-42. [online document]. TILDA; 2011 [cited 01/11/17]. Available from: http:// tilda.tcd.ie/publications/reports/
182726 Nicola Study report__Wave__2.indb 29 20/11/2017 10:23
Chapter 3
30
10. Banks J, Tetlow G. Extending working lives - living in the 21st century: older people in England. The 2006 English Longitudinal Study of Ageing (Wave 3) [online document]. ELSA; 2008 [cited 1/11/17] Available from: http://www.elsa-project.ac.uk/reportWave3
11. Waddell G, Burton AK. Is work good for your health and well-being? [online document] DWP; 2006 [cited 20/10/17]. Available from: https://www.gov.uk/ government/publications/is-work-good-for-your-health-and-well-being
12. Bowen WG, Finegan TA. The economics of labor force participation. USA: Princeton University Press; 1969.
13. Jaumotte F. Female labour force participation: past trends and main determinants in OECD countries. OECD; 2013 [cited 25/10/17]. Available online from: https:// papers.ssrn.com/sol3/papers.cfm?abstract_id=2344556
14. Cai L. The relationship between health and labour force participation: evidence from a panel data simultaneous equation model. Labour Econ. 2010;17(1):77-90.
15. Chirikos TN. The relationship between health and labour market status. Annu Rev Public Health. 1993;14:293-312.
16. Nickell S. Education and lifetime patterns of unemployment. J Polit Econ. 1979; 87(5):117-31.
182726 Nicola Study report__Wave__2.indb 30 20/11/2017 10:23
Early key findings from a study of older people in Northern Ireland (The NICOLA Study)
31
17. Appendix 3.1
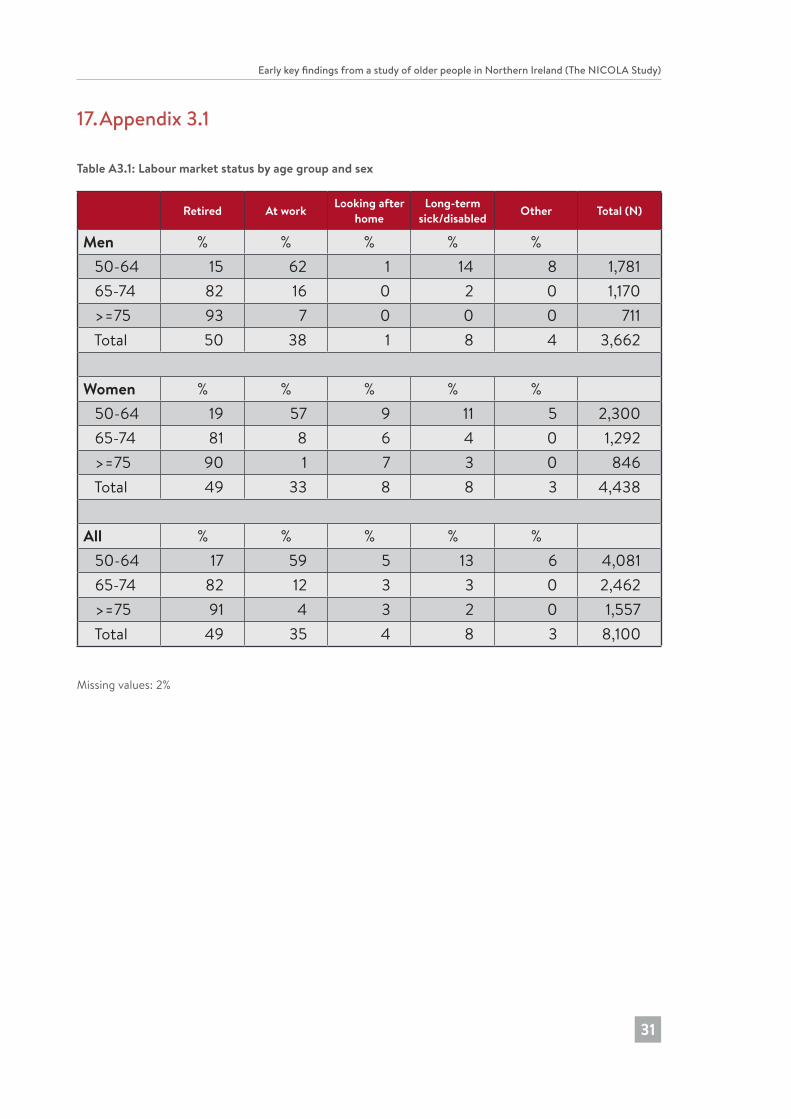
Table A3.1: Labour market status by age group and sex
Retired At work Looking after home
Long-term sick/disabled Other Total (N)
Men % % % % % 50-64 15 62 1 14 8 1,781 65-74 82 16 0 2 0 1,170 >=75 93 7 0 0 0 711 Total 50 38 1 8 4 3,662
Women % % % % % 50-64 19 57 9 11 5 2,300 65-74 81 8 6 4 0 1,292 >=75 90 1 7 3 0 846 Total 49 33 8 8 3 4,438
All % % % % % 50-64 17 59 5 13 6 4,081 65-74 82 12 3 3 0 2,462 >=75 91 4 3 2 0 1,557 Total 49 35 4 8 3 8,100
Missing values: 2%
182726 Nicola Study report__Wave__2.indb 31 20/11/2017 10:23
4 Social connectedness: Older people as members of their families and communities
Chapter 4
32
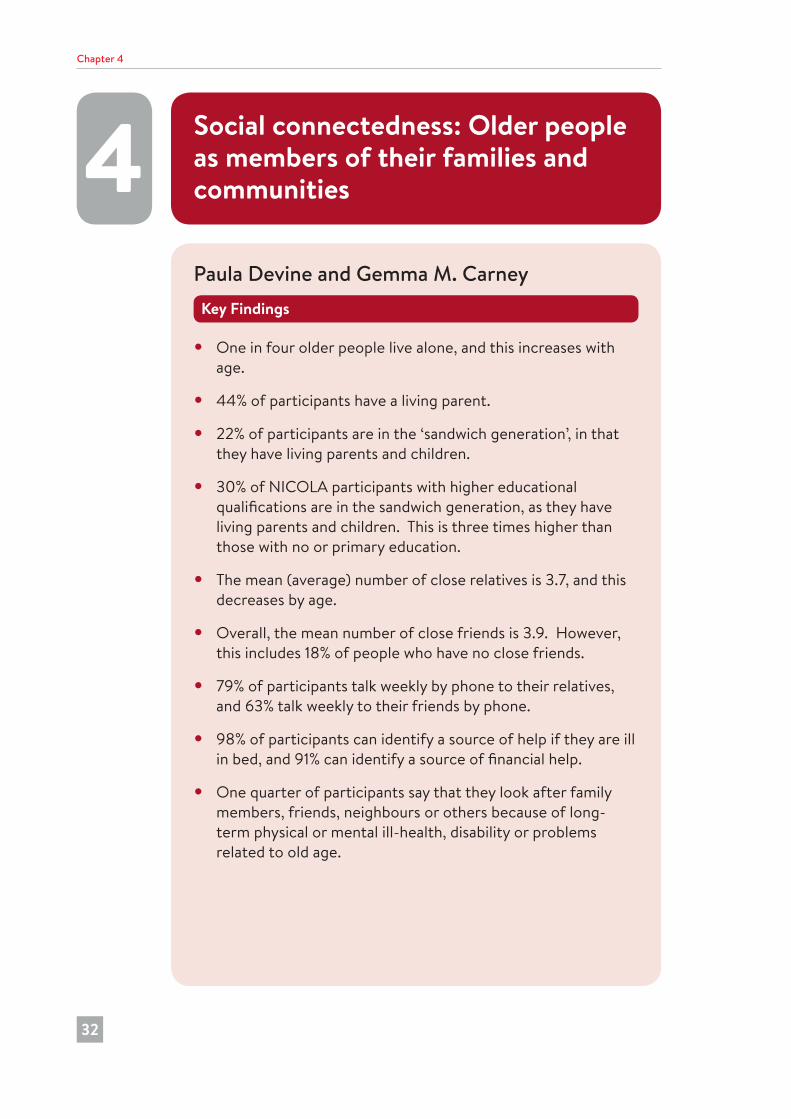
Paula Devine and Gemma M. CarneyKey Findings
• One in four older people live alone, and this increases with age.
• 44% of participants have a living parent.
• 22% of participants are in the ‘sandwich generation’, in that they have living parents and children.
• 30% of NICOLA participants with higher educational qualifications are in the sandwich generation, as they have living parents and children. This is three times higher than those with no or primary education.
• The mean (average) number of close relatives is 3.7, and this decreases by age.
• Overall, the mean number of close friends is 3.9. However, this includes 18% of people who have no close friends.
• 79% of participants talk weekly by phone to their relatives, and 63% talk weekly to their friends by phone.
• 98% of participants can identify a source of help if they are ill in bed, and 91% can identify a source of financial help.
• One quarter of participants say that they look after family members, friends, neighbours or others because of long-term physical or mental ill-health, disability or problems related to old age.
182726 Nicola Study report__Wave__2.indb 32 20/11/2017 10:23

Early key findings from a study of older people in Northern Ireland (The Nicola Study)
33
IntroductionThis chapter explores the social connectedness of older people living in Northern Ireland with regard to their relationships with family, friends and the wider community. Research on social connectedness has evolved away from a naïve embrace of ‘social capital’ typified by the work of Putnam (1), towards a more nuanced understanding of how divisions and inequalities contour social relationships and how efforts to increase social connectedness might be affected by society’s ageing (2,3). Related to this is the diversity that exists within the older population. This diversity leads us to expect a wide range of social relationships and forms of social engagement amongst NICOLA participants from deep kin and family relations, to looser networks at the community level. What we do know is that perceived social connectedness is an important aspect of ageing well and avoiding loneliness (4,5). This suggests that understanding the barriers and opportunities that exist around making people feel socially connected in later life is important in maintaining healthy ageing at the societal level.
While aspects of Northern Irish life are unique, when it comes to demographic ageing, Northern Ireland follows European trends. In this chapter we will see that some of the major life events recognised as critical transition points in later life, such as the dying off of one’s ‘co-biographers’ (6), also apply to Northern Ireland. As Northern Ireland’s cultural values include high levels of religiosity, low divorce rates and a conservative reproductive regime, we would also expect to see large extended families with strong kinship ties.
In this chapter, we look at participants’ family structure (parents, children and other relatives), contact with relatives and friends, sources of support in times of need and experiences of providing care. In order to reflect the diversity of older people, we identify differences by a number of key demographic and socio-economic variables: relation to sex, age group, marital status, educational attainment, rurality and the level of deprivation in the areas where participants live. Results reported in this chapter are weighted to ensure that they are representative of the Northern Ireland population aged 50 years and over (weighting is based on age, sex and region; see also Chapters 2 and 9 for further details on weighting).
MeasuresParticipants were asked about how many of their children and how many other relatives they felt very close to; and how many close friends they have (‘close to’ / ‘close friends’ being defined as people the participant feels at ease with, can talk to about private matters, and can call on for help). They were also asked how often they were in contact with their children, other relatives, and close friends (excluding those they live with) (ranging from ‘every day’ to ‘almost never’) using different modes of personal contact (e.g., by phone, via social media, letters/notes, in person).
182726 Nicola Study report__Wave__2.indb 33 20/11/2017 10:23
Chapter 4
34
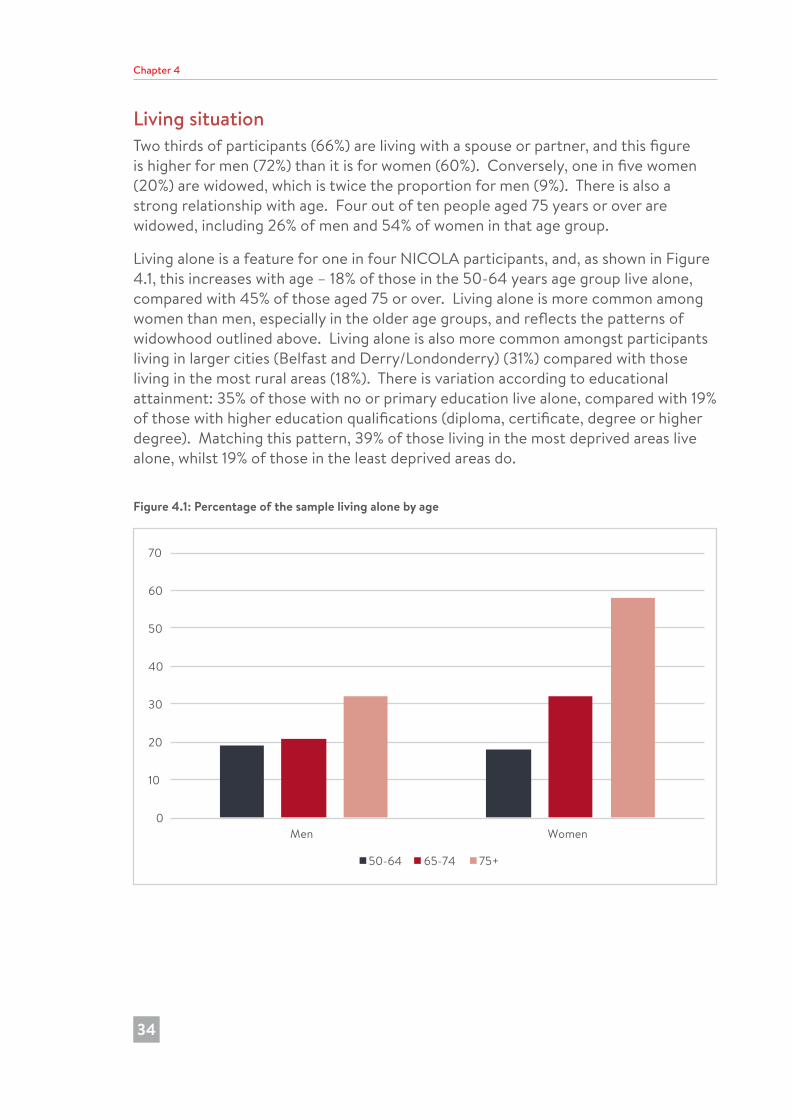
Living situation Two thirds of participants (66%) are living with a spouse or partner, and this figure is higher for men (72%) than it is for women (60%). Conversely, one in five women (20%) are widowed, which is twice the proportion for men (9%). There is also a strong relationship with age. Four out of ten people aged 75 years or over are widowed, including 26% of men and 54% of women in that age group.
Living alone is a feature for one in four NICOLA participants, and, as shown in Figure 4.1, this increases with age – 18% of those in the 50-64 years age group live alone, compared with 45% of those aged 75 or over. Living alone is more common among women than men, especially in the older age groups, and reflects the patterns of widowhood outlined above. Living alone is also more common amongst participants living in larger cities (Belfast and Derry/Londonderry) (31%) compared with those living in the most rural areas (18%). There is variation according to educational attainment: 35% of those with no or primary education live alone, compared with 19% of those with higher education qualifications (diploma, certificate, degree or higher degree). Matching this pattern, 39% of those living in the most deprived areas live alone, whilst 19% of those in the least deprived areas do.
Figure 4.1: Percentage of the sample living alone by age
0
10
20
30
40
50
60
70
Men Women
50-64 65-74 75+
182726 Nicola Study report__Wave__2.indb 34 20/11/2017 10:23
Early key findings from a study of older people in Northern Ireland (The Nicola Study)
35
Living parentsIncreasing life expectancy means that people are more likely to have a living parent for longer in their lives. Having a living parent may have implications for the provision of care, as many older people receive care from their adult children. At the same time, however, many older people are providing care for their adult children, including childcare for grandchildren (7). Patterns of care are explored later in this chapter.
Table A4.1 (see Appendix 4.1 at the end of this chapter) shows that most NICOLA participants (75%) have no living parents, whilst 6% have two living parents. As might be expected, there is a strong association with age: 43% of participants aged 50-64 have at least one living parent, compared with 8% of those aged 65-74 years, and only 1% of those in the oldest age group. Reflecting the differing life expectancy of men and women, twice as many participants have a living mother (22%) than have a living father (10%). Twenty percent of NICOLA participants have one living parent, with the proportion having only a mother alive being four times higher than those having only a father alive (16% and 4% respectively).
Compared with data from Wave 1 of TILDA (8), a higher proportion of men and women taking part in NICOLA have a surviving mother (35% and 39% respectively), compared with figures of 27% and 27% respectively among participants to Wave 1 of TILDA (8).
Life expectancy is also related to socio-economic background (9), and this is evident in the NICOLA data. Eighty-eight percent of those with no or primary school education have no parents alive, compared with 65% of those with higher education qualifications. At the same time, 2% of those with the least educational qualifications have two living parents, compared with 9% of those with highest educational qualifications. However, there is less variation among areas of different levels of deprivation.
Sandwich generationThe ‘sandwich generation’ is a term sometimes used to describe the middle generation – those people providing care for older relatives at the same time as bringing up children. It can also include those parents who are providing help for their adult children. Among NICOLA participants, 22% have both a living parent and living children, and so it is likely that they are providing assistance to both generations. At the same time, one in ten participants have no living parents or living children. As might be expected, there is variation by age, in that 38% of those aged 50-64 are in the sandwich generation, since they have both living parents and children, compared with only 1% of those aged 75 years or over. Reflecting higher life expectancy among people with higher educational qualifications, 30% of NICOLA participants with higher educational qualifications are in the sandwich generation – three times higher than those with no or primary education.
182726 Nicola Study report__Wave__2.indb 35 20/11/2017 10:23
Chapter 4
36
Family and friendsAs outlined previously, the vast majority (86%) of participants have living children (including step, foster and adoptive children). Whilst most participants have living children, they do not necessarily feel close to them, or have frequent contact with them. Eight percent of NICOLA participants indicate that they are not close to at least one of their children.
When asked about other relatives, most people (84%) have at least one relative that they feel close to. The mean (average) number of close relatives is 3.7, and this decreases by age, no doubt due in part to the death of those who constitute the ‘library of our lives’ (6).
Nearly one in five people (18%) say that they do not have any close friends. This is higher for men (22%) than women (16%), and for those in the oldest age group (27%) compared to 50-64 year olds (16%). The mean number of close friends is 3.9, which is slightly higher than the number of close relatives. Despite a higher proportion of men saying that they have no close friends, the mean number of close friends for men is 4.2, which is higher than the figure for women (3.7).
Participants with the highest qualifications have the highest mean number of close relatives (4.1), and also the highest mean number of close friends (4.6), compared with those with lower or no educational qualifications. Those living in the least deprived areas have a higher number of close friends (mean of 4.4) compared with those living in the most deprived areas (mean of 3.6).
Contact with relatives and friendsTwo thirds of parents (68%) say that they are in contact with their children every day (by phone, email, Skype, social media or post), and this is higher among the 50-64 years age group than it is among those aged 75 years or over (57%). Women are more likely than men to have daily contact with their children (73% and 62% respectively). Nevertheless, 1% of participants say that they are almost never in contact with their children.
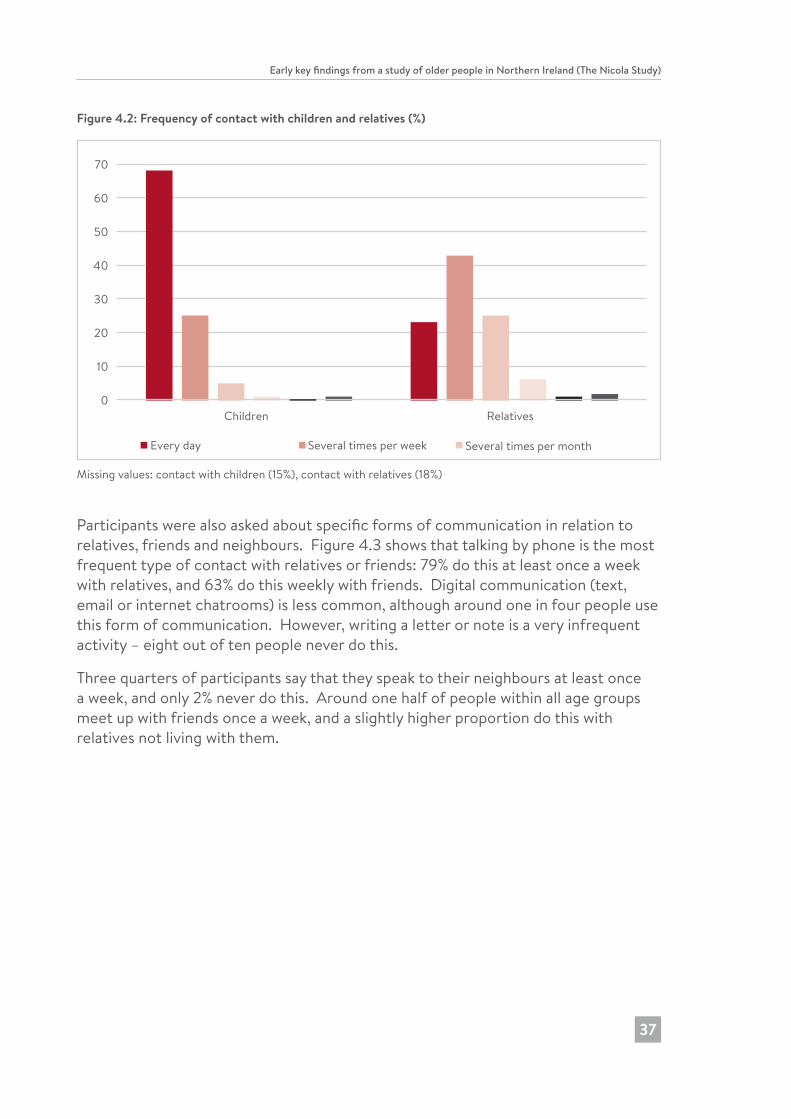
Figure 4.2 shows that contact with relatives is less frequent than with children. Nevertheless, 23% of participants have contact at least every day, and 43% report that they are in contact several times a week. Only 2% say that they are almost never in contact with their relatives. Men are in less frequent contact with relatives than women are: for example, 17% of men are in daily contact, compared with 28% of women. Those in older age groups are in less frequent contact with relatives. In particular, 14% of men aged 65-74 are in daily contact with relatives, compared with 32% of women aged 50-64.
182726 Nicola Study report__Wave__2.indb 36 20/11/2017 10:23
Early key findings from a study of older people in Northern Ireland (The Nicola Study)
37
Figure 4.2: Frequency of contact with children and relatives (%)
0
10
20
30
40
50
60
70
80
Children Relatives
Every day Several times per week Several times per month
Several times per year Once or twice per week Almost neverMissing values: contact with children (15%), contact with relatives (18%)
Participants were also asked about specific forms of communication in relation to relatives, friends and neighbours. Figure 4.3 shows that talking by phone is the most frequent type of contact with relatives or friends: 79% do this at least once a week with relatives, and 63% do this weekly with friends. Digital communication (text, email or internet chatrooms) is less common, although around one in four people use this form of communication. However, writing a letter or note is a very infrequent activity – eight out of ten people never do this.
Three quarters of participants say that they speak to their neighbours at least once a week, and only 2% never do this. Around one half of people within all age groups meet up with friends once a week, and a slightly higher proportion do this with relatives not living with them.
182726 Nicola Study report__Wave__2.indb 37 20/11/2017 10:23
Chapter 4
38
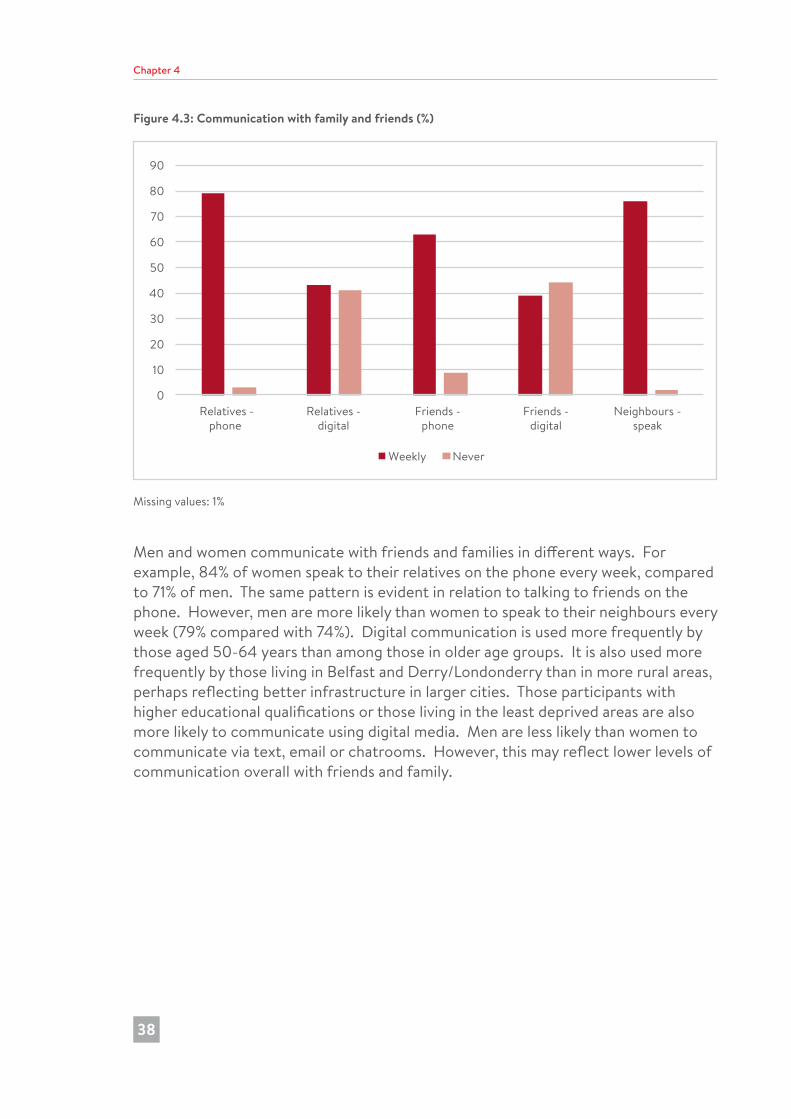
Figure 4.3: Communication with family and friends (%)
0
10
20
30
40
50
60
70
80
90
Relatives -phone
Relatives -digital
Friends -phone
Friends -digital
Neighbours -speak
Weekly Never
Missing values: 1%
Men and women communicate with friends and families in different ways. For example, 84% of women speak to their relatives on the phone every week, compared to 71% of men. The same pattern is evident in relation to talking to friends on the phone. However, men are more likely than women to speak to their neighbours every week (79% compared with 74%). Digital communication is used more frequently by those aged 50-64 years than among those in older age groups. It is also used more frequently by those living in Belfast and Derry/Londonderry than in more rural areas, perhaps reflecting better infrastructure in larger cities. Those participants with higher educational qualifications or those living in the least deprived areas are also more likely to communicate using digital media. Men are less likely than women to communicate via text, email or chatrooms. However, this may reflect lower levels of communication overall with friends and family.
182726 Nicola Study report__Wave__2.indb 38 20/11/2017 10:23
Early key findings from a study of older people in Northern Ireland (The Nicola Study)
39
Despite these patterns of engagement and communication with a wide social network, there is a very small proportion of participants (1%) who have no contact with their relatives, and this is higher among people living alone (2%). Furthermore, 5% of participants do not have any contact with friends, and this is highest among those aged 75 years or over (8%).
Sources of supportNICOLA asked about sources of social support in two scenarios:
“YOU ARE ILL IN BED AND NEED HELP AT HOME. IS THERE ANYONE YOU COULD ASK FOR HELP?”“YOU ARE IN FINANCIAL DIFFICULTY AND NEED TO BORROW SOME MONEY TO SEE YOU THROUGH THE NEXT FEW DAYS. IS THERE ANYONE YOU COULD YOU ASK FOR HELP?”
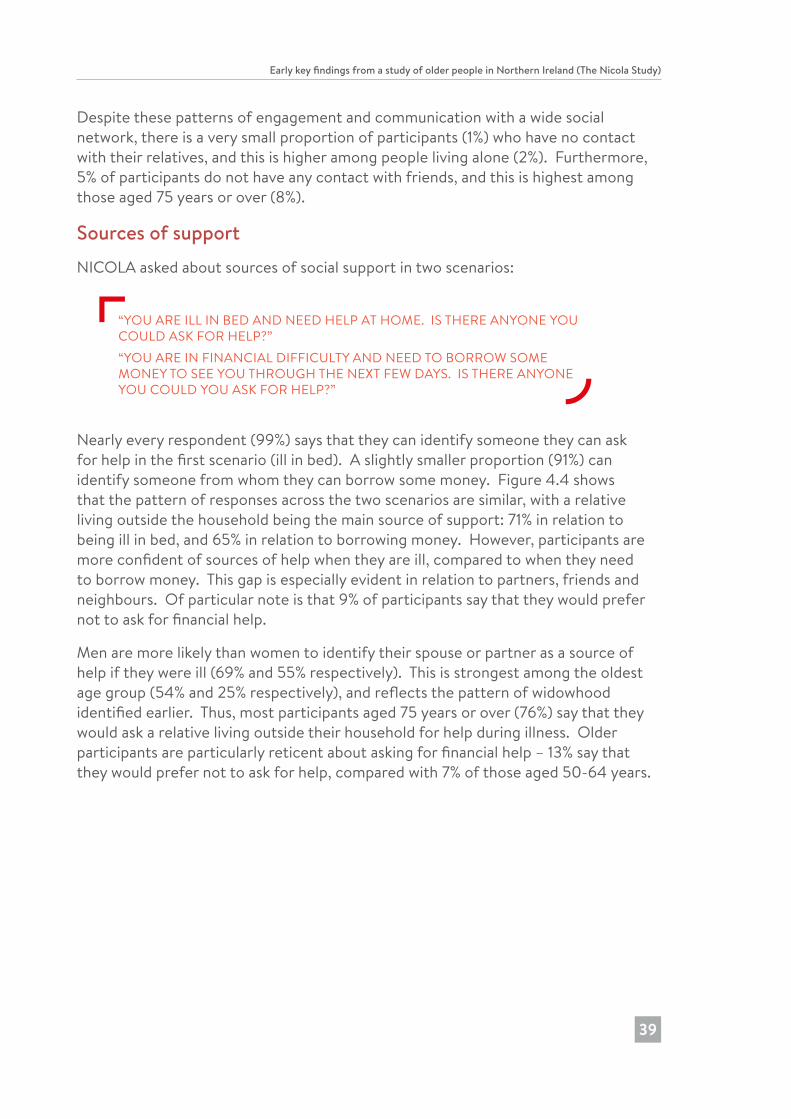
Nearly every respondent (99%) says that they can identify someone they can ask for help in the first scenario (ill in bed). A slightly smaller proportion (91%) can identify someone from whom they can borrow some money. Figure 4.4 shows that the pattern of responses across the two scenarios are similar, with a relative living outside the household being the main source of support: 71% in relation to being ill in bed, and 65% in relation to borrowing money. However, participants are more confident of sources of help when they are ill, compared to when they need to borrow money. This gap is especially evident in relation to partners, friends and neighbours. Of particular note is that 9% of participants say that they would prefer not to ask for financial help.
Men are more likely than women to identify their spouse or partner as a source of help if they were ill (69% and 55% respectively). This is strongest among the oldest age group (54% and 25% respectively), and reflects the pattern of widowhood identified earlier. Thus, most participants aged 75 years or over (76%) say that they would ask a relative living outside their household for help during illness. Older participants are particularly reticent about asking for financial help – 13% say that they would prefer not to ask for help, compared with 7% of those aged 50-64 years.
182726 Nicola Study report__Wave__2.indb 39 20/11/2017 10:23
Chapter 4
40
Figure 4.4: Sources of support (%)
0 20 40 60 80 100
Prefer not to ask for help
Voluntary organisation
Other
Colleague
Neighbour
Other household member
Friend
Partner
Relative outside household
Any sources of help?
Ill in bed Borrow money
Most people say that in a serious personal crisis that they have at least one person that they feel they could turn to for comfort and support, and 12% identify 15 people. At the same time, 1% say that they have no one, and 2% say that they did not know. The mean number is 6.7 people, and this is higher for women (6.8) than for men (6.5), whilst it is lower among people who do live alone (6.1) compared with those who do not live alone (6.9). However, there are no significant differences by age group.
Providing careOne stereotype is that older people are recipients of care. However, the NICOLA data shows that this is not the whole picture.
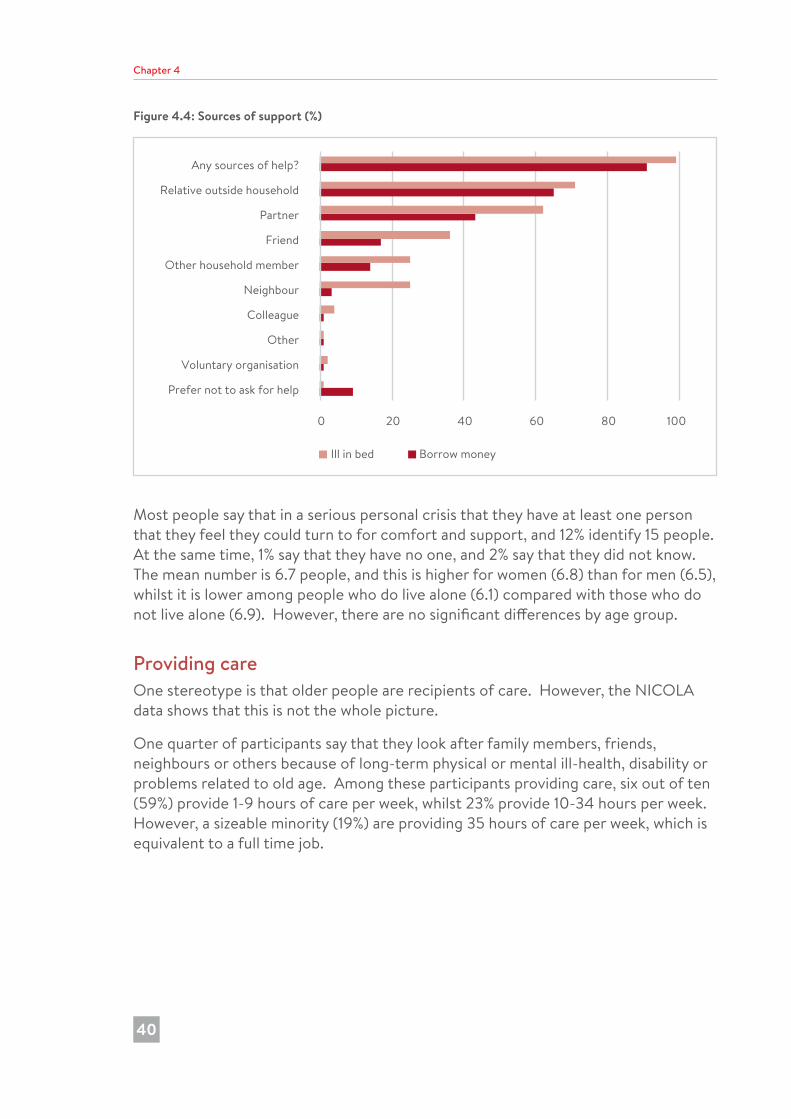
One quarter of participants say that they look after family members, friends, neighbours or others because of long-term physical or mental ill-health, disability or problems related to old age. Among these participants providing care, six out of ten (59%) provide 1-9 hours of care per week, whilst 23% provide 10-34 hours per week. However, a sizeable minority (19%) are providing 35 hours of care per week, which is equivalent to a full time job.
182726 Nicola Study report__Wave__2.indb 40 20/11/2017 10:23

Early key findings from a study of older people in Northern Ireland (The Nicola Study)
41
Women in the 50-64 years age group are more likely than men in that age group to provide care (38% and 27% respectively). Furthermore, the volume of care provided by women carers in this age group is higher than for men. However, this differential decreases among the 65-74 years age group, and is reversed slightly in the older age groups: 14% of men aged 75 years or over are care givers, compared with 11% of women of that age.
NICOLA participants provide regular care to their children who do not live with them – see Figure 4.5. Among those participants with children, four in ten said that, during the previous two years, they (or their spouse/partner) have provided at least one hour per week helping their adult children and/or grandchildren with things like practical household help (for example, home repairs, gardening, transport, shopping or household chores), or help with paperwork (such as filling out forms, settling financial or legal matters). Those in the 50-64 years age group are most likely to have done this (51%) compared with 18% of the oldest age group. This kind of practical help was given by 47% of those with higher education (diploma, certificate, degree or higher degree), compared with 30% of those with no or primary education.
NICOLA participants are also providing childcare: 45% say that during the previous two years they (or their spouse/partner) have provided at least one hour a week taking care of grandchildren or great-grandchildren who live outside their own household. This is higher for women (48%) than for men (39%), and among younger participants aged 50-64 years (54%) than those in the oldest age group (21%) – see Figure 4.5.
The volume of care provided by participants is substantial. The mean number of hours of practical help is 21 hours per month, whilst in relation to providing childcare, the mean number of hours is 39 hours per month
182726 Nicola Study report__Wave__2.indb 41 20/11/2017 10:23
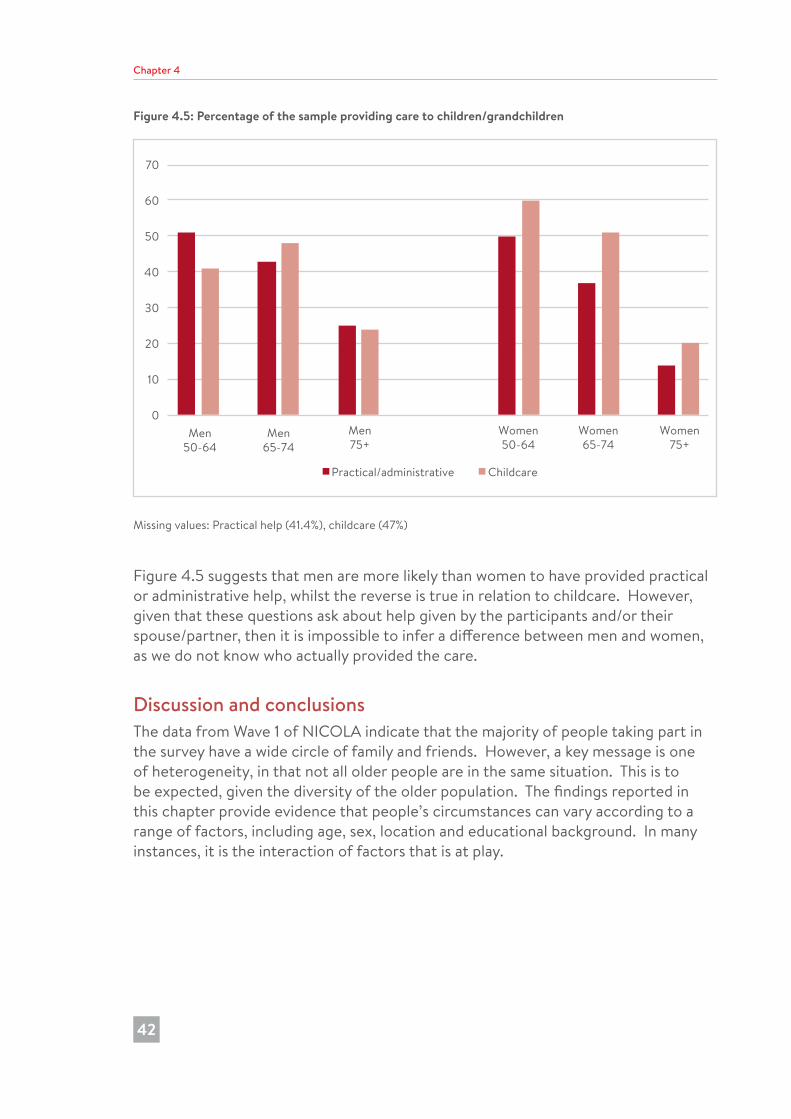
Chapter 4
42
Figure 4.5: Percentage of the sample providing care to children/grandchildren
0
10
20
30
40
50
60
70
Men50-64
Men65-74
Men75+
Women50-64
Women65-74
Women75+
Practical/administrative Childcare
Missing values: Practical help (41.4%), childcare (47%)
Figure 4.5 suggests that men are more likely than women to have provided practical or administrative help, whilst the reverse is true in relation to childcare. However, given that these questions ask about help given by the participants and/or their spouse/partner, then it is impossible to infer a difference between men and women, as we do not know who actually provided the care.
Discussion and conclusionsThe data from Wave 1 of NICOLA indicate that the majority of people taking part in the survey have a wide circle of family and friends. However, a key message is one of heterogeneity, in that not all older people are in the same situation. This is to be expected, given the diversity of the older population. The findings reported in this chapter provide evidence that people’s circumstances can vary according to a range of factors, including age, sex, location and educational background. In many instances, it is the interaction of factors that is at play.
182726 Nicola Study report__Wave__2.indb 42 20/11/2017 10:23
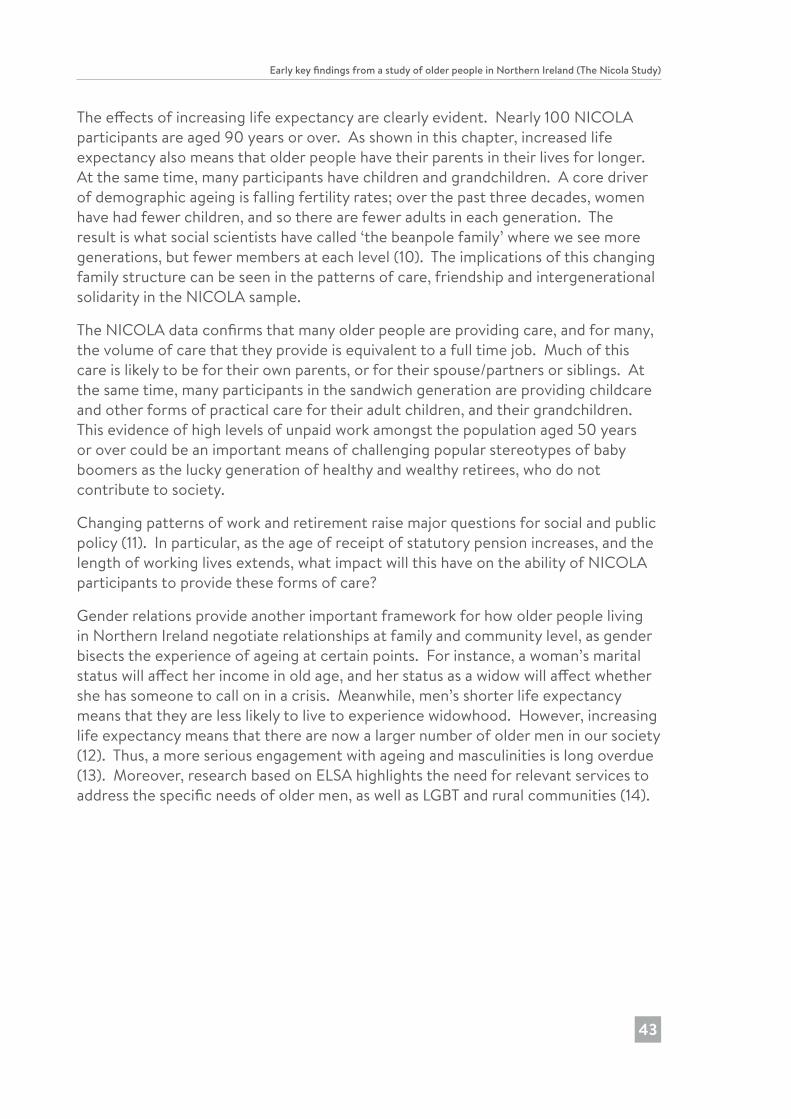
Early key findings from a study of older people in Northern Ireland (The Nicola Study)
43
The effects of increasing life expectancy are clearly evident. Nearly 100 NICOLA participants are aged 90 years or over. As shown in this chapter, increased life expectancy also means that older people have their parents in their lives for longer. At the same time, many participants have children and grandchildren. A core driver of demographic ageing is falling fertility rates; over the past three decades, women have had fewer children, and so there are fewer adults in each generation. The result is what social scientists have called ‘the beanpole family’ where we see more generations, but fewer members at each level (10). The implications of this changing family structure can be seen in the patterns of care, friendship and intergenerational solidarity in the NICOLA sample.
The NICOLA data confirms that many older people are providing care, and for many, the volume of care that they provide is equivalent to a full time job. Much of this care is likely to be for their own parents, or for their spouse/partners or siblings. At the same time, many participants in the sandwich generation are providing childcare and other forms of practical care for their adult children, and their grandchildren. This evidence of high levels of unpaid work amongst the population aged 50 years or over could be an important means of challenging popular stereotypes of baby boomers as the lucky generation of healthy and wealthy retirees, who do not contribute to society.
Changing patterns of work and retirement raise major questions for social and public policy (11). In particular, as the age of receipt of statutory pension increases, and the length of working lives extends, what impact will this have on the ability of NICOLA participants to provide these forms of care?
Gender relations provide another important framework for how older people living in Northern Ireland negotiate relationships at family and community level, as gender bisects the experience of ageing at certain points. For instance, a woman’s marital status will affect her income in old age, and her status as a widow will affect whether she has someone to call on in a crisis. Meanwhile, men’s shorter life expectancy means that they are less likely to live to experience widowhood. However, increasing life expectancy means that there are now a larger number of older men in our society (12). Thus, a more serious engagement with ageing and masculinities is long overdue (13). Moreover, research based on ELSA highlights the need for relevant services to address the specific needs of older men, as well as LGBT and rural communities (14).
182726 Nicola Study report__Wave__2.indb 43 20/11/2017 10:23
Chapter 4
44
References1. Putman R. Bowling alone: the collapse and revival of American community. New
York: Simon & Schuster; 2001.
2. Norris P, Inglehart R. Gendering social capital: bowling in women’s leagues? In: O’Neill B, Gidengil E, editors. Gender and social capital. Abingdon: Routledge Taylor & Francis Group; 2005. p. 73-98.
3. Scharlach A, Lehning A. Age-friendly communities and social inclusion in the United States of America. Ageing Soc. 2013;33(1):110-36.
4. Ashida S, Heaney CA. Differential associations of social support and social connectedness with structural features of social networks and the health status of older adults. J Aging Health. 2008;20(7):872-93.
5. Burholt V. Loneliness of older men and women in rural areas of the UK. In: Safeguarding the convoy. A call to action from the Campaign to End Loneliness. Abington, Oxford: AgeUK Oxfordshire; 2011. p. 35-9.
6. Hagestad G, Settersten R. Aging: it’s interpersonal – reflections from two lifecourse migrants. Gerontologist. 2017;57(1):136-44.
7. Di Gessa G, Glaser K, Tinker A. The health impact of intensive and nonintensive grandchild care in Europe: new evidence from SHARE. J Gerontol B Psychol Sci Soc Sci. 2016;71(5):867-79.
8. Kamiya Y, Timonen V. Older people as members of their families and communities. In: Barrett A, Savva G, Timonen V, Kenny RA, editors. Fifty plus in Ireland: first results from The Irish Longitudinal Study on Ageing (TILDA). Dublin: Trinity College Dublin; 2011. p. 37-50.
9. Buck D, Maguire D. Inequalities in life expectancy. Changes over time and implications for policy. London: The King’s Fund; 2015.
10. Harper S. How population change will transform our world. Oxford: Oxford University Press; 2016.
11. Philipson C. The future of work and retirement. Hum Relat. 2012;66(1);143-53.
12. Devine P, Montgomery L, Carter Anand J, Ní Dhónaill C. Social isolation and older men – learning from research. Community Dev J. Published online 17 July 2017; doi.org/10.1093/cdj/bsx021
13. Hurd-Clarke L, Bennett E, Liu C. Aging and masculinity: portrayals in men’s magazines. J Aging Stud. 2014;31(2014):26-33.
14. ICL-UK. The links between social connections and wellbeing in later life. London: International Longevity Centre – UK; 2015.
182726 Nicola Study report__Wave__2.indb 44 20/11/2017 10:23
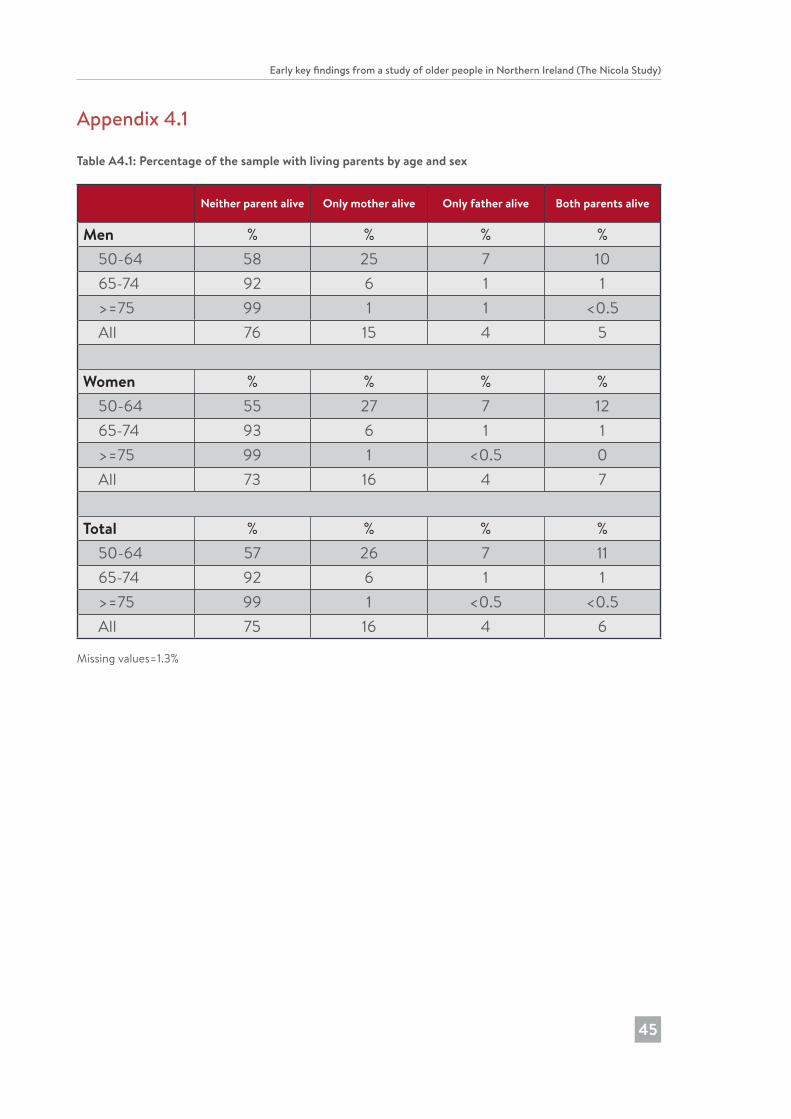
Early key findings from a study of older people in Northern Ireland (The Nicola Study)
45
Appendix 4.1
Table A4.1: Percentage of the sample with living parents by age and sex
Neither parent alive Only mother alive Only father alive Both parents alive
Men % % % % 50-64 58 25 7 10 65-74 92 6 1 1 >=75 99 1 1 <0.5 All 76 15 4 5
Women % % % % 50-64 55 27 7 12 65-74 93 6 1 1 >=75 99 1 <0.5 0 All 73 16 4 7
Total % % % % 50-64 57 26 7 11 65-74 92 6 1 1 >=75 99 1 <0.5 <0.5 All 75 16 4 6
Missing values=1.3%
182726 Nicola Study report__Wave__2.indb 45 20/11/2017 10:23
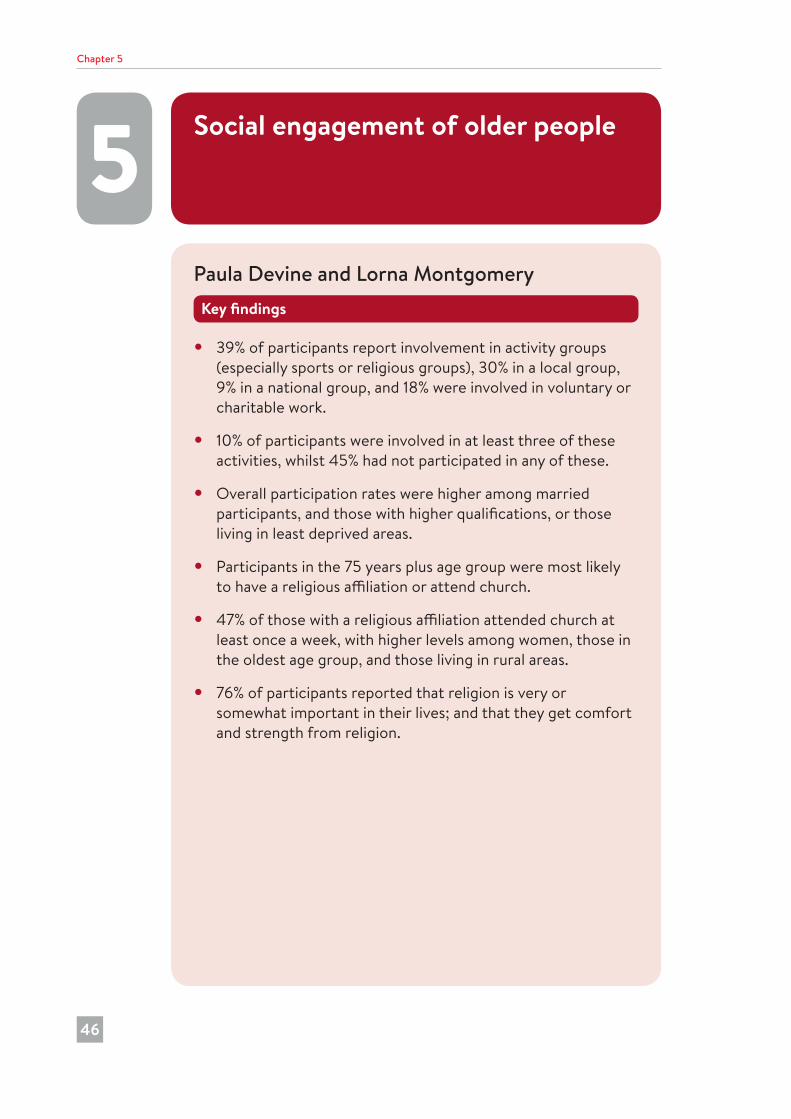
5 Social engagement of older people
Chapter 5
46
Paula Devine and Lorna MontgomeryKey findings
• 39% of participants report involvement in activity groups (especially sports or religious groups), 30% in a local group, 9% in a national group, and 18% were involved in voluntary or charitable work.
• 10% of participants were involved in at least three of these activities, whilst 45% had not participated in any of these.
• Overall participation rates were higher among married participants, and those with higher qualifications, or those living in least deprived areas.
• Participants in the 75 years plus age group were most likely to have a religious affiliation or attend church.
• 47% of those with a religious affiliation attended church at least once a week, with higher levels among women, those in the oldest age group, and those living in rural areas.
• 76% of participants reported that religion is very or somewhat important in their lives; and that they get comfort and strength from religion.
182726 Nicola Study report__Wave__2.indb 46 20/11/2017 10:23
Early key findings from a study of older people in Northern Ireland (The NICOLA Study)
47
IntroductionThis chapter explores patterns of social engagement among NICOLA participants. It has long been recognised that establishing social contact is a basic human need, with limited social contact posing a threat to an individual’s psychological and physical wellbeing (1). However, within an ageing population, loneliness and social isolation are looming as major issues facing our society, impacting significantly on wellbeing and quality of life, with discernible negative health effects. Social isolation can be defined as: “A state in which the individual lacks a sense of belonging socially, lacks engagement with others, and has a minimal number of social contacts which are deficient in fulfilling and quality relationships” (2, p. 1346).
Social engagement can be classified and measured using four distinct types: intimate social relationships; formal organisational involvements outside of work; active and relatively social leisure; and, passive and relatively solitary leisure activities, such as watching television, or reading (3). Several longitudinal studies have explored patterns of engagement in different countries. In Ireland, the TILDA study identified high levels of engagement, with 90% of the older population visiting family and friends at least once a week (4). Findings also indicated that quality of life increases with social integration. Likewise, in England, getting older is linked to an increased chance of detachment from leisure activities and cultural engagement, but not social networks and civic participation (5).
Within Northern Ireland, data from the 2014 Northern Ireland Life and Times Survey indicated that loneliness was considered to be the biggest issue facing older people in Northern Ireland (6). However, in the past ten years there have been a range of public policies developed to improve the quality of life of older people, and in some cases, promote social inclusion. The Active Ageing Strategy, 2014-2020 (7) promotes the development of Northern Ireland as an age-friendly region in which people, as they get older, are valued and supported to live actively to their fullest potential; with their rights and dignity protected. Murtagh (8), using data from the Northern Ireland Life and Times Survey, identified a sea change in attitudes towards older people in Northern Ireland, in which the contribution of older people is increasingly valued.
In exploring current patterns of social engagement in Northern Ireland, Wave 1 of the NICOLA study considered engagement within three contexts: participation in groups; volunteering behaviours; and religious beliefs and practices. In terms of social engagement, research in Belfast (9) found that older men utilised social engagement in order to achieve a more enduring sense of purpose in a post-work and post-conflict context. Volunteering has also been found to have a positive impact on mental and physical health, playing an important role in participants’ lives (10). Despite widespread secularisation, women are often more likely than men to describe themselves as religious, and women are the most typical churchgoers in Europe (11). Although Northern Ireland has historically been seen as a deeply religious society, recent trends have seen a decline in the regularity of church
182726 Nicola Study report__Wave__2.indb 47 20/11/2017 10:23
Chapter 5
48
attendance (12). This can be described as the privatisation of religion, or what Grace Davie describes as ‘believing without belonging’ (13).
In this chapter, we look at participants’ engagement with group activities and organisations, volunteering, and religious activities. In order to reflect the diversity of older people, we identify differences by a number of key demographic and socio-economic variables, including sex, age group, educational attainment, marital status, self-reported health, rurality and the level of deprivation in the areas where participants live. Results reported in this chapter are weighted to ensure that they are representative of the Northern Ireland population aged 50 years and over (weighting is based on age, sex and region; see also Chapters 2 and 9 for further details on weighting).
MeasuresThe NICOLA study included questions focusing on social participation which asked if participants have been involved in different group activities over the previous 12 months. Types of group activities included: i) getting together to do an activity or talk about things (e.g., evening classes, support groups, keep-fit classes); ii) activities as part of a local or community group, club or organisation (e.g., residents’ associations, sports groups, school or religious groups); and iii) activities as part of a national group, club or organisation (e.g., charities, political groups, environmental groups). For each type of activity, participants were asked to indicate their involvement.
Participants were also asked if they are involved in voluntary work or charitable activity, and the amount of time they spend travelling to do these activities (possible responses ranged from ‘no time’ through to ‘50 or more hours/week’).
Participants were asked about their religious affiliation, and if they belonged to a particular denomination they were asked about frequency of attendance at religious services, how important religion is in their lives (five possible response options ranging from ‘very important’ to ‘not at all important’), and whether they get comfort and strength from religion.
Social participationNICOLA participants were asked about their participation in different types of activities and organisations. Figure 5.1 shows that participation in groups is undertaken by only a minority of participants. Thirty-nine percent took part in activity groups (where people get together to do an activity or talk about things), 30% took part in a local group, whilst only 9% participated in a national group (such as political or environment groups or charities). The most popular activity groups related to sports/exercise (36%) or religious groups (31%). Only one in ten participated in groups for older people.
182726 Nicola Study report__Wave__2.indb 48 20/11/2017 10:23

Early key findings from a study of older people in Northern Ireland (The NICOLA Study)
49
In general, there is little variation in social participation according to age, sex, or whether people live alone. However, Figure 5.1 shows the variation in the participation rates of those with differing educational attainment, residents of areas with different levels of deprivation and those with differing self-reported general health. Those with higher educational qualifications and those living in the least deprived areas are most likely to take part in activity, local or national groups. However, this is not unexpected, given the link between education and deprivation.
There are lower levels of participation in these types of groups and activities among those participants who say that they have an illness or disability that limits their activities: 32% were involved in activity groups, 25% were involved in local groups, and 7% had participated in national groups. For other participants, the respective figures were 44%, 35% and 12%.
Figure 5.1: Participation in groups, by education, area deprivation and self-reported health (%)
0
10
20
30
40
50
60
All Highereducation
No/primaryeducation
Leastdeprived
Mostdeprived
Goodhealth
Poorhealth
Activity groups Local group National group
Missing values: 1%
VolunteeringEighteen percent of NICOLA participants are involved in voluntary work or charitable activity, and this is higher among those aged 50-74 years (20%) than it is among those aged 75 years or over (10%). Figure 5.2 shows that there is variation according to where people live, with those living in the least deprived areas being more likely than those living in the most deprived areas (25% and 12% respectively) to be involved in voluntary work or charitable activity. Matching this pattern, there is variation according to educational attainment: 8% of those with no or primary level
182726 Nicola Study report__Wave__2.indb 49 20/11/2017 10:23
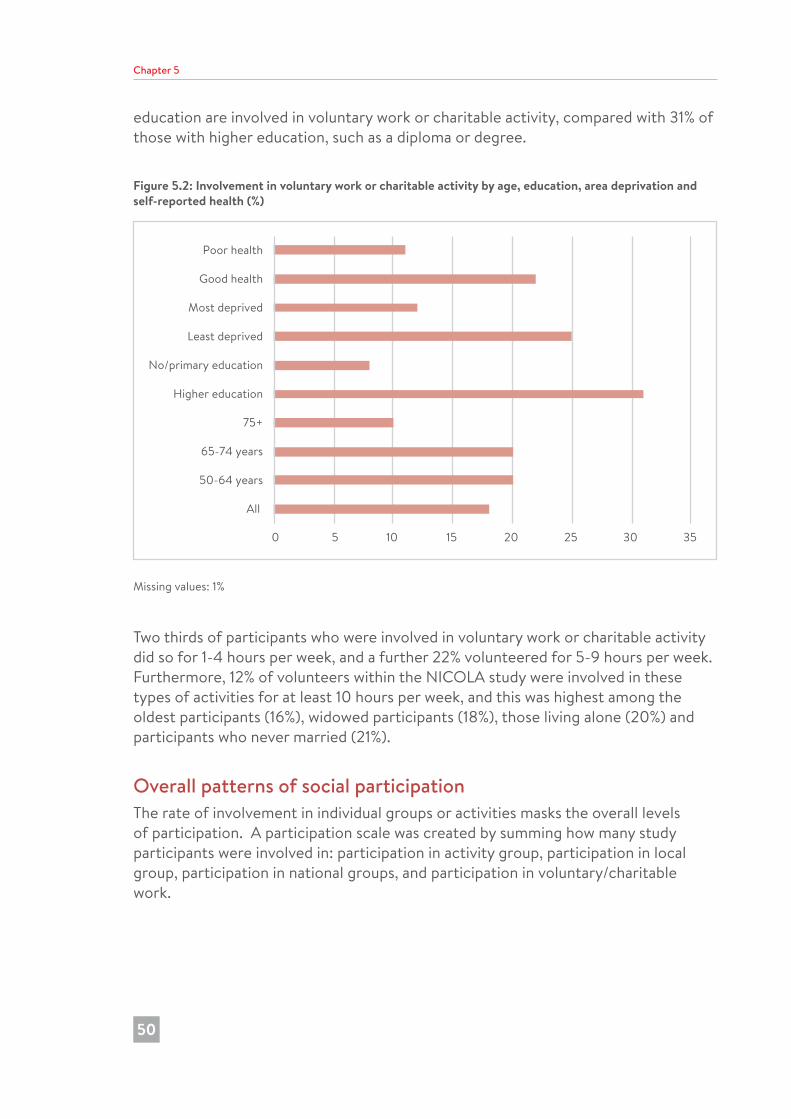
Chapter 5
50
education are involved in voluntary work or charitable activity, compared with 31% of those with higher education, such as a diploma or degree.
Figure 5.2: Involvement in voluntary work or charitable activity by age, education, area deprivation and self-reported health (%)
0 5 10 15 20 25 30 35
All
50-64 years
65-74 years
75+
Higher education
No/primary education
Least deprived
Most deprived
Good health
Poor health
Missing values: 1%
Two thirds of participants who were involved in voluntary work or charitable activity did so for 1-4 hours per week, and a further 22% volunteered for 5-9 hours per week. Furthermore, 12% of volunteers within the NICOLA study were involved in these types of activities for at least 10 hours per week, and this was highest among the oldest participants (16%), widowed participants (18%), those living alone (20%) and participants who never married (21%).
Overall patterns of social participationThe rate of involvement in individual groups or activities masks the overall levels of participation. A participation scale was created by summing how many study participants were involved in: participation in activity group, participation in local group, participation in national groups, and participation in voluntary/charitable work.
182726 Nicola Study report__Wave__2.indb 50 20/11/2017 10:23
Early key findings from a study of older people in Northern Ireland (The NICOLA Study)
51
Just over one half of participants (55%) were involved in at least one type of activity, including 2% who participated in all four; 8% identified three activities; 18% identified two activities; 26% identified one activity; whilst 45% were involved in none of these. There were similar participation rates among men and women, among the different age groups and among rural and urban areas. However, the highest levels of participation were among married participants (58%), whilst the lowest were among those who were separated or divorced (47%). There were also differences according to educational attainment: 44% of those with no education/primary education were involved in any of these activities, compared with 71% of those with a diploma, certificate, degree or higher degree. Furthermore, 21% of this latter group were involved in at least three of the activities. Two thirds of those living in the least deprived areas (67%) were involved in at least one activity, compared with 44% of those in the most deprived areas; 61% of participants who said that they had good general health were involved in at least one activity, whilst 43% of those with poor general health did so.
ReligionReligion can form an integral part of people’s lives. In addition to the religious and spiritual dimensions, religious affiliation can play an important role in shaping personal and community identity, as well as providing opportunities for social engagement.
Around one in ten NICOLA participants (11%) said that they do not belong to a religious denomination, whilst the majority of participants (88%) named a Christian denomination. The three largest denominations were Catholic (36%), Presbyterian (24%) and Church of Ireland (16%). A small number of participants were Buddhist, Hindu, Jewish or Muslim, or belonged to other religious denominations or groups. Having a religious affiliation was higher among women than men (91% and 87% respectively), among those living in the most rural areas compared with those living in Belfast or Derry/Londonderry (92% and 75% respectively), and among those with no or primary education compared with those with higher education qualifications (94% and 86%). Participants in the oldest age group were also most likely to have a religious affiliation: only 5% had no religion, compared with 13% of those aged 50-64 and 10% of those aged 65-74. The oldest participants were most likely to belong to Protestant/other Christian denominations (64%), whilst those in the 50-64 years age band had the highest proportion of Catholic participants (39%).
NICOLA participants have a notably different pattern of religious affiliation than their counterparts in the Republic of Ireland. Data from Wave 1 of TILDA indicated that 5% had no religion, and 90% were Catholic (4) (compared to 36% Catholic in the NICOLA study), which reflects different historical and cultural contexts.
Whilst 22% of NICOLA participants who had a religious affiliation said that they never or almost never attended religious services, nearly half (47%) attended a service at
182726 Nicola Study report__Wave__2.indb 51 20/11/2017 10:23

Chapter 5
52
least once a week. Figure 5.3 shows that men were less likely to attend religious services than women, especially in the younger age groups. Three in ten men aged 50-64 years said that they never attended services. Weekly attendance is more frequent among those in the oldest age group: 56% of men and 59% of women aged 75 years or over attended a religious service at least once a week. This matches the pattern observed among TILDA participants (14). Weekly attendance was also most frequent amongst participants living in the most rural areas, where 56% attended weekly, compared with 40% in Belfast or Derry/Londonderry.
Figure 5.3: Frequency of attendance of religious services, by age and sex (%)
0
10
20
30
40
50
60
70
Men 50-64 Men 65-74 Men 75+ Women 50-64 Women 65-74 Women 75+
Never/almost never 1-5 times per year 1-2 times per month At least once a week
Missing values: 10.6%
Religion plays an important role in the lives of NICOLA participants - around one half (48%) said that religion was very important in their life, and a further 28% said that it is somewhat important. Figure 5.4 shows that there was a clear association with age: 64% of those aged 75 years or over said that religion was very important in their life, compared with 40% of those aged 50-64 years. Religion appears to be more important in the lives of women than men: 55% of women think that it is very important compared with 40% of men. Furthermore, three quarters of people said that they received comfort and strength from religion, and again, there were clear associations with age and sex (see Figure 5.5). Religion plays a larger part in the lives of participants living in the most rural areas, in that they were most likely to say that religion was very or somewhat important in their lives (80%), and to receive comfort and strength from religion (81%). The respective figures for Belfast and Derry/Londonderry were 71% and 71%.
182726 Nicola Study report__Wave__2.indb 52 20/11/2017 10:23
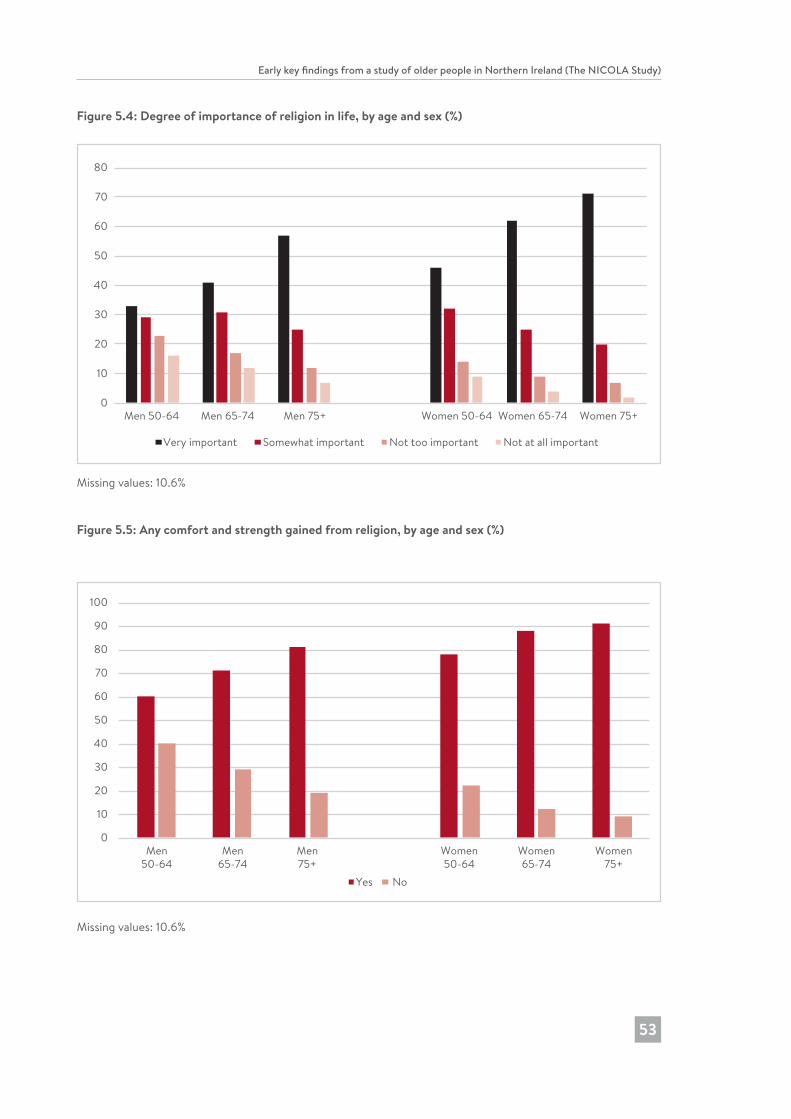
Early key findings from a study of older people in Northern Ireland (The NICOLA Study)
53
Figure 5.4: Degree of importance of religion in life, by age and sex (%)
0
10
20
30
40
50
60
70
80
Men 50-64 Men 65-74 Men 75+ Women 50-64 Women 65-74 Women 75+
Very important Somewhat important Not too important Not at all important
Missing values: 10.6%
Figure 5.5: Any comfort and strength gained from religion, by age and sex (%)
0
10
20
30
40
50
60
70
80
90
100
Men50-64
Men65-74
Men75+
Women50-64
Women65-74
Women75+
Yes No
Missing values: 10.6%
182726 Nicola Study report__Wave__2.indb 53 20/11/2017 10:23
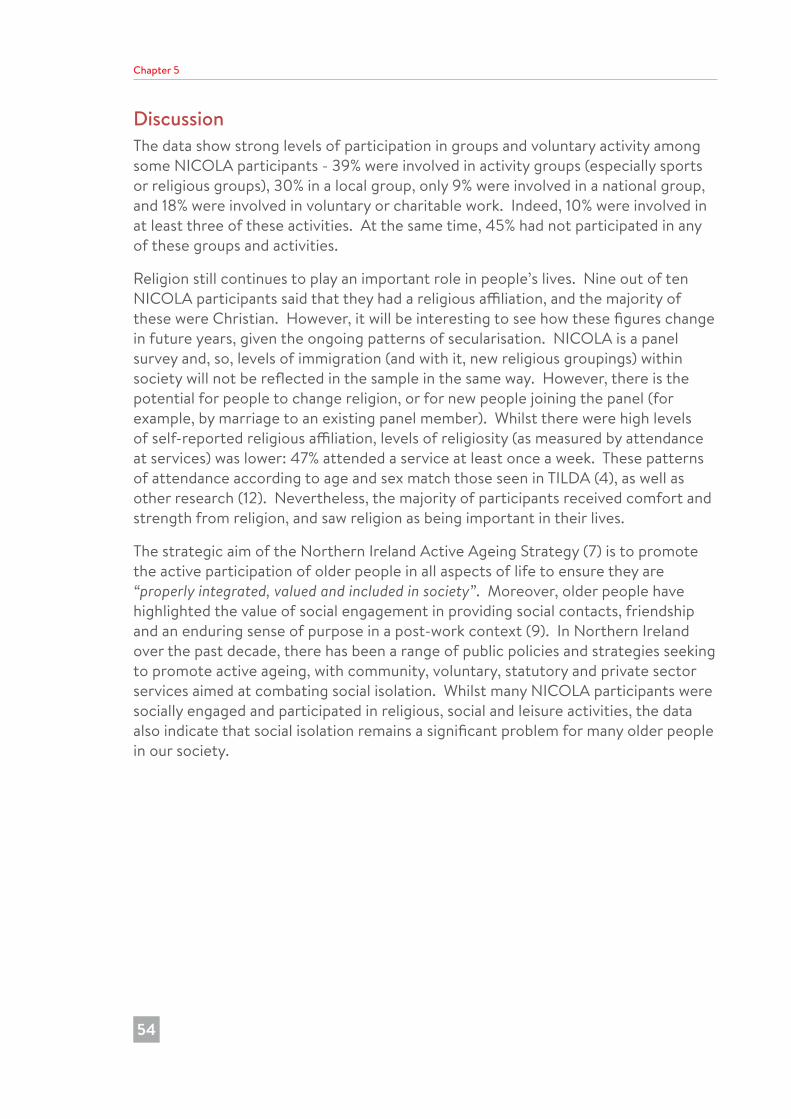
Chapter 5
54
DiscussionThe data show strong levels of participation in groups and voluntary activity among some NICOLA participants - 39% were involved in activity groups (especially sports or religious groups), 30% in a local group, only 9% were involved in a national group, and 18% were involved in voluntary or charitable work. Indeed, 10% were involved in at least three of these activities. At the same time, 45% had not participated in any of these groups and activities.
Religion still continues to play an important role in people’s lives. Nine out of ten NICOLA participants said that they had a religious affiliation, and the majority of these were Christian. However, it will be interesting to see how these figures change in future years, given the ongoing patterns of secularisation. NICOLA is a panel survey and, so, levels of immigration (and with it, new religious groupings) within society will not be reflected in the sample in the same way. However, there is the potential for people to change religion, or for new people joining the panel (for example, by marriage to an existing panel member). Whilst there were high levels of self-reported religious affiliation, levels of religiosity (as measured by attendance at services) was lower: 47% attended a service at least once a week. These patterns of attendance according to age and sex match those seen in TILDA (4), as well as other research (12). Nevertheless, the majority of participants received comfort and strength from religion, and saw religion as being important in their lives.
The strategic aim of the Northern Ireland Active Ageing Strategy (7) is to promote the active participation of older people in all aspects of life to ensure they are “properly integrated, valued and included in society”. Moreover, older people have highlighted the value of social engagement in providing social contacts, friendship and an enduring sense of purpose in a post-work context (9). In Northern Ireland over the past decade, there has been a range of public policies and strategies seeking to promote active ageing, with community, voluntary, statutory and private sector services aimed at combating social isolation. Whilst many NICOLA participants were socially engaged and participated in religious, social and leisure activities, the data also indicate that social isolation remains a significant problem for many older people in our society.
182726 Nicola Study report__Wave__2.indb 54 20/11/2017 10:23
Early key findings from a study of older people in Northern Ireland (The NICOLA Study)
55
References1. Maslow AH. A Theory of human motivation. Psychol Rev. 1943;50(4):370-96.
2. Nicholson NR. Social isolation in older adults: an evolutionary concept analysis. J Adv Nurs. 2009;65:1342-52.
3. House JS, Robbins C, Metzner HL. The association of social relationships and activities with mortality: prospective evidence from the Tecumseh Community Health Study. Am J Epidemiol. 1982;116(1), 123-40.
4. Timonen V, Kamiya Y, Maty S. Social engagement of older people. In: Barrett A, Savva G, Timonen, V, Kenny RA, editors. Fifty plus in Ireland: first results from The Irish Longitudinal Study on Ageing (TILDA). Dublin: Trinity College Dublin; 2011. p. 51-71.
5. Jivraj S, Nazroo J, Barnes M. Change in social detachment in older age in England. In: Banks J, Nazroo J, Steptoe A, editors. The dynamics of ageing: evidence from the English Longitudinal Study of Ageing, 2002-10, Wave 5. London: The Institute for Fiscal Studies; 2012. p. 48-97.
6. ARK. Northern Ireland Life and Times Survey 2014 [Data set]. Belfast: ARK; 2015. http://www.ark.ac.uk/nilt/2015.
7. Northern Ireland Executive Active Ageing Strategy 2016-2021. Belfast: Northern Ireland Executive; 2014.
8. Murtagh B. The politics of age in Northern Ireland. Generations [blog on the Internet]; 2015, Fall 2015 [cited 2017 Sep 14]. Available from http://asaging.org/blog/politics-age-northern-ireland.
9. Devine P, Carter Anand J, Montgomery L, Ní Dhónaill C, O’Hagan L. A review of service provision for men aged 50+ (Belfast). Belfast: Volunteer Now; 2014.
10. Volunteer Now. Formal Volunteering and health in the 50+ age group in Northern Ireland: final report. Belfast: Volunteer Now; 2013.
11. Woodhead L. Gendering secularization theory. Soc Compass. 2008;55:187-93.
12. Devine P. Men, women, and religiosity in Northern Ireland: testing the theories. J Contemp Relig. 2013;28(3):473-88.
13. Davie G. Religion in Britain since 1945: believing without belonging. Oxford: Blackwell; 1994.
182726 Nicola Study report__Wave__2.indb 55 20/11/2017 10:23
6 Alcohol use, smoking and physical activity among older adults
Chapter 6
56
Mark A. Tully, Angie Scott and Sharon CruiseKey Findings
• 61% of NICOLA participants reported drinking alcohol on a regular basis.
• 18% of participants (approximately one in three regular drinkers) consumed more than the recommended level of 14 units per week.
• 17% of participants reported that they smoked currently.
• The highest rates of smoking were observed among participants who were single, younger, lived in urban areas and/or the most deprived areas and had the lowest education levels.
• 57% of participants reported undertaking sufficient physical activity to benefit their health (150 minutes or more per week).
• Physical inactivity tended to be highest among participants who were women, older, single, lived alone, had the lowest education level, and lived in areas of social deprivation.
182726 Nicola Study report__Wave__2.indb 56 20/11/2017 10:23
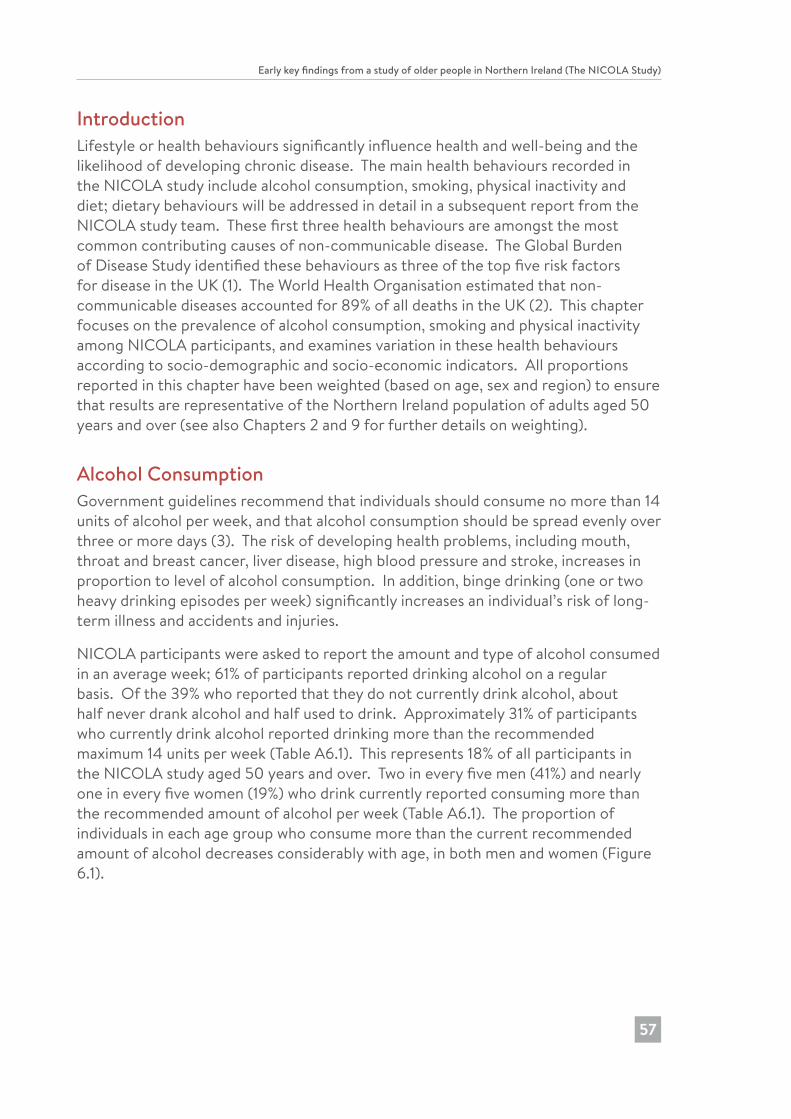
Early key findings from a study of older people in Northern Ireland (The NICOLA Study)
57
IntroductionLifestyle or health behaviours significantly influence health and well-being and the likelihood of developing chronic disease. The main health behaviours recorded in the NICOLA study include alcohol consumption, smoking, physical inactivity and diet; dietary behaviours will be addressed in detail in a subsequent report from the NICOLA study team. These first three health behaviours are amongst the most common contributing causes of non-communicable disease. The Global Burden of Disease Study identified these behaviours as three of the top five risk factors for disease in the UK (1). The World Health Organisation estimated that non-communicable diseases accounted for 89% of all deaths in the UK (2). This chapter focuses on the prevalence of alcohol consumption, smoking and physical inactivity among NICOLA participants, and examines variation in these health behaviours according to socio-demographic and socio-economic indicators. All proportions reported in this chapter have been weighted (based on age, sex and region) to ensure that results are representative of the Northern Ireland population of adults aged 50 years and over (see also Chapters 2 and 9 for further details on weighting).
Alcohol ConsumptionGovernment guidelines recommend that individuals should consume no more than 14 units of alcohol per week, and that alcohol consumption should be spread evenly over three or more days (3). The risk of developing health problems, including mouth, throat and breast cancer, liver disease, high blood pressure and stroke, increases in proportion to level of alcohol consumption. In addition, binge drinking (one or two heavy drinking episodes per week) significantly increases an individual’s risk of long-term illness and accidents and injuries.
NICOLA participants were asked to report the amount and type of alcohol consumed in an average week; 61% of participants reported drinking alcohol on a regular basis. Of the 39% who reported that they do not currently drink alcohol, about half never drank alcohol and half used to drink. Approximately 31% of participants who currently drink alcohol reported drinking more than the recommended maximum 14 units per week (Table A6.1). This represents 18% of all participants in the NICOLA study aged 50 years and over. Two in every five men (41%) and nearly one in every five women (19%) who drink currently reported consuming more than the recommended amount of alcohol per week (Table A6.1). The proportion of individuals in each age group who consume more than the current recommended amount of alcohol decreases considerably with age, in both men and women (Figure 6.1).
182726 Nicola Study report__Wave__2.indb 57 20/11/2017 10:23
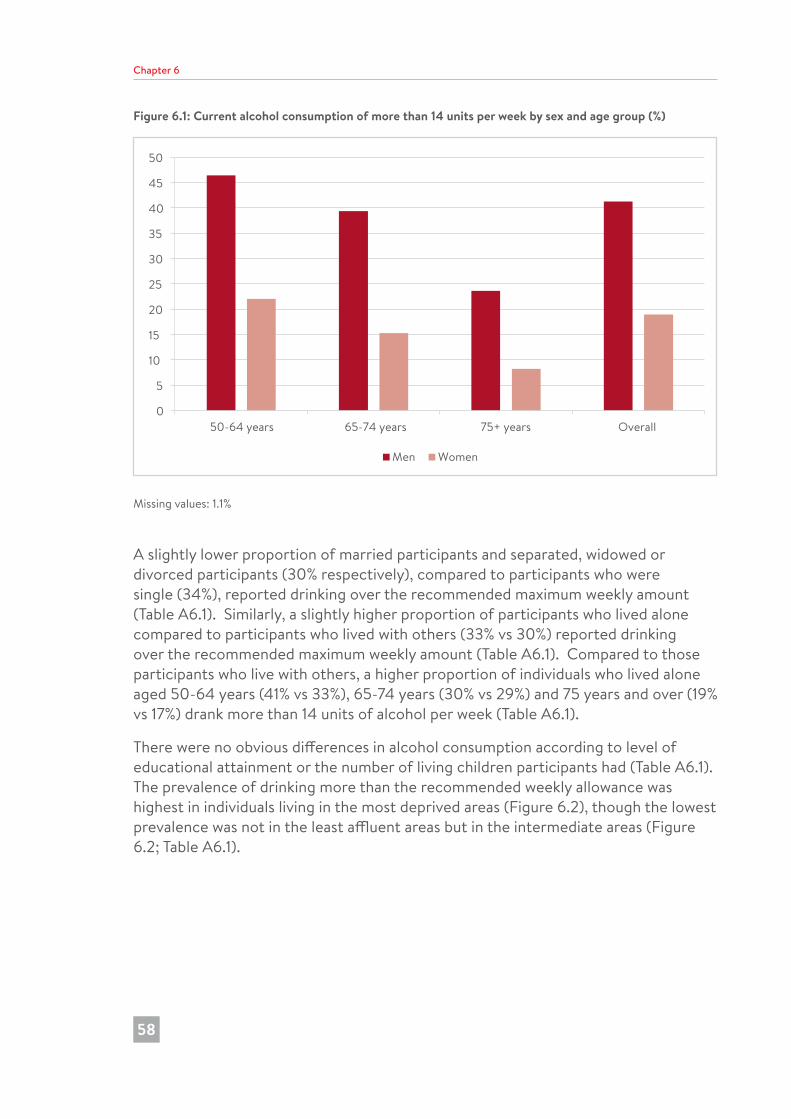
Chapter 6
58
Figure 6.1: Current alcohol consumption of more than 14 units per week by sex and age group (%)
0
5
10
15
20
25
30
35
40
45
50
50-64 years 65-74 years 75+ years Overall
Men Women
Missing values: 1.1%
A slightly lower proportion of married participants and separated, widowed or divorced participants (30% respectively), compared to participants who were single (34%), reported drinking over the recommended maximum weekly amount (Table A6.1). Similarly, a slightly higher proportion of participants who lived alone compared to participants who lived with others (33% vs 30%) reported drinking over the recommended maximum weekly amount (Table A6.1). Compared to those participants who live with others, a higher proportion of individuals who lived alone aged 50-64 years (41% vs 33%), 65-74 years (30% vs 29%) and 75 years and over (19% vs 17%) drank more than 14 units of alcohol per week (Table A6.1).
There were no obvious differences in alcohol consumption according to level of educational attainment or the number of living children participants had (Table A6.1). The prevalence of drinking more than the recommended weekly allowance was highest in individuals living in the most deprived areas (Figure 6.2), though the lowest prevalence was not in the least affluent areas but in the intermediate areas (Figure 6.2; Table A6.1).
182726 Nicola Study report__Wave__2.indb 58 20/11/2017 10:23
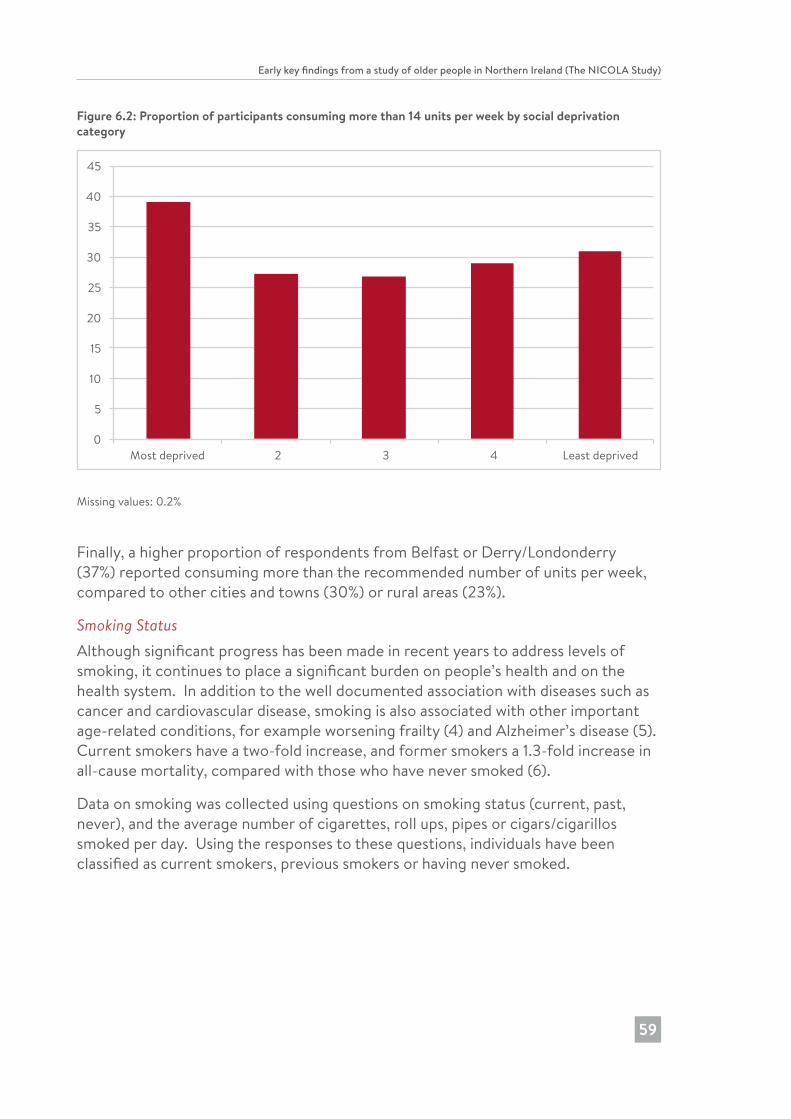
Early key findings from a study of older people in Northern Ireland (The NICOLA Study)
59
Figure 6.2: Proportion of participants consuming more than 14 units per week by social deprivation category
0
5
10
15
20
25
30
35
40
45
Most deprived 2 3 4 Least deprived
Missing values: 0.2%
Finally, a higher proportion of respondents from Belfast or Derry/Londonderry (37%) reported consuming more than the recommended number of units per week, compared to other cities and towns (30%) or rural areas (23%).
Smoking StatusAlthough significant progress has been made in recent years to address levels of smoking, it continues to place a significant burden on people’s health and on the health system. In addition to the well documented association with diseases such as cancer and cardiovascular disease, smoking is also associated with other important age-related conditions, for example worsening frailty (4) and Alzheimer’s disease (5). Current smokers have a two-fold increase, and former smokers a 1.3-fold increase in all-cause mortality, compared with those who have never smoked (6).
Data on smoking was collected using questions on smoking status (current, past, never), and the average number of cigarettes, roll ups, pipes or cigars/cigarillos smoked per day. Using the responses to these questions, individuals have been classified as current smokers, previous smokers or having never smoked.
182726 Nicola Study report__Wave__2.indb 59 20/11/2017 10:23
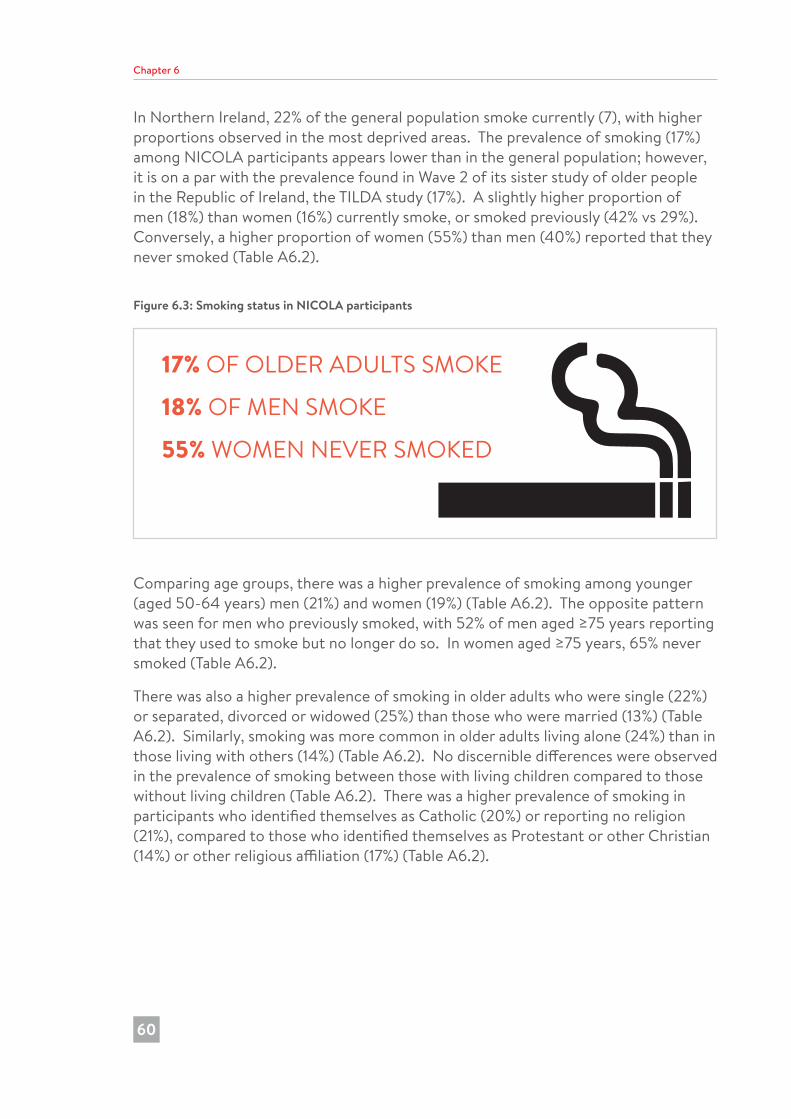
Chapter 6
60
In Northern Ireland, 22% of the general population smoke currently (7), with higher proportions observed in the most deprived areas. The prevalence of smoking (17%) among NICOLA participants appears lower than in the general population; however, it is on a par with the prevalence found in Wave 2 of its sister study of older people in the Republic of Ireland, the TILDA study (17%). A slightly higher proportion of men (18%) than women (16%) currently smoke, or smoked previously (42% vs 29%). Conversely, a higher proportion of women (55%) than men (40%) reported that they never smoked (Table A6.2).
Figure 6.3: Smoking status in NICOLA participants
17% OF OLDER ADULTS SMOKE
18% OF MEN SMOKE
55% WOMEN NEVER SMOKED
Comparing age groups, there was a higher prevalence of smoking among younger (aged 50-64 years) men (21%) and women (19%) (Table A6.2). The opposite pattern was seen for men who previously smoked, with 52% of men aged ≥75 years reporting that they used to smoke but no longer do so. In women aged ≥75 years, 65% never smoked (Table A6.2).
There was also a higher prevalence of smoking in older adults who were single (22%) or separated, divorced or widowed (25%) than those who were married (13%) (Table A6.2). Similarly, smoking was more common in older adults living alone (24%) than in those living with others (14%) (Table A6.2). No discernible differences were observed in the prevalence of smoking between those with living children compared to those without living children (Table A6.2). There was a higher prevalence of smoking in participants who identified themselves as Catholic (20%) or reporting no religion (21%), compared to those who identified themselves as Protestant or other Christian (14%) or other religious affiliation (17%) (Table A6.2).
182726 Nicola Study report__Wave__2.indb 60 20/11/2017 10:23
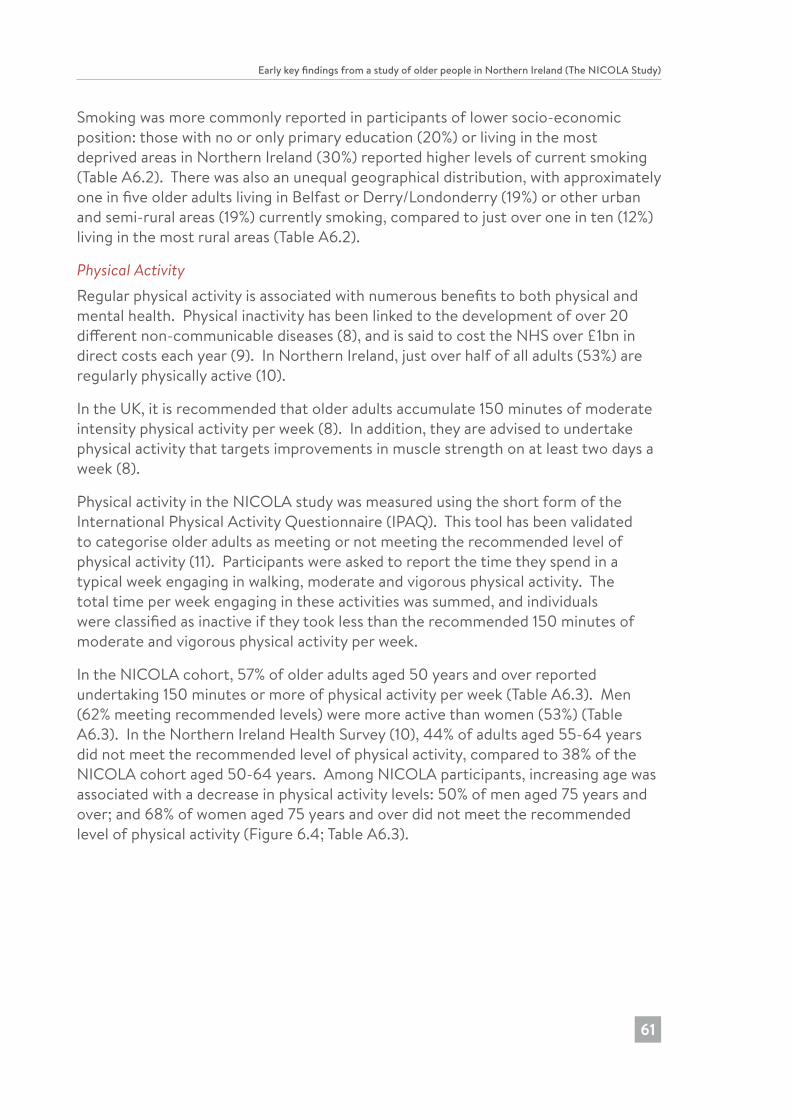
Early key findings from a study of older people in Northern Ireland (The NICOLA Study)
61
Smoking was more commonly reported in participants of lower socio-economic position: those with no or only primary education (20%) or living in the most deprived areas in Northern Ireland (30%) reported higher levels of current smoking (Table A6.2). There was also an unequal geographical distribution, with approximately one in five older adults living in Belfast or Derry/Londonderry (19%) or other urban and semi-rural areas (19%) currently smoking, compared to just over one in ten (12%) living in the most rural areas (Table A6.2).
Physical ActivityRegular physical activity is associated with numerous benefits to both physical and mental health. Physical inactivity has been linked to the development of over 20 different non-communicable diseases (8), and is said to cost the NHS over £1bn in direct costs each year (9). In Northern Ireland, just over half of all adults (53%) are regularly physically active (10).
In the UK, it is recommended that older adults accumulate 150 minutes of moderate intensity physical activity per week (8). In addition, they are advised to undertake physical activity that targets improvements in muscle strength on at least two days a week (8).
Physical activity in the NICOLA study was measured using the short form of the International Physical Activity Questionnaire (IPAQ). This tool has been validated to categorise older adults as meeting or not meeting the recommended level of physical activity (11). Participants were asked to report the time they spend in a typical week engaging in walking, moderate and vigorous physical activity. The total time per week engaging in these activities was summed, and individuals were classified as inactive if they took less than the recommended 150 minutes of moderate and vigorous physical activity per week.
In the NICOLA cohort, 57% of older adults aged 50 years and over reported undertaking 150 minutes or more of physical activity per week (Table A6.3). Men (62% meeting recommended levels) were more active than women (53%) (Table A6.3). In the Northern Ireland Health Survey (10), 44% of adults aged 55-64 years did not meet the recommended level of physical activity, compared to 38% of the NICOLA cohort aged 50-64 years. Among NICOLA participants, increasing age was associated with a decrease in physical activity levels: 50% of men aged 75 years and over; and 68% of women aged 75 years and over did not meet the recommended level of physical activity (Figure 6.4; Table A6.3).
182726 Nicola Study report__Wave__2.indb 61 20/11/2017 10:23
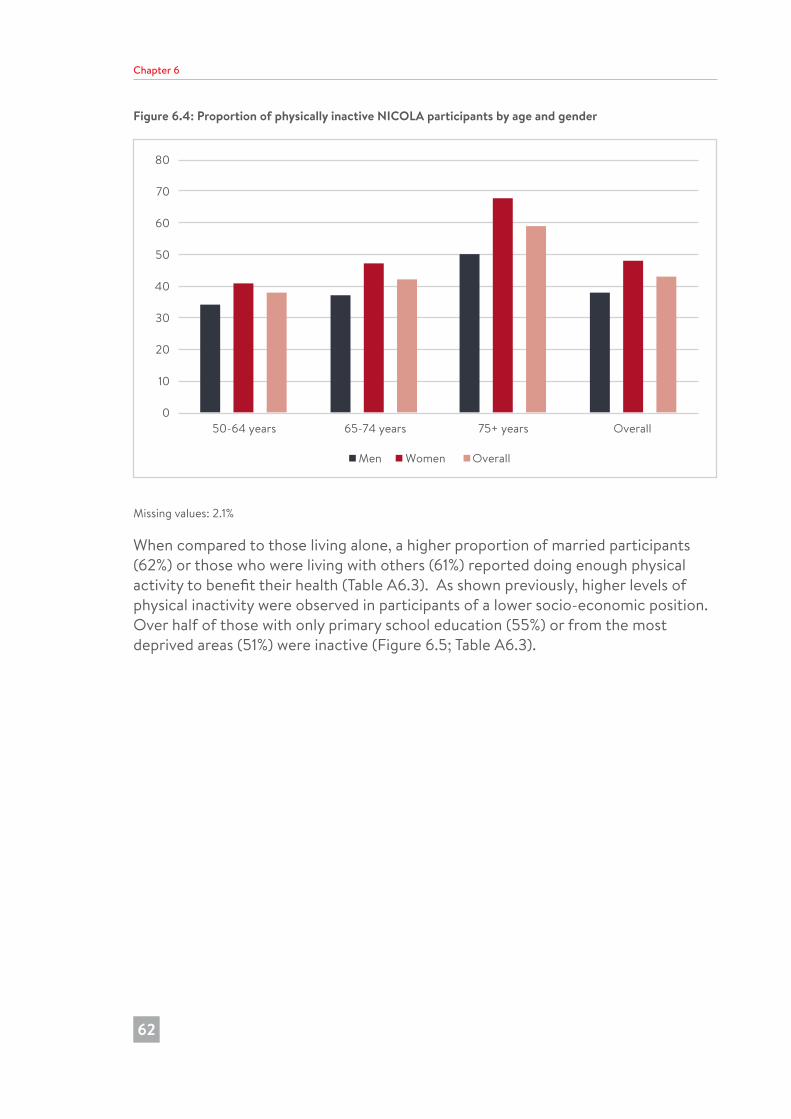
Chapter 6
62
Figure 6.4: Proportion of physically inactive NICOLA participants by age and gender
0
10
20
30
40
50
60
70
80
50-64 years 65-74 years 75+ years Overall
Men Women Overall
Missing values: 2.1%
When compared to those living alone, a higher proportion of married participants (62%) or those who were living with others (61%) reported doing enough physical activity to benefit their health (Table A6.3). As shown previously, higher levels of physical inactivity were observed in participants of a lower socio-economic position. Over half of those with only primary school education (55%) or from the most deprived areas (51%) were inactive (Figure 6.5; Table A6.3).
182726 Nicola Study report__Wave__2.indb 62 20/11/2017 10:23
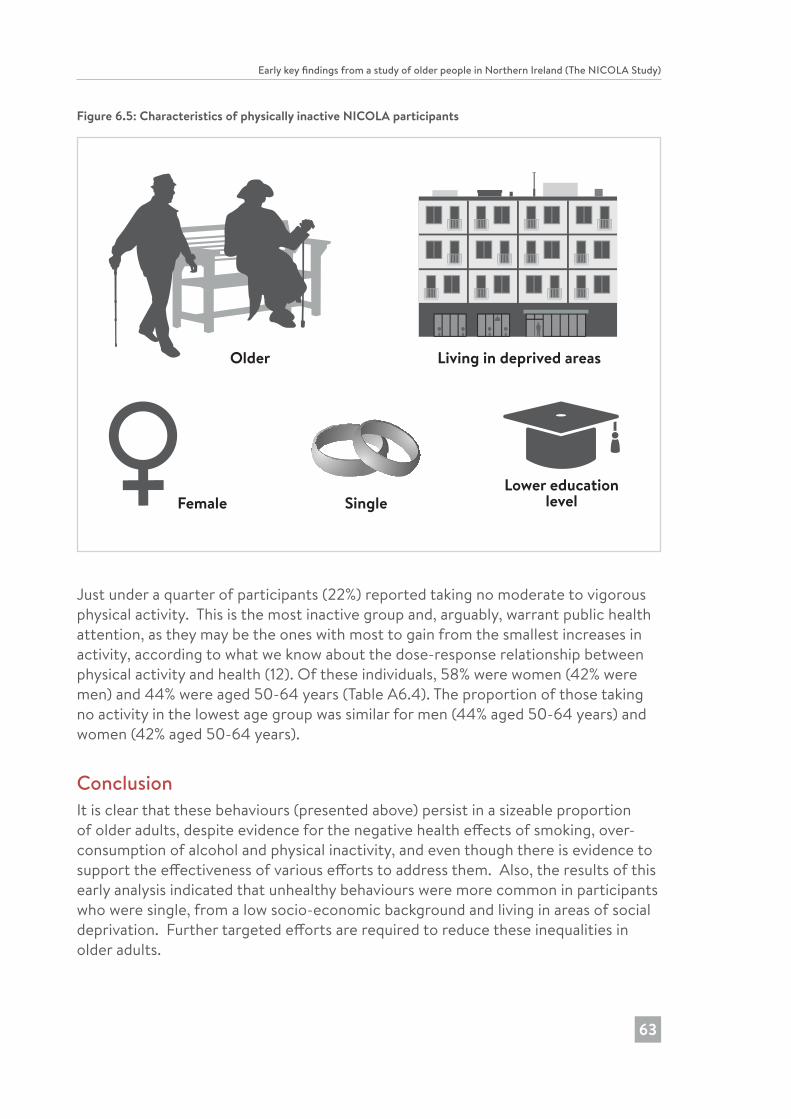
Early key findings from a study of older people in Northern Ireland (The NICOLA Study)
63
Figure 6.5: Characteristics of physically inactive NICOLA participants
Older Living in deprived areas
Female SingleLower education
level
Just under a quarter of participants (22%) reported taking no moderate to vigorous physical activity. This is the most inactive group and, arguably, warrant public health attention, as they may be the ones with most to gain from the smallest increases in activity, according to what we know about the dose-response relationship between physical activity and health (12). Of these individuals, 58% were women (42% were men) and 44% were aged 50-64 years (Table A6.4). The proportion of those taking no activity in the lowest age group was similar for men (44% aged 50-64 years) and women (42% aged 50-64 years).
ConclusionIt is clear that these behaviours (presented above) persist in a sizeable proportion of older adults, despite evidence for the negative health effects of smoking, over-consumption of alcohol and physical inactivity, and even though there is evidence to support the effectiveness of various efforts to address them. Also, the results of this early analysis indicated that unhealthy behaviours were more common in participants who were single, from a low socio-economic background and living in areas of social deprivation. Further targeted efforts are required to reduce these inequalities in older adults.
182726 Nicola Study report__Wave__2.indb 63 20/11/2017 10:23
Chapter 6
64
References1. Murray CJ, Richards MA, Newton JN, Fenton KA, Anderson HR, Atkinson C,
Bennett D, Bernabé E, Blencowe H, Bourne R, Braithwaite T, Brayne C, Bruce NG, Brugha TS, Burney P, Dherani M, Dolk H, Edmond K, Ezzati M, Flaxman AD, Fleming TD, Freedman G, Gunnell D, Hay RJ, Hutchings SJ, Ohno SL, Lozano R, Lyons RA, Marcenes W, Naghavi M, Newton CR, Pearce N, Pope D, Rushton L, Salomon JA, Shibuya K, Vos T, Wang H, Williams HC, Woolf AD, Lopez AD, Davis A. UK health performance: findings of the Global Burden of Disease Study 2010. Lancet. 2013;381(9871):997-1020.
2. Noncommunicable diseases country profiles 2014: UK. World Health Organisation, Copenhagen. 2014. Available from: http://www.who.int/nmh/countries/gbr_en.pdf
3. UK Chief Medical Officers’ Low risk drinking guidelines. London: Department of Health; 2016. Available from: https://www.gov.uk/government/uploads/system/uploads/attachment_data/file/545937/UK_CMOs__report.pdf
4. Kojima G, Iliffe S, Walters K. Smoking as a predictor of frailty: a systematic review. BMC Geriatr. 2015;15:131.
5. Lee Y, Back JH, Kim J, Kim SH, Na DL, Cheong HK, Hong CH, Kim YG. Systematic review of health behavioral risks and cognitive health in older adults. Int Psychogeriatr. 2010;22(2):174-87.
6. Müezzinler A, Mons U, Gellert C, Schöttker B, Jansen E, Kee F, O’Doherty MG, Kuulasmaa K, Freedman ND, Abnet CC, Wolk A, Håkansson N, Orsini N, Wilsgaard T, Bueno-de-Mesquita B, van der Schouw YT, Peeters PHM, de Groot LCPGM, Peters A, Orfanos P, Linneberg A, Pisinger C, Tamosiunas A, Baceviciene M, Luksiene D, Bernotiene G, Jousilahti P, Petterson-Kymmer U, Jansson JH, Söderberg S, Eriksson S, Jankovic N, Sánchez MJ, Veronesi G, Sans S, Drygas W, Trichopoulou A, Boffetta P, Brenner H. Smoking and all-cause mortality in older adults: results from the CHANCES Consortium. Am J Prev Med. 2015;49(5):e53-e63.
7. Health Survey (NI) First results 2015/16. Belfast: Department of Health (Northern Ireland); 2016. Available from: https://www.health-ni.gov.uk/sites/default/files/publications/health/hsni-first-results-15-16.pdf
8. Department of Health, Physical Activity, Health Improvement and Protection. Start active, stay active: a report on physical activity for health from the four home Countries’ Chief Medical Officers. London: Department of Health; 2011.
9. Allender S, Foster C, Scarborough P, Rayner M. The burden of physical activity-related ill health in the UK. J Epidemiol Community Health. 2007;61(4):344-8.
182726 Nicola Study report__Wave__2.indb 64 20/11/2017 10:23
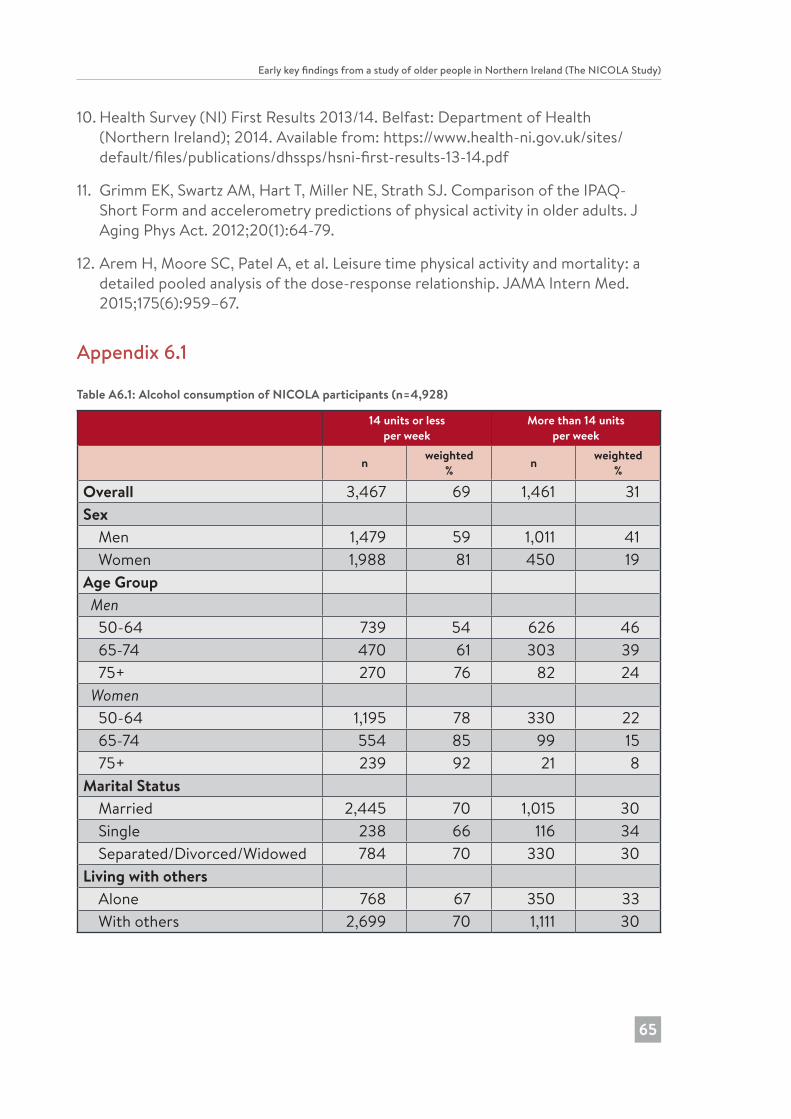
Early key findings from a study of older people in Northern Ireland (The NICOLA Study)
65
10. Health Survey (NI) First Results 2013/14. Belfast: Department of Health (Northern Ireland); 2014. Available from: https://www.health-ni.gov.uk/sites/default/files/publications/dhssps/hsni-first-results-13-14.pdf
11. Grimm EK, Swartz AM, Hart T, Miller NE, Strath SJ. Comparison of the IPAQ-Short Form and accelerometry predictions of physical activity in older adults. J Aging Phys Act. 2012;20(1):64-79.
12. Arem H, Moore SC, Patel A, et al. Leisure time physical activity and mortality: a detailed pooled analysis of the dose-response relationship. JAMA Intern Med. 2015;175(6):959–67.
Appendix 6.1
Table A6.1: Alcohol consumption of NICOLA participants (n=4,928)
14 units or lessper week
More than 14 unitsper week
n weighted % n weighted
%
Overall 3,467 69 1,461 31Sex Men 1,479 59 1,011 41 Women 1,988 81 450 19Age Group Men 50-64 739 54 626 46 65-74 470 61 303 39 75+ 270 76 82 24 Women 50-64 1,195 78 330 22 65-74 554 85 99 15 75+ 239 92 21 8Marital Status Married 2,445 70 1,015 30 Single 238 66 116 34 Separated/Divorced/Widowed 784 70 330 30Living with others Alone 768 67 350 33 With others 2,699 70 1,111 30
182726 Nicola Study report__Wave__2.indb 65 20/11/2017 10:23
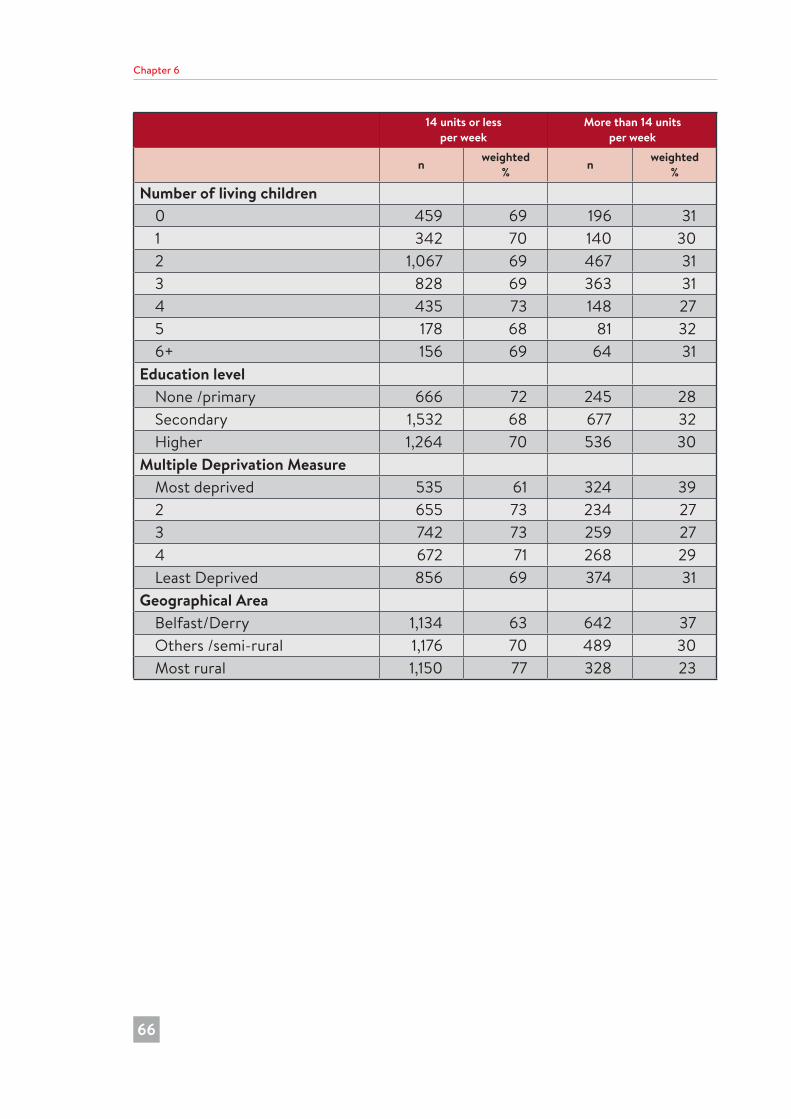
Chapter 6
66
14 units or lessper week
More than 14 unitsper week
n weighted % n weighted
%
Number of living children 0 459 69 196 31 1 342 70 140 30 2 1,067 69 467 31 3 828 69 363 31 4 435 73 148 27 5 178 68 81 32 6+ 156 69 64 31Education level None /primary 666 72 245 28 Secondary 1,532 68 677 32 Higher 1,264 70 536 30Multiple Deprivation Measure Most deprived 535 61 324 39 2 655 73 234 27 3 742 73 259 27 4 672 71 268 29 Least Deprived 856 69 374 31Geographical Area Belfast/Derry 1,134 63 642 37 Others /semi-rural 1,176 70 489 30 Most rural 1,150 77 328 23
182726 Nicola Study report__Wave__2.indb 66 20/11/2017 10:23
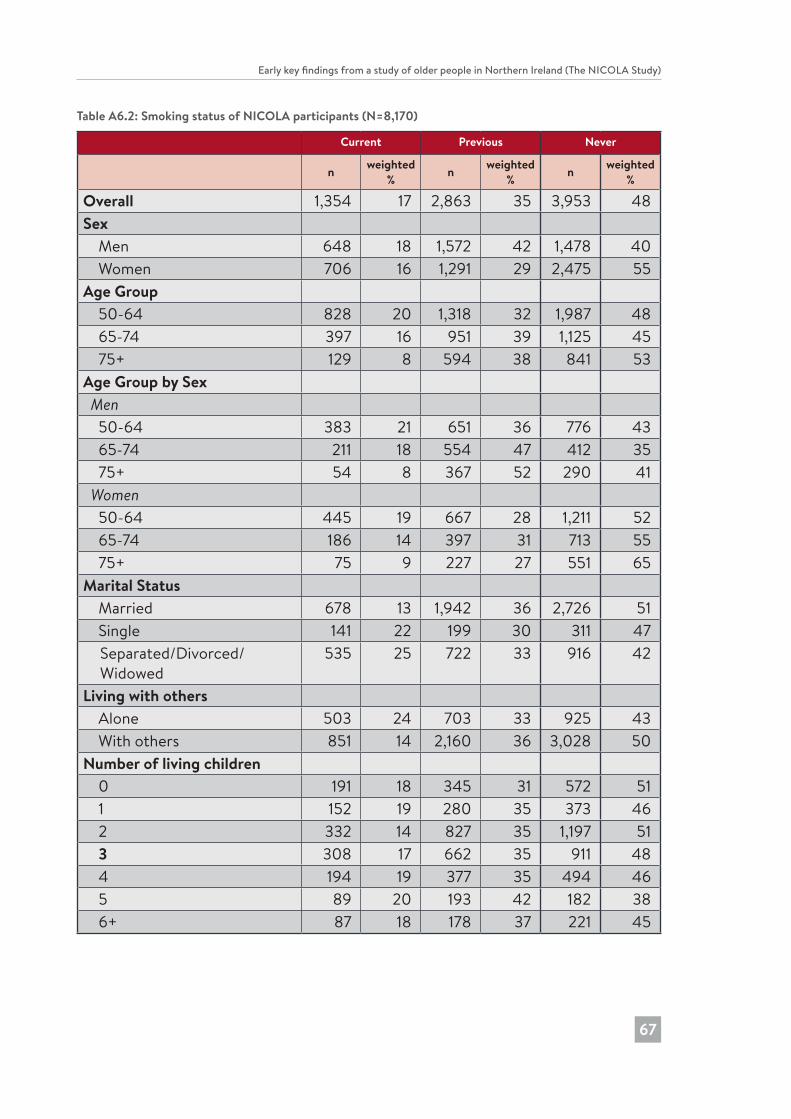
Early key findings from a study of older people in Northern Ireland (The NICOLA Study)
67
Table A6.2: Smoking status of NICOLA participants (N=8,170)
Current Previous Never
n weighted % n weighted
% n weighted %
Overall 1,354 17 2,863 35 3,953 48Sex Men 648 18 1,572 42 1,478 40 Women 706 16 1,291 29 2,475 55Age Group 50-64 828 20 1,318 32 1,987 48 65-74 397 16 951 39 1,125 45 75+ 129 8 594 38 841 53Age Group by Sex Men 50-64 383 21 651 36 776 43 65-74 211 18 554 47 412 35 75+ 54 8 367 52 290 41 Women 50-64 445 19 667 28 1,211 52 65-74 186 14 397 31 713 55 75+ 75 9 227 27 551 65Marital Status Married 678 13 1,942 36 2,726 51 Single 141 22 199 30 311 47
Separated/Divorced/ Widowed
535 25 722 33 916 42
Living with others Alone 503 24 703 33 925 43 With others 851 14 2,160 36 3,028 50Number of living children 0 191 18 345 31 572 51 1 152 19 280 35 373 46 2 332 14 827 35 1,197 51 3 308 17 662 35 911 48 4 194 19 377 35 494 46 5 89 20 193 42 182 38 6+ 87 18 178 37 221 45
182726 Nicola Study report__Wave__2.indb 67 20/11/2017 10:23
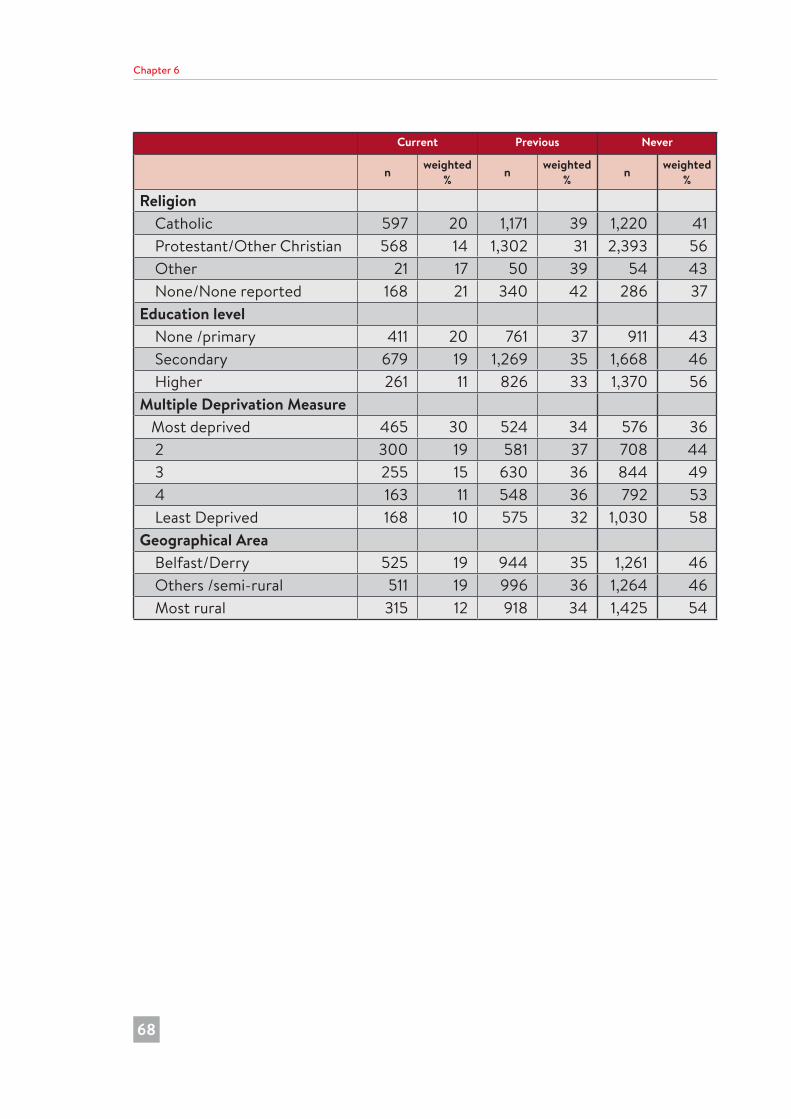
Chapter 6
68
Current Previous Never
n weighted % n weighted
% n weighted %
Religion Catholic 597 20 1,171 39 1,220 41 Protestant/Other Christian 568 14 1,302 31 2,393 56 Other 21 17 50 39 54 43 None/None reported 168 21 340 42 286 37Education level None /primary 411 20 761 37 911 43 Secondary 679 19 1,269 35 1,668 46 Higher 261 11 826 33 1,370 56Multiple Deprivation Measure Most deprived 465 30 524 34 576 36 2 300 19 581 37 708 44 3 255 15 630 36 844 49 4 163 11 548 36 792 53 Least Deprived 168 10 575 32 1,030 58Geographical Area Belfast/Derry 525 19 944 35 1,261 46 Others /semi-rural 511 19 996 36 1,264 46 Most rural 315 12 918 34 1,425 54
182726 Nicola Study report__Wave__2.indb 68 20/11/2017 10:23
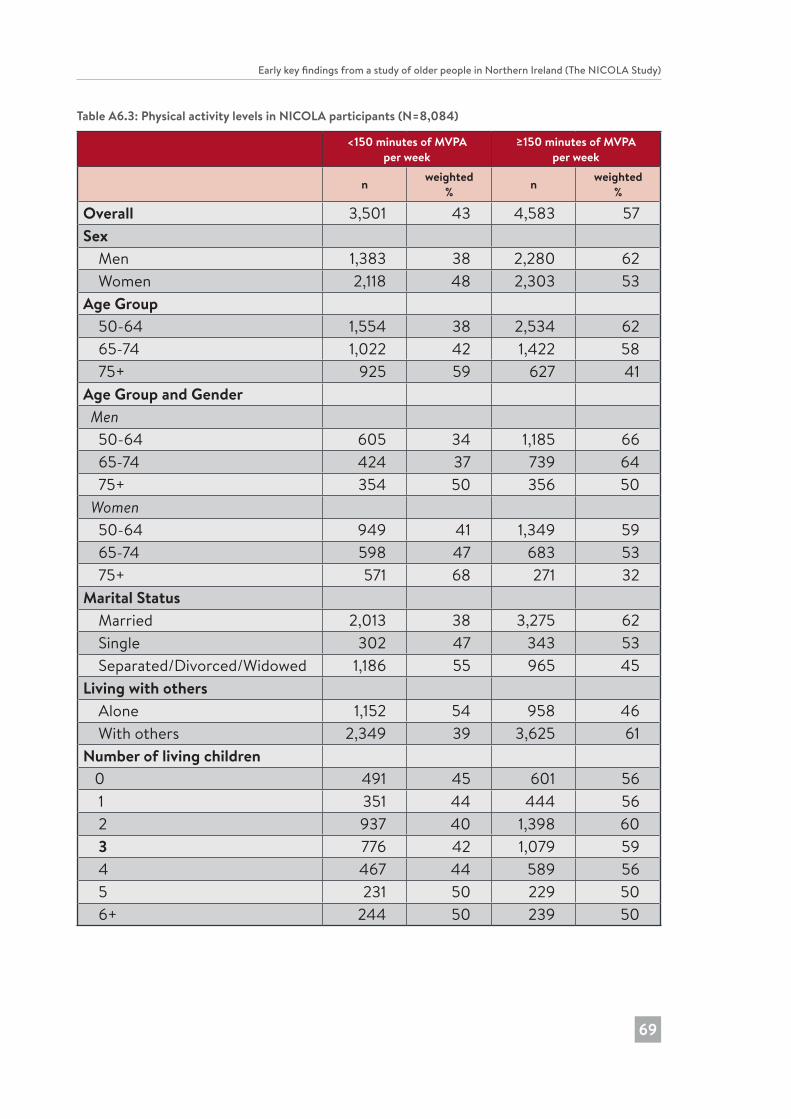
Early key findings from a study of older people in Northern Ireland (The NICOLA Study)
69
Table A6.3: Physical activity levels in NICOLA participants (N=8,084)
<150 minutes of MVPA per week
≥150 minutes of MVPA per week
n weighted % n weighted
%
Overall 3,501 43 4,583 57Sex Men 1,383 38 2,280 62 Women 2,118 48 2,303 53Age Group 50-64 1,554 38 2,534 62 65-74 1,022 42 1,422 58 75+ 925 59 627 41Age Group and Gender Men 50-64 605 34 1,185 66 65-74 424 37 739 64 75+ 354 50 356 50 Women 50-64 949 41 1,349 59 65-74 598 47 683 53 75+ 571 68 271 32Marital Status Married 2,013 38 3,275 62 Single 302 47 343 53 Separated/Divorced/Widowed 1,186 55 965 45Living with others Alone 1,152 54 958 46 With others 2,349 39 3,625 61Number of living children 0 491 45 601 56 1 351 44 444 56 2 937 40 1,398 60 3 776 42 1,079 59 4 467 44 589 56 5 231 50 229 50 6+ 244 50 239 50
182726 Nicola Study report__Wave__2.indb 69 20/11/2017 10:23
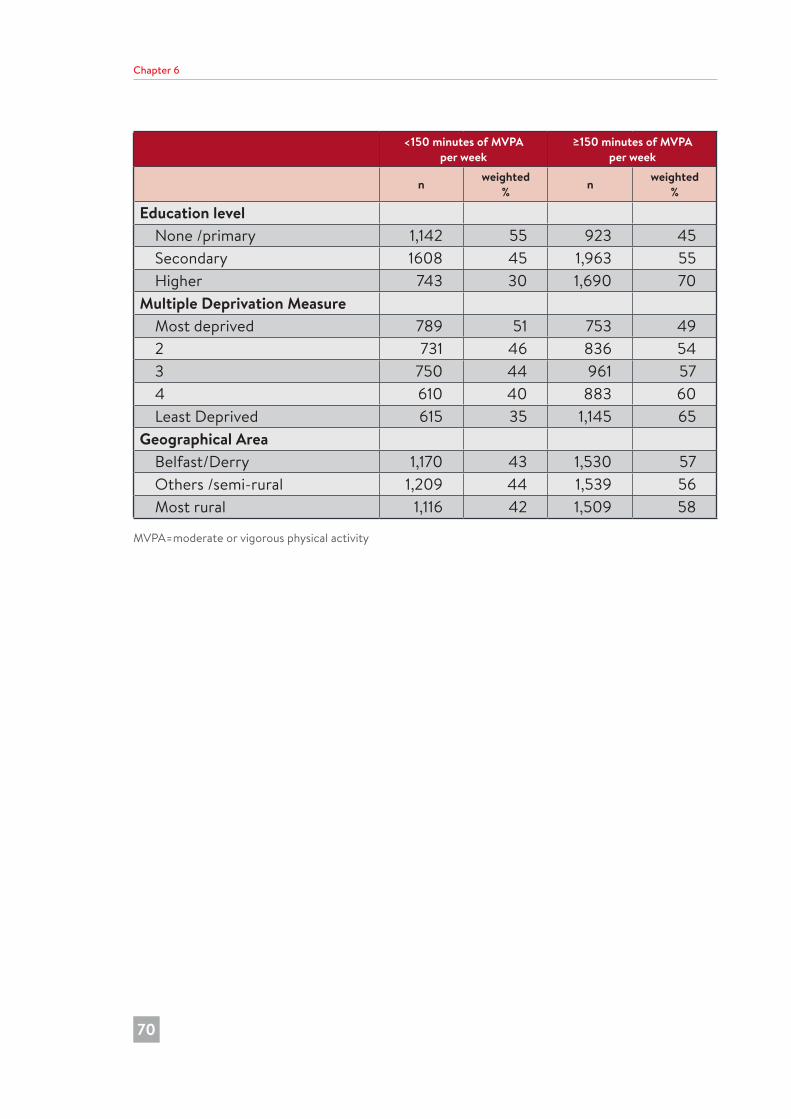
Chapter 6
70
<150 minutes of MVPA per week
≥150 minutes of MVPA per week
n weighted % n weighted
%
Education level None /primary 1,142 55 923 45 Secondary 1608 45 1,963 55 Higher 743 30 1,690 70Multiple Deprivation Measure Most deprived 789 51 753 49 2 731 46 836 54 3 750 44 961 57 4 610 40 883 60 Least Deprived 615 35 1,145 65Geographical Area Belfast/Derry 1,170 43 1,530 57 Others /semi-rural 1,209 44 1,539 56 Most rural 1,116 42 1,509 58
MVPA=moderate or vigorous physical activity
182726 Nicola Study report__Wave__2.indb 70 20/11/2017 10:23
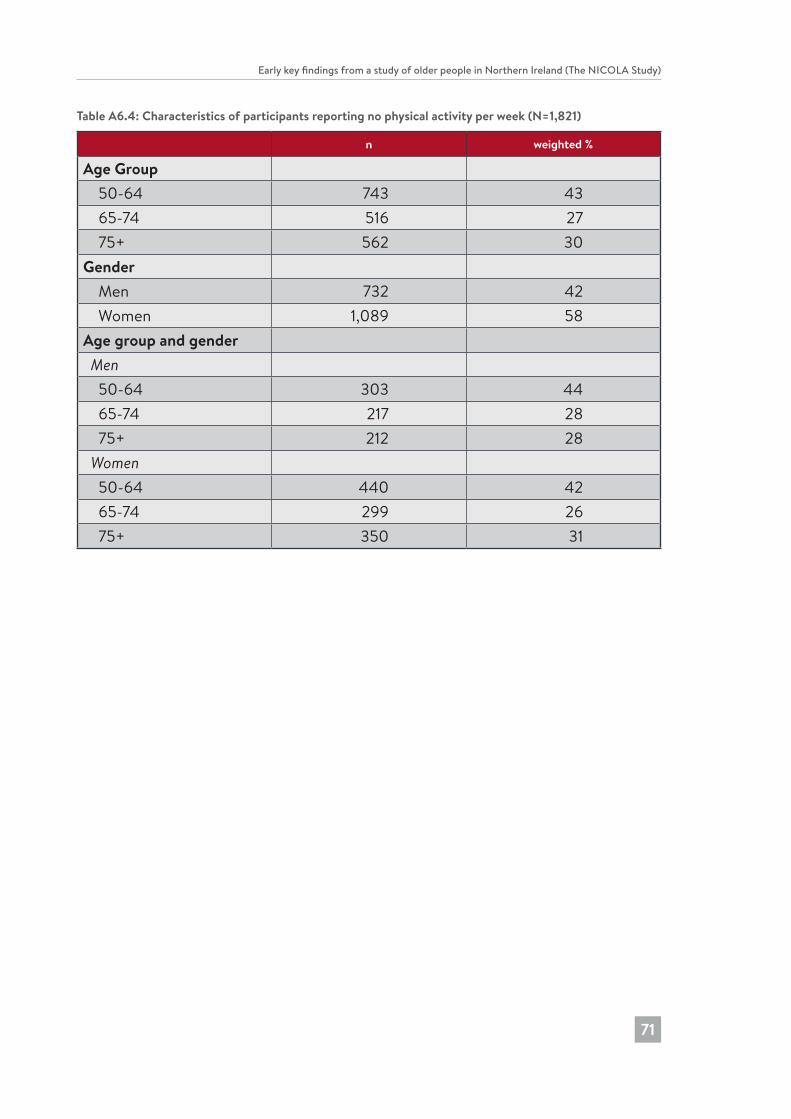
Early key findings from a study of older people in Northern Ireland (The NICOLA Study)
71
Table A6.4: Characteristics of participants reporting no physical activity per week (N=1,821)
n weighted %
Age Group 50-64 743 43 65-74 516 27 75+ 562 30Gender Men 732 42 Women 1,089 58Age group and gender Men 50-64 303 44 65-74 217 28 75+ 212 28 Women 50-64 440 42 65-74 299 26 75+ 350 31
182726 Nicola Study report__Wave__2.indb 71 20/11/2017 10:23

7 Variations in self-reported health status
Chapter 7
72
Dermot O’Reilly and Sharon CruiseKey Findings
• Over one third of participants reported a limiting long-term illness (LLTI).
• The prevalence of LLTI, and limitations in ADL and IADL, rose with increasing age.
• Women reported slightly higher rates of limitations in IADL (20% compared to 14% for men), and slightly higher rates of fair or poor mental health (20% compared to 17% for men).
• 51% of participants reported very good or excellent self-reported mental health; only 5% reported poor mental health.
• Fair or poor self-reported mental health was higher in the youngest age group (23%) compared to the oldest age group (13%).
• On all measures of self-reported health, married or co-habiting participants reported the best health.
• All measures of self-reported health showed a clear socio-economic status gradient; in general, the excess poor health between the most and least affluent areas was around 50%.
• Generally, the health of participants living in the most rural areas was about 4-5 percentage points better than those in the most urban or intermediate areas.
182726 Nicola Study report__Wave__2.indb 72 20/11/2017 10:23
Early key findings from a study of older people in Northern Ireland (The NICOLA Study)
73
IntroductionIn this chapter we describe the variations in self-reported health across the NICOLA cohort members and how these are related to demographic factors such as age, sex and marital status, and also to measures of socio-economic status and area of residence.
It is important to have a good understanding of the distributions of different measures of health status throughout society as these are the major determinants of need for health and caring services, including support from family and friends. In future reports we will use a more detailed examination of these data to better understand the factors that influence healthy ageing and well-being. We will also link health data from consecutive waves of the NICOLA study to see how well people in Northern Ireland are ageing and to provide clues as to which factors are associated with health maintenance or decline. These data will also enable us to undertake comparisons against our sister ageing cohorts in other countries to see how older people in Northern Ireland fare in comparison to their peers elsewhere. A comparison of health data such as presented here will be useful to relate to the data on health and social service use in Chapter 8 to give an indication of equality of access to and use of health services.
MeasuresAll of the five measures reported here, though common to other ageing studies, are based on self-report and are therefore subject to some variations arising from differences in perception and reporting. It is recognised that they constitute ‘something more and something less than clinical judgement’ (1), and while not ‘objective’ are yet known to be very strong indicators of future health status, mortality risk and need for health services (2).
Participants were asked about health in general and then about mental health: ‘Would you say your health is…?..’ and then ‘What about your emotional or mental health? Is it…’, with a range of five response options … excellent, very good, good, fair, or, poor.
Long-term limiting illness was derived from participants’ responses to the following questions:
‘Some people suffer from chronic or long-term health problems. By long-term we mean it has troubled you over a period of time or is likely to affect you over a period of time. Do you have any long-term health problems, illness, disability or infirmity?’
A positive answer to this was followed by … ‘Does this illness or disability limit your activities in any way?’. From responses to these two questions we were able to establish those participants who had no long-term illness, those who had a long-term illness that did not limit their activities, and those who had a long-term illness that limited their activities.
182726 Nicola Study report__Wave__2.indb 73 20/11/2017 10:23
Chapter 7
74
Limitations in activities of daily living (ADL) was derived from a question asking whether the participant had difficulty with six domains of basic, day-to-day activities as a result of a health or memory problem. The six domains included: dressing, walking across a room, bathing/showering, eating (e.g., cutting up food), getting in or out of bed, and toileting. If the participant indicated difficulty with any one of these activities they were deemed to have a limitation in ADL.
Limitations in instrumental activities of daily living (IADL) was derived from a question asking whether the participant had difficulty with six domains of daily instrumental activities as a result of a health or memory problem. The six domains included: preparing a hot meal, doing household chores, grocery shopping, making telephone calls, taking medications, and managing money (e.g., paying bills, budgeting). If the participant indicated difficulty with any one of these activities they were deemed to have a limitation in IADL.
Weighting (based on age, sex and region) was applied to all analyses in order to address any response bias in the home interview. Therefore, proportions (percentages) presented here are based on a sample that has been adjusted in order to provide estimates that are representative of men and women aged 50 years and over in Northern Ireland (see Chapters 2 and 9 for further details of NICOLA’s weighting protocol).
There was a reasonable correspondence between general and physical measures of health but less so with mental health. For example 71% of those with a limiting long-term illness said their general health was fair or poor, but the majority (64%) reported good or better mental health. Similarly, 83% of people with a limitation in ADL also reported a limiting long-term illness and 77% said their general health was fair or poor. However, the majority (59%) reported that their mental health was good or better.
Variations with ageTable A7.1 shows how health varies with age according to each of the five measures of health. For general health, most people consider themselves to be in the middle of the distribution: 28% reported ‘good’ health and just over 10% reported that their health was excellent or poor. The variations from the youngest to the oldest age groups were modest, with a reduction from 14% to 8% reporting excellent health but little change in the proportion reporting poor health. Most of the age-related changes were in the proportions reporting fair health. It is known that when people are asked to rate their overall general health, most older people compare themselves to their peers (3), and compared with younger persons they do not rely so much on the extent of physical symptoms to evaluate their health (4). Collectively, these tendencies may explain why the more general measures remain relatively stable with increasing age despite the more obvious declines that are seen with other more objective health measures.
182726 Nicola Study report__Wave__2.indb 74 20/11/2017 10:23
Early key findings from a study of older people in Northern Ireland (The NICOLA Study)
75
Over one third of participants reported that they had a long-term illness that limited their activities, and in contrast to general health, this measure showed a stronger age gradient: for example, 45% reported having no long-term illness at 75 years and over, compared to 53% with no long-term illness at 50-64 years. A similar pattern was seen with ADL and IADL: for example, 17% reported limitations in at least one ADL, but this increased from 15% in the youngest age group to 23% in the oldest age group.
Mental health presents a different pattern. Fifty percent of participants said that their mental health was either excellent or very good and only 5% reported poor mental health. The relationship between mental health and age differs from most of the physical measures, with higher proportions of younger rather than older people in the cohort reporting fair or poor mental health (23% and 13% respectively). Again, this may be because people place less emphasis on physical health in their self-assessment of general well-being as they age, though it is also recognised that there may be a reluctance to identify and report issues related to mental health (5).
Variations by sexIn terms of physical health, men and women tend to report fairly similar levels of ill-health: for example, 33% of men and 36% of women reported a limiting long-term illness, and 17% of men and women reported limitations in at least one ADL, though women were slightly more likely to report limitations in at least one IADL (20% and 14% respectively). Women were slightly more likely than men to report very good or excellent general health (38% compared to 35%) and slightly more likely to report fair or poor mental health (20% compared to 17% respectively). The gender difference in mental well-being is well recognised, and some of these differences may be due to perception and reporting differences between the sexes (6).
Variations by marital statusHealth also varies by marital status (Table A7.2). On all measures, participants who were married or co-habiting reported better health than any of the other marital status groups. Those who were single or had never married were more likely than married/co-habiting participants to report their general health or mental health as fair or poor (41% compared to 31% and 27% compared to 15% respectively), and to report having a limiting long-term illness (40% compared to 30%). Almost one quarter of those who were separated/divorced or widowed reported at least one limitation in ADL. Separated/divorced participants had the highest rates of fair or poor mental health (32%), more than double that of the married/co-habiting group (15%), and were also more likely than widowed participants to report their general health or mental health as fair or poor (47% compared to 42% and 32% compared to 19% respectively).
182726 Nicola Study report__Wave__2.indb 75 20/11/2017 10:23
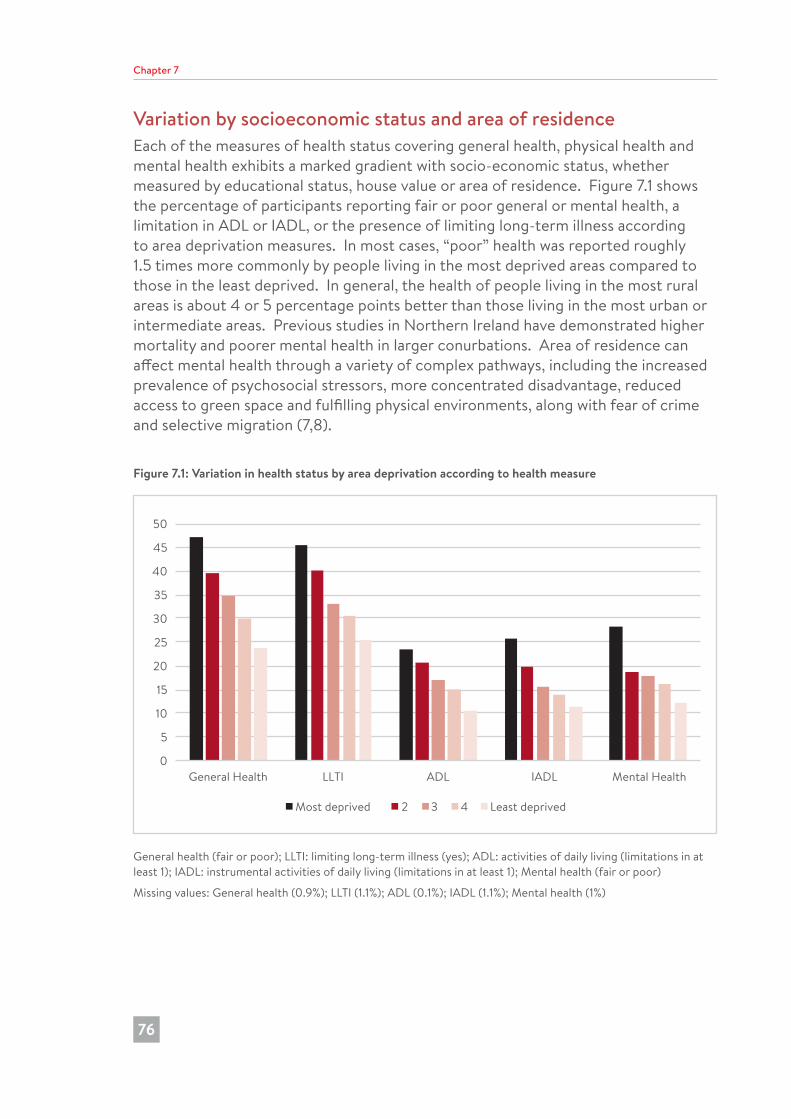
Chapter 7
76
Variation by socioeconomic status and area of residenceEach of the measures of health status covering general health, physical health and mental health exhibits a marked gradient with socio-economic status, whether measured by educational status, house value or area of residence. Figure 7.1 shows the percentage of participants reporting fair or poor general or mental health, a limitation in ADL or IADL, or the presence of limiting long-term illness according to area deprivation measures. In most cases, “poor” health was reported roughly 1.5 times more commonly by people living in the most deprived areas compared to those in the least deprived. In general, the health of people living in the most rural areas is about 4 or 5 percentage points better than those living in the most urban or intermediate areas. Previous studies in Northern Ireland have demonstrated higher mortality and poorer mental health in larger conurbations. Area of residence can affect mental health through a variety of complex pathways, including the increased prevalence of psychosocial stressors, more concentrated disadvantage, reduced access to green space and fulfilling physical environments, along with fear of crime and selective migration (7,8).
Figure 7.1: Variation in health status by area deprivation according to health measure
0
5
10
15
20
25
30
35
40
45
50
General Health LLTI ADL IADL Mental Health
Most deprived 2 3 4 Least deprived
General health (fair or poor); LLTI: limiting long-term illness (yes); ADL: activities of daily living (limitations in at least 1); IADL: instrumental activities of daily living (limitations in at least 1); Mental health (fair or poor)
Missing values: General health (0.9%); LLTI (1.1%); ADL (0.1%); IADL (1.1%); Mental health (1%)
182726 Nicola Study report__Wave__2.indb 76 20/11/2017 10:23
Early key findings from a study of older people in Northern Ireland (The NICOLA Study)
77
ConclusionsThe findings on self-reported health in the NICOLA Wave 1 study demonstrate a close association between the various measures of self-reported physical health, with the exception of self-reported mental health. This is to be expected given that self-reports of general health, limiting long-term illness and limitations of ADL and IADL are focused more on physical than mental/emotional health. Interestingly, self-reported general health showed a normal distribution which remained constant across age groups.
The increasing prevalence of poor self-reported health (general and physical) with advancing age and increasing socio-economic disadvantage is consistent with findings in the other ageing cohorts. It is reassuring that only 5% of NICOLA participants reported experiencing poor mental health, though it will be important to establish how this single-item measure of mental health corresponds to multi-item measures of mental health and well-being that will be available when the health assessment component of the Wave 1 NICOLA study is complete. Future analyses will also examine associations between self-reported health and objective measures of health when this data becomes available. This will also allow for a more detailed examination of the patterns of health status according to socio-demographic and socio-economic indicators that were observed in this chapter.
References1. Maddox G, Douglas E. Self-assessment of health: a longitudinal study of elderly
subjects. J Health Soc Behav. 1973;14:87-93.
2. Idler EL, Angel RJ. Self-rated health and mortality in the NHANES-I Epidemiologic Follow-up Study. Am J Public Health. 1990;80:446-52. doi: 10.2105/AJPH.80.4.446.
3. Leinonen R, Heikkinen E, Jylha M. Self-rated health and self-assessed change in health in elderly men and women – A five year longitudinal study. Soc Sci Med. 1998;46:591-97.
4. Cheng ST, Fung H, Chan A. Maintaining self-rated health through social comparison in old age. J Gerontol B Psychol Sci Soc Sci. 2007;62:277-85.
5. Corrigan P. How stigma interferes with mental health care. Am Psychol. 2004;59:614-25.
6. Green C, Pope CR. Gender, psychosocial factors and the use of medical services: a longitudinal analysis. Soc Sci Med. 1999;48:1363-72.
7. O’ Reilly G, O’ Reilly D, Connolly S, Rosato M. Urban and rural variations in morbidity and mortality in Northern Ireland. BMC Public Health. 2007;7:123.
182726 Nicola Study report__Wave__2.indb 77 20/11/2017 10:23
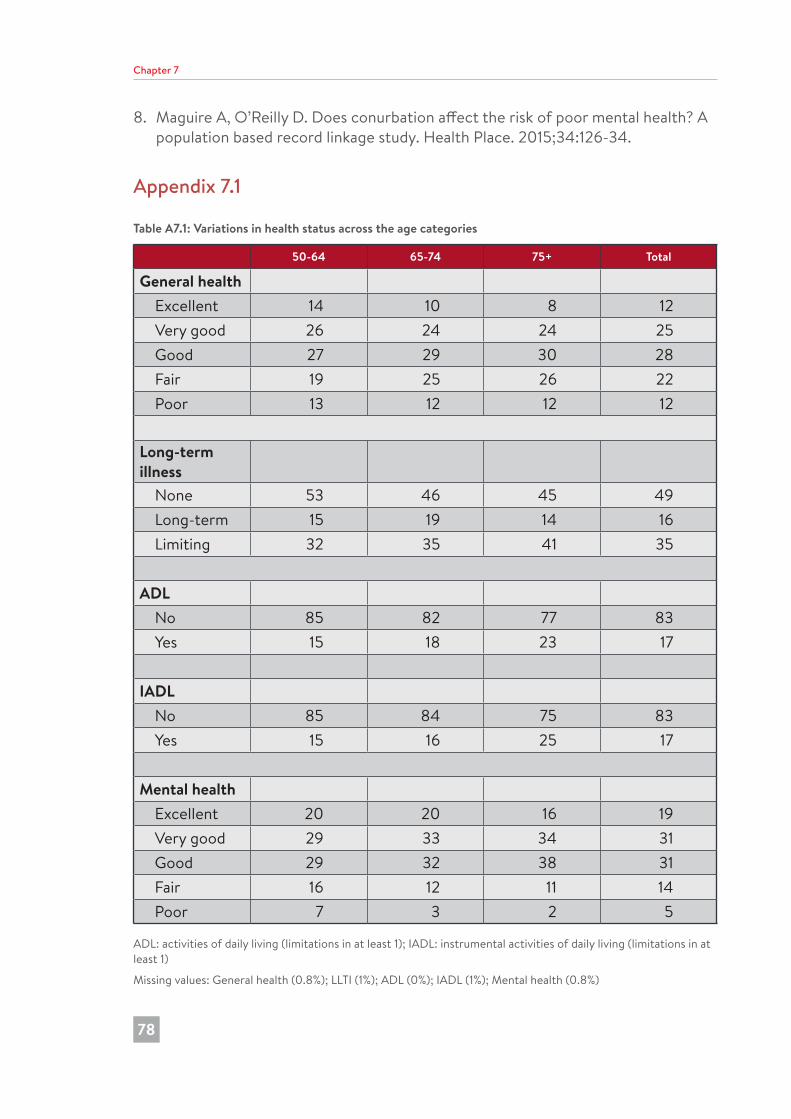
Chapter 7
78
8. Maguire A, O’Reilly D. Does conurbation affect the risk of poor mental health? A population based record linkage study. Health Place. 2015;34:126-34.
Appendix 7.1
Table A7.1: Variations in health status across the age categories
50-64 65-74 75+ Total
General health Excellent 14 10 8 12 Very good 26 24 24 25 Good 27 29 30 28 Fair 19 25 26 22 Poor 13 12 12 12
Long-term illness None 53 46 45 49 Long-term 15 19 14 16 Limiting 32 35 41 35
ADL No 85 82 77 83 Yes 15 18 23 17
IADL No 85 84 75 83 Yes 15 16 25 17
Mental health Excellent 20 20 16 19 Very good 29 33 34 31 Good 29 32 38 31 Fair 16 12 11 14 Poor 7 3 2 5
ADL: activities of daily living (limitations in at least 1); IADL: instrumental activities of daily living (limitations in at least 1)
Missing values: General health (0.8%); LLTI (1%); ADL (0%); IADL (1%); Mental health (0.8%)
182726 Nicola Study report__Wave__2.indb 78 20/11/2017 10:23
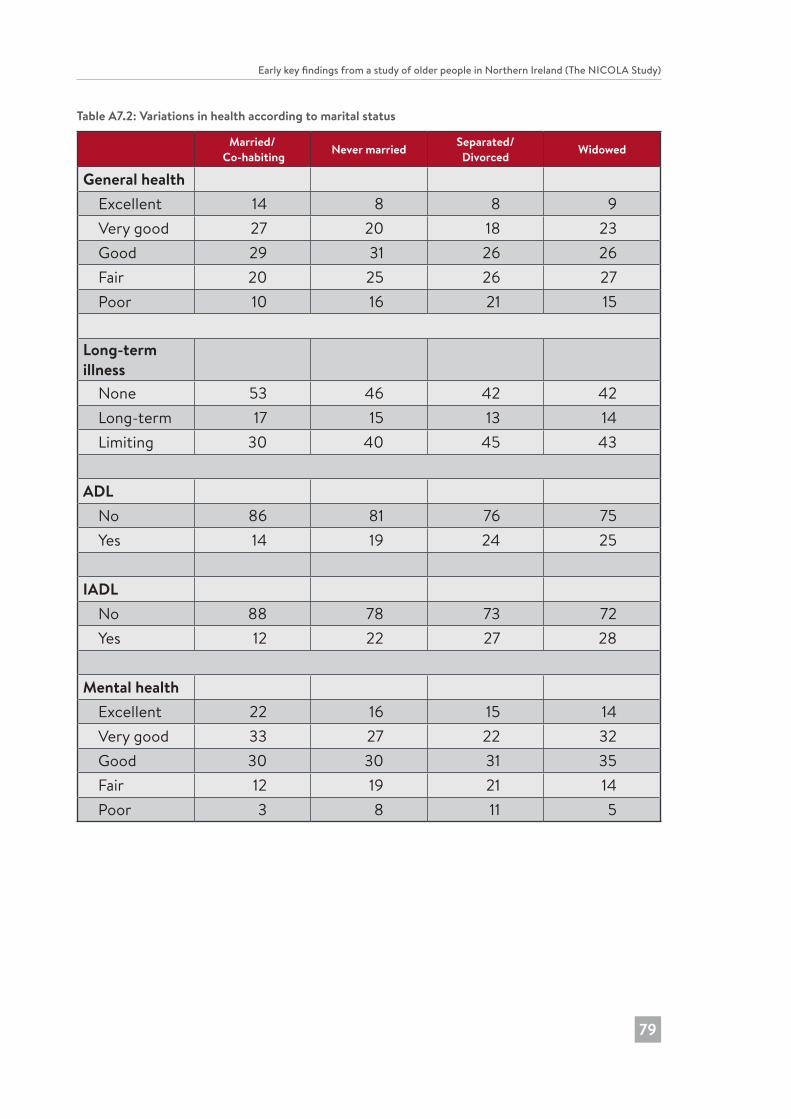
Early key findings from a study of older people in Northern Ireland (The NICOLA Study)
79
Table A7.2: Variations in health according to marital status
Married/ Co-habiting Never married Separated/
Divorced Widowed
General health Excellent 14 8 8 9 Very good 27 20 18 23 Good 29 31 26 26 Fair 20 25 26 27 Poor 10 16 21 15
Long-term illness None 53 46 42 42 Long-term 17 15 13 14 Limiting 30 40 45 43
ADL No 86 81 76 75 Yes 14 19 24 25
IADL No 88 78 73 72 Yes 12 22 27 28
Mental health Excellent 22 16 15 14 Very good 33 27 22 32 Good 30 30 31 35 Fair 12 19 21 14 Poor 3 8 11 5
182726 Nicola Study report__Wave__2.indb 79 20/11/2017 10:23
8 Health service utilisation by older people
Chapter 8
80
Michael Donnelly, Sharon Cruise and Dermot O’ReillyKey Findings
• More than 80% of NICOLA participants reported that they visited their GP at least once in the previous 12 months.
• There was relatively modest use of hospital outpatient clinics (46% of participants), inpatient services (20%) and the Emergency Department (20%).
• The use of secondary care (and higher cost) services increased slightly with age.
• Older people in NICOLA who lived in areas deemed to have the most (compared to the least) social deprivation reported the highest use of each service.
• Participants who had the highest service utilisation level reported poor health, had difficulties undertaking basic activities and/or instrumental activities of daily living and/or had a limiting long-term illness.
• Generally, NICOLA study participants reported approximately similar patterns of service utilisation as those in the TILDA study.
182726 Nicola Study report__Wave__2.indb 80 20/11/2017 10:23
Early key findings from a study of older people in Northern Ireland (The NICOLA Study)
81
IntroductionThis chapter presents a first look at the use of key health services by NICOLA participants. The study of health service utilisation is important because we need to improve our understanding about who uses which services and how often, the nature and degree of the match between the health status and needs of older people and their use of health services, and the efficiency of service organisation and delivery (1). This chapter presents an early analysis of the use of health services only. Utilisation of social care and informal care will be addressed in a subsequent NICOLA report in the context of a comprehensive and detailed analysis of different types of care provision and related factors. In order to ensure the results presented here are representative of the Northern Ireland population aged 50 years and over, all analyses were adjusted using a weighting variable (based on age, sex and region; see also Chapters 2 and 9 for further details of weighting).
Measures of health service utilisation, health and functioningNICOLA participants were asked how often in the past year they visited or used the following key health services: a General Practitioner (GP), an Emergency Department (ED) and a hospital as an inpatient or outpatient. This first analysis presents the results in terms of whether or not participants reported that they had used a given service on one occasion at least in the past year; and then this result is presented according to key variables such as age, sex and marital status.
Participants were asked also to rate their current health status in terms of being (1) excellent, (2) very good, (3) good, (4) fair or (5) poor (see Chapter 7 for further discussion). In this first analysis, we have adopted a similar method of coding as used in the TILDA study: response options 1 to 3 were combined to form a ‘good health’ category and response options 4 and 5 were combined to form a ‘poor health’ category.
The following categories or groups of NICOLA participants were derived from responses to questions about the presence of a long-term illness (LTI) or disability and whether or not any LTI limited their activities of daily living: (i) participants without a LTI (‘No LTI’); (ii) participants with a LTI that did not limit their activities (‘LTI only’); and (iii) participants with a long-term illness that did limit their activities (‘LLTI’). See Figure 8.3 for a diagrammatic presentation of these categories.
Participants were categorised into ‘No ADL’ (limitations) or ‘ADL’ (limitations) according to whether or not they reported that they had difficulty undertaking any of the basic activities of daily living (e.g., dressing, toileting and eating). Similarly, they were categorised into ‘No IADL’ (limitations) or ‘IADL’ (limitations) with respect to undertaking instrumental activities of daily living (e.g., shopping, cooking and money management). In turn, these responses were combined into the following categories: (i) ‘No ADL or IADL’ (limitations); (ii) ‘ADL only’; (iii) ‘IADL only’; and (iv) ‘Both ADL
182726 Nicola Study report__Wave__2.indb 81 20/11/2017 10:23
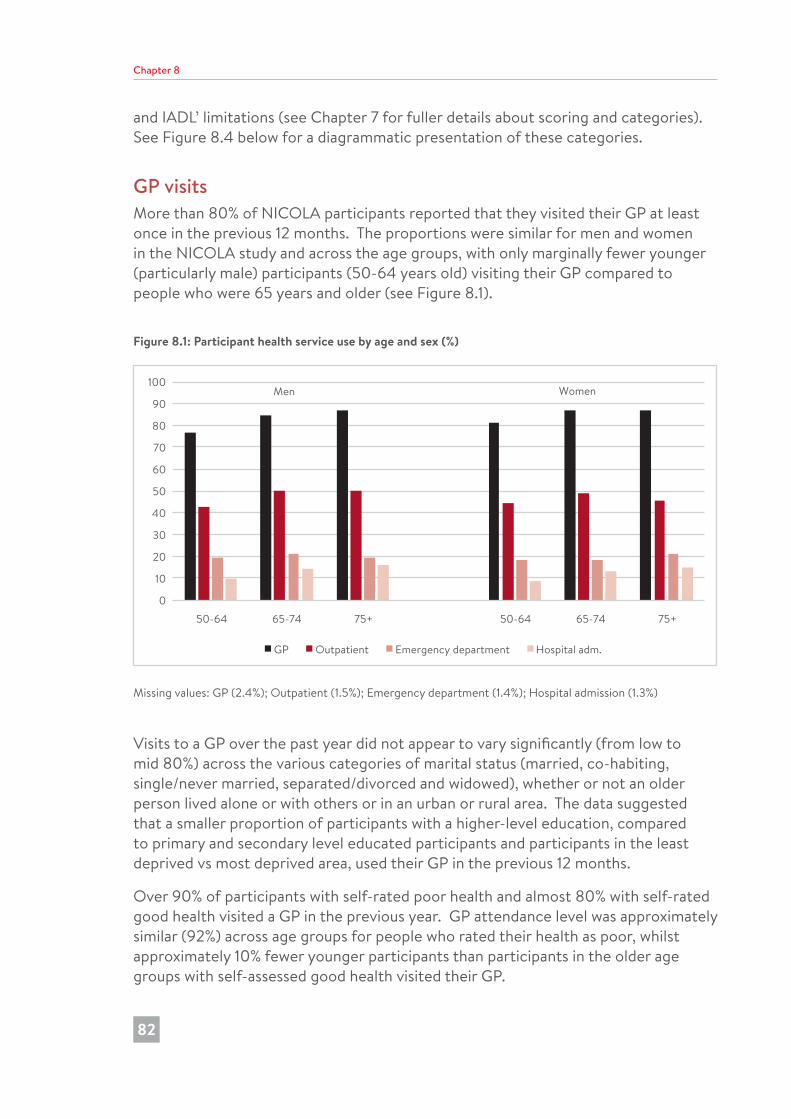
Chapter 8
82
and IADL’ limitations (see Chapter 7 for fuller details about scoring and categories). See Figure 8.4 below for a diagrammatic presentation of these categories.
GP visitsMore than 80% of NICOLA participants reported that they visited their GP at least once in the previous 12 months. The proportions were similar for men and women in the NICOLA study and across the age groups, with only marginally fewer younger (particularly male) participants (50-64 years old) visiting their GP compared to people who were 65 years and older (see Figure 8.1).
Figure 8.1: Participant health service use by age and sex (%)
0
10
20
30
40
50
60
70
80
90
100
50-64 65-74 75+ 50-64 65-74 75+
GP Outpatient Emergency department Hospital adm.
Men Women
Missing values: GP (2.4%); Outpatient (1.5%); Emergency department (1.4%); Hospital admission (1.3%)
Visits to a GP over the past year did not appear to vary significantly (from low to mid 80%) across the various categories of marital status (married, co-habiting, single/never married, separated/divorced and widowed), whether or not an older person lived alone or with others or in an urban or rural area. The data suggested that a smaller proportion of participants with a higher-level education, compared to primary and secondary level educated participants and participants in the least deprived vs most deprived area, used their GP in the previous 12 months.
Over 90% of participants with self-rated poor health and almost 80% with self-rated good health visited a GP in the previous year. GP attendance level was approximately similar (92%) across age groups for people who rated their health as poor, whilst approximately 10% fewer younger participants than participants in the older age groups with self-assessed good health visited their GP.
182726 Nicola Study report__Wave__2.indb 82 20/11/2017 10:23
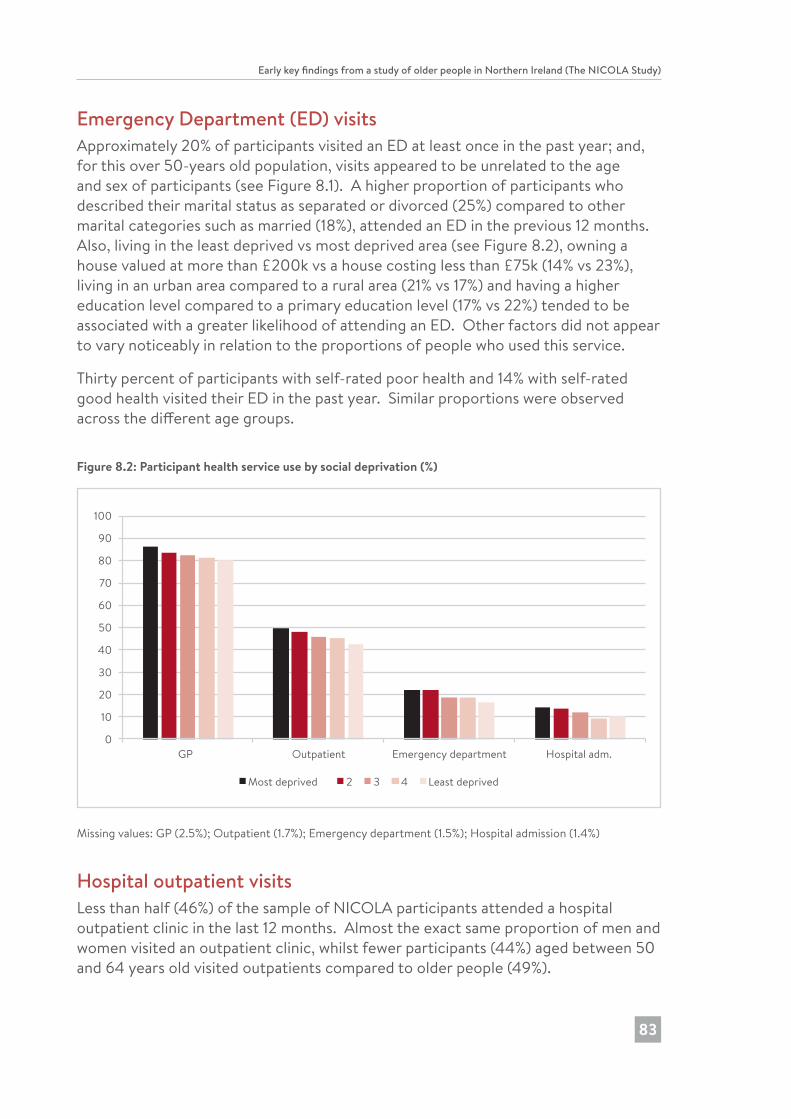
Early key findings from a study of older people in Northern Ireland (The NICOLA Study)
83
Emergency Department (ED) visitsApproximately 20% of participants visited an ED at least once in the past year; and, for this over 50-years old population, visits appeared to be unrelated to the age and sex of participants (see Figure 8.1). A higher proportion of participants who described their marital status as separated or divorced (25%) compared to other marital categories such as married (18%), attended an ED in the previous 12 months. Also, living in the least deprived vs most deprived area (see Figure 8.2), owning a house valued at more than £200k vs a house costing less than £75k (14% vs 23%), living in an urban area compared to a rural area (21% vs 17%) and having a higher education level compared to a primary education level (17% vs 22%) tended to be associated with a greater likelihood of attending an ED. Other factors did not appear to vary noticeably in relation to the proportions of people who used this service.
Thirty percent of participants with self-rated poor health and 14% with self-rated good health visited their ED in the past year. Similar proportions were observed across the different age groups.
Figure 8.2: Participant health service use by social deprivation (%)
0
10
20
30
40
50
60
70
80
90
100
GP Outpatient Emergency department Hospital adm.
Most deprived 2 3 4 Least deprived
Missing values: GP (2.5%); Outpatient (1.7%); Emergency department (1.5%); Hospital admission (1.4%)
Hospital outpatient visitsLess than half (46%) of the sample of NICOLA participants attended a hospital outpatient clinic in the last 12 months. Almost the exact same proportion of men and women visited an outpatient clinic, whilst fewer participants (44%) aged between 50 and 64 years old visited outpatients compared to older people (49%).
182726 Nicola Study report__Wave__2.indb 83 20/11/2017 10:23
Chapter 8
84
Approximately 5% more participants who described their marital status as separated or divorced compared to other marital categories attended an outpatient clinic over the past year. Similarly, participants living in an urban area (compared to a rural area) and those living in the least deprived vs most deprived area were more likely to have visited outpatients. Other variables did not appear to vary noticeably in relation to the proportions of people who used this service.
Among those who rated their health as poor, attendance at an outpatient clinic was approximately similar (65%) across age groups, but among those who rated their health as good, attendance was lower among younger participants (33%) than among the older age groups (40%).
Hospital inpatient stayJust over one tenth (12%) of men and women reported that they had been admitted to hospital for at least one night in the previous year. Similar to the age pattern observed for GP visits and outpatient visits, 9% of participants in the 50-64 years category had a hospital inpatient stay compared to the higher proportions in the older age groups: 14% - 65-74 years and 16% - 75 years and older. Fewer participants who were described as cohabiting (8%) or married (11%) than participants in other marital status categories (14%) had been an inpatient in the previous year. The proportion that had a hospital admission in the previous year was lower among those living in a house valued at more than £200k vs a house costing less than £75k (9% vs 16%), and among those living in the least deprived vs most deprived area (10% vs 14%) or among those having a higher education level compared to a primary education level (10% vs 17%).
The proportion who have had a hospital admission was three times higher among those with poor self-rated health than among participants who perceived their health to be good (22% vs 7%). There did not appear to be notable age group differences in service use for participants with poor health, but among those with good health there were fewer younger participants (4%) compared to the two older age groups (8% and 11%) who had been hospital inpatients.
182726 Nicola Study report__Wave__2.indb 84 20/11/2017 10:23

Early key findings from a study of older people in Northern Ireland (The NICOLA Study)
85
Figure 8.3: Health service use according to a participant’s long-term illness (LTI) and whether or not their LTI limited the ability to undertake activities (LLTI) (%)
0
10
20
30
40
50
60
70
80
90
100
50-64 65-74 75+ 50-64 65-74 75+ 50-64 65-74 75+ 50-64 65-74 75+
GP Outpatient Emergency Department Hospital adm.
No LTI LTI LLTI
Missing values: GP (2.5%); Outpatient (1.7%); Emergency department (1.5%); Hospital admission (1.5%)
Health status is a major determinant of need for, and use of, health services. The relationship between self-reported health status and service use is described above. Figure 8.3 uses long-term illness (LTI) as an alternative measure of health status and shows that the influence of health with respect to service use varies across the age spectrum. Participants with a limiting long-term illness (LLTI) reported the highest utilisation level of each type of health service; and this level was fairly steady across different age bands. However, there appeared to be an age gradient regarding the level of service use for participants who reported a less severe level of disability (No LTI and LTI only).
182726 Nicola Study report__Wave__2.indb 85 20/11/2017 10:23
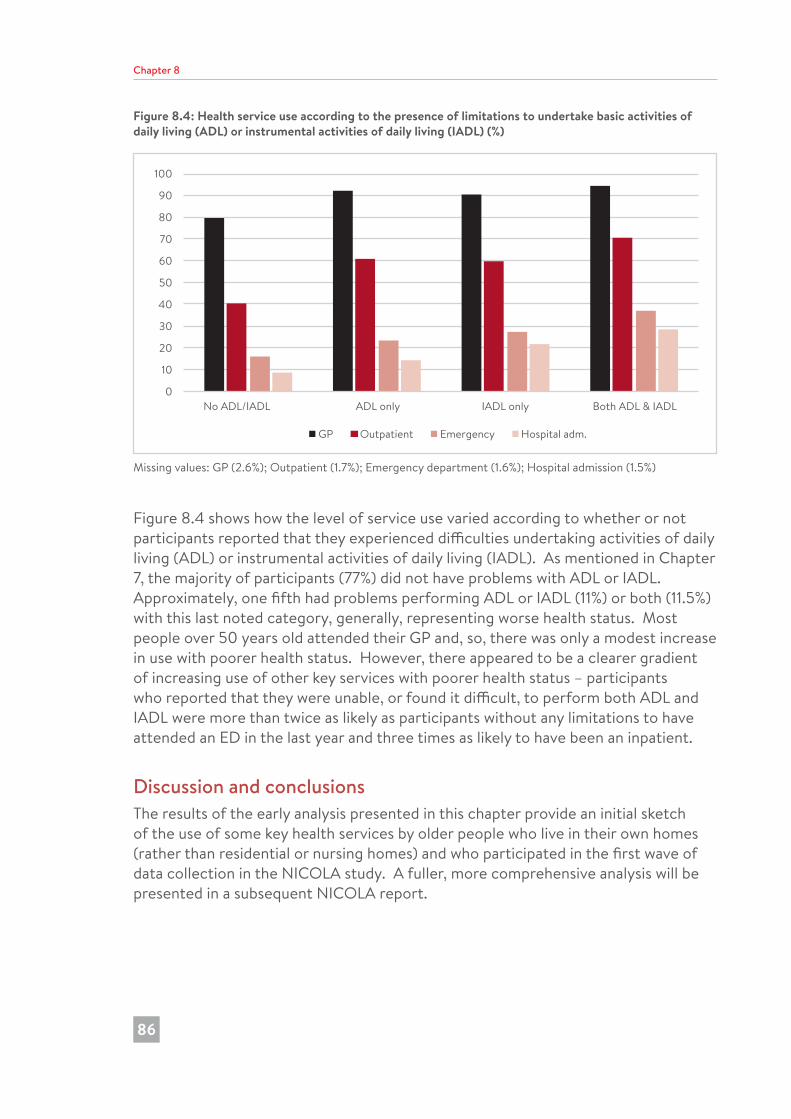
Chapter 8
86
Figure 8.4: Health service use according to the presence of limitations to undertake basic activities of daily living (ADL) or instrumental activities of daily living (IADL) (%)
0
10
20
30
40
50
60
70
80
90
100
No ADL/IADL ADL only IADL only Both ADL & IADL
GP Outpatient Emergency Hospital adm.
Missing values: GP (2.6%); Outpatient (1.7%); Emergency department (1.6%); Hospital admission (1.5%)
Figure 8.4 shows how the level of service use varied according to whether or not participants reported that they experienced difficulties undertaking activities of daily living (ADL) or instrumental activities of daily living (IADL). As mentioned in Chapter 7, the majority of participants (77%) did not have problems with ADL or IADL. Approximately, one fifth had problems performing ADL or IADL (11%) or both (11.5%) with this last noted category, generally, representing worse health status. Most people over 50 years old attended their GP and, so, there was only a modest increase in use with poorer health status. However, there appeared to be a clearer gradient of increasing use of other key services with poorer health status – participants who reported that they were unable, or found it difficult, to perform both ADL and IADL were more than twice as likely as participants without any limitations to have attended an ED in the last year and three times as likely to have been an inpatient.
Discussion and conclusionsThe results of the early analysis presented in this chapter provide an initial sketch of the use of some key health services by older people who live in their own homes (rather than residential or nursing homes) and who participated in the first wave of data collection in the NICOLA study. A fuller, more comprehensive analysis will be presented in a subsequent NICOLA report.
182726 Nicola Study report__Wave__2.indb 86 20/11/2017 10:23
Early key findings from a study of older people in Northern Ireland (The NICOLA Study)
87
Overall, differences between health service use and socio-demographic variables, including age, appear to be modest, at least based on this first look analysis though we have noted where results may suggest potentially important variations. Unsurprisingly and perhaps reassuringly, the results show that older people tend to visit their GP on a regular basis. The proportion (83%) is similar to results from comparable studies such as TILDA (2) in the Republic of Ireland (87%) despite the different care systems. A sizeable minority (just under one fifth) did not attend their GP and further analysis is underway to illuminate the profile of this subgroup of older people. Also, there was a suggestion in the results that younger male NICOLA participants were less likely than their older counterparts to visit their GP. More NICOLA participants than TILDA participants (20% vs 15%) visited an ED at least once in the past year. This may suggest easier access to EDs for NICOLA participants because service use does not require payment, though perhaps the comparatively small size of the difference is surprising. There was a hint also that more participants who were separated or divorced relative to other marital states tended to use services, particularly EDs and hospital outpatients. Some studies have found that changes or differences in marital status were related to changes in a range of behaviours, including health service utilisation (3), whilst other studies found that divorced/separated and widowed people tended to be more likely to have a chronic illness and to report higher service utilisation than married people (4). Slightly more NICOLA participants attended a hospital outpatient clinic in the last 12 months compared to TILDA participants (46% vs 40%); and a similar proportion of NICOLA and TILDA participants reported that they had been admitted to hospital for at least one night in the past year (12% vs 13%) (2). Thus, overall, there did not appear to be substantive differences between use of services by NICOLA and TILDA participants despite different health care systems. There appeared to be a modest general trend between variables such as social deprivation and lower levels of education and a slightly higher use of each service, including GP services. Also, generally, the younger group of NICOLA participants, particularly the men, tended to access and use services less than older NICOLA age groups. Age appears to be important as a determinant of health service utilisation but only in the context of, or alongside, several variables working together. Subsequent analyses will examine these relationships with respect to use of community care, including community health services which is where current policies see the need for greatest investment.
Approximately one third of participants self-reported poor health, one half had a long-term illness or limiting long-term illness (LLTI) and the majority (77%) did not report difficulties undertaking any daily living activities (see also Chapter 7). Service utilisation and self-rated health were related, though there appeared to be variation across services. Sizeable proportions of people with good health reported using each service: most participants visited their GP whether or not they perceived themselves to have good health or poor health; 14%, 36% and 7% of participants with self-rated good health attended respectively an ED, an outpatient clinic or had been admitted to hospital overnight. Further planned analyses will disentangle this set of
182726 Nicola Study report__Wave__2.indb 87 20/11/2017 10:23
Chapter 8
88
relationships. Generally, most studies indicate that self-rated health is a predictor of service utilisation (4). Health status as measured in terms of a limiting long-term illness (LLTI) compared to no LTI or a LTI that did not limit daily living was associated with use of the four key services. The fact that level of service use appeared to increase with age for participants with better health status (no LTI and LTI only) may be linked, in part, to service use for preventative and monitoring reasons such as vaccinations or health checks. A third form of health status assessment or functioning (which tends to be related to the ability to live fully independent lives) was whether or not participants were limited in terms of being able to undertake ADL or IADL. Only around 20% of participants reported limitations performing ADL, IADL or both; and older people with worse health status (in terms of having both ADL and IADL limitations) were more than twice as likely as participants without any limitations to have attended an ED in the last year and three times as likely to have been an inpatient. Following this first broad analysis, overall, there appeared to be a good match between service use and the health needs of NICOLA participants (as assessed using indicators such as self-rated health, ADL and LLTI).
References1. Rosenstock IM. Why people use health services. Millbank Memorial Fund.
1965;94-127.
2. Barrett A, Savva G, Timonen V, Kenny RA. Fifty plus in Ireland 2011: first results from The Irish Longitudinal Study on Ageing (TILDA). Dublin: TILDA, Trinity College Dublin; 2011.
3. Iwashyna TJ, Christakis NA. Marriage, widowhood and health care use. Soc Sci Med. 2003;57:2137-47.
4. Joung IM, van der Meer JB, Mackenbach JP. Marital status and health care utilisation. Int J Epidemiol. 1995;24:569-75.
182726 Nicola Study report__Wave__2.indb 88 20/11/2017 10:23
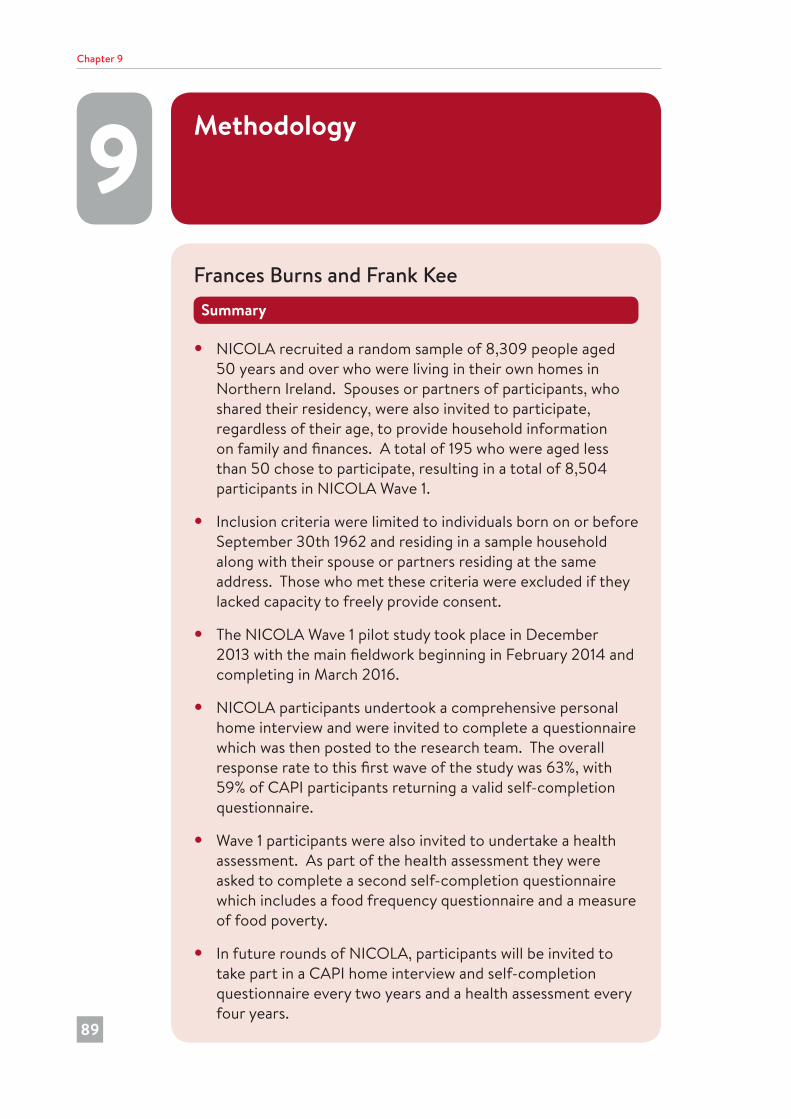
9 Methodology
Chapter 9
89
Frances Burns and Frank KeeSummary
• NICOLA recruited a random sample of 8,309 people aged 50 years and over who were living in their own homes in Northern Ireland. Spouses or partners of participants, who shared their residency, were also invited to participate, regardless of their age, to provide household information on family and finances. A total of 195 who were aged less than 50 chose to participate, resulting in a total of 8,504 participants in NICOLA Wave 1.
• Inclusion criteria were limited to individuals born on or before September 30th 1962 and residing in a sample household along with their spouse or partners residing at the same address. Those who met these criteria were excluded if they lacked capacity to freely provide consent.
• The NICOLA Wave 1 pilot study took place in December 2013 with the main fieldwork beginning in February 2014 and completing in March 2016.
• NICOLA participants undertook a comprehensive personal home interview and were invited to complete a questionnaire which was then posted to the research team. The overall response rate to this first wave of the study was 63%, with 59% of CAPI participants returning a valid self-completion questionnaire.
• Wave 1 participants were also invited to undertake a health assessment. As part of the health assessment they were asked to complete a second self-completion questionnaire which includes a food frequency questionnaire and a measure of food poverty.
• In future rounds of NICOLA, participants will be invited to take part in a CAPI home interview and self-completion questionnaire every two years and a health assessment every four years.
182726 Nicola Study report__Wave__2.indb 89 20/11/2017 10:23
Chapter 9
90
IntroductionChapter 1 described the background to, and objectives for the NICOLA study, and highlighted the comparability between the design of NICOLA and its ‘sister’ studies, the Health and Retirement Survey (HRS) in the US, the English Longitudinal Study of Ageing (ELSA) and The Irish Longitudinal Study on Ageing (TILDA). In order to ensure comparability across this family of studies in the core areas relevant to understanding ageing (e.g., health and well-being, social environment, socio-economic status), Wave 1 of the NICOLA study has incorporated design elements from other ageing cohorts, which are outlined in this chapter.
Target population and sampleIn order to create a sampling frame, the NICOLA study targeted an “eligible population”, defined as people aged 50 years or older and living in private residential accommodation in Northern Ireland. The Health and Social Care (HSC) Business Service Organisation (BSO) database was used as the source for the identifying addresses likely to contain eligible individuals. This information was obtained from the National Health Applications and Infrastructure Services (NHAIS) general practitioner (GP) list for Northern Ireland. The sample extract was based on the likelihood that there was someone aged 50 years or over living in the dwelling. The sample was ordered using geographic stratification, with identified addresses ordered within a postcode based geography and then a fixed interval (systematic) sample drawn. NICOLA required a total of 12,077 addresses (main sample), and in addition a 20% sample contingency of 2,415 addresses (reserve sample), resulting in a total of 14,492 addresses in the initial sampling frame. Both the main and reserve samples were extracted at the start of the project. In a final addition, a further sample of 2,416 addresses (additional reserve) was extracted from BSO in the later stages of Wave 1 fieldwork to enable the target cohort number to be achieved.
To be eligible to take part in the NICOLA study, individuals were required to be aged 50 years or over, and therefore must have been born on or before September 30th 1962. All individuals aged 50 years or over in participant sample households were invited to become part of the longitudinal sample. Householders received an introductory letter (unnamed - addressed to the householder only), followed by contact from Ipsos MORI fieldworkers who obtained the name and informed consent from eligible participants. Those who were institutionalised or who lacked the capacity to provide informed consent were excluded from participating in the NICOLA study. Spouses or partners of eligible participants who wished to take part in the study did not have to have been born on or before September 30th 1962, but had to be living at the same address as the selected age-eligible participant.
182726 Nicola Study report__Wave__2.indb 90 20/11/2017 10:23
Early key findings from a study of older people in Northern Ireland (The NICOLA Study)
91
NICOLA Wave 1 pilot studyThe Central Survey Unit (CSU) of the Northern Ireland Statistical Research Agency (NISRA) was commissioned by the NICOLA project team to conduct an initial pilot of 197 addresses (89 households, 153 participants) between October and November 2013. The main survey was informed by this short pilot study with regards to refinement of the format, content and length of the questionnaire.
Wave 1: Components of the study and measuresThe primary participant from each sample household (first household interview) provided details of the full household composition and family relationships. The fieldworker asked details of all persons living at the address, including name, sex, marital status, date of birth and relationship to other household members. This grid was answered by one person on behalf of the whole household. From this information all eligible household members were subsequently contacted and invited to take part in NICOLA Wave 1.
All participants in the NICOLA study were asked to take part in a Computer-Assisted Personal Interview (CAPI) which was conducted in their own homes, and to complete a self-completion questionnaire, which captured additional information that was not suitable for a face-to-face home CAPI interview. Table A9.1 provides an overview of the main domains that were included in the Wave 1 CAPI. The questionnaire was completed in the participant’s own time and returned to the NICOLA office in a pre-paid envelope. Those who took part in the health assessment were also invited to complete a second questionnaire that was designed to capture dietary-related information. This self-completion questionnaire was also completed in the participant’s own time and returned to the NICOLA office in a pre-paid envelope. Copies of the Wave 1 CAPI questionnaire, both self-completion questionnaires, and the health assessment protocol are available on the NICOLA website1.
At the end of each home interview, the fieldworkers informed each participant that they would be invited to attend for a health assessment at the Wellcome Trust-Wolfson Northern Ireland Clinical Research Facility in Belfast, or that a nurse home visit could be arranged (where necessary).
The NICOLA Wave 1 Technical Report provided by Ipsos MORI (available upon request and which will be posted on the NICOLA website) can be referenced for further component design details, including methodology and comparability with European and international longitudinal studies of ageing.
1 www.qub.ac.uk/sites/NICOLA/
182726 Nicola Study report__Wave__2.indb 91 20/11/2017 10:23
Chapter 9
92
Randomised Controlled Trials of study design included within Wave 1NICOLA Wave 1 included two Randomised Controlled Trials (RCTs) within its study design. The first of these aimed to explore the effect of different types of invitation letter on participation, while the second aimed to investigate the effect of the timing of when the self-completion questionnaires were given to the participant on their completion and return rates.
Within the invitation letter RCT, sample households invited to take part in NICOLA were randomly assigned to one of 12 variations of invitation letter. The aim was to assess if the signatory of the letter, the descriptor of NICOLA as a ‘study’ or a ‘project’ and the inclusion or exclusion of a statement of confidentiality within the wording of the letter affected uptake in study participation. In the self-completion questionnaire RCT, participants were randomised to receive the questionnaire during their home interview or posted to them separately post interview. The aim was to examine the impact of varying the point at which the participant was issued a questionnaire on completion rates. Final analysis and reporting of both embedded RCTs will follow in due course.
Fieldwork response ratesA total of 8,504 CAPI interviews were conducted between December 2013 and March 2016, with eligible participants residing within 6,598 private residential households. This represents an overall response rate of 63%. Of the 8,504 CAPI interviews conducted, 195 were with partners of eligible participants who were not yet 50 years of age at the time of interview. Fifty-nine percent of CAPI participants returned a valid self-completion questionnaire.
WeightingAs described above, not everyone invited to participate in the study chose to do so. It is known that there are systematic differences in the types of people who agree and those who do not. In reality it is difficult to completely adjust for these differences, but weights were applied to the data in order make the sample more representative of the population as a whole. These have the effect of putting more emphasis on data from those participant groups who are known to have been underrepresented and less on those groups which are proportionally over represented. The net effect is to produce results that are more truly representative of the Northern Ireland population aged 50 and over.
For NICOLA the target weights were taken from the 2011 Census for Northern Ireland, and applied so that the distribution of the re-weighted sample represented the Northern Ireland usually resident population according to age in three bands (50-59; 60-69 and 75 and over), sex, and broad geographical distribution (in five bands ). Further details are available on request.
182726 Nicola Study report__Wave__2.indb 92 20/11/2017 10:23
Early key findings from a study of older people in Northern Ireland (The NICOLA Study)
93
Statistical testsWe have generally chosen not to present formal statistical tests on the high level findings that are the focus of this initial report. The main reason for this is that we know that there are many other factors that have a bearing on these relationships, and conducting and presenting formal statistical (hypothesis) tests on these crude associations would only mislead. More detailed multivariate analyses will be conducted and be the subject of future NICOLA outputs.
Next stepsWe anticipate the first linkage of CAPI Wave 1 and Wave 2 data being available by the end of 2019. Not everyone who participated in Wave 1 has yet had the opportunity to attend the Clinical Research Facility for an objective health assessment. These assessments will be completed in early 2018 and the data will be subsequently linked to the CAPI survey. In future rounds of NICOLA, participants will be invited to take part in a CAPI home interview and self-completion questionnaire every two years and a health assessment every four years, subject to funding.
Ispos MORI commenced the Wave 2 fieldwork in June 2017, with anticipated completion by February 2019. This will represent the first follow-up of our cohort, and comprises a CAPI home interview and a self-completion questionnaire. The Wave 2 assessments have some common features with Wave 1, but include some new sections/questions that have been requested by researchers and other stakeholders, for example:
• Subsidiary employment• Involvement in culture and arts activities• Quality of life and disability• Oral health• Sedentary behaviour• Use of and satisfaction with community care services (e.g., public health nurse,
home help, respite services)• Housing• Transport and driving• Volunteering• Perceptions of ageing• Self-efficacy.
Approved researchers, and others from the practitioner and policy communities who wish to use the anonymised dataset from the first wave survey, can do so by making an application using the designated proforma available on our website. In 2018, the NICOLA team will arrange public archiving of core variables.
182726 Nicola Study report__Wave__2.indb 93 20/11/2017 10:23
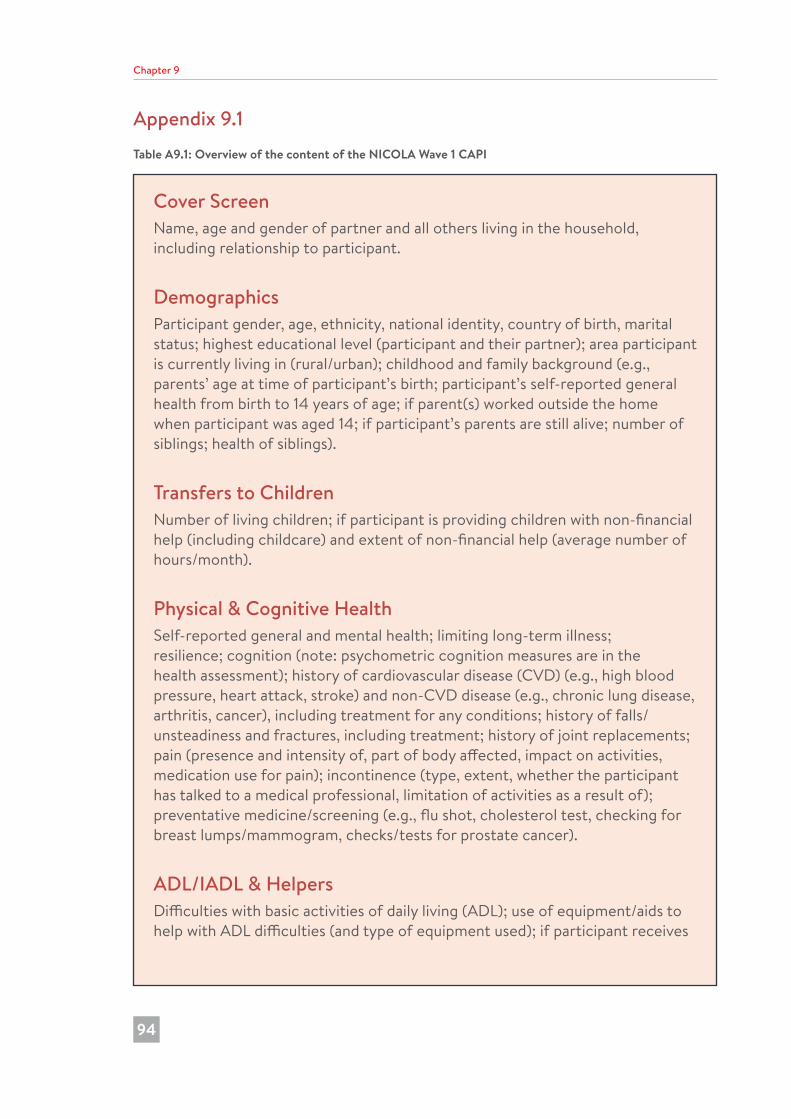
Chapter 9
94
Appendix 9.1Table A9.1: Overview of the content of the NICOLA Wave 1 CAPI
Cover ScreenName, age and gender of partner and all others living in the household, including relationship to participant.
DemographicsParticipant gender, age, ethnicity, national identity, country of birth, marital status; highest educational level (participant and their partner); area participant is currently living in (rural/urban); childhood and family background (e.g., parents’ age at time of participant’s birth; participant’s self-reported general health from birth to 14 years of age; if parent(s) worked outside the home when participant was aged 14; if participant’s parents are still alive; number of siblings; health of siblings).
Transfers to ChildrenNumber of living children; if participant is providing children with non-financial help (including childcare) and extent of non-financial help (average number of hours/month).
Physical & Cognitive HealthSelf-reported general and mental health; limiting long-term illness; resilience; cognition (note: psychometric cognition measures are in the health assessment); history of cardiovascular disease (CVD) (e.g., high blood pressure, heart attack, stroke) and non-CVD disease (e.g., chronic lung disease, arthritis, cancer), including treatment for any conditions; history of falls/unsteadiness and fractures, including treatment; history of joint replacements; pain (presence and intensity of, part of body affected, impact on activities, medication use for pain); incontinence (type, extent, whether the participant has talked to a medical professional, limitation of activities as a result of); preventative medicine/screening (e.g., flu shot, cholesterol test, checking for breast lumps/mammogram, checks/tests for prostate cancer).
ADL/IADL & HelpersDifficulties with basic activities of daily living (ADL); use of equipment/aids to help with ADL difficulties (and type of equipment used); if participant receives
182726 Nicola Study report__Wave__2.indb 94 20/11/2017 10:23
Early key findings from a study of older people in Northern Ireland (The NICOLA Study)
95
assistance from another person to help with ADL difficulties (and if so, who helps most often, what is their gender and relationship to the participant).
Difficulties with instrumental activities of daily living (IADL); if participant receives assistance from another person to help with IADL difficulties (and if so, who helps most often, what is their gender and relationship to the participant).
How many days participant receives help with ADL and/or IADL difficulties; how many hours per day that person spends helping the participant; details of payments to the helper; if anyone else helps, and who that person is; how many different paid helpers have been involved in caring for the participant in the past two years.
Healthcare UtilisationGP or emergency department (ED) attendance in the last 12 months, and if so, how many times; if participant has been an outpatient or has had a hospital admission in the last 12 months, and if so, how many times; how many times the participant had a substantial procedure (as outpatient/during hospital admission); how many times the participant had a full anaesthetic (during hospital admission); how many nights were spent in hospital; was the hospital admission as a public or private patient; was the hospital admission to a public or private hospital.
MedicationsA record was made (by the fieldworker) of all medications that the participant reported taking on a regular basis (including prescription/non-prescription medications, over-the-counter medications, vitamins, and herbal/alternative medicines).
Health BehavioursSmoking (smoking status and amount of tobacco use); physical activity; alcohol (drinking status and consumption, including reasons for not drinking); sleeping patterns, including medication use to aid sleep.
Social ConnectednessNumber of living children (including step, foster, adopted) that participant has; number of children/other relatives participant feels close to; extent of contact participant has with any of their children/other relatives; number of close friends participant has and extent of participant’s contact with close friends;
182726 Nicola Study report__Wave__2.indb 95 20/11/2017 10:23
Chapter 9
96
religious denomination, frequency of religious attendance, importance of religion in the participant’s life and if the participant feels that they get comfort and strength from religion.
Social Participation/CapitalSatisfaction with the area and accommodation participant lives in; how long participant has lived in the area; whether the neighbourhood is supportive, inclusive and safe; characteristics of the area (e.g., litter, vandalism, drug problems); extent to which participant talks to relatives, friends and neighbours; if participant has someone they can call on with health or financial problems and who this person is (e.g., partner, relative, neighbour); how many people participant could turn to for comfort/support in a serious personal crisis; participant’s involvement in groups, clubs, and organisations in the past year; type of unpaid help the participant has received in the past month (e.g., for domestic work, running errands, emotional support).
Work and Pensions/Employment SituationPast and current work activity status; main job (including description, sector, type of contract, number of hours worked, wages and working conditions); unemployment, and reasons for not seeking work; retirement-related benefits and pensions; personal pension plans; job stress; involvement in and extent of unpaid voluntary/charity work; involvement in and extent of caring, including details of person participant is caring for.
Income and AssetsIncome received from various sources over the last year (wages, state pensions, private pensions, other annuity income and state benefits); amount of financial and non-financial assets held, including any income from these assets; regular transfers from non-household members and one-off payments in the last year.
ExpectationsSelf-reported financial situation (i.e., if participant feels they have too little money to spend on their needs); assessment of participant’s household financial situation compared to others around them, their friends, and close work colleagues; if having too little money restricts them (e.g., from buying their first choices of food items, keeping their home in a reasonable state of decoration, buying presents).
182726 Nicola Study report__Wave__2.indb 96 20/11/2017 10:23
Copyright © Northern Ireland Cohort for the Longitudinal Study of Ageing 2017
Northern Ireland Cohort for the Longitudinal Study of Ageing
Centre for Public Health
Queen’s University Belfast
Institute of Clinical Sciences Block B
Grosvenor Road
Belfast BT12 6BJ
Northern Ireland
United Kingdom
Tel: +44(0)28 9097 8926
Email: [email protected]
Website: www.qub.ac.uk/sites/NICOLA/
ISBN: 978-1-909131-68-2