Embed Size (px)
Citation preview
Early Indications of Soil Recovery from Acidic Deposition in U.S. Red Spruce Forests
Gregory B. Lawrence Walter C. Shortle Mark B. David Kevin T. Smith Richard A.F. Warby Andrei G. Lapenis
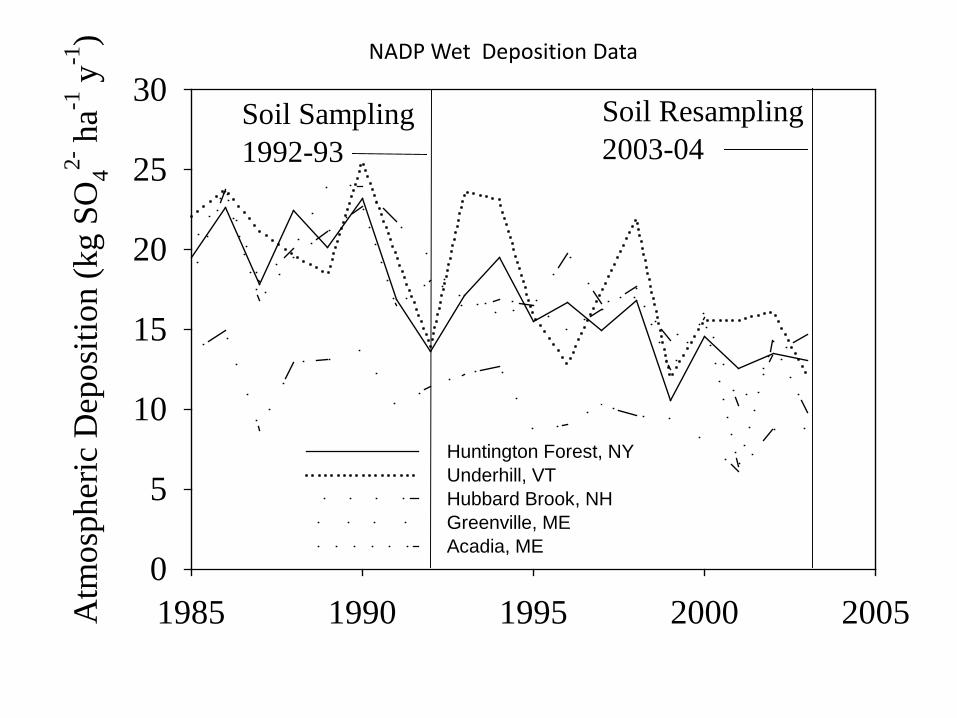
1985 1990 1995 2000 2005Atm
osph
eric
Dep
ositi
on (k
g SO
42- h
a-1 y
-1)
0
5
10
15
20
25
30
Huntington Forest, NY Underhill, VT Hubbard Brook, NH Greenville, ME Acadia, ME
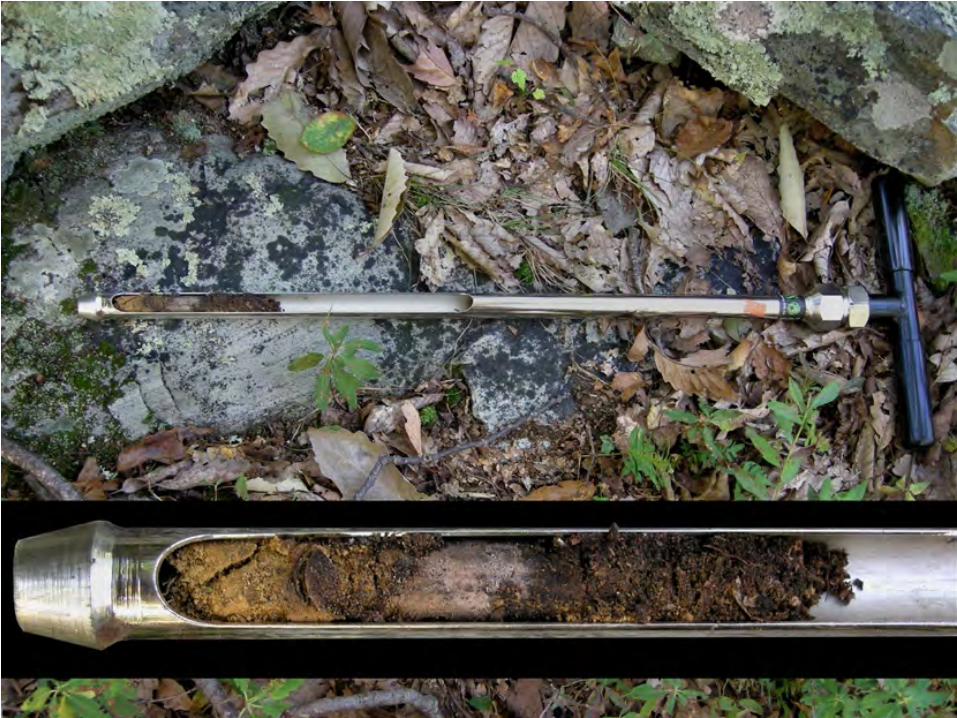
Soil Sampling1992-93
Soil Resampling2003-04
NADP Wet Deposition Data
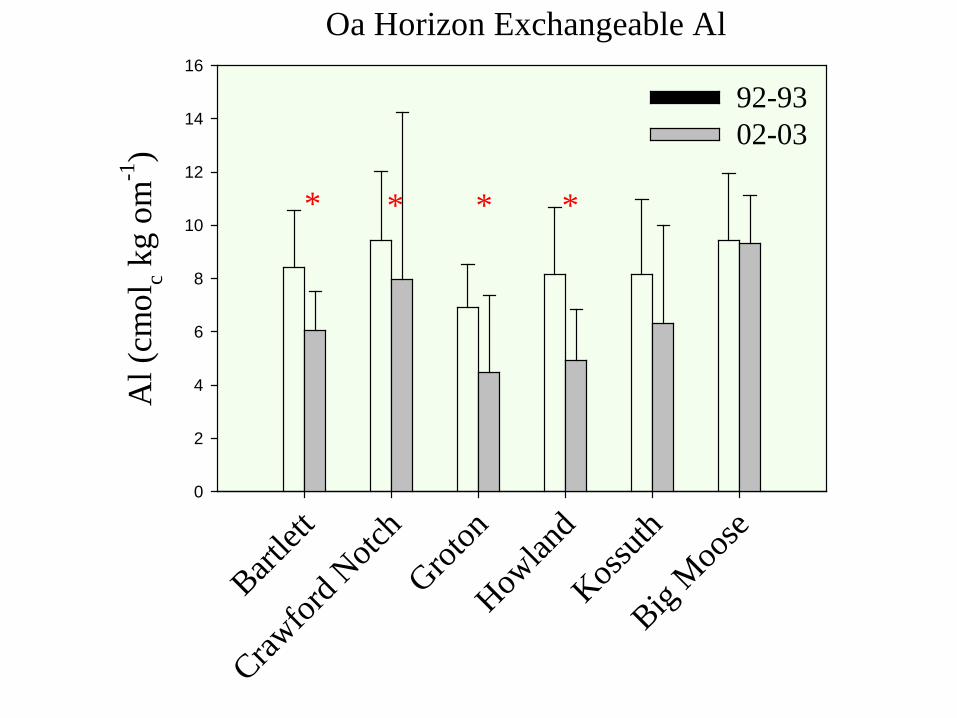
Oa Horizon Exchangeable Al
Bartlet
t
Crawfor
d Notc
h
Groton
Howlan
d
Kossuth
Big Moo
se
Al (
cmol
c kg
om-1
)
0
2
4
6
8
10
12
14
16
92-93 02-03
** * *
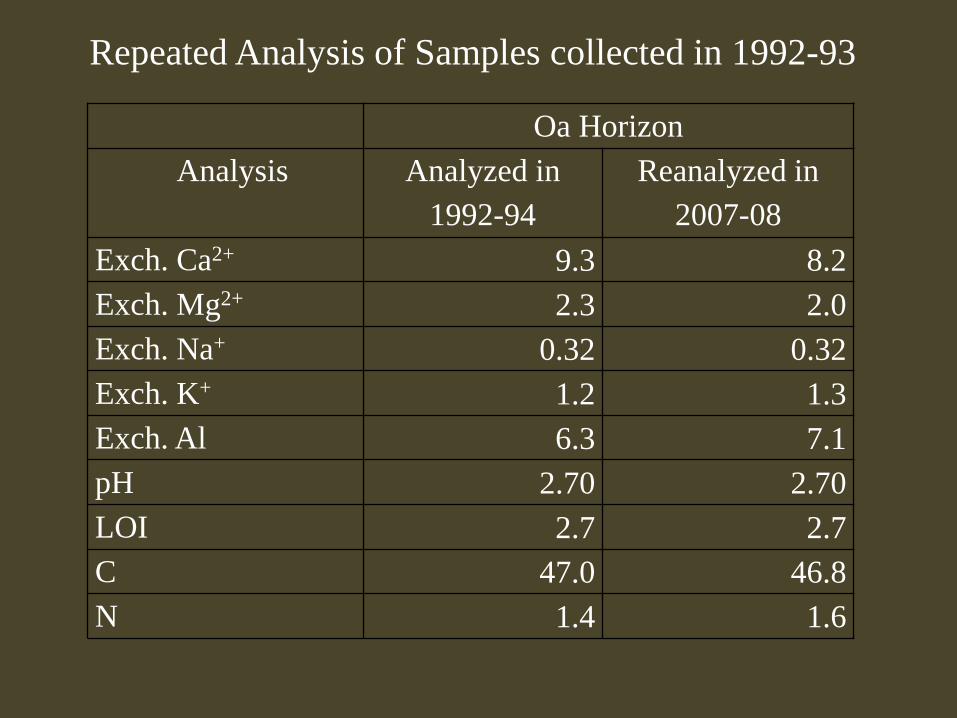
Oa Horizon Analysis Analyzed in
1992-94 Reanalyzed in
2007-08 Exch. Ca2+ 9.3 8.2 Exch. Mg2+ 2.3 2.0 Exch. Na+ 0.32 0.32 Exch. K+ 1.2 1.3 Exch. Al 6.3 7.1 pH 2.70 2.70 LOI 2.7 2.7 C 47.0 46.8 N 1.4 1.6
Repeated Analysis of Samples collected in 1992-93
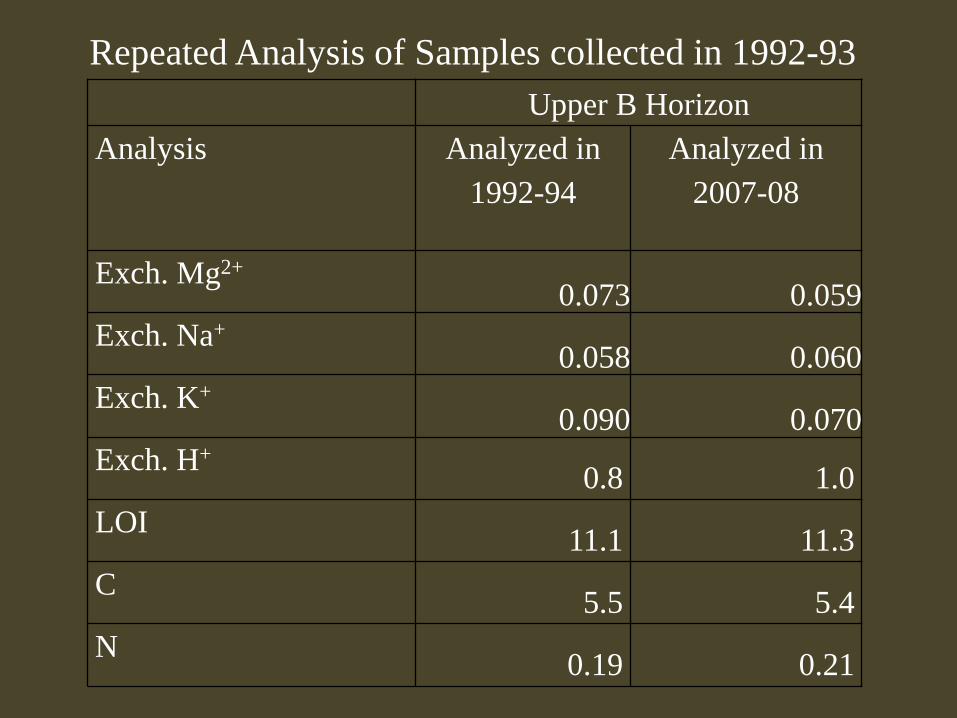
Upper B Horizon Analysis Analyzed in
1992-94 Analyzed in
2007-08
Exch. Mg2+ 0.073 0.059
Exch. Na+ 0.058 0.060
Exch. K+ 0.090 0.070
Exch. H+ 0.8 1.0 LOI 11.1 11.3 C 5.5 5.4 N 0.19 0.21
Repeated Analysis of Samples collected in 1992-93
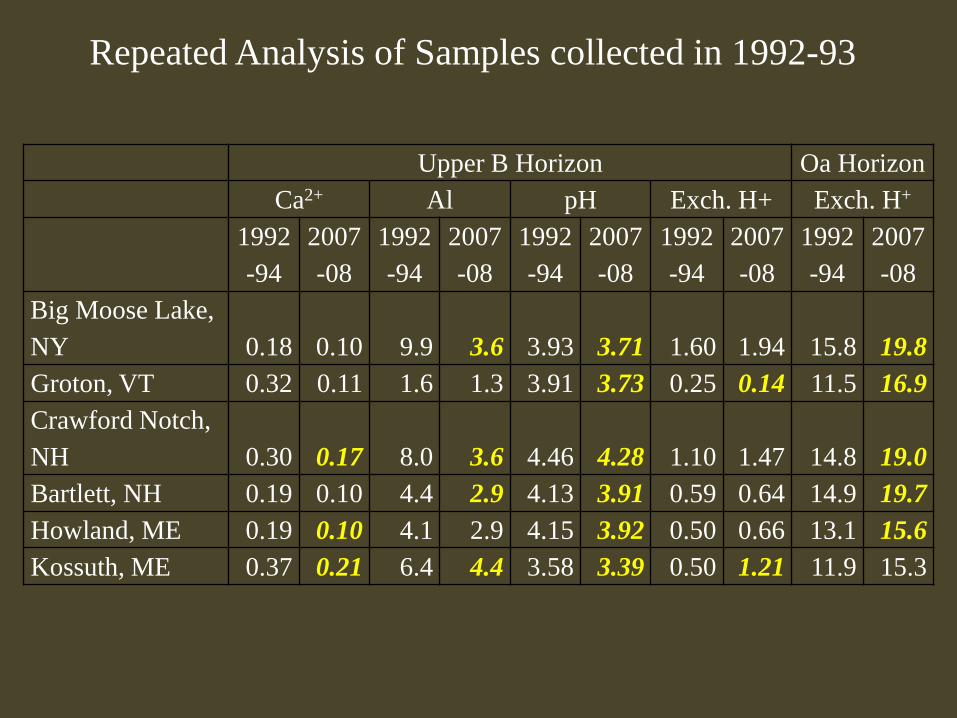
Upper B Horizon Oa Horizon Ca2+ Al pH Exch. H+ Exch. H+
1992-94
2007-08
1992-94
2007-08
1992-94
2007-08
1992-94
2007-08
1992-94
2007-08
Big Moose Lake, NY 0.18 0.10 9.9 3.6 3.93 3.71 1.60 1.94 15.8 19.8 Groton, VT 0.32 0.11 1.6 1.3 3.91 3.73 0.25 0.14 11.5 16.9 Crawford Notch, NH 0.30 0.17 8.0 3.6 4.46 4.28 1.10 1.47 14.8 19.0 Bartlett, NH 0.19 0.10 4.4 2.9 4.13 3.91 0.59 0.64 14.9 19.7 Howland, ME 0.19 0.10 4.1 2.9 4.15 3.92 0.50 0.66 13.1 15.6 Kossuth, ME 0.37 0.21 6.4 4.4 3.58 3.39 0.50 1.21 11.9 15.3
Repeated Analysis of Samples collected in 1992-93
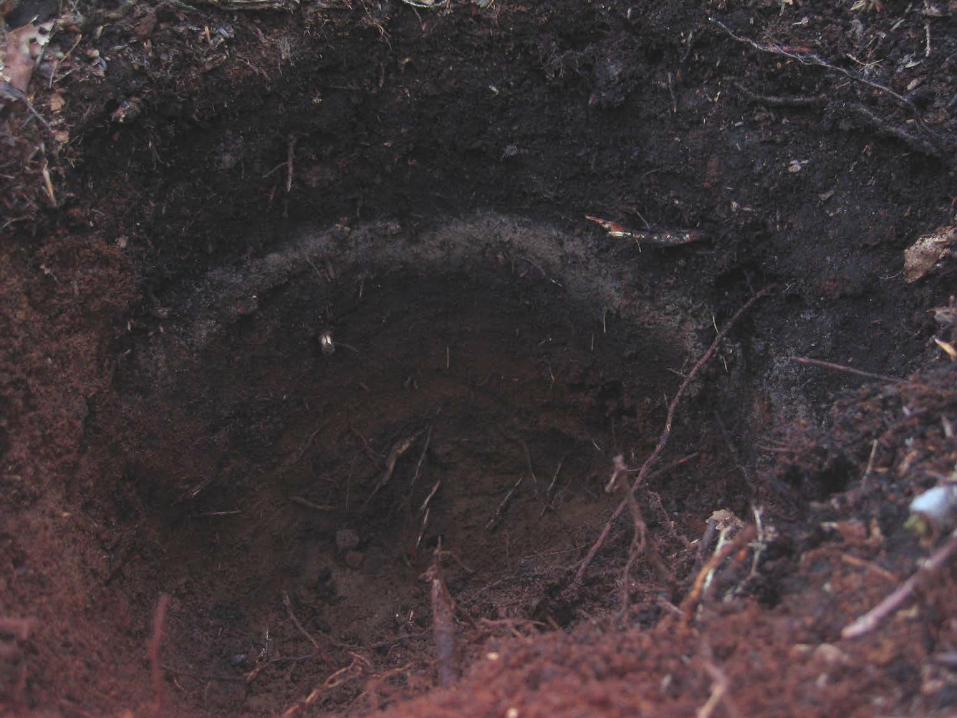
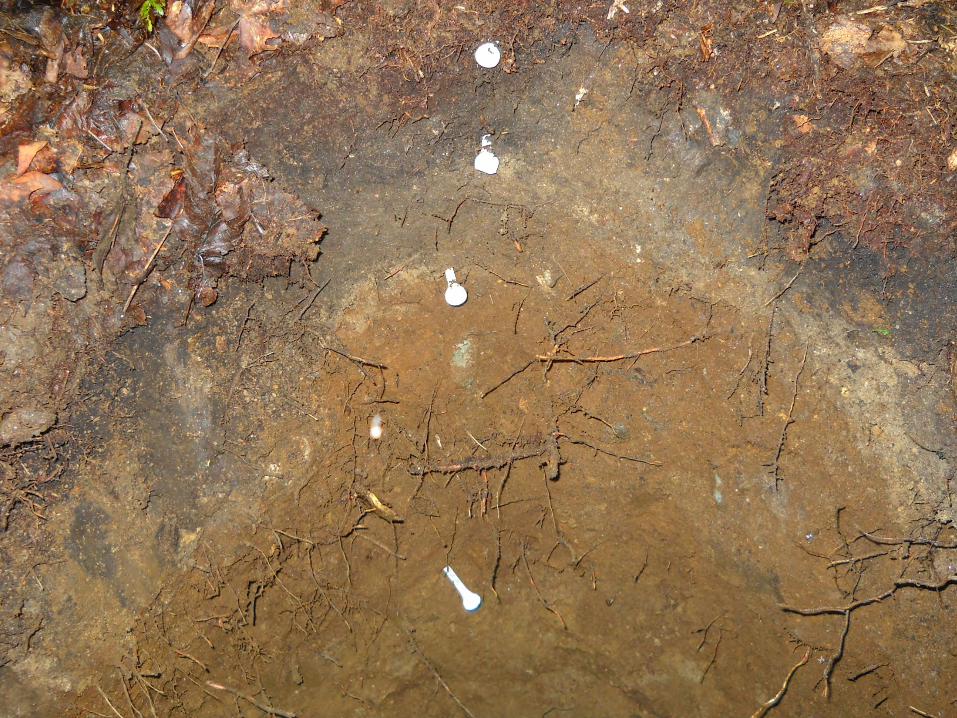
What if we resampled the Oa horizon too deep/too shallow
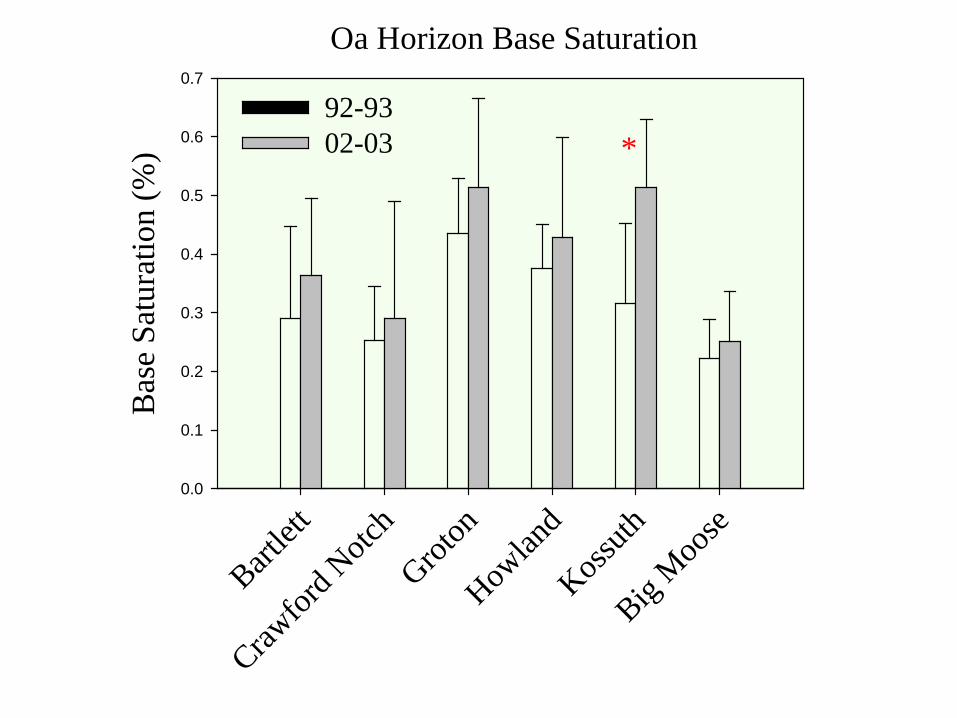
Oa Horizon Base Saturation
Bartlet
t
Crawfor
d Notc
h
Groton
Howlan
d
Kossuth
Big Moo
se
Bas
e Sa
tura
tion
(%)
0.0
0.1
0.2
0.3
0.4
0.5
0.6
0.7
92-93 02-03 *
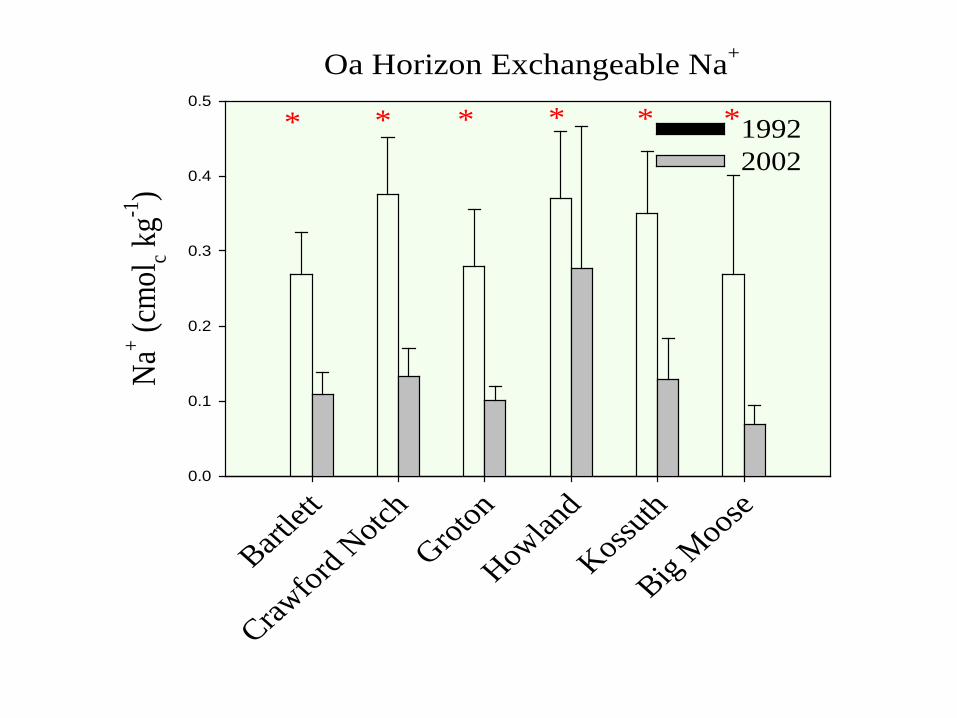
Oa Horizon Exchangeable Na+
Bartlet
t
Crawford Notch
Groton
Howland
Kossuth
Big Moose
Na+ (c
mol
c kg-1
)
0.0
0.1
0.2
0.3
0.4
0.5
1992 2002
* * ** * *
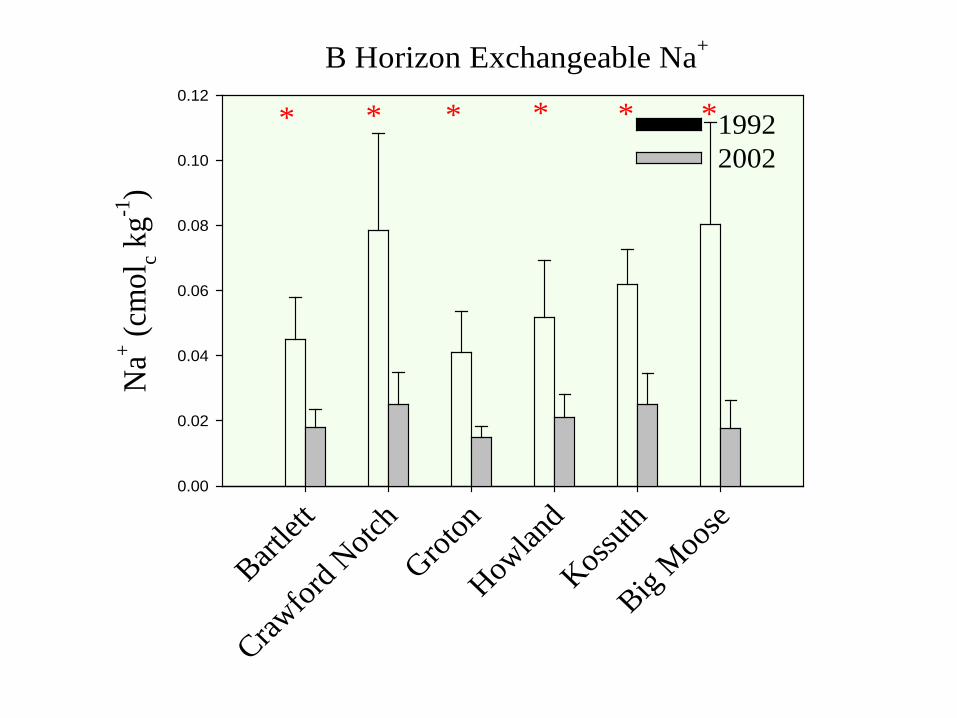
B Horizon Exchangeable Na+
Bartlet
t
Crawfor
d Notc
hGrot
on
Howlan
d
Kossuth
Big Moo
se
Na+ (c
mol
c kg-1
)
0.00
0.02
0.04
0.06
0.08
0.10
0.12
1992 2002
* * ** * *
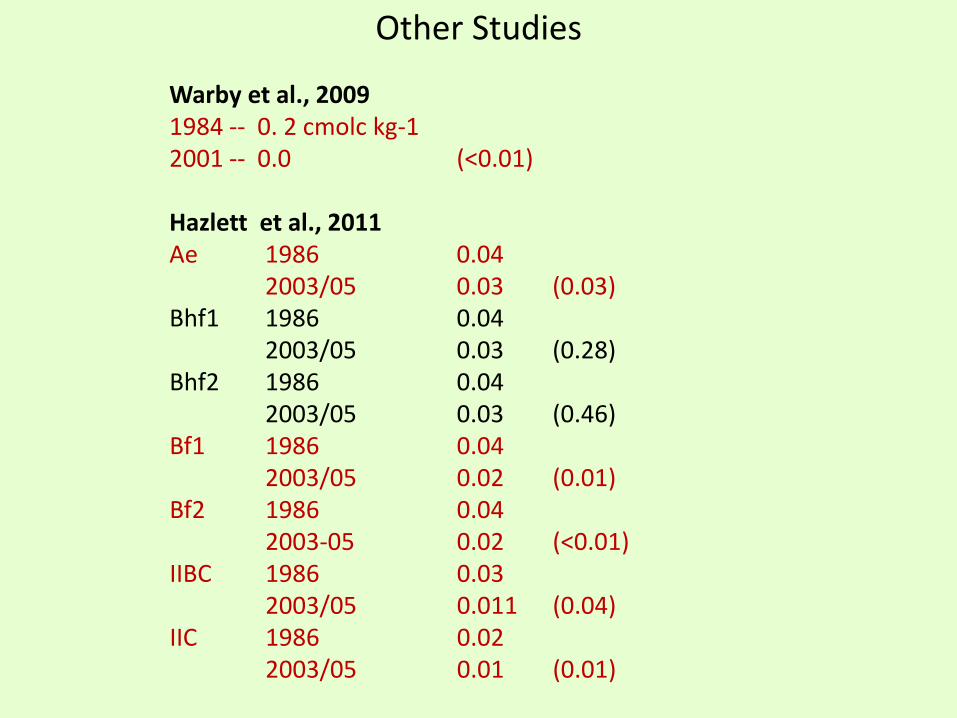
Other Studies Warby et al., 2009 1984 -- 0. 2 cmolc kg-1 2001 -- 0.0 (<0.01) Hazlett et al., 2011 Ae 1986 0.04 2003/05 0.03 (0.03) Bhf1 1986 0.04 2003/05 0.03 (0.28) Bhf2 1986 0.04 2003/05 0.03 (0.46) Bf1 1986 0.04 2003/05 0.02 (0.01) Bf2 1986 0.04 2003-05 0.02 (<0.01) IIBC 1986 0.03 2003/05 0.011 (0.04) IIC 1986 0.02 2003/05 0.01 (0.01)
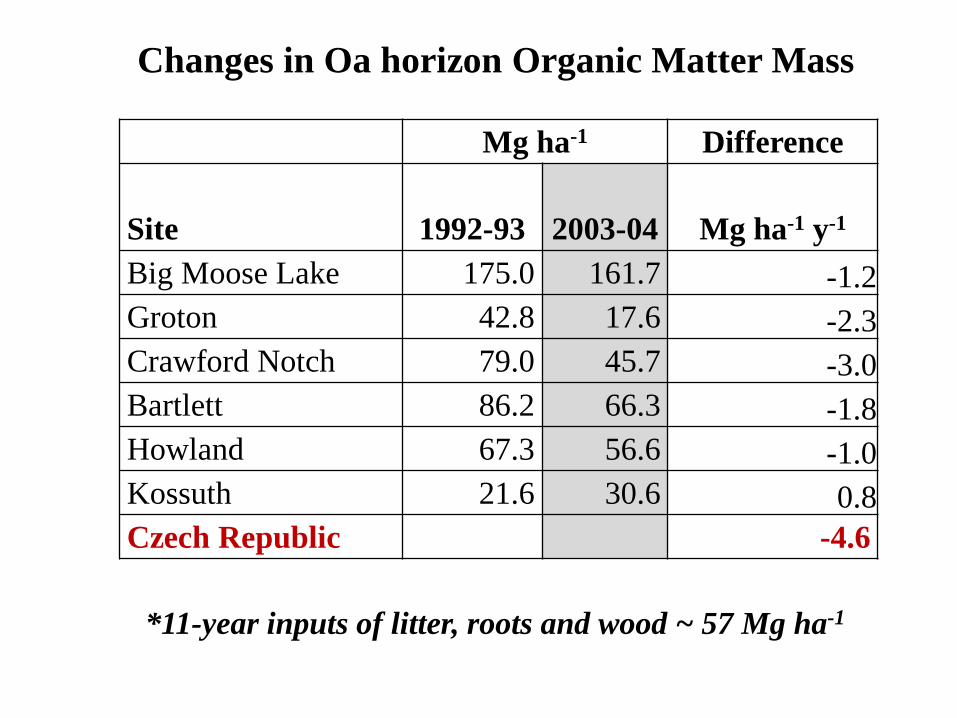
Mg ha-1 Difference
Site 1992-93 2003-04 Mg ha-1 y-1
Big Moose Lake 175.0 161.7 -1.2 Groton 42.8 17.6 -2.3 Crawford Notch 79.0 45.7 -3.0 Bartlett 86.2 66.3 -1.8 Howland 67.3 56.6 -1.0 Kossuth 21.6 30.6 0.8 Czech Republic -4.6
Changes in Oa horizon Organic Matter Mass
*11-year inputs of litter, roots and wood ~ 57 Mg ha-1
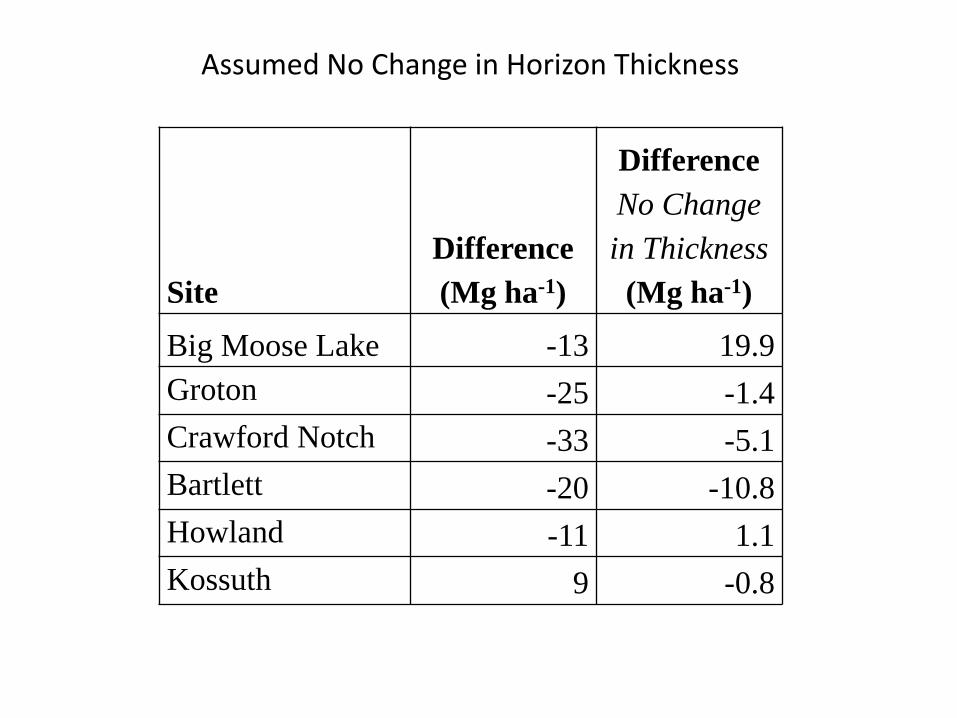
Site Difference (Mg ha-1)
Difference No Change in Thickness
(Mg ha-1)
Big Moose Lake -13 19.9 Groton -25 -1.4 Crawford Notch -33 -5.1 Bartlett -20 -10.8 Howland -11 1.1 Kossuth 9 -0.8
Assumed No Change in Horizon Thickness