Embed Size (px)
Citation preview
Arlington Public Schools
Early Childhood
Program Evaluation
Report
Prepared by the Office of Planning and Evaluation
Response from the Early Childhood Office
January 2016


i
Table of Contents
Table of Contents ........................................................................................................................................... i
List of Tables ................................................................................................................................................ iii
List of Figures ............................................................................................................................................... iv
List of Appendices ....................................................................................................................................... vii
SECTION 1: BACKGROUND ............................................................................................................................ 1
Early Childhood Program Description - Prepared by the Office of Early Childhood ................................. 1
Program Overview ................................................................................................................................ 1
Goals and Objectives ............................................................................................................................. 2
Attributes of Success ............................................................................................................................. 5
Program Attributes ............................................................................................................................... 6
Best and Current Practices .................................................................................................................. 10
VPI Program Guidelines/Expectations: ............................................................................................... 12
Professional Development .................................................................................................................. 12
Resources ............................................................................................................................................ 13
Status of Recommendations Made in Previous Evaluations .............................................................. 16
Expressed Concerns ............................................................................................................................ 18
Methodology ........................................................................................................................................... 18
Evaluation Design and Questions ....................................................................................................... 18
Study Measures................................................................................................................................... 23
SECTION 2: FINDINGS .................................................................................................................................. 25
Evaluation Question #1: How effectively was the Early Childhood program implemented?................. 25
Quality of Instruction .......................................................................................................................... 25
Program Fidelity .................................................................................................................................. 36
Meeting the Needs of the Whole Child .............................................................................................. 44
Community and Parent Engagement .................................................................................................. 48
Effective Use of Resources .................................................................................................................. 58
Evaluation Question #2: What were the outcomes? .............................................................................. 69
Kindergarten Readiness ...................................................................................................................... 69
Long-term Outcomes .......................................................................................................................... 89
SECTION 3: SUMMARY OF FINDINGS .......................................................................................................... 93

ii
SECTION 4: FINDINGS AND ACTIONS .......................................................................................................... 98
Primary Montessori Program .................................................................................................................. 98
Pre-K Instruction and Student Outcomes ............................................................................................... 99
Special Education .................................................................................................................................. 101
The executive summary and appendices are available at www.apsva.us/evaluationreports.
iii
List of Tables
Table 1: Early Childhood Office Staff and Responsibilities ......................................................................... 13
Table 2: Status of Recommendations Made in Previous Evaluations ......................................................... 17
Table 3: Early Childhood Evaluation Design ................................................................................................ 19
Table 4: Pre-K CLASS Domains and Dimensions ......................................................................................... 25
Table 5: Indicators and Behavioral Markers Associated with Pre-K Concept Development ...................... 27
Table 6: Total Enrollment in VPI and Primary Montessori, 2011-12 through 2015-16 .............................. 36
Table 7: Parent Engagement Questions on Parent and Staff Surveys ........................................................ 53
Table 8: Staff Seniority and Costs by Program, 2015-16............................................................................. 60
Table 9: Primary Montessori Fee Schedule, 2015-16 ................................................................................. 61
Table 10: Teacher Licenses and Endorsements by Program....................................................................... 63
Table 11: Average Kindergarten Beginning of Year Math Scores by Pre-K Experience .............................. 81
iv
List of Figures
Figure 1: Average CLASS Doman Scores by Pre-K Program ........................................................................ 27
Figure 2: Average Montessori Domain Scores by Location ........................................................................ 29
Figure 3: Participation in SIOP training ....................................................................................................... 31
Figure 4: Percentage of Participants Rating SIOP Training Extremely/Very Helpful .................................. 31
Figure 5: Percentage of specials teachers selecting Daily, Weekly, A Few Times per Month: How
frequently do you collaborate with Pre-K teachers at your school in the following ways? ....................... 33
Figure 6: Percentage of Pre-K teachers selecting Daily, Weekly, A Few Times per Month: How frequently
do you collaborate with specials teachers (Art, Music, PE) at your school in the following ways? ........... 33
Figure 7: Percentage of VPI and Montessori teachers selecting Daily, Weekly, A Few Times per Month:
How frequently do you collaborate with Pre-K special education teachers at your school in the following
ways? .......................................................................................................................................................... 35
Figure 8: Percentage of special education teachers selecting Daily, Weekly, A Few Times per Month: How
frequently do you collaborate with primary Montessori/VPI teachers at your school in the following
ways? (n=16-17) .......................................................................................................................................... 35
Figure 9: Percentage of Students who Are LEP, by Program ...................................................................... 37
Figure 10: Percentage of Students who Qualify for Free/Reduced Price Meals, by Program .................... 38
Figure 11: Montessori Enrollment by School and Disadvantaged Status, 2015-16 .................................... 38
Figure 12: Percentage of Primary Montessori Accepted Applicants with Family Income at or Below
$86,000 in 2015-16 ..................................................................................................................................... 39
Figure 13: Montessori Enrollment by Race/Ethnicity ................................................................................. 40
Figure 14: 2015-16 Percent of Students to Leave Montessori Program in the Kindergarten Year, Drew vs.
Satellite Schools .......................................................................................................................................... 41
Figure 15: 2014-15 Percent of Students to Leave Montessori Program in the Kindergarten Year, Drew vs.
Satellite Schools .......................................................................................................................................... 41
Figure 16: How much of an impact does kindergarten attrition have on your ability to implement the
Montessori program with fidelity? ............................................................................................................. 43
Figure 17: Percentage Agree: Students in my class/school and their families receive the social-
emotional/behavior, practical/social support and services they need for success in school. ................... 45
Figure 18: How would you rate your level of confidence in providing developmentally appropriate
instruction to Pre-K students (Specials teachers)? ..................................................................................... 47
Figure 19: Staff: Effectiveness of the Registration Process ........................................................................ 49
Figure 20: Parents: Ease of Application and Registration Process by Language ........................................ 51
v
Figure 21: Parents: Ease of Application and Registration Process by Household Income ......................... 51
Figure 22: Parents: Ease of Application and Registration Process by Highest Level of Education ............. 51
Figure 23: Parent Engagement Questions: Percentage Indicating Strongly/Somewhat Agree .................. 54
Figure 24: Parent Engagement Responses by Language ............................................................................ 55
Figure 25: Parent Engagement Responses by Education ............................................................................ 55
Figure 26: Have you participated in any of the following activities? By Pre-K Program ............................ 56
Figure 27: Have you participated in any of the following activities? By Race/Ethnicity ............................ 57
Figure 28: Percentage of Students Whose Parents Participated at Least Once in Activity, 2015-16 ......... 58
Figure 29: Distribution of Years of Teaching Experience by Program, 2015-16* ....................................... 62
Figure 30: Principals and Assistant Principals level of difficulty for hiring and recruiting teachers ........... 63
Figure 31: Satisfaction with child’s Pre-K teacher, by program .................................................................. 64
Figure 32: How Relevant to Your Work with Pre-K Students Is the Professional Development Provided by
School, EC Office, Other Central Offices? (Percent Extremely/Very Relevant)* ........................................ 66
Figure 33: How Frequently Would You Say You Apply What You Learn in Professional Development
Provided by School, EC Office, Central Office, to Your Work with Pre-K Students? (Percent
Always/Often)* ........................................................................................................................................... 67
Figure 34: Please Rate Your Level of Satisfaction with Division-Level Support for the Following from the
Early Childhood Office (Percent Extremely/Very Satisfied) ........................................................................ 68
Figure 35: Percentage of VPI Students Meeting PALS Pre-K Developmental Ranges, Fall and Spring 2015-
16* .............................................................................................................................................................. 70
Figure 36: Percentage of VPI Students Meeting PALS Pre-K Developmental Ranges, Fall and Spring 2015-
16, by LEP Status* ....................................................................................................................................... 71
Figure 37: Percentage of VPI Students Meeting PALS Pre-K Developmental Ranges, Fall and Spring 2015-
16, by Economic Status* ............................................................................................................................. 72
Figure 38: Percentage of Students in Special Education Program Meeting PALS Pre-K Developmental
Ranges, Fall and Spring 2015-16* ............................................................................................................... 73
Figure 39: Percentage of Students in the Special Education Program Meeting PALS Pre-K Developmental
Ranges, Fall and Spring 2015-16, by LEP Status* ........................................................................................ 74
Figure 40: Percentage of VPI Students Meeting PALS Pre-K Developmental Ranges, Fall and Spring 2015-
16, by Economic Status* ............................................................................................................................. 75
Figure 41: Percentage of Kindergartners at or above Kindergarten Fall PALS Benchmark, by Pre-K
Experience ................................................................................................................................................... 76
vi
Figure 42: Percentage of Kindergartners at or above Kindergarten Fall PALS Benchmark, by Pre-K
Experience and LEP Status* ........................................................................................................................ 77
Figure 43: Percentage of Kindergartners at or above Kindergarten Fall PALS Benchmark, by Pre-K
Experience and Economic Status ................................................................................................................ 77
Figure 44: Percentage of Kindergartners at or above Kindergarten Fall PALS Benchmark, by Pre-K
Experience and Race/Ethnicity ................................................................................................................... 78
Figure 45: 2015-16 Percentage of VPI Students at each DMA Level .......................................................... 79
Figure 46: 2015-16 Percentage of Students in the Special Education Program at Each DMA Level .......... 80
Figure 47: Average Kindergarten Beginning of Year Score, by Pre-K Experience and LEP Status .............. 82
Figure 48: Average Kindergarten Beginning of Year Score, by Pre-K Experience and Economic Status .... 82
Figure 49: Average Kindergarten Beginning of Year Math Score, by Pre-K Experience and Race/Ethnicity
.................................................................................................................................................................... 83
Figure 50: Percent Selecting Strongly Agree/Somewhat Agree: My child will be ready for kindergarten.*
.................................................................................................................................................................... 84
Figure 51: Increase in Four-Year-Old Students Meeting Social-Emotional Indicators by Program, 2015-16
.................................................................................................................................................................... 86
Figure 52: Parents: Satisfaction with growth in personal/social skills, by program ................................... 87
Figure 53: Satisfaction with growth in fine/gross motor development, by program ................................. 88
Figure 54: Have you noticed any increase in your child’s willingness to try new foods, especially fruit and
vegetables, since entering Pre-K? By program ........................................................................................... 89
vii
List of Appendices
Appendix A: Definitions………………….……………………………………………………………………………………………………..A1
Appendix B: Quality of Instruction
B1: CLASS Description………………………………………………………….….……………………………………………….B1
B2: Alignment of CLASS with APS Best Instructional Practices..…………………………………….………….B6
B3: CLASS Domain and Dimension Scores…………………..…………………………………………………………….B8
B4: Montessori Observations.…………………..…………………………………………………………………………….B16
Appendix C: Program Data
C1: Pre-K Enrollment…………………………………………………………….….……………………………………………….C1
C2: Parent Participation……..………………………………………………….…………………………………….…………C22
C3: Montessori Kindergarten Discontinuation….………………….….…………………………………….……….C32
Appendix D: Stakeholder Feedback
D1: Parent Surveys……………………………………………………………….….……………………………………………….D1
D2: Staff Survey……………………………………………………………………...…………………………………….……….D25
Appendix E: Resources
E1: Hanover Research Cost Comparison……………………………….….……………………………………………….E1
Appendix F: Outcomes
F1: Pre-K PALS……………………………….………………………………………………………………………………………….F1
F2: Developmental Math Assessment.……………………..……………..………………………………….………….F17
F3: Kindergarten Beginning of Year Math Assessment…………..………………………………………………..F25
F4: Kindergarten PALS…………………………………………………….……..……………………………………………….F50
F5: Hanover Research Longitudinal Study..…………………….……..………………………………………………..F61
F6: Social Emotional Outcomes……………....…………………….……..……………………………………………...F140
Appendices are available at www.apsva.us/evaluationreports.
1
SECTION 1: BACKGROUND
The Early Childhood evaluation began in 2014-15 with the development of an evaluation design. A
planning committee met regularly throughout the year to develop the evaluation questions that would
guide data collection for this report. Committee members included staff from Planning and Evaluation,
the Early Childhood Office, other central offices, and schools; as well as a community member from the
Arlington Montessori Action Committee (AMAC) and the Early Childhood Advisory Committee (ECAC).
Data collection for the evaluation occurred during the 2015-16 school year and the fall of 2016. This
evaluation employed various methodologies to collect data with which to examine the success of the
APS Early Childhood program. In particular, this report addresses the following three components
outlined in Arlington Public Schools (APS) policy and procedures (45-3) for accountability and evaluation:
1. A description of the department, program, or service
2. Evaluation questions that ask
a. How effectively was the Early Childhood program implemented?
b. What were the outcomes?
3. Recommendations
The executive summary and appendices are located online at www.apsva.us/evaluationreports.
Early Childhood Program Description - Prepared by the Office of Early Childhood
Program Overview
Arlington Public Schools (APS) offers three different types of full day Pre-K school programs for a limited
number of three- and four-year-olds that reside in Arlington County.
The primary Montessori program is a multi-age preschool program based on the methodology
and philosophy of Dr. Maria Montessori. Students work independently and cooperatively in a
structured environment which allows students to work at their own pace. Montessori teaching
materials are designed to promote habits of concentration, initiative, persistence, and
discovery, while the Montessori philosophy and community emphasizes respect for others,
peace, and creativity.
The Virginia Preschool Initiative (VPI) is designed to follow the High Scope1 model which can
easily be compared to a traditional preschool program. The VPI Pre-Kindergarten program
curriculum is based on Virginia’s Foundation Blocks for Early Learning: Comprehensive Standards
for Four-Year-Olds.2 The standards cover literacy, mathematics, science, history and social
science, physical and motor development, and personal and social development. The VPI
program has a strong focus on education, parent involvement, child health and social services,
and transportation for families with four-year-olds at risk of school failure. The Foundation
Blocks establish a measurable range of skills and knowledge essential for four-year-olds to be
successful in kindergarten.
1 www.highscope.org 2 VDOE. (http://www.doe.virginia.gov/instruction/early_childhood/preschool_initiative/foundationblocks.pdf)
2
The APS Pre-K Special Education program receives oversight from the Office of Special
Education. The program serves children with disabilities aged two to four years old. There are a
variety of programming options based on student’s needs and Individualized Education Plans
(IEPs). Options include community-based resource services provided in a child’s private childcare
or Pre-K program within Arlington, toddler programs, multi-intervention programs for students
with autism, and non-categorical programs for students aged three to four years old. The
programs for students aged three to four years old are aligned with the VPI curriculum. The goal
of the Pre-K special education program is to help students meet their individualized IEP goals in
identified developmental areas of delay.
Office of Early Childhood is a part of the APS Department of Instruction (DOI). The Office is responsible
for several broad areas including:
Virginia Preschool Initiative (VPI) Program: Family outreach, student registration and placement,
professional development for Pre-K staff, quality monitoring, oversight of VPI state grant and
budget
Primary Montessori Program: Parent outreach and education, recruitment of staff, student
registration and monitoring, program monitoring, and professional development
Instructional Support and Guidance for Early Childhood Educators and Administrators (pre-k to
grade 2)
Kindergarten Readiness support to families and schools
Implementation of APS policies relating to early childhood
Goals and Objectives
The Early Childhood Office operates within the Department of Instruction (DOI) to meet APS Strategic
Plan goals and DOI process goals. APS develops six-year strategic plans with staff and community
involvement to identify focus areas for school system improvement. Each year the School Board and the
public receive reports on the progress made within each Strategic Plan goal area during the preceding
year, with the opportunity for modifications to the Strategic Plan as warranted.
The current strategic plan runs through 2017 and focuses on five important goal areas:
Goal 1: Ensure that Every Student is Challenged and Engaged
Goal 2: Eliminate Achievement Gaps
Goal 3: Recruit, Retain and Develop High-Quality Staff
Goal 4: Provide Optimal Learning Environments
Goal 5: Meet the Needs of the Whole Child
The Early Childhood Office also works toward meeting the following seven DOI process goals:
Communication: Communicate curriculum and programs to constituent groups
3
Curriculum: Develop, revise, and enhance curriculum and programs; identify and create teacher
resources that support a rigorous curriculum aligned with state standards
Assessment: Provide analysis of summative student achievement data
Formative Assessment: Identify and implement formative assessments to monitor student
progress and inform instruction
Instruction: Monitor instruction and program implementation; promote high quality instruction
through curriculum development, professional development, observation and feedback cycles
for teachers
Professional Development: Provide sustained high quality professional development for staff
Research: Review current research/environmental scans for innovative approaches to teaching
and learning
Progress in each of the areas of responsibility is monitored through a cycle of program evaluation as well
as annual supervision and evaluation within DOI.
The mission of the Office of Early Childhood is to provide effective programs and experiences for young
children and their families. This will be accomplished through curriculum leadership, community
involvement, and instructional support of developmentally effective programs. Understanding that
young children have unique and specific developmental needs, the Office of Early Childhood is
committed to providing direct services and collaborating with core instructional offices to ensure that
young children’s educational experiences are commensurate with their developmental characteristics.
In addition, the Early Childhood Office is committed to increasing access to Pre-Kindergarten programs
for Arlington families with a special attention to those of lesser financial means and to maintaining a
high quality Montessori choice program.
Montessori Education Goals and Objectives
The Montessori program provides an interdisciplinary, discovery-based approach to learning founded on
the work of Dr. Maria Montessori over 100 years ago. The program is based on a philosophy of learning
that grows from the belief that children are natural learners, and that learning occurs best in a
nurturing, prepared environment that promotes spontaneous cooperative inquiry. The teaching method
that grew from this philosophy fosters a sense of security, self-confidence and independence in children,
enabling them to develop into people who respect and care for themselves, others, the environment
and all life. Montessori teachers address physical, emotional, social, spiritual, aesthetic, and cognitive
needs as they guide their students to develop inner discipline, coordination, concentration, a sense of
order, and independence. A list of goals and objectives are outlined below to sustain a quality
Montessori program for Arlington children ages 3-12.
A multi-age grouping in each classroom provides a family-like setting where learning can take
place naturally and cooperatively.
The Montessori classroom is a working community of children and adults with constant problem
solving, child-to-child teaching, and socialization.

4
The Montessori Method is based on scientific observation. Much of student assessment is
through teacher observations.
The Montessori Method refers to the interaction of children, Montessori teaching materials, and
Montessori teachers.
The Montessori philosophy values all intelligences and styles of learning. Subjects are
interwoven, not taught in isolation, and children are free to work and develop at their own pace
with materials they have chosen, either alone or with others.
Children in a Montessori environment are able to learn in many different ways: individual
lessons with the teacher, small group lessons with the teacher, and large group lessons with the
teacher; a lesson from another child and most importantly from being able to observe other
children of various ages working.
The aim of the method is to assist children in developing habits of concentration, initiative,
persistence, and joy in learning so that they can reach full potential in all areas of life and
become life-long learners.
The guiding principle is freedom within limits.
Virginia Preschool Initiative (VPI) Goals and Objectives
The Virginia Preschool initiative program, VPI, provides a foundation for learning and academic success.
School-readiness activities focus on phonological awareness, vocabulary, number sense and physical,
motor and social development. The goal of the VPI program is to prepare both the child and family for
school success in kindergarten and beyond.
Instruction in the VPI program must align with the Foundation Blocks for Early Learning3. The
Foundation Blocks for Early Learning are comprehensive standards that must be met in the following
categories: literacy, mathematics, science, social studies, health & physical well-being, personal & social
well-being, music and visual arts.
These principles frame the Arlington Public Schools approach to early childhood education:
Valuing each young child
Acknowledging the importance of each child's family and culture
Working collaboratively with stakeholders, including Northern Virginia Family Services who
provides Head Start in Arlington and the Arlington Department of Human Services, to meet the
needs of young children and their families
Increasing the level of parent education and staff training available to those involved with young
children in Arlington
Emphasizing the importance and necessity of acquiring school readiness skills
3 www.doe.virginia.gov/instruction/early_childhood
5
Curriculum
APS uses both locally developed curriculum and commercial materials to meet the needs of the
students. Program materials support our goal of ensuring students have the experiences and skills
needed to be successful in kindergarten and beyond. When planning learning experiences for students,
a backward design model is used. Teachers first look at our desired outcomes for children as specified in
the Virginia’s Foundation Blocks. The teachers then plan activities/experiences for the children that will
facilitate the development of concepts and skills needed to meet the objectives.
APS is committed to providing a balance between both teacher directed (direct instruction) and student
centered experiences. Teachers use a High-Scope framework in their classroom and all teachers have
students engage in small group interactions as well as the Plan, Do, Review process. For the direct
instruction component all teachers use Opening the World of Learning (OWL), a comprehensive early
literacy program, Words Their Way, and Handwriting without Tears. In Mathematics, all teachers use the
Great Source Every Day Counts: Every Day in Pre-K: Math instructional program and Numbers Plus
Preschool Mathematics Curriculum.
The Policy Implementation Procedures aligned with School Board Policy 20-3 on Program Differentiation
provide the framework for Arlington’s early childhood programs. The Board believes that each Pre-
Kindergarten-aged child should experience high quality settings that promote success in school, whether
in his or her home with family supervision, with a home day-care provider, in a private day care center,
and/or in a publicly funded program. The Arlington School Board recognizes the critical influence of
early childhood experiences on school success and desires that more children begin their school careers
in kindergarten fully prepared for success in school, including the ability to speak and understand
English. As a result of this belief and recognition, the Arlington School Board supports other community
agencies and stakeholders in providing additional Pre-Kindergarten programs, as well as caregiver
education opportunities.
In implementing the principles listed in the prior section, Arlington Public Schools provides
Pre-Kindergarten programs for identified students with disabilities, aged 2-4 years old
Pre-Kindergarten programs for four-year-old students identified as at-risk for school failure, in
selected locations and as resources allow
Montessori programs for three-, four-, and five-year-old students in selected locations and as
resources allow. Tuition shall be charged on a sliding scale for all enrolled students who do not
meet the age requirement for kindergarten. “Two-thirds of the positions in each Montessori
class will be reserved for children whose parents’ income is at or less than 80% of the amount
specified in the annual income guidelines for families qualified for tax relief programs in
Arlington County” as stated in APS School Board policy 25-2.2.
Attributes of Success
Through successful implementation, the Early Childhood program will accomplish the following:
6
Students will develop school readiness as outlined in the Virginia State Task Force definition of
school readiness; emphasis will be placed on emergent literacy and numeracy outcomes, as well
as socio-emotional growth including:
o display emerging literacy skills
o show an interest and skill in mathematics
o build early science skills
o learn about history and social studies
o enhance physical and motor development
o exhibit personal and social skills and a sense of self-worth
Students will master literacy skills assessed on the following literacy assessments:
o Pre-K Phonological Awareness Literacy Screening Pre-K PALS (VPI, Special Education and
Montessori 4 year olds only)
o K Phonological Awareness Literacy Screening (KPALS)
Students will master math skills assessed on the following literacy assessments:
Developmental Math Assessment (DMA) (VPI and Special Education Pre-K 4 year olds
only)
APS kindergarten Math Assessment (K year)
Program Attributes
Montessori Pre-K
Montessori education is a multi-age, child-directed model of education based on the work of Dr. Maria
Montessori, a renowned physician, anthropologist, and educational researcher. Over a century ago, Dr.
Montessori opened the first ‘casa del bambini’ or children’s house in Rome in 1907. Through extensive
study and careful observations of students, she concluded that children are innately equipped with an
‘absorbent mind’ and should have a carefully prepared environment in which children may act on their
need to explore and learn. The Montessori Method is based on the philosophy that a child’s desire and
ability to learn should be nurtured through interaction with a prepared environment, purposeful
activities, and the guidance of trained adult. Over time, children develop concentration, self-discipline,
and respect for themselves and others.
Montessori education is available in Arlington for students 3-12 years of age. This includes primary
elementary and middle school classrooms. The program provides Arlington public schools with an
option other than the traditional educational model. Families must apply for their child to participate in
the Montessori program during the Pre-Kindergarten years. Additional entry points are considered at
7
grade one and three with the discretion of the principal and parents. The Pre-Kindergarten program
reserves two-thirds of the available positions for families of lesser financial means as defined by APS
School Board policy.
Application Process
The primary Montessori application is a school-based process. Children and families may apply to the
primary Montessori program at each eligible school site if the child has turned three-years-old by
September 30. During the month of April, a lottery is conducted at each school in which two-thirds of
the available positions are reserved for families whose income is at or less than 80% of the median
income for a family of four in Arlington County.
Children that apply for four and five-year-old positions are placed on a school waiting list. All families
with three-year-old children pay tuition, which is assessed on a sliding scale. Families whose income is
below 80% of the median income for Arlington County, do not pay tuition during the four-year-old year.
All five-year-old children (by September 30) attend the Montessori program free of charge. Elementary
students also have the opportunity to apply and enroll in the Montessori elementary program.
Additional entry points are typically at first and fourth grade.
Family and Parental Involvement Plan
Communication between home and family is unique in a Montessori setting as the children and families
work with a single teacher for three consecutive years. This allows the teacher to build enduring
relationships with the student and his or her family based on shared experience. A variety of methods
are used to sustain communication including conferences, newsletters, school events, and personal
communication.
In addition to individual school events and conferences, Montessori families are invited to attend
county-wide programs. These events, including parent education evenings, back-to-school picnics,
curriculum nights, celebrations and Montessori Information Night, bring families together from across
the division to learn and share their experience of a Montessori education.
The schools sponsor many events to make the school setting as inviting as possible for each family. Also,
the Early Childhood Office coordinates and executes an Annual Montessori Information Night for
families.
Primary Montessori Curriculum and Instruction
Montessori primary curriculum is divided into four curricular areas, which include: Practical Life,
Sensorial, Math, and Language. Art, music, science, and cultural studies are integrated into all areas of
the classroom. Students engage with both the teacher and the prepared environment to learn
fundamental skills and content knowledge. Students experience a sequence of lessons in small groups or
one-on-one settings with the teacher. Follow-up work is selected to provide concrete experiences on
concepts to be learned. Children also work to acquire independence, coordination, sense of order,
concentration, and internal motivation.
8
Lessons are delivered in small groups or one-on-one with the teacher. Follow-up work is selected and
completed during the three-hour work cycle. As children progress through curricular materials, which
are self-correcting, they work from concrete to abstract lessons at their own pace. Classes are multi-age,
traditionally spanning three years (ages 3-6, 6-9, and 9-12). This affords children and families continuity
and promotes strong relationships among the teachers, children, and parents in a Montessori
environment.
Montessori children experience the Arlington Public Schools, Virginia State Standards for kindergarten,
and Montessori curriculum which extends from age 3 to 12. Teachers maintain a sophisticated record
keeping process which allows them to track individual student’s progress in the curricular areas. The
Early Childhood Office provides resources for teachers to utilize the online Montessori Record Keeping
System (MRX). This is an online tool that allows for teacher record keeping and report creation for
parents and administrators.
Virginia Preschool Initiative
The Virginia Preschool Initiative (VPI) is a program that serves at risk four-year-old children in Arlington
County. Currently, Arlington supports 35 VPI classrooms with approximately 630 students. VPI began in
1995 with the Education Act (HB2542). This legislation was created in response to a study of early
childhood programs for at-risk four-year-old children presented to the Senate Finance Committee and
House Appropriations Committee in 1993. The state of Virginia provides monies to public and private
agencies which are able to provide high quality early childhood services to at-risk four-year-olds in order
to eliminate academic differences in school readiness. Although the initiative is focused primarily on
supporting academic success through quality pre-kindergarten education, programs must also include
support for health services, social services and parental involvement.
VPI is a pre-kindergarten program for children from families of lesser financial resources Children must
be four years old on or before September 30 of the year they enroll in the program and their household
income must not exceed 350% of the federal poverty level. Per state guidelines, priority for this program
is based on need starting with those at or below 100% of federal poverty. The VPI grants requires that
jurisdictions also collect risk factor information on children applying for the program including: homeless
status, parental incarceration, single parent status, military family, parent with limited school and
whether the child is an English-Language learner. VPI classes are housed in 16 elementary schools with
one countywide site at Drew Model School. The VPI program is funded through state and local funds.
The VPI program is a high quality, comprehensive pre-kindergarten program operating during school
hours and provides a balance of student initiated and teacher initiated activities. The curriculum aligns
with the Virginia Foundation Blocks for Early Learning and students are assessed using the Pre-K PALs
and the DMA math assessment three times per year. Teachers in the program are fully Virginia licensed
teachers with an endorsement in Early Childhood Education.
Application Process
The VPI program is available to families whose income is at or below 350% of the federal poverty level
and who have other risk factors. Families that qualify for the VPI program must submit a completed
application and verification of income to the early Childhood Office before the registration cut-off date
9
in mid-April. After the application window has closed, the Office of Early Childhood places students
based on need at particular sites giving consideration to parent preferences listed on the application.
Those applications are then sent to school sites to offer families spots in the program and assist them in
completing registration.
Social Services and Child Health Plan
The Arlington Department of Human Services School Health Office collaborates with the APS Office of
Early Childhood by promoting and providing awareness of our programs as well as assistance in
completing applications. Additionally, APS partners with Northern Virginia Community College for an
annual event to provide free dental cleanings to all VPI students and selected Special education and
Montessori students. APS has also partnered with Northern Virginia Family Services who serves Head
Start to collaboratively support the needs of students and families.
Family and Parental Involvement Plan
Communication between home and family is carried out using a variety of means. At a minimum,
parents will meet seven times with the teacher to include: one home visit, three parent teacher
conferences and multiple countywide parent/family events. All of the schools have bilingual staff and
translation is provided at meetings, during phone calls and in written communications. Teachers make
home visits for each child in their classroom. They sometimes will bring along the instructional assistant,
co-teacher, interpreter or another staff member from the school. The first home visit takes place before
school starts or during the month of September. In cases where a visit at the child’s home cannot take
place, the teacher works with the parent to identify a location where the family feels comfortable. The
goal of the home visit is to begin to create a relationship between the family and teacher.
The schools sponsor many events to make the school setting as inviting as possible for family
participation. Parents with children in the VPI program are invited to all school events. The school
calendar is a component of each school’s Family Handbook, which is revised and published every
September. The school year begins with an Open House before school opens in order for parents to get
acquainted with one another and the teaching staff. There is also a Back-To-School Night where parents
learn about their child’s instructional program. All schools have family literacy nights and family library
nights where staff members present programs that introduce children to diverse genres of literature
while modeling literacy building skills for parents. VPI teachers are encouraged to provide at least two
parent involvement events including one for literacy and one for numeracy and ways to foster these
areas at home.
In addition, the APS Office of Early Childhood sponsors numerous events open to all VPI families.
Parents have the opportunity to meet with their children’s teachers at school three times during the
year, for parent teacher conferences. The teachers are encouraged to also create regular class
newsletters, blogs, twitter accounts, etc. to keep parents informed about the activities in their children’s
classes. Parents are also encouraged to volunteer in their children’s classroom, the library, or the
cafeteria and on field trips as their work schedules permit.
10
Finally, each VPI student receives a monthly Home School Connection packet that includes a letter
translated into 5 languages, an activity and a book. These packets correlate with what the student is
learning in the program during that month.
VPI Curriculum and Instruction
APS uses locally developed curriculum and commercial materials to meet the needs of the students in
the VPI classes. Program materials support our goals of ensuring students have the experiences and
skills needed to be successful in kindergarten and beyond. When planning learning experiences for
students, a backward design model is used. Teachers first look at the desired outcomes for children as
specified in the Mathematics and Literacy checklists (the APS Scope and Sequence) and Virginia’s
Foundation Blocks. This allows teachers to use both State and National norms and expectations on
which to base a student’s progress. The teachers then plan activities/experiences for the children that
facilitate the development of concepts and skills needed to meet the objectives. Additionally, teachers
utilize the Words Their Way and the Handwriting without Tears materials as part of the VPI literacy
block.
APS is committed to providing a balance between both teacher directed (direct instruction) and student
centered experiences. Teachers use a High-Scope framework in their classroom and all teachers have
students engage in small group interactions as well as the Plan, Do, Review process. For the direct
instruction component all teachers use the Pearson Opening the World of Learning comprehensive early
literacy program and the Alligators to Zucchini early literacy kit. In Mathematics all teachers use Every
Day Counts in Pre-K: Math instructional program as well as the Numbers Plus materials.
For socio-emotional learning, the VPI program uses the Conscious Discipline program. Components of
this program such as family photographs posted, classroom jobs representing every student, a safe
place, etc. is expected to be evident in each classroom so that students feel safe and have their socio-
emotional needs met.
Best and Current Practices
In 2006, a group of Montessori parents, teachers and others produced a best practices document for
APS primary Montessori teachers. It included the following components:
1. A child remains in the same class; any changes in a child’s placement will include a dialogue with
parent(s), teacher and administrator.
2. Parents of children Kindergarten age and up without Montessori experience, who are interested
in Montessori, must meet with a teacher and principal and observe a class in order to determine
if the transition into Montessori is in the best interest of the child.
3. Advanced Practical Life Activities are available, presented, and utilized.
4. Workspace is designed to optimize concentration and engagement.
5. Sound level is low enough to encourage concentration.
6. Conversations are held only in close proximity.
7. Most children working in the classroom demonstrate on-task behavior (attention, eyes focused
on their work and language related to that work)
8. Adults should seldom intervene when children are on-task

11
9. A full complement of Montessori materials is available to the teacher
10. Respect for others space e.g. not interfering or bothering children who are working
11. The teacher acts as a role model.
12. Behaviors promoted –completion of cycles- that the child completes, even if the cycle is short,
teachers demonstrate a focused and well-prepared lesson that is appropriately scripted-
physically models the lesson in a developmentally appropriate manner using the materials.
13. Adults speak in a low voice with close proximity to the child.
14. Adults use the language and behaviors of the grace and courtesy lessons they teach.
15. Adults address the child at his/her eye level.
16. Adults use respectful language.
17. Adults offer assistance when needed and limit unnecessary interference.
18. Teachers use a variety of communication and reporting techniques including the following: parent
conferences, telephone calls, e-mail contacts, written reports, and open house events.
19. A 3 hour work period is provided -preferably not interrupted by specials and in the morning as
little teacher scheduling as possible, as much student choice as possible.
20. Specialist where possible, adopt Montessori principles
21. Absence of extrinsic rewards.
22. Wide variety of exercises (Type and complexity) is available
23. Materials are attractive and arranged with purpose
24. Children practice grace and courtesy
25. Children extend their learning with fine and lively arts
26. A Variety of literature is provided to enhance oral and written experiences
27. Observation, reflection and social interactions are valuable learning activities
28. Most students are engaged in Montessori materials in a focused and appropriate manner.
29. Concentration is evident during work, reflection and observation
30. Children are allowed opportunities to experience silence (teacher or child initiative)
31. Wait time is provided.
32. Teachers have access to funds to furnish classrooms appropriately.
33. Curriculum that is not inherently “Montessori”, will be presented within the parameters of the
Montessori philosophy (i.e., lends itself to independent work and is not solely teacher directed.)
34. Teachers observe for specific purposes (whole class, small group or individual child).
35. Observation is on-going.
36. Observation informs the preparation of the environment and program implementation.
37. Classroom layout enables teachers to monitor students working in all areas of the room.
38. Non-Montessori materials must serve an explicit purpose and are aligned with Montessori
principles and/or APS curriculum.
39. Teachers encourage students to reflect on his/her work.
40. Teachers model language of Montessori self-assessment
41. Teachers assist students in goal setting.
42. Children will use materials in sequence to learn concepts.
43. Materials are arranged in logical sequence.
44. Children have the freedom to choose work and follow their interests.
12
45. Children working in small groups or individually.
46. Whole group lessons are short and kept to a minimum.
47. Teachers present materials and provide opportunities to explore that leads to discovery of
concepts.
48. Children create follow-up work and extensions.
49. Children have multiple opportunities to work on research projects.
VPI Program Guidelines/Expectations:
The VPI program has several consistent guidelines and expectations that have been developed over the
history of the program. These guidelines support consistent implementation and foster high quality
early childhood experiences for students.
1. Classroom schedules reflect the VPI Required Daily Schedule Components.
2. All classes use the Every Day Counts: Every Day in Pre-K Math materials.
3. All classes use the Pearson Opening the World of Learning Early Literacy Program (OWL).
Teachers implement the curriculum per APS guidelines.
4. All teachers implement the OWL Story Time and Songs, Word Play and Letters (SWIPLE)
components of the program as described in the teacher’s manual.
5. All teachers implement the High/Scope work time “Plan, Do, Review” a minimum of 45 minutes
a day, 4 days per week.
6. All teachers attend and participate in regular VPI professional development opportunities.
7. All teachers conduct home visits for each child in their class.
8. All teachers take at least two field trips. These may include a walking field trip.
9. All parents have the opportunity to attend 3 parent involvement activities. These may be done
in conjunction with other activities already scheduled at the school.
10. All classroom environments facilitate both small and large group activities and have the
following four areas: Blocks, Toys, Home and Art.
Professional Development
The Office of Early Childhood works closely with the Department of Instruction to provide professional
learning opportunities for all Pre-K teachers.
Because primary Montessori teachers educate students in the kindergarten year, they often participate
in school-based professional learning to ensure an understanding of what is being taught in the general
education kindergarten classroom and meet those needs in the Montessori classroom.
Additionally, The Office of Early Childhood provides the funding for primary Montessori teachers to
attend professional Montessori conferences and workshops to meet their individual needs and training
as Montessori guides. Additional training is provided for primary Montessori assistants to learn more
about their role in the prepared Montessori environment.

13
The Office of Early Childhood collaborates with the Special Education Office to plan and execute
differentiated professional learning for VPI and Special Education Pre-K teachers. Past trainings have
included Early Childhood SIOP best practices, support for inclusive classrooms serving children with
disabilities, socio-emotional support for students, literacy training, and more.
VPI and Special education assistants receive a choice of developmentally appropriate trainings to best
meet their needs to support the Pre-K classroom.
Resources
The budget for the Department of Instruction includes funds for approved curriculum and staff
development. The FY 2017 budget includes $1,013,490 that is shared among all instructional programs
to pay for
salaries for curriculum work done by teachers
salaries and costs for in-service professionals, including outside consultants, contract courses,
and staff participating in professional learning outside of their contract hours
Conference registration fees for both presenters and attendees
School-based professional development
The Office of Early Childhood is responsible for the implementation of Pre-Kindergarten initiatives, VPI
and Montessori, as well as co-supervision of the Montessori elementary program. Support for
instruction and professional development is a shared responsibility with the other offices throughout
the Department of Instruction as well as the Department of Student Services and Special Education.
The primary responsibilities of the three Early Childhood Office employees are described in Table 1:
Table 1: Early Childhood Office Staff and Responsibilities
Employee Primary Responsibilities
Director of
Early
Childhood and
Elementary
Education
(fulltime)
Supervises the Early Childhood Coordinator and subsequent management of
the Virginia Preschool Initiative Program
Supervises the Early Childhood Coordinator and subsequent management of
the Pre-K programs
Plans, leads and coordinates APS school improvement Initiatives for identified
schools
Engages in APS executive Leadership (ELC) Initiative for continuous school
improvement
Provides systematic and targeted instruction and organizational support
monthly & weekly to identified schools (operational, management and
instructional leadership)

14
Screens, interviews, and mentors staff (both administrators and others)
Formally observes teachers and provides feedback related to the instructional
programs and student learning
Coaches identified principals on a biweekly/monthly basis
Plans and facilitates intra-departmental meetings to align priorities related to
parent engagement and collaboration and professional learning opportunities
for staff
Serves in leadership role for Department of Instruction and APS initiatives and
projects (i.e. PLC, Festival of the Minds, data-driven instruction, master
scheduling, early literacy initiatives, formative assessment, ATSS, etc.)
Establishes and fosters APS division-wide collaboration to enhance the
educational opportunities for staff to strengthen the APS Pre-K and
elementary programs
Coordinator,
Early
Childhood
(fulltime)
Supervises and manages the Virginia Preschool Initiative (VPI) to include
writing of grant, management of budget, coordination of outside services
including dental, health and social services
Supports school administration in interviewing potential teaching candidates
and assists with the hiring process for both the VPI and primary Montessori
programs
Develops and facilitates professional development with VPI and Montessori
teachers and assistants
Works with parents and private providers to answer questions and assist in
planning for entry to the Arlington Public Schools both for Pre-K and
kindergarten
Supervises and provides formal observations of VPI, Montessori and K-2
teachers upon request
Serves on local and state committees addressing issues relevant to young
children and their families including the Arlington Child Care Committee,
George Mason early childhood subgroup, Wolf Trap Early Learning Committee
and VA Early Childhood Council
Collaborates with Information Services and School & Family Relations to
provide training to school registrars
Serves as the liaison to the Advisory Council on instruction’s Early Childhood
Advisory Committee
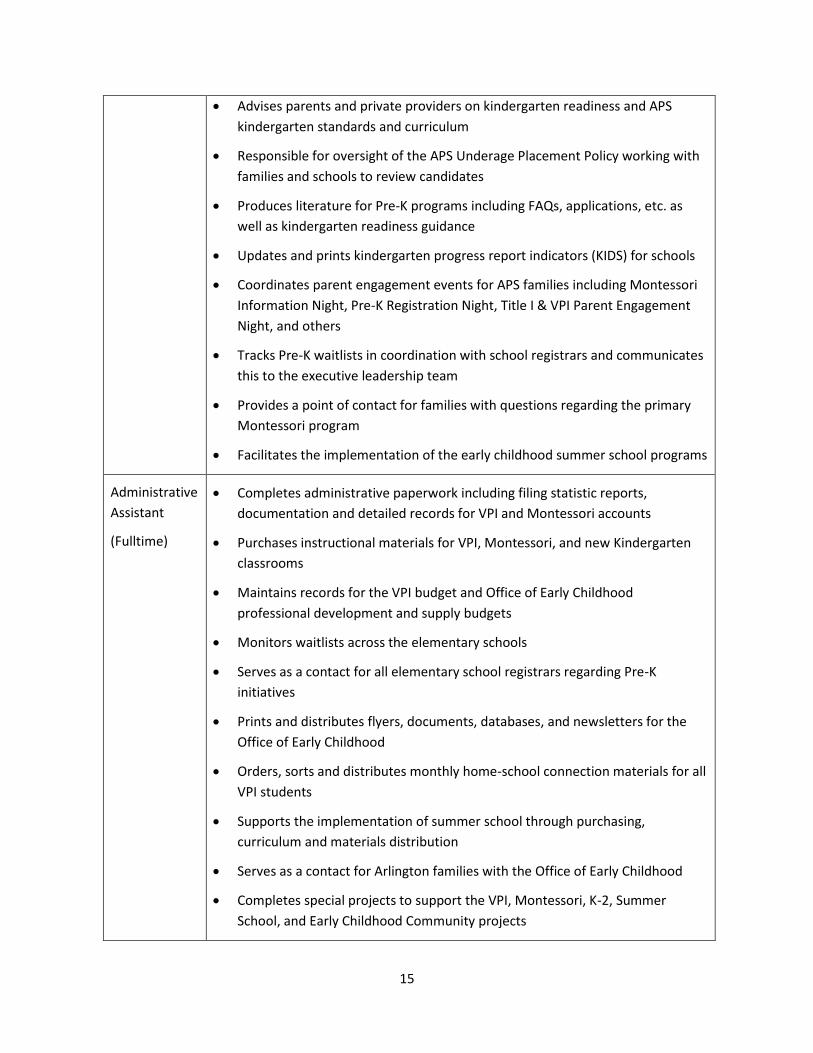
15
Advises parents and private providers on kindergarten readiness and APS
kindergarten standards and curriculum
Responsible for oversight of the APS Underage Placement Policy working with
families and schools to review candidates
Produces literature for Pre-K programs including FAQs, applications, etc. as
well as kindergarten readiness guidance
Updates and prints kindergarten progress report indicators (KIDS) for schools
Coordinates parent engagement events for APS families including Montessori
Information Night, Pre-K Registration Night, Title I & VPI Parent Engagement
Night, and others
Tracks Pre-K waitlists in coordination with school registrars and communicates
this to the executive leadership team
Provides a point of contact for families with questions regarding the primary
Montessori program
Facilitates the implementation of the early childhood summer school programs
Administrative
Assistant
(Fulltime)
Completes administrative paperwork including filing statistic reports,
documentation and detailed records for VPI and Montessori accounts
Purchases instructional materials for VPI, Montessori, and new Kindergarten
classrooms
Maintains records for the VPI budget and Office of Early Childhood
professional development and supply budgets
Monitors waitlists across the elementary schools
Serves as a contact for all elementary school registrars regarding Pre-K
initiatives
Prints and distributes flyers, documents, databases, and newsletters for the
Office of Early Childhood
Orders, sorts and distributes monthly home-school connection materials for all
VPI students
Supports the implementation of summer school through purchasing,
curriculum and materials distribution
Serves as a contact for Arlington families with the Office of Early Childhood
Completes special projects to support the VPI, Montessori, K-2, Summer
School, and Early Childhood Community projects
16
All Pre-K teachers have earned a Virginia State Teaching license. Most have earned advanced degrees.
Montessori teachers hold a second Montessori credential from either American Montessori Society
(AMS) or American Montessori International (AMI). The instructional assistants have varied educational
experiences.
The teaching staff for FY 2017 is funded through school planning factors and includes the following
positions that support early childhood instruction:
19 Pre-K Montessori teachers
35 VPI teachers
54 instructional assistants
The average teacher salary in FY2017 is $78,002.
Class Size
Each Montessori class has a maximum capacity of 23 students and is served by a Montessori teacher as
well as an instructional assistant. APS has 19 primary classes across 9 schools.
VPI classrooms have between 16-18 students served by a teacher and an instructional assistant. This
number fluctuates based on availability of VPI-eligible 4-year-old students with disabilities at particular
sites. During the 2016-17 school year there are 35 VPI classes across 16 schools. Pre-K students with
disabilities are included in accordance with their IEPs in both VPI and primary Montessori classrooms.
Other Program Resources
In addition to set class sizes and appropriate levels of staffing, APS Pre-K programs have access to a
variety of curricular materials and other program resources:
Montessori materials and curriculum
VPI materials and curriculum
Opening the World of Learning (OWLs): A Comprehensive Early Literacy Program: Pearson
Early Learning
Every Day in Pre-K Math: Great Source Education Company
Handwriting Without Tears: Teacher’s guide, student books, manipulative kits: Handwriting
Without Tears Company
Words Their Way, Pearson
In addition to APS operating funds, the VPI grant provides $3,000 per student served, while many of the
families with Montessori students pay tuition on a sliding scale.
Status of Recommendations Made in Previous Evaluations
The Early Childhood Program was last evaluated in 2010 and included the following recommendations.
Maintains the Office of Early Childhood website

17
Table 2: Status of Recommendations Made in Previous Evaluations
Recommendation Status
Continue to provide both Montessori and VPI Pre-K
programs for Arlington families, giving priority to
students who are economically disadvantaged or limited
English proficient.
APS has increased Pre-K enrollment in
both programs since the last
evaluation. For current numbers, see
Participation in APS Pre-K Programs on
page 36.
Provide professional development
that addresses instructional support as defined by
the CLASS framework, for teachers and instructional
assistants in both the Montessori and VPI programs.
The professional development should provide
opportunities for Pre-K staff to become skilled in the
areas of concept development, quality feedback and
language modeling.
for instructional assistants that ensures the quality
of instruction is consistent within the classroom.
that continues to reinforce the classroom
organization as described by the CLASS for VPI
teachers, to reduce the variability of
implementation.
The EC Office continues to provide
targeted professional development to
support instructional needs.
The EC Office has increased
professional development
opportunities for all assistants since
the last evaluation.
Identify consistent methods to monitor student
progress in mathematics, using existing assessments
such as work sampling and Montessori record keeping.
VPI teachers now have a curriculum
framework created by a committee of
teachers in 2013. Additionally, VPI
teachers now use the DMA math
assessment to measure numeracy
understanding.
Montessori teachers now have the
option to use Montessori Records
Express (MRX) to record progress.
Review the personnel descriptions for Pre-K
instructional assistants and determine if revisions are
needed that align APS more closely with the QRIS
expectations for a 5-star rating. Determine ways to
develop the skills so instructional assistants meet any
new requirements.
Job descriptions for instructional
assistants have been updated to
ensure that candidates meet the
criteria for highly qualified staff
Instructional assistants are provided
training and support by the Early
Childhood Office annually.
18
Expressed Concerns
Although APS has increased access to both the VPI and Montessori Pre-K programs, there is continued
interest in increasing access to Pre-K programs. APS wait list data suggest strong interest in both
programs, while the state of Virginia also identifies unmet need4. The VPI wait list has included
approximately 50 students a year over the past three years. For school year 2009-10 the Commonwealth
of Virginia estimated 549 unserved, at-risk four year old children in Arlington were eligible for the VPI
program. APS provided VPI spots for 496 students. This report includes a section on program capacity.
As APS continues to increase the number of Pre-K classrooms, questions have been raised about the
long term impact this program has on student outcomes. This report includes a longitudinal study of
students who started in the Pre-K program.
Pre-K teachers indicate that they need more time to plan for instruction. This concern is not addressed
within this evaluation report since it was raised after data collection was underway.
Methodology
Evaluation Design and Questions
Table 3 displays the Early Childhood evaluation design.
4 Virginia Preschool Initiative Projected Grant Application.
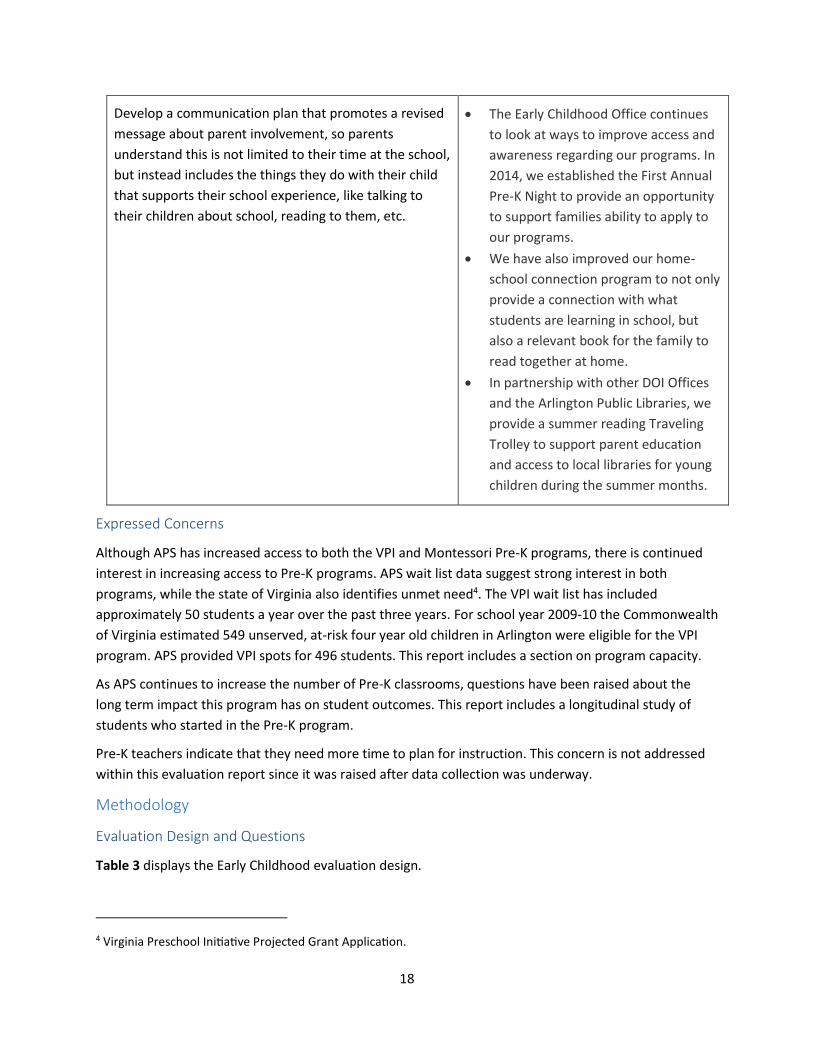
Develop a communication plan that promotes a revised
message about parent involvement, so parents
understand this is not limited to their time at the school,
but instead includes the things they do with their child
that supports their school experience, like talking to
their children about school, reading to them, etc.
The Early Childhood Office continues
to look at ways to improve access and
awareness regarding our programs. In
2014, we established the First Annual
Pre-K Night to provide an opportunity
to support families ability to apply to
our programs.
We have also improved our home-
school connection program to not only
provide a connection with what
students are learning in school, but
also a relevant book for the family to
read together at home.
In partnership with other DOI Offices
and the Arlington Public Libraries, we
provide a summer reading Traveling
Trolley to support parent education
and access to local libraries for young
children during the summer months.

19
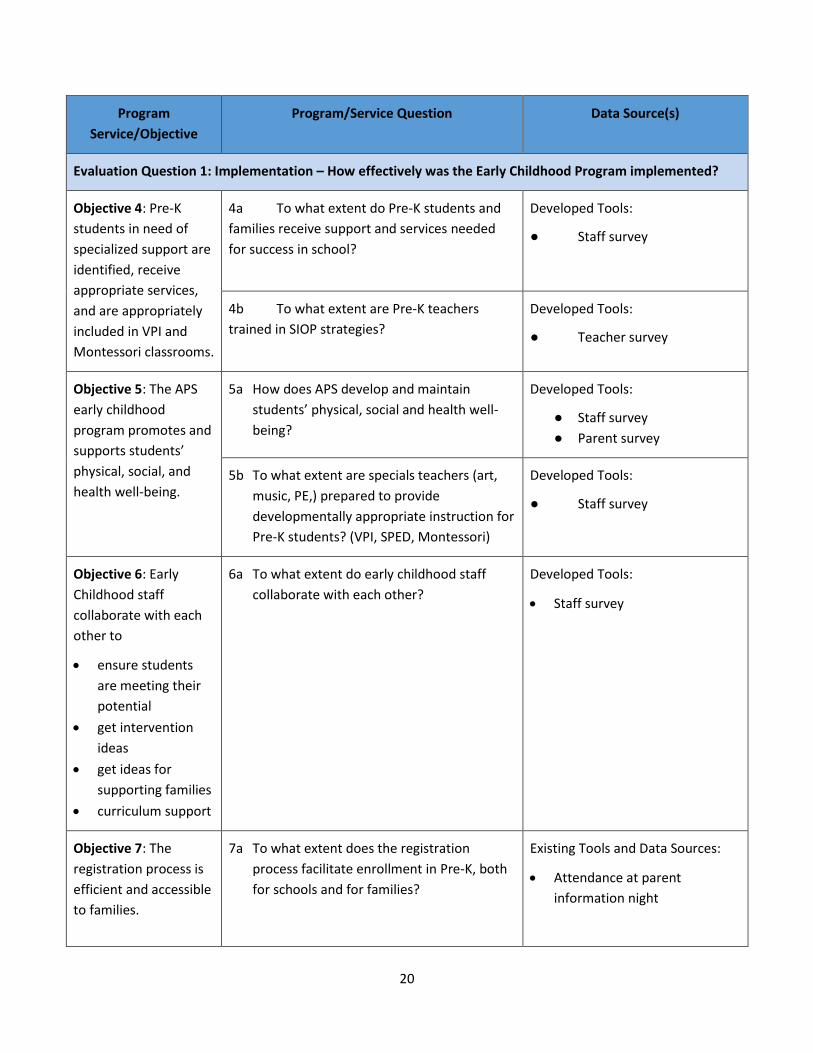
Table 3: Early Childhood Evaluation Design
Program
Service/Objective
Program/Service Question Data Source(s)
Evaluation Question 1: Implementation – How effectively was the Early Childhood Program implemented?
Objective 1: Best
instructional practices
for emotional support,
classroom
organization,
instructional support,
and student
engagement are
evident across
instruction in Pre-K
classrooms.
1a To what degree are best instructional
practices evident in Pre-K classrooms?
Existing Tools and Data Sources:
● Observations using the
Classroom Assessment Scoring
System (CLASS)
Objective 2: The APS
Early Childhood
Montessori program
follows best practices
aligned to the
Montessori philosophy.
2a To what extent does observed early
childhood Montessori instruction align with
Montessori best practices?
Developed Tools:
● APS-developed Montessori
observation
2b To what extent do primary Montessori
students participate in the program for the
full three years?
Existing Tools and Data Sources:
● Pre-K enrollment
2c What factors lead some parents to leave
Montessori after the 3- and 4-year-old
years?
Developed Tools:
● Parent survey
2d To what extent does kindergarten attrition
affect Montessori program fidelity?
Developed Tools:
● Teacher survey
Objective 3: APS Pre-K
programs are
accessible to all
students who are
eligible to participate.
3a Who participates in APS Pre-K programs?
Demographic representation
Variability among locations
Existing Tools and Data Sources:
● Enrollment
● Household income
3b What factors contribute to participation or
non-participation in APS Pre-K programs?
Developed Tools:
● Parent survey
20
Program
Service/Objective
Program/Service Question Data Source(s)
Evaluation Question 1: Implementation – How effectively was the Early Childhood Program implemented?
Objective 4: Pre-K
students in need of
specialized support are
identified, receive
appropriate services,
and are appropriately
included in VPI and
Montessori classrooms.
4a To what extent do Pre-K students and
families receive support and services needed
for success in school?
Developed Tools:
● Staff survey
4b To what extent are Pre-K teachers
trained in SIOP strategies?
Developed Tools:
● Teacher survey
Objective 5: The APS
early childhood
program promotes and
supports students’
physical, social, and
health well-being.
5a How does APS develop and maintain
students’ physical, social and health well-
being?
Developed Tools:
● Staff survey
● Parent survey
5b To what extent are specials teachers (art,
music, PE,) prepared to provide
developmentally appropriate instruction for
Pre-K students? (VPI, SPED, Montessori)
Developed Tools:
● Staff survey
Objective 6: Early
Childhood staff
collaborate with each
other to
ensure students
are meeting their
potential
get intervention
ideas
get ideas for
supporting families
curriculum support
6a To what extent do early childhood staff
collaborate with each other?
Developed Tools:
Staff survey
Objective 7: The
registration process is
efficient and accessible
to families.
7a To what extent does the registration
process facilitate enrollment in Pre-K, both
for schools and for families?
Existing Tools and Data Sources:
Attendance at parent
information night
21
Program
Service/Objective
Program/Service Question Data Source(s)
Evaluation Question 1: Implementation – How effectively was the Early Childhood Program implemented?
Developed Tools:
● Parent survey
● Staff survey
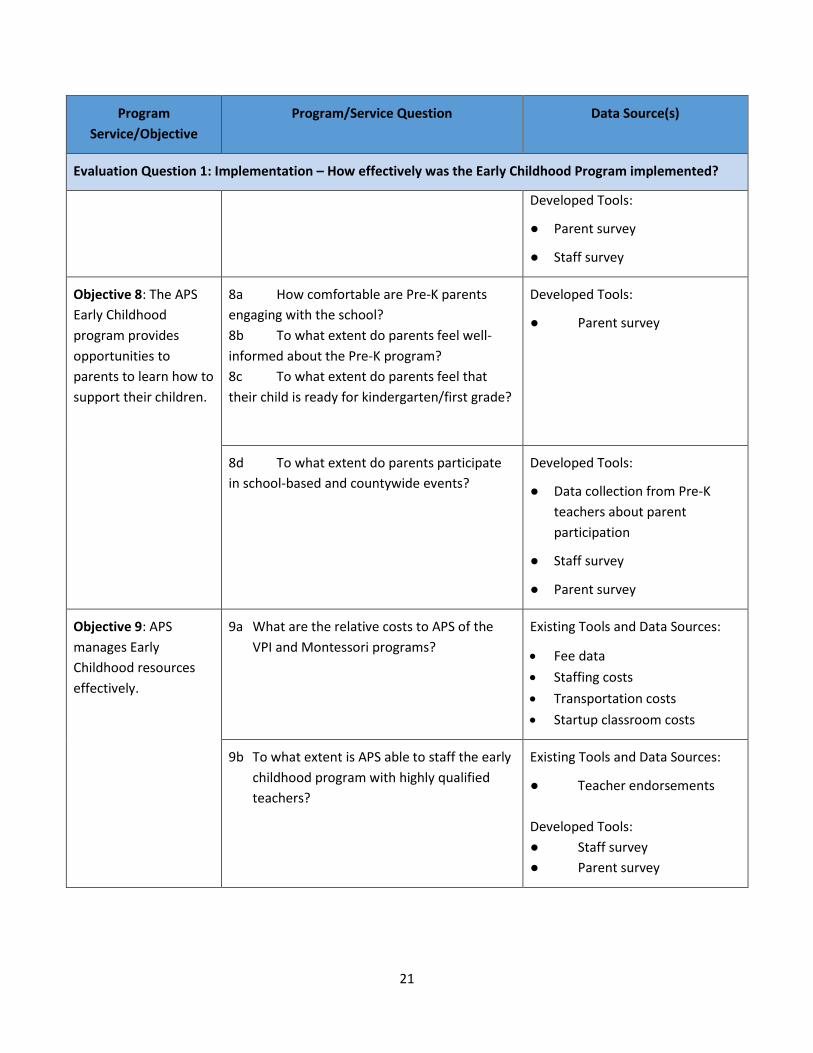
Objective 8: The APS
Early Childhood
program provides
opportunities to
parents to learn how to
support their children.
8a How comfortable are Pre-K parents
engaging with the school?
8b To what extent do parents feel well-
informed about the Pre-K program?
8c To what extent do parents feel that
their child is ready for kindergarten/first grade?
Developed Tools:
● Parent survey
8d To what extent do parents participate
in school-based and countywide events?
Developed Tools:
● Data collection from Pre-K
teachers about parent
participation
● Staff survey
● Parent survey
Objective 9: APS
manages Early
Childhood resources
effectively.
9a What are the relative costs to APS of the
VPI and Montessori programs?
Existing Tools and Data Sources:
Fee data
Staffing costs
Transportation costs
Startup classroom costs
9b To what extent is APS able to staff the early
childhood program with highly qualified
teachers?
Existing Tools and Data Sources:
● Teacher endorsements
Developed Tools:
● Staff survey
● Parent survey
22
Program
Service/Objective
Program/Service Question Data Source(s)
Evaluation Question 1: Implementation – How effectively was the Early Childhood Program implemented?
9c How effective and relevant is the
professional development provided to Pre-K
teachers and assistants?
Developed Tools:
● Staff survey
9d To what extent are teachers satisfied with
division-level support?
Developed Tools:
● Staff survey
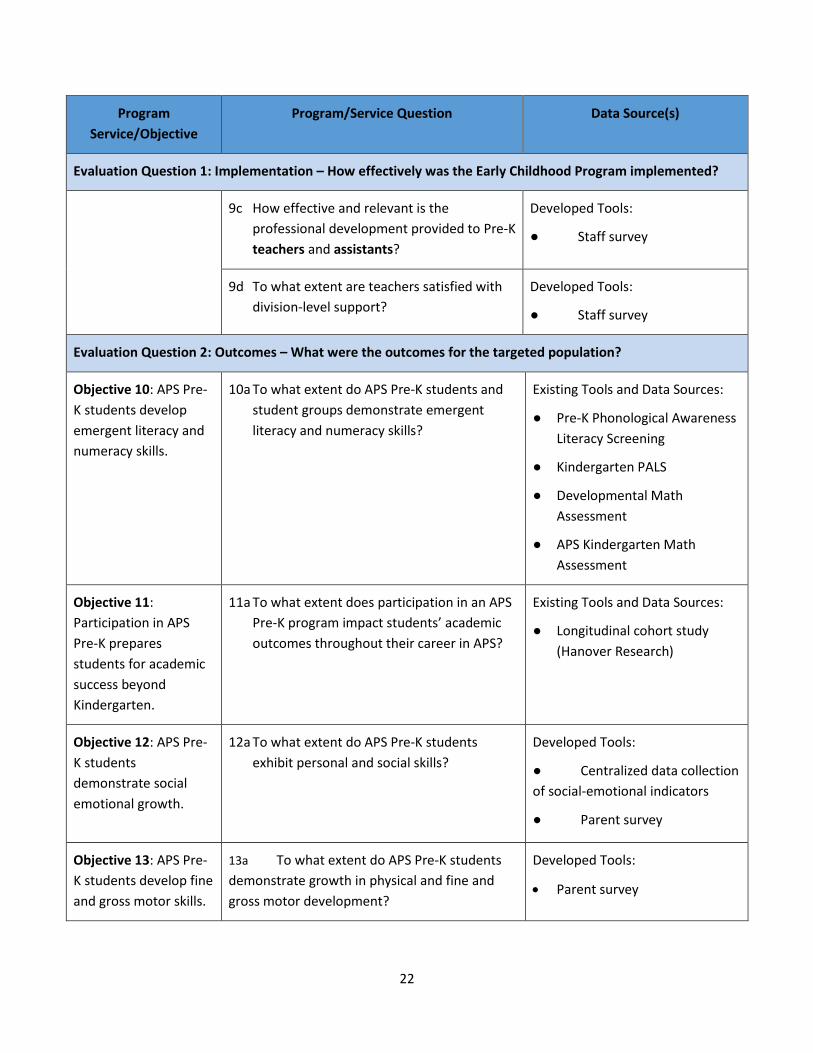
Evaluation Question 2: Outcomes – What were the outcomes for the targeted population?
Objective 10: APS Pre-
K students develop
emergent literacy and
numeracy skills.
10a To what extent do APS Pre-K students and
student groups demonstrate emergent
literacy and numeracy skills?
Existing Tools and Data Sources:
● Pre-K Phonological Awareness
Literacy Screening
● Kindergarten PALS
● Developmental Math
Assessment
● APS Kindergarten Math
Assessment
Objective 11:
Participation in APS
Pre-K prepares
students for academic
success beyond
Kindergarten.
11a To what extent does participation in an APS
Pre-K program impact students’ academic
outcomes throughout their career in APS?
Existing Tools and Data Sources:
● Longitudinal cohort study
(Hanover Research)
Objective 12: APS Pre-
K students
demonstrate social
emotional growth.
12a To what extent do APS Pre-K students
exhibit personal and social skills?
Developed Tools:
● Centralized data collection
of social-emotional indicators
● Parent survey
Objective 13: APS Pre-
K students develop fine
and gross motor skills.
13a To what extent do APS Pre-K students
demonstrate growth in physical and fine and
gross motor development?
Developed Tools:
Parent survey
23
Study Measures
Data sources used to inform this evaluation are described in detail below.
Outcomes: Classroom Assessment Scoring System (CLASS)
The Classroom Assessment Scoring System (CLASS) is an observation tool developed at the University of
Virginia’s Curry School of Education to analyze the interactions among adults, students, and content.
CLASS observations were conducted in the winter of 2016 at all elementary schools with Pre-K
programs.
The domains and dimensions of the CLASS tool are described in detail in Appendix B1. Appendix B2
describes the alignment between CLASS dimensions and APS best instructional practices. A summary of
CLASS data used in this evaluation is available in Appendix B3.
Implementation: Montessori Observations
In order to assess APS primary Montessori classrooms’ fidelity to the Montessori philosophy, the Office
of Planning and Evaluation contracted with the Montessori Training Center Northeast (MTCNE), a part of
the Capitol Region Educational Council (CREC) in Hartford, Connecticut. An MTCN evaluator was able to
complete 18 observations out of 19 primary classrooms in February 2016. Their full report is available in
Appendix B4.
Implementation: Enrollment
This evaluation uses Pre-K enrollment data from Synergy, the student information system. Full
enrollment information is available in Appendix C1.
Implementation: Parent Participation
Throughout the 2015-16 school year, Planning and Evaluation collected information from Pre-K teachers
about the types of parent participation that occurred for each child in their class. The full report can be
found in Appendix C2.
Stakeholder Feedback: Surveys
Several surveys were developed and administered as part of this evaluation. A staff survey was
administered in fall 2015 to Pre-K teachers and assistants, as well as elementary specials teachers,
principals, assistant principals, and front office staff known to work on Pre-K registration. In March-April,
2016, two separate surveys were administered to parents of kindergartners who had discontinued the
Montessori program, or who had not attended a Pre-K program at all. In June 2016, a survey was
administered to parents of current Pre-K students. Due to low a low response rate, data from the non-
participant survey has been excluded from this evaluation. Parent survey results can be found in
Appendix D1, and staff survey results can be found in Appendix D4.
Implementation: Cost Comparison
Planning and Evaluation contracted with Hanover Research (Hanover) to conduct a comparison of costs
and revenue for the Montessori and VPI programs. The analysis also included a summary of teacher
qualification by program. The full Hanover report can be found in Appendix E1.

24
Outcomes: Phonological Awareness Literacy Screening (PALS)
PALS results were downloaded from the PALS site for this evaluation. The full analysis of Pre-K PALS
results can be found in Appendix F1. The full analysis of fall K PALS results, disaggregated by prior Pre-K
experience, can be found in Appendix F4.
Outcomes: Developmental Math Assessment (DMA)
The Developmental Math Assessment (DMA) was selected in 2011-12 to evaluate the mathematical
understanding of students in the VPI program. The DMA is used for all VPI and 3-5 year-old Special
Education Pre-K students and is administered at three points in the year. The Office of Early Childhood
provided Planning and Evaluation with three years of DMA data for VPI students, and the Special
Education Office provided the most recent year of DMA data. The full report is available in Appendix F2.
Outcomes: Kindergarten Math Assessment
The Math Office provided Planning and Evaluation with four years of kindergarten math assessment
data. This assessment is an APS-developed test that measures students’ mastery of kindergarten math
skills. An analysis of fall math assessment scores by prior Pre-K experience is available in Appendix F3.
Outcomes: Longitudinal Study
Planning and Evaluation contracted with Hanover to conduct a longitudinal analysis of achievement data
for two cohorts of APS Pre-K students. The full Hanover report can be found in Appendix F5.
Outcomes: Social Emotional Outcomes
Planning and Evaluation collected information from all Pre-K teachers on social-emotional outcomes for
their students at three points during the 2015-16 school year. The analysis of these outcomes can be
found in Appendix F6.

25
SECTION 2: FINDINGS
Evaluation Question #1: How effectively was the Early Childhood program implemented?
To address this question, the evaluation focused on several areas: quality of instruction, program
fidelity, meeting the needs of the whole child, community and parent engagement, and effective use of
resources.
Quality of Instruction
CLASS Observations
CLASS observations across programs show a high level of emotional support and classroom
organization, while instructional support scores fall into the low-mid range. Regard for Student
Perspectives appears to be particularly strong in Montessori classrooms.
Arlington Public Schools uses the Classroom Assessment Scoring System (CLASS) observation tool to
assess the quality of interactions between teachers and students for all program evaluation areas. It was
developed by the University of Virginia’s Curry School of Education as an early childhood observation
tool, and later expanded to include other grade levels.
The CLASS tool is grounded in developmental theory and research that suggest that interactions
between students and adults are the primary mechanism for student learning. Multiple research studies
have found that students who attend classrooms that rate highly on the CLASS have improved social and
academic outcomes (Howes. et al., 2008).
The Pre-K CLASS is organized into three broad domains: Emotional Support, Classroom Organization, and
Instructional Support. Each domain contains specific observable dimensions that are appropriate to each
grade level. Table 4 outlines the dimensions included in each domain of the Pre-K CLASS tool.
Dimensions are scored on a 7-point scale consisting of Low (1, 2), Mid (3, 4, 5), and High (6, 7) ranges.
Table 4: Pre-K CLASS Domains and Dimensions
Domain Dimension Measures
Emotional Support
Positive Climate Warmth and connection shared by teachers and students, verbal and non-verbal
Negative Climate Expressed negativity among teachers and students, verbal and non-verbal
Teacher Sensitivity Teacher awareness and responsiveness to students’ academic and social needs
Regard for Student Perspectives
Degree to which teachers emphasize students’ interests, motivations, and points of view, and promote students’ independence
Classroom Organization
Behavior Management Teachers’ use of clear behavioral expectations and effectiveness at redirecting misbehavior
Productivity How well the teacher manages time and routines so instructional time is maximized

26
Domain Dimension Measures
Instructional Learning Formats
Teachers’ employment of lessons and materials to support different learning styles, interests, and abilities
Instructional Support
Concept Development Facilitation of students’ broader understanding of concepts and ideas
Quality of Feedback Degree to which feedback expands learning and understanding
Language Modeling Quality and amount of language-stimulation and facilitation techniques
CLASS domains and dimensions are described in detail in Appendix B1. The alignment between CLASS
dimensions and APS best instructional practices can be found in Appendix B2.
Pre-K CLASS observations were conducted in the winter of 2016 at all elementary schools with Pre-K
programs. Observers conducted two 30-minute cycles (observations) for each teacher. All 34 VPI
teachers were observed, along with 18 out of 19 Montessori teachers and 18 out of 19 Special Education
teachers. Figure 1 shows the average CLASS scores for each domain by level.
For context, two sets of additional CLASS scores are included in this analysis:
Mean scores from the prior evaluation of the Early Childhood program. These observations were
conducted in 2008-09 in VPI and Montessori classrooms. Mean scores are included here as an
average for both programs combined as the prior report did not include a comparison between
the two programs.
Mean scores from a national review of Head Start programs. This review was conducted by the
Office of Head Start in 2015, and included a series of CLASS observations conducted in a random
sample of Head Start preschool classrooms.5
When interpreting CLASS results, Teachstone advises that typically, half a point to a point difference is
considered to be educationally significant; in other words, a difference that would impact outcomes for
students6. Mean scores for APS programs and the national Head Start comparison data show no
educationally significant differences among programs, but do show some large gaps among domains.
5 https://eclkc.ohs.acf.hhs.gov/hslc/data/class-reports/class-data-2015.html 6 Teachstone, personal communication, June 13, 2014 and January 5, 2016
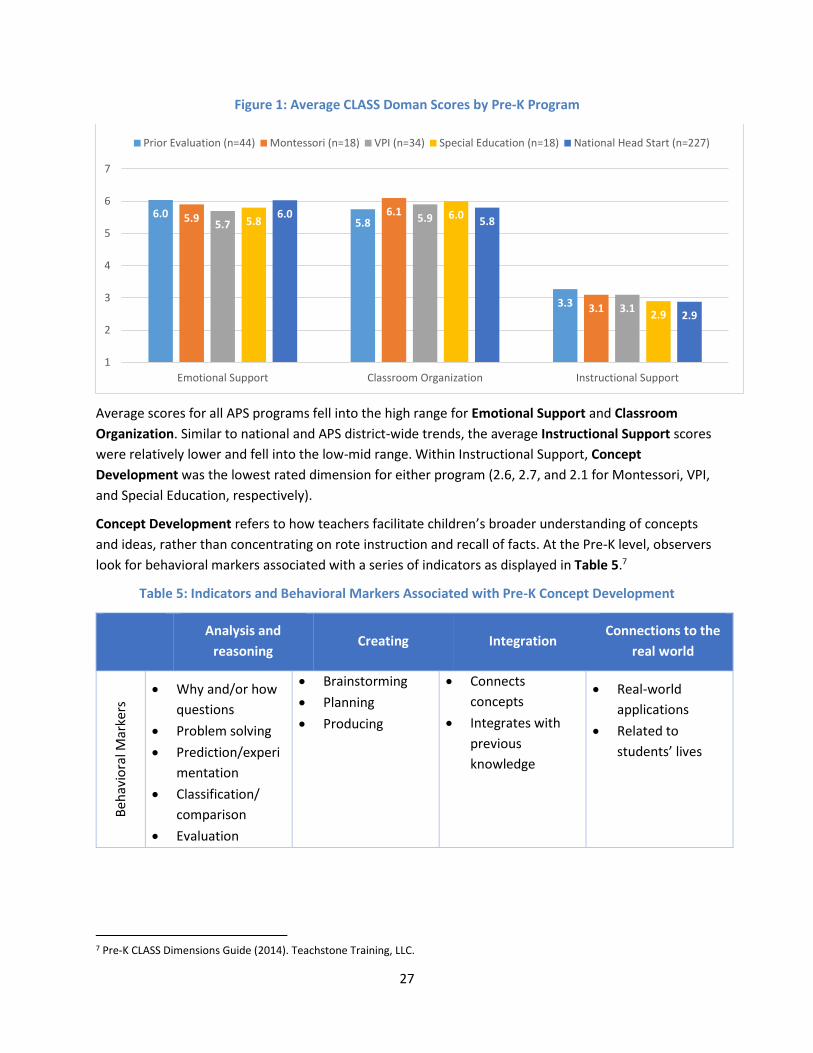
27
Figure 1: Average CLASS Doman Scores by Pre-K Program
Average scores for all APS programs fell into the high range for Emotional Support and Classroom
Organization. Similar to national and APS district-wide trends, the average Instructional Support scores
were relatively lower and fell into the low-mid range. Within Instructional Support, Concept
Development was the lowest rated dimension for either program (2.6, 2.7, and 2.1 for Montessori, VPI,
and Special Education, respectively).
Concept Development refers to how teachers facilitate children’s broader understanding of concepts
and ideas, rather than concentrating on rote instruction and recall of facts. At the Pre-K level, observers
look for behavioral markers associated with a series of indicators as displayed in Table 5.7
Table 5: Indicators and Behavioral Markers Associated with Pre-K Concept Development
Analysis and
reasoning Creating Integration
Connections to the
real world
Beh
avio
ral M
arke
rs
Why and/or how
questions
Problem solving
Prediction/experi
mentation
Classification/
comparison
Evaluation
Brainstorming
Planning
Producing
Connects
concepts
Integrates with
previous
knowledge
Real-world
applications
Related to
students’ lives
7 Pre-K CLASS Dimensions Guide (2014). Teachstone Training, LLC.
6.05.8
3.3
5.96.1
3.1
5.75.9
3.1
5.86.0
2.9
6.05.8
2.9
1
2
3
4
5
6
7
Emotional Support Classroom Organization Instructional Support
Prior Evaluation (n=44) Montessori (n=18) VPI (n=34) Special Education (n=18) National Head Start (n=227)
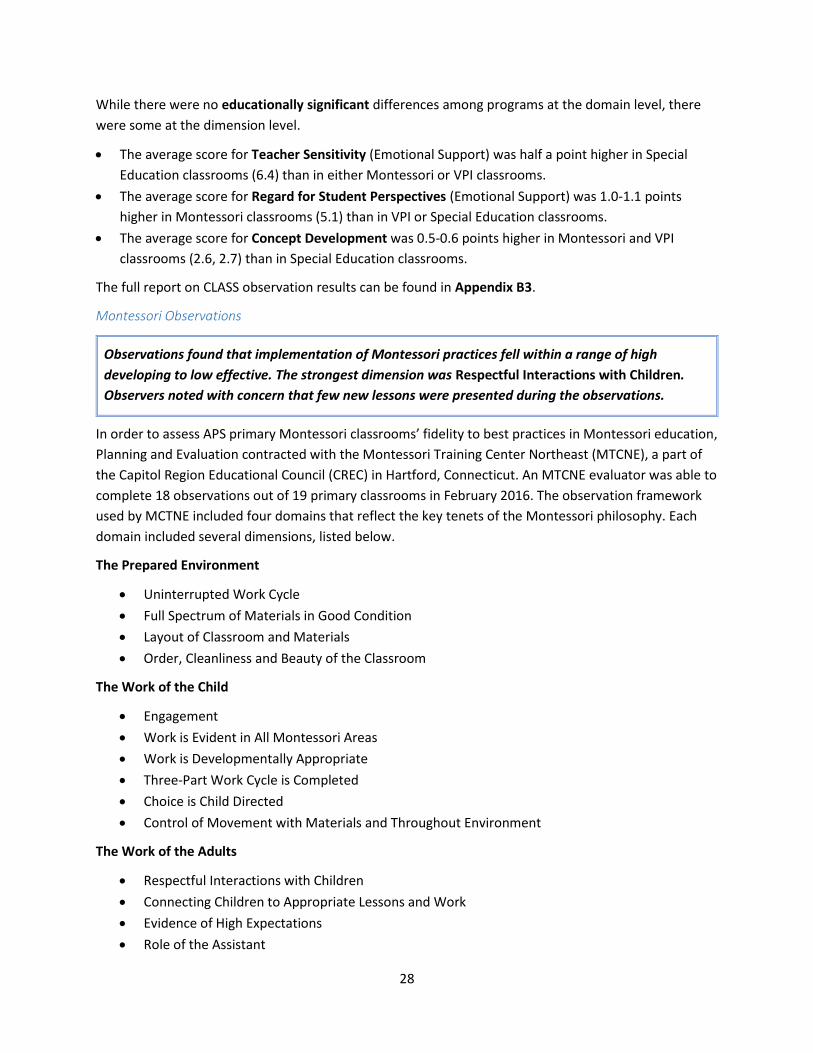
28
While there were no educationally significant differences among programs at the domain level, there
were some at the dimension level.
The average score for Teacher Sensitivity (Emotional Support) was half a point higher in Special
Education classrooms (6.4) than in either Montessori or VPI classrooms.
The average score for Regard for Student Perspectives (Emotional Support) was 1.0-1.1 points
higher in Montessori classrooms (5.1) than in VPI or Special Education classrooms.
The average score for Concept Development was 0.5-0.6 points higher in Montessori and VPI
classrooms (2.6, 2.7) than in Special Education classrooms.
The full report on CLASS observation results can be found in Appendix B3.
Montessori Observations
Observations found that implementation of Montessori practices fell within a range of high
developing to low effective. The strongest dimension was Respectful Interactions with Children.
Observers noted with concern that few new lessons were presented during the observations.
In order to assess APS primary Montessori classrooms’ fidelity to best practices in Montessori education,
Planning and Evaluation contracted with the Montessori Training Center Northeast (MTCNE), a part of
the Capitol Region Educational Council (CREC) in Hartford, Connecticut. An MTCNE evaluator was able to
complete 18 observations out of 19 primary classrooms in February 2016. The observation framework
used by MCTNE included four domains that reflect the key tenets of the Montessori philosophy. Each
domain included several dimensions, listed below.
The Prepared Environment
Uninterrupted Work Cycle
Full Spectrum of Materials in Good Condition
Layout of Classroom and Materials
Order, Cleanliness and Beauty of the Classroom
The Work of the Child
Engagement
Work is Evident in All Montessori Areas
Work is Developmentally Appropriate
Three-Part Work Cycle is Completed
Choice is Child Directed
Control of Movement with Materials and Throughout Environment
The Work of the Adults
Respectful Interactions with Children
Connecting Children to Appropriate Lessons and Work
Evidence of High Expectations
Role of the Assistant

29
Managing Student Behavior
Lesson and Assessment Record Keeping
The Community of Children
Children Respect the Environment
Kind and Respectful Social Language and Movement
Appropriate Mixed Aged Groups
Spontaneous, Productive Work Groups
Dimensions were rated using a 4-point rubric, with 1 indicating ineffective and 4 indicating highly
effective. Average scores fall between 2.6 and 2.9, within a range of high developing (2) to low effective
(3). In order to assess whether there are differences between the countywide primary Montessori
program and the satellite programs, MCTNE provided a breakdown of the average scores comparing
observations conducted at Drew (countywide) and those conducted at other schools (satellites). Figure
2 shows the average domain scores by location. Average scores are consistent across domains, with only
minor differences between the countywide program and satellite programs.
Figure 2: Average Montessori Domain Scores by Location
In the summary of the observations focusing on Work of the Child, the MCTNE report noted that:
It is also the work of the adult to connect children to lessons and to work. Many of the teachers
did not give specific lessons but roamed the room, stopping to assist children as needed. Though
review or assistance may be helpful to the child, of significant note were very few new lessons
were presented during the three observation days. Two lessons were given that were not
Montessori lessons. In light of the previously mentioned observation, lack of Montessori
materials being chosen, this observed pattern should be examined by the APS Montessori
teaching staff.
2.9
2.6
2.9
2.62.7
2.62.8
2.7
1
2
3
4
PreparedEnvironment
Work of the Child Work of the Adults Community ofChildren
Countywide Satellites
30
Among the dimensions, average scores are also fairly consistent between the countywide and satellite
programs, with just two exceptions:
Prepared Environment: Full Spectrum of Materials in Good Condition (3.1 countywide, 2.6
satellites)
Work of the Child: Work is Evident in All Montessori Areas (2.7 countywide, 2.4 satellites)
The strongest dimension was Respectful Interactions with Children in the Work of the Adults domain,
with scores of 3.3 for both Drew and satellite programs.
The full MCTNE report, including commendations and recommendations, is available in Appendix B4.
SIOP Training
Most APS Pre-K teachers have participated in some form of SIOP training. VPI teachers were the
most likely to report that they implement SIOP strategies daily.
The Sheltered Instruction Observation Protocol (SIOP) Model is a research-based and validated model of
sheltered instruction for English language learners. VPI and Special Education Pre-K teachers were
required to participate in SIOP training offered by the Early Childhood Office during a three-year period
from 2012-13 through 2014-15. Primary Montessori teachers were invited to participate as well; their
participation was optional.
A survey administered to Pre-K teachers and assistants in fall 2015 included a series of questions about
participation in SIOP training and application of SIOP strategies in Pre-K classrooms. Figure 3 shows the
percentage of respondents who indicated that they had participated in SIOP training offered by their
school, by the Early Childhood Office, or by another source. Most Pre-K teachers indicated that they had
participated in some form of SIOP training.
Unsurprisingly, Montessori teachers were far more likely to have participated in school-based training
(60%) than training offered by the Early Childhood Office that focused on early childhood students (7%).
High percentages of special education and VPI teachers had participated in an Early Childhood SIOP
training (79% for both groups). VPI and special education assistants were more likely than teachers in
their program to indicate that they had never participated in any SIOP training (88% and 43%,
respectively).

31
Figure 3: Participation in SIOP training
Those who had participated in any type of SIOP training were asked how frequently they use SIOP
strategies in their classrooms. VPI teachers were the most likely to report that they implement SIOP
strategies daily (56%), followed by special education teachers (29%) and Montessori teachers (17%).
Montessori teachers were more likely to select a few times a month (33%) and special education
teachers were slightly more likely to select both a few times a month (33%) and weekly (33%).
Participants were also asked, “How helpful has the school-based/Early Childhood SIOP training been in
your work with Pre-K students who are English language learners?”
Figure 4 shows the percentage of respondents selecting extremely or very helpful. Assistants are not
included in this graph due to low numbers.
Figure 4: Percentage of Participants Rating SIOP Training Extremely/Very Helpful
43%
21% 21%
7%
20%
80%
20%
88%
13%11%
54%
79%
20%
60%
7%13%
7%
76% 79%
14%
0%
20%
40%
60%
80%
100%
No SIOP training School-based SIOPtraining
Early Childhood specificSIOP training
Other
Special Education Assistant (n=14) Montessori Assistant (n=5)
VPI Assistant (n=8) Special Education teacher (n=28)
Primary Montessori teacher (n=15) VPI teacher (n=29)
28%
26%
14%
52%
27%
0% 20% 40% 60% 80% 100%
VPI Teacher (n=22-27)
Montessori Teacher (n=8)*
Special Education Teacher (n=15-22)
Early Childhood School-Based
32
CLASS observation scores show that Language Modeling was the strongest dimension within the
Instructional Support domain, with mean scores of 3.5 in VPI and Montessori observations, and 3.3 in
special education observations, ranging from 0.8 – 1.2 points higher than Concept Development.
Language modeling is a key component of the SIOP model.
The full staff survey report is available in Appendix D4, and the full CLASS report is available in Appendix
B3.
Collaboration among Pre-K Teachers
Collaboration among teachers occurs most frequently among teachers at the same school and
among teachers within the same program. The most frequently occurring type of collaboration
between Pre-K teaches and specials teachers (art, music, and PE) is sharing ideas. Special education
teachers were the most likely to report that they frequently co-teach with other teachers in their
program. Survey responses from all teacher groups indicate that special education teachers are far
more likely to collaborate with VPI teachers than with primary Montessori teachers.
The Early Childhood Office supports and encourages Pre-K staff to collaborate with each other to
provide optimal experiences for young learners. This has been encouraged through collaborative
trainings, collaborative walks (observations), and other opportunities. Because Pre-K programs are
spread throughout 23 sites, it is important for staff to have the opportunity to be involved in a
professional learning community with others sharing the same curriculum.
As APS has been moving toward common planning time for collaborative learning teams (CLTs) and
professional learning communities (PLCs) at each grade level through master scheduling, the Pre-K
teachers in many schools have specials assigned at common times of the day, which allows for
collaboration and data sharing during their planning periods. Data sharing meetings are also scheduled
with the Early Childhood Office throughout the year to review data and generate strategies for overall
growth of students. VPI and special education teachers attend these meetings.
Collaboration between Pre-K and Specials Teachers
Figure 5 and Figure 6 show responses to two parallel questions for specials and Pre-K teachers: “How
frequently do you collaborate with Pre-K/specials teachers at your school in the following ways?”
Survey responses indicate that the most commonly occurring type of collaboration among all teacher
groups is sharing ideas. Among specials teachers, 21%, 53%, and 43% of arts, music, and PE teachers,
respectively, reported that they share ideas with Pre-K teachers either daily, weekly, or a few times per
month. Among Pre-K teachers, 32%, 8%, and 24% of special education, Montessori, and VPI teachers,
respectively, selected these frequencies. Art teachers and VPI teachers were the most likely to report
that they frequently attend team meetings with either Pre-K teachers or specials teachers (21% for both
groups). Montessori teachers were the least likely to report frequent collaboration in any category, with
just 0-8% for any category. In most of these cases, a few times a month was selected more frequently
than either weekly or daily.
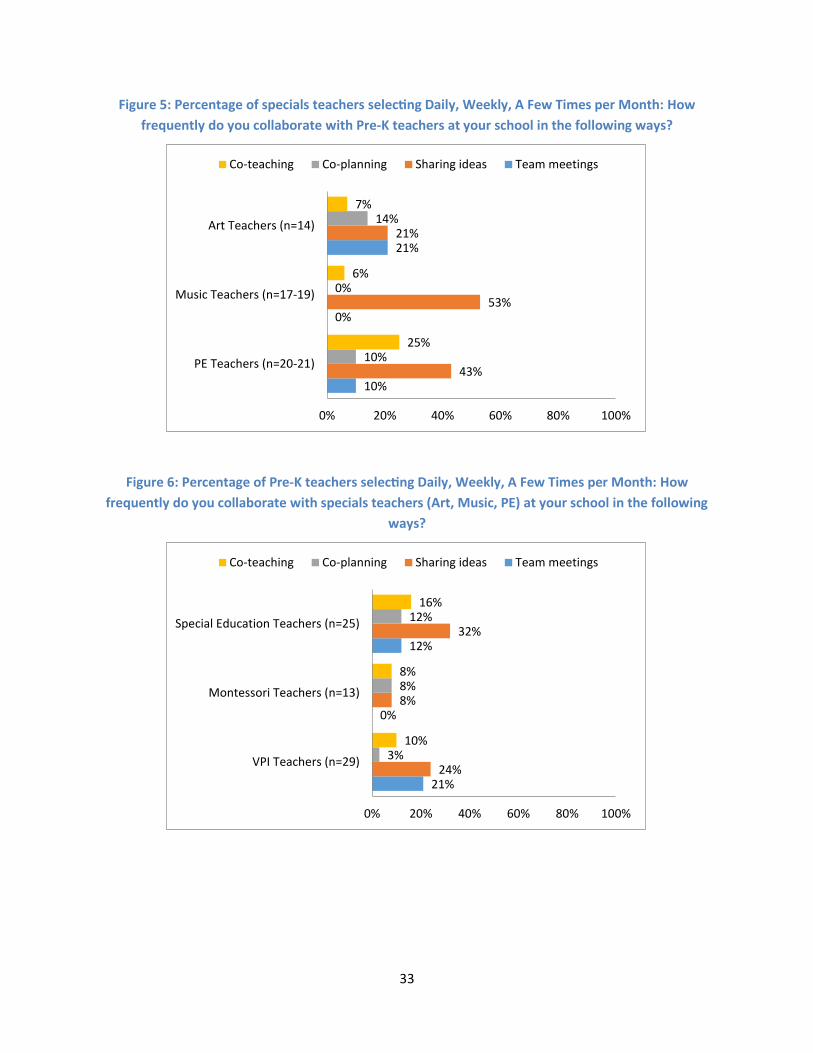
33
Figure 5: Percentage of specials teachers selecting Daily, Weekly, A Few Times per Month: How
frequently do you collaborate with Pre-K teachers at your school in the following ways?
Figure 6: Percentage of Pre-K teachers selecting Daily, Weekly, A Few Times per Month: How
frequently do you collaborate with specials teachers (Art, Music, PE) at your school in the following
ways?
10%
0%
21%
43%
53%
21%
10%
0%
14%
25%
6%
7%
0% 20% 40% 60% 80% 100%
PE Teachers (n=20-21)
Music Teachers (n=17-19)
Art Teachers (n=14)
Co-teaching Co-planning Sharing ideas Team meetings
21%
0%
12%
24%
8%
32%
3%
8%
12%
10%
8%
16%
0% 20% 40% 60% 80% 100%
VPI Teachers (n=29)
Montessori Teachers (n=13)
Special Education Teachers (n=25)
Co-teaching Co-planning Sharing ideas Team meetings
34
Collaboration within Teacher Groups
Across all three groups of Pre-K teachers and all types of collaboration, teachers were far more likely to
report that they collaborated frequently with teachers in their program who were at their school8,
rather than at other schools. Frequent collaboration with teachers from other schools was reported by
between 0-7% of teachers.
All three groups of teachers indicated that their most frequent type of collaboration with their school-
based peers were team meetings and sharing ideas. VPI teachers were the most likely to report
frequent collaboration of this type (96% for both team meetings and sharing ideas), followed by
Montessori teachers (90% team meetings, 80% sharing ideas) and special education teachers (69%,
75%).
Special education teachers were the most likely to report that they frequently co-teach with other
teachers in their program at their school (64%, compared to 35% of VPI teachers and 11% of Montessori
teachers). Montessori teachers were the least likely to report that they frequently co-plan with other
Montessori teachers at their school (44% compared to 65% of both VPI and special education teachers).
Collaboration between Special Education Teachers and Montessori or VPI Teachers
Figure 7 and Figure 8 show responses to a series of parallel questions for special education and
VPI/primary Montessori teachers:
Asked of special education Pre-K teachers:
How frequently do you collaborate with primary Montessori teachers at your school in the
following ways?
How frequently do you collaborate with VPI teachers at your school in the following ways?
Asked of VPI and primary Montessori teachers:
How frequently do you collaborate with special education Pre-K teachers at your school in the
following ways?
Both graphs indicate that special education teachers are far more likely to collaborate with VPI teachers
than with primary Montessori teachers. Between 75-83% of VPI teachers report frequent collaboration
with special education teachers through team meetings, sharing ideas, and co-planning. These
percentages were lower, but still relatively high, among special education teachers (51% for team
meetings, 63% for sharing ideas, and 44% for co-planning). Just 22% of VPI teachers and 38% of special
education teachers indicated that they frequently co-teach with the other type of teacher.
Montessori teachers were the most likely to report that they frequently co-teach with special education
teachers (36%), and special education teachers were most likely to report that they frequently share
ideas with Montessori teachers (30%).
8 School-based percentages in this section represent responses only for those respondents who indicated that there are other
teachers from their program at their school.

35
Figure 7: Percentage of VPI and Montessori teachers selecting Daily, Weekly, A Few Times per Month:
How frequently do you collaborate with Pre-K special education teachers at your school in the
following ways?
Figure 8: Percentage of special education teachers selecting Daily, Weekly, A Few Times per Month:
How frequently do you collaborate with primary Montessori/VPI teachers at your school in the
following ways? (n=16-17)
The full staff survey report is available in Appendix D4.
23%
78%
25%
83%
36%
75%
36%
22%
0% 10% 20% 30% 40% 50% 60% 70% 80% 90% 100%
Montessori Teachers (n=11-15)
VPI Teachers (n=28)
Co-teaching Co-planning Sharing ideas Team meetings
24%
51%
30%
63%
12%
44%
18%
38%
0% 10% 20% 30% 40% 50% 60% 70% 80% 90% 100%
Montessori Teachers
VPI Teachers
Co-teaching Co-planning Sharing ideas Team meetings
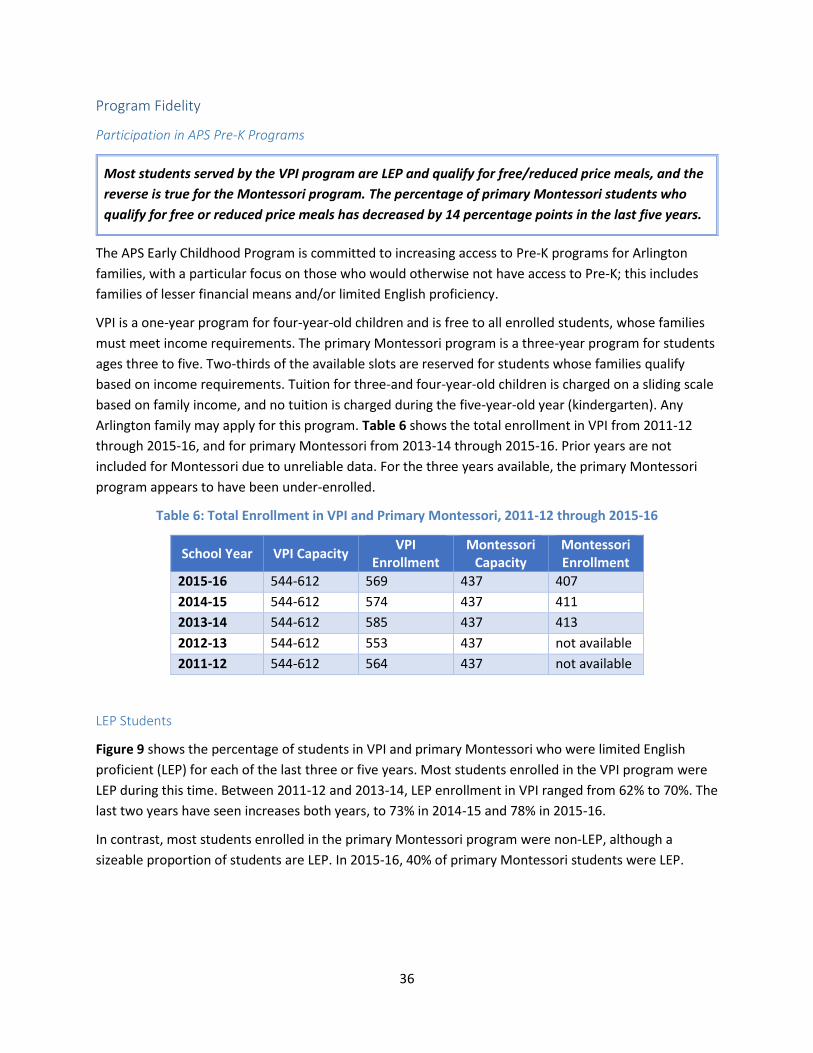
36
Program Fidelity
Participation in APS Pre-K Programs
Most students served by the VPI program are LEP and qualify for free/reduced price meals, and the
reverse is true for the Montessori program. The percentage of primary Montessori students who
qualify for free or reduced price meals has decreased by 14 percentage points in the last five years.
The APS Early Childhood Program is committed to increasing access to Pre-K programs for Arlington
families, with a particular focus on those who would otherwise not have access to Pre-K; this includes
families of lesser financial means and/or limited English proficiency.
VPI is a one-year program for four-year-old children and is free to all enrolled students, whose families
must meet income requirements. The primary Montessori program is a three-year program for students
ages three to five. Two-thirds of the available slots are reserved for students whose families qualify
based on income requirements. Tuition for three-and four-year-old children is charged on a sliding scale
based on family income, and no tuition is charged during the five-year-old year (kindergarten). Any
Arlington family may apply for this program. Table 6 shows the total enrollment in VPI from 2011-12
through 2015-16, and for primary Montessori from 2013-14 through 2015-16. Prior years are not
included for Montessori due to unreliable data. For the three years available, the primary Montessori
program appears to have been under-enrolled.
Table 6: Total Enrollment in VPI and Primary Montessori, 2011-12 through 2015-16
School Year VPI Capacity VPI
Enrollment Montessori
Capacity Montessori Enrollment
2015-16 544-612 569 437 407
2014-15 544-612 574 437 411
2013-14 544-612 585 437 413
2012-13 544-612 553 437 not available
2011-12 544-612 564 437 not available
LEP Students
Figure 9 shows the percentage of students in VPI and primary Montessori who were limited English
proficient (LEP) for each of the last three or five years. Most students enrolled in the VPI program were
LEP during this time. Between 2011-12 and 2013-14, LEP enrollment in VPI ranged from 62% to 70%. The
last two years have seen increases both years, to 73% in 2014-15 and 78% in 2015-16.
In contrast, most students enrolled in the primary Montessori program were non-LEP, although a
sizeable proportion of students are LEP. In 2015-16, 40% of primary Montessori students were LEP.
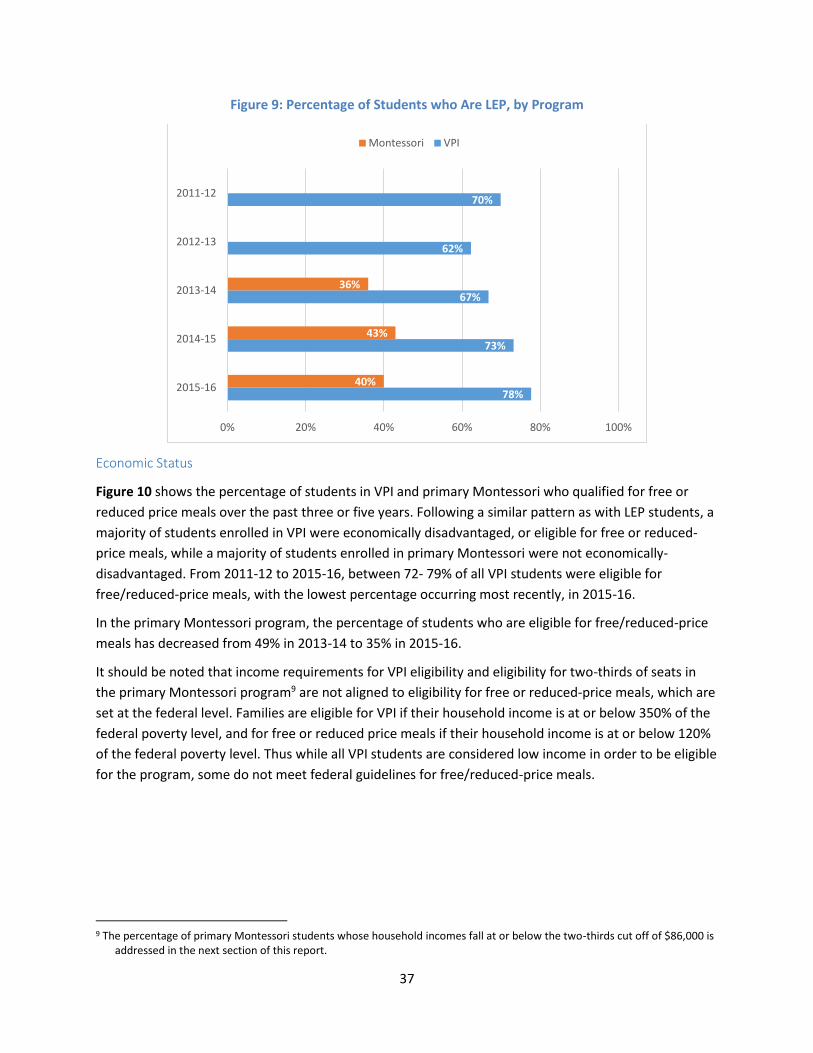
37
Figure 9: Percentage of Students who Are LEP, by Program
Economic Status
Figure 10 shows the percentage of students in VPI and primary Montessori who qualified for free or
reduced price meals over the past three or five years. Following a similar pattern as with LEP students, a
majority of students enrolled in VPI were economically disadvantaged, or eligible for free or reduced-
price meals, while a majority of students enrolled in primary Montessori were not economically-
disadvantaged. From 2011-12 to 2015-16, between 72- 79% of all VPI students were eligible for
free/reduced-price meals, with the lowest percentage occurring most recently, in 2015-16.
In the primary Montessori program, the percentage of students who are eligible for free/reduced-price
meals has decreased from 49% in 2013-14 to 35% in 2015-16.
It should be noted that income requirements for VPI eligibility and eligibility for two-thirds of seats in
the primary Montessori program9 are not aligned to eligibility for free or reduced-price meals, which are
set at the federal level. Families are eligible for VPI if their household income is at or below 350% of the
federal poverty level, and for free or reduced price meals if their household income is at or below 120%
of the federal poverty level. Thus while all VPI students are considered low income in order to be eligible
for the program, some do not meet federal guidelines for free/reduced-price meals.
9 The percentage of primary Montessori students whose household incomes fall at or below the two-thirds cut off of $86,000 is
addressed in the next section of this report.
78%
73%
67%
62%
70%
40%
43%
36%
0% 20% 40% 60% 80% 100%
2015-16
2014-15
2013-14
2012-13
2011-12
Montessori VPI
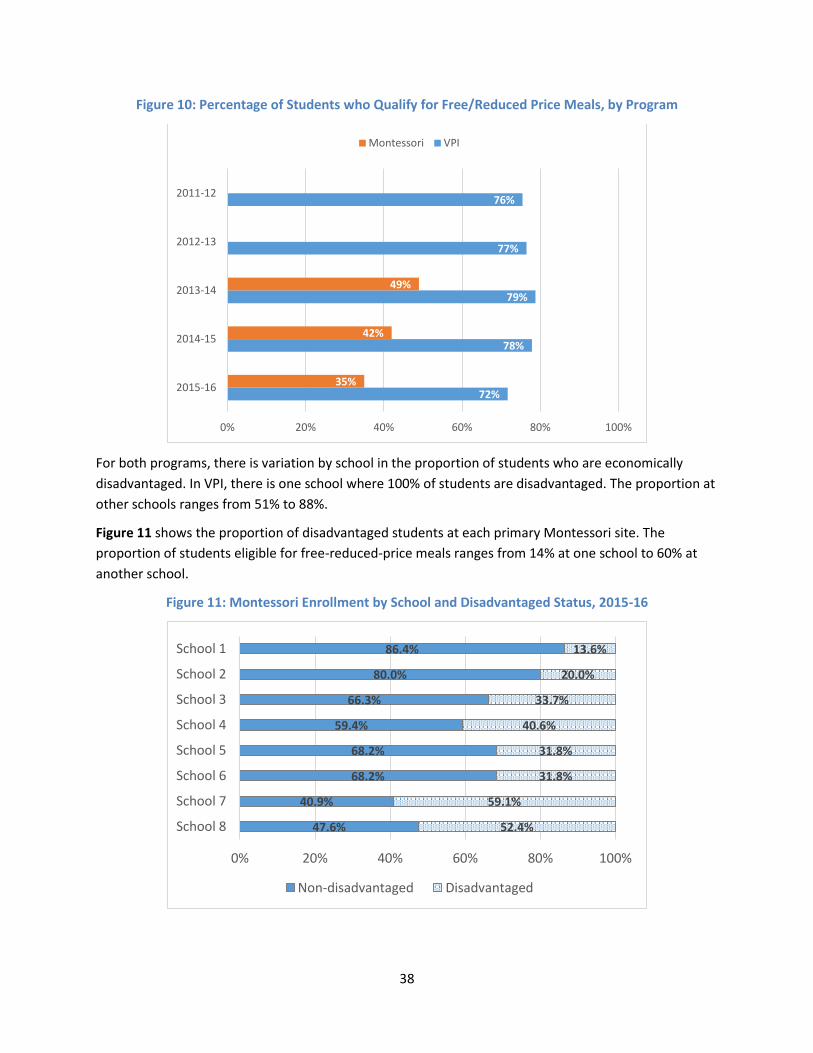
38
Figure 10: Percentage of Students who Qualify for Free/Reduced Price Meals, by Program
For both programs, there is variation by school in the proportion of students who are economically
disadvantaged. In VPI, there is one school where 100% of students are disadvantaged. The proportion at
other schools ranges from 51% to 88%.
Figure 11 shows the proportion of disadvantaged students at each primary Montessori site. The
proportion of students eligible for free-reduced-price meals ranges from 14% at one school to 60% at
another school.
Figure 11: Montessori Enrollment by School and Disadvantaged Status, 2015-16
72%
78%
79%
77%
76%
35%
42%
49%
0% 20% 40% 60% 80% 100%
2015-16
2014-15
2013-14
2012-13
2011-12
Montessori VPI
47.6%
40.9%
68.2%
68.2%
59.4%
66.3%
80.0%
86.4%
52.4%
59.1%
31.8%
31.8%
40.6%
33.7%
20.0%
13.6%
0% 20% 40% 60% 80% 100%
School 8
School 7
School 6
School 5
School 4
School 3
School 2
School 1
Non-disadvantaged Disadvantaged
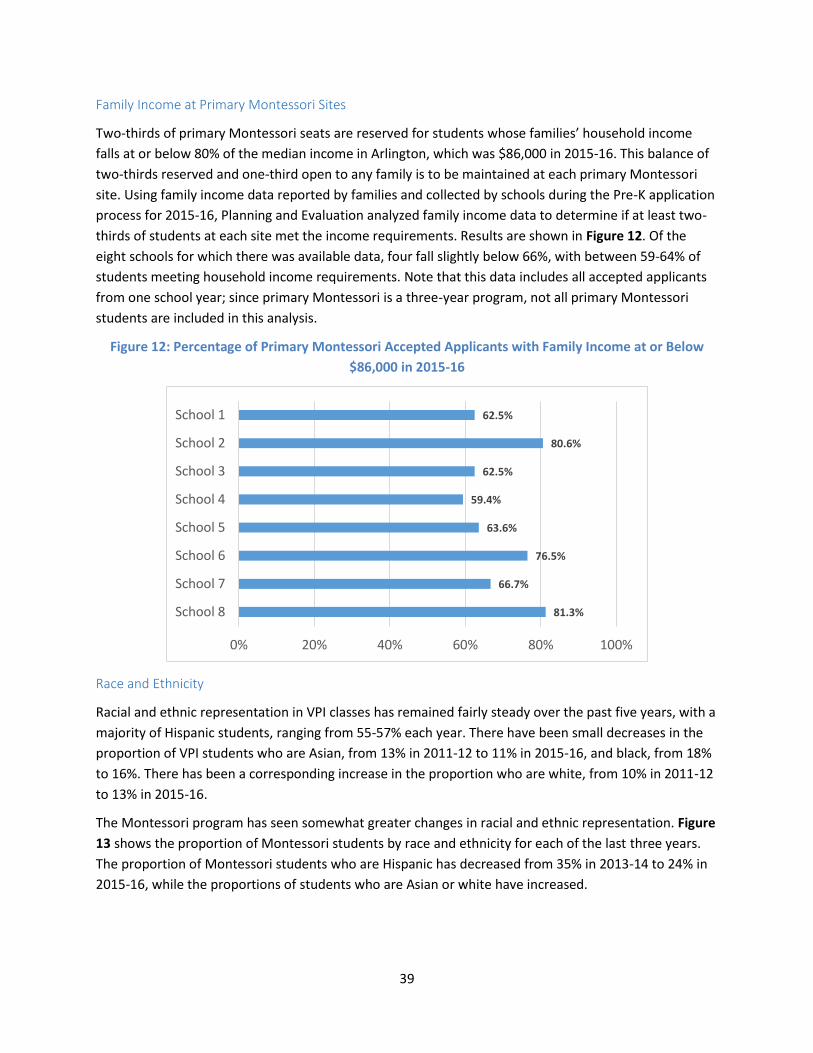
39
Family Income at Primary Montessori Sites
Two-thirds of primary Montessori seats are reserved for students whose families’ household income
falls at or below 80% of the median income in Arlington, which was $86,000 in 2015-16. This balance of
two-thirds reserved and one-third open to any family is to be maintained at each primary Montessori
site. Using family income data reported by families and collected by schools during the Pre-K application
process for 2015-16, Planning and Evaluation analyzed family income data to determine if at least two-
thirds of students at each site met the income requirements. Results are shown in Figure 12. Of the
eight schools for which there was available data, four fall slightly below 66%, with between 59-64% of
students meeting household income requirements. Note that this data includes all accepted applicants
from one school year; since primary Montessori is a three-year program, not all primary Montessori
students are included in this analysis.
Figure 12: Percentage of Primary Montessori Accepted Applicants with Family Income at or Below
$86,000 in 2015-16
Race and Ethnicity
Racial and ethnic representation in VPI classes has remained fairly steady over the past five years, with a
majority of Hispanic students, ranging from 55-57% each year. There have been small decreases in the
proportion of VPI students who are Asian, from 13% in 2011-12 to 11% in 2015-16, and black, from 18%
to 16%. There has been a corresponding increase in the proportion who are white, from 10% in 2011-12
to 13% in 2015-16.
The Montessori program has seen somewhat greater changes in racial and ethnic representation. Figure
13 shows the proportion of Montessori students by race and ethnicity for each of the last three years.
The proportion of Montessori students who are Hispanic has decreased from 35% in 2013-14 to 24% in
2015-16, while the proportions of students who are Asian or white have increased.
81.3%
66.7%
76.5%
63.6%
59.4%
62.5%
80.6%
62.5%
0% 20% 40% 60% 80% 100%
School 8
School 7
School 6
School 5
School 4
School 3
School 2
School 1
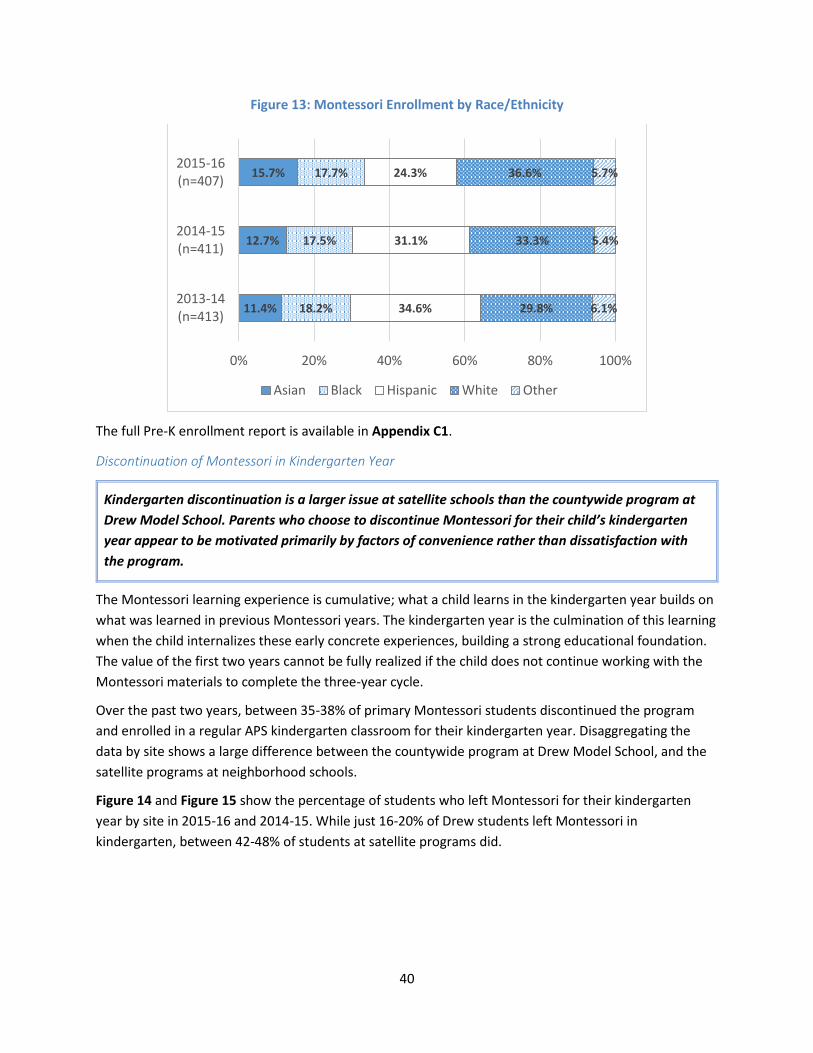
40
Figure 13: Montessori Enrollment by Race/Ethnicity
The full Pre-K enrollment report is available in Appendix C1.
Discontinuation of Montessori in Kindergarten Year
Kindergarten discontinuation is a larger issue at satellite schools than the countywide program at
Drew Model School. Parents who choose to discontinue Montessori for their child’s kindergarten
year appear to be motivated primarily by factors of convenience rather than dissatisfaction with
the program.
The Montessori learning experience is cumulative; what a child learns in the kindergarten year builds on
what was learned in previous Montessori years. The kindergarten year is the culmination of this learning
when the child internalizes these early concrete experiences, building a strong educational foundation.
The value of the first two years cannot be fully realized if the child does not continue working with the
Montessori materials to complete the three-year cycle.
Over the past two years, between 35-38% of primary Montessori students discontinued the program
and enrolled in a regular APS kindergarten classroom for their kindergarten year. Disaggregating the
data by site shows a large difference between the countywide program at Drew Model School, and the
satellite programs at neighborhood schools.
Figure 14 and Figure 15 show the percentage of students who left Montessori for their kindergarten
year by site in 2015-16 and 2014-15. While just 16-20% of Drew students left Montessori in
kindergarten, between 42-48% of students at satellite programs did.
11.4%
12.7%
15.7%
18.2%
17.5%
17.7%
34.6%
31.1%
24.3%
29.8%
33.3%
36.6%
6.1%
5.4%
5.7%
0% 20% 40% 60% 80% 100%
2013-14(n=413)
2014-15(n=411)
2015-16(n=407)
Asian Black Hispanic White Other
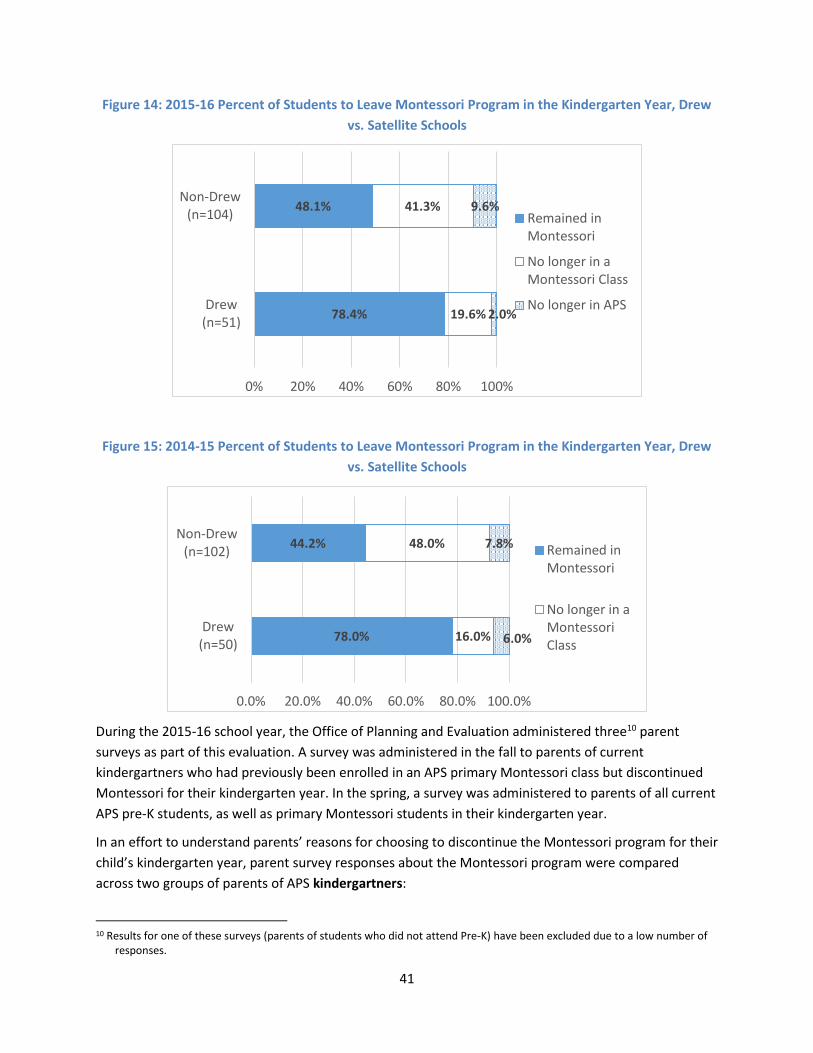
41
Figure 14: 2015-16 Percent of Students to Leave Montessori Program in the Kindergarten Year, Drew
vs. Satellite Schools
Figure 15: 2014-15 Percent of Students to Leave Montessori Program in the Kindergarten Year, Drew
vs. Satellite Schools
During the 2015-16 school year, the Office of Planning and Evaluation administered three10 parent
surveys as part of this evaluation. A survey was administered in the fall to parents of current
kindergartners who had previously been enrolled in an APS primary Montessori class but discontinued
Montessori for their kindergarten year. In the spring, a survey was administered to parents of all current
APS pre-K students, as well as primary Montessori students in their kindergarten year.
In an effort to understand parents’ reasons for choosing to discontinue the Montessori program for their
child’s kindergarten year, parent survey responses about the Montessori program were compared
across two groups of parents of APS kindergartners:
10 Results for one of these surveys (parents of students who did not attend Pre-K) have been excluded due to a low number of
responses.
78.4%
48.1%
19.6%
41.3%
2.0%
9.6%
0% 20% 40% 60% 80% 100%
Drew(n=51)
Non-Drew(n=104) Remained in
Montessori
No longer in aMontessori Class
No longer in APS
78.0%
44.2%
16.0%
48.0%
6.0%
7.8%
0.0% 20.0% 40.0% 60.0% 80.0% 100.0%
Drew(n=50)
Non-Drew(n=102) Remained in
Montessori
No longer in aMontessoriClass
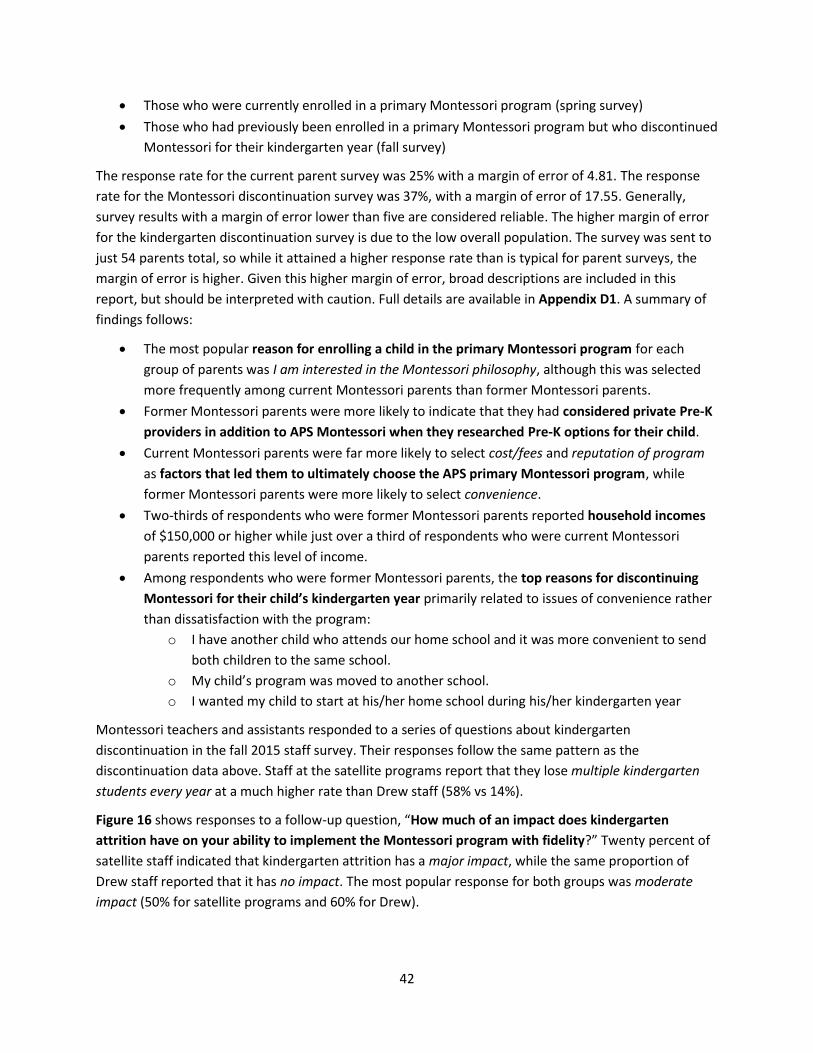
42
Those who were currently enrolled in a primary Montessori program (spring survey)
Those who had previously been enrolled in a primary Montessori program but who discontinued
Montessori for their kindergarten year (fall survey)
The response rate for the current parent survey was 25% with a margin of error of 4.81. The response
rate for the Montessori discontinuation survey was 37%, with a margin of error of 17.55. Generally,
survey results with a margin of error lower than five are considered reliable. The higher margin of error
for the kindergarten discontinuation survey is due to the low overall population. The survey was sent to
just 54 parents total, so while it attained a higher response rate than is typical for parent surveys, the
margin of error is higher. Given this higher margin of error, broad descriptions are included in this
report, but should be interpreted with caution. Full details are available in Appendix D1. A summary of
findings follows:
The most popular reason for enrolling a child in the primary Montessori program for each
group of parents was I am interested in the Montessori philosophy, although this was selected
more frequently among current Montessori parents than former Montessori parents.
Former Montessori parents were more likely to indicate that they had considered private Pre-K
providers in addition to APS Montessori when they researched Pre-K options for their child.
Current Montessori parents were far more likely to select cost/fees and reputation of program
as factors that led them to ultimately choose the APS primary Montessori program, while
former Montessori parents were more likely to select convenience.
Two-thirds of respondents who were former Montessori parents reported household incomes
of $150,000 or higher while just over a third of respondents who were current Montessori
parents reported this level of income.
Among respondents who were former Montessori parents, the top reasons for discontinuing
Montessori for their child’s kindergarten year primarily related to issues of convenience rather
than dissatisfaction with the program:
o I have another child who attends our home school and it was more convenient to send
both children to the same school.
o My child’s program was moved to another school.
o I wanted my child to start at his/her home school during his/her kindergarten year
Montessori teachers and assistants responded to a series of questions about kindergarten
discontinuation in the fall 2015 staff survey. Their responses follow the same pattern as the
discontinuation data above. Staff at the satellite programs report that they lose multiple kindergarten
students every year at a much higher rate than Drew staff (58% vs 14%).
Figure 16 shows responses to a follow-up question, “How much of an impact does kindergarten
attrition have on your ability to implement the Montessori program with fidelity?” Twenty percent of
satellite staff indicated that kindergarten attrition has a major impact, while the same proportion of
Drew staff reported that it has no impact. The most popular response for both groups was moderate
impact (50% for satellite programs and 60% for Drew).

43
Figure 16: How much of an impact does kindergarten attrition have on your ability to implement the
Montessori program with fidelity?
Out of twelve responses to an open-ended question about how kindergarten attrition impacts staff’s
ability to implement the Montessori program, most (six) pointed out that kindergarten students serve as
role models in the primary Montessori classroom, which is important both to the younger students who
learn from the older students, and to the older students who apply what they have learned by teaching
the younger students.
Montessori is based on social learning and well balanced multi-age classroom environment. If we
do not have this balance, we miss a key factor which is the older kids teaching the younger ones,
the older kids being a role model, and the older kids having the opportunity to apply what is
learned by teaching the little ones. This is a very important dynamic in Montessori.
The second most popular answer (four) referred to the flip side of having too few kindergartners: having
too many three-year-olds. Respondents felt that having a disproportionately high number of three-year-
olds increases the demand on teachers and assistants to spend more focused time on these needier
students.
It disrupts the ratio of ages. A majority of three year olds in a class makes it more difficult to
have lengthy and focused lessons/discussions.
Ideally a third of students are kindergartners. Having fewer means that the non-kindergarten
students, who are less independent and limited in their work choices need more attention strictly
because there are more of them. This can reduce the quality time that the teacher needs with
the Ks.
The full report on Montessori kindergarten discontinuation is available in Appendix C3. The staff survey
report is available in Appendix D4, and the parent survey report is available in Appendix D1.
20%30%
20%
50%
60%
20%
0%
20%
40%
60%
80%
100%
School-based (n=10) County-wide (n=5)
No impact Minor impact Moderate impact Major impact
44
Meeting the Needs of the Whole Child
The Pre-K programs in APS strive to meet the needs of the whole child through various means. Because
this is the first school experience for many Pre-K students, staff engage families on nutritional needs,
establishing structures for children, and offering experiences to build background understanding for
students. Because children learn through play, staff provide numerous experiences for children to
engage in play and investigation during the pre-k experience.
Support and Services for Pre-K Students and Families
Staff across programs generally feel that APS Pre-K students and their families receive the social-
emotional/behavioral and practical/social supports they need. Many staff suggested that
additional support could be provided by means of parent meetings and workshops, and counseling
and social worker services for students. Special education teachers suggested home visits and
counseling services for parents.
APS offers the following supports to preschool age children enrolled in APS whose families are
homeless:
Transportation to school or origin if attending APS Pre-K program
Right to immediate enrollment, including without initial presentation of immunization
documents, birth certificate, etc.
Free Extended Day
Free school breakfast and lunch
Participation in Backpack Buddies (weekend food program)
Free summer school
Priority given for enrollment in APS Pre-K programs and Head Start or Early Head Start
Lola’s Lab – Educational Camp (funds permitting and if available)
Free haircuts at Career Center Cosmetology program
75% off Arlington Recreation classes
School Social Worker interview to determine other needs and referrals such as clothing,
recreation fees, school materials, backpacks, field trip fees, and referrals to other services in the
community
The fall 2015 staff survey included a series of questions about the adequacy of the supports that Pre-K
students and their families receive. Figure 17 shows the percentage of each staff type who selected
strongly agree or somewhat agree for the following statements:
Students in my class/school and their families receive the social-emotional/behavior support
and services they need for success in school.
Students in my class/school and their families receive the practical/social support and services
they need for success in school (e.g. clothes, food, supplies, etc.).

45
Staff are generally positive about the supports that students and their families receive, with a majority
of all staff groups agreeing that that students and families receive the support they need for success in
school.
Figure 17: Percentage Agree: Students in my class/school and their families receive the social-
emotional/behavior, practical/social support and services they need for success in school.
*Fewer than 5 Montessori assistants responded to the practical/social question; answers not reported.
In response to the open-ended question, “What, if any, additional types of social-
emotional/behavioral supports are needed?” staff across programs suggested parent meetings or
workshops and counseling services, either for students or – in the case of special education teachers –
for parents. Three special education teachers also suggested that time for home visits be built into the
program11, and three administrators suggested that the school social worker should be available to Pre-
K students and their families (planning factors for social workers and counselors are based on the K-5
population of each elementary school; schools vary in how they implement their staffing).
Many of the parents would benefit from some workshops in Conscious Discipline. – VPI teacher
It would be helpful to have some type of home visit portion to the program. I often wish that our
program ended at 2 PM with some time for home visits after school. – Special education teacher
11 Home visits are a requirement of the VPI program and not the primary Montessori or special education program. For more
information about VPI home visits, see Family and Parental Involvement Plan on page 7.
75%
77%
67%
94%
78%
90%
88%
86%
60%
74%
68%
74%
86%
Montessori Assistants (n=8)*
VPI Assistants (n=8-14)
SPED Assistants (n=5-13)
Montessori Teachers (n=15)
VPI Teachers (n=28-29)
SPED Teachers (n=27)
Principals and APs (n=30)
Social-Emotional/Behavioral Practical/Social

46
Counselors need to be involved and an outreach plan implemented – Montessori teacher
The Pre-K students need to be part of the planning factor for counselor allocation to schools. –
Administrator
The school social worker needs to work with preschoolers. - Administrator
Social and Health Wellbeing
Pre-K teachers and assistants engage in a variety of methods to develop healthy eating and physical
activity habits in their students.
Pre-K teachers and assistants answered open-ended questions on the staff survey about how they teach
their students healthy eating habits. Across programs and roles, the most commonly cited methods
were:
Discussing healthy foods
Providing healthy snacks/meals
Providing lessons or activities focused on nutrition
Encouraging students to try new and healthy foods
Modeling healthy eating
Teachers and assistants listed the following activities as ways that they incorporate physical activity into
the day for their students:
Exercise/movement activities as games or incorporated through the day
Recess/playground/outside time
Physical Education class
Yoga/Stretching
Dancing
Specials – Art, Music, and Physical Education
Among specials teachers, PE teachers were most likely to feel confident in their ability to provide
developmentally appropriate instruction to Pre-K students, though open-ended responses show they
are also the most likely to feel they receive no support in their instruction for Pre-K students.
Montessori and VPI parents generally expressed a high level of satisfaction with their child’s specials
teachers, particularly parents of VPI students.
The fall 2015 staff survey was sent to specials teachers as well as Pre-K teachers. Teachers of art, music,
and physical education (PE) who indicated that they taught any classes with Pre-K students then
responded to the question, “How would you rate your level of confidence in providing
developmentally appropriate instruction to Pre-K students?” Responses are displayed in Figure 18. PE
teachers were the most likely to indicate they are extremely confident (43%), compared to 26% of music
teachers and 14% of art teachers, who were also the most likely to select moderately confident (57%) at
the lower end of the scale.

47
Figure 18: How would you rate your level of confidence in providing developmentally appropriate
instruction to Pre-K students (Specials teachers)?
Montessori and VPI12 parents generally expressed a high level of satisfaction with their child’s specials
teachers, particularly parents of VPI students. Between 83-85% of VPI parents indicated that they were
very satisfied with their child’s art, music, and PE teachers. Montessori parents selected very satisfied
between 63-66% of the time for music and PE teachers, and 71% for art teachers. This seems to be less
of an indication of dissatisfaction than lack of familiarity, as Montessori parents were far more likely to
select I don’t know than either slightly satisfied or moderately satisfied (between 13-20% for each
teacher type).
Specials teachers who indicated that they taught any classes with Pre-K students also answered a series
of open-ended questions about the types of support they receive, or would like to receive, in providing
developmentally appropriate instruction to Pre-K students.
PE and music teachers indicated that Pre-K assistants join their students and offer support in the
PE or music class. Art teachers reported other ways they receive support from assistants, such
as providing information about individual student needs or Pre-K content.
Art teachers were the most likely to indicate that they receive support directly from the Pre-K
teacher or that they meet and plan with the Pre-K teacher, although several music and PE
teachers cited this as well.
Some art and music teachers indicated that they have attended professional development
specific to Pre-K offered by the Arts Education Office. Music teachers also indicated that they
had received curriculum materials from the Arts Education Office.
12 Responses from parents of students in the special education program were removed from this analysis because they included
responses from parents of dual enrolled students, who do not take specials in APS.
16%
5%
57%
26%
19%
29%
32%
33%
14%
26%
43%
0% 20% 40% 60% 80% 100%
Elementary Art Teachers (n=14)
Elementary Music Teachers (n=19)
Elementary PE teachers (n=21)
Slightly confident Moderately confident Very confident Extremely confident
48
PE teachers were the most likely to report that they receive no support in providing
developmentally appropriate instruction to Pre-K students.
When asked what types of additional supports they would like to receive in the area of professional
development, the most common answers were:
Professional development focused on developmental stages
Professional development focused specifically on appropriate art, music, or PE instruction for Pre-
K students
Time to plan with Pre-K teachers
Time to observe other specials teachers who teach Pre-K students
In the area of resources, the most common responses were:
Information about Pre-K curriculum to align with learning activities in the specials classroom
Ideas for lessons or activities
Music materials
Suggested websites
Information about how specials teachers collaborate with Pre-K teachers can be found under CLASS
observation scores show that Language Modeling was the strongest dimension within the Instructional
Support domain, with mean scores of 3.5 in VPI and Montessori observations, and 3.3 in special
education observations, ranging from 0.8 – 1.2 points higher than Concept Development. Language
modeling is a key component of the SIOP model.
The full staff survey report is available in Appendix D4, and the full CLASS report is available in Appendix
B3.
Collaboration among Pre-K Teachers on page 32.
The staff survey report is available in Appendix D4, and the parent survey report is available in Appendix
D1.
Community and Parent Engagement
Pre-K Registration
Most parents find the Pre-K application and registration process to be easy, and this is generally
true across demographic factors such as home language, education level, and household income.
The two most commonly recommended improvements frequently went hand in hand: Allow parents
to apply and register online and centralize the application process.
Staff responses were more varied, depending on staff type. Front office staff were the most likely to
report that the registration process as effective. There was little agreement on whether school-
based or centralized registration is preferable.
Staff were asked to rate the effectiveness of the application and registration process in helping to
facilitate enrollment in Pre-K programs in APS schools. The application and registration process for
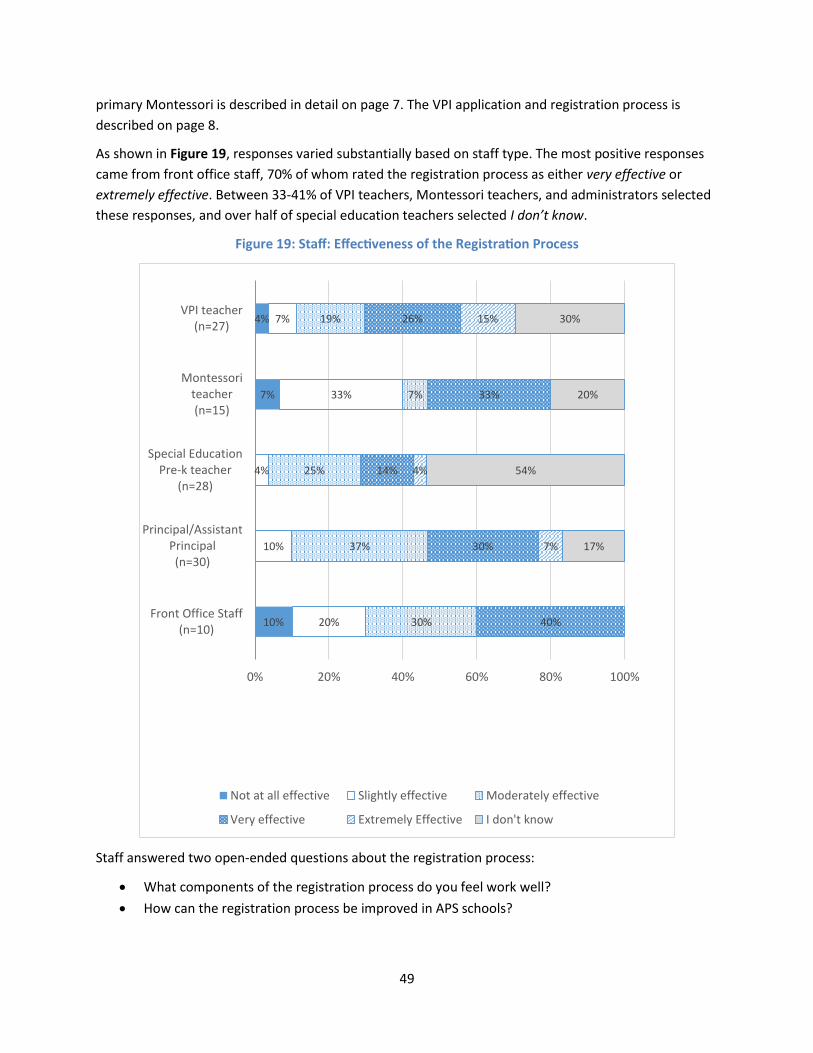
49
primary Montessori is described in detail on page 7. The VPI application and registration process is
described on page 8.
As shown in Figure 19, responses varied substantially based on staff type. The most positive responses
came from front office staff, 70% of whom rated the registration process as either very effective or
extremely effective. Between 33-41% of VPI teachers, Montessori teachers, and administrators selected
these responses, and over half of special education teachers selected I don’t know.
Figure 19: Staff: Effectiveness of the Registration Process
Staff answered two open-ended questions about the registration process:
What components of the registration process do you feel work well?
How can the registration process be improved in APS schools?
10%
7%
4%
20%
10%
4%
33%
7%
30%
37%
25%
7%
19%
40%
30%
14%
33%
26%
7%
4%
15%
17%
54%
20%
30%
0% 20% 40% 60% 80% 100%
Front Office Staff(n=10)
Principal/AssistantPrincipal(n=30)
Special EducationPre-k teacher
(n=28)
Montessoriteacher(n=15)
VPI teacher(n=27)
Not at all effective Slightly effective Moderately effective
Very effective Extremely Effective I don't know
50
Responses indicated a sense of agreement across staff types that annual Pre-K registration nights for
each program are an effective means of assisting parents with the registration process. There was a
stark lack of agreement on whether school-based or centralized registration is preferable, and notably,
staff appeared to have different perceptions about whether the process is school-based or centralized
to begin with. This is most likely due to confusion whether “centralized registration” refers to
applications and placement or actual registration in a program.
Two VPI teachers and four administrators mentioned centralized registration as a strength, while two
VPI teachers and six administrators mentioned school-based registration as a strength.
Changes in recent years to centralize registration have made the process SO MUCH BETTER!!! –
VPI teacher
The centralization of the registration process has made it for an extremely effective way to get
our families the information they need and registration guidance. - Administrator
I think allowing the parents to register at the school site is helpful because for many families it is
difficult to find time and transportation to get to the main APS buildings. - VPI teacher
The ability for our families to register at the location where they would like to enroll their child
gives us an opportunity to welcome prospective families. – Administrator
There was a similar contrast within respondent groups regarding how the registration process can be
improved, though this leaned more heavily towards a preference for centralized registration. Seven VPI
teachers, three administrators, and one Montessori teacher suggested centralized registration as an
improvement while two VPI teachers, three administrators, and one Montessori teacher suggested
school-based registration.
Centralized registration instead of having to register at each school – VPI teacher
Making a centralized registration for VPI and Montessori would ensure all spots are full at all
sites – Administrator
Keep the registration at the individual school. - Administrator
Other popular suggestions for improving the registration process centered on communication with
parents: Increasing awareness of the programs, and helping parents to be better informed about
registration and program expectations.
Parents were positive about the ease of the application and registration process, with 89% indicating
that the application process was very easy or somewhat easy, and 92% selecting these responses for the
registration process. Minor differences emerged when disaggregated by home language, household
income, and highest level of education. These responses are shown in Figure 20, Figure 21, and Figure
22. Parents who spoke a language other than English and parents who had less than an associate’s
degree were the most likely to indicate that they found the application and registration process very or
somewhat easy, and parents with a household income at the lowest range ($0-51,000) were the most
likely to find the application process very or somewhat easy. The only group who selected

51
very/somewhat easy less than 80% of the time were parents with a household income at the highest
range ($150,001 or higher), only 55% of whom selected these responses for the application process.
Figure 20: Parents: Ease of Application and Registration Process by Language
Figure 21: Parents: Ease of Application and Registration Process by Household Income
Figure 22: Parents: Ease of Application and Registration Process by Highest Level of Education
84%
88%
92%
95%
0% 20% 40% 60% 80% 100%
Application
Registration
Language other than English (n=150-162)
English Only (n=129-132)
55%
95%
86%
89%
87%
89%
95%
93%
0% 20% 40% 60% 80% 100%
Application
Registration
$0 to $51,000 (n=85-99) $51,001 to $86,000 (n=64-65)
$86,001 to $150,000 (n=45-46) $150,001 or higher (n=74-76)
83%
94%
91%
89%
97%
92%
0% 20% 40% 60% 80% 100%
Application
Registration
Less than associates or bachelor’s degree (n=60-68)
Bachelor’s/associate’s degree (n=80-83)
Advanced degree (n=141-146)
52
Open-ended responses reiterated that parents generally find the application and registration process to
be easy, but several parents offered suggestions for how to improve either the application or
registration process. Most of the responses (43) indicated that the process was easy or that they had no
recommendations for improvement. The two most commonly recommended improvements frequently
went hand in hand: Allow parents to apply and register online (27) and centralize the application
process (24).
It would be much more convenient if there was an online option. You have to figure out which
schools are within your zone. Complete up to 3 applications - one for each school. Mail or deliver
them to the school and keep your fingers crossed they arrive if using mail. And then each school
handles it differently. One school mailed a confirmation postcard that the application arrived. The
others didn't. One school notified us right away, others didn't.
There should a single electronic application.
I had to submit seven different applications to different schools during regular work hours. It was
extremely difficult for me to make it during those hours. Not to mention the hassle of filing out the
same applications seven times.
Twenty parents expressed that the process is overly cumbersome.
A lot of required documents make it difficult
Parameters for the application process changed during the process which complicated the
process this year.
Registration was more difficult only because it required more details/paperwork.
Of those parents, six were parents of students in the special education program who found the process
of having their child screened or identifying appropriate services to be onerous.
Fewer evaluations. Evaluation appointments earlier in the day. I had to take a lot of time off
work to complete the process. The whole process was hard to understand. A one-page summary
of the steps would have been helpful.
The application process for us was difficult because my daughter needed to go through the
screening process to qualify for the special education program, so I'm not sure how you would
have made that easier.
It was difficult getting in touch with the right person APS who could help us. We moved from out
of state, had not yet closed on our house and our son had an IEP. We were passed around from
residency, special education, and Pre-K quite a bit before getting any help.
Eighteen parents recommended improvements to communication and/or outreach, and nine suggested
shortening the timeline between application and registration.
We had to put money down at a private program to ensure he got a Montessori slot. An earlier
lottery date similar to the deadline of local private Montessori schools would have helped.

53
Parents know that the deadline is April 15, but there is not clarity about when the lottery is held
after that and when parents will be notified. EARLIER REGISTRATION - private preschools require
application and deposits much earlier.
Knowing when to expect responses from schools (at least when the lottery would be held and
when you would hear from the school).
The staff survey report is available in Appendix D4, and the parent survey report is available in Appendix
D1.
Parent Engagement
Both parents and staff are positive about whether schools do a good job of keeping parents
informed. Parents across demographic groups also reported that they feel comfortable interacting
with staff at their child’s school. Survey responses and data collection from teachers both indicate
that most parents participate in a school-based activity such as conferences, field trips, or
classroom events. Those with higher incomes and higher levels of education were the most likely to
have volunteered in the classroom.
Interaction with Schools
Both the staff and parent surveys included a series of questions addressing communication and
interaction between parents and schools, as displayed in Table 7.
Table 7: Parent Engagement Questions on Parent and Staff Surveys
Parent Survey Staff Survey
My child’s school does a good job of informing me about my child’s progress.
My school does a good job of informing parents about their Pre-K students' progress.
My child’s school does a good job of informing me about Pre-K events, volunteer opportunities, etc.
My school does a good job of informing parents of Pre-K students about events, volunteer opportunities etc.
I have a good understanding of the goals, design, and philosophy of my child’s Pre-K program (Montessori, VPI, or special education).
Parents have a good understanding of the goals, design and philosophy of their child's Pre-K program.
I am comfortable interacting with staff at my child’s school.
n/a
Responses are displayed in Figure 23. All response groups were generally positive with a majority
indicating agreement for each statement. Answers are fairly consistent across groups for the two
questions about how well schools inform parents of their child’s progress and of events, although
Montessori teachers stand out as being least likely to agree that their school does a good job of
informing parents about their child’s progress (86%).
There was less consistency among groups for the statement regarding whether parents have a good
understanding of the goals, design, and philosophy of their child’s Pre-K program. Parents and
administrators were the most likely to agree with this statement (92-94%), followed by special
education teachers (83%). VPI and Montessori teachers were least likely to agree at 61-64%.
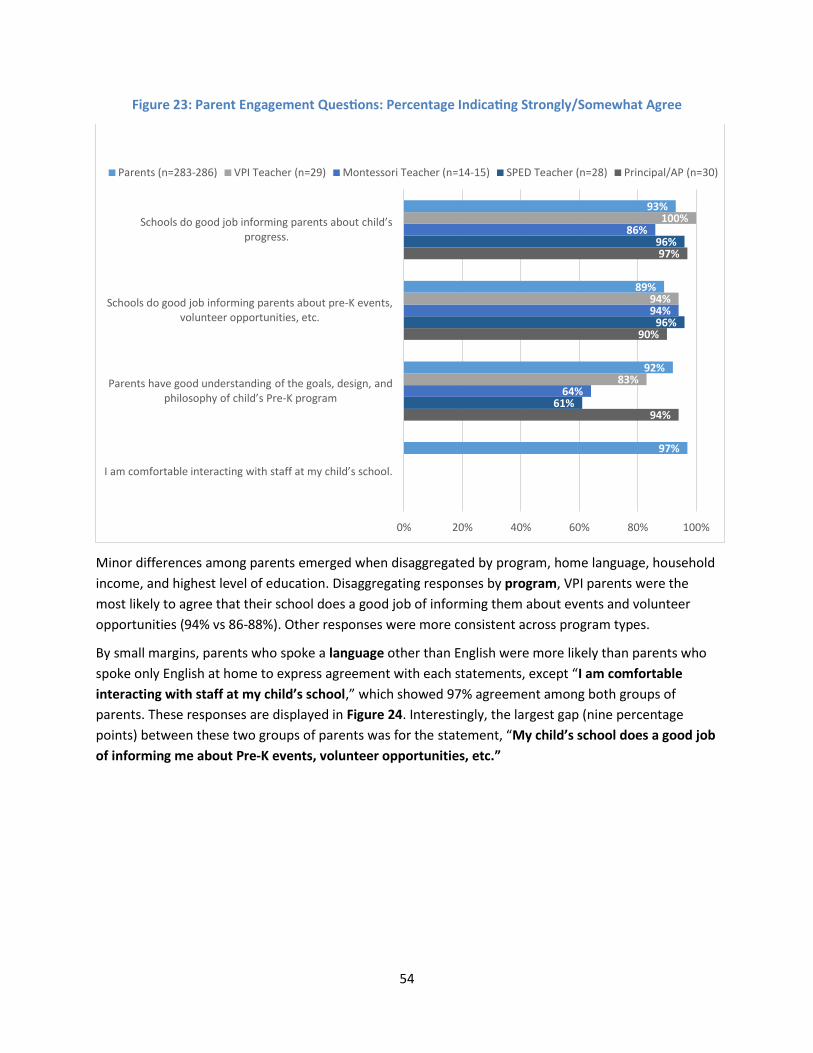
54
Figure 23: Parent Engagement Questions: Percentage Indicating Strongly/Somewhat Agree
Minor differences among parents emerged when disaggregated by program, home language, household
income, and highest level of education. Disaggregating responses by program, VPI parents were the
most likely to agree that their school does a good job of informing them about events and volunteer
opportunities (94% vs 86-88%). Other responses were more consistent across program types.
By small margins, parents who spoke a language other than English were more likely than parents who
spoke only English at home to express agreement with each statements, except “I am comfortable
interacting with staff at my child’s school,” which showed 97% agreement among both groups of
parents. These responses are displayed in Figure 24. Interestingly, the largest gap (nine percentage
points) between these two groups of parents was for the statement, “My child’s school does a good job
of informing me about Pre-K events, volunteer opportunities, etc.”
94%
90%
97%
61%
96%
96%
64%
94%
86%
83%
94%
100%
97%
92%
89%
93%
0% 20% 40% 60% 80% 100%
I am comfortable interacting with staff at my child’s school.
Parents have good understanding of the goals, design, and philosophy of child’s Pre-K program
Schools do good job informing parents about pre-K events,volunteer opportunities, etc.
Schools do good job informing parents about child’s progress.
Parents (n=283-286) VPI Teacher (n=29) Montessori Teacher (n=14-15) SPED Teacher (n=28) Principal/AP (n=30)
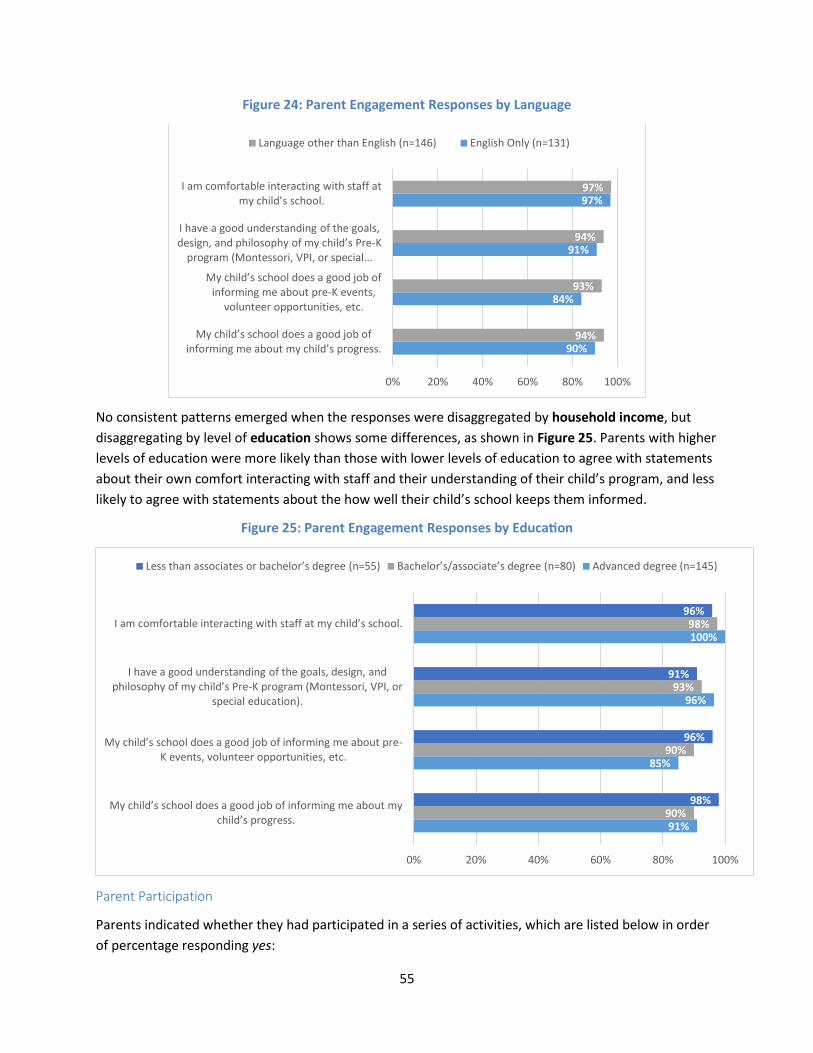
55
Figure 24: Parent Engagement Responses by Language
No consistent patterns emerged when the responses were disaggregated by household income, but
disaggregating by level of education shows some differences, as shown in Figure 25. Parents with higher
levels of education were more likely than those with lower levels of education to agree with statements
about their own comfort interacting with staff and their understanding of their child’s program, and less
likely to agree with statements about the how well their child’s school keeps them informed.
Figure 25: Parent Engagement Responses by Education
Parent Participation
Parents indicated whether they had participated in a series of activities, which are listed below in order
of percentage responding yes:
90%
84%
91%
97%
94%
93%
94%
97%
0% 20% 40% 60% 80% 100%
My child’s school does a good job of informing me about my child’s progress.
My child’s school does a good job of informing me about pre-K events,
volunteer opportunities, etc.
I have a good understanding of the goals, design, and philosophy of my child’s Pre-K
program (Montessori, VPI, or special …
I am comfortable interacting with staff at my child’s school.
Language other than English (n=146) English Only (n=131)
91%
85%
96%
100%
90%
90%
93%
98%
98%
96%
91%
96%
0% 20% 40% 60% 80% 100%
My child’s school does a good job of informing me about my child’s progress.
My child’s school does a good job of informing me about pre-K events, volunteer opportunities, etc.
I have a good understanding of the goals, design, and philosophy of my child’s Pre-K program (Montessori, VPI, or
special education).
I am comfortable interacting with staff at my child’s school.
Less than associates or bachelor’s degree (n=55) Bachelor’s/associate’s degree (n=80) Advanced degree (n=145)
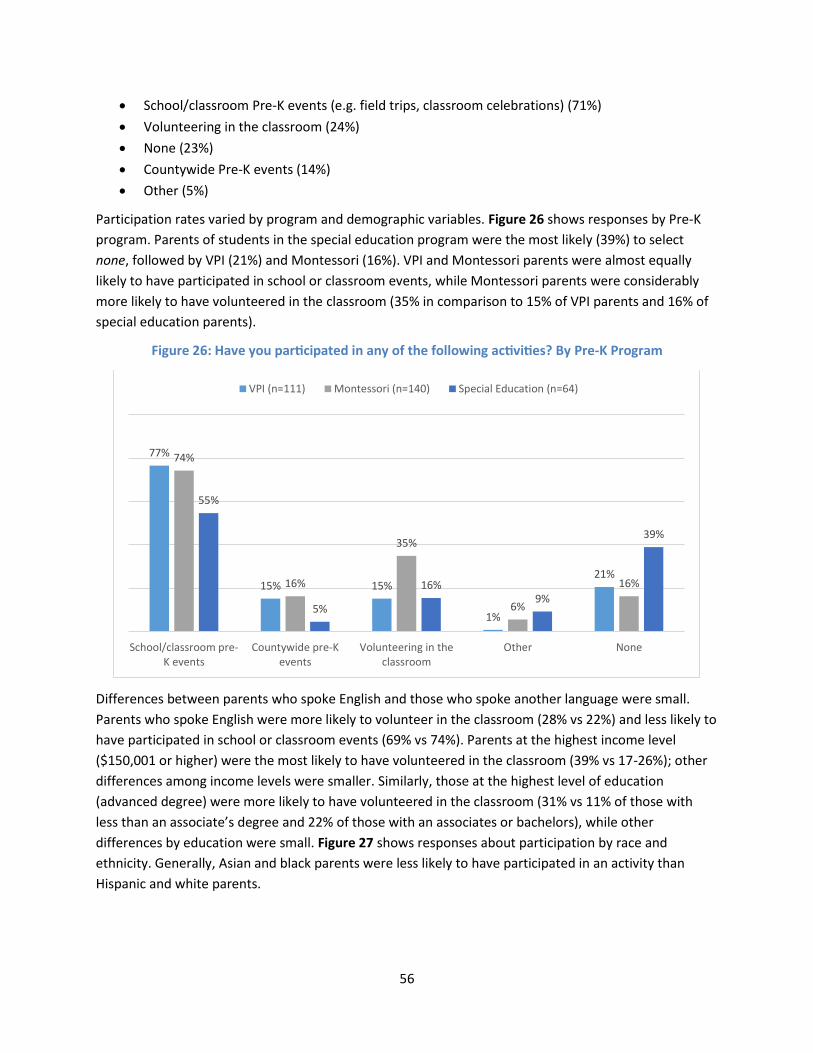
56
School/classroom Pre-K events (e.g. field trips, classroom celebrations) (71%)
Volunteering in the classroom (24%)
None (23%)
Countywide Pre-K events (14%)
Other (5%)
Participation rates varied by program and demographic variables. Figure 26 shows responses by Pre-K
program. Parents of students in the special education program were the most likely (39%) to select
none, followed by VPI (21%) and Montessori (16%). VPI and Montessori parents were almost equally
likely to have participated in school or classroom events, while Montessori parents were considerably
more likely to have volunteered in the classroom (35% in comparison to 15% of VPI parents and 16% of
special education parents).
Figure 26: Have you participated in any of the following activities? By Pre-K Program
Differences between parents who spoke English and those who spoke another language were small.
Parents who spoke English were more likely to volunteer in the classroom (28% vs 22%) and less likely to
have participated in school or classroom events (69% vs 74%). Parents at the highest income level
($150,001 or higher) were the most likely to have volunteered in the classroom (39% vs 17-26%); other
differences among income levels were smaller. Similarly, those at the highest level of education
(advanced degree) were more likely to have volunteered in the classroom (31% vs 11% of those with
less than an associate’s degree and 22% of those with an associates or bachelors), while other
differences by education were small. Figure 27 shows responses about participation by race and
ethnicity. Generally, Asian and black parents were less likely to have participated in an activity than
Hispanic and white parents.
77%
15% 15%
1%
21%
74%
16%
35%
6%
16%
55%
5%
16%9%
39%
School/classroom pre-K events
Countywide pre-Kevents
Volunteering in theclassroom
Other None
VPI (n=111) Montessori (n=140) Special Education (n=64)

57
Figure 27: Have you participated in any of the following activities? By Race/Ethnicity
In addition to survey data, the Office of Planning and Evaluation collected data from all Pre-K teachers
throughout the 2015-16 school year regarding events and activities that parents of students in their
class had participated in. A class list was provided to teachers to check off whether a child’s parent had
participated in a list of events and activities that occurred throughout the year, and this was submitted
on an ongoing basis via a google sheet. A child’s parent was counted as participating if he/she had
participated at least one time. Figure 28 shows the results for all three programs.
When interpreting this data, two differences among the programs should be kept in mind:
Home visits are a requirement of the VPI program and not the primary Montessori or special
education program. For more information about VPI home visits, see Family and Parental
Involvement Plan on page 7.
Both Montessori and VPI families participate in the two APS elementary conference days per
school year to discuss student progress. VPI families are asked to participate in an additional
end-of-year conference in June. At this final conference, the teacher shares the student
portfolio with the parent and celebrates student success. For this reason, there is no data
available for end-of-year conferences for Montessori parents.
Other than VPI home visits, the events with the highest rates of participation were parent conferences.
90-92% of VPI and Montessori students’ parents, and 77% of parents of students in the special
education program, attended the fall parent conference. This participation rate remained steady for
mid-year conferences, but fell for VPI and special education parents in the end-of-year conference in
June (62% VPI, 43% special education).
Mirroring the parent survey, Montessori parents were the most likely to have volunteered in the
classroom (28%), followed by special education (17%) and VPI (10%).
65%
12%16%
26%
5%
70%
7%
16%
26%
2%
76%
16%
26%18%
5%
69%
15%
28%24%
5%
100%
18%
27%
0%
9%
School/classroom pre-K events (e.g. field
trips, classroomcelebrations)
Countywide pre-Kevents
Volunteering in theclassroom
None Other
Asian (n=43) Black (n=43) Hispanic (n=76) White (n=134) Other (n=11)

58
While the survey asked parents about their attendance at “school/classroom” events, teachers reported
data for these two types of events separately. Montessori parents were more likely to have attended a
classroom-based event (69%) while VPI parents were more likely to have attended a school-based
event (54%). Special education parents had the lowest rate of participation in both types of events, 41%
for classroom-based and 32% for school-based.
Figure 28: Percentage of Students Whose Parents Participated at Least Once in Activity, 2015-16
The parent survey report is available in Appendix D1. The full report on parent participation data
collected in 2015-16 is available in Appendix C2.
Effective Use of Resources
Costs of VPI and Montessori Programs
Due to slightly higher average salary and benefits costs for VPI assistants and lower student-staff
ratios, per-pupil staffing costs are higher for VPI ($8,702) than for primary Montessori ($7,331). At
90%
90%
62%
51%
91%
10%
48%
54%
42%
92%
94%
42%
28%
69%
39%
25%
77%
75%
43%
38%
3%
17%
41%
32%
28%
0% 20% 40% 60% 80% 100%
Fall Parent Conference
Mid-Year Conference
End-of-Year Conference
Back to School Night
Home Visit
Classroom Volunteer
Classroom-based event
School-based event
Field Trip Chaperone
SPED (n=221-239) Montessori (n=342-359) VPI (n=535-537)

59
the same time, average salary and benefits costs for primary Montessori teachers are higher than
for VPI teachers. Startup costs at the individual classroom level, including furniture and
instructional material purchases, are considerably higher for the primary Montessori program than
for VPI. Tuition fees required for the primary Montessori program vary widely by household income
level and make up a greater percentage of a family’s income at the middle income levels than at
higher income levels.
The Office of Planning and Evaluation contracted with Hanover Research (Hanover) to conduct a cost
analysis for the VPI and primary Montessori programs. Planning and Evaluation provided Hanover with
data from the student information system, as well as data provided by the Finance Department,
Transportation, and the Office of Early Childhood:
2015-16 VPI and Montessori enrollment
2015-16 VPI grant funds
2015-16 central professional development and curriculum development budget for primary
Montessori
Salary and benefit information for VPI and primary Montessori teachers and assistants for 2015-
16
Credentials, endorsements, and years of teaching experience for VPI and primary Montessori
teachers in 2015-16
Teacher-reported data on which Pre-K students took the bus in 2015-16
List of Pre-K students who were eligible for bus service in 2015-16
Estimate of per-pupil bus transportation costs for 2014-15 (most recent available)
Estimate of Pre-K bus attendant staffing and wages for 2015-16
Startup costs for most recent new primary Montessori classroom (2013-14)
Startup costs for most recent new VPI classroom (2010-11)
Montessori fee schedule (2015-16)
Staff Teaching Experience and Costs
A summary of staff allocation and costs are provided in Table 8 below.
Teachers in the primary Montessori program, on average, have more years of teaching
experience than those in the VPI Pre-K program.
Per-pupil staff costs are slightly higher for VPI ($8,702) than for primary Montessori ($7,331).
However, average salary and benefits costs for primary Montessori teachers are higher than for
VPI teachers ($117,401 and $97,196, respectively).
Higher per-pupil costs for the VPI program can be attributed to slightly higher average salary
and benefits costs for the assistants in the VPI program, as well as smaller class sizes and lower
student-teacher and student-assistant ratios. The VPI program requires a maximum class size of
16 to 18 students, while the maximum class size for Montessori Primary classrooms is 23 Pre-K
and kindergarten students. It should be noted that the average class size for mixed-age
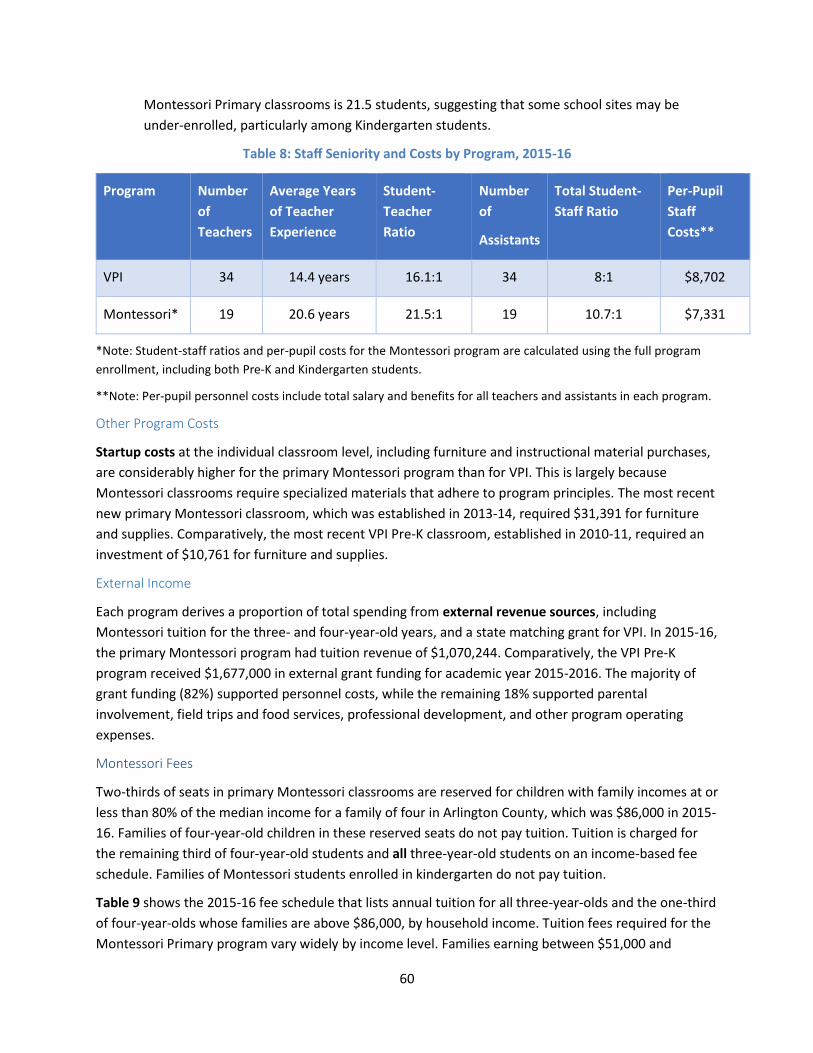
60
Montessori Primary classrooms is 21.5 students, suggesting that some school sites may be
under-enrolled, particularly among Kindergarten students.
Table 8: Staff Seniority and Costs by Program, 2015-16
Program Number
of
Teachers
Average Years
of Teacher
Experience
Student-
Teacher
Ratio
Number
of
Assistants
Total Student-
Staff Ratio
Per-Pupil
Staff
Costs**
VPI 34 14.4 years 16.1:1 34 8:1 $8,702
Montessori* 19 20.6 years 21.5:1 19 10.7:1 $7,331
*Note: Student-staff ratios and per-pupil costs for the Montessori program are calculated using the full program
enrollment, including both Pre-K and Kindergarten students.
**Note: Per-pupil personnel costs include total salary and benefits for all teachers and assistants in each program.
Other Program Costs
Startup costs at the individual classroom level, including furniture and instructional material purchases,
are considerably higher for the primary Montessori program than for VPI. This is largely because
Montessori classrooms require specialized materials that adhere to program principles. The most recent
new primary Montessori classroom, which was established in 2013-14, required $31,391 for furniture
and supplies. Comparatively, the most recent VPI Pre-K classroom, established in 2010-11, required an
investment of $10,761 for furniture and supplies.
External Income
Each program derives a proportion of total spending from external revenue sources, including
Montessori tuition for the three- and four-year-old years, and a state matching grant for VPI. In 2015-16,
the primary Montessori program had tuition revenue of $1,070,244. Comparatively, the VPI Pre-K
program received $1,677,000 in external grant funding for academic year 2015-2016. The majority of
grant funding (82%) supported personnel costs, while the remaining 18% supported parental
involvement, field trips and food services, professional development, and other program operating
expenses.
Montessori Fees
Two-thirds of seats in primary Montessori classrooms are reserved for children with family incomes at or
less than 80% of the median income for a family of four in Arlington County, which was $86,000 in 2015-
16. Families of four-year-old children in these reserved seats do not pay tuition. Tuition is charged for
the remaining third of four-year-old students and all three-year-old students on an income-based fee
schedule. Families of Montessori students enrolled in kindergarten do not pay tuition.
Table 9 shows the 2015-16 fee schedule that lists annual tuition for all three-year-olds and the one-third
of four-year-olds whose families are above $86,000, by household income. Tuition fees required for the
Montessori Primary program vary widely by income level. Families earning between $51,000 and

61
$110,000 per year pay fees that consist of approximately 10% of their household income. This
percentage shrinks to 5.7% of household income or less for families that earn more than $200,000 per
year. Because families who pay the full tuition amount ($11,443) do not have to provide income
verification information, APS does not currently have information about the total income levels for full-
paying students.
Table 9: Primary Montessori Fee Schedule, 2015-16
Household Income Full-Day Fee
Percentage of Household Income*
Income to $24,000 $741 3.1% or more
$24,001 - $27,000 $1,010 4.20%
$27,001-$30,000 $1,310 4.90%
$30,001 - $33,000 $1,737 5.80%
$33,001 - $37,000 $2,217 6.70%
$37,001 - $41,000 $2,847 7.70%
$41,001 - $46,000 $3,556 8.70%
$46,001 - $51,000 $4,345 9.40%
$51,001 - $57,000 $5,212 10.20%
$57,001 - $62,000 $6,290 11.00%
$62,001 - $67,000 $7,463 12.00%
$67,001 - $72,000 $8,734 13.00%
$72,001 - $77,000 $9,354 13.00%
$77,001 - $82,000 $10,018 13.00%
$82,001 - $86,000 $10,065 12.30%
$86,001 - $90,000 $10,065 11.70%
$90,001 - $96,000 $10,113 11.20%
$96,001 - $110,000 $10,161 10.60%
$110,001 - $125,000 $10,408 9.50%
$125,001 - $150,000 $10,660 8.50%
$150,001 - $175,000 $10,916 7.30%
$175,001 - $200,000 $11,177 6.40%
$200,001 and up $11,443 5.7% or less
*Calculated for the minimum income level within each range, except for household income of $24,000.
Transportation
Approximately one-third of Montessori Pre-K students and one-half of VPI students receive
transportation services at APS. Based on an estimate of per-pupil costs provided by the
Transportation Office, the total cost of Pre-K transportation is $171,661, including $45,026 for
the Montessori program and $126,635 for the VPI program. Note that this cost estimate does
not include students who receive exclusive transportation bus services for special education, or
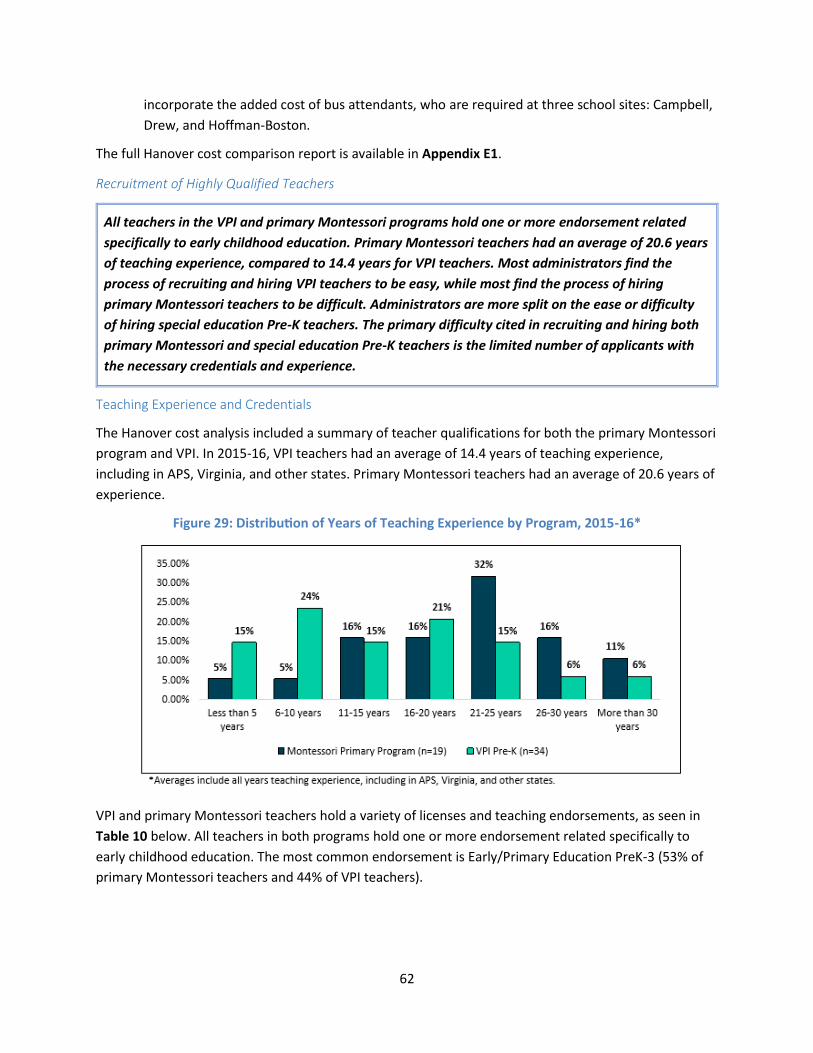
62
incorporate the added cost of bus attendants, who are required at three school sites: Campbell,
Drew, and Hoffman-Boston.
The full Hanover cost comparison report is available in Appendix E1.
Recruitment of Highly Qualified Teachers
All teachers in the VPI and primary Montessori programs hold one or more endorsement related
specifically to early childhood education. Primary Montessori teachers had an average of 20.6 years
of teaching experience, compared to 14.4 years for VPI teachers. Most administrators find the
process of recruiting and hiring VPI teachers to be easy, while most find the process of hiring
primary Montessori teachers to be difficult. Administrators are more split on the ease or difficulty
of hiring special education Pre-K teachers. The primary difficulty cited in recruiting and hiring both
primary Montessori and special education Pre-K teachers is the limited number of applicants with
the necessary credentials and experience.
Teaching Experience and Credentials
The Hanover cost analysis included a summary of teacher qualifications for both the primary Montessori
program and VPI. In 2015-16, VPI teachers had an average of 14.4 years of teaching experience,
including in APS, Virginia, and other states. Primary Montessori teachers had an average of 20.6 years of
experience.
Figure 29: Distribution of Years of Teaching Experience by Program, 2015-16*
VPI and primary Montessori teachers hold a variety of licenses and teaching endorsements, as seen in
Table 10 below. All teachers in both programs hold one or more endorsement related specifically to
early childhood education. The most common endorsement is Early/Primary Education PreK-3 (53% of
primary Montessori teachers and 44% of VPI teachers).

63
Table 10: Teacher Licenses and Endorsements by Program
Endorsement/License
Primary Montessori
Teachers VPI Teachers
Number % Number %
License Type
Collegiate Professional 5 26% 13 38%
Postgraduate Professional 13 68% 20 59%
Provisional 1 5% 1 3%
Teacher Early Childhood Education Endorsements*
Early/Primary Education PreK-3 10 53% 15 44%
Elementary Education PreK-4 2 11% 10 29%
Early Education NK-4 3 16% 5 15%
Early Childhood Special Education 1 5% 3 9%
Early Education PreK-3 3 16% 1 3%
Elementary Grades PreK-6 0 0% 3 9%
Elementary Grades NK-8 1 5% 0 0%
Total Teachers with a Pre-K Endorsement (Unduplicated) 19 100% 34 100%
*Note: Number of teachers may sum to more than the total for each program because teachers may hold more
than one endorsement.
Principals and assistant principals who indicated that they are involved in the recruitment and hiring
process for each type of Pre-K teacher were asked to rate the ease or difficulty of hiring and recruiting
teachers for each Pre-K program. Their responses are displayed in Figure 30. While most administrators
involved in recruitment and hiring for VPI teachers rated the process as somewhat or very easy (81%),
the reverse is true for Montessori, with 64% rating the process as very difficult and just 27% rating the
process as somewhat easy. Administrators were more split on special education hiring, with 52% rating
the process difficult and 48% rating the process easy.
Figure 30: Principals and Assistant Principals level of difficulty for hiring and recruiting teachers
13%
64%
5%
39%
9%
14%
39%
27%
43%
9%
38%
0% 20% 40% 60% 80% 100%
Recruiting/hiring teachers for SpecialEducation (n=23)
Recruiting/hiring for Primary Montessori(n=11)
Recruiting/hiring for VPI (n=21)
Very Difficult Somewhat Difficult Somewhat Easy Very Easy
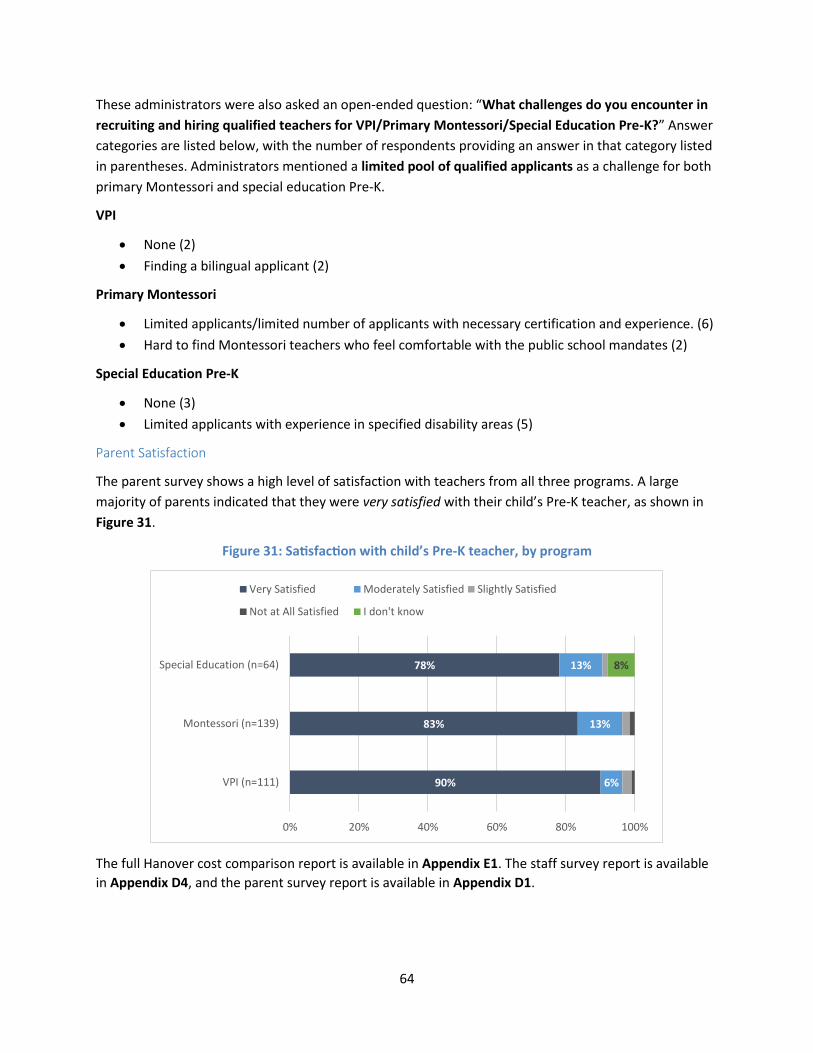
64
These administrators were also asked an open-ended question: “What challenges do you encounter in
recruiting and hiring qualified teachers for VPI/Primary Montessori/Special Education Pre-K?” Answer
categories are listed below, with the number of respondents providing an answer in that category listed
in parentheses. Administrators mentioned a limited pool of qualified applicants as a challenge for both
primary Montessori and special education Pre-K.
VPI
None (2)
Finding a bilingual applicant (2)
Primary Montessori
Limited applicants/limited number of applicants with necessary certification and experience. (6)
Hard to find Montessori teachers who feel comfortable with the public school mandates (2)
Special Education Pre-K
None (3)
Limited applicants with experience in specified disability areas (5)
Parent Satisfaction
The parent survey shows a high level of satisfaction with teachers from all three programs. A large
majority of parents indicated that they were very satisfied with their child’s Pre-K teacher, as shown in
Figure 31.
Figure 31: Satisfaction with child’s Pre-K teacher, by program
The full Hanover cost comparison report is available in Appendix E1. The staff survey report is available
in Appendix D4, and the parent survey report is available in Appendix D1.
90%
83%
78%
6%
13%
13% 8%
0% 20% 40% 60% 80% 100%
VPI (n=111)
Montessori (n=139)
Special Education (n=64)
Very Satisfied Moderately Satisfied Slightly Satisfied
Not at All Satisfied I don't know
65
Professional Development
VPI teachers were far more likely than Montessori teachers to report that professional development
offered by the Early Childhood Office was relevant to their work, and that they frequently apply
what they learn in professional development offered by the Early Childhood Office.
Teachers and assistants responded to a series of questions about the relevance of professional
development they had participated in, as well as how frequently they apply what they have learned in
professional development. Figure 32 shows responses to three questions: How relevant to your work
with Pre-K students is the professional development provided by
Your school
The Early Childhood Office
Other Central Offices
Among all response groups, professional development offered by the school was the least likely to be
rated very or extremely relevant. As for professional development offered by the Early Childhood Office
or by other central offices, VPI and Montessori teachers responded in direct contrast to each other. VPI
teachers were far more likely to report that professional development offered by the Early Childhood
Office was extremely or very relevant (79%) than Montessori teachers (26%), whereas Montessori
teachers were more likely to report that professional development offered by other central offices was
extremely or very relevant (53%) than VPI teachers (11%). Notably, 52% of VPI teachers reported that
they had never participated in professional development offered by other central offices.
This contrast between VPI and Montessori teachers may be explained in part by the evolving nature of
professional development provided to Montessori teachers by the Early Childhood Office. In recent
years, the office has diversified its approach to meet the unique professional learning needs of all
primary Montessori teachers. In 2012-13 and 2013-14, the Early Childhood Office provided substitutes
and trainers from two different Montessori training institutes. Starting in 2014, the Early Childhood
Office instead supported registration costs for optional attendance at outside Montessori workshops
and trainings. Additionally, Montessori teachers have been invited to participate in countywide Pre-K
trainings.
Special education teachers were almost as likely as VPI teachers to view professional development
offered by the Early Childhood Office as very or extremely relevant (70%), and fell in between VPI and
Montessori teachers regarding professional development offered by other central offices (37%).

66
Figure 32: How Relevant to Your Work with Pre-K Students Is the Professional Development Provided
by School, EC Office, Other Central Offices? (Percent Extremely/Very Relevant)*
*Montessori assistants not included; fewer than five responses
Figure 33 shows responses to three questions: How frequently would you say you apply what you
learn in professional development provided by your school/the Early Childhood Office/other central
offices to your work with Pre-K students? Similar to the relevance questions, there is a contrast
between VPI and special education teachers, and Montessori teachers, with a greater percentage of
VPI/special education teachers reporting that they apply what they learn in professional development
offered by the Early Childhood Office always or often (73-77% vs 44%), and a greater percentage of
Montessori teachers reporting that they apply what they learn in professional development offered by
other central offices always or often (50% vs 11-18%).
All groups were more likely to report that they apply what they learn always/often from professional
development offered by the Early Childhood Office than from professional development offered by their
school.
39%
53%
28%
63%
63%
50%
37%
70%
18%
53%
26%
13%
11%
79%
10%
0% 20% 40% 60% 80% 100%
Other Central Offices
Early Childhood Office
School
VPI Teacher(n=29)
Montessori Teacher(n=15)
SPED Teacher(n=27)
VPI Assistant(n=8)
SPED Assistant(n=13)

67
Figure 33: How Frequently Would You Say You Apply What You Learn in Professional Development
Provided by School, EC Office, Central Office, to Your Work with Pre-K Students? (Percent
Always/Often)*
*Montessori assistants not included; fewer than five responses
In response to an open-ended question asking for suggestions for how professional development for
early childhood staff could be improved:
By far, the most common response among Montessori teachers was a desire for more
Montessori-specific professional development.
Special education and VPI teachers suggested more of a focus on how to implement strategies.
Others suggested time to collaborate with and observe other teachers.
Two special education teachers specifically mentioned that they appreciate being included in
the professional development offered by the Early Childhood Office.
The full staff survey report is available in Appendix D4.
Division-Level Support
VPI teachers were the most likely to express satisfaction with support from the Early Childhood
Office in any area.
Teachers and assistants from all programs indicated their satisfaction with support from the Early
Childhood Office. Responses are displayed in Figure 34. Among teachers, VPI teachers were the most
likely to express satisfaction (extremely or very satisfied) with support in any area. The same held true
for VPI assistants among all the assistant groups. Only around a quarter of Montessori teachers
expressed satisfaction with support for curriculum, professional development, and advocacy. The
50%
58%
41%
67%
72%
57%
18%
73%
18%
50%
44%
22%
11%
77%
14%
0% 20% 40% 60% 80% 100%
Other Central Offices
Early Childhood Office
School
VPI Teacher(n=22)
Montessori Teacher(n=9)
SPED Teacher(n=22)
VPI Assistant(n=7)
SPED Assistant(n=12)
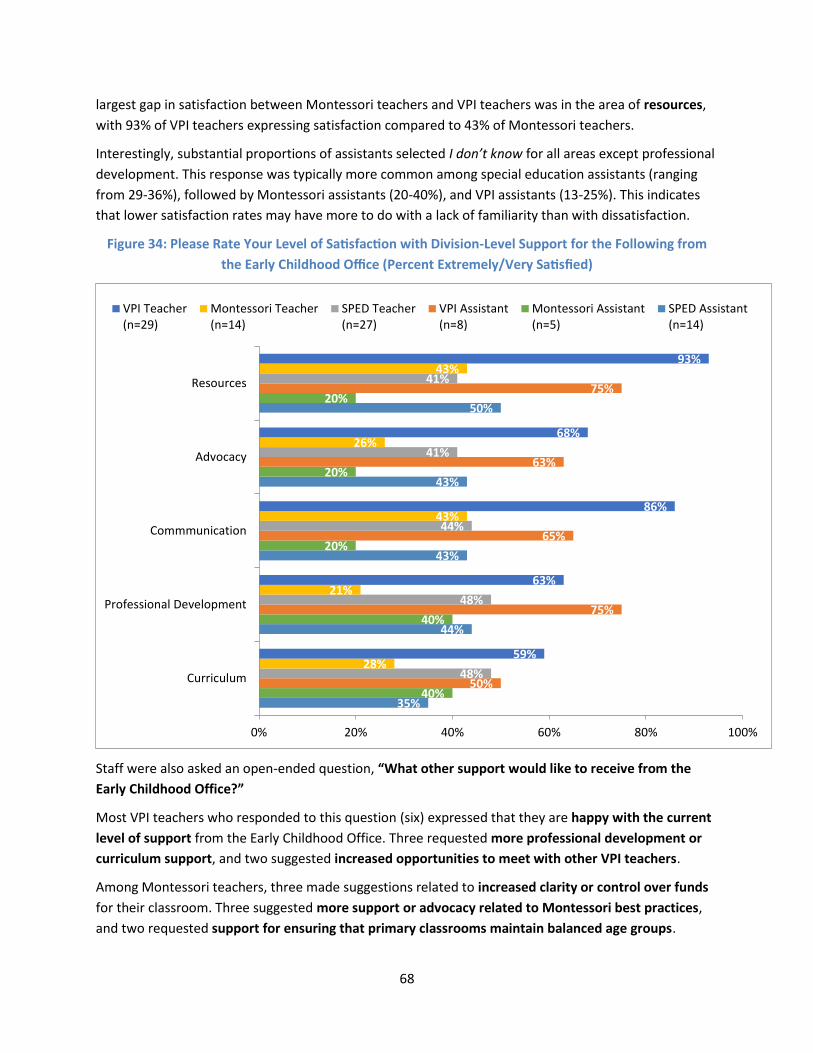
68
largest gap in satisfaction between Montessori teachers and VPI teachers was in the area of resources,
with 93% of VPI teachers expressing satisfaction compared to 43% of Montessori teachers.
Interestingly, substantial proportions of assistants selected I don’t know for all areas except professional
development. This response was typically more common among special education assistants (ranging
from 29-36%), followed by Montessori assistants (20-40%), and VPI assistants (13-25%). This indicates
that lower satisfaction rates may have more to do with a lack of familiarity than with dissatisfaction.
Figure 34: Please Rate Your Level of Satisfaction with Division-Level Support for the Following from
the Early Childhood Office (Percent Extremely/Very Satisfied)
Staff were also asked an open-ended question, “What other support would like to receive from the
Early Childhood Office?”
Most VPI teachers who responded to this question (six) expressed that they are happy with the current
level of support from the Early Childhood Office. Three requested more professional development or
curriculum support, and two suggested increased opportunities to meet with other VPI teachers.
Among Montessori teachers, three made suggestions related to increased clarity or control over funds
for their classroom. Three suggested more support or advocacy related to Montessori best practices,
and two requested support for ensuring that primary classrooms maintain balanced age groups.
35%
44%
43%
43%
50%
40%
40%
20%
20%
20%
50%
75%
65%
63%
75%
48%
48%
44%
41%
41%
28%
21%
43%
26%
43%
59%
63%
86%
68%
93%
0% 20% 40% 60% 80% 100%
Curriculum
Professional Development
Commmunication
Advocacy
Resources
VPI Teacher(n=29)
Montessori Teacher(n=14)
SPED Teacher(n=27)
VPI Assistant(n=8)
Montessori Assistant(n=5)
SPED Assistant(n=14)
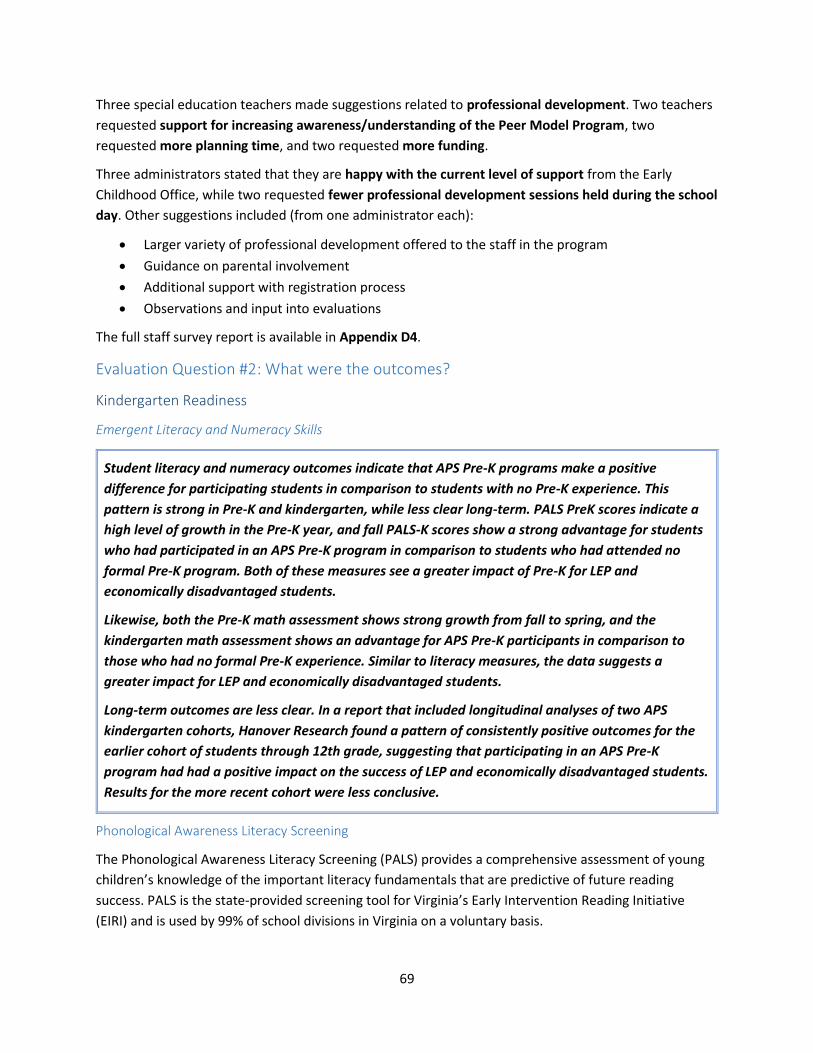
69
Three special education teachers made suggestions related to professional development. Two teachers
requested support for increasing awareness/understanding of the Peer Model Program, two
requested more planning time, and two requested more funding.
Three administrators stated that they are happy with the current level of support from the Early
Childhood Office, while two requested fewer professional development sessions held during the school
day. Other suggestions included (from one administrator each):
Larger variety of professional development offered to the staff in the program
Guidance on parental involvement
Additional support with registration process
Observations and input into evaluations
The full staff survey report is available in Appendix D4.
Evaluation Question #2: What were the outcomes?
Kindergarten Readiness
Emergent Literacy and Numeracy Skills
Student literacy and numeracy outcomes indicate that APS Pre-K programs make a positive
difference for participating students in comparison to students with no Pre-K experience. This
pattern is strong in Pre-K and kindergarten, while less clear long-term. PALS PreK scores indicate a
high level of growth in the Pre-K year, and fall PALS-K scores show a strong advantage for students
who had participated in an APS Pre-K program in comparison to students who had attended no
formal Pre-K program. Both of these measures see a greater impact of Pre-K for LEP and
economically disadvantaged students.
Likewise, both the Pre-K math assessment shows strong growth from fall to spring, and the
kindergarten math assessment shows an advantage for APS Pre-K participants in comparison to
those who had no formal Pre-K experience. Similar to literacy measures, the data suggests a
greater impact for LEP and economically disadvantaged students.
Long-term outcomes are less clear. In a report that included longitudinal analyses of two APS
kindergarten cohorts, Hanover Research found a pattern of consistently positive outcomes for the
earlier cohort of students through 12th grade, suggesting that participating in an APS Pre-K
program had had a positive impact on the success of LEP and economically disadvantaged students.
Results for the more recent cohort were less conclusive.
Phonological Awareness Literacy Screening
The Phonological Awareness Literacy Screening (PALS) provides a comprehensive assessment of young
children’s knowledge of the important literacy fundamentals that are predictive of future reading
success. PALS is the state-provided screening tool for Virginia’s Early Intervention Reading Initiative
(EIRI) and is used by 99% of school divisions in Virginia on a voluntary basis.
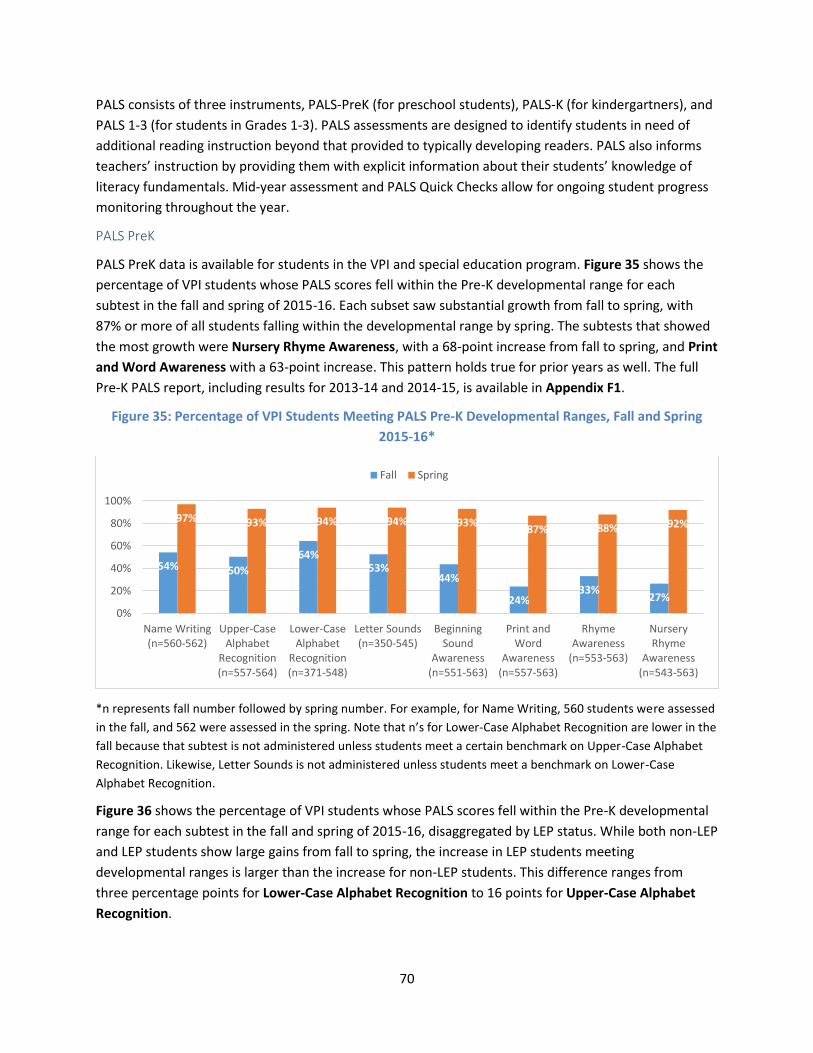
70
PALS consists of three instruments, PALS-PreK (for preschool students), PALS-K (for kindergartners), and
PALS 1-3 (for students in Grades 1-3). PALS assessments are designed to identify students in need of
additional reading instruction beyond that provided to typically developing readers. PALS also informs
teachers’ instruction by providing them with explicit information about their students’ knowledge of
literacy fundamentals. Mid-year assessment and PALS Quick Checks allow for ongoing student progress
monitoring throughout the year.
PALS PreK
PALS PreK data is available for students in the VPI and special education program. Figure 35 shows the
percentage of VPI students whose PALS scores fell within the Pre-K developmental range for each
subtest in the fall and spring of 2015-16. Each subset saw substantial growth from fall to spring, with
87% or more of all students falling within the developmental range by spring. The subtests that showed
the most growth were Nursery Rhyme Awareness, with a 68-point increase from fall to spring, and Print
and Word Awareness with a 63-point increase. This pattern holds true for prior years as well. The full
Pre-K PALS report, including results for 2013-14 and 2014-15, is available in Appendix F1.
Figure 35: Percentage of VPI Students Meeting PALS Pre-K Developmental Ranges, Fall and Spring
2015-16*
*n represents fall number followed by spring number. For example, for Name Writing, 560 students were assessed
in the fall, and 562 were assessed in the spring. Note that n’s for Lower-Case Alphabet Recognition are lower in the
fall because that subtest is not administered unless students meet a certain benchmark on Upper-Case Alphabet
Recognition. Likewise, Letter Sounds is not administered unless students meet a benchmark on Lower-Case
Alphabet Recognition.
Figure 36 shows the percentage of VPI students whose PALS scores fell within the Pre-K developmental
range for each subtest in the fall and spring of 2015-16, disaggregated by LEP status. While both non-LEP
and LEP students show large gains from fall to spring, the increase in LEP students meeting
developmental ranges is larger than the increase for non-LEP students. This difference ranges from
three percentage points for Lower-Case Alphabet Recognition to 16 points for Upper-Case Alphabet
Recognition.
54% 50%
64%53%
44%
24%33%
27%
97% 93% 94% 94% 93%87% 88% 92%
0%
20%
40%
60%
80%
100%
Name Writing(n=560-562)
Upper-CaseAlphabet
Recognition(n=557-564)
Lower-CaseAlphabet
Recognition(n=371-548)
Letter Sounds(n=350-545)
BeginningSound
Awareness(n=551-563)
Print andWord
Awareness(n=557-563)
RhymeAwareness
(n=553-563)
NurseryRhyme
Awareness(n=543-563)
Fall Spring
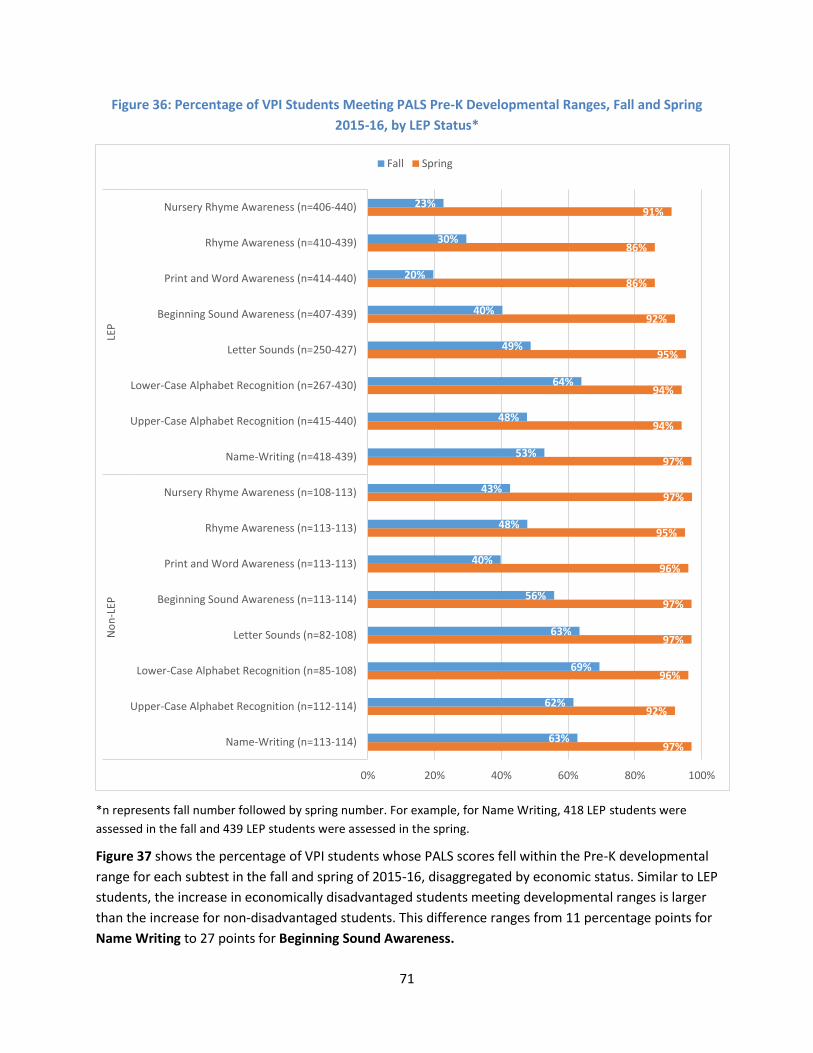
71
Figure 36: Percentage of VPI Students Meeting PALS Pre-K Developmental Ranges, Fall and Spring
2015-16, by LEP Status*
*n represents fall number followed by spring number. For example, for Name Writing, 418 LEP students were
assessed in the fall and 439 LEP students were assessed in the spring.
Figure 37 shows the percentage of VPI students whose PALS scores fell within the Pre-K developmental
range for each subtest in the fall and spring of 2015-16, disaggregated by economic status. Similar to LEP
students, the increase in economically disadvantaged students meeting developmental ranges is larger
than the increase for non-disadvantaged students. This difference ranges from 11 percentage points for
Name Writing to 27 points for Beginning Sound Awareness.
97%
92%
96%
97%
97%
96%
95%
97%
97%
94%
94%
95%
92%
86%
86%
91%
63%
62%
69%
63%
56%
40%
48%
43%
53%
48%
64%
49%
40%
20%
30%
23%
0% 20% 40% 60% 80% 100%
Name-Writing (n=113-114)
Upper-Case Alphabet Recognition (n=112-114)
Lower-Case Alphabet Recognition (n=85-108)
Letter Sounds (n=82-108)
Beginning Sound Awareness (n=113-114)
Print and Word Awareness (n=113-113)
Rhyme Awareness (n=113-113)
Nursery Rhyme Awareness (n=108-113)
Name-Writing (n=418-439)
Upper-Case Alphabet Recognition (n=415-440)
Lower-Case Alphabet Recognition (n=267-430)
Letter Sounds (n=250-427)
Beginning Sound Awareness (n=407-439)
Print and Word Awareness (n=414-440)
Rhyme Awareness (n=410-439)
Nursery Rhyme Awareness (n=406-440)
No
n-L
EPLE
P
Fall Spring
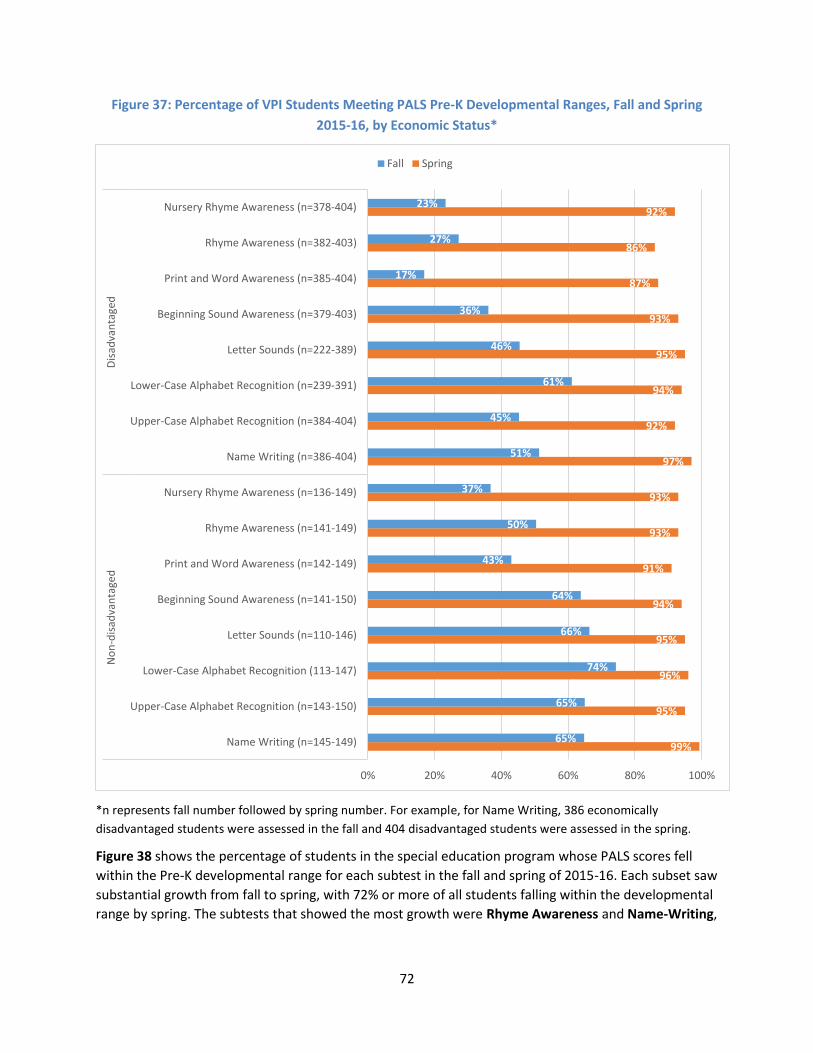
72
Figure 37: Percentage of VPI Students Meeting PALS Pre-K Developmental Ranges, Fall and Spring
2015-16, by Economic Status*
*n represents fall number followed by spring number. For example, for Name Writing, 386 economically
disadvantaged students were assessed in the fall and 404 disadvantaged students were assessed in the spring.
Figure 38 shows the percentage of students in the special education program whose PALS scores fell
within the Pre-K developmental range for each subtest in the fall and spring of 2015-16. Each subset saw
substantial growth from fall to spring, with 72% or more of all students falling within the developmental
range by spring. The subtests that showed the most growth were Rhyme Awareness and Name-Writing,
99%
95%
96%
95%
94%
91%
93%
93%
97%
92%
94%
95%
93%
87%
86%
92%
65%
65%
74%
66%
64%
43%
50%
37%
51%
45%
61%
46%
36%
17%
27%
23%
0% 20% 40% 60% 80% 100%
Name Writing (n=145-149)
Upper-Case Alphabet Recognition (n=143-150)
Lower-Case Alphabet Recognition (113-147)
Letter Sounds (n=110-146)
Beginning Sound Awareness (n=141-150)
Print and Word Awareness (n=142-149)
Rhyme Awareness (n=141-149)
Nursery Rhyme Awareness (n=136-149)
Name Writing (n=386-404)
Upper-Case Alphabet Recognition (n=384-404)
Lower-Case Alphabet Recognition (n=239-391)
Letter Sounds (n=222-389)
Beginning Sound Awareness (n=379-403)
Print and Word Awareness (n=385-404)
Rhyme Awareness (n=382-403)
Nursery Rhyme Awareness (n=378-404)
No
n-d
isad
van
tage
dD
isad
van
tage
d
Fall Spring

73
with a 30-point increase from fall to spring. Data is available for 2014-15 in Appendix F1, and follows a
similar pattern.
Figure 38: Percentage of Students in Special Education Program Meeting PALS Pre-K Developmental
Ranges, Fall and Spring 2015-16*
*n represents fall number followed by spring number. For example, for Name Writing, 82 students were assessed
in the fall, and 99 were assessed in the spring. Note that n’s for Lower-Case Alphabet Recognition are lower in the
fall because that subtest is not administered unless students meet a certain benchmark on Upper-Case Alphabet
Recognition. Likewise, Letter Sounds is not administered unless students meet a benchmark on Lower-Case
Alphabet Recognition.
Figure 39 shows the percentage of students in the special education program whose PALS scores fell
within the Pre-K developmental range for each subtest in the fall and spring of 2015-16, disaggregated
by LEP status. Similar to VPI students, both non-LEP and LEP students show large gains from fall to
spring, and the increase in LEP students meeting developmental ranges is larger than the increase for
non-LEP students, with just one exception. This difference ranges from six percentage points for Name-
Writing to 34 points for Nursery Rhyme Awareness.
50%
71%80%
71%
58%
37%
48% 51%
80%86% 86% 87% 85%
72%78% 79%
0%
20%
40%
60%
80%
100%
Name-Writing(n=82-99)
Upper-CaseAlphabet
Recognition(n=83-99)
Lower-CaseAlphabet
Recognition(n=73-99)
Letter Sounds(n=73-93)
BeginningSound
Awareness(n=83-90)
Print andWord
Awareness(n=83-99)
RhymeAwareness(n=83-99)
NurseryRhyme
Awareness(n=83-99)
Fall Spring
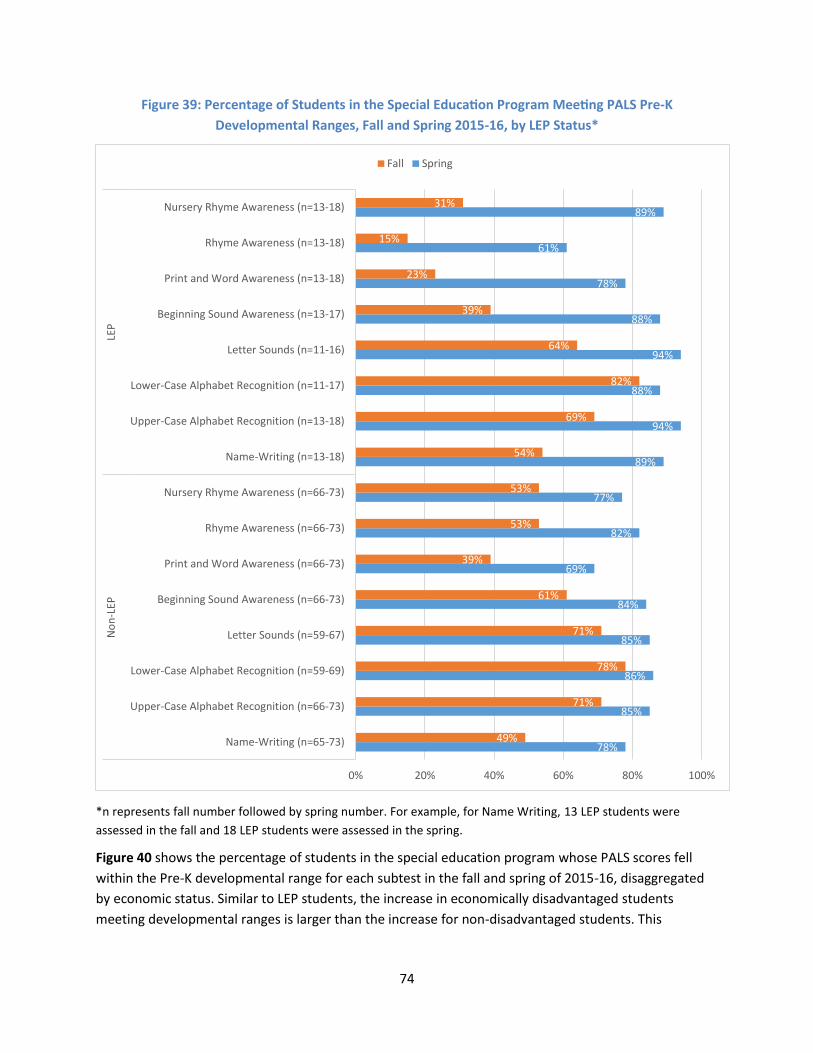
74
Figure 39: Percentage of Students in the Special Education Program Meeting PALS Pre-K
Developmental Ranges, Fall and Spring 2015-16, by LEP Status*
*n represents fall number followed by spring number. For example, for Name Writing, 13 LEP students were
assessed in the fall and 18 LEP students were assessed in the spring.
Figure 40 shows the percentage of students in the special education program whose PALS scores fell
within the Pre-K developmental range for each subtest in the fall and spring of 2015-16, disaggregated
by economic status. Similar to LEP students, the increase in economically disadvantaged students
meeting developmental ranges is larger than the increase for non-disadvantaged students. This
78%
85%
86%
85%
84%
69%
82%
77%
89%
94%
88%
94%
88%
78%
61%
89%
49%
71%
78%
71%
61%
39%
53%
53%
54%
69%
82%
64%
39%
23%
15%
31%
0% 20% 40% 60% 80% 100%
Name-Writing (n=65-73)
Upper-Case Alphabet Recognition (n=66-73)
Lower-Case Alphabet Recognition (n=59-69)
Letter Sounds (n=59-67)
Beginning Sound Awareness (n=66-73)
Print and Word Awareness (n=66-73)
Rhyme Awareness (n=66-73)
Nursery Rhyme Awareness (n=66-73)
Name-Writing (n=13-18)
Upper-Case Alphabet Recognition (n=13-18)
Lower-Case Alphabet Recognition (n=11-17)
Letter Sounds (n=11-16)
Beginning Sound Awareness (n=13-17)
Print and Word Awareness (n=13-18)
Rhyme Awareness (n=13-18)
Nursery Rhyme Awareness (n=13-18)
No
n-L
EPLE
P
Fall Spring
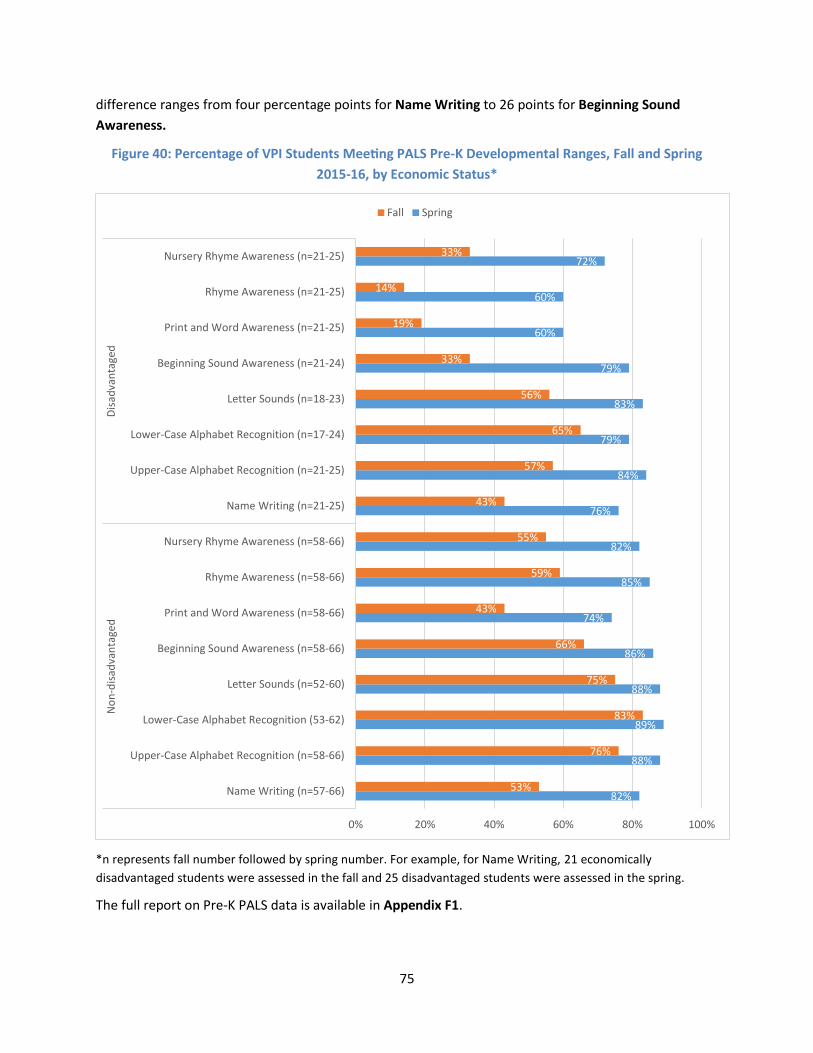
75
difference ranges from four percentage points for Name Writing to 26 points for Beginning Sound
Awareness.
Figure 40: Percentage of VPI Students Meeting PALS Pre-K Developmental Ranges, Fall and Spring
2015-16, by Economic Status*
*n represents fall number followed by spring number. For example, for Name Writing, 21 economically
disadvantaged students were assessed in the fall and 25 disadvantaged students were assessed in the spring.
The full report on Pre-K PALS data is available in Appendix F1.
82%
88%
89%
88%
86%
74%
85%
82%
76%
84%
79%
83%
79%
60%
60%
72%
53%
76%
83%
75%
66%
43%
59%
55%
43%
57%
65%
56%
33%
19%
14%
33%
0% 20% 40% 60% 80% 100%
Name Writing (n=57-66)
Upper-Case Alphabet Recognition (n=58-66)
Lower-Case Alphabet Recognition (53-62)
Letter Sounds (n=52-60)
Beginning Sound Awareness (n=58-66)
Print and Word Awareness (n=58-66)
Rhyme Awareness (n=58-66)
Nursery Rhyme Awareness (n=58-66)
Name Writing (n=21-25)
Upper-Case Alphabet Recognition (n=21-25)
Lower-Case Alphabet Recognition (n=17-24)
Letter Sounds (n=18-23)
Beginning Sound Awareness (n=21-24)
Print and Word Awareness (n=21-25)
Rhyme Awareness (n=21-25)
Nursery Rhyme Awareness (n=21-25)
No
n-d
isad
van
tage
dD
isad
van
tage
d
Fall Spring

76
PALS-K Fall Benchmark
In order to determine how well participation in an APS Pre-K program prepares students for
kindergarten, this evaluation includes an analysis of fall PALS-K results for all kindergarten students in
2013-14 through 2015-16, comparing results for those who attended an APS Pre-K program with those
who attended private Pre-K, no Pre-K at all, or Head Start.
Figure 41 shows the percentage of kindergartners whose fall PALS scores were at or above the
benchmark during the past three years, disaggregated by Pre-K experience13. In 2015-16, students who
had attended an APS Pre-K program (VPI, Montessori, or special education) were almost as likely to
meet the PALS benchmark as students who had attended a private Pre-K program (97% for all APS
programs, 99% for private providers). Students who had attended Head Start or who had attended no
formal Pre-K at all were less likely to meet the benchmark, ranging from 79-81%.
Figure 41: Percentage of Kindergartners at or above Kindergarten Fall PALS Benchmark, by Pre-K
Experience
Figure 42 shows the percentage of kindergartners whose fall PALS scores were at or above the
benchmark in the past two years, disaggregated by LEP status and Pre-K experience. In this graph, “APS
Pre-K program” refers to VPI, Montessori, or special education. In both years, LEP students who
attended an APS Pre-K program were far more likely to meet the kindergarten PALS benchmark than
13 2013-14 data does not include the Pre-K experiences of “no formal or institutional Pre-K program” or “private provider” due
to unreliable data for those categories. In addition, this graph excludes the categories of “coordinated special education” and “Other-Only APS is Peer Model.” These categories include small numbers of students and data for these students is included in Appendix F4.
98% 99%
97%
92%
87%
97%97%
82%81%
79%
75%
80%
85%
90%
95%
100%
2013-14 2014-15 2015-16
Private provider (n=945-1,010)
VPI (n=467-483)
Montessori (n=150-156)
SPED (n=67-90)
Head Start (n=26-32)
No formal or institutionalPre-K program (n=186-199)
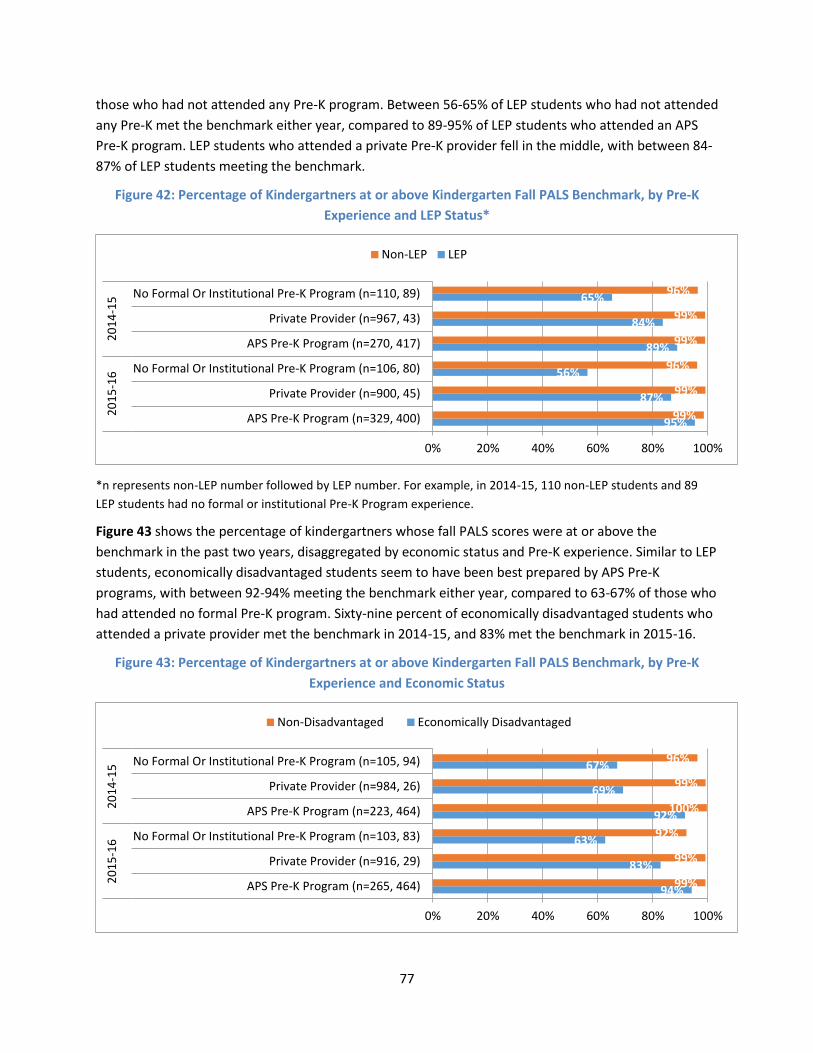
77
those who had not attended any Pre-K program. Between 56-65% of LEP students who had not attended
any Pre-K met the benchmark either year, compared to 89-95% of LEP students who attended an APS
Pre-K program. LEP students who attended a private Pre-K provider fell in the middle, with between 84-
87% of LEP students meeting the benchmark.
Figure 42: Percentage of Kindergartners at or above Kindergarten Fall PALS Benchmark, by Pre-K
Experience and LEP Status*
*n represents non-LEP number followed by LEP number. For example, in 2014-15, 110 non-LEP students and 89
LEP students had no formal or institutional Pre-K Program experience.
Figure 43 shows the percentage of kindergartners whose fall PALS scores were at or above the
benchmark in the past two years, disaggregated by economic status and Pre-K experience. Similar to LEP
students, economically disadvantaged students seem to have been best prepared by APS Pre-K
programs, with between 92-94% meeting the benchmark either year, compared to 63-67% of those who
had attended no formal Pre-K program. Sixty-nine percent of economically disadvantaged students who
attended a private provider met the benchmark in 2014-15, and 83% met the benchmark in 2015-16.
Figure 43: Percentage of Kindergartners at or above Kindergarten Fall PALS Benchmark, by Pre-K
Experience and Economic Status
95%
87%
56%
89%
84%
65%
99%
99%
96%
99%
99%
96%
0% 20% 40% 60% 80% 100%
APS Pre-K Program (n=329, 400)
Private Provider (n=900, 45)
No Formal Or Institutional Pre-K Program (n=106, 80)
APS Pre-K Program (n=270, 417)
Private Provider (n=967, 43)
No Formal Or Institutional Pre-K Program (n=110, 89)
20
15
-16
20
14
-15
Non-LEP LEP
94%
83%
63%
92%
69%
67%
99%
99%
92%
100%
99%
96%
0% 20% 40% 60% 80% 100%
APS Pre-K Program (n=265, 464)
Private Provider (n=916, 29)
No Formal Or Institutional Pre-K Program (n=103, 83)
APS Pre-K Program (n=223, 464)
Private Provider (n=984, 26)
No Formal Or Institutional Pre-K Program (n=105, 94)
20
15
-16
20
14
-15
Non-Disadvantaged Economically Disadvantaged
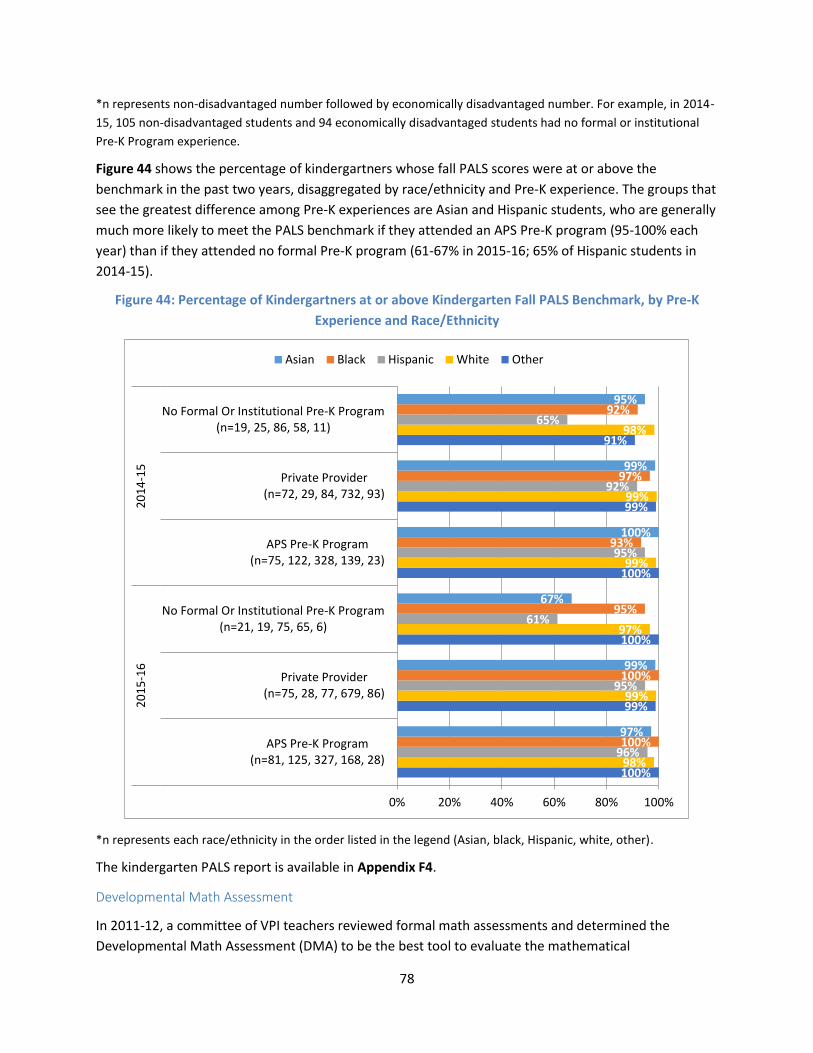
78
*n represents non-disadvantaged number followed by economically disadvantaged number. For example, in 2014-
15, 105 non-disadvantaged students and 94 economically disadvantaged students had no formal or institutional
Pre-K Program experience.
Figure 44 shows the percentage of kindergartners whose fall PALS scores were at or above the
benchmark in the past two years, disaggregated by race/ethnicity and Pre-K experience. The groups that
see the greatest difference among Pre-K experiences are Asian and Hispanic students, who are generally
much more likely to meet the PALS benchmark if they attended an APS Pre-K program (95-100% each
year) than if they attended no formal Pre-K program (61-67% in 2015-16; 65% of Hispanic students in
2014-15).
Figure 44: Percentage of Kindergartners at or above Kindergarten Fall PALS Benchmark, by Pre-K
Experience and Race/Ethnicity
*n represents each race/ethnicity in the order listed in the legend (Asian, black, Hispanic, white, other).
The kindergarten PALS report is available in Appendix F4.
Developmental Math Assessment
In 2011-12, a committee of VPI teachers reviewed formal math assessments and determined the
Developmental Math Assessment (DMA) to be the best tool to evaluate the mathematical
100%
99%
100%
100%
99%
91%
98%
99%
97%
99%
99%
98%
96%
95%
61%
95%
92%
65%
100%
100%
95%
93%
97%
92%
97%
99%
67%
100%
99%
95%
0% 20% 40% 60% 80% 100%
APS Pre-K Program(n=81, 125, 327, 168, 28)
Private Provider(n=75, 28, 77, 679, 86)
No Formal Or Institutional Pre-K Program(n=21, 19, 75, 65, 6)
APS Pre-K Program(n=75, 122, 328, 139, 23)
Private Provider(n=72, 29, 84, 732, 93)
No Formal Or Institutional Pre-K Program(n=19, 25, 86, 58, 11)
20
15
-16
20
14
-15
Asian Black Hispanic White Other

79
understanding of students in the program. The DMA is used with all VPI students as well as 3- through 5-
year old special education Pre-K students. Given the unique nature of the Montessori program, those
students are not formally assessed until the kindergarten year when they take APS kindergarten
assessments.
DMA assessments are given at three points in the Pre-K year: fall, mid-year and spring. Three years of
DMA data for the VPI program were provided to Planning and Evaluation by the Early Childhood Office.
The Special Education Office provided DMA scores for 2015-16. Due to limitations in the data, this
analysis includes overall scores only and no disaggregation by demographic variables. Students can place
at one of three levels on the DMA:
Emergent- students requiring instruction in Pre-Kindergarten number concepts.
Pre-K- students developing Pre-Kindergarten number concepts
Kindergarten- students demonstrate Kindergarten readiness concepts
Figure 45 shows the percentage of VPI students who placed at each DMA level in fall, mid-year, and
spring of 2015-16. Students show growth throughout the year, with just 4% of students testing at the
kindergarten level in the fall and 61% doing so in the spring. The pattern is almost identical for 2013-14
and 2014-15; data for those years is available in Appendix F2. In the three years included in this analysis,
between 93-98% of VPI students who placed at the Emergent level in the fall had improved at least one
level by spring, and between 81-86% of students who placed at the Pre-K level in the fall had moved to
the Kindergarten level by spring.
Figure 45: 2015-16 Percentage of VPI Students at each DMA Level
Figure 46 shows the percentage of students in the special education program who placed at each DMA
level in fall, mid-year, and spring of 2015-16. The percentage of students placing at the kindergarten
level increases from 7% in the fall to 49% in the spring. Of the students in the special education program
45.8%
12.1%3.9%
50.3%
67.4%
34.8%
3.8%20.5%
61.3%
0%
20%
40%
60%
80%
100%
Fall 2015-16(n=469)
Mid-year 2015-16(n=454)
Spring 2015-16(n=437)
Emerging Pre-K Kindergarten
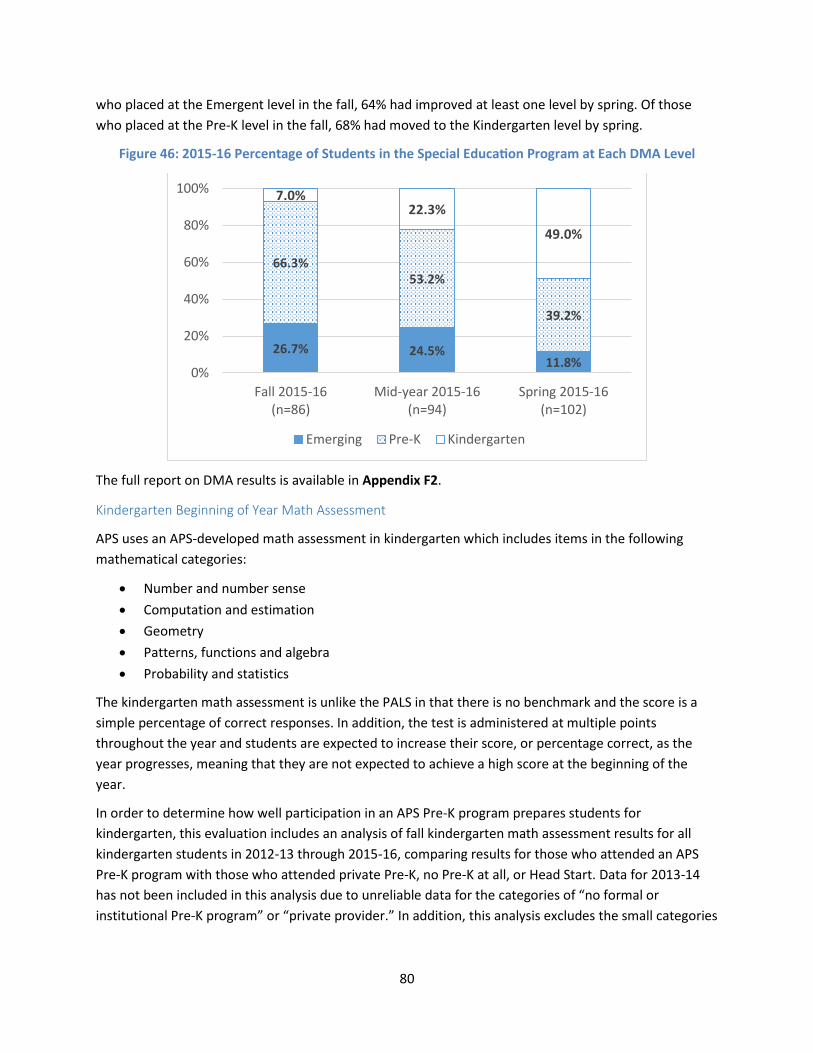
80
who placed at the Emergent level in the fall, 64% had improved at least one level by spring. Of those
who placed at the Pre-K level in the fall, 68% had moved to the Kindergarten level by spring.
Figure 46: 2015-16 Percentage of Students in the Special Education Program at Each DMA Level
The full report on DMA results is available in Appendix F2.
Kindergarten Beginning of Year Math Assessment
APS uses an APS-developed math assessment in kindergarten which includes items in the following
mathematical categories:
Number and number sense
Computation and estimation
Geometry
Patterns, functions and algebra
Probability and statistics
The kindergarten math assessment is unlike the PALS in that there is no benchmark and the score is a
simple percentage of correct responses. In addition, the test is administered at multiple points
throughout the year and students are expected to increase their score, or percentage correct, as the
year progresses, meaning that they are not expected to achieve a high score at the beginning of the
year.
In order to determine how well participation in an APS Pre-K program prepares students for
kindergarten, this evaluation includes an analysis of fall kindergarten math assessment results for all
kindergarten students in 2012-13 through 2015-16, comparing results for those who attended an APS
Pre-K program with those who attended private Pre-K, no Pre-K at all, or Head Start. Data for 2013-14
has not been included in this analysis due to unreliable data for the categories of “no formal or
institutional Pre-K program” or “private provider.” In addition, this analysis excludes the small categories
26.7% 24.5%11.8%
66.3%53.2%
39.2%
7.0%22.3%
49.0%
0%
20%
40%
60%
80%
100%
Fall 2015-16(n=86)
Mid-year 2015-16(n=94)
Spring 2015-16(n=102)
Emerging Pre-K Kindergarten
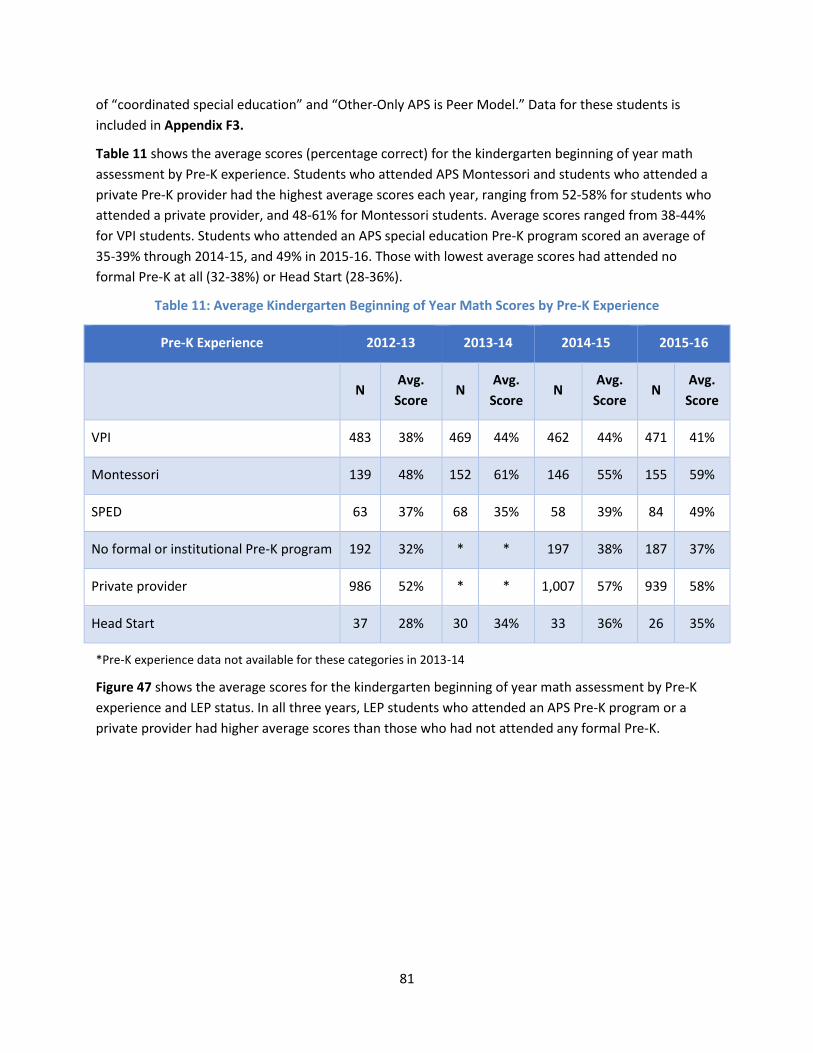
81
of “coordinated special education” and “Other-Only APS is Peer Model.” Data for these students is
included in Appendix F3.
Table 11 shows the average scores (percentage correct) for the kindergarten beginning of year math
assessment by Pre-K experience. Students who attended APS Montessori and students who attended a
private Pre-K provider had the highest average scores each year, ranging from 52-58% for students who
attended a private provider, and 48-61% for Montessori students. Average scores ranged from 38-44%
for VPI students. Students who attended an APS special education Pre-K program scored an average of
35-39% through 2014-15, and 49% in 2015-16. Those with lowest average scores had attended no
formal Pre-K at all (32-38%) or Head Start (28-36%).
Table 11: Average Kindergarten Beginning of Year Math Scores by Pre-K Experience
Pre-K Experience 2012-13 2013-14 2014-15 2015-16
N Avg.
Score N
Avg.
Score N
Avg.
Score N
Avg.
Score
VPI 483 38% 469 44% 462 44% 471 41%
Montessori 139 48% 152 61% 146 55% 155 59%
SPED 63 37% 68 35% 58 39% 84 49%
No formal or institutional Pre-K program 192 32% * * 197 38% 187 37%
Private provider 986 52% * * 1,007 57% 939 58%
Head Start 37 28% 30 34% 33 36% 26 35%
*Pre-K experience data not available for these categories in 2013-14
Figure 47 shows the average scores for the kindergarten beginning of year math assessment by Pre-K
experience and LEP status. In all three years, LEP students who attended an APS Pre-K program or a
private provider had higher average scores than those who had not attended any formal Pre-K.
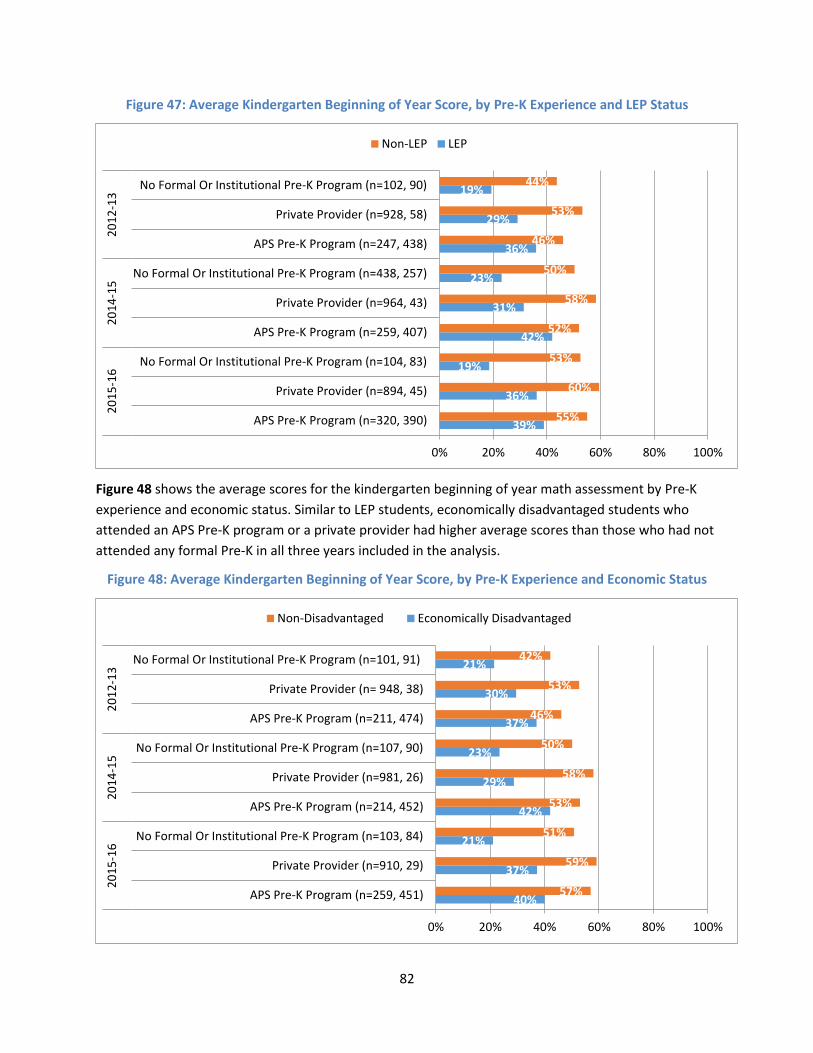
82
Figure 47: Average Kindergarten Beginning of Year Score, by Pre-K Experience and LEP Status
Figure 48 shows the average scores for the kindergarten beginning of year math assessment by Pre-K
experience and economic status. Similar to LEP students, economically disadvantaged students who
attended an APS Pre-K program or a private provider had higher average scores than those who had not
attended any formal Pre-K in all three years included in the analysis.
Figure 48: Average Kindergarten Beginning of Year Score, by Pre-K Experience and Economic Status
39%
36%
19%
42%
31%
23%
36%
29%
19%
55%
60%
53%
52%
58%
50%
46%
53%
44%
0% 20% 40% 60% 80% 100%
APS Pre-K Program (n=320, 390)
Private Provider (n=894, 45)
No Formal Or Institutional Pre-K Program (n=104, 83)
APS Pre-K Program (n=259, 407)
Private Provider (n=964, 43)
No Formal Or Institutional Pre-K Program (n=438, 257)
APS Pre-K Program (n=247, 438)
Private Provider (n=928, 58)
No Formal Or Institutional Pre-K Program (n=102, 90)
20
15
-16
20
14
-15
20
12
-13
Non-LEP LEP
40%
37%
21%
42%
29%
23%
37%
30%
21%
57%
59%
51%
53%
58%
50%
46%
53%
42%
0% 20% 40% 60% 80% 100%
APS Pre-K Program (n=259, 451)
Private Provider (n=910, 29)
No Formal Or Institutional Pre-K Program (n=103, 84)
APS Pre-K Program (n=214, 452)
Private Provider (n=981, 26)
No Formal Or Institutional Pre-K Program (n=107, 90)
APS Pre-K Program (n=211, 474)
Private Provider (n= 948, 38)
No Formal Or Institutional Pre-K Program (n=101, 91)
20
15
-16
20
14
-15
20
12
-13
Non-Disadvantaged Economically Disadvantaged
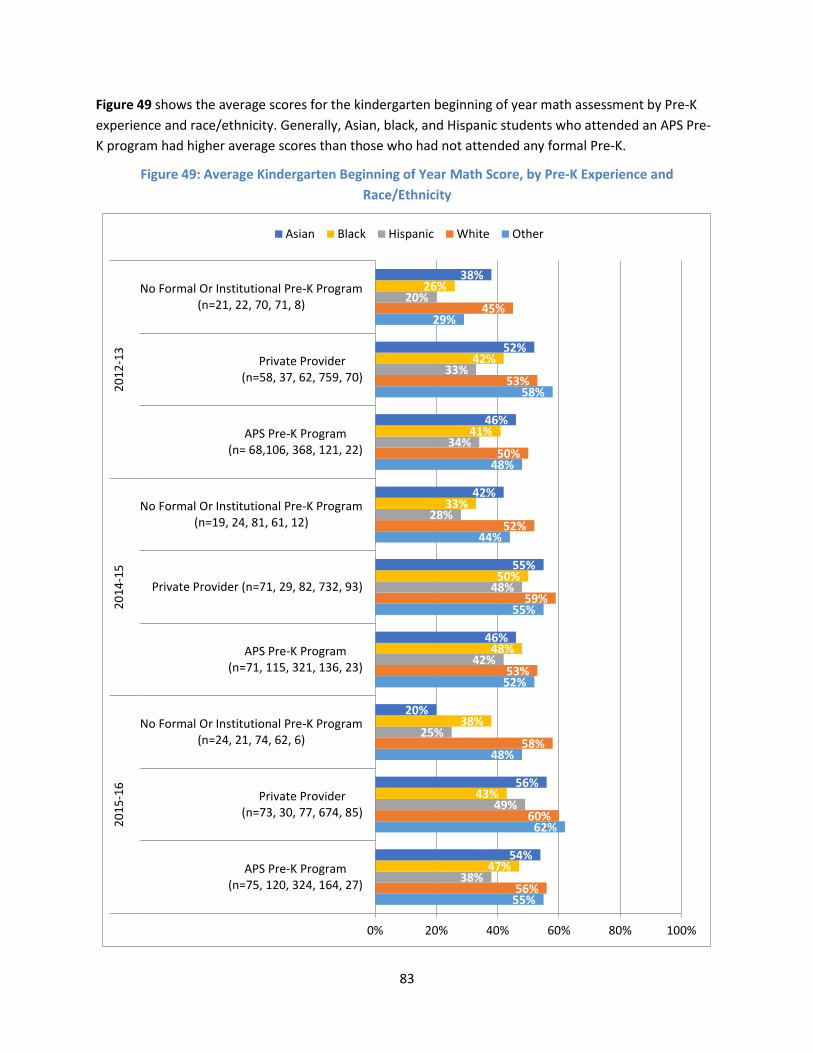
83
Figure 49 shows the average scores for the kindergarten beginning of year math assessment by Pre-K
experience and race/ethnicity. Generally, Asian, black, and Hispanic students who attended an APS Pre-
K program had higher average scores than those who had not attended any formal Pre-K.
Figure 49: Average Kindergarten Beginning of Year Math Score, by Pre-K Experience and
Race/Ethnicity
55%
62%
48%
52%
55%
44%
48%
58%
29%
56%
60%
58%
53%
59%
52%
50%
53%
45%
38%
49%
25%
42%
48%
28%
34%
33%
20%
47%
43%
38%
48%
50%
33%
41%
42%
26%
54%
56%
20%
46%
55%
42%
46%
52%
38%
0% 20% 40% 60% 80% 100%
APS Pre-K Program(n=75, 120, 324, 164, 27)
Private Provider(n=73, 30, 77, 674, 85)
No Formal Or Institutional Pre-K Program(n=24, 21, 74, 62, 6)
APS Pre-K Program(n=71, 115, 321, 136, 23)
Private Provider (n=71, 29, 82, 732, 93)
No Formal Or Institutional Pre-K Program(n=19, 24, 81, 61, 12)
APS Pre-K Program(n= 68,106, 368, 121, 22)
Private Provider(n=58, 37, 62, 759, 70)
No Formal Or Institutional Pre-K Program(n=21, 22, 70, 71, 8)
20
15
-16
20
14
-15
20
12
-13
Asian Black Hispanic White Other
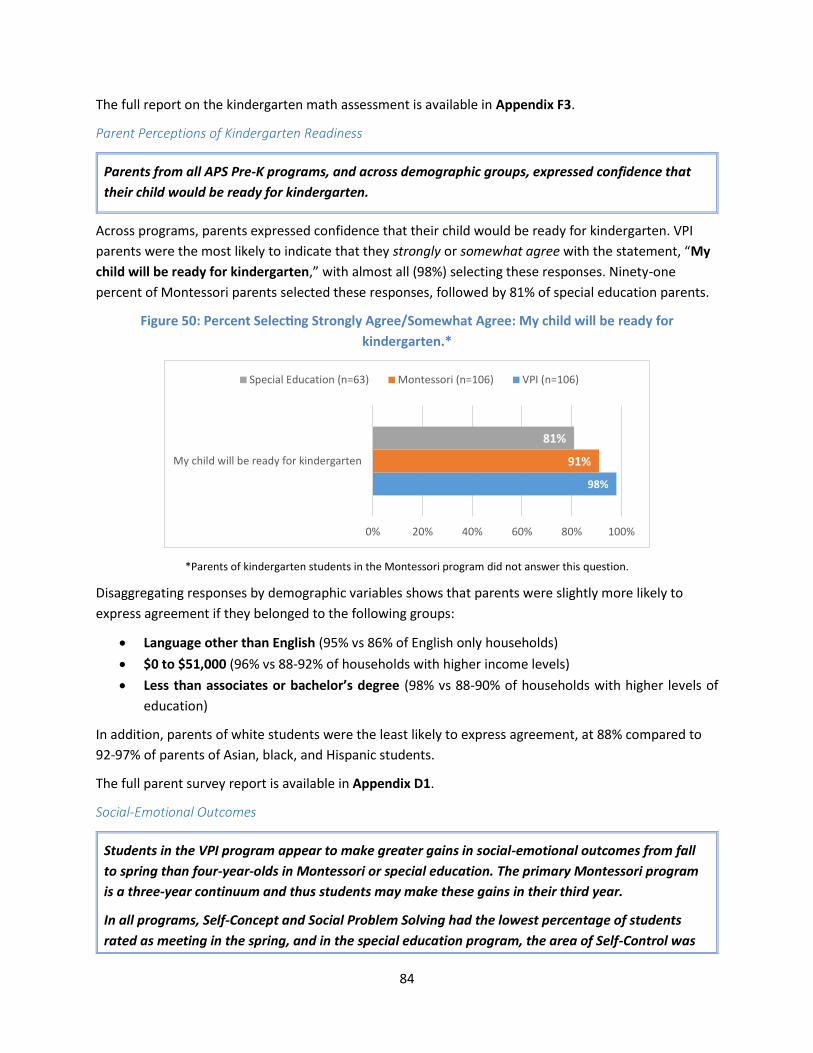
84
The full report on the kindergarten math assessment is available in Appendix F3.
Parent Perceptions of Kindergarten Readiness
Parents from all APS Pre-K programs, and across demographic groups, expressed confidence that
their child would be ready for kindergarten.
Across programs, parents expressed confidence that their child would be ready for kindergarten. VPI
parents were the most likely to indicate that they strongly or somewhat agree with the statement, “My
child will be ready for kindergarten,” with almost all (98%) selecting these responses. Ninety-one
percent of Montessori parents selected these responses, followed by 81% of special education parents.
Figure 50: Percent Selecting Strongly Agree/Somewhat Agree: My child will be ready for
kindergarten.*
*Parents of kindergarten students in the Montessori program did not answer this question.
Disaggregating responses by demographic variables shows that parents were slightly more likely to
express agreement if they belonged to the following groups:
Language other than English (95% vs 86% of English only households)
$0 to $51,000 (96% vs 88-92% of households with higher income levels)
Less than associates or bachelor’s degree (98% vs 88-90% of households with higher levels of
education)
In addition, parents of white students were the least likely to express agreement, at 88% compared to
92-97% of parents of Asian, black, and Hispanic students.
The full parent survey report is available in Appendix D1.
Social-Emotional Outcomes
Students in the VPI program appear to make greater gains in social-emotional outcomes from fall
to spring than four-year-olds in Montessori or special education. The primary Montessori program
is a three-year continuum and thus students may make these gains in their third year.
In all programs, Self-Concept and Social Problem Solving had the lowest percentage of students
rated as meeting in the spring, and in the special education program, the area of Self-Control was
98%
91%
81%
0% 20% 40% 60% 80% 100%
My child will be ready for kindergarten
Special Education (n=63) Montessori (n=106) VPI (n=106)
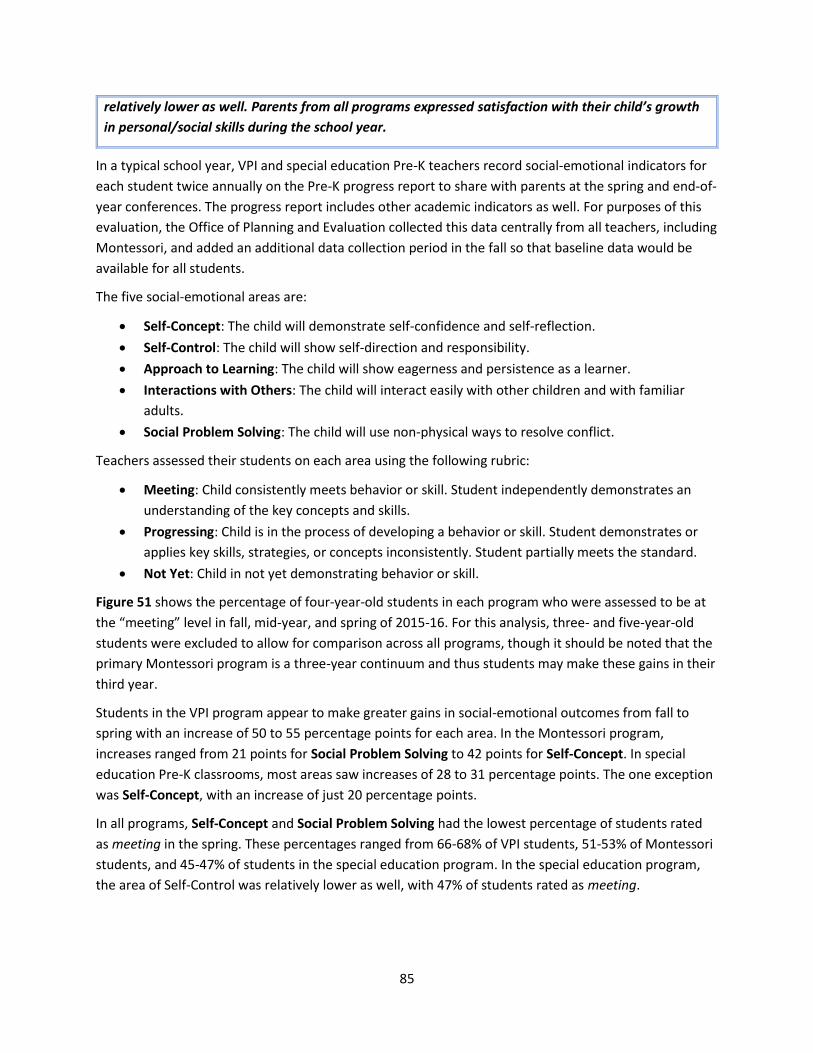
85
relatively lower as well. Parents from all programs expressed satisfaction with their child’s growth
in personal/social skills during the school year.
In a typical school year, VPI and special education Pre-K teachers record social-emotional indicators for
each student twice annually on the Pre-K progress report to share with parents at the spring and end-of-
year conferences. The progress report includes other academic indicators as well. For purposes of this
evaluation, the Office of Planning and Evaluation collected this data centrally from all teachers, including
Montessori, and added an additional data collection period in the fall so that baseline data would be
available for all students.
The five social-emotional areas are:
Self-Concept: The child will demonstrate self-confidence and self-reflection.
Self-Control: The child will show self-direction and responsibility.
Approach to Learning: The child will show eagerness and persistence as a learner.
Interactions with Others: The child will interact easily with other children and with familiar
adults.
Social Problem Solving: The child will use non-physical ways to resolve conflict.
Teachers assessed their students on each area using the following rubric:
Meeting: Child consistently meets behavior or skill. Student independently demonstrates an
understanding of the key concepts and skills.
Progressing: Child is in the process of developing a behavior or skill. Student demonstrates or
applies key skills, strategies, or concepts inconsistently. Student partially meets the standard.
Not Yet: Child in not yet demonstrating behavior or skill.
Figure 51 shows the percentage of four-year-old students in each program who were assessed to be at
the “meeting” level in fall, mid-year, and spring of 2015-16. For this analysis, three- and five-year-old
students were excluded to allow for comparison across all programs, though it should be noted that the
primary Montessori program is a three-year continuum and thus students may make these gains in their
third year.
Students in the VPI program appear to make greater gains in social-emotional outcomes from fall to
spring with an increase of 50 to 55 percentage points for each area. In the Montessori program,
increases ranged from 21 points for Social Problem Solving to 42 points for Self-Concept. In special
education Pre-K classrooms, most areas saw increases of 28 to 31 percentage points. The one exception
was Self-Concept, with an increase of just 20 percentage points.
In all programs, Self-Concept and Social Problem Solving had the lowest percentage of students rated
as meeting in the spring. These percentages ranged from 66-68% of VPI students, 51-53% of Montessori
students, and 45-47% of students in the special education program. In the special education program,
the area of Self-Control was relatively lower as well, with 47% of students rated as meeting.
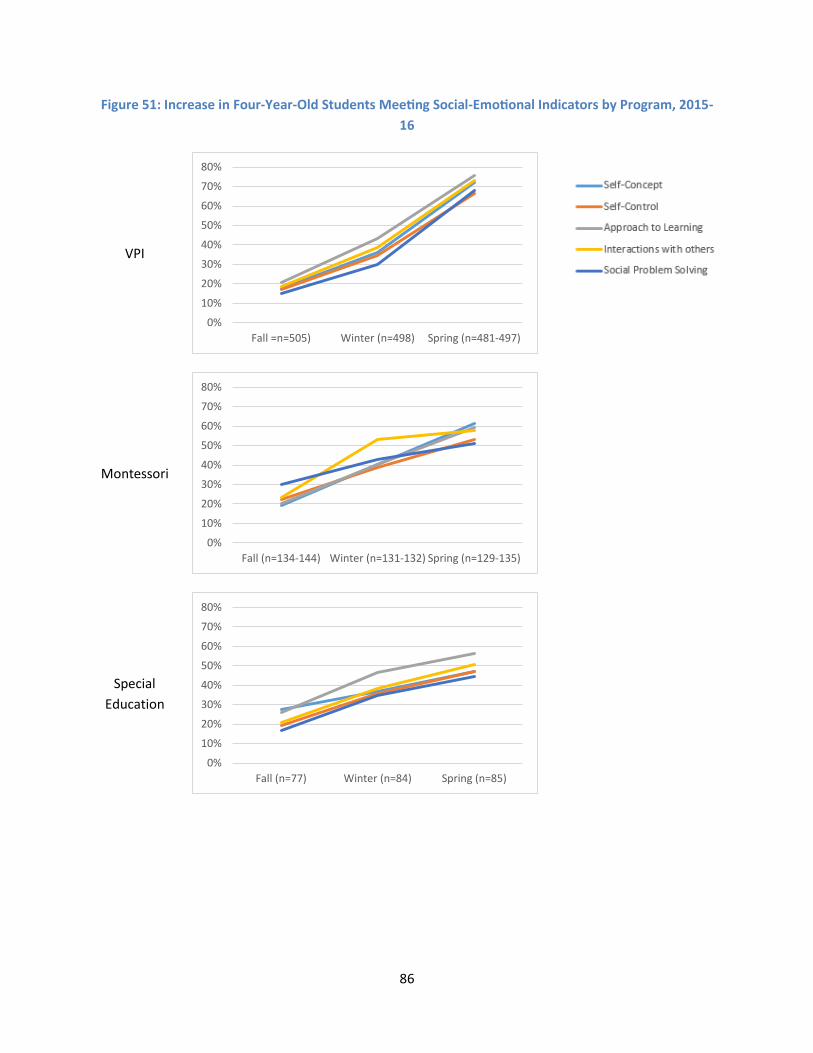
86
Figure 51: Increase in Four-Year-Old Students Meeting Social-Emotional Indicators by Program, 2015-
16
VPI
Montessori
Special
Education
0%
10%
20%
30%
40%
50%
60%
70%
80%
Fall =n=505) Winter (n=498) Spring (n=481-497)
0%
10%
20%
30%
40%
50%
60%
70%
80%
Fall (n=134-144) Winter (n=131-132) Spring (n=129-135)
0%
10%
20%
30%
40%
50%
60%
70%
80%
Fall (n=77) Winter (n=84) Spring (n=85)

87
Figure 52 shows responses from the spring 2016 survey of current Pre-K parents to the question,
“Please indicate how satisfied you are with your child's growth in personal/social skills during the
2015-16 school year.” Parents from all programs responded positively, with between 93-94% of VPI and
Montessori parents selecting very satisfied or moderately satisfied, and 87% of special education
parents selecting these responses.
Figure 52: Parents: Satisfaction with growth in personal/social skills, by program
The full report on social emotional outcomes is available in Appendix F6. The parent survey report is
available in Appendix D1.
Fine and Gross Motor Development
APS does not currently have a systematic approach to measuring growth in fine and gross motor
development. Most parents from all programs were satisfied with their child’s growth in fine and
gross motor development in the Pre-K year.
One goal of this evaluation was to assess students’ growth in fine and gross motor development, but
APS does not currently have a systematic approach to measuring growth in this area. As a result,
objective measures of fine and gross motor development have not been included in the evaluation, but
parent perceptions were gauged on the parent survey.
Figure 53 shows parents’ level of satisfaction with their child’s growth in fine and gross motor
development over the school year. Between 96-97% of VPI and Montessori parents reported being very
satisfied or moderately satisfied, while 87% of special education parents selected these responses.
84%
73%
59%
9%
21%
28%
4%
7%
0% 20% 40% 60% 80% 100%
VPI (n=106)
Montessori (n=136)
Special Education (n=58)
Very Satisfied Moderately Satisfied Slightly Satisfied Not at All Satisfied I don't know
88
Figure 53: Satisfaction with growth in fine/gross motor development, by program
The parent survey report is available in Appendix D1.
Student Health Wellbeing
Almost half of VPI parents indicated that their child’s willingness to try new foods, especially fruits
and vegetables, had increased since entering Pre-K.
APS Pre-K classrooms strive to introduce new healthy snack choices to students in ways that are fun and
engaging. One of the goals of VPI is to educate children and families on healthy eating choices.
Foundation Block 6 outlines the following: “The child will identify healthy and unhealthy foods, and
simple practices and habits that promote health and prevent illness.” Students in Montessori classrooms
are expected to prepare their own snack during the work block at their own discretion. This encourages
independence and interest in new snack choices.
Figure 54 shows responses to the question, “Have you noticed any increase in your child’s willingness
to try new foods, especially fruit and vegetables, since entering Pre-K?” Parents of VPI students were
the most likely to indicate that their child’s willingness to try new foods had increased (44%), followed
by special education (34%) and Montessori (29%).
83%
82%
61%
13%
15%
26% 5% 7%
0% 20% 40% 60% 80% 100%
VPI (n=105)
Montessori (n=136)
Special Education (n=57)
Very Satisfied Moderately Satisfied Slightly Satisfied Not at All Satisfied I don't know
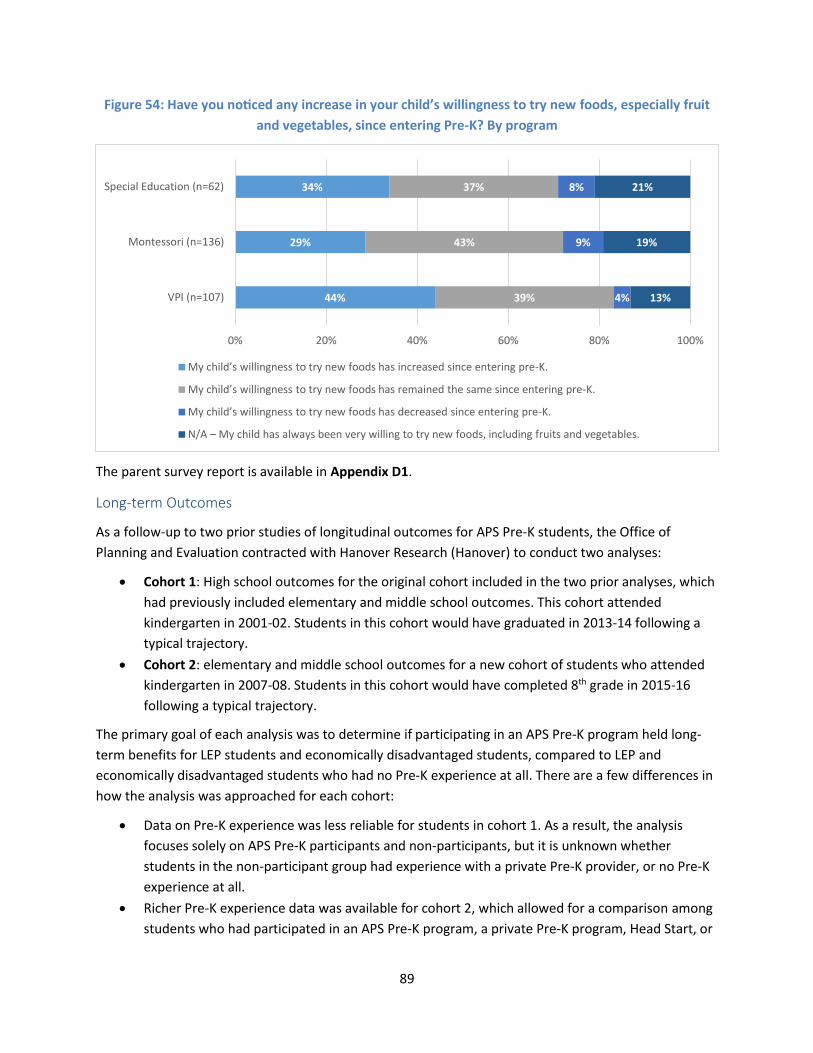
89
Figure 54: Have you noticed any increase in your child’s willingness to try new foods, especially fruit
and vegetables, since entering Pre-K? By program
The parent survey report is available in Appendix D1.
Long-term Outcomes
As a follow-up to two prior studies of longitudinal outcomes for APS Pre-K students, the Office of
Planning and Evaluation contracted with Hanover Research (Hanover) to conduct two analyses:
Cohort 1: High school outcomes for the original cohort included in the two prior analyses, which
had previously included elementary and middle school outcomes. This cohort attended
kindergarten in 2001-02. Students in this cohort would have graduated in 2013-14 following a
typical trajectory.
Cohort 2: elementary and middle school outcomes for a new cohort of students who attended
kindergarten in 2007-08. Students in this cohort would have completed 8th grade in 2015-16
following a typical trajectory.
The primary goal of each analysis was to determine if participating in an APS Pre-K program held long-
term benefits for LEP students and economically disadvantaged students, compared to LEP and
economically disadvantaged students who had no Pre-K experience at all. There are a few differences in
how the analysis was approached for each cohort:
Data on Pre-K experience was less reliable for students in cohort 1. As a result, the analysis
focuses solely on APS Pre-K participants and non-participants, but it is unknown whether
students in the non-participant group had experience with a private Pre-K provider, or no Pre-K
experience at all.
Richer Pre-K experience data was available for cohort 2, which allowed for a comparison among
students who had participated in an APS Pre-K program, a private Pre-K program, Head Start, or
44%
29%
34%
39%
43%
37%
4%
9%
8%
13%
19%
21%
0% 20% 40% 60% 80% 100%
VPI (n=107)
Montessori (n=136)
Special Education (n=62)
My child’s willingness to try new foods has increased since entering pre-K.
My child’s willingness to try new foods has remained the same since entering pre-K.
My child’s willingness to try new foods has decreased since entering pre-K.
N/A – My child has always been very willing to try new foods, including fruits and vegetables.

90
an “other” Pre-K program such as the APS Peer Model program. There were limitations to the
Pre-K experience data for this cohort for special education categories, so the cohort 2 analysis
excludes students with special education Pre-K experience categories from the analysis.
Summary of Findings for Cohort 1
Longitudinal outcomes for economically disadvantaged and LEP students who participated in an
APS Pre-K program in 2000-01 consistently show advantages in comparison to economically
disadvantaged and LEP students who did not participate in an APS Pre-K program.
SOLs
Economically disadvantaged students: APS Pre-K participating students on average perform
better than their non-participating peers. For all four high school grades, participants
outperform non-participants in nine assessments, while non-participants do better on six
assessments.
LEP students: LEP participants of Pre-K APS programs do even better relative to their peers than
economically disadvantaged students. In this subsample, participants receive higher SOL scale
scores on average for 12 assessments across four grades. Conversely, non-participants
outperform them on only three occasions.
GPA
Economically disadvantaged students: Participants consistently outperform their non-
participating economically disadvantaged peers. The gap between two groups ranges from 0.13
points to 0.28 points.
LEP students: While LEP students earn lower GPAs than the overall cohort, LEP students who
attended APS Pre-K programs outperform those who did not.
AP/IB Participation
Economically disadvantaged students: Participants take more AP/IB classes than their peers
who did not attend an APS Pre-K program in Grade 9-12.
LEP students: LEP students who participated in APS Pre-K programs take more AP/IB classes in
Grades 10-12 than their LEP non-participant peers.
Attendance
Economically disadvantaged students: Economically disadvantaged students who participated
in APS Pre-K had higher attendance rates than their peers. The difference is more pronounced in
this subsample, reaching roughly 2 percentage points in Grade 10.
LEP students: LEP students had higher attendance if they participated in the APS Pre-K
programs, relative to those who did not.
On-time Graduation and Post-Graduation Plans
On Time Graduation: All APS Pre-K participants graduated on time, while 2.1 percent of non-
participants did not graduate on time in the overall sample. This holds true for ED and LEP

91
samples, but 5.6 and 4.8 percent of non-participants did not graduate on time in these
subgroups, respectively.
Post-Graduation plans: APS Pre-K participants are more likely to choose a four-year college as
their post-graduation plan than non-participants across all three samples.
Summary of Findings for Cohort 2
Longitudinal outcomes for economically disadvantaged and LEP students who participated in an
APS Pre-K program in 2006-07 show mixed results, with participants outperforming their peers who
had no formal Pre-K experience on some measures but not all.
PALS
Economically disadvantaged students: Those who participated in the APS Pre-K programs
perform better in Kindergarten fall semester and fall of Grade 1, while falling behind in the
spring semester of Grade 1. This pattern is present in both mean scores and percentage of
students who performed below benchmark in both fall and spring semesters. For instance, in
the fall semester of Kindergarten, only 16% of participants perform below benchmark,
compared to 47% of students with no Pre-K experience. In comparison, in Grade 2 spring
semester, 19% of participants do not reach the benchmark level, while only 15% of students
with no Pre-K experience fail to reach this level. It appears that the APS Pre-K cohort has not
improved in terms of reaching the benchmark level over the course of three years, while their
peers have.
LEP students: Similar to economically disadvantaged students, APS Pre-K program participants
perform better on the PALS assessment in terms of mean scores relative to those with no Pre-K
experience in Kindergarten and Grade 1. However, the gap shrinks as students progress through
the grades. For instance, APS Pre-K participants are less likely to perform below benchmark by
27 percentage points relative to students with no Pre-K experience when they are in the fall
semester of Kindergarten, but they are less likely to do so by only 7 percentage points when
they are in the spring semester of Grade 1.
Degrees of Reading Power (DRP)
Economically disadvantaged students: APS Pre-K participants and those with no Pre-K
experience perform similarly.
LEP students: LEP students who participated in any of the APS Pre-K programs consistently
outperform their peers in Head Start, but underperform in comparison to LEP students in other
groups, including those with no Pre-K experience. The difference in mean DRP scores are more
pronounced for this sample compared to the economically disadvantaged sample.
SOLs
Economically disadvantaged students: There is no consistent pattern comparing APS Pre-K
participants to students with no Pre-K experience.
92
LEP students: There is no consistent pattern comparing APS Pre-K participants to students with
no Pre-K experience.
GPA
Economically disadvantaged students: Economically disadvantaged students who participated
in the APS Pre-K programs outperform their peers without Pre-K experience and those in Head
Start in Grades 6 and 7. However, by Grade 8, those with no Pre-K experience catch up with and
ultimately pass them.
LEP students: APS Pre-K participants consistently earn higher GPAs than their peers in Head
Start and students without Pre-K experience.
Participation in Advanced Math
Economically disadvantaged students: Economically disadvantaged students who participated
in APS Pre-K programs were more likely to enroll in an advanced math class than their
disadvantaged peers who had no Pre-K experience, and this gap increased from three
percentage points in 6th grade to 18 percentage points in 8th grade.
LEP students: LEP APS Pre-K participants were more likely to enroll in an advanced math class in
7th and 8th grade than their LEP peers who had no Pre-K experience. The gap was 15 percentage
points in 8th grade.
Attendance
Economically disadvantaged students: APS Pre-K participants are more likely to have high
attendance rates than other groups in Grades 1, 3, and 6-8.
LEP students: Trends in attendance rates by Pre-K program type are not particularly consistent,
with no group displaying a consistent advantage in attendance over the full range of grade
levels.
The full Hanover report on longitudinal outcomes is available in Appendix F5.
93
SECTION 3: SUMMARY OF FINDINGS
Instruction and Student Outcomes 1. The APS Early Childhood Program is committed to increasing access to Pre-K programs for Arlington
families, with a particular focus on those who would otherwise not have access to Pre-K; this
includes families of lesser financial means and/or limited English proficiency. Student academic
outcomes indicate that APS Pre-K programs make a positive difference for participating students in
comparison to students with no Pre-K experience. This pattern is strong in fall kindergarten
outcomes, while less clear long-term.
PALS PreK scores indicate a high level of growth in the Pre-K year, and fall PALS-K scores show a strong
advantage for students who had participated in all APS Pre-K programs in comparison to students who had
attended no formal Pre-K program. Both of these measures see a greater impact of Pre-K for LEP and
economically disadvantaged students.
Likewise, the Pre-K math assessment shows strong growth from fall to spring, and the kindergarten math
assessment shows an advantage for APS Pre-K participants in comparison to those who had no formal Pre-
K experience. Similar to literacy measures, the data suggests a greater impact for LEP and economically
disadvantaged students.
Short-term outcomes for students who participate in the special education Pre-K program tend to fall into
lower ranges than for those who participate in VPI or Montessori, although this is not always true:
While high, growth in DMA levels and PALS PreK developmental ranges from fall to spring was less
pronounced for students in the special education program than for VPI students.
In 2015-16, students who had attended an APS special education Pre-K program were just as likely
as VPI, Montessori, or private preschool students to meet the fall K-PALS benchmark.
Students who had attended an APS special education Pre-K program had a higher average score on
the fall kindergarten math assessment than VPI students, and a lower average score than Montessori
students.
Long-term outcomes are less clear. In a report that included longitudinal analyses of two APS kindergarten
cohorts, Hanover Research found a pattern of consistently positive outcomes for the earlier cohort of
students through 12th grade, suggesting that participating in an APS Pre-K program had had a positive
impact on the success of LEP and economically disadvantaged students. Results for the more recent cohort
were less conclusive.
2. Four-year-old students across programs show growth in social-emotional indicators from fall to
spring.
Students in the VPI program appear to make greater gains in social-emotional outcomes from fall to spring
than four-year-olds in Montessori or special education. The primary Montessori program is a three-year
continuum and thus students may make these gains in their third year.
94
In all programs, Self-Concept and Social Problem Solving had the lowest percentage of students rated as
meeting in the spring, and in the special education program, the area of Self-Control was relatively lower
as well. Parents from all programs expressed satisfaction with their child’s growth in personal/social skills
during the school year.
Generally, the percentage of students in the special education program rated as meeting various social-
emotional indicators increased from fall to spring at a lower rate than those in the VPI and Montessori
programs.
3. Classroom observations indicate a strong level of emotional support and classroom organization,
while also pointing to areas of focus for future professional development.
CLASS observations across programs show a high level of emotional support and classroom organization,
while instructional support scores fall into the low-mid range. Regard for Student Perspectives appears to
be particularly strong in Montessori classrooms.
Montessori observations found that implementation of Montessori practices fell within a range of high
developing to low effective. The strongest dimension was Respectful Interactions with Children. The
Montessori observer noted with concern that many teachers did not give specific lessons, instead
monitoring the room, stopping to assist children as needed.
4. Collaboration among teachers occurs most frequently among teachers at the same school and
among teachers within the same program.
The most frequently occurring type of collaboration between Pre-K teaches and specials teachers (art,
music, and PE) is sharing ideas. Other types of collaboration – co-teaching, co-planning, and team
meetings – generally occurred at much lower rates, and Montessori teachers were the least likely to report
frequent collaboration with specials teachers in any category, with just 0-8% for any category.
Within Pre-K programs, teachers were far more likely to report that they collaborated frequently with
teachers in their program who were at their school, rather than at other schools. Frequent collaboration
with teachers from other schools was reported by between 0-7% of teachers. All three groups of teachers
indicated that their most frequent type of collaboration with their school-based peers were team meetings
and sharing ideas. Special education teachers were the most likely to report that they frequently co-teach
with other teachers in their program at their school.
Survey responses from all teacher groups indicate that special education teachers are far more likely to
collaborate with VPI teachers than with primary Montessori teachers.
95
Meeting the Needs of the Whole Child 5. APS Pre-K programs provide a variety of social-emotional/behavioral and practical/social supports to
students and families. Feedback from staff indicates some possible areas for expansion of supports.
Staff across programs generally feel that APS Pre-K students and their families receive the social-
emotional/behavioral and practical/social supports they need. Many staff suggested that additional
support could be provided by means of parent meetings and workshops, and counseling and social worker
services for students. Special education teachers suggested home visits and counseling services for
parents.
6. While parents are generally satisfied with their child’s specials teachers, specials teachers vary by
program area in their level of confidence in providing developmentally appropriate instruction to
Pre-K students.
Among specials teachers, PE teachers were most likely to feel confident in their ability to provide
developmentally appropriate instruction to Pre-K students, though open-ended responses show they are
also the most likely to feel they receive no support in their instruction for Pre-K students. Montessori and
VPI parents generally expressed a high level of satisfaction with their child’s specials teachers, particularly
parents of VPI students. Montessori parents’ lower satisfaction ratings seem to be less of an indication of
dissatisfaction than lack of familiarity.
Community and Parent Engagement 7. Feedback from parents indicates that the Early Childhood Program is doing a good job engaging
parents across demographic groups.
Most students served by the VPI program are LEP and qualify for free or reduced-price meals. The reverse
is true for the Montessori program. The percentage of primary Montessori students who qualify for free or
reduced price meals has decreased by 14 percentage points in the last five years, and was 35% in 2015-16.
Survey responses indicate that parents feel that APS does a good job of keeping them informed of their
child’s progress and of opportunities to be involved in their child’s education. Parents also reported that
they feel comfortable interacting with staff at their child’s school. Differences among demographic groups
were minor; where there were differences, the satisfaction level tended to be higher among groups that
might be considered to be at a disadvantage, such as those who speak a language other than English or
those with lower levels of education.
96
Survey responses and data collection from teachers both indicate that most parents participate in a school-
based activity such as conferences, field trips, or classroom events. Those with higher incomes and higher
levels of education were the most likely to have volunteered in the classroom.
8. While most parents find the Pre-K application and registration process to be easy, feedback from
parents and staff suggests some areas for improvement, though there was contradictory feedback
about the benefits of centralized registration.
Most parents find the Pre-K application and registration process to be easy, and this is generally true
across demographic factors such as home language, education level, and household income. The two most
commonly recommended improvements frequently went hand in hand: Allow parents to apply and
register online and centralize the application process. Staff responses about the registration process were
more varied. Among staff, there was little agreement on whether school-based or centralized registration
is preferable.
Resources 9. Per-student staffing costs are higher for VPI than for Montessori, even while the average salary and
benefit cost for primary Montessori teachers is higher than for VPI teachers.
Due to slightly higher average salary and benefits costs for VPI assistants and lower student-staff ratios,
per-pupil staffing costs are higher for VPI ($8,702) than for primary Montessori ($7,331). At the same time,
average salary and benefits costs for primary Montessori teachers are higher than for VPI teachers. Startup
costs at the individual classroom level, including furniture and instructional material purchases, are
considerably higher for the primary Montessori program than for VPI.
10. The primary Montessori fee schedule appears to have a disproportionate impact on some families.
Tuition fees required for the primary Montessori program vary widely by household income level and
make up a greater percentage of a family’s income at the middle income levels than at higher income
levels.
11. All VPI and primary Montessori teachers meet criteria to be considered highly qualified.
Administrators involved in recruitment generally have an easier time hiring VPI teachers than
primary Montessori or special education Pre-K teachers.
All teachers in the VPI and primary Montessori programs hold one or more endorsement related
specifically to early childhood education. Primary Montessori teachers had an average of 20.6 years of
teaching experience, compared to 14.4 years for VPI teachers. Most administrators find the process of
recruiting and hiring VPI teachers to be easy, while most find the process of hiring primary Montessori
teachers to be difficult. Administrators are more split on the ease or difficulty of hiring special education
97
Pre-K teachers. The primary difficulty cited in recruiting and hiring both primary Montessori and special
education Pre-K teachers is the limited number of applicants with the necessary credentials and
experience.
12. VPI teachers have a higher level of satisfaction with services and resources provided by the Early
Childhood Office.
VPI teachers were the most likely to express satisfaction with support from the Early Childhood Office in
any area: resources, advocacy, communication, professional development, and curriculum. They were also
far more likely than Montessori teachers to report that professional development offered by the Early
Childhood Office was relevant to their work, and that they frequently apply what they learn in professional
development offered by the Early Childhood Office.
98
SECTION 4: FINDINGS AND ACTIONS
Primary Montessori Program
Finding #1: As the planning process to move the countywide elementary Montessori program from Drew Model School to a new location begins,
several findings from this evaluation point to opportunities for possible restructuring:
There are some key differences between the countywide and satellite programs:
o Observations suggest that the centralized site is more likely than satellite sites to use Montessori materials without
supplementing with non-Montessori materials.
o Kindergarten discontinuation occurs at a greater rate at the satellite sites than at Drew.
Kindergarten discontinuation appears to be more about convenience than dissatisfaction.
Families in the middle range of household income pay a larger percentage of their income in Montessori fees than those in the highest
range.
Primary Montessori programs appear to be under-enrolled, with an average class size of 21.5 and a maximum class size of 23.
There has been a decrease in the past three years in the percentage of primary Montessori students who meet eligibility requirements
for free or reduced-price meals.
Administrators report that recruitment and hiring of primary Montessori teachers is difficult.
Recommendation #1: Review and recommend changes to the structure and delivery of APS primary Montessori options in the context of
capacity and crowding decisions.
STAFF RESPONSE:
Staff has developed the following plan to address the findings and implement the recommendations of the Early Childhood program evaluation.
If any policy changes and/or budget requests are necessary during this process, staff will present them during the budget process or policy
review process as appropriate.
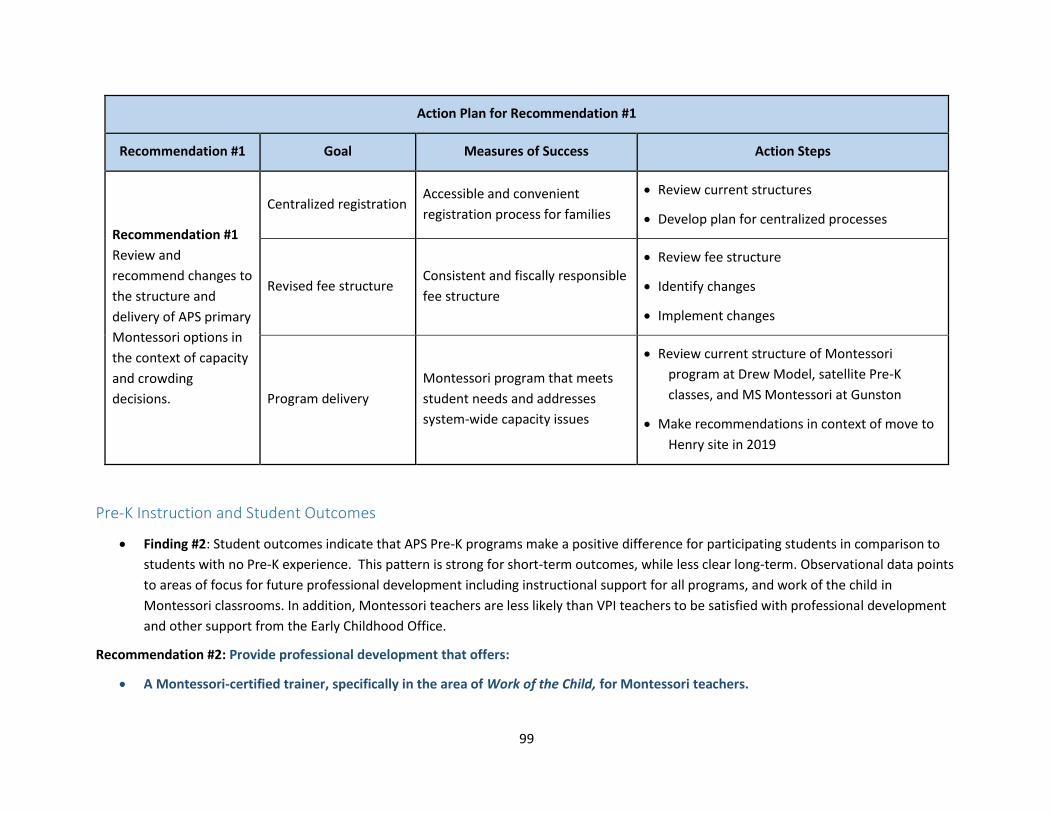
99
Action Plan for Recommendation #1
Recommendation #1 Goal Measures of Success Action Steps
Recommendation #1
Review and
recommend changes to
the structure and
delivery of APS primary
Montessori options in
the context of capacity
and crowding
decisions.
Centralized registration Accessible and convenient
registration process for families
Review current structures
Develop plan for centralized processes
Revised fee structure Consistent and fiscally responsible
fee structure
Review fee structure
Identify changes
Implement changes
Program delivery
Montessori program that meets
student needs and addresses
system-wide capacity issues
Review current structure of Montessori
program at Drew Model, satellite Pre-K
classes, and MS Montessori at Gunston
Make recommendations in context of move to
Henry site in 2019
Pre-K Instruction and Student Outcomes
Finding #2: Student outcomes indicate that APS Pre-K programs make a positive difference for participating students in comparison to
students with no Pre-K experience. This pattern is strong for short-term outcomes, while less clear long-term. Observational data points
to areas of focus for future professional development including instructional support for all programs, and work of the child in
Montessori classrooms. In addition, Montessori teachers are less likely than VPI teachers to be satisfied with professional development
and other support from the Early Childhood Office.
Recommendation #2: Provide professional development that offers:
A Montessori-certified trainer, specifically in the area of Work of the Child, for Montessori teachers.

100
More opportunities for the development of professional learning communities among Montessori staff and more support for
collaborative walks and observation.
Training for all Pre-K staff on factors essential to strong instructional support, including quality of feedback, language modeling, and
most importantly, concept development.
STAFF RESPONSE:
Staff has developed the following plan to address the findings and implement the recommendations of the Early Childhood Program Evaluation.
If any policy changes and/or budget requests are necessary during this process, staff will present them during the budget process or policy
review process as appropriate.
Action Plan for Recommendation #2
Recommendation #2 Goal Measures of Success Action Steps
Recommendation #
Provide professional
development targeted
to the findings
Pre-K teachers will be
provided targeted
professional learning to
improve instruction.
All Montessori teachers trained in
Work of the Child
Provide Montessori teachers with a Montessori-
certified trainer specifically in the area of Work
of the Child
Eliminate discrepancy between
the countywide and satellite sites
Provide more opportunities for the development
of professional learning communities among
Montessori staff and support collaborative walks
and observation
Provide training for VPI and special education
Pre-K staff on factors essential to strong
instructional support, including quality of
feedback, language modeling, and most
importantly, concept development.

101
Special Education
Finding #3: Outcomes for students who participate in the special education Pre-K program tend to fall into lower ranges than for those who
participate in VPI or Montessori, although this is not always true:
While high, growth in DMA levels and PALS PreK developmental ranges from fall to spring was less pronounced for students in the special
education program than for VPI students.
In 2015-16, students who had attended an APS special education Pre-K program were just as likely as VPI, Montessori, or private
preschool students to meet the fall K-PALS benchmark.
Students who had attended an APS special education Pre-K program had a higher average score on the fall kindergarten math
assessment than VPI students, and a lower average score than Montessori students.
Generally, the percentage of students in the special education program rated as meeting various social-emotional indicators increased
from fall to spring at a lower rate than those in the VPI and Montessori programs.
Special education teachers appear to collaborate frequently with VPI teachers and less frequently with primary Montessori teachers.
Recommendation #3: Continue efforts to increase inclusive practices in APS Pre-K programs through:
Continued collaboration between the Office of Early Childhood and the Office of Special Education
Continued strategic placement efforts for students in the special education program
Continued opportunities for joint professional development with Special Education Pre-K, VPI and Montessori staff
STAFF RESPONSE:
Staff has developed the following plan to address the findings and implement the recommendations of the Early Childhood Program Evaluation.
If any policy changes and/or budget requests are necessary during this process, staff will present them during the budget process or policy
review process as appropriate.
Action Plan for Recommendation #3
Recommendation #3 Goal Measures of Success Action Steps
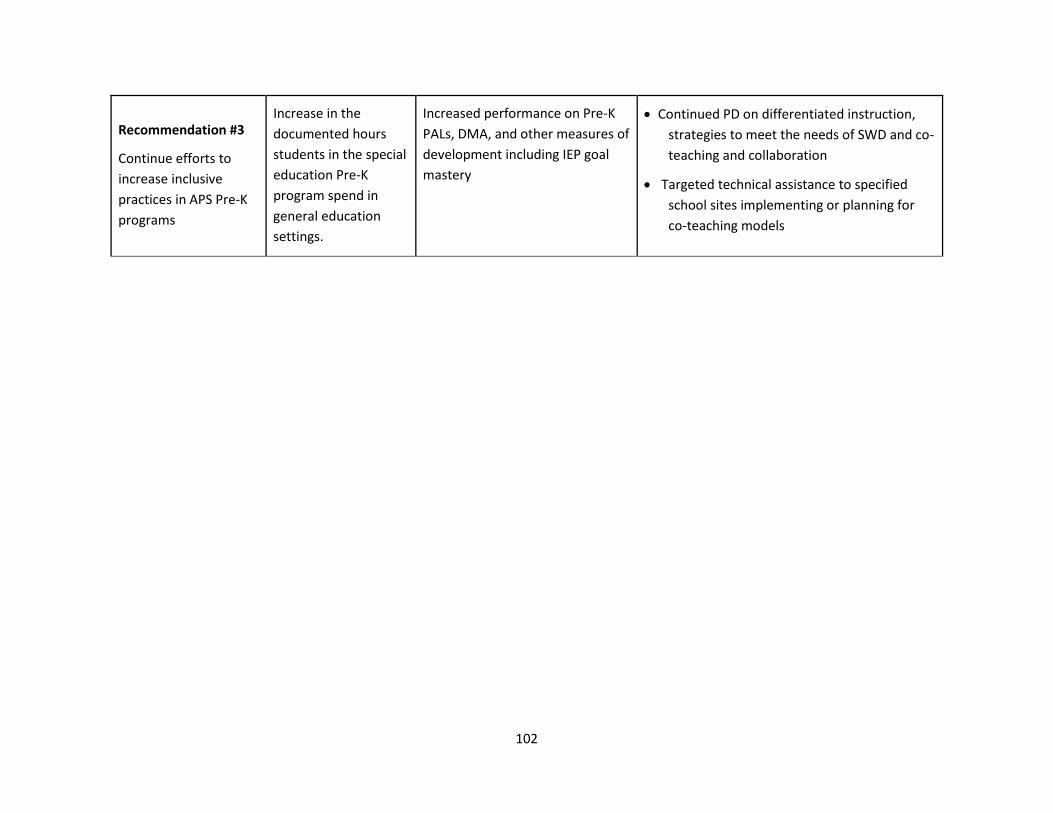
102
Recommendation #3
Continue efforts to
increase inclusive
practices in APS Pre-K
programs
Increase in the
documented hours
students in the special
education Pre-K
program spend in
general education
settings.
Increased performance on Pre-K
PALs, DMA, and other measures of
development including IEP goal
mastery
Continued PD on differentiated instruction,
strategies to meet the needs of SWD and co-
teaching and collaboration
Targeted technical assistance to specified
school sites implementing or planning for
co-teaching models