Embed Size (px)
Citation preview
FOOD CONSUMPTION AND NUTRITION DIVISION January 2006
FCND Discussion Paper 203
Early Childhood Nutrition, Schooling, and Sibling Inequality in a Dynamic Context: Evidence from South Africa
Futoshi Yamauchi
2033 K Street, NW, Washington, DC 20006-1002 USA • Tel.: +1-202-862-5600 • Fax: +1-202-467-4439 • [email protected] www.ifpri.org
IFPRI Division Discussion Papers contain preliminary material and research results. They have not been subject to formal external reviews managed by IFPRI’s Publications Review Committee, but have been reviewed by at least one internal or external researcher. They are circulated in order to stimulate discussion and critical comment.
Copyright 2006, International Food Policy Research Institute. All rights reserved. Sections of this material may be reproduced for personal and not-for-profit use without the express written permission of but with acknowledgment to IFPRI. To reproduce the material contained herein for profit or commercial use requires express written permission. To obtain permission, contact the Communications Division at [email protected].
ii
Abstract
This paper examines the effects of early childhood nutrition on schooling inputs
and outcomes to assess the dynamic nature of human capital production, using panel data
from South Africa. Height-for-age Z-score is used as a measure of health and nutritional
status in early childhood. Based on a comparison of siblings, this analysis concludes that
improving children’s health significantly lowers the age when they start school, increases
grade attainment, and decreases grade repetition in the early stage of schooling.
However, this positive effect diminishes at later stages. The results also show that
households allocate more of their resources (such as school fee expenditure) to healthy
children at the early stage, although wealthier households may invest more in less well
endowed children in an attempt to reduce sibling inequality. However, fewer resources
are allocated to healthy children at later stages. By the time of transition from primary to
secondary school, the healthy child can increase household income by seeking
employment in the labor market. In other words, while health capital augments the
efficiency of investment in schooling at the early stage, it may increase opportunity costs
at the later stage, which may deter investment in schooling.
Key words: early childhood nutrition, health capital, height-for-age, schooling investments and outcomes, South Africa

iii
Contents
Acknowledgments............................................................................................................... v 1. Motivations .................................................................................................................... 1 2. A Simple Model............................................................................................................. 5 3. Empirical Framework .................................................................................................. 10 4. Data .............................................................................................................................. 12 5. Outcomes at the Early Stage of Schooling ................................................................... 17
Age Started School ............................................................................................... 17 Grade Completed .................................................................................................. 18 Grade Repetition ................................................................................................... 19 School Fee Expenditure ........................................................................................ 20 Learning Outcomes............................................................................................... 22
6. Outcomes at the Later Stage of Schooling................................................................... 24 7. Conclusions................................................................................................................... 28 References......................................................................................................................... 29
Tables
1 Descriptive statistics: Schooling............................................................................. 14 2 Descriptive statistics: Math results ......................................................................... 15 3 Attritions .................................................................................................................. 16 4 Age started school.................................................................................................... 17 5 Grade completed ...................................................................................................... 19 6 Grade repetition ....................................................................................................... 20 7 School fee expenditure 1998.................................................................................... 22

iv
8a Mathematics test results: Probit with cluster fixed effects ...................................... 23 8b Mathematics test results: Linear probability with household fixed effects ............. 23 9 Age started school—1993 sample ........................................................................... 25 10 Grade completed and repeated—1993 sample ........................................................ 26 11 School fee expenditure—1993 sample .................................................................... 27
Figures
1a Distributions of height-for-age Z-score in 1998 ...................................................... 13 1b Distributions of height-for-age Z-score in 1993 ...................................................... 13 2 School fee distribution ............................................................................................. 14

v
Acknowledgments
I thank Michelle Adato, Daniel Gilligan, John Hoddinott, John Maluccio, Julian
May, and seminar participants at the International Food Policy Research Institute (IFPRI)
for comments. The work reported here is the outcome of a collaborative project between
researchers at IFPRI, the University of KwaZulu-Natal, the University of Wisconsin,
London School of Hygiene and Tropical Medicine, the Norwegian Institute of Urban and
Regional Studies, and the South African Department of Social Development. In addition
to support from these institutions, financial support was received from the Department for
International Development - South Africa (DfID-SA), the United States Agency for
International Development (USAID), the Mellon Foundation, and the National Research
Foundation/Norwegian Research Council grant to the University of KwaZulu-Natal. I
am grateful to the Government of Japan for financial support. Any remaining
shortcomings are mine.
Futoshi Yamauchi International Food Policy Research Institute

1
1. Motivations
Human capital takes a long time to accumulate, going through multiple phases
from early childhood through higher education. While nutritional intake in early
childhood forms the basis of a child’s health capital, which provides a foundation for
subsequent child development,1 investments in schooling augment the child’s knowledge
capital, which is directly rewarded in advanced labor markets and technologies. In this
paper, we examine the effects of nutritional status and health capital in early childhood
on schooling investments and outcomes, using recently available panel data from South
Africa.
The dynamic process of human capital development creates the possibility that
investments in early childhood will influence the optimal amount and effectiveness of
investments at later stages (Cunha et al. 2004). Some recent studies attempt to identify
the causality from early-childhood nutritional status to schooling outcomes (see, for
example, Alderman, Hoddinott, and Kinsey 2002; Glewwe, Jacoby, and King 2001). In
general, the way that early-stage human capital investments determine the subsequent
path of human capital accumulation and future income depends on (1) whether
investments in different stages are mutual complements or substitutes, and (2) the extent
to which early investments and outcomes alter the environment, information, and
preferences of children and parents that affect investment decisions at later stages.
To answer the question of whether early investments in children affect future
outcomes requires a good understanding of rather complex interactions of market forces
and dynamic household behavior. First, health capital, as well as schooling investments,
generates positive economic returns, especially in the developing-country context
(Strauss 1986; Haddad and Bouis 1991; Thomas and Strauss 1997). Therefore, health
1 For comprehensive discussion of the problem of child malnutrition in economic development, see Behrman, Alderman, and Hoddinott (2004).
2
capital may increase opportunity costs for schooling investments,2 and it may affect
intertemporal decisionmaking, creating nonlinearity in the effect of health capital on
schooling investments.
Second, there is a technical relationship between health and schooling in the
dynamic human capital production function. For example, if health capital3 is an input in
the schooling production function (for example, enabling children to attend classes every
day), whether health capital augment the productivity of schooling investments or it
substitutes for schooling inputs, it affects the optimal level of schooling investments. In
the former case, we predict a cumulative process of widening inequality among siblings,
given differences in nutritional status and health capital in early childhood, since more
knowledge capital is invested in healthy children. If parents are averse to sibling
inequality in the future earnings, they will make more schooling investment in unhealthy
children.
Third, parents also learn about potential returns to schooling investments from
outcomes of early-stage investments (in nutritional status and health in our context) and
make decisions regarding optimal investments at later stages. In these decisions, parents’
preferences concerning sibling inequality in human capital and future income matter. If
parents are averse to the inequality among their children, they may increase investments
in schooling of their less well-endowed children to equalize future incomes among their
children (Quisumbing, Estudillo, and Otsuka 2003). In the context of dynamic human
capital production, since outcomes of early-childhood investments signal the expected
outcomes of investment at a later stage, parents can react to those signals by changing
late-stage investments to maximize their objective.
2 For example, with a relatively small sample of 367 adult workers (age above 20) in the KwaZulu-Natal Income Dynamics Study 1998, returns to height (measured in centimeters) are estimated as 0.0093 (t-value: 2.04) in the log-wage equation. Returns to schooling (in years) are 0.1055 (t-value: 8.26). The specification includes age, male dummy, and community fixed effects. Robust standard errors are used with community-level clusters. 3 Health capital is part of human capital, measuring physical development and conditions in children (height, weight, and if the child is sick or well), but not including endowment such as in-born differences in intelligence.
3
To empirically assess this issue, we encounter a few challenging problems even
with longitudinal data of children. The first problem arises from potential endogeneity of
nutritional status, such as fixed household-specific unobserved factors that affect both
child health capital and schooling decisions, creating a positive correlation between them.
To eliminate this problem, our approach requires household fixed effects, which base
inferences on (often small) sibling variations.4 5
The next section describes the model. Human capital accumulation is modeled as
a sequential process in which health is formed at an early stage and schooling investment
is undertaken given the health outcomes. Both health and knowledge (education) capital
determine earnings in the labor market. Section 3 discusses econometric issues, focusing
on specification and identification strategy.
Data and variables are described in Section 4. To measure schooling outcomes,
we use the 2004 KwaZulu-Natal Income Dynamics Study (Round 3), which collected
individual-level information such as enrollment, age schooling started, grade completed,
grades repeated, and expenditures from children aged 7 to 20. To supplement the main
analysis, the survey also used the results of simple mathematics tests given to children
4 The literature offers a few qualified empirical studies, which solve the above problems. Using longitudinal data for children from Zimbabwe, Alderman, Hoddinott, and Kinsey (2002) use civil war and drought periods that affected growth in children below three years to identify the effect of early childhood malnutrition on schooling in a maternal fixed effect model. This identification strategy is based on findings that income shocks, such as drought and flood, in credit constrained circumstances, change consumption, which affects child growth (Hoddinott and Kinsey 2001; Foster 1995). Glewwe, Jacoby, and King (2001) take a similar approach to sibling estimation, using longitudinal data of Filipino children, but their identification strategy uses a rather strong assumption on height changes among older and younger siblings. Alderman et al. (2000) use price data, interacted with parents’ education and child gender, as instruments for child height growth in Pakistan. 5 An earlier version uses the unique period in South Africa from the end of apartheid to the beginning of a democratic regime in the province of KwaZulu Natal. The country introduced the first democratic election in 1994, but the implementation of the local election was delayed one year in KwaZulu-Natal due to violent political conflicts and social turmoil. This period is also the start of widening economic and political opportunities for African populations, who were neglected during apartheid. These transitions seem to have exogenously affected the welfare of sample households, though the magnitude and direction of the changes depend on the community in which they resided as well as their initial income level. The sample of children in the longitudinal data from the province of KwaZulu Natal include children below the age of three in 1994 and 1995, whose physical growth is regarded as sensitive to nutrition intakes. However, it is shown that the instruments constructed are not statistically effective enough to correct for individual bias.

4
age 7 to 9 to measure their learning performance. Therefore, combined with the
information on nutrition and health outcomes for children ages 1 to 5 available in the
1998 survey, we can investigate the effect of early childhood nutrition on schooling
investments and outcomes of children 6 years and above. One advantage of focusing on
early stages of schooling is the high enrollment rate at the primary school level, which
minimizes a selectivity problem arising from child time allocation decisions at later
stages of schooling.
Section 5 summarizes empirical results. First, data for siblings showing the
effects of nutrition (as indicated by height) on the age schooling started and the grade
completed show that for the majority, children of normal height (as measured by height-
for-age Z-score) start school earlier, complete more grades, and repeat fewer grades. The
analysis also identifies some outlying observations among taller children (less than 5
percent of the sample) that show a negative effect of the height Z-score on schooling
outcomes. In the analysis with longer panel data (11 years), we find that, although better
nutrition and health status in early childhood improves primary school outcomes, this
positive effect diminishes as the child moves from primary to secondary school.
Second, the analysis on mathematics test results, using the sample of children age
7 to 9, shows that health capital, measured by height at early childhood, has a
significantly positive effect among children age 7, implying that early-childhood nutrition
affects learning performance at the very early stage of transition to schooling.
Comparison of naïve—ordinary least squares (OLS)—and sibling estimates also
demonstrates that some (unobserved) household factors improve both child health and
learning performance. Similarly, our results suggest that household-specific
unobservables are positively correlated with schooling investments and early childhood
health capital.
Third, the information on individual-level school fee expenditure enables us to
investigate intrahousehold resource allocation among siblings. We find that more
resources are allocated to shorter (less healthy) children in the early stage of primary
school (thus reducing inequality), but this increases inequality at later stages.

5
2. A Simple Model
This section introduces a simple model in which parents decide on how much to
invest in child health and schooling, resulting in returns to labor. For simplicity, we treat
the age distribution of children as exogenous and assume that children enter the labor
market in the final stage. Health is formed in the first stage,6 while schooling investment
is undertaken in the next stage.
In the pre-primary stage, per capita consumption determines health capital hj for
child j,
hj = f (c1, z) + εj1,
where c1 is per capita consumption in the household, z is predetermined household
characteristics such as parents’ schooling, and εj1 is an idiosyncratic health shock. For
simplicity, health capital accumulates only until age a*, when the child enters the
schooling stage. Investment component f (c1, z) is characterized by the properties:
2
1
0 and 0 or 0f fc c z∂ ∂
> ≤ ≥∂ ∂ ∂
.
For simplicity, we assume that c1 = y. Given that h is child height, c is specifically
intended to capture nutritional intake.
At the second stage, knowledge capital, kj, accumulates with schooling
investments sjt. The law of motion is given as
kj = g(sj, hj, z) + εj2,
where investment g(sj2, hj, z) has health capital as its argument. Complementarity
between schooling and health investments is captured by 6 Nutrition intakes until the age of 3 are regarded as very important in forming child health capital, measured by height-for-age Z-score. Although weight-for-age Z-score fluctuates over time (age) due to changes in nutrition intakes (that is, consumption), height-for-age Z-score is less likely to change after the age of 3. In the context of dynamic human capital production, therefore, child health is measured by the height-for-age Z-score.

6
2
0gs h∂
>∂ ∂
.7
Household budget constraint is
2 ( )[ ]i ii
c y w h T s b= + − +∑ ,
and c1 = y where w(hi) is child wage, T is time endowment for the child, b is saving and
loan, and y is exogenous household income. It is assumed that child wage increases with
health capital, that is, w′(hi) ≥ 0. It is assumed that the child cannot work at the pre-
primary stage and can work in the labor market only when he or she enters school.
Several reservations follow. First, it is assumed that income from siblings,
parents, and credit are pooled in the household budget and therefore are perfectly
substitutable. Second, to describe the income process, the model does not assume a
production function where adult and child members supply labor inputs that are not
perfectly substitutable. This framework is suitable in our empirical setting of South
Africa, where wage employment (including formal and informal jobs) is a major source
of income. Third, the model does not have leisure in the utility function, which is
imperfectly substitutable between household members (Pitt and Rosenzweig 1990).
It is also important to note that the income opportunity in the child wage w(h) is
not necessarily related to labor markets. It may also capture activities such as childcare
and self-employment in a family business.
Parents maximize the objective function,
2
1 21 1, 1
max ( ) ( , ) (1 ) | , ,i
tt i is b t i
E u c W k h r b z yβ β ε−
=
⎡ ⎤⎧ ⎫+ − +⎨ ⎬⎢ ⎥
⎩ ⎭⎣ ⎦∑ ∑ ,
7 Cunha et al. (2004) summarize some key concepts in the sequential development of child human capital. They focus on cognitive and noncognitive development. It seems that their analysis does not directly include health and nutritional status as part of human capital in child development. The exclusion of health capital from the analysis results in a framework in which they can focus on human capital production function and complementarity and substitutability of different inputs (early childhood and schooling stage). In this paper, children also work in the labor market where health capital has economic returns.

7
which captures the discounted sum of expected utilities from consumption over time and
the final-period returns from children. Assume that W (ki, hi) is strictly concave in both ki
and hi. The concavity of the wage function implies that parents have incentives to
equalize human capital among their children.8
The first order conditions at the second stage are
*2 2
2 2
( ) (1 )
( ) ( , , ) ( , )j j j j jj j
u c rg Ww h s h z E k hs k
λ β
λ β
′= = +
∂ ∂=
∂ ∂,
where λ2 denotes the Lagrange multiplier associated with the stage-2 budget constraint.
These conditions provide the schooling function k*(y, hj, z). At the first stage, the
problem is trivial, since exogenous income and shocks determine investment in health
capital. From these conditions, we define
2( , ) ( , , ) ( , ) ( )(1 ) 0j j j j j j jj j
g WF s h E s h z k h w h rs k
⎡ ⎤∂ ∂= − + =⎢ ⎥
∂ ∂⎢ ⎥⎣ ⎦.
The first term captures the expected marginal return from schooling investment, while the
second term is the opportunity cost for time spent in school. Therefore, with a perfect
loan market, the effect of health on schooling depends on
*
*2 2
( , ) ( , )or 0 or ( ) ( )j s j j k j j
jj j
s g s h W k hE w h u c
h hβ
⎡ ⎤∂ ∂′ ′≥ ≤ ⇔ ≥ ≤⎢ ⎥
∂ ∂⎢ ⎥⎣ ⎦,
where *2c is such that *
2( ) β(1 )u c r′ = + . Therefore, preference does not actually enter the
condition. In this case, parents compare returns and opportunity costs for schooling, and
child health capital can change both. Household income does not enter the condition, so
income level does not affect the optimal schooling and child health does not affect the
schooling decision.
8 Since household members have no preference for leisure, there is no income effect on labor supply.

8
If child wage does not increase with health capital (that is, w′(h) = 0), an increase
in health capital will raise the optimal level of schooling if health and knowledge capital
are complementary.
Consider the case that b = 0, where credit opportunity is closed. Given the
second-order condition, the effect of hj on sj depends on
*
22 2
( , ) ( , ) ( )or 0 or ( ) ( ( )) ( )j s j j k j jj j
j j j
s g s h W k h yE w h u c y w hh h h
λβ⎡ ⎤∂ ∂ ∂′ ′≥ ≤ ⇔ ≥ ≤ +⎢ ⎥
∂ ∂ ∂⎢ ⎥⎣ ⎦,
where
2 22
( ) ( )( ( )) 0j
y c yu c yh h
λ∂ ∂′′= <∂ ∂
.
The right-hand side captures changes in the opportunity cost and the current liquidity.
First, an increase in health capital raises the child wage, which discourages schooling
investment. Second, an increase in health capital relaxes the current budget constraint,
given that the child works to make a contribution to the household income. The
concavity of the utility function guarantees that the second term is negative, which
increases schooling investments.9
An increase in the income level decreases the marginal utility, so λ2(y). In the first
term, poverty therefore magnifies the negative effect of health capital on schooling
investment. If the absolute risk aversion measure is constant, it is easy to show that an
increase in income weakens the negative effect of health capital on child schooling.
9 An increase in child health capital improves the welfare:
[ ] [ ]2 2 2 2 2 2( ) ( ) ( ) 0ij j i j j
ij i i j j
sW W g Ww h T s E E w h w h T s E
h k s h hλ β β λ λ β
∂∂ ∂ ∂ ∂′ ′− + + − = − + >∂ ∂ ∂ ∂ ∂
⎡ ⎤⎢ ⎥⎣ ⎦
∑ ,
where the Envelope theorem was applied to the third term. Even though we cannot predict the direction of the marginal impact of changes in health capital on schooling investments, it is shown that the direct effect of an increase in health capital is welfare augmenting.
9
Interestingly, the effect of other siblings’ health capital on schooling investment
only exists when the financial market is imperfect. An improvement in other siblings’
health relaxes the budget constraint, which reduces the marginal utility λ2(y). This does
not happen when the loan market is perfect.
We have two conjectures. First, in the case of the convex return function where
the second order conditions do not hold, we expect some corner solutions, concentrating
all schooling investments in some children, leaving no investment to others. Parents can
maximize welfare by investing in some children, while ignoring the others. When health
capital is complementary to schooling investment, parents concentrate schooling
investments in well-endowed children, if the labor market wage is constant. However,
greater health capital also raises wages (thus, opportunity costs), which decreases
schooling investments. If the latter effect is sufficiently small, we expect that the
inequality in schooling between siblings will diverge.10
Second, suppose that children are born in different time periods. When the timing
(and the number) of children is exogenous, we have a substitution effect between
investment in schooling of elder siblings and investment in health of younger siblings, if
the discount factor is sufficiently large. In the case of a small discount factor, parents
may want to invest more in schooling of elder siblings, sacrificing the human capital of
younger siblings, in order to gain returns to human capital as early as possible. If elder
siblings’ time input is important (included) in child health capital production, elder
siblings can work at home to take care of younger siblings. In this case, there is a trade-
off between schooling investments in elder siblings and time input in health capital
formation of younger siblings, which again depends on the discount factor.11
10 Quisumbing, Estudillo, and Otsuka (2003) presents evidence from the rural Philippines, where boys are likely to inherit land, showing that parents invest more in schooling of daughters than sons to equalize lifetime earnings between them. In the Philippines, Schady (2003) and Yamauchi (2005) both show that the schooling return function is convex, whereas the latter contrasts this finding to the case of Thailand where schooling returns are concave. 11 Nonneutrality of birth order and sibling’s sex composition in child human capital investment is pointed out and analyzed in, for example, Rosenzweig and Wolpin (2000), Rosenzweig (1986), and Butcher and Case (1994).

10
3. Empirical Framework
To assess the effects of children’s health in their early years on schooling
decisions and outcomes at a subsequent stage, we use the following framework. The
schooling equation is
1 1 2 ( )ijt ijt a ijt ijt i j ijta
q h I a a zα β β γ μ φ ε−= + + = + + + +∑ , (1)
where i, j, and t denote household, child, and time, respectively, and qijt is schooling
inputs or outcomes, hijt−1 is health capital, which is measured by the height-for-age Z-
score (formed at t − 1), aijt is the age of the child, zijt is a set of control variables, μi is
household-specific fixed unobservables, φj is child-specific fixed unobservables, and εijt
is an error term.
First, it is important to control the heterogeneity that arises from the current ages.
For example, cumulative years of grades repeated increases (but weakly) as children
spend more time in school, that is, as their age increases. The score of the mathematical
tests also changes by age (and grade completed). In the analysis below, we assume that
age structure in the sample of children is exogenous; it is uncorrelated with shocks in
schooling decisions and outcomes, which justifies the inclusion of age fixed effects.
Second, since it is highly likely that household-specific unobservables μi are
correlated with hijt−1, ordinary least square (OLS) estimates of β1 are biased. This makes
it necessary to eliminate this component from the errors. For this purpose, we include
household fixed effects to control μi. Therefore, estimation is based on variations across
siblings in the household.
In the context of panel analysis, the inclusion of household fixed effects has
another advantage regarding the attrition bias, which may arise from endogenous
migration and mortality during the sample period. Since we only look at variations
within households, given household observations in the two rounds, we do not have to
11
control for household-level attrition problems. Individual-level attritions are investigated
in Section 4.
Third, even with household fixed effects, we still encounter a potential problem of
bias that may arise from a correlation between φj and hijt−1. To wipe out this correlation,
it is necessary to use a set of instruments that explains the variations in hijt−1 but is
uncorrelated with either φj or shocks in schooling investments and outcomes εijt.
However, the necessity depends on the magnitude of covariations in differences among
siblings in Z-score and schooling endowments.12
Finally, we can examine how parents differentiate among their children in the
quality of their investments in school fee payments. It is thought that options depend on
income level. Low-income households, most likely to be credit constrained, cannot
afford to change expenditures for different siblings. Children from those households are
likely to attend inexpensive public schools in the neighborhood. An increase in income
enables parents to differentiate between their children in school spending. In this regard,
it is interesting to see whether parents compensate for less endowed children (those with
12 The instruments used in the analysis below are influenced by a historical event specific to KwaZulu-Natal, from which our data come. Prior to 1994, under apartheid, South Africa prohibited freedom in various dimensions of social life for African and nonwhite populations. At the end of apartheid in 1994, after violent political struggles, the country held its first democratic national election, except in KwaZulu-Natal, where the African National Congress and a new political party could not agree to the election. For this reason, KwaZulu Natal had its election one year later in 1995. That year was marked by turbulence and violence in the province.
An instrument is constructed to have the value of one if children were less than 3 years old (inclusive) between the beginning of 1994 and the end of 1995. Before the age of three is regarded as the period when the child’s growth is most sensitive to nutritional intake, which reflects economic conditions. This indicator is interacted with cluster fixed effects to capture possible heterogeneity in the impacts of the 1994–95 disturbances on child growth, I(Age ≤ 3 in Year = 1994 or 95) × cluster indicators. This period also corresponds to the abolishment of apartheid, so new economic opportunities became open to the African population. Thus there may have been positive impacts as well as negative ones. In addition, to capture the heterogeneity in the impacts related to the initial income level, the indicator is also interacted with total monthly household income in 1993.
Although an F-test supports the joint significance of these instruments in explaining variations among siblings in height-for-age Z-scores, a Hausman-Wu test rejects the relevance of these instruments. We observed some differences between sibling OLS and sibling IV estimates, but the magnitude did not change the qualitative nature of our results. Therefore, we do not show sibling IV estimates here and focus on sibling OLS estimates in the following discussion.

12
lower health capital) by spending more on them, or whether they will or concentrate more
resources on better-endowed children.
4. Data
The analysis requires information from different points in time for the same
individuals. In this paper, we use data from the KwaZulu-Natal Income Dynamics Study
of 1993, 1998, and 2004. Population was self-weighted designed in the first round in
1993, based on the 1991 population census, and enumeration-based weights were
introduced in 1998). The 1993 and 1998 surveys provide information on anthropometric
measures and health outcomes of children, enabling us to construct age-standardized Z-
scores for height. The 2004 survey provides some detailed information on schooling
decisions and outcomes. Our analysis combines the nutritional status of pre-primary
aged children in 1998 and 1993 and their schooling inputs and outcomes until 2004.13
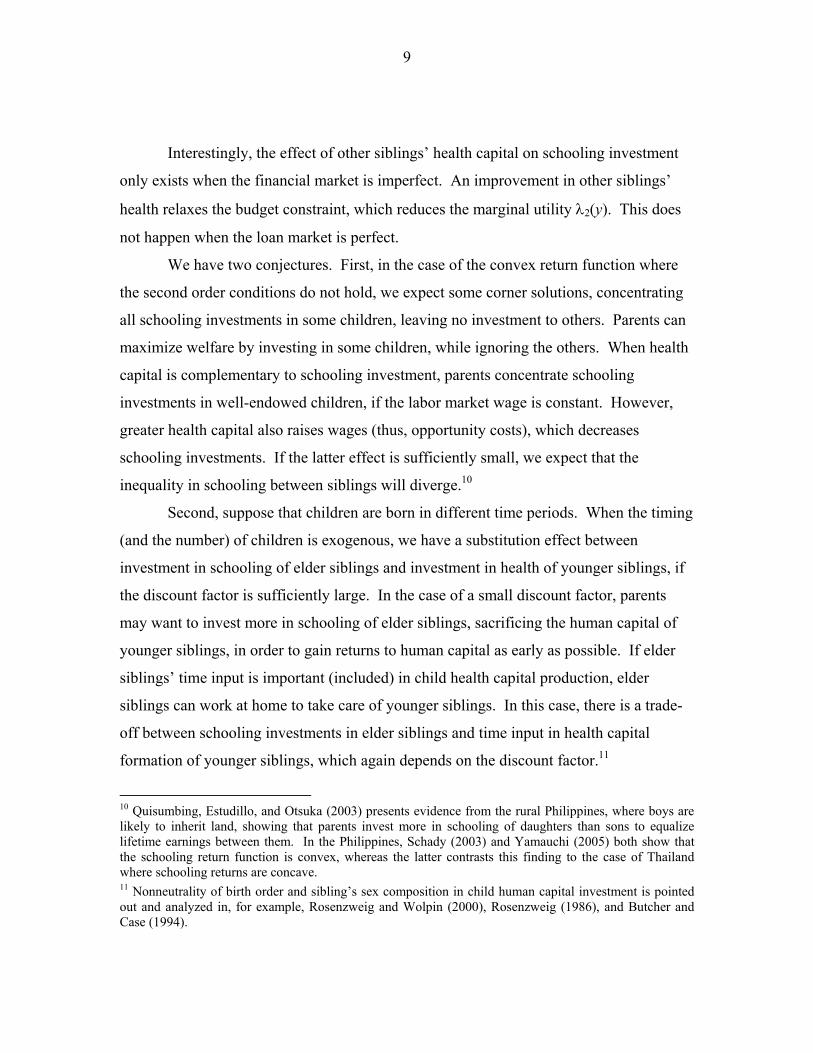
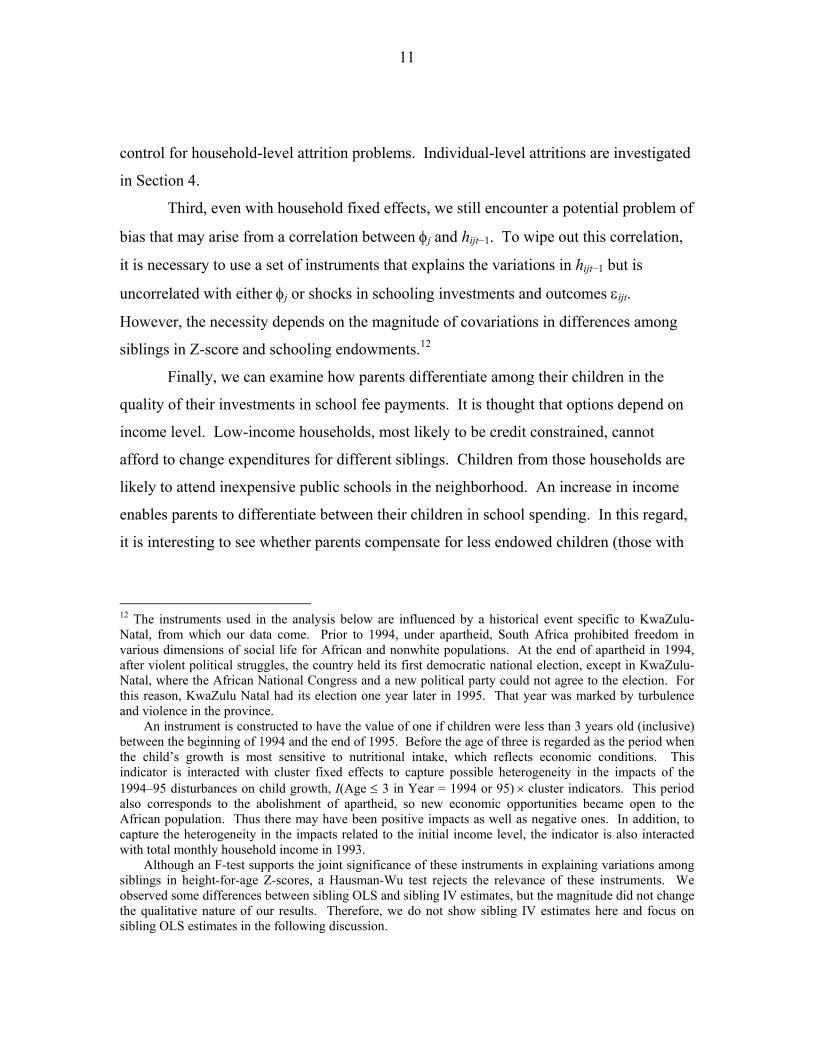
Figures 1a and 1b depict the distribution of height-for-age Z-scores by age in
1998 and 1993, respectively. Observations with inconsistent ages between 1993 or 1998
and 2004 were screened out from the sample. The sample includes those who were
enrolled in school. These figures show symmetric distributions of height Z-scores by age
group, though small samples seem to affect the smoothness of the empirical distributions.
In the main analysis, we use as schooling variables: (1) age started school,
(2) grade completed (conditional on current age), (3) the number of grades repeated,
(4) school fee expenditure, and (5) mathematics test results. For age started school, the
2004 survey asks for the calendar year in which the child started primary school. That
year, compared with the current age in 2004, tells us the age at which the child started
attending primary school.14
13 Constructing individual-level panel data from the 1998 and 2004 surveys, we have screened out observations recorded in multiple households (multiple memberships). The details of this procedure are available from the author. 14 In the main analysis, we only use observations with estimated age started school greater or equal to age 4, restricting the sample to children who were aged less than 3.
13
Figure 1a—Distributions of height-for-age Z-score in 1998
Figure 1b—Distributions of height-for-age Z-score in 1993
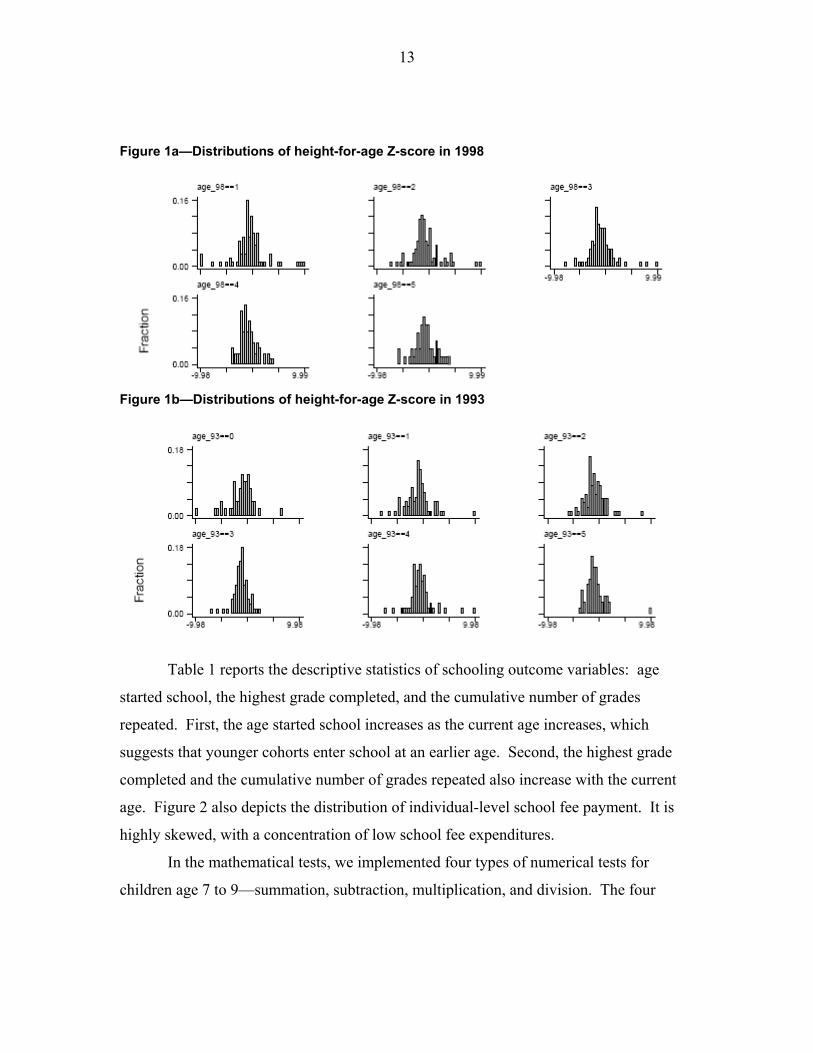
Table 1 reports the descriptive statistics of schooling outcome variables: age
started school, the highest grade completed, and the cumulative number of grades
repeated. First, the age started school increases as the current age increases, which
suggests that younger cohorts enter school at an earlier age. Second, the highest grade
completed and the cumulative number of grades repeated also increase with the current
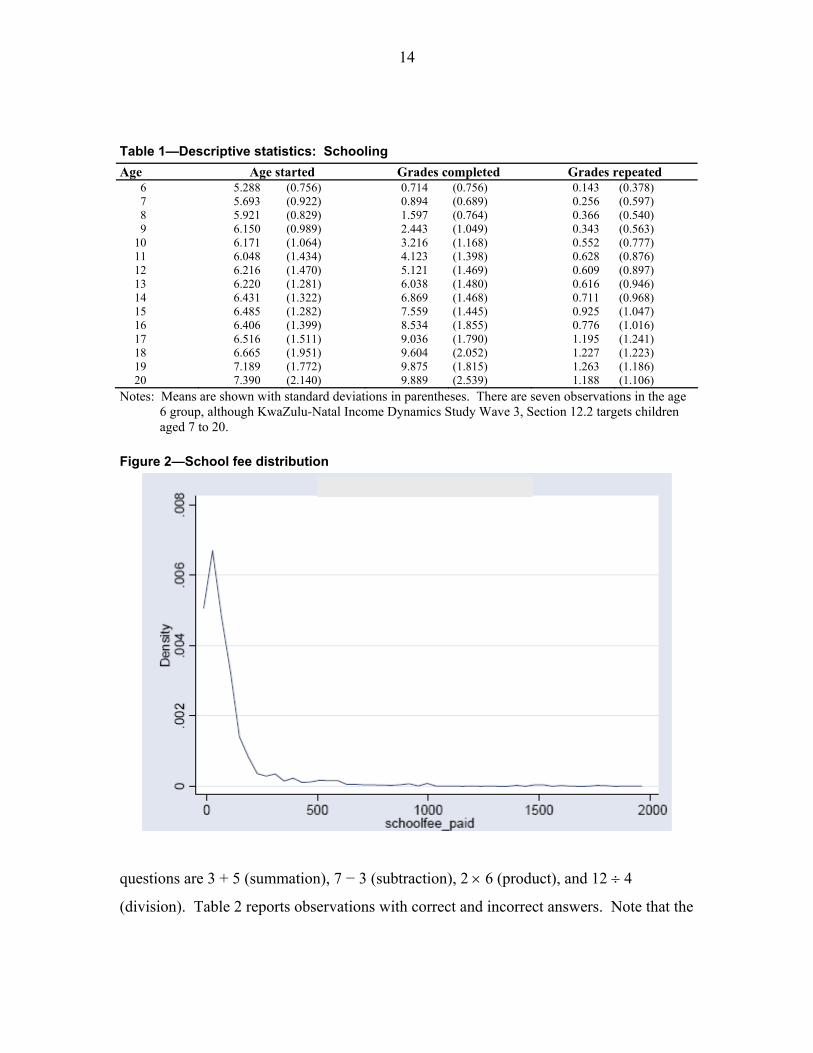
age. Figure 2 also depicts the distribution of individual-level school fee payment. It is
highly skewed, with a concentration of low school fee expenditures.
In the mathematical tests, we implemented four types of numerical tests for
children age 7 to 9—summation, subtraction, multiplication, and division. The four
14
Table 1—Descriptive statistics: Schooling Age Age started Grades completed Grades repeated
6 5.288 (0.756) 0.714 (0.756) 0.143 (0.378) 7 5.693 (0.922) 0.894 (0.689) 0.256 (0.597) 8 5.921 (0.829) 1.597 (0.764) 0.366 (0.540) 9 6.150 (0.989) 2.443 (1.049) 0.343 (0.563)
10 6.171 (1.064) 3.216 (1.168) 0.552 (0.777) 11 6.048 (1.434) 4.123 (1.398) 0.628 (0.876) 12 6.216 (1.470) 5.121 (1.469) 0.609 (0.897) 13 6.220 (1.281) 6.038 (1.480) 0.616 (0.946) 14 6.431 (1.322) 6.869 (1.468) 0.711 (0.968) 15 6.485 (1.282) 7.559 (1.445) 0.925 (1.047) 16 6.406 (1.399) 8.534 (1.855) 0.776 (1.016) 17 6.516 (1.511) 9.036 (1.790) 1.195 (1.241) 18 6.665 (1.951) 9.604 (2.052) 1.227 (1.223) 19 7.189 (1.772) 9.875 (1.815) 1.263 (1.186) 20 7.390 (2.140) 9.889 (2.539) 1.188 (1.106)
Notes: Means are shown with standard deviations in parentheses. There are seven observations in the age 6 group, although KwaZulu-Natal Income Dynamics Study Wave 3, Section 12.2 targets children aged 7 to 20.
Figure 2—School fee distribution
questions are 3 + 5 (summation), 7 − 3 (subtraction), 2 × 6 (product), and 12 ÷ 4
(division). Table 2 reports observations with correct and incorrect answers. Note that the
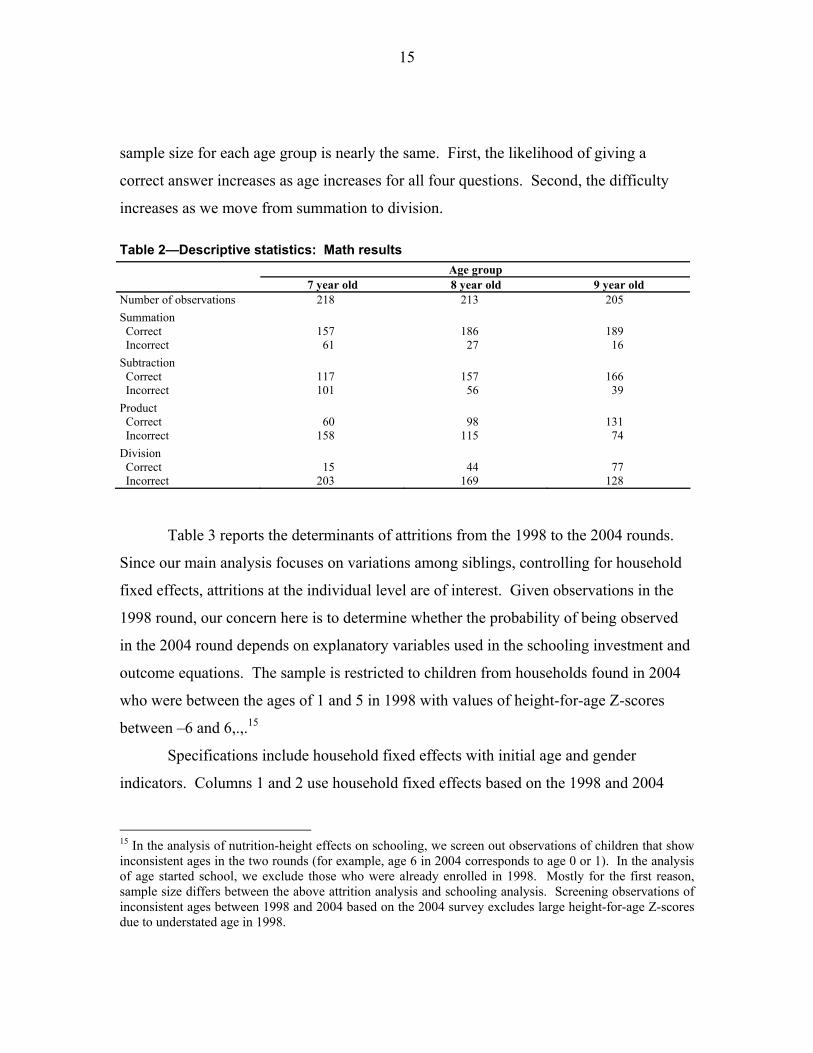
15
sample size for each age group is nearly the same. First, the likelihood of giving a
correct answer increases as age increases for all four questions. Second, the difficulty
increases as we move from summation to division.
Table 2—Descriptive statistics: Math results Age group 7 year old 8 year old 9 year old Number of observations 218 213 205 Summation Correct 157 186 189 Incorrect 61 27 16 Subtraction Correct 117 157 166 Incorrect 101 56 39 Product Correct 60 98 131 Incorrect 158 115 74 Division Correct 15 44 77 Incorrect 203 169 128
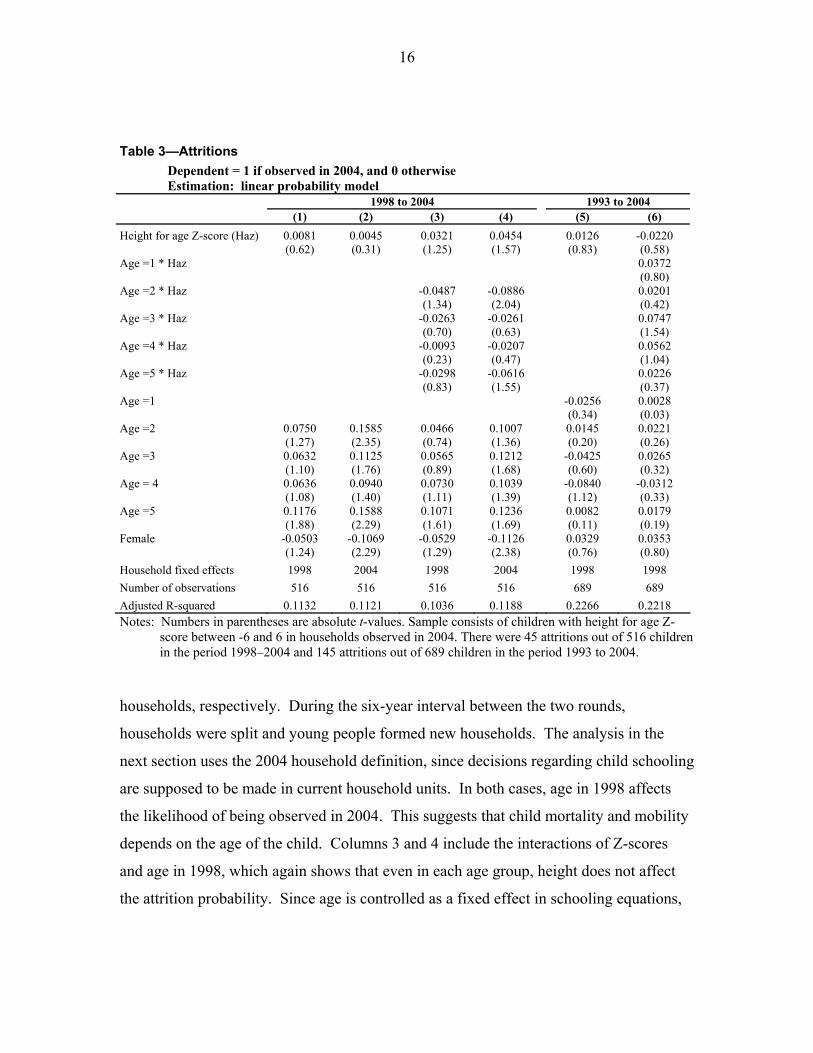
Table 3 reports the determinants of attritions from the 1998 to the 2004 rounds.
Since our main analysis focuses on variations among siblings, controlling for household
fixed effects, attritions at the individual level are of interest. Given observations in the
1998 round, our concern here is to determine whether the probability of being observed
in the 2004 round depends on explanatory variables used in the schooling investment and
outcome equations. The sample is restricted to children from households found in 2004
who were between the ages of 1 and 5 in 1998 with values of height-for-age Z-scores
between –6 and 6,.,.15
Specifications include household fixed effects with initial age and gender
indicators. Columns 1 and 2 use household fixed effects based on the 1998 and 2004
15 In the analysis of nutrition-height effects on schooling, we screen out observations of children that show inconsistent ages in the two rounds (for example, age 6 in 2004 corresponds to age 0 or 1). In the analysis of age started school, we exclude those who were already enrolled in 1998. Mostly for the first reason, sample size differs between the above attrition analysis and schooling analysis. Screening observations of inconsistent ages between 1998 and 2004 based on the 2004 survey excludes large height-for-age Z-scores due to understated age in 1998.
16
Table 3—Attritions Dependent = 1 if observed in 2004, and 0 otherwise Estimation: linear probability model 1998 to 2004 1993 to 2004 (1) (2) (3) (4) (5) (6) Height for age Z-score (Haz) 0.0081 0.0045 0.0321 0.0454 0.0126 -0.0220 (0.62) (0.31) (1.25) (1.57) (0.83) (0.58) Age =1 * Haz 0.0372 (0.80) Age =2 * Haz -0.0487 -0.0886 0.0201 (1.34) (2.04) (0.42) Age =3 * Haz -0.0263 -0.0261 0.0747 (0.70) (0.63) (1.54) Age =4 * Haz -0.0093 -0.0207 0.0562 (0.23) (0.47) (1.04) Age =5 * Haz -0.0298 -0.0616 0.0226 (0.83) (1.55) (0.37) Age =1 -0.0256 0.0028 (0.34) (0.03) Age =2 0.0750 0.1585 0.0466 0.1007 0.0145 0.0221 (1.27) (2.35) (0.74) (1.36) (0.20) (0.26) Age =3 0.0632 0.1125 0.0565 0.1212 -0.0425 0.0265 (1.10) (1.76) (0.89) (1.68) (0.60) (0.32) Age = 4 0.0636 0.0940 0.0730 0.1039 -0.0840 -0.0312 (1.08) (1.40) (1.11) (1.39) (1.12) (0.33) Age =5 0.1176 0.1588 0.1071 0.1236 0.0082 0.0179 (1.88) (2.29) (1.61) (1.69) (0.11) (0.19) Female -0.0503 -0.1069 -0.0529 -0.1126 0.0329 0.0353 (1.24) (2.29) (1.29) (2.38) (0.76) (0.80) Household fixed effects 1998 2004 1998 2004 1998 1998 Number of observations 516 516 516 516 689 689 Adjusted R-squared 0.1132 0.1121 0.1036 0.1188 0.2266 0.2218 Notes: Numbers in parentheses are absolute t-values. Sample consists of children with height for age Z-
score between -6 and 6 in households observed in 2004. There were 45 attritions out of 516 children in the period 1998–2004 and 145 attritions out of 689 children in the period 1993 to 2004.
households, respectively. During the six-year interval between the two rounds,
households were split and young people formed new households. The analysis in the
next section uses the 2004 household definition, since decisions regarding child schooling
are supposed to be made in current household units. In both cases, age in 1998 affects
the likelihood of being observed in 2004. This suggests that child mortality and mobility
depends on the age of the child. Columns 3 and 4 include the interactions of Z-scores
and age in 1998, which again shows that even in each age group, height does not affect
the attrition probability. Since age is controlled as a fixed effect in schooling equations,

17
estimation of equation (1) is robust to attrition bias. Similarly, Columns 5 and 6 examine
attritions from 1993 to 2004. Results confirm that attritions were not associated with
height-for-age Z-score in 1993 (and interactions with the 1993 age), so we do not have to
control attrition probability in the following analyses.
5. Outcomes at the Early Stage of Schooling
Age Started School
Table 4 shows the effect of the height-for-age Z-score in 1998 on the age started
school. The sample consists of children aged 1 to 3 in 1998.16 Column 1 controls only
cluster-level fixed effects, while column 2 reports estimates for siblings. The
specifications include current age indicators to control cohort effects. In column 1,
greater child height is found to significantly lower the age when the child started school,
though this estimate is likely to be biased due to a correlation between household-level
factors and child height.
Table 4—Age started school Dependent: Age started school (1) (2) Height-for-age Z-score 1998 -0.1036 -0.3568 (2.99) (2.75) Female -0.0722 -0.0377 (0.57) (0.11) Current age fixed effects Yes Yes Cluster fixed effects Yes Household fixed effects Yes R-squared 0.3994 0.9829 Number of observations 215 215 Notes: Numbers in parentheses are absolute t-values. Robust standard errors are used in Column 1. Sample consists of
children aged 1 to 3 in 1998, with consistent ages in 1998 and 2004, height-for-age Z-score in the range of –6 to 6 in 1998, and age started school equal to or above 4.
16 Since older children are more likely to be already in school than younger children, this selection of the sample affects estimated height effects on age started school. If the height effect is positive, those who are relatively well endowed are likely to be dropped from the sample, especially among older children (ages 4 and 5). As a result, the selection biases the estimate upward (smaller in absolute value).

18
Column 2 confirms the above finding, showing an even greater effect of height on
age starting school. The upward bias suggests that household-specific unobservables
endowment (which increases the child’s age to start school) is positively correlated with
the height-for-age Z-score. These results imply that early childhood malnutrition delays
the age when the child starts school.17 Current age does not matter in age started school
(not shown in the table), which suggests that the decision to start primary schooling did
not change between 1998 and 2004.
Grade Completed
Table 5 reports the effects of the height-for-age Z-score on years of schooling
completed. Columns 1 and 2 compare estimates with cluster and household fixed effects.
Though a positive significant effect is found with cluster fixed effects, the effect is
negative and insignificant with household fixed effects. In both cases, girls are more
likely to advance grades than boys.
To check possible nonmonotonicity, columns 3 and 4 include step functions of
height-for-age Z-score in different ranges. Interestingly, an improvement in the height Z-
score significantly increases years of schooling completed, but the effect turns out to be
negative at large values of the Z-score.
The negative effect of height on schooling is consistent with increased
opportunity cost of schooling investment. However, we also have to take into account
the possibility that those observations with large Z-scores come from an understatement
of ages. As discussed, the number of observations in this range of Z-scores is extremely
small.
17 A preliminary analysis showed some potential nonmonotonicity in the effect of the height Z-score on age started school. First, estimates of height effects on age started school are significantly negative among relatively short children. Marginal gain in earlier age to start school from increasing height is greater among less endowed children. Second, the numbers of observations in these estimations suggest that the effect is negative and significant in more than 95 percent of the sample. Some outlying observations from exceptionally tall children (conditional on age) change the estimates. This also holds in the analysis of grade completion and repetitions.

19
Table 5—Grade completed Dependent: Grade completed (1) (2) (3) (4) Height for age Z-score 1998 (Haz) 0.0619 -0.0278 0.1090 0.2873 (2.11) (0.43) (2.49) (3.30) Haz 1 to 2 0.1476 -0.5789 (0.61) (1.35) Haz 2 to 3 -0.5716 -1.6777 (1.70) (3.33) Haz 3 to 4 -0.3658 -2.9630 (0.89) (4.83) Haz 4 to 5 -0.5666 -2.2446 (1.45) (2.79) Haz 5 to 6 -1.7554 n.a. (1.90) Female 0.2396 0.5316 0.2353 0.5560 (2.39) (2.63) (2.39) (3.26) Current age fixed effects yes yes yes yes Cluster fixed effects yes yes Household fixed effects yes yes R squared 0.6778 0.9396 0.6864 0.9607 Number of observations 348 348 348 348 Notes: Numbers in parentheses are absolute t values. Robust standard errors are used in columns 1 and 3.
Sample consists of children aged 1 to 5 in 1998, consistent with 2004 ages, and height-for-age Z-score in the range of –6 to 6 in 1998.
The results also show that household endowment is negatively correlated with
height if the Z-score is smaller than one, but it is positively correlated with height if the
score is larger. If the negative effect of height on schooling attainment comes from the
incentive to work outside school, unobserved household-specific factors (such as parents’
knowledge) tend to prevent children from supplying their labor.
Grade Repetition
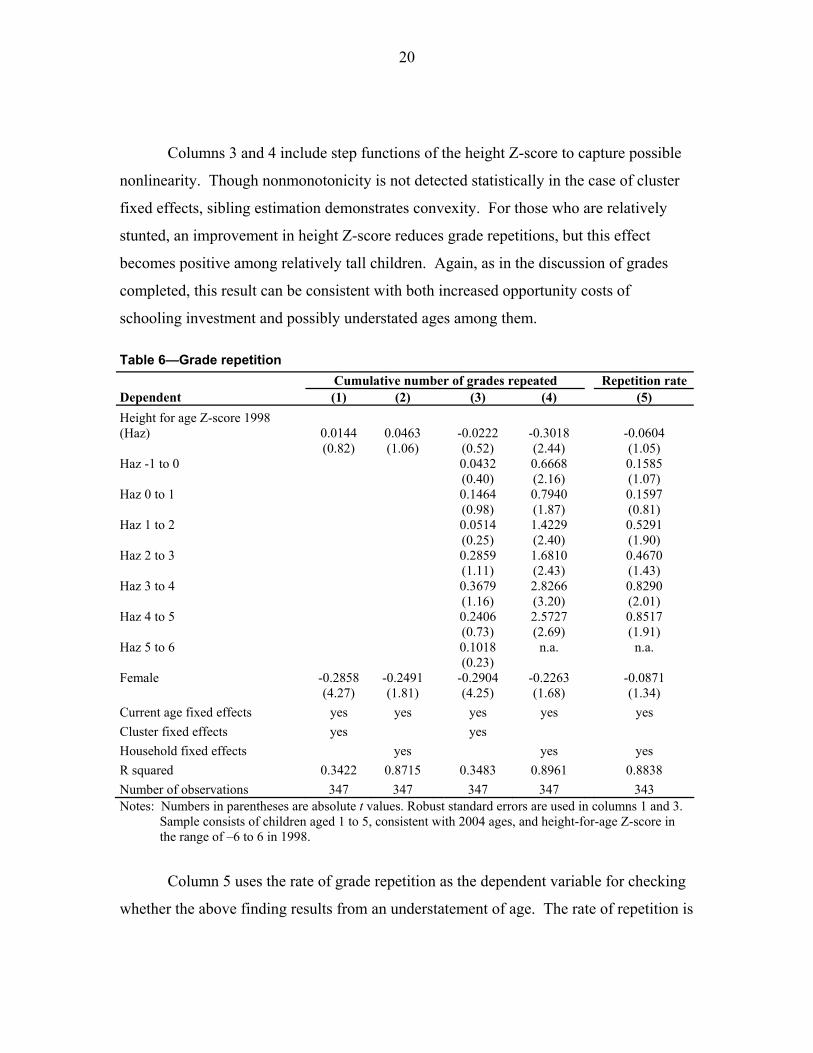
Table 6 summarizes the results on grade repetitions. The dependent variable is
the cumulative number of grades repeated. Columns 1 and 2 show estimates with cluster
and household fixed effects respectively. The effect of the height Z-score is insignificant
in both cases. Consistent with the previous finding on grades completed, girls experience
a smaller number of grade repetitions than boys.
20
Columns 3 and 4 include step functions of the height Z-score to capture possible
nonlinearity. Though nonmonotonicity is not detected statistically in the case of cluster
fixed effects, sibling estimation demonstrates convexity. For those who are relatively
stunted, an improvement in height Z-score reduces grade repetitions, but this effect
becomes positive among relatively tall children. Again, as in the discussion of grades
completed, this result can be consistent with both increased opportunity costs of
schooling investment and possibly understated ages among them.
Table 6—Grade repetition Cumulative number of grades repeated Repetition rate Dependent (1) (2) (3) (4) (5) Height for age Z-score 1998 (Haz) 0.0144 0.0463 -0.0222 -0.3018 -0.0604 (0.82) (1.06) (0.52) (2.44) (1.05) Haz -1 to 0 0.0432 0.6668 0.1585 (0.40) (2.16) (1.07) Haz 0 to 1 0.1464 0.7940 0.1597 (0.98) (1.87) (0.81) Haz 1 to 2 0.0514 1.4229 0.5291 (0.25) (2.40) (1.90) Haz 2 to 3 0.2859 1.6810 0.4670 (1.11) (2.43) (1.43) Haz 3 to 4 0.3679 2.8266 0.8290 (1.16) (3.20) (2.01) Haz 4 to 5 0.2406 2.5727 0.8517 (0.73) (2.69) (1.91) Haz 5 to 6 0.1018 n.a. n.a. (0.23) Female -0.2858 -0.2491 -0.2904 -0.2263 -0.0871 (4.27) (1.81) (4.25) (1.68) (1.34) Current age fixed effects yes yes yes yes yes Cluster fixed effects yes yes Household fixed effects yes yes yes R squared 0.3422 0.8715 0.3483 0.8961 0.8838 Number of observations 347 347 347 347 343 Notes: Numbers in parentheses are absolute t values. Robust standard errors are used in columns 1 and 3.
Sample consists of children aged 1 to 5, consistent with 2004 ages, and height-for-age Z-score in the range of –6 to 6 in 1998.
Column 5 uses the rate of grade repetition as the dependent variable for checking
whether the above finding results from an understatement of age. The rate of repetition is

21
constructed as the cumulative number of repeated grades divided by the sum of grades
repeated and completed. Those who show height-for-age Z-scores above the value of one
are found to experience greater repetition rates, which supports the possibility that
opportunity costs can be high among them.
School Fee Expenditure
Table 7 shows the results on school fee expenditures. In addition to the height-
for-age Z-score, we include its interaction with total monthly household income in
1998.18 In column 1, which controls for cluster fixed effects, the 1998 household total
monthly income has a positive and significant effect on school fee payment. The effects
of the Z-score and its interaction with the initial household income are both insignificant.
Relatively wealthy households are able to pay more for school fees within clusters.
Column 2 shows the sibling estimates. The specification includes the interaction
between the height Z-score and household income in 1998. Since the estimation is based
on household variations of the height Z-score, the 1998 household income is
exogenous.19
While the height Z-score has a positive (marginally significant) effect on school
fee expenditure, higher household income is found to reduce this effect so that parents
spend more for relatively short children only if they can afford it. The former effect
(height) increases income inequality among siblings (given positive returns to height in
the labor market), while the latter (higher income) reduces inequality among them.
To detect possible nonmonotonicity, column 3 includes step functions of the
height-for-age Z-score. Except for some significant effects from scores of between 3 and
4, the finding remains robust. Note that less than 5 percent of the full sample had a Z-
score greater than 3. 18 In preliminary analyses, height-for-age Z-score in sibling estimation was insignificant without its interaction with the 1998 total household income, no matter what range of Z-score was used. Therefore, it is important to control heterogeneity of the initial income level. 19 In a preliminary analysis, the 2004 household monthly income was also interacted with the height Z-score in 1998, but it was shown to be insignificant.

22
Table 7—School fee expenditure 1998 Dependent: School fee paid (1) (2) (3) Height-for-age Z-score 1998 (Haz) -15.221 23.147 66.305 (1.27) (1.55) (3.06) Monthly household income 1998 0.0272 (1.84) Income * Haz 0.0021 -0.0110 -0.0383 (0.43) (2.59) (5.70) Haz 1 to 2 -157.950 (1.34) Haz 2 to 3 -201.140 (0.93) Haz 3 to 4 -542.351 (2.88) Haz 4 to 5 -233.005 (0.96) Haz 5 to 6 n.a. Income * Haz 1 to 2 0.0471 (0.96) Income * Haz 2 to 3 0.0773 (0.71) Income * Haz 3 to 4 0.2814 (4.62) Income * Haz 4 to 5 0.1129 (0.66) Income * Haz 5 to 6 n.a. Age fixed effects yes yes yes Cluster fixed effects yes Household fixed effects yes yes R squared 0.6531 0.9853 0.9907 Number of observations 341 341 341 Notes: Numbers in parentheses are absolute t- values. Robust standard errors are used in column 1. Sample
consists of children aged 1 to 5 in 1998, consistent with 2004 ages, height-for-age Z-score in the range of –6 to 6 in 1998, and school fee paid is less than or equal to school fee charged.
Learning Outcomes
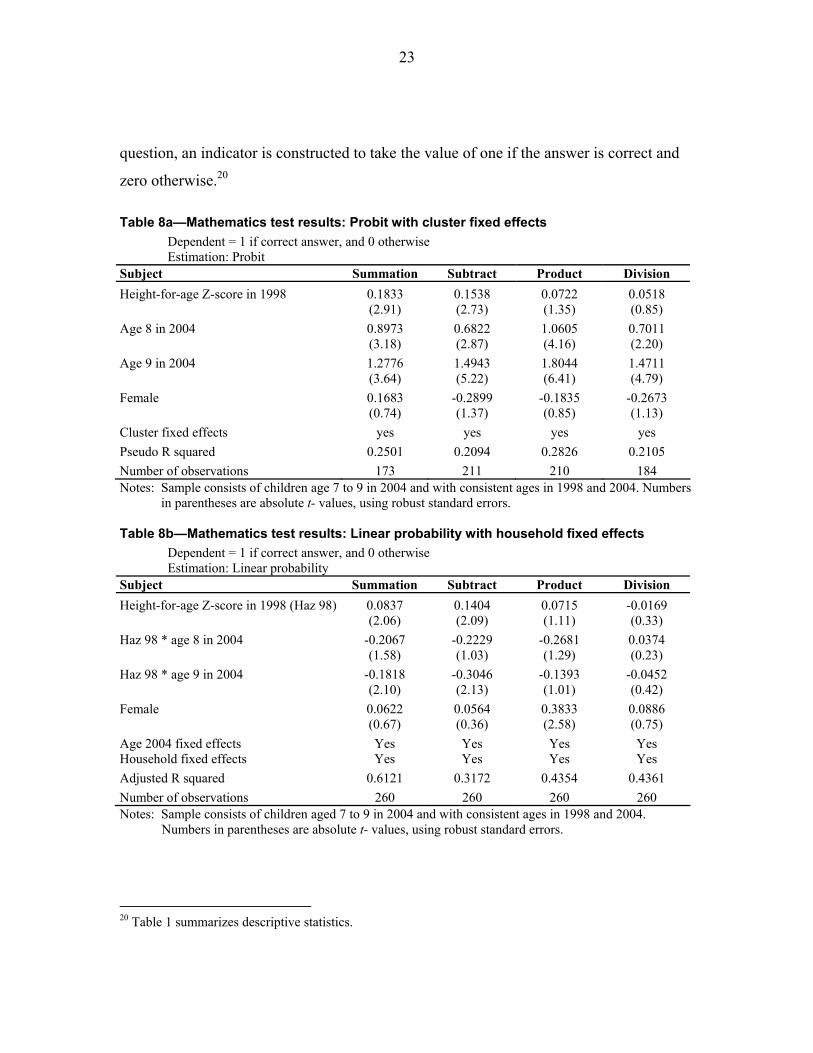
Tables 8a and 8b report the effects of height for age on mathematics test scores.
In the 2004 survey, we implemented four types of basic mathematics tests for children
aged 7 to 9. There are four questions, one question for each operation: 3 + 5
(summation), 7 – 3 (subtraction), 2 × 6 (product), and 12 ÷ 4 (division). For each
23
question, an indicator is constructed to take the value of one if the answer is correct and
zero otherwise.20
Table 8a—Mathematics test results: Probit with cluster fixed effects Dependent = 1 if correct answer, and 0 otherwise Estimation: Probit Subject Summation Subtract Product Division Height-for-age Z-score in 1998 0.1833 0.1538 0.0722 0.0518 (2.91) (2.73) (1.35) (0.85) Age 8 in 2004 0.8973 0.6822 1.0605 0.7011 (3.18) (2.87) (4.16) (2.20) Age 9 in 2004 1.2776 1.4943 1.8044 1.4711 (3.64) (5.22) (6.41) (4.79) Female 0.1683 -0.2899 -0.1835 -0.2673 (0.74) (1.37) (0.85) (1.13) Cluster fixed effects yes yes yes yes Pseudo R squared 0.2501 0.2094 0.2826 0.2105 Number of observations 173 211 210 184 Notes: Sample consists of children age 7 to 9 in 2004 and with consistent ages in 1998 and 2004. Numbers
in parentheses are absolute t- values, using robust standard errors. Table 8b—Mathematics test results: Linear probability with household fixed effects Dependent = 1 if correct answer, and 0 otherwise Estimation: Linear probability Subject Summation Subtract Product Division Height-for-age Z-score in 1998 (Haz 98) 0.0837 0.1404 0.0715 -0.0169 (2.06) (2.09) (1.11) (0.33) Haz 98 * age 8 in 2004 -0.2067 -0.2229 -0.2681 0.0374 (1.58) (1.03) (1.29) (0.23) Haz 98 * age 9 in 2004 -0.1818 -0.3046 -0.1393 -0.0452 (2.10) (2.13) (1.01) (0.42) Female 0.0622 0.0564 0.3833 0.0886 (0.67) (0.36) (2.58) (0.75) Age 2004 fixed effects Yes Yes Yes Yes Household fixed effects Yes Yes Yes Yes Adjusted R squared 0.6121 0.3172 0.4354 0.4361 Number of observations 260 260 260 260 Notes: Sample consists of children aged 7 to 9 in 2004 and with consistent ages in 1998 and 2004.
Numbers in parentheses are absolute t- values, using robust standard errors.
20 Table 1 summarizes descriptive statistics.

24
Table 8a shows Probit results with cluster fixed effects. There are two
observations. First, significantly positive effects are found in summation and subtraction
(relatively easy computations). The point estimate decreases as the difficulty of
calculation advances. Second, age has a significantly positive effect on the probability of
answering correctly. These estimates are again likely to be biased due to omitted
household factors.
Table 8b reports sibling estimates, where the effects of the height Z-scores are
differentiated by age in 2004. In preliminary analyses, without these age-height
interactions, we have not found any significant effects of child height.21 First, it is found
that in summation and subtraction, height Z-score significantly increases the probability
of making correct answers among children age 7, but not in the other age groups.
Interestingly, the effects will decrease as children age. The lagged nutrition effect is
significant in the transitional phase from pre-primary to primary school stages.
6. Outcomes at the Later Stage of Schooling
This section summarizes our findings on the effects of the children’s height Z-
score in 1993 on schooling outcomes in 2004. Before discussing the results, we also
must note that South African education was in its historical transition from apartheid to
democracy during the period 1993–96, and the South African School Act and Norms and
Standards were introduced in 1996, making it compulsory for the school system to be
nonsegregated. Due to these social changes, it is also expected that the estimation results
are subject to imprecision.
It is also important to note that by 2004, this group of children was also in
transition from primary to secondary stages of education. This may create heterogeneity
by age in the effects of the height Z-score on schooling outcomes. Therefore, it is equally
important to examine possible variations in the height effect by age as well as the
21 The finding implies that household factors are positively correlated with both child height and learning outcomes (both conditional on age).

25
nonmonotonicity. The role of positive returns to health is greater among elder children
than younger.
In the analysis of age started school results in Table 9, we expect more
measurement errors than is the case in the 1998 sample due to recall problems. Columns
1 and 2 show sibling estimates (household fixed effect). The height Z-score has no
significant effect on age started school in this group. Column 3, which uses cluster fixed
effects instead of household fixed effects, shows that a greater height Z-score decreases
the age they started school for those in the age-14 group (compared with the age-11
group), who were already age 3 in 1993 (before the political transition). All these results
show that girls are likely to start school earlier than boys.
Table 9—Age started school—1993 sample Dependent variable: Age started school (1) (2) (3) Height-for-age Z-score 1993 0.0467 0.0654 0.0733 (0.46) (0.36) (1.00) * Age 12 0.0904 -0.1193 (0.36) (1.16) * Age 13 -0.0696 -0.1529 (0.34) (1.42) * Age 14 -0.2339 -0.4033 (0.67) (2.67) Female -0.4273 -0.4949 -0.2604 (1.46) (1.60) (1.77) Age fixed effects yes yes yes Cluster fixed effects yes Household fixed effects yes yes R squared 0.9338 0.9370 0.4567 Number of observations 230 230 230 Notes: Numbers in parentheses are absolute t- values. Robust standard errors are given in column 3.
Sample consists of children aged 0 to 5, consistent with 2004 ages, and height-for-age Z-score in the range of –6 to 6 in 1993.
Table 10 shows the effects of the height-for-age Z-score on grades completed and
repeated. All the specifications control household fixed effects. Column 1 has only the
height Z-score, which shows its insignificance. Age heterogeneity is controlled in
column 2. It is interesting to know that an improvement in height Z-score marginally
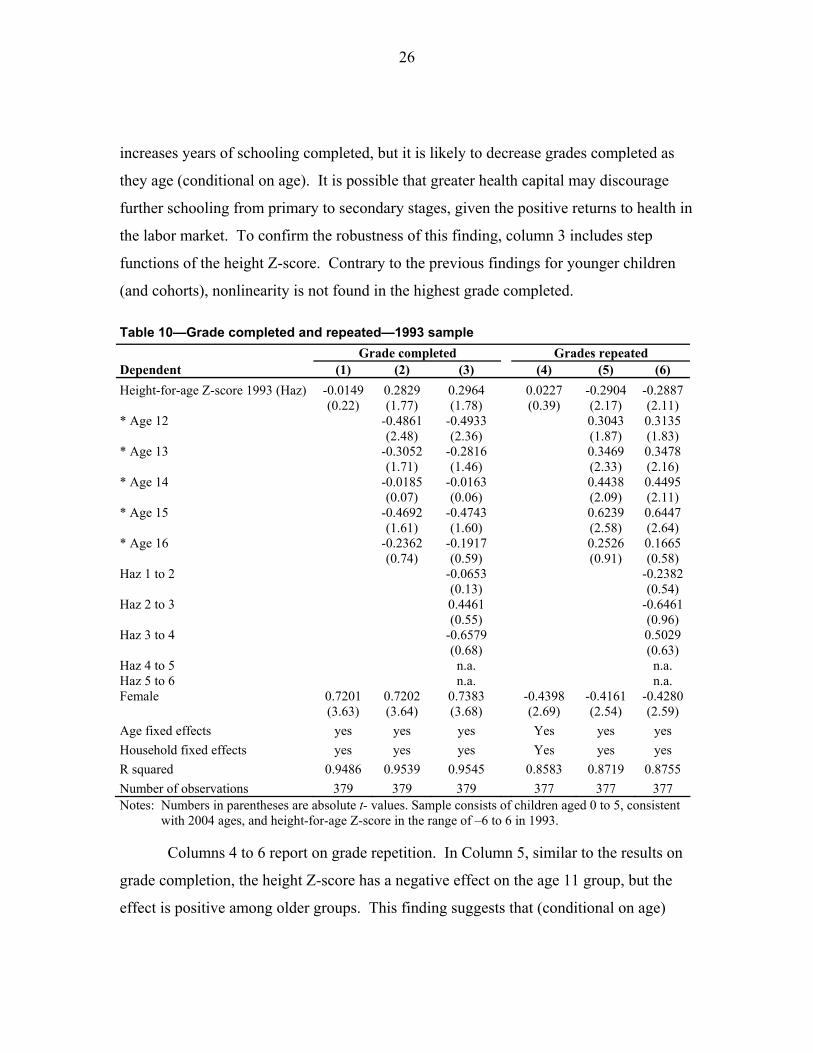
26
increases years of schooling completed, but it is likely to decrease grades completed as
they age (conditional on age). It is possible that greater health capital may discourage
further schooling from primary to secondary stages, given the positive returns to health in
the labor market. To confirm the robustness of this finding, column 3 includes step
functions of the height Z-score. Contrary to the previous findings for younger children
(and cohorts), nonlinearity is not found in the highest grade completed.
Table 10—Grade completed and repeated—1993 sample Grade completed Grades repeated Dependent (1) (2) (3) (4) (5) (6) Height-for-age Z-score 1993 (Haz) -0.0149 0.2829 0.2964 0.0227 -0.2904 -0.2887 (0.22) (1.77) (1.78) (0.39) (2.17) (2.11) * Age 12 -0.4861 -0.4933 0.3043 0.3135 (2.48) (2.36) (1.87) (1.83) * Age 13 -0.3052 -0.2816 0.3469 0.3478 (1.71) (1.46) (2.33) (2.16) * Age 14 -0.0185 -0.0163 0.4438 0.4495 (0.07) (0.06) (2.09) (2.11) * Age 15 -0.4692 -0.4743 0.6239 0.6447 (1.61) (1.60) (2.58) (2.64) * Age 16 -0.2362 -0.1917 0.2526 0.1665 (0.74) (0.59) (0.91) (0.58) Haz 1 to 2 -0.0653 -0.2382 (0.13) (0.54) Haz 2 to 3 0.4461 -0.6461 (0.55) (0.96) Haz 3 to 4 -0.6579 0.5029 (0.68) (0.63) Haz 4 to 5 n.a. n.a. Haz 5 to 6 n.a. n.a. Female 0.7201 0.7202 0.7383 -0.4398 -0.4161 -0.4280 (3.63) (3.64) (3.68) (2.69) (2.54) (2.59) Age fixed effects yes yes yes Yes yes yes Household fixed effects yes yes yes Yes yes yes R squared 0.9486 0.9539 0.9545 0.8583 0.8719 0.8755 Number of observations 379 379 379 377 377 377 Notes: Numbers in parentheses are absolute t- values. Sample consists of children aged 0 to 5, consistent
with 2004 ages, and height-for-age Z-score in the range of –6 to 6 in 1993.
Columns 4 to 6 report on grade repetition. In Column 5, similar to the results on
grade completion, the height Z-score has a negative effect on the age 11 group, but the
effect is positive among older groups. This finding suggests that (conditional on age)

27
greater health capital may discourage further investments in schooling at the transition
stage from primary to secondary schools. Column 6 investigates potential nonlinearity
by introducing step functions, which again show insignificance of nonlinearity in grade
repetition.
In both grades completed and repeated, girls perform better than boys. However,
preliminary analysis shows that gender does not matter in the effect of the height Z-score
on these schooling outcomes.
Finally, Table 11 reports the effects of the height Z-score on school fee payment.
Interestingly, the results show opposite signs in the key parameter estimates. Columns 1
and 2 use monthly household income in 1993 and 2004, respectively. In both cases, the
height Z-score decreases the school fee paid, while an increase in income augments
school-fee expenditure to healthy children. The difference between Tables 11 and 7 may
result from (1) possible differences in the education system that these cohorts
experienced during this transitional stage of South African education, (2) differences in
parents’ attitude to school fee expenditure and school choice behavior between early
primary school and primary-to-secondary school stages. However, the results show a
Table 11—School fee expenditure—1993 sample Dependent variable: School fee paid (1) (2) Height-for-age Z-score 1993 (Haz) -245.68 -361.79 (1.92) (3.47) Household monthly income 1993 * Haz 0.2153 (2.57) Household monthly income 2004 * Haz 0.1283 (5.16) Age fixed effects yes yes Household fixed effects yes yes R squared 0.7090 0.7686 Number of observations 366 329 Notes: Numbers in parentheses are absolute t- values. Sample consists of children aged 0 to 5, consistent
with 2004 ages, height-for-age Z-score in the range of –6 to 6 in 1993, and school fee paid less than or equal to school fee charged.

28
process of increasing inequality among children, given positive returns to health capital
and the positive association between school fee expenditure and school quality.
7. Conclusions
This paper examines the effect of early childhood health capital on schooling
investments and outcomes, using panel data from South Africa. Good nutrition and
health in early childhood are thought to be a precondition for child development and
school learning at subsequent stages. However, in an environment where children may
contribute to household income, as in developing countries where health capital has
positive economic returns in the labor market, child health augments not only the
efficiency of human capital production at the schooling stage but also the labor-market
wage. Therefore the opportunity costs of going to school are higher.
Nutrition intake and health capital in early childhood, measured by the height-for-
age Z-score of pre-primary-school-aged children, enhance schooling investments and
improve the outcomes. That is, children who are well nourished and in good health start
school at an earlier age, progress further, and repeat fewer grades. We also found that
some taller children (Z-score above two) perform worse than shorter children, but since
this segment of observations is very small in our sample, it is difficult to generalize this
nonmonotonicity. Instead, the analysis with a longer panel data of 11 years suggests that
good health may discourage further investments in schooling at the stage of transition
from primary to secondary school, when a better health status may reinforce incentives to
go to work. In the early stage of schooling, parents attempt to narrow the gaps in total
human capital and future incomes among siblings by increasing expenditures on
education for children with smaller health capital as household income increases.
However, unequal allocation of resources among siblings is found to increase inequality
at later stages. This difference may reflect some changes in the education system in
South Africa during this period, or changes in parents’ behavior that may happen when
the child moves from primary to secondary school.
29
References
Alderman, H., J. Hoddinott, and B. Kinsey. 2002. Long-term consequences of early
childhood malnutrition. Oxford Economic Papers. Forthcoming.
Alderman, H., J. Behrman, V. Lavy, and R. Menon. 2000. Child health and school
enrollment: A longitudinal analysis. Journal of Human Resources 36 (1):
185-205.
Behrman, J., H. Alderman, and J. Hoddinott. 2004. Hunger and malnutrition. In Global
crisis, global solutions, ed. B. Lomborg. Cambridge: Cambridge University
Press.
Butcher, K., and A. Case. 1994. The effect of sibling sex composition on women’s
education and earnings. Quarterly Journal of Economics 109 (3): 531–563.
Cunha, F., J. Heckman, L. Lochner, and D. Masterov. 2004. Interpreting the evidence
on life cycle skill formation. University of Chicago, Chicago, Ill., U.S.A.
Photocopy.
Foster, A. 1995. Prices, credit markets and child growth in low-income rural areas.
Economic Journal 105 (430): 551–570.
Glewwe, P., H. Jacoby, and E. King. 2001. The impact of early childhood nutritional
status on cognitive development: Does the timing of malnutrition matter?
Journal of Public Economics 81 (3): 345–368.
Haddad, L., and H. Bouis. 1991. The impact of nutritional status on agricultural
productivity: Wage evidence from the Philippines. Oxford Bulletin of Economics
and Statistics 53 (1): 45–68.
Hoddinott, J., and B. Kinsey. 2001. Child growth in the time of drought. Oxford
Bulletin of Economics and Statistics 63 (4): 409–436.
Pitt, M., and M. R. Rosenzweig. 1990. Estimating the intrahousehold incidence of
illness: Child health and gender inequality in the allocation of time. International
Economic Review 31 (4): 969–980.
30
Quisumbing, A., J. Estudillo, and K.Otsuka. 2004. Land and schooling: Transferring
wealth across generations. Baltimore, Md., U.S.A.: Johns Hopkins University
Press for the International Food Policy Research Institute.
Rosenzweig, M. R. 1986. Birth spacing and sibling inequality: Asymmetric information
within the family. International Economic Review 27 (1): 55–76.
Rosenzweig, M. R., and K. Wolpin. 2000. Natural ‘natural experiments’ in economics.
Journal of Economic Literature 38 (4): 827-874.
Schady, N. 2003. Convexity and sheepskin effects in the human capital earnings
function: Recent evidence from Filipino men. Oxford Bulletin of Economics and
Statistics 65 (2): 171–196.
Strauss, J. 1986. Does better nutrition raise farm productivity? Journal of Political
Economy 94 (2): 297–320.
Thomas, D., and J. Strauss. 1997. Health and wages: Evidence on men and women in
urban Brazil. Journal of Econometrics 77 (1): 159–185.
Yamauchi, F. 2005. Why do schooling returns differ? Screening, private schools and
labor markets in the Philippines and Thailand. Economic Development and
Cultural Change 53 (4): 959–982.

FCND DISCUSSION PAPERS
202 Has Economic Growth in Mozambique Been Pro-Poor? Robert C. James, Channing Arndt, and Kenneth R. Simler, December 2005
201 Community, Inequality, and Local Public Goods: Evidence from School Financing in South Africa, Futoshi Yamauchi and Shinichi Nishiyama, September 2005
200 Is Greater Decisionmaking Power of Women Associated with Reduced Gender Discrimination in South Asia? Lisa C. Smith and Elizabeth M. Byron, August 2005
199 Evaluating the Cost of Poverty Alleviation Transfer Programs: An Illustration Based on PROGRESA in Mexico, David Coady, Raul Perez, and Hadid Vera-Ilamas, July 2005
198 Why the Poor in Rural Malawi Are Where They Are: An Analysis of the Spatial Determinants of the Local Prevalence of Poverty, Todd Benson, Jordan Chamberlin, and Ingrid Rhinehart, July 2005
194 Livelihoods, Growth, and Links to Market Towns in 15 Ethiopian Villages, Stefan Dercon and John Hoddinott, July 2005
193 Livelihood Diversification and Rural-Urban Linkages in Vietnam’s Red River Delta, Hoang Xuan Thanh, Dang Nguyen Anh, and Ceclila Tacoli, June 2005
192 Poverty, Inequality, and Geographic Targeting: Evidence from Small-Area Estimates in Mozambique, Kenneth R. Simler and Virgulino Nhate, June 2005
191 Program Participation Under Means-Testing and Self-Selection Targeting Methods, David P. Coady and Susan W. Parker, April 2005
190 Social Learning, Neighborhood Effects, and Investment in Human Capital: Evidence from Green-Revolution India, Futoshi Yamauchi, April 2005
189 Estimating Utility-Consistent Poverty Lines, Channing Arndt and Kenneth R. Simler, March 2005
188 Coping with the “Coffee Crisis” in Central America: The Role of the Nicaraguan Red de Protección Social (RPS), John A. Maluccio, February 2005
187 The Use of Operations Research as a Tool for Monitoring and Managing Food-Assisted Maternal/Child Health and Nutrition (MCHN) Programs: An Example from Haiti, Cornelia Loechl, Marie T. Ruel, Gretel Pelto, and Purnima Menon, February 2005
186 Are Wealth Transfers Biased Against Girls? Gender Differences in Land Inheritance and Schooling Investment in Ghana’s Western Region, Agnes R. Quisumbing, Ellen M. Payongayong, and Keijiro Otsuka, August 2004
185 Assets at Marriage in Rural Ethiopia, Marcel Fafchamps and Agnes Quisumbing, August 2004
184 Impact Evaluation of a Conditional Cash Transfer Program: The Nicaraguan Red de Protección Social, John A. Maluccio and Rafael Flores, July 2004
183 Poverty in Malawi, 1998, Todd Benson, Charles Machinjili, and Lawrence Kachikopa, July 2004
182 Race, Equity, and Public Schools in Post-Apartheid South Africa: Is Opportunity Equal for All Kids? Futoshi Yamauchi, June 2004
181 Scaling Up Community-Driven Development: A Synthesis of Experience, Stuart Gillespie, June 2004
180 Kudumbashree—Collective Action for Poverty Alleviation and Women’s Employment, Suneetha Kadiyala, May 2004
179 Scaling Up HIV/AIDS Interventions Through Expanded Partnerships (STEPs) in Malawi, Suneetha Kadiyala, May 2004
178 Community-Driven Development and Scaling Up of Microfinance Services: Case Studies from Nepal and India, Manohar P. Sharma, April 2004
177 Community Empowerment and Scaling Up in Urban Areas: The Evolution of PUSH/PROSPECT in Zambia, James Garrett, April 2004
176 Why Is Child Malnutrition Lower in Urban than Rural Areas? Evidence from 36 Developing Countries, Lisa C. Smith, Marie T. Ruel, and Aida Ndiaye, March 2004
FCND DISCUSSION PAPERS
175 Consumption Smoothing and Vulnerability in the Zone Lacustre, Mali, Sarah Harrower and John Hoddinott, March 2004
174 The Cost of Poverty Alleviation Transfer Programs: A Comparative Analysis of Three Programs in Latin America, Natàlia Caldés, David Coady, and John A. Maluccio, February 2004
173 Food Aid Distribution in Bangladesh: Leakage and Operational Performance, Akhter U. Ahmed, Shahidur Rashid, Manohar Sharma, and Sajjad Zohir in collaboration with Mohammed Khaliquzzaman, Sayedur Rahman, and the Data Analysis and Technical Assistance Limited, February 2004
172 Designing and Evaluating Social Safety Nets: Theory, Evidence, and Policy Conclusions, David P. Coady, January 2004
171 Living Life: Overlooked Aspects of Urban Employment, James Garrett, January 2004
170 From Research to Program Design: Use of Formative Research in Haiti to Develop a Behavior Change Communication Program to Prevent Malnutrition, Purnima Menon, Marie T. Ruel, Cornelia Loechl, and Gretel Pelto, December 2003
169 Nonmarket Networks Among Migrants: Evidence from Metropolitan Bangkok, Thailand, Futoshi Yamauchi and Sakiko Tanabe, December 2003
168 Long-Term Consequences of Early Childhood Malnutrition, Harold Alderman, John Hoddinott, and Bill Kinsey, December 2003
167 Public Spending and Poverty in Mozambique, Rasmus Heltberg, Kenneth Simler, and Finn Tarp, December 2003
166 Are Experience and Schooling Complementary? Evidence from Migrants’ Assimilation in the Bangkok Labor Market, Futoshi Yamauchi, December 2003
165 What Can Food Policy Do to Redirect the Diet Transition? Lawrence Haddad, December 2003
164 Impacts of Agricultural Research on Poverty: Findings of an Integrated Economic and Social Analysis, Ruth Meinzen-Dick, Michelle Adato, Lawrence Haddad, and Peter Hazell, October 2003
163 An Integrated Economic and Social Analysis to Assess the Impact of Vegetable and Fishpond Technologies on Poverty in Rural Bangladesh, Kelly Hallman, David Lewis, and Suraiya Begum, October 2003
162 The Impact of Improved Maize Germplasm on Poverty Alleviation: The Case of Tuxpeño-Derived Material in Mexico, Mauricio R. Bellon, Michelle Adato, Javier Becerril, and Dubravka Mindek, October 2003
161 Assessing the Impact of High-Yielding Varieties of Maize in Resettlement Areas of Zimbabwe, Michael Bourdillon, Paul Hebinck, John Hoddinott, Bill Kinsey, John Marondo, Netsayi Mudege, and Trudy Owens, October 2003
160 The Impact of Agroforestry-Based Soil Fertility Replenishment Practices on the Poor in Western Kenya, Frank Place, Michelle Adato, Paul Hebinck, and Mary Omosa, October 2003
159 Rethinking Food Aid to Fight HIV/AIDS, Suneetha Kadiyala and Stuart Gillespie, October 2003
158 Food Aid and Child Nutrition in Rural Ethiopia, Agnes R. Quisumbing, September 2003
157 HIV/AIDS, Food Security, and Rural Livelihoods: Understanding and Responding, Michael Loevinsohn and Stuart Gillespie, September 2003
156 Public Policy, Food Markets, and Household Coping Strategies in Bangladesh: Lessons from the 1998 Floods, Carlo del Ninno, Paul A. Dorosh, and Lisa C. Smith, September 2003
155 Consumption Insurance and Vulnerability to Poverty: A Synthesis of the Evidence from Bangladesh, Ethiopia, Mali, Mexico, and Russia, Emmanuel Skoufias and Agnes R. Quisumbing, August 2003
154 Cultivating Nutrition: A Survey of Viewpoints on Integrating Agriculture and Nutrition, Carol E. Levin, Jennifer Long, Kenneth R. Simler, and Charlotte Johnson-Welch, July 2003
153 Maquiladoras and Market Mamas: Women’s Work and Childcare in Guatemala City and Accra, Agnes R. Quisumbing, Kelly Hallman, and Marie T. Ruel, June 2003
FCND DISCUSSION PAPERS
152 Income Diversification in Zimbabwe: Welfare Implications From Urban and Rural Areas, Lire Ersado, June 2003
151 Childcare and Work: Joint Decisions Among Women in Poor Neighborhoods of Guatemala City, Kelly Hallman, Agnes R. Quisumbing, Marie T. Ruel, and Bénédicte de la Brière, June 2003
150 The Impact of PROGRESA on Food Consumption, John Hoddinott and Emmanuel Skoufias, May 2003
149 Do Crowded Classrooms Crowd Out Learning? Evidence From the Food for Education Program in Bangladesh, Akhter U. Ahmed and Mary Arends-Kuenning, May 2003
148 Stunted Child-Overweight Mother Pairs: An Emerging Policy Concern? James L. Garrett and Marie T. Ruel, April 2003
147 Are Neighbors Equal? Estimating Local Inequality in Three Developing Countries, Chris Elbers, Peter Lanjouw, Johan Mistiaen, Berk Özler, and Kenneth Simler, April 2003
146 Moving Forward with Complementary Feeding: Indicators and Research Priorities, Marie T. Ruel, Kenneth H. Brown, and Laura E. Caulfield, April 2003
145 Child Labor and School Decisions in Urban and Rural Areas: Cross Country Evidence, Lire Ersado, December 2002
144 Targeting Outcomes Redux, David Coady, Margaret Grosh, and John Hoddinott, December 2002
143 Progress in Developing an Infant and Child Feeding Index: An Example Using the Ethiopia Demographic and Health Survey 2000, Mary Arimond and Marie T. Ruel, December 2002
142 Social Capital and Coping With Economic Shocks: An Analysis of Stunting of South African Children, Michael R. Carter and John A. Maluccio, December 2002
141 The Sensitivity of Calorie-Income Demand Elasticity to Price Changes: Evidence from Indonesia, Emmanuel Skoufias, November 2002
140 Is Dietary Diversity an Indicator of Food Security or Dietary Quality? A Review of Measurement Issues and Research Needs, Marie T. Ruel, November 2002
139 Can South Africa Afford to Become Africa’s First Welfare State? James Thurlow, October 2002
138 The Food for Education Program in Bangladesh: An Evaluation of its Impact on Educational Attainment and Food Security, Akhter U. Ahmed and Carlo del Ninno, September 2002
137 Reducing Child Undernutrition: How Far Does Income Growth Take Us? Lawrence Haddad, Harold Alderman, Simon Appleton, Lina Song, and Yisehac Yohannes, August 2002
136 Dietary Diversity as a Food Security Indicator, John Hoddinott and Yisehac Yohannes, June 2002
135 Trust, Membership in Groups, and Household Welfare: Evidence from KwaZulu-Natal, South Africa, Lawrence Haddad and John A. Maluccio, May 2002
134 In-Kind Transfers and Household Food Consumption: Implications for Targeted Food Programs in Bangladesh, Carlo del Ninno and Paul A. Dorosh, May 2002
133 Avoiding Chronic and Transitory Poverty: Evidence From Egypt, 1997-99, Lawrence Haddad and Akhter U. Ahmed, May 2002
132 Weighing What’s Practical: Proxy Means Tests for Targeting Food Subsidies in Egypt, Akhter U. Ahmed and Howarth E. Bouis, May 2002
131 Does Subsidized Childcare Help Poor Working Women in Urban Areas? Evaluation of a Government-Sponsored Program in Guatemala City, Marie T. Ruel, Bénédicte de la Brière, Kelly Hallman, Agnes Quisumbing, and Nora Coj, April 2002
130 Creating a Child Feeding Index Using the Demographic and Health Surveys: An Example from Latin America, Marie T. Ruel and Purnima Menon, April 2002
129 Labor Market Shocks and Their Impacts on Work and Schooling: Evidence from Urban Mexico, Emmanuel Skoufias and Susan W. Parker, March 2002
FCND DISCUSSION PAPERS
128 Assessing the Impact of Agricultural Research on Poverty Using the Sustainable Livelihoods Framework, Michelle Adato and Ruth Meinzen-Dick, March 2002
127 A Cost-Effectiveness Analysis of Demand- and Supply-Side Education Interventions: The Case of PROGRESA in Mexico, David P. Coady and Susan W. Parker, March 2002
126 Health Care Demand in Rural Mozambique: Evidence from the 1996/97 Household Survey, Magnus Lindelow, February 2002
125 Are the Welfare Losses from Imperfect Targeting Important?, Emmanuel Skoufias and David Coady, January 2002
124 The Robustness of Poverty Profiles Reconsidered, Finn Tarp, Kenneth Simler, Cristina Matusse, Rasmus Heltberg, and Gabriel Dava, January 2002
123 Conditional Cash Transfers and Their Impact on Child Work and Schooling: Evidence from the PROGRESA Program in Mexico, Emmanuel Skoufias and Susan W. Parker, October 2001
122 Strengthening Public Safety Nets: Can the Informal Sector Show the Way?, Jonathan Morduch and Manohar Sharma, September 2001
121 Targeting Poverty Through Community-Based Public Works Programs: A Cross-Disciplinary Assessment of Recent Experience in South Africa, Michelle Adato and Lawrence Haddad, August 2001
120 Control and Ownership of Assets Within Rural Ethiopian Households, Marcel Fafchamps and Agnes R. Quisumbing, August 2001
119 Assessing Care: Progress Towards the Measurement of Selected Childcare and Feeding Practices, and Implications for Programs, Mary Arimond and Marie T. Ruel, August 2001
118 Is PROGRESA Working? Summary of the Results of an Evaluation by IFPRI, Emmanuel Skoufias and Bonnie McClafferty, July 2001
117 Evaluation of the Distributional Power of PROGRESA’s Cash Transfers in Mexico, David P. Coady, July 2001
116 A Multiple-Method Approach to Studying Childcare in an Urban Environment: The Case of Accra, Ghana, Marie T. Ruel, Margaret Armar-Klemesu, and Mary Arimond, June 2001
115 Are Women Overrepresented Among the Poor? An Analysis of Poverty in Ten Developing Countries, Agnes R. Quisumbing, Lawrence Haddad, and Christina Peña, June 2001
114 Distribution, Growth, and Performance of Microfinance Institutions in Africa, Asia, and Latin America, Cécile Lapenu and Manfred Zeller, June 2001
113 Measuring Power, Elizabeth Frankenberg and Duncan Thomas, June 2001
112 Effective Food and Nutrition Policy Responses to HIV/AIDS: What We Know and What We Need to Know, Lawrence Haddad and Stuart Gillespie, June 2001
111 An Operational Tool for Evaluating Poverty Outreach of Development Policies and Projects, Manfred Zeller, Manohar Sharma, Carla Henry, and Cécile Lapenu, June 2001
110 Evaluating Transfer Programs Within a General Equilibrium Framework, Dave Coady and Rebecca Lee Harris, June 2001
109 Does Cash Crop Adoption Detract From Childcare Provision? Evidence From Rural Nepal, Michael J. Paolisso, Kelly Hallman, Lawrence Haddad, and Shibesh Regmi, April 2001
108 How Efficiently Do Employment Programs Transfer Benefits to the Poor? Evidence from South Africa, Lawrence Haddad and Michelle Adato, April 2001
107 Rapid Assessments in Urban Areas: Lessons from Bangladesh and Tanzania, James L. Garrett and Jeanne Downen, April 2001
106 Strengthening Capacity to Improve Nutrition, Stuart Gillespie, March 2001
105 The Nutritional Transition and Diet-Related Chronic Diseases in Asia: Implications for Prevention, Barry M. Popkin, Sue Horton, and Soowon Kim, March 2001

FCND DISCUSSION PAPERS
104 An Evaluation of the Impact of PROGRESA on Preschool Child Height, Jere R. Behrman and John Hoddinott, March 2001
103 Targeting the Poor in Mexico: An Evaluation of the Selection of Households for PROGRESA, Emmanuel Skoufias, Benjamin Davis, and Sergio de la Vega, March 2001
102 School Subsidies for the Poor: Evaluating a Mexican Strategy for Reducing Poverty, T. Paul Schultz, March 2001
101 Poverty, Inequality, and Spillover in Mexico’s Education, Health, and Nutrition Program, Sudhanshu Handa, Mari-Carmen Huerta, Raul Perez, and Beatriz Straffon, March 2001
100 On the Targeting and Redistributive Efficiencies of Alternative Transfer Instruments, David Coady and Emmanuel Skoufias, March 2001
99 Cash Transfer Programs with Income Multipliers: PROCAMPO in Mexico, Elisabeth Sadoulet, Alain de Janvry, and Benjamin Davis, January 2001
98 Participation and Poverty Reduction: Issues, Theory, and New Evidence from South Africa, John Hoddinott, Michelle Adato, Tim Besley, and Lawrence Haddad, January 2001
97 Socioeconomic Differentials in Child Stunting Are Consistently Larger in Urban Than in Rural Areas, Purnima Menon, Marie T. Ruel, and Saul S. Morris, December 2000
96 Attrition in Longitudinal Household Survey Data: Some Tests for Three Developing-Country Samples, Harold Alderman, Jere R. Behrman, Hans-Peter Kohler, John A. Maluccio, Susan Cotts Watkins, October 2000
95 Attrition in the Kwazulu Natal Income Dynamics Study 1993-1998, John Maluccio, October 2000
94 Targeting Urban Malnutrition: A Multicity Analysis of the Spatial Distribution of Childhood Nutritional Status, Saul Sutkover Morris, September 2000
93 Mother-Father Resource Control, Marriage Payments, and Girl-Boy Health in Rural Bangladesh, Kelly K. Hallman, September 2000
92 Assessing the Potential for Food-Based Strategies to Reduce Vitamin A and Iron Deficiencies: A Review of Recent Evidence, Marie T. Ruel and Carol E. Levin, July 2000
91 Comparing Village Characteristics Derived From Rapid Appraisals and Household Surveys: A Tale From Northern Mali, Luc Christiaensen, John Hoddinott, and Gilles Bergeron, July 2000
90 Empirical Measurements of Households’ Access to Credit and Credit Constraints in Developing Countries: Methodological Issues and Evidence, Aliou Diagne, Manfred Zeller, and Manohar Sharma, July 2000
89 The Role of the State in Promoting Microfinance Institutions, Cécile Lapenu, June 2000
88 The Determinants of Employment Status in Egypt, Ragui Assaad, Fatma El-Hamidi, and Akhter U. Ahmed, June 2000
87 Changes in Intrahousehold Labor Allocation to Environmental Goods Collection: A Case Study from Rural Nepal, Priscilla A. Cooke, May 2000
86 Women’s Assets and Intrahousehold Allocation in Rural Bangladesh: Testing Measures of Bargaining Power, Agnes R. Quisumbing and Bénédicte de la Brière, April 2000
85 Intrahousehold Impact of Transfer of Modern Agricultural Technology: A Gender Perspective, Ruchira Tabassum Naved, April 2000
84 Intrahousehold Allocation and Gender Relations: New Empirical Evidence from Four Developing Countries, Agnes R. Quisumbing and John A. Maluccio, April 2000
83 Quality or Quantity? The Supply-Side Determinants of Primary Schooling in Rural Mozambique, Sudhanshu Handa and Kenneth R. Simler, March 2000
82 Pathways of Rural Development in Madagascar: An Empirical Investigation of the Critical Triangle of Environmental Sustainability, Economic Growth, and Poverty Alleviation, Manfred Zeller, Cécile Lapenu, Bart Minten, Eliane Ralison, Désiré Randrianaivo, and Claude Randrianarisoa, March 2000

FCND DISCUSSION PAPERS
81 The Constraints to Good Child Care Practices in Accra: Implications for Programs, Margaret Armar-Klemesu, Marie T. Ruel, Daniel G. Maxwell, Carol E. Levin, and Saul S. Morris, February 2000
80 Nontraditional Crops and Land Accumulation Among Guatemalan Smallholders: Is the Impact Sustainable? Calogero Carletto, February 2000
79 Adult Health in the Time of Drought, John Hoddinott and Bill Kinsey, January 2000
78 Determinants of Poverty in Mozambique: 1996-97, Gaurav Datt, Kenneth Simler, Sanjukta Mukherjee, and Gabriel Dava, January 2000
77 The Political Economy of Food Subsidy Reform in Egypt, Tammi Gutner, November 1999.
76 Raising Primary School Enrolment in Developing Countries: The Relative Importance of Supply and Demand, Sudhanshu Handa, November 1999
75 Determinants of Poverty in Egypt, 1997, Gaurav Datt and Dean Jolliffe, October 1999
74 Can Cash Transfer Programs Work in Resource-Poor Countries? The Experience in Mozambique, Jan W. Low, James L. Garrett, and Vitória Ginja, October 1999
73 Social Roles, Human Capital, and the Intrahousehold Division of Labor: Evidence from Pakistan, Marcel Fafchamps and Agnes R. Quisumbing, October 1999
72 Validity of Rapid Estimates of Household Wealth and Income for Health Surveys in Rural Africa, Saul S. Morris, Calogero Carletto, John Hoddinott, and Luc J. M. Christiaensen, October 1999
71 Social Capital and Income Generation in South Africa, 1993-98, John Maluccio, Lawrence Haddad, and Julian May, September 1999
70 Child Health Care Demand in a Developing Country: Unconditional Estimates from the Philippines, Kelly Hallman, August 1999
69 Supply Response of West African Agricultural Households: Implications of Intrahousehold Preference Heterogeneity, Lisa C. Smith and Jean-Paul Chavas, July 1999
68 Early Childhood Nutrition and Academic Achievement: A Longitudinal Analysis, Paul Glewwe, Hanan Jacoby, and Elizabeth King, May 1999
67 Determinants of Household Access to and Participation in Formal and Informal Credit Markets in Malawi, Aliou Diagne, April 1999
66 Working Women in an Urban Setting: Traders, Vendors, and Food Security in Accra, Carol E. Levin, Daniel G. Maxwell, Margaret Armar-Klemesu, Marie T. Ruel, Saul S. Morris, and Clement Ahiadeke, April 1999
65 Are Determinants of Rural and Urban Food Security and Nutritional Status Different? Some Insights from Mozambique, James L. Garrett and Marie T. Ruel, April 1999
64 Some Urban Facts of Life: Implications for Research and Policy, Marie T. Ruel, Lawrence Haddad, and James L. Garrett, April 1999
63 Are Urban Poverty and Undernutrition Growing? Some Newly Assembled Evidence, Lawrence Haddad, Marie T. Ruel, and James L. Garrett, April 1999
62 Good Care Practices Can Mitigate the Negative Effects of Poverty and Low Maternal Schooling on Children's Nutritional Status: Evidence from Accra, Marie T. Ruel, Carol E. Levin, Margaret Armar-Klemesu, Daniel Maxwell, and Saul S. Morris, April 1999
61 Does Geographic Targeting of Nutrition Interventions Make Sense in Cities? Evidence from Abidjan and Accra, Saul S. Morris, Carol Levin, Margaret Armar-Klemesu, Daniel Maxwell, and Marie T. Ruel, April 1999
60 Explaining Child Malnutrition in Developing Countries: A Cross-Country Analysis, Lisa C. Smith and Lawrence Haddad, April 1999
59 Placement and Outreach of Group-Based Credit Organizations: The Cases of ASA, BRAC, and PROSHIKA in Bangladesh, Manohar Sharma and Manfred Zeller, March 1999

FCND DISCUSSION PAPERS
58 Women's Land Rights in the Transition to Individualized Ownership: Implications for the Management of Tree Resources in Western Ghana, Agnes Quisumbing, Ellen Payongayong, J. B. Aidoo, and Keijiro Otsuka, February 1999
57 The Structure of Wages During the Economic Transition in Romania, Emmanuel Skoufias, February 1999
56 How Does the Human Rights Perspective Help to Shape the Food and Nutrition Policy Research Agenda?, Lawrence Haddad and Arne Oshaug, February 1999
55 Efficiency in Intrahousehold Resource Allocation, Marcel Fafchamps, December 1998
54 Endogeneity of Schooling in the Wage Function: Evidence from the Rural Philippines, John Maluccio, November 1998
53 Agricultural Wages and Food Prices in Egypt: A Governorate-Level Analysis for 1976-1993, Gaurav Datt and Jennifer Olmsted, November 1998
52 Testing Nash Bargaining Household Models With Time-Series Data, John Hoddinott and Christopher Adam, November 1998
51 Urban Challenges to Food and Nutrition Security: A Review of Food Security, Health, and Caregiving in the Cities, Marie T. Ruel, James L. Garrett, Saul S. Morris, Daniel Maxwell, Arne Oshaug, Patrice Engle, Purnima Menon, Alison Slack, and Lawrence Haddad, October 1998
50 Computational Tools for Poverty Measurement and Analysis, Gaurav Datt, October 1998
49 A Profile of Poverty in Egypt: 1997, Gaurav Datt, Dean Jolliffe, and Manohar Sharma, August 1998.
48 Human Capital, Productivity, and Labor Allocation in Rural Pakistan, Marcel Fafchamps and Agnes R. Quisumbing, July 1998
47 Poverty in India and Indian States: An Update, Gaurav Datt, July 1998
46 Impact of Access to Credit on Income and Food Security in Malawi, Aliou Diagne, July 1998
45 Does Urban Agriculture Help Prevent Malnutrition? Evidence from Kampala, Daniel Maxwell, Carol Levin, and Joanne Csete, June 1998
44 Can FAO's Measure of Chronic Undernourishment Be Strengthened?, Lisa C. Smith, with a Response by Logan Naiken, May 1998
43 How Reliable Are Group Informant Ratings? A Test of Food Security Rating in Honduras, Gilles Bergeron, Saul Sutkover Morris, and Juan Manuel Medina Banegas, April 1998
42 Farm Productivity and Rural Poverty in India, Gaurav Datt and Martin Ravallion, March 1998
41 The Political Economy of Urban Food Security in Sub-Saharan Africa, Dan Maxwell, February 1998
40 Can Qualitative and Quantitative Methods Serve Complementary Purposes for Policy Research? Evidence from Accra, Dan Maxwell, January 1998
39 Whose Education Matters in the Determination of Household Income: Evidence from a Developing Country, Dean Jolliffe, November 1997
38 Systematic Client Consultation in Development: The Case of Food Policy Research in Ghana, India, Kenya, and Mali, Suresh Chandra Babu, Lynn R. Brown, and Bonnie McClafferty, November 1997
37 Why Do Migrants Remit? An Analysis for the Dominican Sierra, Bénédicte de la Brière, Alain de Janvry, Sylvie Lambert, and Elisabeth Sadoulet, October 1997
36 The GAPVU Cash Transfer Program in Mozambique: An assessment, Gaurav Datt, Ellen Payongayong, James L. Garrett, and Marie Ruel, October 1997
35 Market Access by Smallholder Farmers in Malawi: Implications for Technology Adoption, Agricultural Productivity, and Crop Income, Manfred Zeller, Aliou Diagne, and Charles Mataya, September 1997
34 The Impact of Changes in Common Property Resource Management on Intrahousehold Allocation, Philip Maggs and John Hoddinott, September 1997
33 Human Milk—An Invisible Food Resource, Anne Hatløy and Arne Oshaug, August 1997

FCND DISCUSSION PAPERS
32 The Determinants of Demand for Micronutrients: An Analysis of Rural Households in Bangladesh, Howarth E. Bouis and Mary Jane G. Novenario-Reese, August 1997
31 Is There an Intrahousehold 'Flypaper Effect'? Evidence from a School Feeding Program, Hanan Jacoby, August 1997
30 Plant Breeding: A Long-Term Strategy for the Control of Zinc Deficiency in Vulnerable Populations, Marie T. Ruel and Howarth E. Bouis, July 1997
29 Gender, Property Rights, and Natural Resources, Ruth Meinzen-Dick, Lynn R. Brown, Hilary Sims Feldstein, and Agnes R. Quisumbing, May 1997
28 Developing a Research and Action Agenda for Examining Urbanization and Caregiving: Examples from Southern and Eastern Africa, Patrice L. Engle, Purnima Menon, James L. Garrett, and Alison Slack, April 1997
27 "Bargaining" and Gender Relations: Within and Beyond the Household, Bina Agarwal, March 1997
26 Why Have Some Indian States Performed Better Than Others at Reducing Rural Poverty?, Gaurav Datt and Martin Ravallion, March 1997
25 Water, Health, and Income: A Review, John Hoddinott, February 1997
24 Child Care Practices Associated with Positive and Negative Nutritional Outcomes for Children in Bangladesh: A Descriptive Analysis, Shubh K. Kumar Range, Ruchira Naved, and Saroj Bhattarai, February 1997
23 Better Rich, or Better There? Grandparent Wealth, Coresidence, and Intrahousehold Allocation, Agnes R. Quisumbing, January 1997
22 Alternative Approaches to Locating the Food Insecure: Qualitative and Quantitative Evidence from South India, Kimberly Chung, Lawrence Haddad, Jayashree Ramakrishna, and Frank Riely, January 1997
21 Livestock Income, Male/Female Animals, and Inequality in Rural Pakistan, Richard H. Adams, Jr., November 1996
20 Macroeconomic Crises and Poverty Monitoring: A Case Study for India, Gaurav Datt and Martin Ravallion, November 1996
19 Food Security and Nutrition Implications of Intrahousehold Bias: A Review of Literature, Lawrence Haddad, Christine Peña, Chizuru Nishida, Agnes Quisumbing, and Alison Slack, September 1996
18 Care and Nutrition: Concepts and Measurement, Patrice L. Engle, Purnima Menon, and Lawrence Haddad, August 1996
17 Remittances, Income Distribution, and Rural Asset Accumulation, Richard H. Adams, Jr., August 1996
16 How Can Safety Nets Do More with Less? General Issues with Some Evidence from Southern Africa, Lawrence Haddad and Manfred Zeller, July 1996
15 Repayment Performance in Group-Based credit Programs in Bangladesh: An Empirical Analysis, Manohar Sharma and Manfred Zeller, July 1996
14 Demand for High-Value Secondary Crops in Developing Countries: The Case of Potatoes in Bangladesh and Pakistan, Howarth E. Bouis and Gregory Scott, May 1996
13 Determinants of Repayment Performance in Credit Groups: The Role of Program Design, Intra-Group Risk Pooling, and Social Cohesion in Madagascar, Manfred Zeller, May 1996
12 Child Development: Vulnerability and Resilience, Patrice L. Engle, Sarah Castle, and Purnima Menon, April 1996
11 Rural Financial Policies for Food Security of the Poor: Methodologies for a Multicountry Research Project, Manfred Zeller, Akhter Ahmed, Suresh Babu, Sumiter Broca, Aliou Diagne, and Manohar Sharma, April 1996
10 Women's Economic Advancement Through Agricultural Change: A Review of Donor Experience, Christine Peña, Patrick Webb, and Lawrence Haddad, February 1996

FCND DISCUSSION PAPERS
9 Gender and Poverty: New Evidence from 10 Developing Countries, Agnes R. Quisumbing, Lawrence Haddad, and Christine Peña, December 1995
8 Measuring Food Insecurity: The Frequency and Severity of "Coping Strategies," Daniel G. Maxwell, December 1995
7 A Food Demand System Based on Demand for Characteristics: If There Is "Curvature" in the Slutsky Matrix, What Do the Curves Look Like and Why?, Howarth E. Bouis, December 1995
6 Gender Differentials in Farm Productivity: Implications for Household Efficiency and Agricultural Policy, Harold Alderman, John Hoddinott, Lawrence Haddad, and Christopher Udry, August 1995
5 Gender Differences in Agricultural Productivity: A Survey of Empirical Evidence, Agnes R. Quisumbing, July 1995
4 Market Development and Food Demand in Rural China, Jikun Huang and Scott Rozelle, June 1995
3 The Extended Family and Intrahousehold Allocation: Inheritance and Investments in Children in the Rural Philippines, Agnes R. Quisumbing, March 1995
2 Determinants of Credit Rationing: A Study of Informal Lenders and Formal Credit Groups in Madagascar, Manfred Zeller, October 1994
1 Agricultural Technology and Food Policy to Combat Iron Deficiency in Developing Countries, Howarth E. Bouis, August 1994