Embed Size (px)
Citation preview
HEALTHY PEOPLE 2020 MIDCOURSE REVIEW
CHAPTER 10
Early and Middle Childhood (EMC)
Lead AgenciesAdministration for Children and FamiliesCenters for Disease Control and PreventionHealth Resources and Services Administration
ContentsGoal 10–2Status of Objectives 10–2Figure 10–1. Midcourse Status of the Early and Middle Childhood Objectives 10–2Selected Findings 10–2More Information 10–3Footnotes 10–3Suggested Citation 10–4Table 10–1. Early and Middle Childhood Objectives 10–5Table 10–2. Midcourse Progress for Measurable Early and Middle Childhood Objectives 10–8Table 10–3. Midcourse Health Disparities for Population-based
Early and Middle Childhood Objectives 10–10Map 10–1. Children (0–5 years) Whose Family Read to Them Every Day,
by State: 2011–2012 10–11Map 10–2. Children (0–5 years) Whose Doctor Asked Their Parents About
Concerns Regarding the Child’s Development, by State: 2011–2012 10–12
10–2 HEALTHY PEOPLE 2020 MIDCOURSE REVIEW
Goal: Document and track population-based measures of health and well-being for early and middle childhood populations over time in the United States.
This chapter includes objectives that monitor positive parenting and school health education standards. The Reader’s Guide provides a step-by-step explanation of the content of this chapter, including criteria for highlighting objectives in the Selected Findings.1
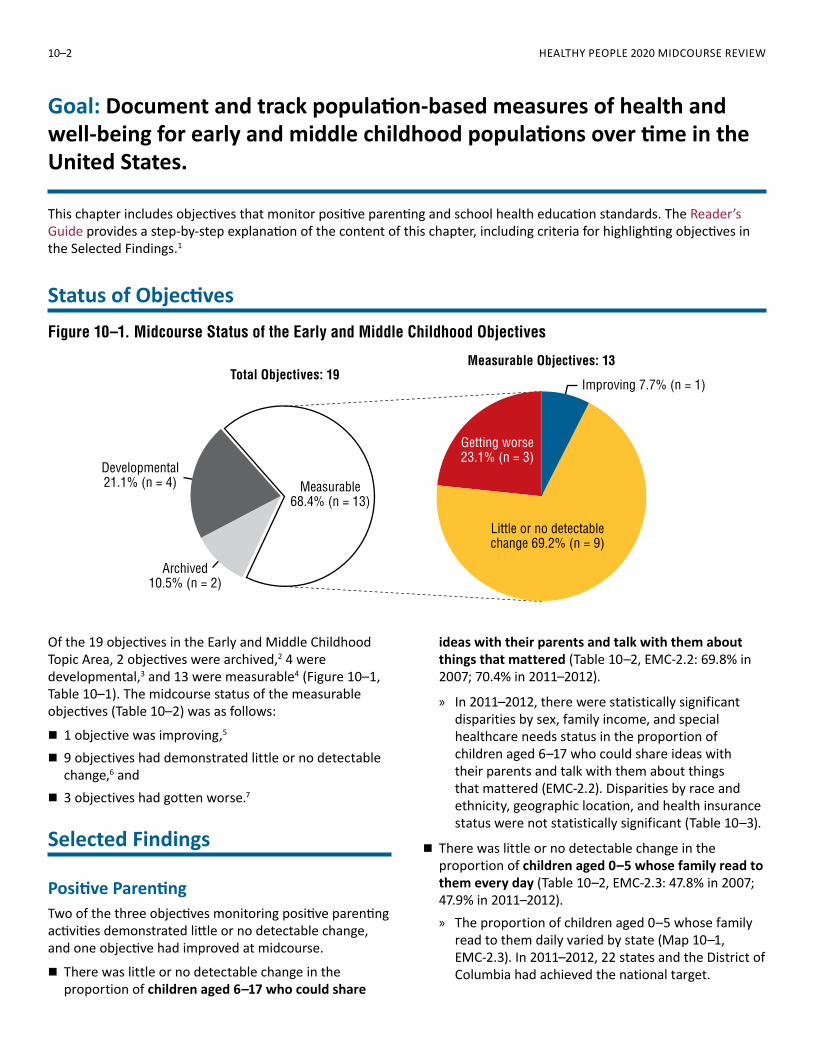
Status of ObjectivesFigure 10–1. Midcourse Status of the Early and Middle Childhood Objectives
Measurable Objectives: 13Total Objectives: 19
Measurable68.4% (n = 13)
Developmental21.1% (n = 4)
Archived10.5% (n = 2)
Improving 7.7% (n = 1)
Little or no detectablechange 69.2% (n = 9)
Getting worse23.1% (n = 3)
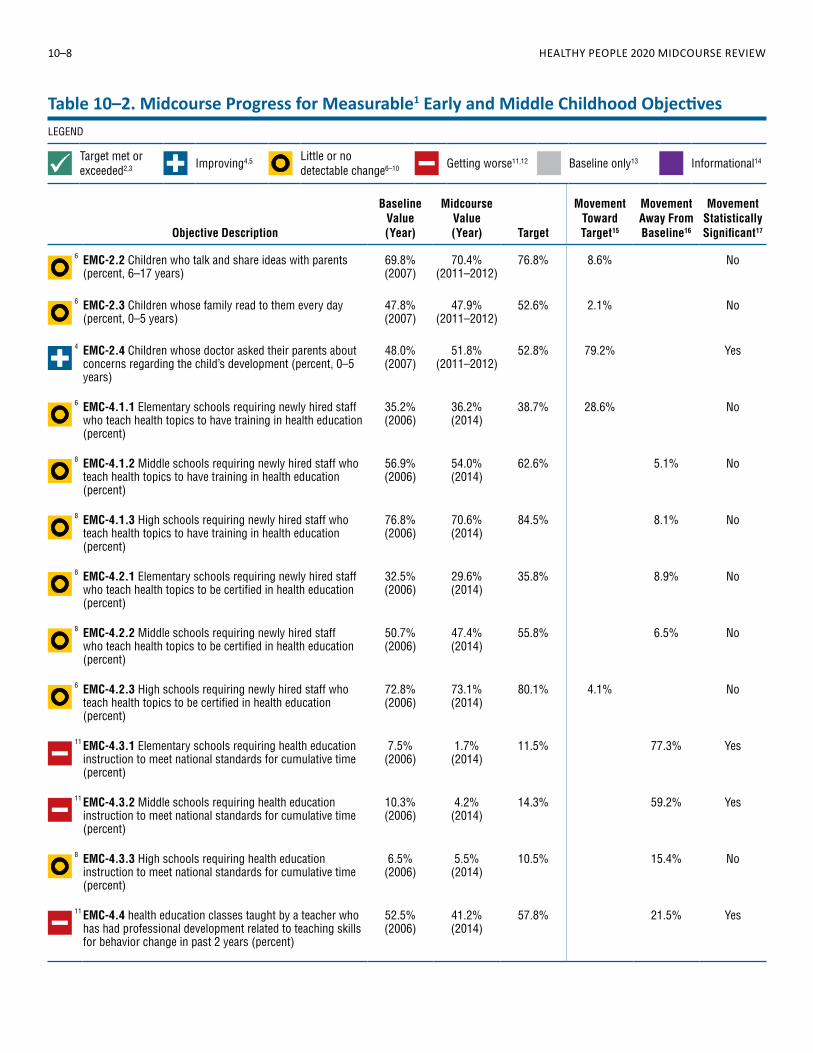
Of the 19 objectives in the Early and Middle Childhood Topic Area, 2 objectives were archived,2 4 were developmental,3 and 13 were measurable4 (Figure 10–1, Table 10–1). The midcourse status of the measurable objectives (Table 10–2) was as follows:
� 1 objective was improving,5
� 9 objectives had demonstrated little or no detectable change,6 and
� 3 objectives had gotten worse.7
Selected Findings
Positive ParentingTwo of the three objectives monitoring positive parenting activities demonstrated little or no detectable change, and one objective had improved at midcourse.
� There was little or no detectable change in the proportion of children aged 6–17 who could share
ideas with their parents and talk with them about things that mattered (Table 10–2, EMC-2.2: 69.8% in 2007; 70.4% in 2011–2012).
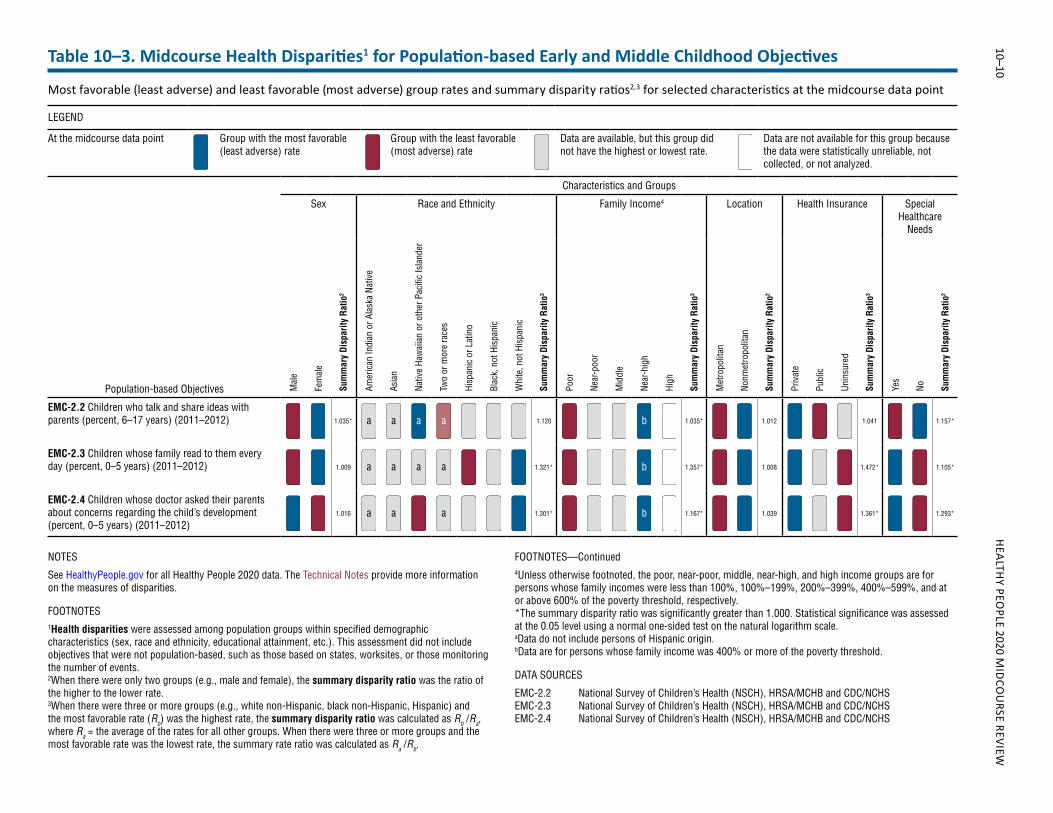
» In 2011–2012, there were statistically significant disparities by sex, family income, and special healthcare needs status in the proportion of children aged 6–17 who could share ideas with their parents and talk with them about things that mattered (EMC-2.2). Disparities by race and ethnicity, geographic location, and health insurance status were not statistically significant (Table 10–3).
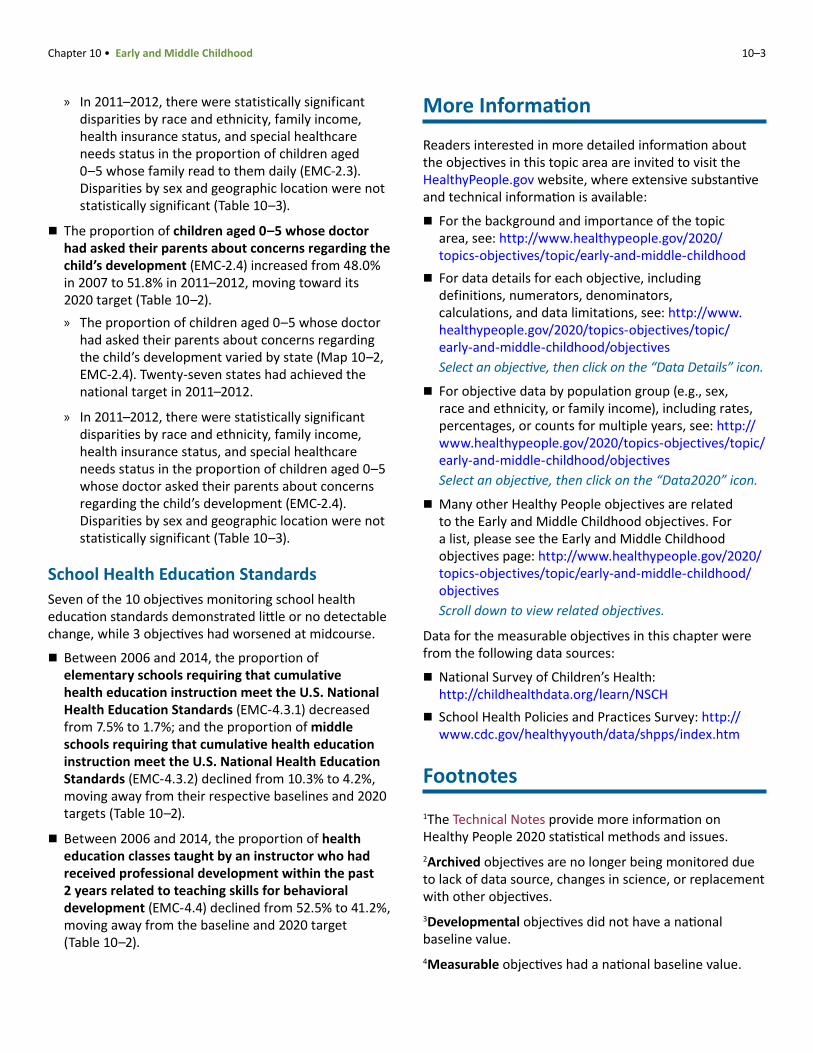
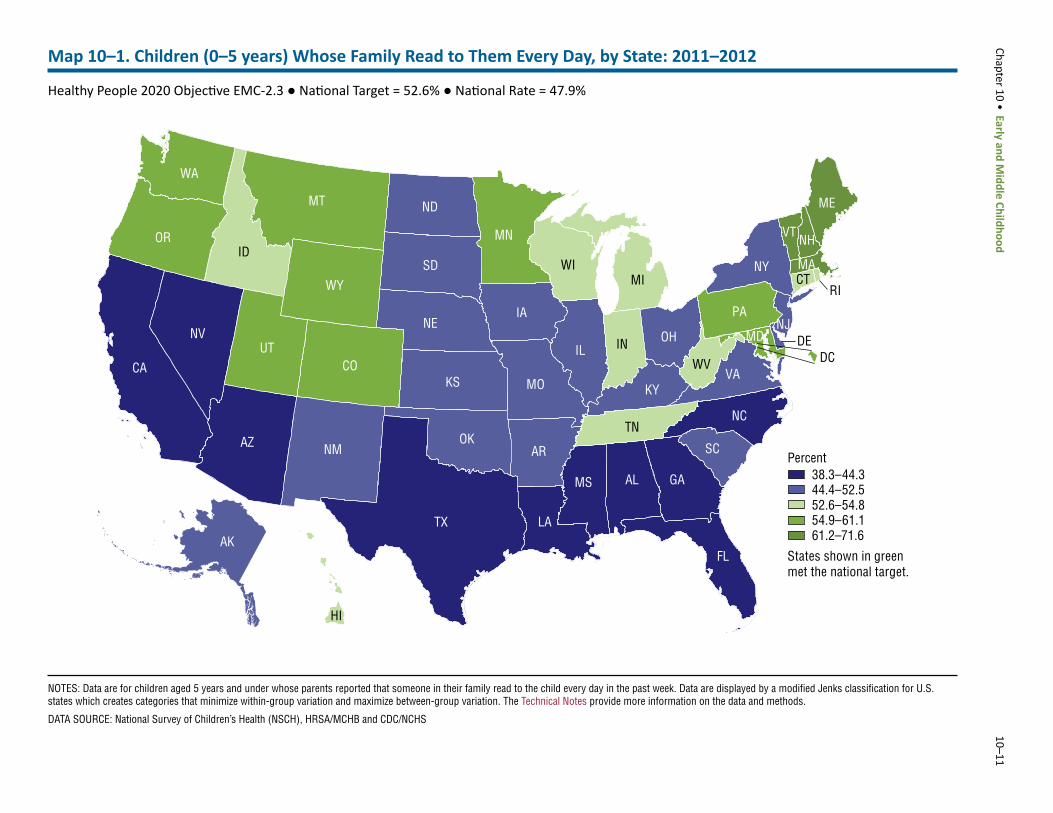
� There was little or no detectable change in the proportion of children aged 0–5 whose family read to them every day (Table 10–2, EMC-2.3: 47.8% in 2007; 47.9% in 2011–2012). » The proportion of children aged 0–5 whose family
read to them daily varied by state (Map 10–1, EMC-2.3). In 2011–2012, 22 states and the District of Columbia had achieved the national target.
Chapter 10 • Early and Middle Childhood 10–3
» In 2011–2012, there were statistically significant disparities by race and ethnicity, family income, health insurance status, and special healthcare needs status in the proportion of children aged 0–5 whose family read to them daily (EMC-2.3). Disparities by sex and geographic location were not statistically significant (Table 10–3).
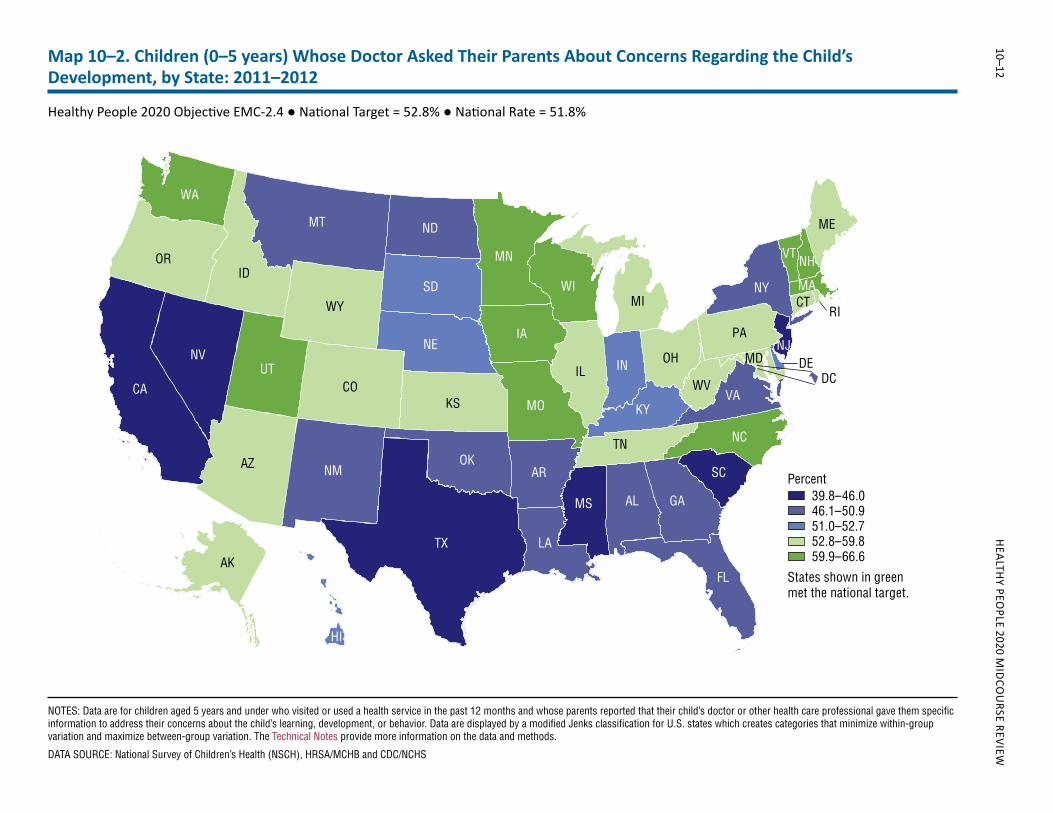
� The proportion of children aged 0–5 whose doctor had asked their parents about concerns regarding the child’s development (EMC-2.4) increased from 48.0% in 2007 to 51.8% in 2011–2012, moving toward its 2020 target (Table 10–2). » The proportion of children aged 0–5 whose doctor
had asked their parents about concerns regarding the child’s development varied by state (Map 10–2, EMC-2.4). Twenty-seven states had achieved the national target in 2011–2012.
» In 2011–2012, there were statistically significant disparities by race and ethnicity, family income, health insurance status, and special healthcare needs status in the proportion of children aged 0–5 whose doctor asked their parents about concerns regarding the child’s development (EMC-2.4). Disparities by sex and geographic location were not statistically significant (Table 10–3).
School Health Education StandardsSeven of the 10 objectives monitoring school health education standards demonstrated little or no detectable change, while 3 objectives had worsened at midcourse.
� Between 2006 and 2014, the proportion of elementary schools requiring that cumulative health education instruction meet the U.S. National Health Education Standards (EMC-4.3.1) decreased from 7.5% to 1.7%; and the proportion of middle schools requiring that cumulative health education instruction meet the U.S. National Health Education Standards (EMC-4.3.2) declined from 10.3% to 4.2%, moving away from their respective baselines and 2020 targets (Table 10–2).
� Between 2006 and 2014, the proportion of health education classes taught by an instructor who had received professional development within the past 2 years related to teaching skills for behavioral development (EMC-4.4) declined from 52.5% to 41.2%, moving away from the baseline and 2020 target (Table 10–2).
More Information
Readers interested in more detailed information about the objectives in this topic area are invited to visit the HealthyPeople.gov website, where extensive substantive and technical information is available:
� For the background and importance of the topic area, see: http://www.healthypeople.gov/2020/topics-objectives/topic/early-and-middle-childhood
� For data details for each objective, including definitions, numerators, denominators, calculations, and data limitations, see: http://www.healthypeople.gov/2020/topics-objectives/topic/early-and-middle-childhood/objectives Select an objective, then click on the “Data Details” icon.
� For objective data by population group (e.g., sex, race and ethnicity, or family income), including rates, percentages, or counts for multiple years, see: http://www.healthypeople.gov/2020/topics-objectives/topic/early-and-middle-childhood/objectivesSelect an objective, then click on the “Data2020” icon.
� Many other Healthy People objectives are related to the Early and Middle Childhood objectives. For a list, please see the Early and Middle Childhood objectives page: http://www.healthypeople.gov/2020/topics-objectives/topic/early-and-middle-childhood/objectivesScroll down to view related objectives.
Data for the measurable objectives in this chapter were from the following data sources:
� National Survey of Children’s Health: http://childhealthdata.org/learn/NSCH
� School Health Policies and Practices Survey: http://www.cdc.gov/healthyyouth/data/shpps/index.htm
Footnotes
1The Technical Notes provide more information on Healthy People 2020 statistical methods and issues.2Archived objectives are no longer being monitored due to lack of data source, changes in science, or replacement with other objectives.3Developmental objectives did not have a national baseline value.4Measurable objectives had a national baseline value.
10–4 HEALTHY PEOPLE 2020 MIDCOURSE REVIEW
5Improving—One of the following, as specified in the Midcourse Progress Table: » Movement was toward the target, standard errors
were available, and the percentage of targeted change achieved was statistically significant.
» Movement was toward the target, standard errors were not available, and the objective had achieved 10% or more of the targeted change.
6Little or no detectable change—One of the following, as specified in the Midcourse Progress Table: » Movement was toward the target, standard errors
were available, and the percentage of targeted change achieved was not statistically significant.
» Movement was toward the target, standard errors were not available, and the objective had achieved less than 10% of the targeted change.
» Movement was away from the baseline and target, standard errors were available, and the percentage change relative to the baseline was not statistically significant.
» Movement was away from the baseline and target, standard errors were not available, and the objective had moved less than 10% relative to the baseline.
» There was no change between the baseline and the midcourse data point.
7Getting worse—One of the following, as specified in the Midcourse Progress Table: » Movement was away from the baseline and target,
standard errors were available, and the percentage change relative to the baseline was statistically significant.
» Movement was away from the baseline and target, standard errors were not available, and the objective had moved 10% or more relative to the baseline.
Suggested Citation
National Center for Health Statistics. Chapter 10: Early and Middle Childhood. Healthy People 2020 Midcourse Review. Hyattsville, MD. 2016.
Chapter 10 • Early and Middle Childhood 10–5
Objective Number Objective Statement Data Sources
Midcourse Data Availability
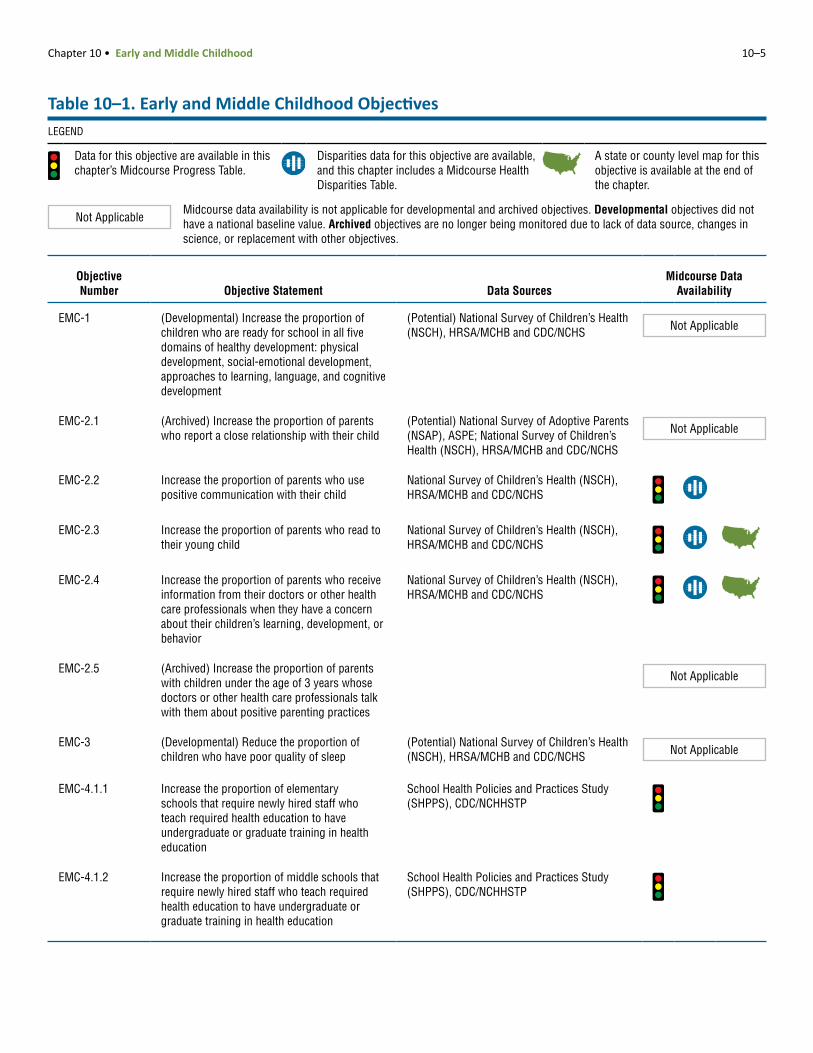
EMC-1 (Developmental) Increase the proportion of children who are ready for school in all five domains of healthy development: physical development, social-emotional development, approaches to learning, language, and cognitive development
(Potential) National Survey of Children’s Health (NSCH), HRSA/MCHB and CDC/NCHS Not Applicable
EMC-2.1 (Archived) Increase the proportion of parents who report a close relationship with their child
(Potential) National Survey of Adoptive Parents (NSAP), ASPE; National Survey of Children’s Health (NSCH), HRSA/MCHB and CDC/NCHS
Not Applicable
EMC-2.2 Increase the proportion of parents who use positive communication with their child
National Survey of Children’s Health (NSCH), HRSA/MCHB and CDC/NCHS
EMC-2.3 Increase the proportion of parents who read to their young child
National Survey of Children’s Health (NSCH), HRSA/MCHB and CDC/NCHS
EMC-2.4 Increase the proportion of parents who receive information from their doctors or other health care professionals when they have a concern about their children’s learning, development, or behavior
National Survey of Children’s Health (NSCH), HRSA/MCHB and CDC/NCHS
EMC-2.5 (Archived) Increase the proportion of parents with children under the age of 3 years whose doctors or other health care professionals talk with them about positive parenting practices
Not Applicable
EMC-3 (Developmental) Reduce the proportion of children who have poor quality of sleep
(Potential) National Survey of Children’s Health (NSCH), HRSA/MCHB and CDC/NCHS Not Applicable
EMC-4.1.1 Increase the proportion of elementary schools that require newly hired staff who teach required health education to have undergraduate or graduate training in health education
School Health Policies and Practices Study (SHPPS), CDC/NCHHSTP
EMC-4.1.2 Increase the proportion of middle schools that require newly hired staff who teach required health education to have undergraduate or graduate training in health education
School Health Policies and Practices Study (SHPPS), CDC/NCHHSTP
Table 10–1. Early and Middle Childhood ObjectivesLEGEND
Data for this objective are available in this chapter’s Midcourse Progress Table.
Disparities data for this objective are available, and this chapter includes a Midcourse Health Disparities Table.
A state or county level map for this objective is available at the end of the chapter.
Not ApplicableMidcourse data availability is not applicable for developmental and archived objectives. Developmental objectives did not have a national baseline value. Archived objectives are no longer being monitored due to lack of data source, changes in science, or replacement with other objectives.
10–6 HEALTHY PEOPLE 2020 MIDCOURSE REVIEW
Objective Number Objective Statement Data Sources
Midcourse Data Availability
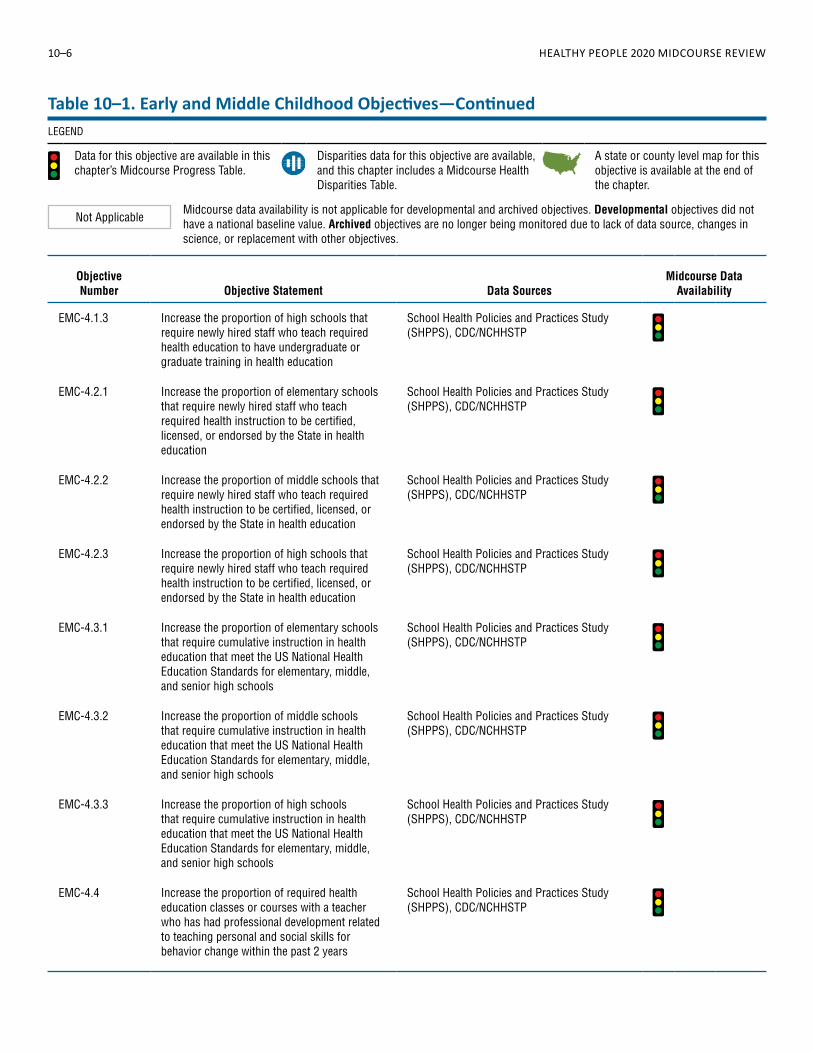
EMC-4.1.3 Increase the proportion of high schools that require newly hired staff who teach required health education to have undergraduate or graduate training in health education
School Health Policies and Practices Study (SHPPS), CDC/NCHHSTP
EMC-4.2.1 Increase the proportion of elementary schools that require newly hired staff who teach required health instruction to be certified, licensed, or endorsed by the State in health education
School Health Policies and Practices Study (SHPPS), CDC/NCHHSTP
EMC-4.2.2 Increase the proportion of middle schools that require newly hired staff who teach required health instruction to be certified, licensed, or endorsed by the State in health education
School Health Policies and Practices Study (SHPPS), CDC/NCHHSTP
EMC-4.2.3 Increase the proportion of high schools that require newly hired staff who teach required health instruction to be certified, licensed, or endorsed by the State in health education
School Health Policies and Practices Study (SHPPS), CDC/NCHHSTP
EMC-4.3.1 Increase the proportion of elementary schools that require cumulative instruction in health education that meet the US National Health Education Standards for elementary, middle, and senior high schools
School Health Policies and Practices Study (SHPPS), CDC/NCHHSTP
EMC-4.3.2 Increase the proportion of middle schools that require cumulative instruction in health education that meet the US National Health Education Standards for elementary, middle, and senior high schools
School Health Policies and Practices Study (SHPPS), CDC/NCHHSTP
EMC-4.3.3 Increase the proportion of high schools that require cumulative instruction in health education that meet the US National Health Education Standards for elementary, middle, and senior high schools
School Health Policies and Practices Study (SHPPS), CDC/NCHHSTP
EMC-4.4 Increase the proportion of required health education classes or courses with a teacher who has had professional development related to teaching personal and social skills for behavior change within the past 2 years
School Health Policies and Practices Study (SHPPS), CDC/NCHHSTP
Table 10–1. Early and Middle Childhood Objectives—ContinuedLEGEND
Data for this objective are available in this chapter’s Midcourse Progress Table.
Disparities data for this objective are available, and this chapter includes a Midcourse Health Disparities Table.
A state or county level map for this objective is available at the end of the chapter.
Not ApplicableMidcourse data availability is not applicable for developmental and archived objectives. Developmental objectives did not have a national baseline value. Archived objectives are no longer being monitored due to lack of data source, changes in science, or replacement with other objectives.
Chapter 10 • Early and Middle Childhood 10–7
Objective Number Objective Statement Data Sources
Midcourse Data Availability
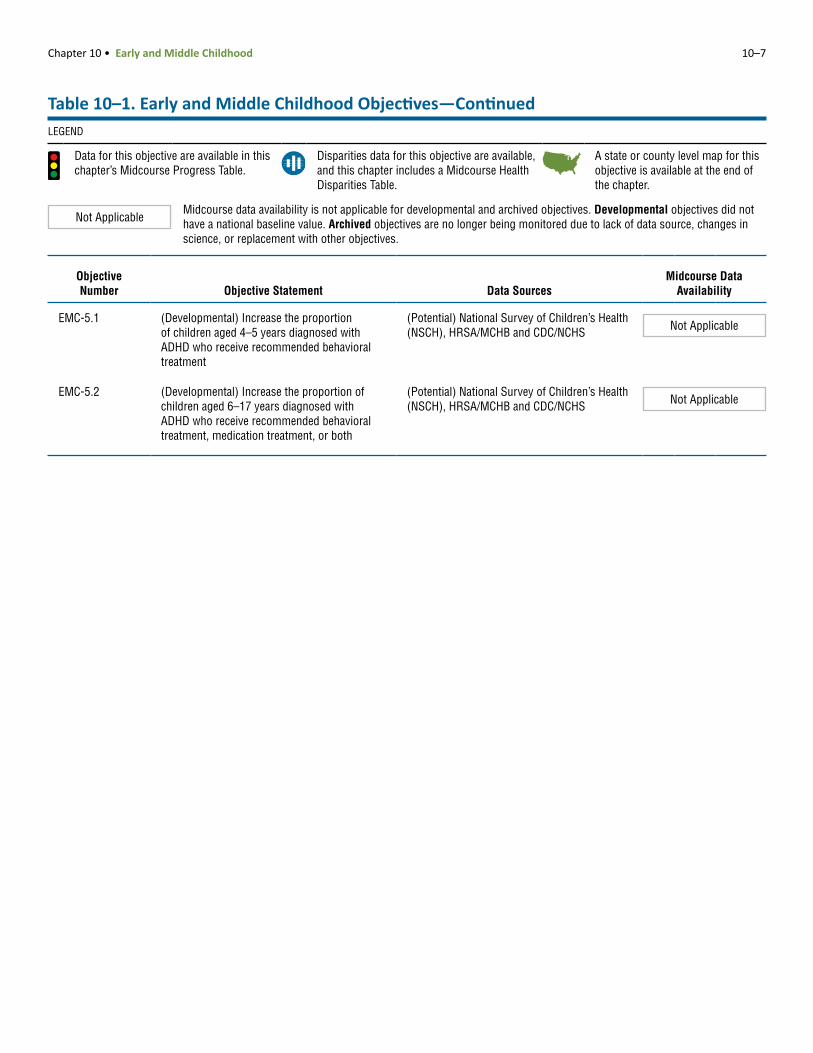
EMC-5.1 (Developmental) Increase the proportion of children aged 4–5 years diagnosed with ADHD who receive recommended behavioral treatment
(Potential) National Survey of Children’s Health (NSCH), HRSA/MCHB and CDC/NCHS Not Applicable
EMC-5.2 (Developmental) Increase the proportion of children aged 6–17 years diagnosed with ADHD who receive recommended behavioral treatment, medication treatment, or both
(Potential) National Survey of Children’s Health (NSCH), HRSA/MCHB and CDC/NCHS Not Applicable
Table 10–1. Early and Middle Childhood Objectives—ContinuedLEGEND
Data for this objective are available in this chapter’s Midcourse Progress Table.
Disparities data for this objective are available, and this chapter includes a Midcourse Health Disparities Table.
A state or county level map for this objective is available at the end of the chapter.
Not ApplicableMidcourse data availability is not applicable for developmental and archived objectives. Developmental objectives did not have a national baseline value. Archived objectives are no longer being monitored due to lack of data source, changes in science, or replacement with other objectives.
10–8 HEALTHY PEOPLE 2020 MIDCOURSE REVIEW
Objective Description
Baseline Value (Year)
Midcourse Value (Year) Target
Movement Toward Target15
Movement Away From Baseline16
Movement Statistically Significant17
6 EMC-2.2 Children who talk and share ideas with parents (percent, 6–17 years)
69.8% (2007)
70.4% (2011–2012)
76.8% 8.6% No
6 EMC-2.3 Children whose family read to them every day (percent, 0–5 years)
47.8% (2007)
47.9% (2011–2012)
52.6% 2.1% No
4 EMC-2.4 Children whose doctor asked their parents about concerns regarding the child’s development (percent, 0–5 years)
48.0% (2007)
51.8% (2011–2012)
52.8% 79.2% Yes
6 EMC-4.1.1 Elementary schools requiring newly hired staff who teach health topics to have training in health education (percent)
35.2% (2006)
36.2% (2014)
38.7% 28.6% No
8 EMC-4.1.2 Middle schools requiring newly hired staff who teach health topics to have training in health education (percent)
56.9% (2006)
54.0% (2014)
62.6% 5.1%
No
8 EMC-4.1.3 High schools requiring newly hired staff who teach health topics to have training in health education (percent)
76.8% (2006)
70.6% (2014)
84.5% 8.1%
No
8 EMC-4.2.1 Elementary schools requiring newly hired staff who teach health topics to be certified in health education (percent)
32.5% (2006)
29.6% (2014)
35.8% 8.9%
No
8 EMC-4.2.2 Middle schools requiring newly hired staff who teach health topics to be certified in health education (percent)
50.7% (2006)
47.4% (2014)
55.8% 6.5%
No
6 EMC-4.2.3 High schools requiring newly hired staff who teach health topics to be certified in health education (percent)
72.8% (2006)
73.1% (2014)
80.1% 4.1% No
11 EMC-4.3.1 Elementary schools requiring health education instruction to meet national standards for cumulative time (percent)
7.5% (2006)
1.7% (2014)
11.5% 77.3%
Yes
11 EMC-4.3.2 Middle schools requiring health education instruction to meet national standards for cumulative time (percent)
10.3% (2006)
4.2% (2014)
14.3% 59.2%
Yes
8 EMC-4.3.3 High schools requiring health education instruction to meet national standards for cumulative time (percent)
6.5% (2006)
5.5% (2014)
10.5% 15.4%
No
11 EMC-4.4 health education classes taught by a teacher who has had professional development related to teaching skills for behavior change in past 2 years (percent)
52.5% (2006)
41.2% (2014)
57.8% 21.5%
Yes
Table 10–2. Midcourse Progress for Measurable1 Early and Middle Childhood ObjectivesLEGEND
Target met or exceeded2,3 Improving4,5 Little or no
detectable change6–10 Getting worse11,12 Baseline only13
Informational14
Chapter 10 • Early and Middle Childhood 10–9
Table 10–2. Midcourse Progress for Measurable1 Early and Middle Childhood Objectives—Continued
NOTES
See HealthyPeople.gov for all Healthy People 2020 data. The Technical Notes provide more information on the measures of progress.
FOOTNOTES1Measurable objectives had a national baseline value.Target met or exceeded:
2At baseline the target was not met or exceeded and the midcourse value was equal to or exceeded the target. (The percentage of targeted change achieved was equal to or greater than 100%.)3The baseline and midcourse values were equal to or exceeded the target. (The percentage of targeted change achieved was not assessed.)
Improving:4Movement was toward the target, standard errors were available, and the percentage of targeted change achieved was statistically significant.5Movement was toward the target, standard errors were not available, and the objective had achieved 10% or more of the targeted change.
Little or no detectable change:6Movement was toward the target, standard errors were available, and the percentage of targeted change achieved was not statistically significant.7Movement was toward the target, standard errors were not available, and the objective had achieved less than 10% of the targeted change.8Movement was away from the baseline and target, standard errors were available, and the percentage change relative to the baseline was not statistically significant.9Movement was away from the baseline and target, standard errors were not available, and the objective had moved less than 10% relative to the baseline.10There was no change between the baseline and the midcourse data point.
Getting worse:11Movement was away from the baseline and target, standard errors were available, and the percentage change relative to the baseline was statistically significant.12Movement was away from the baseline and target, standard errors were not available, and the objective had moved 10% or more relative to the baseline.
13Baseline only: The objective only had one data point, so progress toward target attainment could not be assessed.14Informational: A target was not set for this objective, so progress toward target attainment could not be assessed.
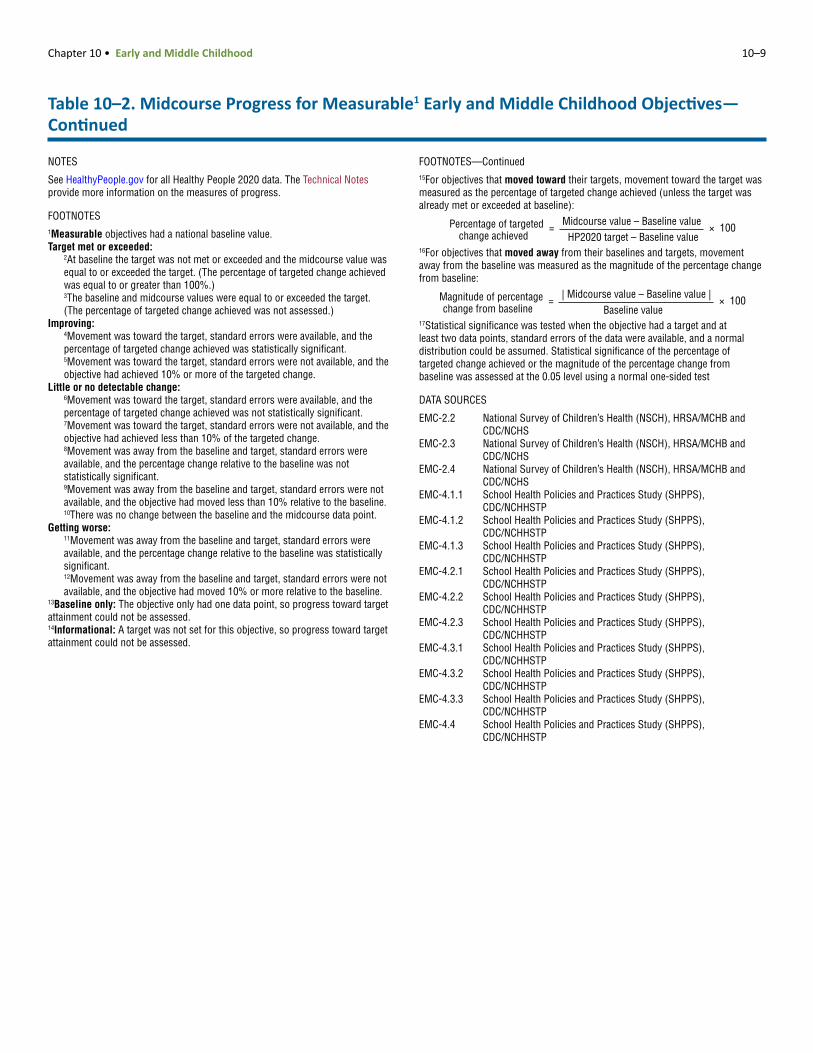
FOOTNOTES—Continued15For objectives that moved toward their targets, movement toward the target was measured as the percentage of targeted change achieved (unless the target was already met or exceeded at baseline):
Percentage of targeted = Midcourse value – Baseline value
× 100change achieved HP2020 target – Baseline value
16For objectives that moved away from their baselines and targets, movement away from the baseline was measured as the magnitude of the percentage change from baseline:
Magnitude of percentage = | Midcourse value – Baseline value |
× 100change from baseline Baseline value
17Statistical significance was tested when the objective had a target and at least two data points, standard errors of the data were available, and a normal distribution could be assumed. Statistical significance of the percentage of targeted change achieved or the magnitude of the percentage change from baseline was assessed at the 0.05 level using a normal one-sided test
DATA SOURCES
EMC-2.2 National Survey of Children’s Health (NSCH), HRSA/MCHB and CDC/NCHS
EMC-2.3 National Survey of Children’s Health (NSCH), HRSA/MCHB and CDC/NCHS
EMC-2.4 National Survey of Children’s Health (NSCH), HRSA/MCHB and CDC/NCHS
EMC-4.1.1 School Health Policies and Practices Study (SHPPS), CDC/NCHHSTP
EMC-4.1.2 School Health Policies and Practices Study (SHPPS), CDC/NCHHSTP
EMC-4.1.3 School Health Policies and Practices Study (SHPPS), CDC/NCHHSTP
EMC-4.2.1 School Health Policies and Practices Study (SHPPS), CDC/NCHHSTP
EMC-4.2.2 School Health Policies and Practices Study (SHPPS), CDC/NCHHSTP
EMC-4.2.3 School Health Policies and Practices Study (SHPPS), CDC/NCHHSTP
EMC-4.3.1 School Health Policies and Practices Study (SHPPS), CDC/NCHHSTP
EMC-4.3.2 School Health Policies and Practices Study (SHPPS), CDC/NCHHSTP
EMC-4.3.3 School Health Policies and Practices Study (SHPPS), CDC/NCHHSTP
EMC-4.4 School Health Policies and Practices Study (SHPPS), CDC/NCHHSTP
10–10 H
EALTHY PEO
PLE 2020 MID
COU
RSE REVIEW
Population-based Objectives
Sex Race and Ethnicity on Health Insurance Special Healthcare
Needs
Mal
e
Fem
ale
Sum
mar
y Di
spar
ity R
atio
2
Amer
ican
Indi
an o
r Ala
ska
Nativ
e
Asia
n
Nativ
e Ha
wai
ian
or o
ther
Pac
ific
Isla
nder
Two
or m
ore
race
s
Hisp
anic
or L
atin
o
Blac
k, n
ot H
ispa
nic
Whi
te, n
ot H
ispa
nic
3
Sum
mar
y Di
spar
ity R
atio
2
Priv
ate
Publ
ic
Unin
sure
d
Sum
mar
y Di
spar
ity R
atio
3
Yes
No Sum
mar
y Di
spar
ity R
atio
2
EMC-2.2 Children who talk and share ideas with parents (percent, 6–17 years) (2011–2012) 1.035* a a a a 1.12 1.012 1.041 1.157*
EMC-2.3 Children whose family read to them every day (percent, 0–5 years) (2011–2012) 1.009 a a a a 1.32 1.008 1.472* 1.105*
EMC-2.4 Children whose doctor asked their parents about concerns regarding the child’s development (percent, 0–5 years) (2011–2012)
1.016 a a a 1.30 1.039 1.361* 1.293*
Table 10–3. Midcourse Health Disparities1 for Population-based Early and Middle Childhood Objectives
Most favorable (least adverse) and least favorable (most adverse) group rates and summary eristics at the midcourse data point
LEGEND
At the midcourse data point Group with the most favorable (least adverse) rate
Group with the least favorable (most adverse) rate
Data are not available for this group because the data were statistically unreliable, not collected, or not analyzed.
NOTES
See HealthyPeople.gov for all Healthy People 2020 data. The Technical Notes provide more information on the measures of disparities.
FOOTNOTES1Health disparities were assessed among population groups within specified demographic characteristics (sex, race and ethnicity, educational attainment, etc.). This assessment did not include objectives that were not population-based, such as those based on states, worksites, or those monitoring the number of events.2When there were only two groups (e.g., male and female), the summary disparity ratio was the ratio of the higher to the lower rate. 3When there were three or more groups (e.g., white non-Hispanic, black non-Hispanic, Hispanic) and the most favorable rate (Rb) was the highest rate, the summary disparity ratio was calculated as Rb /Ra, where Ra = the average of the rates for all other groups. When there were three or more groups and the most favorable rate was the lowest rate, the summary rate ratio was calculated as Ra /Rb.
FOOTNO4Unless igh, and high income groups are for persons 9%, 200%–399%, 400%–599%, and at or abov*The su 0. Statistical significance was assessed at the 0 arithm scale.aData dobData ar of the poverty threshold.
DATA S
EMC-2. SA/MCHB and CDC/NCHSEMC-2. SA/MCHB and CDC/NCHSEMC-2. SA/MCHB and CDC/NCHS
TES—Continued
otherwise footnoted, the poor, near-poor, middle, near-h whose family incomes were less than 100%, 100%–19e 600% of the poverty threshold, respectively.mmary disparity ratio was significantly greater than 1.00.05 level using a normal one-sided test on the natural log not include persons of Hispanic origin.e for persons whose family income was 400% or more
OURCES
2 National Survey of Children’s Health (NSCH), HR3 National Survey of Children’s Health (NSCH), HR4 National Survey of Children’s Health (NSCH), HR
Characteristics and Groups
Family Income4 Locati
Sum
mar
y Di
spar
ity R
atio
Poor
Near
-poo
r
Mid
dle
Near
-hig
h
High
Sum
mar
y Di
spar
ity R
atio
3
Met
ropo
litan
Nonm
etro
polit
an
0 b 1.035*
1* b 1.357*
1* b 1.167*
disparity ratios2,3 for selected charact
Data are available, but this group did not have the highest or lowest rate.
Chapter 10 • Early and Middle Childhood
10–11Map 10–1. Children (0–5 years) Whose Family Read to Them Every Day, by State: 2011–2012
Healthy People 2020 Objective EMC-2.3 ● National Target = 52.6% ● National Rate = 47.9%
NOTES: Data are for children aged 5 years and under whose parents reported that someone in their family read to the child every day in the past week. Data are displayed by a modified Jenks classification for U.S. states which creates categories that minimize within-group variation and maximize between-group variation. The Technical Notes provide more information on the data and methods.
DATA SOURCE: National Survey of Children’s Health (NSCH), HRSA/MCHB and CDC/NCHS
Percent
States shown in greenmet the national target.
38.3–44.3 44.4–52.5 52.6–54.8 54.9–61.1 61.2–71.6
MT
ID
CO
OR
UT
WY
MN
WI
WA
MI
IN
PA
TN
ME
WV
VTNH
CT
HI
RI
DEMDNJ
DC
MA
TX
CA
AZ
NV
NM
IL
KS
IANE
SD
ND
FL
OK
MO
GAAL
AR
LA
NY
NC
MS
VAKY
OH
SC
AK
10–12 H
EALTHY PEO
PLE 2020 MID
COU
RSE REVIEWMap 10–2. Children (0–5 years) Whose Doctor Asked Their Parents About Concerns Regarding the Child’s Development, by State: 2011–2012
Healthy People 2020 Objective EMC-2.4 ● National Target = 52.8% ● National Rate = 51.8%
NOTES: Data are for children aged 5 years and under who visited or used a health service in the past 12 months and whose parents reported that their child’s doctor or other health care professional gave them specific information to address their concerns about the child’s learning, development, or behavior. Data are displayed by a modified Jenks classification for U.S. states which creates categories that minimize within-group variation and maximize between-group variation. The Technical Notes provide more information on the data and methods.
DATA SOURCE: National Survey of Children’s Health (NSCH), HRSA/MCHB and CDC/NCHS
Percent
States shown in greenmet the national target.
39.8–46.046.1–50.951.0–52.752.8–59.859.9–66.6
MT
ID
CO
OR
UT
WY
MN
WI
WA
MI
IN
PA
TN
WV
CT
HI
ME
MA
VTNH
RI
DEMDNJ
DC
TX
CA
AZ
NV
NM
IL
KS
IANE
SD
ND
FL
OK
MO
GAAL
AR
LA
NY
NC
MS
VAKY
OH
SC
AK