Embed Size (px)
Citation preview
Early Age Characterization and Microstructural Features of Sustainable Binder Systems
for Concrete
by
Kirk Vance
A Dissertation Presented in Partial Fulfillment
of the Requirements for the Degree
Doctor of Philosophy
Approved May 2014 by the
Graduate Supervisory Committee:
Narayanan Neithalath, Chair
Barzin Mobasher
Subramaniam Rajan
Nikhilesh Chawla
Robert Marzke
ARIZONA STATE UNIVERSITY
August 2014
i
ABSTRACT
Concrete is the most widely used infrastructure material worldwide. Production of portland
cement, the main binding component in concrete, has been shown to require significant
energy and account for approximately 5-7% of global carbon dioxide production. The
expected continued increased use of concrete over the coming decades indicates this is an
ideal time to implement sustainable binder technologies. The current work aims to explore
enhanced sustainability concretes, primarily in the context of limestone and flow. Aspects
such as hydration kinetics, hydration product formation and pore structure add to the
understanding of the strength development and potential durability characteristics of these
binder systems.
Two main strategies for enhancing this sustainability are explored in this work: (i) the use
of high volume limestone in combination with other alternative cementitious materials to
decrease the portland cement quantity in concrete and (ii) the use of geopolymers as the
binder phase in concrete. The first phase of the work investigates the use of fine limestone
as cement replacement from the perspective of hydration, strength development, and pore
structure. The nature of the potential synergistic benefit of limestone and alumina will be
explored. The second phase will focus on the rheological characterization of these
materials in the fresh state, as well as a more general investigation of the rheological
characterization of suspensions.
The results of this work indicate several key ideas. (i) There is a potential synergistic
benefit for strength, hydration, and pore structure by using alumina and in portland
limestone cements, (ii) the limestone in these systems is shown to react to some extent,
and fine limestone is shown to accelerate hydration, (iii) rheological characteristics of
ii
cementitious suspensions are complex, and strongly dependent on several key parameters
including: the solid loading, interparticle forces, surface area of the particles present,
particle size distribution of the particles, and rheological nature of the media in which the
particles are suspended, and (iv) stress plateau method is proposed for the determination of
rheological properties of concentrated suspensions, as it more accurately predicts apparent
yield stress and is shown to correlate well with other viscoelastic properties of the
suspensions.

iii
To Asha, for her support, encouragement and understanding

iv
ACKNOWLEDGEMENTS
The completion of this dissertation would not have been possible without the support and
assistance of many friends and colleagues. Firstly I would like to thank my family: Asha,
my mother, my father, and sister for all of their support, encouragement and assistance
throughout.
I would further like to gratefully acknowledge the guidance, support and motivation offered
by my advisor, Prof. Neithalath without whom this dissertation surely would not have been
possible. I would additionally like to thank my committee members: Profs. Rajan,
Mobasher, Marzke, and Chawla for dedicating their time and guidance to this work.
I would additionally like to thank the many with whom I worked on this project.
Specifically I am grateful to those that directly contributed to this work: Matthew Aguayo,
Akash Dakhane, and Aashay Arora. I would like to also acknowledge the other students
who helped along the way: Deepak, Sundar, Sumanta, Ben, Vikram, Ussala, Kingsten,
Sateesh, Pu, and Breeann.
I would further like to thank the laboratory support staff: Kenneth Witczak and Peter
Goguen for all their assistance throughout this project.
Finally, I would like to thank the National Science Foundation and the Ira A. Fulton
Schools of Engineering Dean’s Fellowship for the financial support provided which
enabled the completion of this project.
v
TABLE OF CONTENTS
Page
LIST OF TABLES….………………………………………………………………… xiv
LIST OF FIGURES…………………………………………………………………… xvi
CHAPTER
1. INTRODUCTION ....................................................................................................1
1.1 Objectives ..........................................................................................................2
1.2 Dissertation Layout............................................................................................3
2. LITERATURE REVIEW .........................................................................................6
2.1 Limestone as Cement Replacement Material ....................................................6
2.1.1 Overview and Background .........................................................................6
2.1.2 Influence of Limestone on Cement Hydration ...........................................8
2.1.3 Influence of Limestone on Mechanical Properties ...................................14
2.1.4 Influence of Limestone on Durability ......................................................16
2.2 Rheology of Cementitious Suspensions ..........................................................19
2.2.1 Overview and Background .......................................................................19
2.2.2 The Rheology of Suspensions ..................................................................20
2.2.3 Rheology and Flow of Fresh Cement and Concrete ................................24
2.2.4 Rheology of Alkali Activated Geopolymer Suspensions .........................27
3. MATERIALS AND EXPERIMENTAL METHODS ............................................29
vi
CHAPTER Page
3.1 Materials ..........................................................................................................29
3.2 Experimental Methods .....................................................................................29
3.3 Curing Conditions and Mixing for Tests on Hardened Cement Pastes ...........29
3.3.1 Isothermal Calorimetry ............................................................................30
3.3.2 Simultaneous Thermal Analysis (STA/TGA) ..........................................31
3.3.3 Mercury Intrusion Porosimetry ................................................................32
3.3.4 Rheology ..................................................................................................34
4. HYDRATION AND STRENGTH DEVELOPMENT IN TERNARY PORTLAND
CEMENT BLENDS CONTAINING LIMESTONE AND FLY ASH OR
METAKAOLIN..............................................................................................................37
4.1 Introduction .....................................................................................................37
4.2 Experimental Program .....................................................................................39
4.2.1 Materials and Mixture Proportions ..........................................................39
4.2.2 Experimental Methods .............................................................................41
4.3 Results and Discussions...................................................................................42
4.3.1 Early-Age Behavior of Binary and Ternary Cementitious Pastes............42
4.3.1.1 Effect of limestone fineness and dosage on the progress of reactions .42
4.3.1.2 Influence of fly ash and metakaolin replacements on the progress of
reactions ………….. ...........................................................................................47
vii
CHAPTER Page
4.3.1.3 Progress of reactions in fly ash/metakaolin containing limestone
containing pastes……………………………………………………………... 50
4.3.2 Compressive Strength Development ........................................................55
4.3.3 Thermal Analysis of Pastes: Influence of Limestone and Fly
Ash/Metakaolin .......................................................................................................57
4.3.3.1 Analysis of TG and DTG Curves .........................................................57
4.3.3.2 Bound Water and CH Contents ............................................................62
4.4 Conclusions .....................................................................................................65
5. COMPARATIVE INVESTIGATION OF TERNARY LIMESTONE AND FLY
ASH OR METAKAOLIN BLENDED CEMENT PASTE MICROSTRUCTURE VIA
MERCURY INTRUSION POROSIMETRY .................................................................68
5.1 Introduction .....................................................................................................68
5.2 Experimental Program .....................................................................................70
5.2.1 Materials ...................................................................................................70
5.2.2 Experimental Parameters..........................................................................73
5.2.3 Experimental Design ................................................................................76
5.3 Results and Discussions...................................................................................77
5.3.1 Influence of limestone replacement ratio and fineness on pore structure 77
5.3.2 Influences of alumina addition on the pore structure of portland limestone
cement paste ............................................................................................................82
viii
CHAPTER Page
5.3.3 Influences of limestone dosage on pore structure of cement pastes with
metakaolin or fly ash ...............................................................................................88
5.4 Comparing Interground and Blended Limestone Pore Structure ....................89
5.4.1 Interground and Blended Pore Structure ..................................................90
5.5 Conclusions .....................................................................................................96
6. THE RHEOLOGICAL PROPERTIES OF TERNARY BINDERS CONTAINING
LIMESTONE AND METAKAOLIN OR FLY ASH ....................................................99
6.1 Introduction .....................................................................................................99
6.2 Experimental Program ...................................................................................100
6.2.1 Materials and Mixtures...........................................................................100
6.2.2 Rheological Experiments .......................................................................103
6.2.3 Determination of Particle Number Density and Apparent Water Film
Thickness ..……………………………………………………………………... 106
6.3 Results and Discussions.................................................................................109
6.3.1 Rheological Studies of Limestone Powder Modified Cement Pastes ....110
6.3.2 Influence of Fly Ash and Metakaolin on the Rheological Properties of
Pastes ………………………………………………………………………... 112
6.3.3 Rheological Studies of Ternary Blends Containing Limestone .............114
6.3.3.1 Combined Effects of Limestone Particle Size and Addition of Fly Ash
……………………………………………………………………………….. 115
ix
CHAPTER Page
6.3.3.2 Combined effects of limestone particle size and addition of
metakaolin .........................................................................................................117
6.3.4 Representing the Rheological Properties as Functions of the Mixture
Parameters: Observations from Experiments and Microstructural Generations ...119
6.4 Summary Conclusions ...................................................................................127
7. THE RHEOLOGY OF CEMENTITIOUS SUSPENSIONS: A CLOSER LOOK AT
EXPERIMENTAL PARAMETERS AND PROPERTY DETERMINATIONS USING
COMMONLY USED RHEOLOGICAL MODELS. ...................................................129
7.1 Introduction ...................................................................................................129
7.2 Experimental Program ...................................................................................131
7.2.1 Materials .................................................................................................131
7.2.2 Experimental Parameters and Suspensions ............................................133
7.2.3 Mixing and Testing Procedure ...............................................................134
7.3 Results and Discussions.................................................................................137
7.3.1 Influence of Gap between Parallel Plates on the Measured Rheological
Properties ..............................................................................................................137
7.3.2 Influence of the Surface Condition of the Bottom Plate ........................140
7.3.3 Influence of Mixing Procedure on Rheological Properties as Estimated
Using the Bingham Model ....................................................................................141
7.3.4 Influence of Shear Rate and Model Selection on Rheological Property 144
x
CHAPTER Page
7.3.4.1 Shear Rate Range Effects ...................................................................144
7.3.4.2 Rheological Model Effects .................................................................152
7.4 Applicability of Rheological Models in Fly Ash Geopolymer Suspensions .156
7.5 Conclusions ...................................................................................................158
8. RHEOLOGICAL EVALUATION OF INTERGROUND AND BLENDED
LIMESTONE-PORTLAND CEMENT SUSPENSIONS ............................................160
8.1 Introduction ...................................................................................................160
8.2 Experimental Program ...................................................................................162
8.2.1 Materials .................................................................................................162
8.2.2 Experimental Parameters........................................................................165
8.3 Results and Discussions.................................................................................168
8.3.1 Rheological Response of Portland Limestone-Cement Blends..............168
8.3.2 Comparing the Rheological Parameters of Interground PLC and PSD-
Matched OPC-Limestone Blends .........................................................................173
8.3.2.1 Yield Stress and Plastic Viscosity ......................................................173
8.3.2.2 Observations from Oscillatory Shear Stress Ramp Experiments .......175
8.3.3 Influence of Fly Ash on the Rheological Performance of PLC
Suspensions ...........................................................................................................180
8.4 Conclusions ...................................................................................................181
xi
CHAPTER Page
9. OBSERVATIONS ON THE RHEOLOGICAL RESPONSE OF ALKALI
ACTIVATED FLY ASH SUSPENSIONS: THE ROLE OF ACTIVATOR TYPE AND
CONCENTRATION ....................................................................................................183
9.1 Introduction ...................................................................................................183
9.2 Experimental Program ...................................................................................185
9.2.1 Experimental Parameters........................................................................185
9.2.2 Mixing and Testing Procedure ...............................................................186
9.3 Results and Discussions.................................................................................189
9.3.1 Rheological Behavior of the Activation Solutions .................................190
9.3.2 Rheological Behavior of Fly Ash Suspensions Activated with NaOH or
KOH ………………. ............................................................................................192
9.3.3 Rheological Behavior of Fly Ash Suspensions Activated Using Na- or K-
Silicates….. ...........................................................................................................195
9.3.3.1 Influence of n, Ms, and (w/s)m ............................................................195
9.3.3.2 Dependence of rheological parameters on the volumetric activator
solution-binder ratio ..........................................................................................198
9.3.4 Rheological Response of Suspensions under Extended Shear Rates .....202
9.3.4.1 Comparison of Activated Fly Ash Suspension to OPC-Water
Suspensions .......................................................................................................202
xii
CHAPTER Page
9.3.4.2 Discussions on the changes in rheological response with activator Ms
…………….. .....................................................................................................205
9.3.4.3 Response of different activator Ms: Shear stress growth
experiments .......................................................................................................207
9.4 Conclusions ...................................................................................................209
10. RHEOLOGICAL CHARACTERIZATION OF FRESH ALKALI ACTIVATED
SLAG SUSPENSIONS: INFLUENCE OF ACTIVATOR TYPE ...............................211
10.1 Introduction ...................................................................................................211
10.2 Experimental Program ...................................................................................212
10.2.1 Experimental Materials ..........................................................................212
10.2.2 Mixing and Testing Procedure ...............................................................214
10.3 Results and Discussions.................................................................................217
10.3.1 Rheological Behavior of Activated Solution .........................................217
10.3.2 Rheological Behavior of Fresh Slag Suspensions Activated Using KOH
or NaOH…. ...........................................................................................................220
10.3.3 Rheological Behavior of Fresh Slag Suspensions Activated Using K-Si or
Na-Si ……………... .............................................................................................222
10.3.4 Influence of Fly Ash Addition on Determined Rheological Properties of
Slag Based Geopolymers ......................................................................................227
10.4 Conclusions ...................................................................................................229
xiii
CHAPTER Page
11. CONCLUSIONS ...............................................................................................231
11.1 Part I Conclusion ...........................................................................................231
11.2 Part II Conclusion ..........................................................................................231
BIBLIOGRAPHY……………………………………………………………..……. 234
xiv
LIST OF TABLES
Table Page
Table 4-1: Chemical Composition of the Component Materials .......................................40
Table 4-2: Parameters of the Calorimetric Response for Binary and Ternary Cement Pastes
....................................................................................................................................52
Table 5-1: Composition and Specific Surface Areas (m2/kg) of the Materials used in this
Study as Determined using XRF and the Blaine’s Air Permeability Apparatus per
ASTM C205-11 ..........................................................................................................72
Table 5-2: The Proportions of the Paste Mixtures Evaluated in this Study .......................72
Table 5-3: Experimental Design Table ..............................................................................77
Table 6-1: Composition and Specific Surface Areas (m2/kg) of the Materials used in this
Study as Determined using XRF and the Blaine’s Air Permeability Apparatus per
ASTM C205-11 ........................................................................................................102
Table 6-2: The Proportions of the Paste Mixtures Evaluated in this Study .....................103
Table 7-1: Oxide Compositions and Specific Surface Areas of the Raw Materials used in
this Study. .................................................................................................................132
Table 7-2: Details Regarding Experimental Variables, their Range, and the Suspension
Characteristics ..........................................................................................................134
Table 7-3: Mixing Procedures and Corresponding Details Relevant to Suspension
Preparation ................................................................................................................135
Table 8-1: Oxide Composition of Experimental Materials, and Material Median Particle
Size ...........................................................................................................................163

xv
Table Page
Table 9-1: Chemical Composition and Physical Properties of Fly Ash ..........................185
Table 10-1: Chemical Composition of Study Materials ..................................................213
xvi
LIST OF FIGURES
Figure Page
Figure 2-1: Typical Cement Heat Evolution Curve (Bullard et al. 2011) ...........................9
Figure 2-2: Predicted Hydration Products for Ternary Blends of Limestone and Fly Ash
(De Weerdt, Haha, et al. 2011). ................................................................................13
Figure 2-3: Influence of Particle Size Distribution, Degree of Hydration, and Fineness on
Diffusivity (Dale P. Bentz et al. 1999) .....................................................................18
Figure 2-4: Electric Double Layer Model (left) (Yang, Neubauer, and Jennings 1997) and
Interaction Potential Between Two Surfaces Based on DVLO Theory (Shaw
1992). ........................................................................................................................21
Figure 2-5: Graphical Depiction of the Influence of Solid Loading on the Flow Behavior
of Suspensions (Mueller, Llewellin, and Mader 2010).............................................23
Figure 3-1: ICal 8000 Isothermal Calorimeter...................................................................31
Figure 3-2: Perkin Elmer STA 6000 Instrument Setup .....................................................32
Figure 3-3: Quantachrome PoreMaster Mercury Intrusion Porosimeter ...........................33
Figure 3-4: TA Instruments AR2000EX Used in this Study, Shown in Parallel Plate
Configuration. ...........................................................................................................34
Figure 3-5: Cup-and-bob Geometries used in Study .........................................................35
Figure 4-1: Particle Size Distributions of: (a) Limestone Powders and (b) Cement, Fly Ash,
and Metakaolin..........................................................................................................41
Figure 4-2: Influence of Limestone Fineness on the Heat Release Rate. Representative Heat
Flow Curves are Shown. The Uncertainty in the Heat Flow is Less than 2% Based on
Measurements on Triplicate Specimens. ..................................................................44
xvii
Figure Page
Figure 4-3: 1-Day Compressive Strengths of Binary and Ternary Blends of Limestone and
Fly Ash/Metakaolin ..................................................................................................44
Figure 4-4: Influence of Limestone Dosage on Heat Release Rates for Pastes Containing:
(a) 0.7 µm Limestone Powder, (b) 3 µm Limestone Powder, and (c) 15 µm Limestone
Powder. Representative Heat Flow Curves are Shown. The Uncertainty in the Heat
Flow is Less than 2% Based on Measurements on Triplicate Specimens. ...............45
Figure 4-5: Influence of w/c Ratio on the Calorimetric Response of OPC Pastes.
Representative Heat Flow Curves are Shown. The Uncertainty in the Heat Flow is
Less than 2% Based on Measurements on Triplicate Specimens. ............................46
Figure 4-6: 1 Day CH Contents for Selected Binary and Ternary Pastes ..........................47
Figure 4-7: Calorimetric Response of: (a) Fly Ash Modified Pastes, (b) Metakaolin
Modified Pastes, (c) Ternary Mixtures of 10% Limestone and 10% Fly Ash, (d)
Ternary Mixtures of 20% Limestone and 10% Fly Ash, (e) Ternary Mixtures of 10%
Limestone and 10% Metakaolin, and (f) Ternary Mixtures of 20% Limestone and
10% Metakaolin. Representative Heat Flow Curves are Shown. The Uncertainty in
the Heat Flow is Less Than 2% Based on Measurements on Triplicate
Specimens. ................................................................................................................49
Figure 4-8: Compressive Strength Development Of: (A) OPC- Limestone Pastes, (B) OPC-
Limestone-Fly Ash Pastes, and (C) OPC-Limestone-Metakaolin Pastes. The
Standard Deviation in Compressive Strengths Ranged from 0.5 MPa at Early Ages
to 4.5 MPa at Later Ages, but are not Shown in the Graphs to Avoid Cluttering. ...57
xviii
Figure Page
Figure 4-9: TG and DTG curves of: (a) 1 Day Hydrated Binary and Ternary Pastes
Containing Limestone and Fly Ash/Metakaolin, (b) 28 Day Hydrated Pastes
Containing Fly Ash/Metakaolin, (c) 28 Day Hydrated Ternary Blends with 10% 0.7
µm Limestone, and (d) 28 Day Hydrated Ternary Blends with 20% 3 µm Limestone.
Representative Data is Shown. The Uncertainty in the Mass Loss was Less than 5%
for Duplicate Measurements Made at the Same Age. ...............................................58
Figure 4-10: Residual Calcium Carbonate Contents in the Limestone Powder Modified
Pastes After 1 and 28 Days of Hydration..................................................................61
Figure 4-11: Heat Flow Curves for the Limestone Modified Pastes at 28 Days of Hydration
...................................................................................................................................62
Figure 4-12: Non-Evaporable Water and CH Contents of: (a) Binary Mixtures Containing
Limestone or Fly Ash/Metakaolin, and (b) Ternary Blends of Limestone and Fly
Ash/Metakaolin .........................................................................................................65
Figure 5-1: The Particle Size Distributions (PSDs) of: (a) the OPC and Limestone Powders,
and (b) the OPC, Fly Ash, and Metakaolin Powders. ...............................................70
Figure 5-2: Preliminary Study of Influence of Drying Techniques on (a) Determined Pore
Size Distribution and (b) Critical Pore Diameter Values..........................................76
Figure 5-3: Determined Intrusion and Extrusion (higher curve) Pore Size Distributions for:
(a) 0.7 µm, (b) 3 µm, and (c) 15 µm Limestone Replacement .................................78
Figure 5-4: Influence of Limestone Fineness and Replacement Ratio on Determined (a)
Mercury Porosity, (b) Critical Pore Diameter, and (c) Retained Volume Ratio.......82
xix
Figure Page
Figure 5-5: Influence of Inclusion of Alumina Sources in Hardened Portland Limestone
Cement Pastes on Critical Pore Diameter and Porosity for (a) Fly Ash, and (b)
Metakaolin. ...............................................................................................................83
Figure 5-6: Retained Mercury Volume Fraction After Extrusion for (a) Fly Ash, and (b)
Metakaolin. ...............................................................................................................87
Figure 5-7: Influence of 3 µm Limestone Replacement Ratio in Ternary Blends with Fly
Ash or Metakaolin on (a) Porosity, (b) Critical Pore Diameter, and (c) Volume
Fraction Retained. .....................................................................................................89
Figure 5-8: Intrusion Curves Comparing Interground to Blended PLCs, Solid Lines are 3
Day, Dashed are 28 Day for: (a) OPC, (b) C595, and (c) C1157 .............................91
Figure 5-9: Comparison of Porosity and Critical Pore Diameter for PLCs Investigated,
Patterned Fill is at 3 Days, Solid is at 28 Days. ........................................................92
Figure 5-10: Strength Versus Porosity Relationships at 3 Days (solid fill) and 28 Days (no
fill).............................................................................................................................94
Figure 5-11 – Modified Extrusion Curves Comparing Interground and Blended Samples at
3 (solid line) and 28 (dashed line) Days. ..................................................................95
Figure 5-12: Comparison of Interground and Blended Limestone Cements, (a) Volume
Extruded, and (b) Volume and Percent Volume of Intruded Mercury Retained; at 3
Days (dashed fill) and 28 Days (solid fill). ...............................................................96
Figure 6-1: The Particle Size Distributions (PSDs) of: (a) the OPC and Limestone Powders,
and (b) the OPC, Fly Ash, and Metakaolin Powders. .............................................101
xx
Figure Page
Figure 6-2: A Schematic Representation of the Rheological Procedure, and (b) a Typical
Shear Rate-Shear Stress Relationship Showing the Ascending and Descending
Curves. The Linear Fit of the Data in the Descending Curve is Used to Extract the
Yield Stress and Plastic Viscosity...........................................................................105
Figure 6-3: A Simulated 3D Microstructure Generated Using the Packing Algorithm and
(b) a 2D Slice Captured from the 3D-REV. ............................................................107
Figure 6-4: Centroidal Distances as Determined for: (a) Binary Blends Containing
Limestone; (b) Ternary Blends Containing Limestone and Metakaolin; and (c)
Ternary Blends Containing Limestone and Fly Ash. The REV Size is 400 x 400 x
400 µm3 ...................................................................................................................108
Figure 6-5: The Relationship Between the Water Film Thickness and the Ratio: SSA/(w/s)v
.................................................................................................................................109
Figure 6-6: The Influence of: (a) Limestone Particle Size, and (b) Level of Replacement of
OPC by Limestone (volume basis) on the Yield Stress and Plastic Viscosity of the
Paste Mixtures. ........................................................................................................111
Figure 6-7: The Influence of Fly Ash and Metakaolin on the Rheological Properties of
Binary Pastes ...........................................................................................................114
Figure 6-8: Influence of Limestone Dosage on Measured Rheological Properties in
Limestone ................................................................................................................116
Figure 6-9: Influence of Limestone Dosage on the Measured Rheological Properties of
Metakaolin Blended Pastes for: (a) 5% Metakaolin, (b) 10% Metakaolin. ............118
xxi
Figure Page
Figure 6-10: The Influence of Particle Number Density on the Rheological Properties of
Pastes with (w/s)v of: (a) 1.26 and (b) 1.42.............................................................120
Figure 6-11: The Influence of the Specific Surface Area on the Rheological Properties of
Pastes with (w/s)v of: (a) 1.26 and (b) 1.42.............................................................122
Figure 6-12: The Influence of a Calculated Water Film Thickness on the Rheological
Properties of Cement Pastes with (w/s)v of: (a) 1.26 and (b) 1.42..........................123
Figure 6-13: The Apparent Viscosity Ratio for the Pastes with (w/s)v of: (a) 1.26 (solid
loading of 0.44) and (b) 1.42 (solid loading of 0.41) Predicted Using K-D Equation
(Equation 5). The Constant η Used in Equation (5) Takes Values of 13.26±2.06 and
14.25±2.17 for the (w/s)v 1.26 and 1.42 Pastes Respectively. ................................125
Figure 6-14: The Apparent Viscosity Ratio for the Pastes with (w/s)v of: (a) 1.26 (solid
loading of 0.44) and (b) 1.42 (solid loading of 0.41) Predicted Using Liu’s Equation
(Equation 6-6). The constants a and n Used in Equation (6-6) Take Values of
0.065±0.035 and 2.14 Respectively ........................................................................126
Figure 7-1: The Particle Size Distributions of OPC, 3μm Limestone, and Fly Ash, as
Measured Using a Light Scattering Analyzer. ........................................................132
Figure 7-2: The Rheological Procedures Applied Over: (a) “normal” Shear Range, (b)
“low” Shear Range, and (c) “wide” Shear Range ...................................................136
Figure 7-3: The Influence of Gap on the Rheological Properties, Estimated Using the
Bingham Model ......................................................................................................140
Figure 7-4: The Influence of the Surface Condition of the Bottom Plate on the Rheological
Properties as Estimated Using the Bingham Model. ..............................................141
xxii
Figure Page
Figure 7-5: The Influence of Mixing Procedure on the Rheological Properties as Estimated
using the Bingham Model .......................................................................................142
Figure 7-6: The Influence of Shear Rate Range and the Selected Model on Rheological
Properties for the Plain OPC Suspension on: (a) Linear Scale, and (b) Logarithmic
Scale ........................................................................................................................145
Figure 7-7: The Influence of Shear Rate Range and the Selected Model on the Rheological
Rroperties for 10% 3 μm Limestone Containing Suspension on: (a) Linear Scale, and
(b) Logarithmic Scale. ............................................................................................146
Figure 7-8: The Influence of Shear Rate Range and the Selected Model on the Rheological
Properties for 10% Fly Ash Containing Suspension: (a) Linear Scale, and (b)
Logarithmic Scale. ..................................................................................................146
Figure 7-9: Investigations of Shear Stress Offset using a “modified-wide” Experiment on:
(a) Linear Scale, and (b) Logarithmic Scale. The “modified-wide” Evaluation is
Constructed by Combining the “normal” and “wide” Shear Evaluation Regimes. 148
Figure 7-10: (a) The Predicted Shear Rate vs. Shear Stress Response Extrapolated from
Data in Figure 7-9. Closed Circles are Measured Data, Open Circles are Extrapolated
Values. Results of the Bingham Model are Fit over the Shear Rate Range of 5-100/s,
and the Herschel-Bulkley and Casson Models are Fit over the Shear Rate Range from
0.1-100/s and (b) Shear Stress-Shear Rate Response for a Number of Particulate
Suspensions Composed in Water (three types of cement, fly ash, and slag) to
Demonstrate the Existence of a Stress Plateau at Low Shear Rates for Various
Suspensions. ............................................................................................................151
xxiii
Figure Page
Figure 7-11: Viscosity-Shear Stress Relationships for the Suspensions Evaluated, to
Illustrate the Apparent Yield Stress. .......................................................................152
Figure 7-12: The Influence of Selected Rheological Model using “wide” Shear Rate Range
Data on the Estimated Yield Stress for: (a) OPC-Water Suspension, (b) 10% 3 μm
Limestone Containing Suspension, and (c) 10% Fly Ash Containing
Suspension. .............................................................................................................153
Figure 7-13: Investigation of Model Applicability for 0.35 (a/p)m Hydroxide Geopolymer
Suspensions: (a) 8M KOH, and (b) 8M NaOH.......................................................156
Figure 7-14: Investigation of Model Applicability for 0.20 (a/p)m Silica Hydroxide
Geopolymer Suspensions with n = 0.05 and Ms = 1.5 : (a) Potassium (b) Sodium 157
Figure 7-15: Investigation of Model Applicability for 0.20 (a/p)m Potassium Silicate
Geopolymer Suspensions with n = 0.05 and Ms = 2.5 ............................................157
Figure 8-1: Particle Size Distribution of (a) Cements, and (b) Limestones used in this
Study. ......................................................................................................................164
Figure 8-2: Particle Size Distribution Interground Limestone-Cements (solid lines) as
Compared to Blended Mixes (dashed lines). ..........................................................164
Figure 8-3: The Rheological Procedure for Shear Ramp Study ......................................167
Figure 8-4: Method of Rheological Parameter Extraction used in Shear Ramp Study ...168
Figure 8-5: Representative Flow Curves for OPC and OPC-Limestone Suspension (OPC
Replacement by PSD-Matched Limestone 11.8% by Mass) ..................................169
Figure 8-6: Influence of the Content of PSD-Matched Limestone on Determined
Rheological Properties of the Suspension...............................................................171
xxiv
Figure Page
Figure 8-7: Yield Stress and Plastic Viscosity of the PLC Suspensions Along with those of
PSD-Matched OPC-Limestone Blends Corresponding to Pure OPC and the
PLCs. .......................................................................................................................173
Figure 8-8: Relationship Between Shear Stress and Storage or Loss Moduli of Suspensions:
(a) Pure OPC and the OPC-Limestone Blend with same PSD as OPC; (b) C595 PLC
and OPC-Limestone Blend with the same PSD as C595 PLC; and (c) C1157 PLC
and OPC-Limestone Blend with the same PSD as C1157 PLC. ............................176
Figure 8-9: Viscoelastic Phase Angle (δ) for Investigated Suspensions. ........................177
Figure 8-10: (a) Relationship Between Yield Stress and Storage Modulus in Linear
Viscoelastic Regime, and (b) Effect of Median Particle Size on Yield Stress and
Storage Modulus. ....................................................................................................178
Figure 8-11: Influence of Fly Ash Addition on the Rheological Properties of Blended and
Interground Limestone-Cement Suspensions. ........................................................181
Figure 9-1: Rheological Procedure: (a) “normal” Shear Range and (b) “wide” Shear Range
.................................................................................................................................189
Figure 9-2: A Typical Shear Rate-Stress Plot of Activator Solutions and the Corresponding
Newtonian Least Squares Best Fit ..........................................................................190
Figure 9-3: Influence of: (a) Molarity of KOH and NaOH Solutions on its Viscosity, and
(b) n, Ms of K-Silicate and Na-Silicate Activators on its Viscosity. The Viscosities
were Extracted using a Newtonian Model. .............................................................191
Figure 9-4: Influence of Molarity of KOH and NaOH on the Rheological Properties
Determined using the Bingham Model ...................................................................195
xxv
Figure Page
Figure 9-5: Influence of Ms on the Rheological Properties of Fly Ash-K Silicate
Suspensions Determined using the Bingham Model for: (a) 0.20 (w/s)m and (b) 0.25
(w/s)m. Note the Difference in the Ranges of Yield Stress and Plastic Viscosity with
Changing (w/s)m. The Y-axis Scales are Different in both these Graphs. ..............196
Figure 9-6: Influence of Ms on the Rheological Properties of Fly Ash-Na Silicate
Suspensions Determined using the Bingham Model for: (a) 0.20 (w/s)m and (b) 0.25
(w/s)m. At a (w/s)m of 0.20, a Fly Ash-Na Silicate Suspension with an Ms of 2.5 and
n of 0.05 was not Possible because it would have Meant Removing water from the
Activators to Obtain the Desired (w/s)m. ................................................................197
Figure 9-7: Influence of (as/b)V Ratio on Rheological Properties for: (a) Fly Ash-K Silicate
Suspensions, and (b) Fly Ash-Na Silicate Suspensions (label in parentheses is the n-
value).......................................................................................................................200
Figure 9-8: Investigation of Influence of n and Ms at a Constant (as/b)V Ratio of 0.72. Solid
Lines Represent the Determined Suspension Rheological Parameters, Dashed Lines
Represent Rheological Properties of Activation Solution. .....................................202
Figure 9-9: Comparison of Rheological Response of Fly Ash Suspensions in KOH and K-
Silicate Solutions and Portland Cement-Water Suspension: (a) Shear Stress Response
in Linear Scale and (b) Shear Stress (solid) and Viscosity Response (dashed) in log
Scale ........................................................................................................................203
xxvi
Figure Page
Figure 9-10: Comparison of Rheological Response of Fly Ash Suspensions in NaOH and
Na-Silicate Solutions and Portland Cement-Water Suspension: (a) Shear Stress
Response in Linear Scale and (b) Shear Stress (solid) and Viscosity (dashed)
Response in log Scale .............................................................................................204
Figure 9-11: Rheological Study of 0.20 (w/s)m Suspension of Fly Ash and Water: (a) Linear
Scale and (b) Logarithmic Scale .............................................................................206
Figure 9-12: Rheological Study of 0.25 (w/s)m K-Si Fly Ash Suspension at Varying Ms: (a)
Flow Curve in Logarithmic Scale and (b) Influence of Ms on Determined Rheological
Properties ................................................................................................................207
Figure 9-13: Oscillatory Shear Study of 0.25 (w/s)m Fly Ash Suspensions with (a) K-Si
Based Activator, and (b) Na-Si Based Activator ....................................................209
Figure 10-1: Rheological Procedure: (a) “normal” Shear Range, (b) “wide” Shear
Range ......................................................................................................................216
Figure 10-2: Typical Results of Activator Rheology Showing Newtonian Least Squares
Best Fit ....................................................................................................................218
Figure 10-3: Activator Rheology, Viscosity Determined using a Newtonian Model, (a)
Influence of Molarity on KOH and NaOH Activator Solutions, and Influence of n
and Ms on KOH and NaOH Silicate Activators for: (b) 0.35, and (c) 0.40 (w-s)m
Activators. ...............................................................................................................218
Figure 10-4: Influence of Molarity of KOH and NaOH Activators on Determined
Rheological Properties using the Bingham Model for 0.60 (a/p)m .........................222
xxvii
Figure Page
Figure 10-5: Influence of Ms in K-Si Activated Pastes on Determined Rheological
Properties using the Bingham Model for: (a) 0.35 (w/s)m and (b) 0.40 (w/s)m ......224
Figure 10-6: Influence of Ms in Na-Si Activated Pastes on Determined Rheological
Properties using the Bingham Model for: (a) 0.35 (w/s)m and (b) 0.40 (w/s)m ......224
Figure 10-7: Influence of (As/p)V Ratio of Suspension on Determined Rheological
Properties for: (a) K-Silicate, and (b) Na-Silicate Suspensions ..............................227
Figure 10-8: Influence of Fly Ash Addition at 50% Mass Ratio for (a) K-Si and (b) Na-Si
at (w/s)m Ratios of 0.30 and 0.35, n-value of 0.05, and Ms Ratio at 1.5 and 2.5. Results
for Slag at 0.35 with same n and Ms Values Included for Reference. ....................229
1
1. INTRODUCTION
The expected continued increase in worldwide demand of concrete (P. Kumar Mehta and
Monteiro 2005) indicates this is an ideal time to focus on the sustainability of these
systems. Concrete is composed of portland cement, water, and aggregates. Portland
cement undergoes hydration reactions with water to form a cement paste which binds the
aggregates together to form concrete. Portland cement production is an energy intensive
process which requires heating of limestone and other raw materials to a very high
temperature, after which the products of this process, the portland cement clinker, are
ground to the desired fineness. Production of concrete thus requires significant energy,
approximately 4600 MJ/ton of cement (Government of Canada 2009). Further, it has been
shown that portland cement production accounts for approximately 5% of global
anthropogenic CO2 emissions (Worrell et al. 2001). These carbon dioxide emissions are
both a product of the energy production required as well as the calcination that occurs when
limestone is heated to a high temperature (Worrell et al. 2001; P. Kumar Mehta and
Monteiro 2005). The inherent chemical production of CO2 can be as high as 60% of total
carbon emissions from portland cement production (Worrell et al. 2001). This fact
indicates that while gains may be possible from the use of low heat cements or increased
efficiency, since a majority of the CO2 emissions result from portland cement manufacture
are a direct result of the chemical process itself, alternative strategies are required to further
reduce carbon emissions associated with portland cement manufacture. These issues have
motivated the current work to explore two possible strategies for enhanced sustainability
in concrete: (i) replacement of portland cement by limestone and limestone in combination
with waste stream alumina sources, and (ii) the use of cement-free binder systems, also
2
known as geopolymers, wherein the binder phase in the concrete is composed entirely of
aluminosilicate waste stream materials such as fly ash or slag. The first phase of the project
is devoted to the hydration, strength development, and microstructural features of
limestone replaced portland cement systems with and without additional alumina sources.
The second phase of the project is devoted to determination of the rheological
characteristics of both plain and blended portland cement systems, as well as fly ash and
slag based geopolymer systems.
1.1 Objectives
Determine the synergistic benefits of the use of limestone in combination with alumina
sources (metakaolin, fly ash, sodium aluminate) as partial cement replacement materials
on the hydration kinetics, product formation, and strength development of cement pastes.
Investigate the microstructure of these modified cementitious systems through the use of
mercury porosimetry.
Determine the influences of fine blended and interground limestone with or without an
alumina source on the flow characteristics of fresh portland cement suspensions.
Investigate the applicability of the generalized Bingham models to portland cement based
suspensions as well as fly ash and slag geopolymer suspensions. Also, to investigate
methods for determining the rheological yield stress in concentrated cementitious
suspensions and use rheology to investigate influences of limestone and additives on the
property (storage and loss moduli) development of these suspensions.
Investigate the influences of silica modulus, alkali-to-binder ratio, activator type, and
molarity on the rheological properties of fly ash and slag based geopolymer materials, so
3
as to better tailor chemical admixture systems for geopolymer mixtures, which are non-
existent currently.
1.2 Dissertation Layout
This dissertation is composed primarily of the seven papers that have been or will be
submitted for publication as part of this work, with in some cases additional data that is not
presented in the published papers. These papers can be found in Chapters 4-10. The first
section of this dissertation is composed of Chapters 4 and 5, which focuses on the
hydration, strength development, and pore structure of limestone replacement portland
cement pastes. The second section composed of the remaining chapters is devoted to the
rheological characterization of sustainable binder systems in the fresh state, including:
limestone replacement portland cement, fly ash geopolymer, and slag geopolymer
suspensions.
Chapter 2 provides an extensive literature review into the following key topics: (i) the use
of limestone in portland cement systems, (ii) the use of rheology to characterize the flow
behavior of cementitious suspensions and concentrated suspensions in general.
Chapter 3 provides a brief exploration of the experimental methodologies and materials
used in the study. As a large number of experiments were completed as part of this study
using a wide variety of experimental techniques and procedures, more in-depth discussions
of methods used for the individual chapters is presented in their corresponding chapters.
Chapter 4 explores the influences of limestone replacement of portland cement with or
without additional alumina sources on the hydration kinetics, compressive strength
development, and hydration product formation.
4
Chapter 5 presents an analysis of the influence of limestone replacement of portland cement
on the pore structure of the hardened pastes as determined using mercury intrusion
porosimetry. The pore structure of the pastes is investigated using both intrusion and
extrusion curves, and the influence of limestone is disconnected from packing and surface
area influences by replacing cement with particle size distribution matched limestone.
Chapter 6 presents rheological exploration of ternary blended portland cement, limestone,
and metakaolin or fly ash suspensions in the fresh state. The nature of the rheological
performance of these suspensions is explored through the use of the Bingham model, and
particle size and surface area effects are fully explored in this analysis.
Chapter 7 presents an exploration of experimental influences on the rheological
characterization of portland cement suspensions in the fresh state. The effect of gap,
mixing technique, surface roughness, and shear rate range of the study are thoroughly
explored. Further, an investigation of the relevance of several rheological models is
included, namely: Bingham, Herschel-Bulkley, and Casson. Further, this model
investigation is extended to other concentrated suspensions including suspensions of fly
and limestone in water, as well as fly ash and slag suspended in various alkali-activated
solutions.
Chapter 8 further explores the rheological nature of limestone replaced portland cement
suspensions using the techniques as determined in Chapter 7. The nature of limestone in
these suspensions is disconnected from particle size and surface area effects through the
use of size-matched limestone as a cement replacement material. The viscoelastic nature
of these suspensions is explored using small amplitude oscillatory shear experiments.
5
Chapter 9 investigates the influence of alkali activator type and concentration on the
rheological performance of fly ash suspensions in the alkali activated solution.
Characterization of these suspensions was completed for both alkali-hydroxide activator
solutions and alkali-silica-hydroxide activator solutions, where the selected alkalis are Na
or K.
Chapter 10 provides a similar investigation as Chapter 9, however for the case of slag based
geopolymers in the fresh state. A similar comparison of activator solution effects is
explored and presented.
6
2. LITERATURE REVIEW
The proceeding literature review is divided into two distinct sections, one focused on the
historical and current use of limestone as a portland cement replacement material, and the
second a review of rheological characterization of suspensions, with a particular focus on
cementitious suspensions.
2.1 Limestone as Cement Replacement Material
2.1.1 Overview and Background
Portland cement concrete (PCC) is the most widely used infrastructure material globally.
PCC is primarily composed of aggregates (rock and sand), water, and portland cement.
Portland cement, the main binding component in concrete is manufactured by heating raw
materials such as limestone and clay in a kiln at temperatures of approximately 1500 °C.
The high heat requirement for portland cement production requires a significant quantity
of energy, approximately 4600 MJ/ton (Government of Canada 2009). Further the
production of portland cement releases a significant quantity of CO2, accounting for
approximately 5% of global anthropogenic carbon dioxide production (Worrell et al. 2001;
Hendriks et al. 2002). These factors, combined with the predicted increases in concrete
use over the coming decades indicate this is an ideal time to focus on enhancing the
sustainability of concrete (P.K. Mehta 2002; P. Kumar Mehta and Monteiro 2005). Two
primary methods are currently used for enhancing concrete sustainability: (i) decrease the
energy demand required for cement production or increase efficiency and (ii) partial
replacement of cement by inert fillers or reactive pozzolanic materials. Strategies for
decreasing energy requirements include enhancing efficiency of production facilities and
the use of low energy cements (Popescu, Muntean, and Sharp 2003), cements which require
7
lower temperatures to produce cement. However, more than 50% of the carbon dioxide
released during cement production is a result of the calcination of limestone (Worrell et al.
2001), thus advances in efficiency may not be able to have a significant impact on
greenhouse gas emissions. Pozzolanic materials are aluminosilicate materials which
chemically react with the portlandite phase in cement hydration to produce additional C-
S-H gel. Traditional pozzolanic replacement materials used to enhanced concrete
sustainability include the use of aluminosilicate waste stream materials such as fly ash and
slag from coal fired power plants and steel production respectively. However, the
availability of these materials is limited, and the increased use of natural gas extracted
using hydraulic fracturing may limit the availability of fly ash in particular (Texas
Department of Transportation 2012).
Over the past decades there has been increased interest in the use of limestone as a partial
cement replacement material in portland cement concrete. This interest is motivated by a
desire to increase the sustainability of concrete by reducing the required portland cement
content, thereby reducing the CO2 emissions and energy requirements associated with
portland cement production. To achieve full hydration, it has been shown that chemically
a minimum water-to-cement (w/c) ratio of approximately 0.25 is required (P. Kumar Mehta
and Monteiro 2005), however the hydration model proposed by Powers indicates that the
lack of capillary porosity in low w/c ratio concretes restricts the ultimate degree of
hydration further, and a minimum w/c ratio of 0.36 is required for complete hydration of
cement (Powers and Brownyard 1947). Thus, in modern high performance concretes
(HPCs) which are commonly manufactured using very low w/c ratios, below this limit
proposed by Powers, there remains unhydrated portland cement even at very late ages.
8
Given that this remaining unreacted cement is acting primarily as a filler material and
increasing the microstructural packing, it has been proposed that partial replacement of
cement by an inert filler may achieve comparable mechanical performance while
concurrently decreasing the financial and environmental costs associated with concrete
production (D. Bentz et al. 2009a; V. Bonavetti et al. 2003; Dale P. Bentz 2006). Thus,
inclusion of the relatively inert limestone in as a cement replacement material could act to
raise the effective w/c ratio, increasing the degree of hydration and replacing the unreacted
cement at later ages.
2.1.2 Influence of Limestone on Cement Hydration
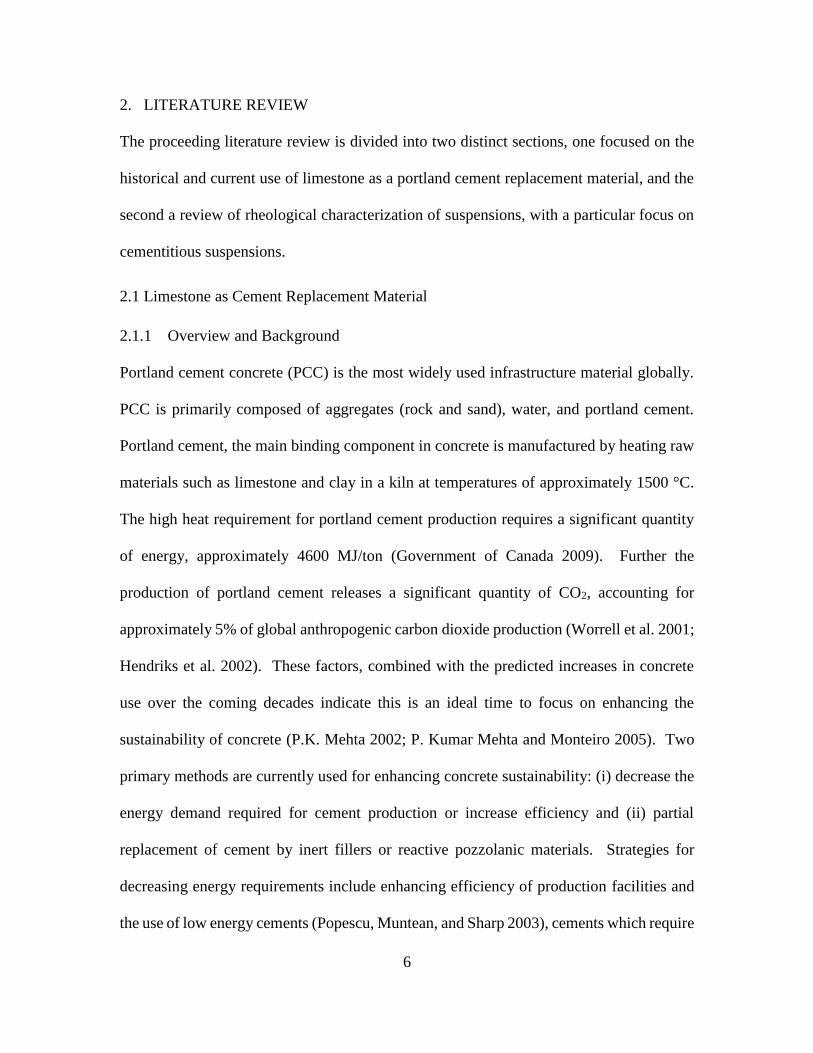
Typical portland cement hydration is a series of exothermic reactions consisting of a
dissolution phase, an induction period, a subsequent acceleration phase, followed finally
by diffusion controlled regime. The resultant heat flow curve is typically a two peak
system, the first peak representing the dissolution peak and the second peak corresponding
to the main hydration peak. A typical presentation of the heat evolution of the cement
hydration reactions is presented in Figure 2-1. The dissolution phase corresponds to the
initial heat release associated with the dissolution of aluminates and sulfates and the early
hydration of the aluminate phase, and lasts on the order of minutes (Irassar et al. 2011; P.
Kumar Mehta and Monteiro 2005). The induction period typically lasts on the order of a
few hours, and is proceeded by the main hydration peak. The main hydration peak
corresponds to the reaction of the calcium phases in the portland cement to form C-S-H gel
and other hydration products. A shoulder is typically present on the main hydration peak
indicating the secondary formation of ettringite (Bullard et al. 2011). At early ages in
ordinary portland cement ettringite is formed in a reaction between the C3A phases and the
9
sulfates added in the form of gypsum to control setting. After the sulfates have been
consumed, ettringite reacts with the remaining C3A to form monosulfate. The final phase
in portland cement hydration is the diffusion controlled phase, represented by a slow
downward slope of the main hydration peak, where further reaction of the C3S and C2S is
controlled by the diffusion of water through the hydration shell that has formed on the
portland cement grains.
Figure 2-1: Typical cement heat evolution curve (Bullard et al. 2011)
Extensive work has been completed on the influences of limestone replacement on
portland cement hydration. Some works on the heat evolution of portland cement replaced
by limestone tended to indicate that the inclusion of limestone had a negligible effect, or
even a slight reduction in the heat flow response of the paste (Irassar et al. 2011; Hooton
1990; Livesey 1991). However, it is noted that these experiments were either conducted
semi-adiabatically or appear to be measuring the heat flow response of the entire composite
system. Other works by both Bonavetti (V. Bonavetti et al. 2003) and Bentz (Dale P. Bentz
2006) found that the replacement of cement by limestone raised the degree of hydration of
10
the resultant cement paste. These results appear contradictory to the works described
above, however there are multiple possible causes for the discrepancy: (i) normalization of
heat flow based on cement content rather than sample mass provides a more accurate
picture of the degree of hydration and (ii) the effect of fineness of the limestone used as
replacement material may be crucial. Similarly, reports on the effect of limestone on heat
of hydration in self compacting concrete systems indicated a significantly accelerated
hydration (Ye et al. 2007). It is thus appears generally agreed that the influence of fine
limestone on cement hydration is one to accelerate the hydration reactions, as it acts as a
nucleation site for hydration product formation (Soroka and Setter 1977).
Several studies have investigated the influence of limestone on hydration product
formation. It has been shown that limestone reacts to some extent with the C3A phase in
portland cement (Soroka and Stern 1976; Ingram et al. 1990), and in a pure C3A system
limestone has been shown to react significantly with this phase, while not as significantly
with pure C3S (Kakali et al. 2000). Limestone powder interacts chemically with the C3A
phase in the cement stabilizing carboaluminate and reducing the formation of
monosulfoaluminate (Matschei, Lothenbach, and Glasser 2007b). Subsequently the
reaction of ettringite with the C3A phase to form monosulfate is prevented due to the
increased stability of carboaluminate as compared to monosulfate (Matschei, Lothenbach,
and Glasser 2007b; De Weerdt, Haha, et al. 2011). This stabilized ettringite in the paste,
and due to the lower density of ettringite as compared to other hydration products may
potentially lead to a reduction of porosity and enhanced strength in the hardened paste.
These results have been confirmed by the determination that ettringite remained present in
significant volumes even in later age pastes (Kakali et al. 2000; Hoshino, Yamada, and
11
Hirao 2006). There have been varying results with regard to investigations of the quantities
of calcium carbonate that is consumed in these systems, with some believing that in low
volume replacement almost all of it may be consumed (Matschei, Lothenbach, and Glasser
2007b), while most reporting limestone consumption on the order of 5-10% of limestone
by mass. Further, the reactivity of limestone in portland cement systems has indicate an
overall decrease in bound water in the system, indicated a decrease in degree of hydration,
as limestone quantity is increased, however, when the value is normalized by the quantity
of cement the bound water can be seen to increase (De Weerdt, Kjellsen, et al. 2011). This
indicates that the degree of hydration of the portland cement is higher, supporting the idea
that limestone is accelerating the hydration reactions. These effects are attributed primarily
to the dilution of cement in the system resulting in a higher effective w/c ratio and limestone
acting as a nucleation site for hydration products.
Based on the noted interaction between limestone and the alumina phases in portland
cement, several studies have been completed to investigate possible synergistic benefits of
the addition of alumina sources to portland limestone cements. The hydration of binary
systems of portland cement and alumina sources such as fly ash, slag, or metakaolin have
been well documented in the literature. Pozzolanic materials such as fly ash, metakaolin
and slag have been shown to react with the portlandite phase in cement hydration. This in
turn results in enhanced durability and mechanical strength in these concretes due to a
reduction in the water soluble calcium hydroxide phase, and replacement with less soluble
hydration products. In fly ash-cement blends, fly ash has been shown to have a low
reactivity until later ages (Fajun, Grutzeck, and Roy 1985; Fraay, Bijen, and de Haan 1989;
Sakai et al. 2005), typically remaining unreacted in the system until later ages when it
12
reacts with the portlandite (calcium hydroxide) to form C-(A)-S-H gel. The influence of
low calcium fly ash is seen to be primarily a dilution effect on heat evolution, due to this
low early age reactivity (Sánchez de Rojas et al. 1993), decreasing the heat evolved in the
paste, however when normalized by cement content remaining comparable to portland
cement. Metakaolin, a calcined clay aluminosilicate material, has indicated enhanced
reactivity at early ages (Wild and Khatib 1997; Sabir, Wild, and Bai 2001) as compared to
fly ash, typically increasing the heat evolution when replacing portland cement (M. Frı́as,
de Rojas, and Cabrera 2000). Like other pozzolans, metakaolin reacts with the portlandite
that is formed as part of cement hydration reactions to form alternative reaction products
including C-S-H and C-(A)-S-H gels. However, it is noted that due to the higher reactivity
of metakaolin at early ages, the quantity of portlandite will vary based on how much has
been produced and how much is consumed, often with local minima in portlandite content
present as the paste ages.
Based on the Pozzolanic activity of added aluminosilicate materials in combination with
the reactivity of limestone with the alumina species in cement, there is interest in possible
synergistic benefits of replacement of cement in ternary blends of limestone and alternate
alumina sources. Several studies have been completed on the hydration mechanisms in
these systems, including hydration models of ternary limestone-fly ash systems (De
Weerdt, Haha, et al. 2011), where a potential synergistic benefit was noted with enhanced
formation of C-(A)-S-H gel in the presence of limestone, as well as the stabilized ettringite
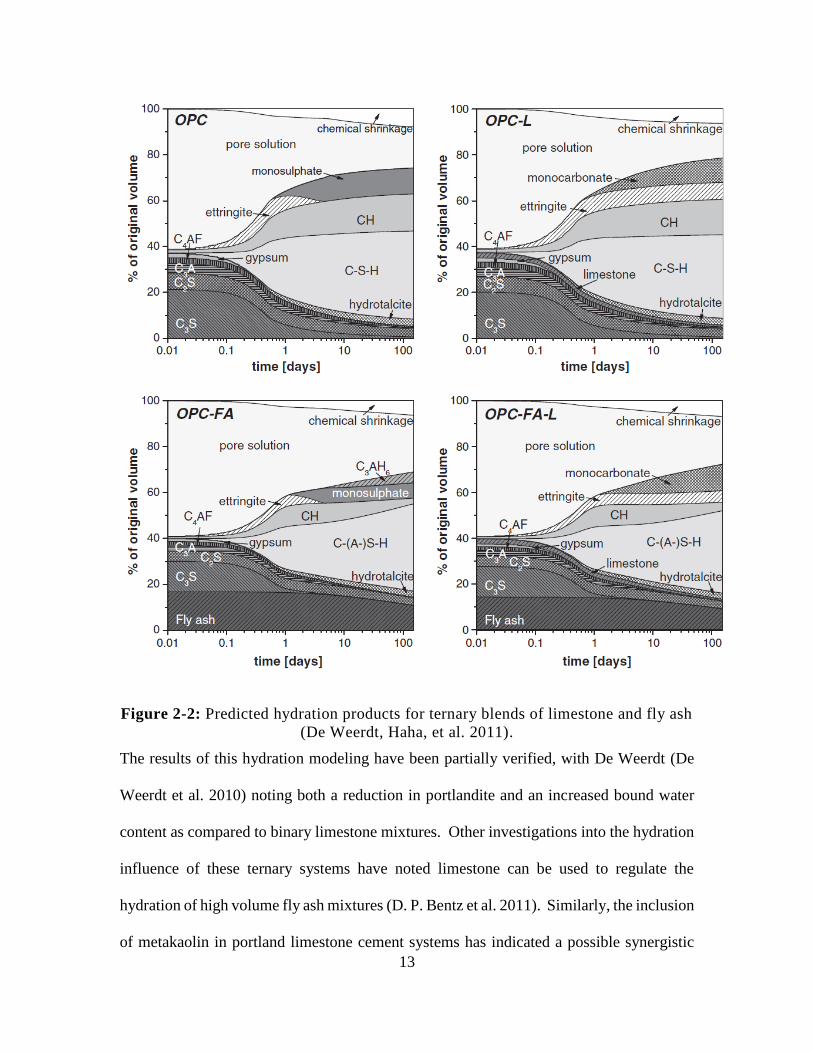
as discussed above. Figure 2-2 presents the results of this hydration modelling.
13
Figure 2-2: Predicted hydration products for ternary blends of limestone and fly ash
(De Weerdt, Haha, et al. 2011).
The results of this hydration modeling have been partially verified, with De Weerdt (De
Weerdt et al. 2010) noting both a reduction in portlandite and an increased bound water
content as compared to binary limestone mixtures. Other investigations into the hydration
influence of these ternary systems have noted limestone can be used to regulate the
hydration of high volume fly ash mixtures (D. P. Bentz et al. 2011). Similarly, the inclusion
of metakaolin in portland limestone cement systems has indicated a possible synergistic
14
benefit, with respect to hydration, where the main hydration peak has been shown to be
significantly accelerated in blends of limestone and metakaolin, and the reaction rate of
metakaolin is seen to be enhanced in the presence of limestone (Antoni et al. 2012).
2.1.3 Influence of Limestone on Mechanical Properties
Extensive work has been completed investigating the influences of limestone on the
mechanical properties of portland cement pastes, mortars, and concretes. It is notable that
many of these studies have contradictory results, possibly attributed to the fineness of the
selected limestone, replacement ratio and type of cement used. Tsivilis found that
limestone replacement by intergrinding with the clinker at ratios of up to 10% had limited
effects on the compressive strengths of pastes, however at higher replacement ratios there
was a noted decline in strength (Tsivilis, Chaniotakis, Badogiannis, et al. 1999). It was
further noted that increased intergrinding time in the ball mill decreased the strength
reduction in these pastes. Similarly, Bentz (D.P. Bentz 2005) noted that replacement of
the coarser fraction of portland cement with limestone allowed for mechanical properties
that were comparable to OPC. Similarly, Voglis (Voglis et al. 2005) found that hardened
portland limestone cement pastes had comparable properties to OPC pastes, with noted
higher early age strength in the limestone system. Bentz further studied the influence of
limestone fineness on the compressive strength of both mortars and concretes and found
that there was no apparent influence of fineness (Dale P. Bentz and Peltz 2008), as
limestone of either fineness used resulted in comparable strength reductions, however both
sizes of limestone used in this study were comparable in size or coarser than the portland
cement used in the study. Irasser noted similar results, with limestone replacement
resulting in a strength reduction in mortar specimens, with further reductions as
15
replacement ratio is increased; however, the limestone size was not noted (Irassar 2001).
For more information on the influences of limestone on the mechanical properties of
portland cement pastes, mortars and concrete, the author directs readers to a comprehensive
review of limestone behavior in portland cement systems (Hawkins, Tennis, and Detwiler
2003). It is generally noted from this review that limestone replacement results in
decreased mechanical properties, further decreasing as the replacement ratio is increased.
The influence of ternary blends of limestone and other alumina sources, including: slag,
fly ash, and metakaolin, has not been as extensively studied in the literature as the influence
of binary limestone. Elkhadiri (Elkhadiri et al. 2002) noted that inclusion of fly ash in
interground limestone systems resulted in comparable mechanical behavior to OPC. De
Weerdt (De Weerdt, Haha, et al. 2011; De Weerdt, Kjellsen, et al. 2011) noted a beneficial
effect of inclusion of limestone and fly ash. The inclusion of fly ash in portland limestone
cements was shown to recover the compressive strength loss associated with limestone
inclusion, and further shown to increase the flexural strength loss associated with the
inclusion of fly ash. These two studies both indicated potential synergistic benefits of
combined replacement of portland cement by limestone and fly ash. Similarly, metakaolin
has shown to enhance the compressive strength of portland cement-limestone blends
(Antoni et al. 2012). Metakaolin alone significantly enhances the strength of portland
cement mixes, particularly at early ages (Ambroise, Maximilien, and Pera 1994; Wild,
Khatib, and Jones 1996), and its inclusion in limestone cement systems helps to recover
some of the strength lost associated with limestone inclusion. Similarly, the inclusion of
slag in limestone replaced portland cements was found to recover some of the strength loss
16
associated with limestone inclusion, although there were still noted strength deficits, these
were typically recovered by later ages (Menéndez, Bonavetti, and Irassar 2003).
2.1.4 Influence of Limestone on Durability
The development of sustainable concrete systems also requires the development of portland
cement concretes with equivalent or better durability characteristics. Enhancing the
durability of portland cement concrete would increase the service life of structures, as well
as decrease associated rehabilitation and repair costs. The durability of concrete can be
divided into several key components, but primarily: (i) resistance to corrosion, and (ii)
resistance to chemical attack. The current section will review the influence of limestone
on the resistance to corrosion, as determined via the pore structure of the portland cement
paste. The proceeding section provides a brief overview of some concerns with limestone
with respect to chemical attack. The estimated cost of corrosion, just in reinforced concrete
highway bridge infrastructure is between $64.3 and $101.5 billion annually (Yunovich and
Thompson 2003), and the overall cost of corrosion in the United States is further estimated
to be approximately 27% of the gross domestic product (Koch et al. 2002). For corrosion
of steel reinforcing to occur in reinforced concrete, only two things are required: water and
oxygen. However, due to the highly alkaline pore solution in cementitious systems,
corrosion typically will not occur below a certain critical concentration of chloride ions
required to break the passive layer on the steel (Alonso et al. 2000; Moreno et al. 2004).
Thus, the presence of chloride ions in concrete allows for the initiation of corrosion, and
the transport of chloride ion in the sample is crucial to resistance to corrosion. Corrosion
resistance of a portland cement concrete has been shown to be dependent on both the
chloride ion permeability (Halamickova et al. 1995) and the chloride binding of the
17
portland cement paste (Geiker, Nielsen, and Herfort 2007; Yuan et al. 2009). As a key
focus of this dissertation is the microstructural features of portland limestone cement
pastes, the influences of limestone on the chloride ion binding capabilities of the hardened
cement paste are not included in this literature review.
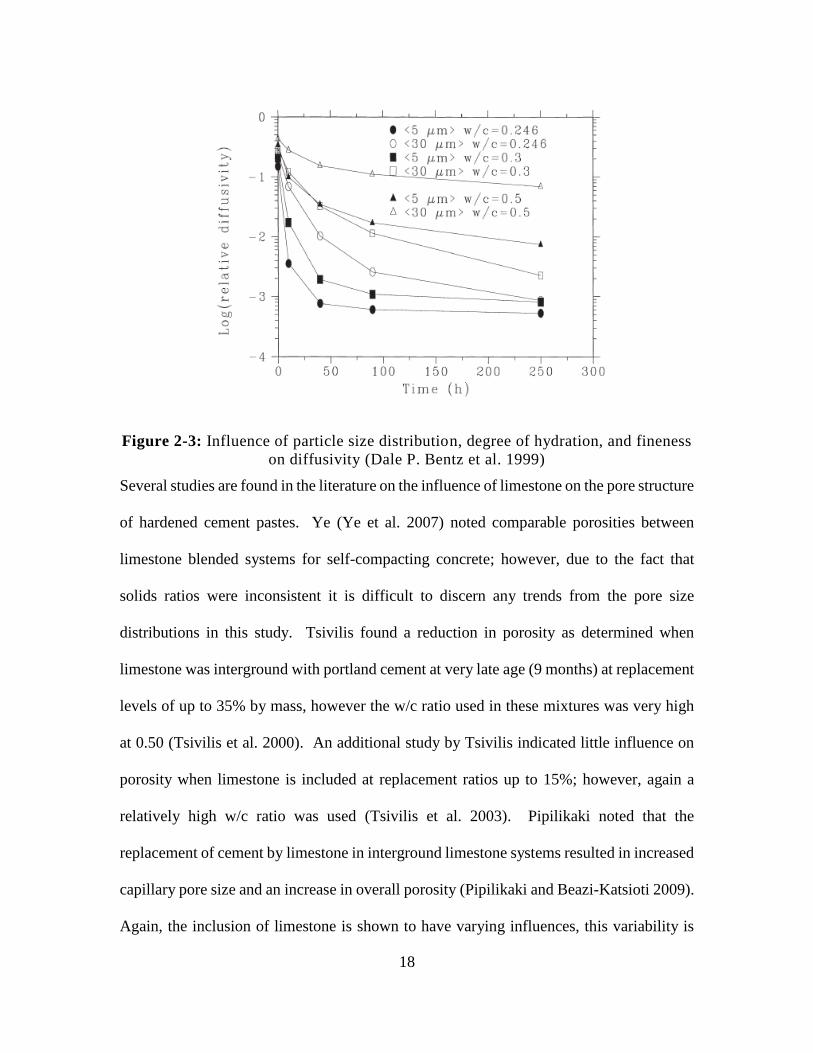
In general, the permeability and diffusivity of concrete is dominated by the portland cement
paste phase, due to the fact that the portland cement paste is significantly more porous than
materials typically used as aggregates. The permeability of the cement paste is influenced
by several factors, including the degree of hydration (Halamickova et al. 1995; Atahan,
Oktar, and Tasdemir 2009), the pore structure of the cement paste (Bágel’ and Živica
1997), and the constitution of the cement paste (Dale P. Bentz et al. 1999). The pore
structure of cement pastes is similarly influenced by the degree of hydration of the paste,
and the constitution of the cement paste, particularly with regard to the w/c ratio and the
particle size distribution of the species in the paste (Dale P. Bentz et al. 1999; Winslow and
Diamond 1970a). These effects are illustrated in Figure 2-3.
18
Figure 2-3: Influence of particle size distribution, degree of hydration, and fineness
on diffusivity (Dale P. Bentz et al. 1999)
Several studies are found in the literature on the influence of limestone on the pore structure
of hardened cement pastes. Ye (Ye et al. 2007) noted comparable porosities between
limestone blended systems for self-compacting concrete; however, due to the fact that
solids ratios were inconsistent it is difficult to discern any trends from the pore size
distributions in this study. Tsivilis found a reduction in porosity as determined when
limestone was interground with portland cement at very late age (9 months) at replacement
levels of up to 35% by mass, however the w/c ratio used in these mixtures was very high
at 0.50 (Tsivilis et al. 2000). An additional study by Tsivilis indicated little influence on
porosity when limestone is included at replacement ratios up to 15%; however, again a
relatively high w/c ratio was used (Tsivilis et al. 2003). Pipilikaki noted that the
replacement of cement by limestone in interground limestone systems resulted in increased
capillary pore size and an increase in overall porosity (Pipilikaki and Beazi-Katsioti 2009).
Again, the inclusion of limestone is shown to have varying influences, this variability is
19
likely attributed to changes in limestone size distribution, varying w/c ratios and different
methodologies of limestone replacement.
As a final note in the discussions of durability of limestone cement systems, it is important
to note that limestone has been shown to have some potential influences on chemical attack
in portland cement concrete. There is concern in the literature that portland limestone
cement systems may be susceptible to sulfate attack due to the stabilization of more
voluminous hydration products in the microstructure. Sulfate attack is a form of
deterioration in portland cement systems where the stabilization or delayed formation of
less dense hydration products results in expansive cracking in the microstructure and
decreased mechanical performance. The stability of less dense ettringite in portland
limestone cement systems leads to increased volume of hydration products (Matschei,
Lothenbach, and Glasser 2007b) which has been proposed to increase packing, however
may also lead to cracking. Further, several authors have noted the potential of sulfate attack
due to thaumasite formation (Bensted 1999; Hartshorn, Sharp, and Swamy 1999; Justnes
2003; Kakali et al. 2003), and is of particular concern at lower temperatures and
environments where the concrete is exposed to sulfates.
2.2 Rheology of Cementitious Suspensions
2.2.1 Overview and Background
Rheological studies are the study of flow in a material, typically a fluid (Barnes, Non-
Newtonian, and Mechanics 2000). Rheological studies of fluids typically consist of
investigations of the response of the fluid to changes in stress or strain, applied in both
linear and oscillatory studies. The rheological behavior of cementitious suspensions is a
crucial area of investigation, as it gives insight into the ease of casting, pumping, and
20
finishing of concrete structures. Further, exploration of the rheological nature of
cementitious materials gives insight into the underlying physicochemical interactions
between the various suspended species as well as potential interactions with the suspending
media itself.
2.2.2 The Rheology of Suspensions
The study of the flow of suspensions is a broad discipline, including investigations into
food processing (Bayod, Willers, and Tornberg 2008; Steffe 1996), blood (Cerny, Cook,
and Walker 1962; Dintenfass 1976), and construction materials such as asphalt (Chomton
and Valyer 1972; Gaskins et al. 1960) and concrete (Banfill and others 2003). The
rheological behavior of suspensions is a complex system, dependent on solid loading,
particle size, particle interaction effects, and the nature of the suspending media. Particle
interaction effects include particle contact forces, electrostatic forces, and van der Waals
forces. Colloidal stability and the behavior of colloidal suspensions has been proposed to
be dominated by DLVO theory (named for Derjaguin, Landau, Verwey, and Overbeek)
which relates repulsion and coagulation through electrostatic repulsive forces and attractive
van der Waals forces respectively. The electrostatic forces result from the adsorption of
charged particles in the electric double layer (EDL). A graphical representation of the EDL
is depicted in Figure 2-4, where the stern layer is the layer closest to the particle consisting
of strongly held ions of opposite charge to the surface of the particle and the diffuse layer
is the outer shell layer consisting of less strongly held ions with the same charge as the
particle. DLVO theory proposes that the electrostatic interaction at particle surfaces results
in a repulsive force which is balanced by van der Waals attractive forces. Where van der
Waals forces are proportional to 1/r2 and electrostatic repulsion forces are proportional to
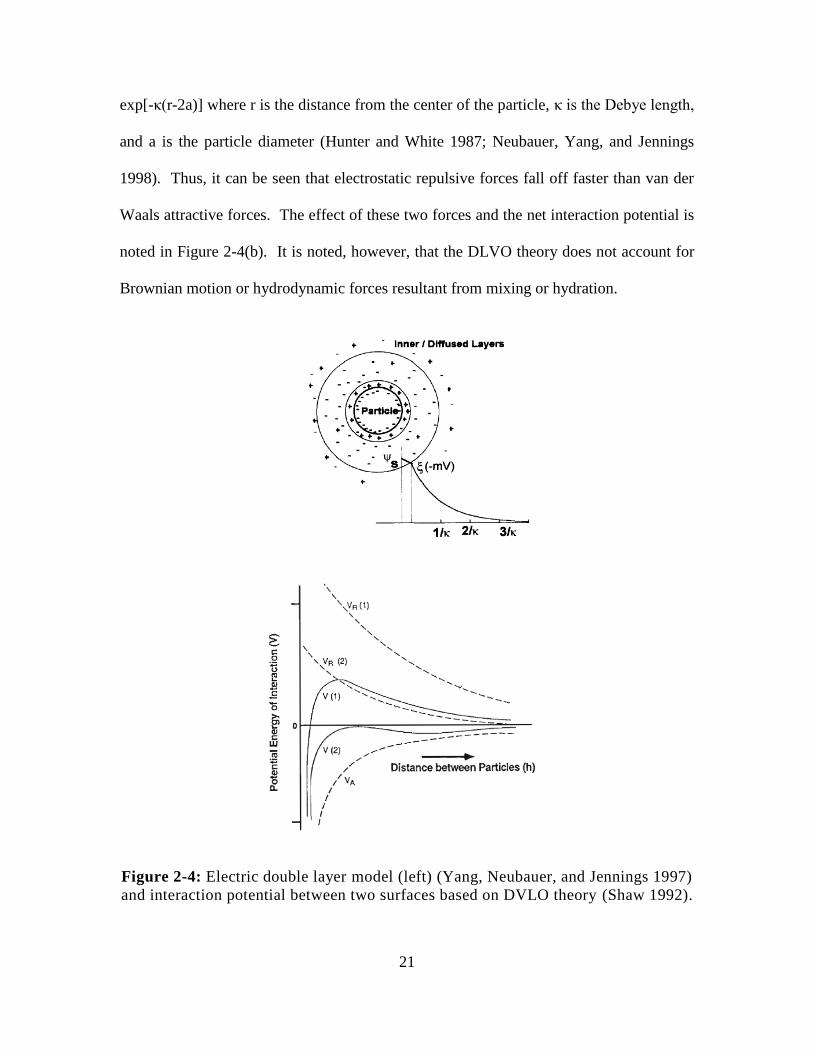
21
exp[-κ(r-2a)] where r is the distance from the center of the particle, κ is the Debye length,
and a is the particle diameter (Hunter and White 1987; Neubauer, Yang, and Jennings
1998). Thus, it can be seen that electrostatic repulsive forces fall off faster than van der
Waals attractive forces. The effect of these two forces and the net interaction potential is
noted in Figure 2-4(b). It is noted, however, that the DLVO theory does not account for
Brownian motion or hydrodynamic forces resultant from mixing or hydration.
Figure 2-4: Electric double layer model (left) (Yang, Neubauer, and Jennings 1997)
and interaction potential between two surfaces based on DVLO theory (Shaw 1992).
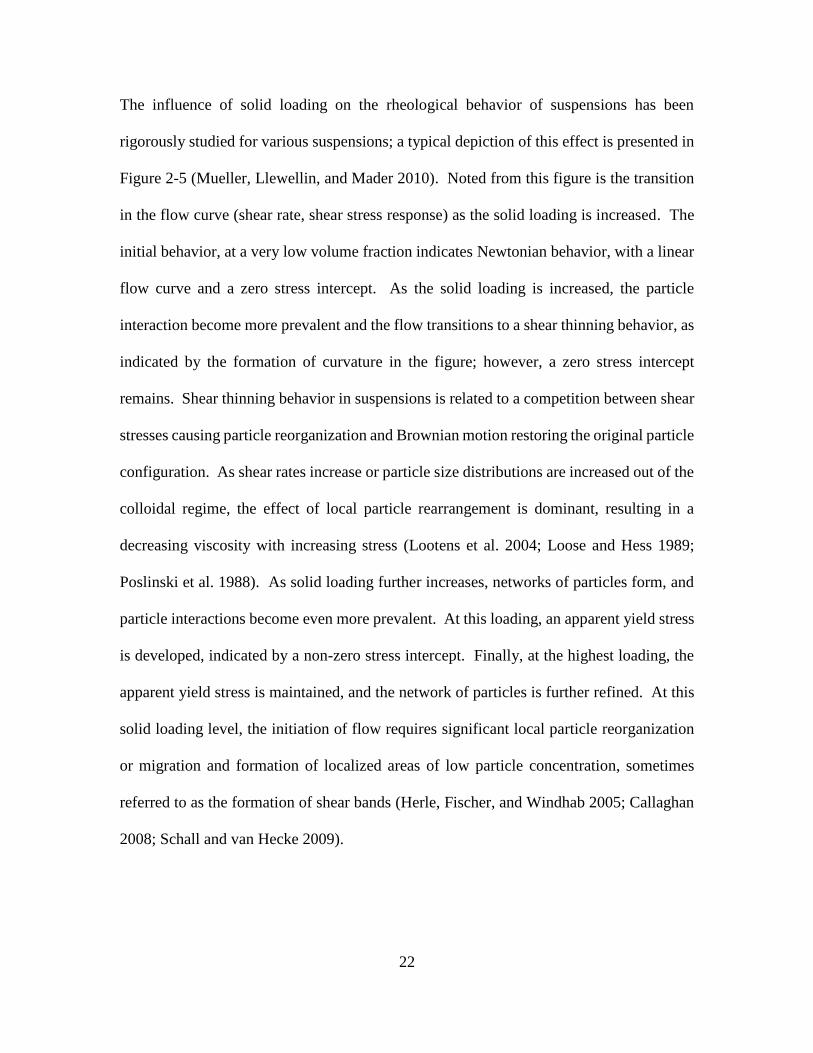
22
The influence of solid loading on the rheological behavior of suspensions has been
rigorously studied for various suspensions; a typical depiction of this effect is presented in
Figure 2-5 (Mueller, Llewellin, and Mader 2010). Noted from this figure is the transition
in the flow curve (shear rate, shear stress response) as the solid loading is increased. The
initial behavior, at a very low volume fraction indicates Newtonian behavior, with a linear
flow curve and a zero stress intercept. As the solid loading is increased, the particle
interaction become more prevalent and the flow transitions to a shear thinning behavior, as
indicated by the formation of curvature in the figure; however, a zero stress intercept
remains. Shear thinning behavior in suspensions is related to a competition between shear
stresses causing particle reorganization and Brownian motion restoring the original particle
configuration. As shear rates increase or particle size distributions are increased out of the
colloidal regime, the effect of local particle rearrangement is dominant, resulting in a
decreasing viscosity with increasing stress (Lootens et al. 2004; Loose and Hess 1989;
Poslinski et al. 1988). As solid loading further increases, networks of particles form, and
particle interactions become even more prevalent. At this loading, an apparent yield stress
is developed, indicated by a non-zero stress intercept. Finally, at the highest loading, the
apparent yield stress is maintained, and the network of particles is further refined. At this
solid loading level, the initiation of flow requires significant local particle reorganization
or migration and formation of localized areas of low particle concentration, sometimes
referred to as the formation of shear bands (Herle, Fischer, and Windhab 2005; Callaghan
2008; Schall and van Hecke 2009).
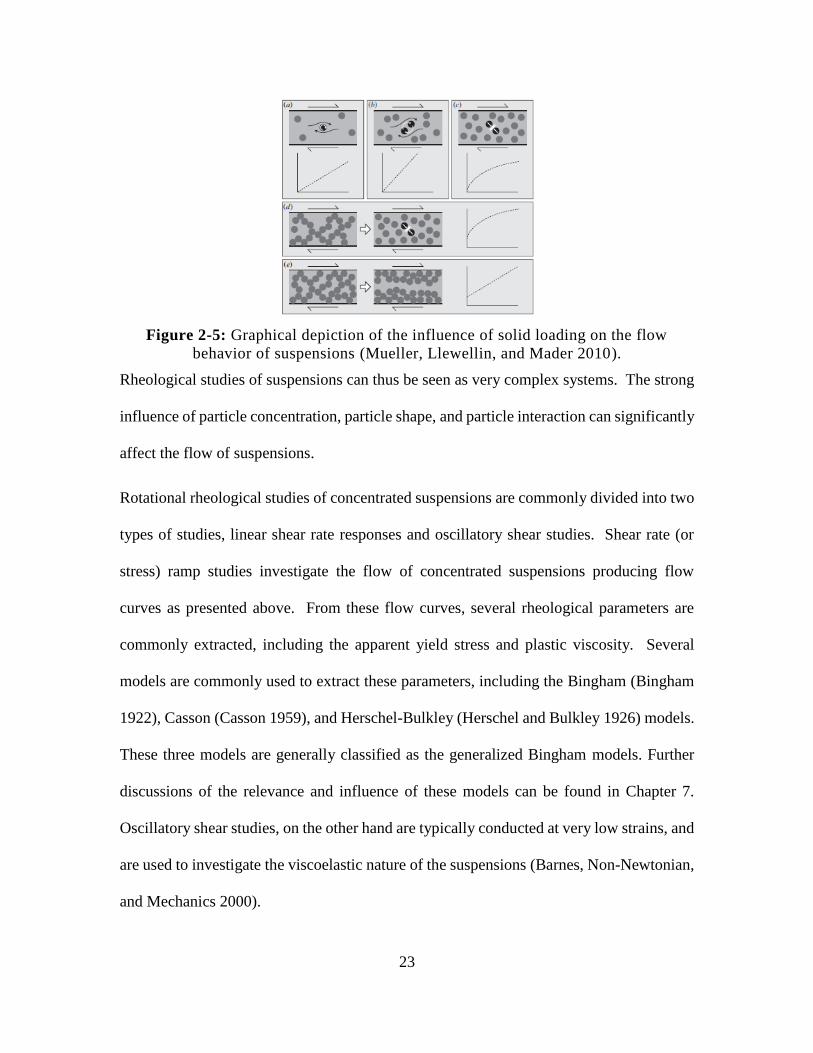
23
Figure 2-5: Graphical depiction of the influence of solid loading on the flow
behavior of suspensions (Mueller, Llewellin, and Mader 2010).
Rheological studies of suspensions can thus be seen as very complex systems. The strong
influence of particle concentration, particle shape, and particle interaction can significantly
affect the flow of suspensions.
Rotational rheological studies of concentrated suspensions are commonly divided into two
types of studies, linear shear rate responses and oscillatory shear studies. Shear rate (or
stress) ramp studies investigate the flow of concentrated suspensions producing flow
curves as presented above. From these flow curves, several rheological parameters are
commonly extracted, including the apparent yield stress and plastic viscosity. Several
models are commonly used to extract these parameters, including the Bingham (Bingham
1922), Casson (Casson 1959), and Herschel-Bulkley (Herschel and Bulkley 1926) models.
These three models are generally classified as the generalized Bingham models. Further
discussions of the relevance and influence of these models can be found in Chapter 7.
Oscillatory shear studies, on the other hand are typically conducted at very low strains, and
are used to investigate the viscoelastic nature of the suspensions (Barnes, Non-Newtonian,
and Mechanics 2000).
24
2.2.3 Rheology and Flow of Fresh Cement and Concrete
As mentioned previously, the study of flow of fresh cement in concrete is crucial to
providing insight into effects on pouring, finishing, casting, and pumping of fresh concrete.
Studies on the flow of concrete range from empirical tests such as the slump test (“ASTM
C143 - 12. Standard Test Method for Slump of Hydraulic-Cement Concrete” 2012) to
experiments using viscometers and rheometers. The slump test is a field test commonly
used to determine the workability of a concrete, wherein a concrete specimen is placed in
a cone, and then the cone is withdrawn and the distance the concrete settles is recorded as
the slump. Thus, a higher slump indicates a mixture that is more fluid and a lower slump
indicates one that is stiffer. The results of the slump test are generally considered to be a
measurement of the yield stress of the concrete (Saak, Jennings, and Shah 2004; Nicolas
Roussel 2006; N. Roussel and Coussot 2005); however, relationships between determined
yield stress and slump often have a fair amount of scatter. This is likely due to the fact that
the flow of concrete cannot be effectively modelled by a single parameter, and thus slump
estimations of yield stress are prone to error.
The second method of investigating the rheological properties of concrete and portland
cement suspensions is through the use of rotational viscometers or rheometers. The
majority of rheological studies of cementitious systems involve rheological studies of the
cement pastes, rather than of the concrete, and relate the properties of the paste to the
properties of concrete. This is due to the increased complexity and size requirements of
measuring the rheological characteristics of the concrete itself. It is noted that concrete is
a suspension of rock and sand, where the suspending fluid is a paste, while the suspending
fluid itself is also a suspension of portland cement, gypsum, and hydration products in
25
water. The range of scales from the macro – aggregate in paste, to micro – cement in water,
make investigations of the concrete itself a challenging endeavor. Some studies have
developed large scale viscometers to perform these types of investigations (Banfill and
others 2003; C. F Ferraris and de Larrard, Francois; Ferraris and Gaidis 1992); however,
the use of this equipment was not available as part of this dissertation, so the focus here
will be on the rheological characterization of cementitious pastes.
Rheological studies of cementitious systems are common in the industry and have been
completed dating back several decades. Several comprehensive reviews have been
performed on this topic, and the author directs the reader to one of these reviews for a more
complete discussion (Banfill 2006). In general rheological studies have been focused on
two key areas: the influence of cement constitution on the rheological performance of
cementitious suspensions (Ferraris, Obla, and Hill 2001; Park, Noh, and Park 2005; D. P.
Bentz et al. 2012; Grzeszczyk and Lipowski 1997) and the influence of admixtures on these
suspensions (Burgos-Montes et al. 2012; Asaga and Roy 1980; Daimon and Roy 1979;
Lachemi et al. 2004). As the work completed in this dissertation is focused primarily at
the physicochemical changes in suspensions that result from changes in cement
constitution, the focus of this literature review will be primarily aimed at these influences.
Several key factors have been noted to influence the rheological behavior of cementitious
suspensions when admixtures are present: the inclusion of mineral admixtures, the
inclusion of pozzolanic materials, and the size and shape distribution of the particles
present in the suspension. Investigations of these key factors provide insight into the
overall behavior of these systems, as well as provide background for the discussions in this
paper. As solids content in portland cement is increased, there is a corresponding increase
26
in the determined rheological properties, as would be expected from the discussions above
(Justnes and Vikan 2005). The influence of the surface area of portland cement was studied
by Vikan (H. Vikan et al. 2007), where it was noted that increasing the specific surface
area by additional grinding of the portland cement clinker led to an increased flow
resistance due to decreased particle spacing.
It is notable that there have been many conflicting reports with respect to the influence of
cement replacement on the rheological properties of portland cement suspensions. For
example, at a water-to-powder (w/p) ratio of 0.5, Nehdi (Nehdi and Rahman 2004a)
showed reductions in yield stress for most models used with 25% fly ash replacement;
however, at a lower w/p ratio (0.4), an increase in yield stress was noted. Further,
significant variability was noted in the determined yield stress based on the selected model.
Ferraris (Ferraris, Obla, and Hill 2001) generally showed enhanced flowability when
cement was replaced by ultrafine fly ash indicated by the reduced need for high range water
reducing admixtures (HRWR). However, in neither of the above cases was the class of fly
ash indicated. Rudzinski noted an increase in determined rheological properties when fly
ash is included; however, the fly ash was added, not used as cement replacement, thereby
decreasing the w/p ratio of the suspension. The use of Class C, or high calcium fly ash,
resulted in a general decrease in flowability of the suspension (Grzeszczyk and Lipowski
1997). The inclusion of Class F fly ash on the other hand, has been shown to reduce both
the yield stress and plastic viscosity of the suspension. Park noted a decrease in yield stress
but increase in plastic viscosity when portland cement was replaced by fly ash (Park, Noh,
and Park 2005). The cause of these varied results may be attributed to material variability,
27
differences in experimentation, differences in chemical admixtures, and possibly issues
with the rheological models themselves.
The reported influences of limestone on the rheological properties of portland cement
suspensions was also varied. Yahia reported that up to a certain dosage the inclusion of
limestone had no influence of the flowability of the paste; however, limestone was replaced
by mass in this study and the limestone size was not specified (Yahia, Tanimura, and
Shimoyama 2005). Similarly Sakai reported improved flowability with replacement of low
heat cement by fine limestone (Sakai et al. 2009). Ultrafine fly addition was shown to
reduce yield stress and plastic viscosity at inclusion values up to 10% (X. Zhang and Han
2000); however, several results in this study indicated a zero yield stress, and further it
appeared this was an addition rather than replacement to a portland cement suspension.
2.2.4 Rheology of Alkali Activated Geopolymer Suspensions
Alkali activated geopolymers are cement-free binder systems for concrete composed of
aluminosilicate materials which are activated by a highly alkaline solution, typically of Na
or K (Davidovits 1991). The aluminosilicate materials typically used as the binders in
these systems are slag, fly ash, and metakaolin. As the focus of this dissertation is on the
early age flow characteristics of these systems, a further review of geopolymers is not
provided; however, the author directs the reader to several papers on the topic (Davidovits
1991; Provis et al. 2007; Phair, Smith, and Van Deventer 2003) which more thoroughly
review the nature of these materials including polymerization reactions and hydration. A
review of the literature found very little work done on the rheological characterizations of
geopolymer solutions. The majority of the studies found were focused on investigations
of the influence of chemical admixtures on these suspensions (Bakharev, Sanjayan, and
28
Cheng 2000; Criado et al. 2009; Palacios and Puertas 2005; Palacios et al. 2009a), with the
majority of the studies indicating admixtures had variable or inconsistent effects in these
systems. The rheological nature of metakaolin based geopolymers was studied; however,
this was a study of the viscoelastic development of metakaolin over time, rather than an
investigation of the flow of the fresh paste (Poulesquen, Frizon, and Lambertin 2013a).
The influence of the type of activator, the influence of activator concentration, and the
influence of activator cation on the rheological performance of these suspensions has not
studied in the literature, thus there remains a significant gap in the understanding of these
systems.
29
3. MATERIALS AND EXPERIMENTAL METHODS
3.1 Materials
This study was completed using a wide variety of materials, including: portland cement,
limestone, metakaolin, fly ash, and ground granulated blast furnace slag. As these materials
varied for each section of the project, the author directs the reader to the individual
materials sections in each chapter for information on the materials used in this work.
3.2 Experimental Methods
As with materials, experimental methods varied significantly, particularly with respect to
rheological characterization of these materials. Based on this, a broad overview of the
experimental methods used in this dissertation is provided. For a more in depth look that
the experimental methods used in each section, the author directs the reader to the
experimental methods sections in each chapter.
3.3 Curing Conditions and Mixing for Tests on Hardened Cement Pastes
Mixing for tests on hardened concrete specimens was performed in accordance with ASTM
C305. All powders were dry blended prior to adding water. All mixes in this study were
completed without the use of chemical admixtures to distinguish the effects of mixture
constitution without influence of admixtures.
For tests on hardened cement pastes, two different curing regimes were used in this study.
The first method was for samples for compression testing and thermal analysis. Samples
were cast and the cured until the desired testing age in a humidity chamber with a relative
humidity ≥ 95% at a temperature of 23±1 °C. At the desired testing age, samples were
removed from the chamber and blotted dry with a towel. Compressive test samples were
cured for the first 24 hours loosely covered with plastic, after which they were demolded
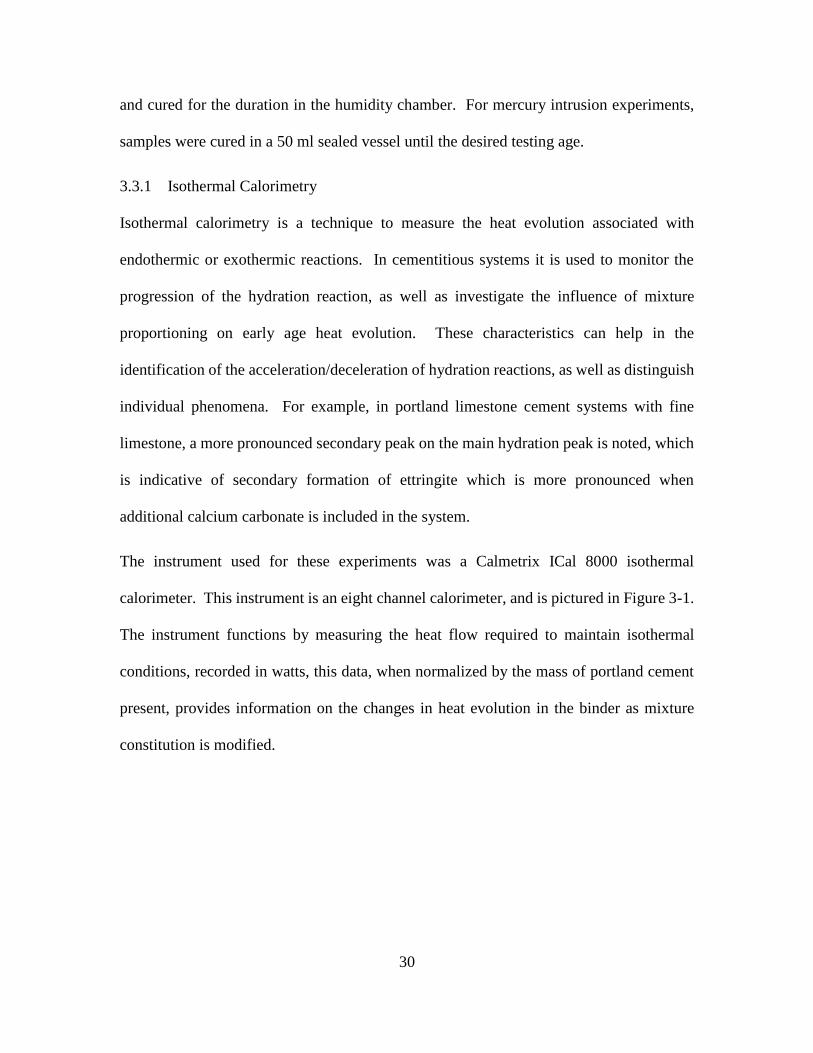
30
and cured for the duration in the humidity chamber. For mercury intrusion experiments,
samples were cured in a 50 ml sealed vessel until the desired testing age.
3.3.1 Isothermal Calorimetry
Isothermal calorimetry is a technique to measure the heat evolution associated with
endothermic or exothermic reactions. In cementitious systems it is used to monitor the
progression of the hydration reaction, as well as investigate the influence of mixture
proportioning on early age heat evolution. These characteristics can help in the
identification of the acceleration/deceleration of hydration reactions, as well as distinguish
individual phenomena. For example, in portland limestone cement systems with fine
limestone, a more pronounced secondary peak on the main hydration peak is noted, which
is indicative of secondary formation of ettringite which is more pronounced when
additional calcium carbonate is included in the system.
The instrument used for these experiments was a Calmetrix ICal 8000 isothermal
calorimeter. This instrument is an eight channel calorimeter, and is pictured in Figure 3-1.
The instrument functions by measuring the heat flow required to maintain isothermal
conditions, recorded in watts, this data, when normalized by the mass of portland cement
present, provides information on the changes in heat evolution in the binder as mixture
constitution is modified.
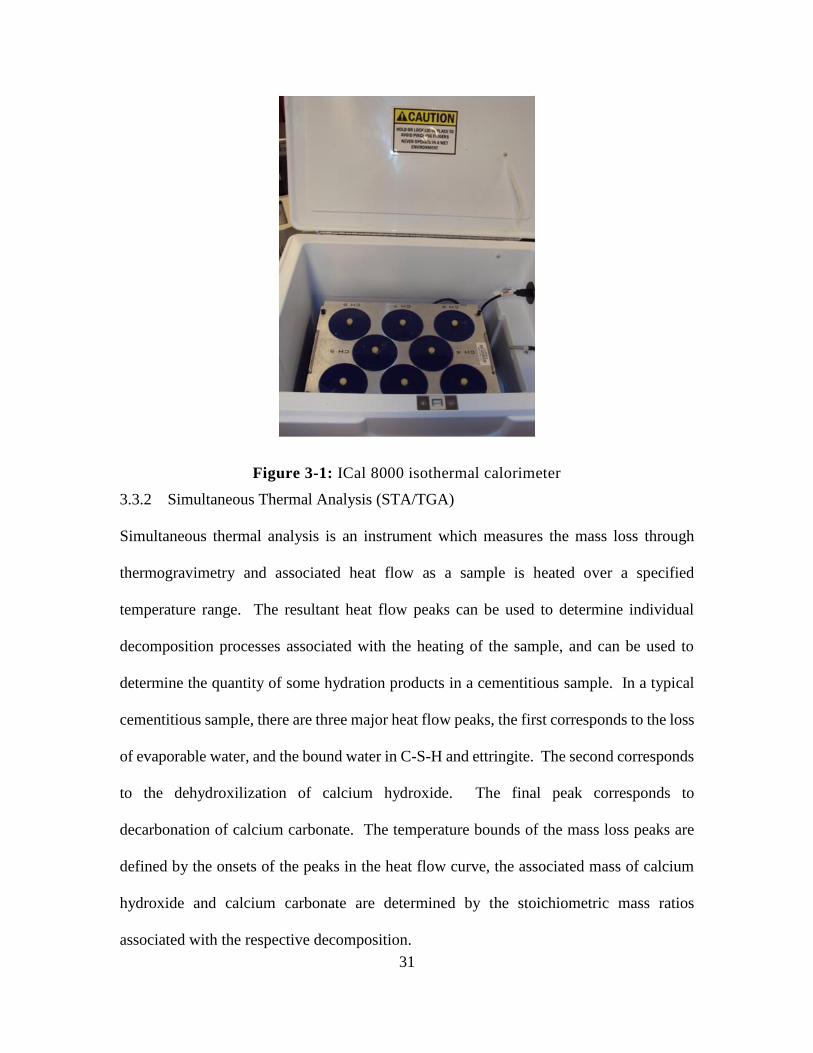
31
Figure 3-1: ICal 8000 isothermal calorimeter
3.3.2 Simultaneous Thermal Analysis (STA/TGA)
Simultaneous thermal analysis is an instrument which measures the mass loss through
thermogravimetry and associated heat flow as a sample is heated over a specified
temperature range. The resultant heat flow peaks can be used to determine individual
decomposition processes associated with the heating of the sample, and can be used to
determine the quantity of some hydration products in a cementitious sample. In a typical
cementitious sample, there are three major heat flow peaks, the first corresponds to the loss
of evaporable water, and the bound water in C-S-H and ettringite. The second corresponds
to the dehydroxilization of calcium hydroxide. The final peak corresponds to
decarbonation of calcium carbonate. The temperature bounds of the mass loss peaks are
defined by the onsets of the peaks in the heat flow curve, the associated mass of calcium
hydroxide and calcium carbonate are determined by the stoichiometric mass ratios
associated with the respective decomposition.
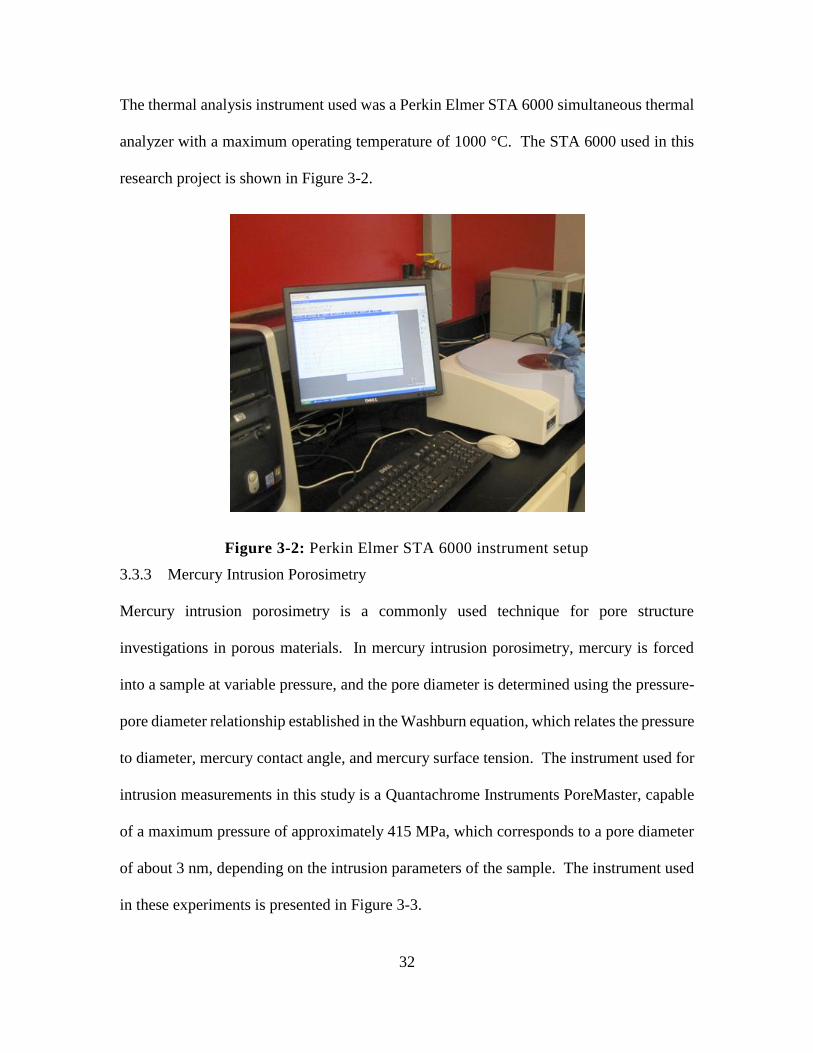
32
The thermal analysis instrument used was a Perkin Elmer STA 6000 simultaneous thermal
analyzer with a maximum operating temperature of 1000 °C. The STA 6000 used in this
research project is shown in Figure 3-2.
Figure 3-2: Perkin Elmer STA 6000 instrument setup
3.3.3 Mercury Intrusion Porosimetry
Mercury intrusion porosimetry is a commonly used technique for pore structure
investigations in porous materials. In mercury intrusion porosimetry, mercury is forced
into a sample at variable pressure, and the pore diameter is determined using the pressure-
pore diameter relationship established in the Washburn equation, which relates the pressure
to diameter, mercury contact angle, and mercury surface tension. The instrument used for
intrusion measurements in this study is a Quantachrome Instruments PoreMaster, capable
of a maximum pressure of approximately 415 MPa, which corresponds to a pore diameter
of about 3 nm, depending on the intrusion parameters of the sample. The instrument used
in these experiments is presented in Figure 3-3.
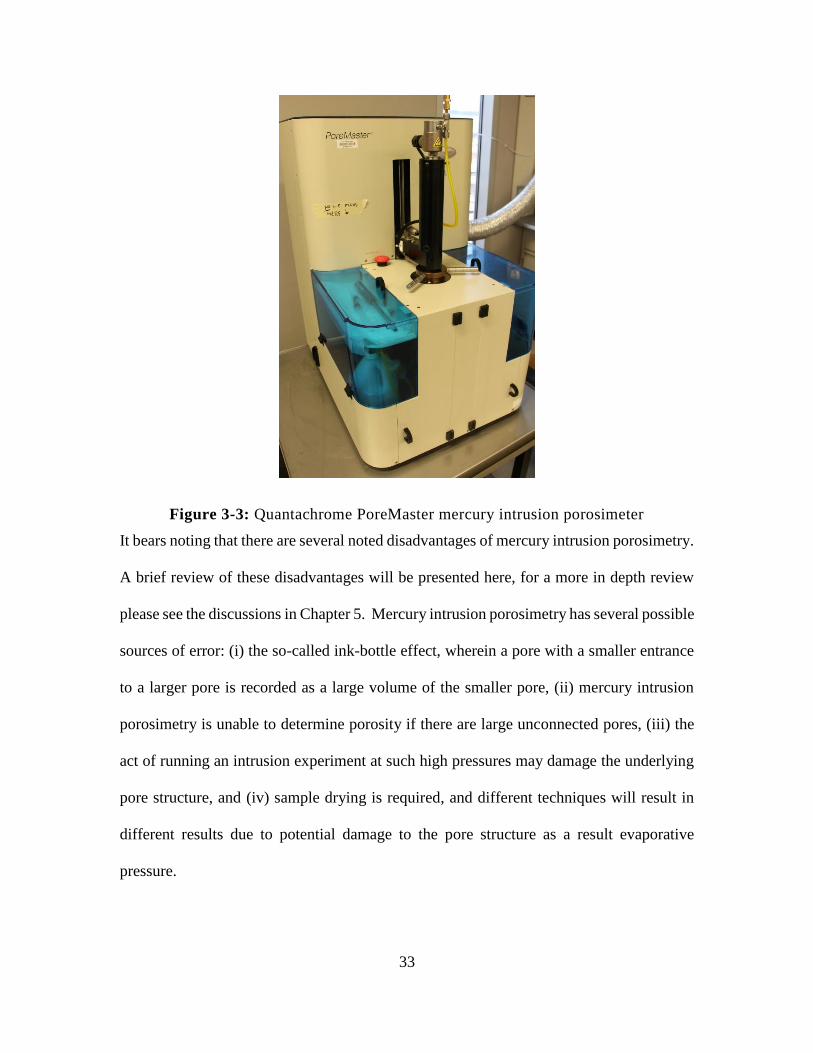
33
Figure 3-3: Quantachrome PoreMaster mercury intrusion porosimeter
It bears noting that there are several noted disadvantages of mercury intrusion porosimetry.
A brief review of these disadvantages will be presented here, for a more in depth review
please see the discussions in Chapter 5. Mercury intrusion porosimetry has several possible
sources of error: (i) the so-called ink-bottle effect, wherein a pore with a smaller entrance
to a larger pore is recorded as a large volume of the smaller pore, (ii) mercury intrusion
porosimetry is unable to determine porosity if there are large unconnected pores, (iii) the
act of running an intrusion experiment at such high pressures may damage the underlying
pore structure, and (iv) sample drying is required, and different techniques will result in
different results due to potential damage to the pore structure as a result evaporative
pressure.
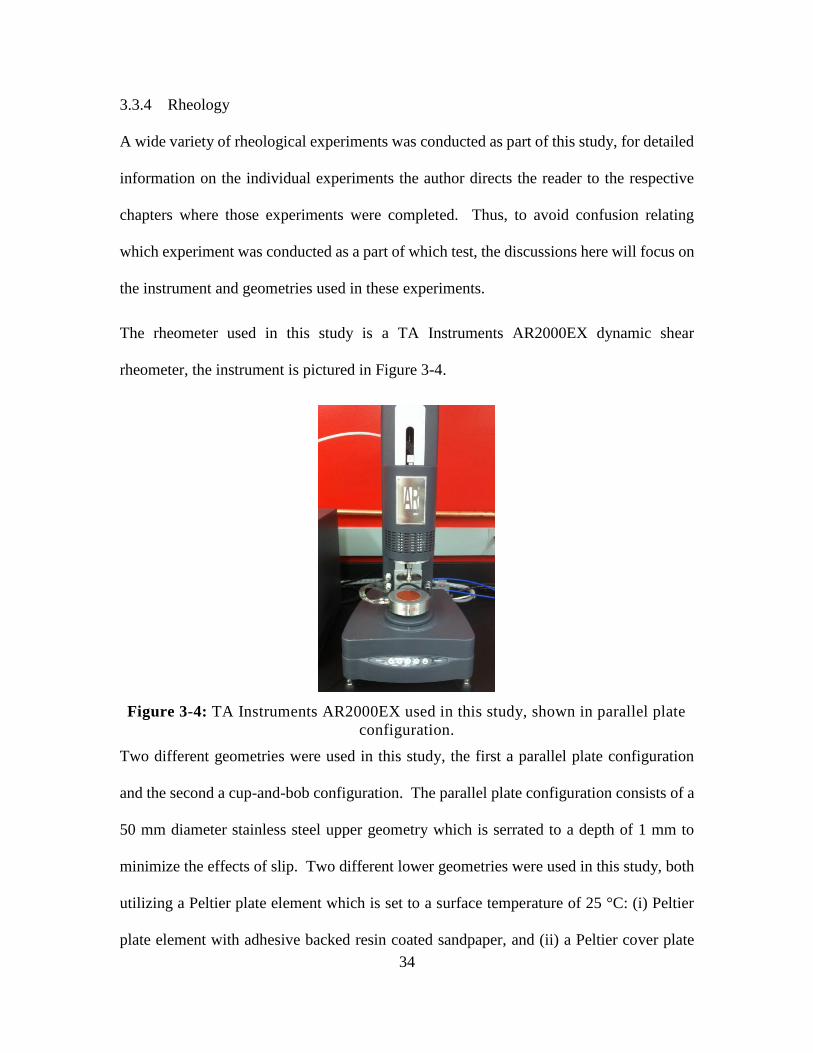
34
3.3.4 Rheology
A wide variety of rheological experiments was conducted as part of this study, for detailed
information on the individual experiments the author directs the reader to the respective
chapters where those experiments were completed. Thus, to avoid confusion relating
which experiment was conducted as a part of which test, the discussions here will focus on
the instrument and geometries used in these experiments.
The rheometer used in this study is a TA Instruments AR2000EX dynamic shear
rheometer, the instrument is pictured in Figure 3-4.
Figure 3-4: TA Instruments AR2000EX used in this study, shown in parallel plate
configuration.
Two different geometries were used in this study, the first a parallel plate configuration
and the second a cup-and-bob configuration. The parallel plate configuration consists of a
50 mm diameter stainless steel upper geometry which is serrated to a depth of 1 mm to
minimize the effects of slip. Two different lower geometries were used in this study, both
utilizing a Peltier plate element which is set to a surface temperature of 25 °C: (i) Peltier
plate element with adhesive backed resin coated sandpaper, and (ii) a Peltier cover plate
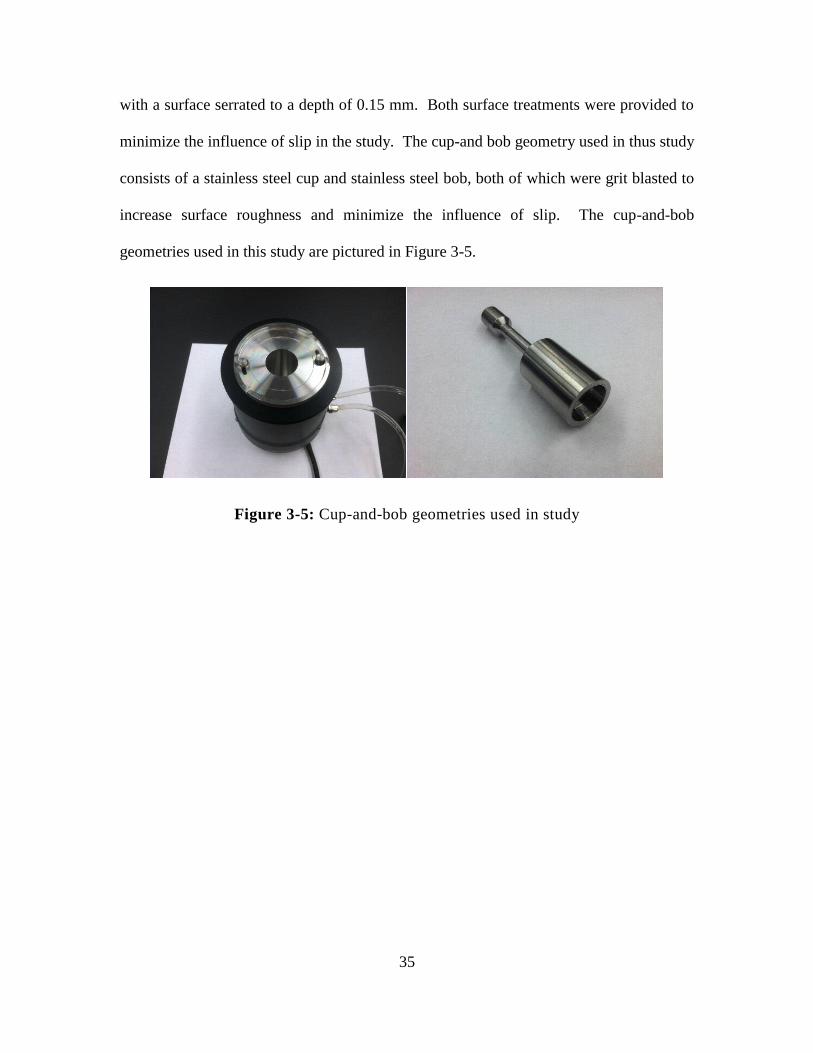
35
with a surface serrated to a depth of 0.15 mm. Both surface treatments were provided to
minimize the influence of slip in the study. The cup-and bob geometry used in thus study
consists of a stainless steel cup and stainless steel bob, both of which were grit blasted to
increase surface roughness and minimize the influence of slip. The cup-and-bob
geometries used in this study are pictured in Figure 3-5.
Figure 3-5: Cup-and-bob geometries used in study

36
PART I – HYDRATION AND PORE STRUCTURE
37
4. HYDRATION AND STRENGTH DEVELOPMENT IN TERNARY PORTLAND
CEMENT BLENDS CONTAINING LIMESTONE AND FLY ASH OR
METAKAOLIN
4.1 Introduction
In recent years there has been increased interest in the use of limestone powder as a partial
cement replacement material. Limestone has the advantages of being abundant,
inexpensive, and without the environmental costs associated with Portland cement.
Portland limestone cements have been in extensive use in Europe and Canada since the
1990s. ASTM standards historically allowed only up to 5% limestone (mass basis) in
cement, and it has been shown that such low replacement levels can result in comparable
or better properties as compared to plain cements (Tsivilis, Chaniotakis, Badogiannis, et
al. 1999; Voglis et al. 2005). Recently ASTM C 595-12 has defined a Type IL cement that
can include up to 15% of limestone powder as a cement replacement material (Tennis,
Thomas, and Weiss 2011).
The incorporation of limestone powder modifies the hydration process in low water-to-
cement ratio (w/c) cement systems where a substantial fraction of the cement remains
unhydrated (V. Bonavetti et al. 2003; D. Bentz et al. 2009a). The use of appropriate size
ranges of limestone powder as a filler material has been reported to result in similar/better
fresh properties in self-consolidating concretes, inspite of reduced cement contents
(Felekoğlu et al. 2006). The use of fine limestone powder (finer than OPC) provides
nucleation sites and thus accelerates C3S hydration (Oey et al. 2012; V. Bonavetti et al.
2003; Lothenbach et al. 2008), while participating to a limited extent in the cement
hydration reactions (L. Opoczky 1992). For this reason, fine limestone powder has been
38
used to limit delays in setting in high volume fly ash mixtures (D. P Bentz and Ferraris
2010). The use of limestone powder has been shown to slightly increase compressive
strength (Tsivilis, Chaniotakis, Badogiannis, et al. 1999), while contrary results have also
been reported (D. Bentz et al. 2009b; Voglis et al. 2005; Dhir et al. 2007). The likely cause
of these discrepancies is the use of limestone powders of different fineness, the dosage of
limestone powder, water-to-powder ratios, and the type/fineness of cement used. Fine
fillers have been shown to decrease the capillary porosity of the paste, which may account
for some of the strength gain reported (D. Bentz et al. 2009a). It has been shown that by
increasing the fineness of Portland cement or decreasing the water-to-solids ratio (w/s),
some of the strength loss associated with limestone additions can be mitigated (V.
Bonavetti et al. 2003; Tsivilis, Chaniotakis, Badogiannis, et al. 1999; Cam and Neithalath
2010).
Limestone powder has been shown to chemically interact with the aluminate phases in
cement (Ingram et al. 1990) to stabilize a carboaluminate phase at the expense of
monosulfoaluminate (Matschei, Lothenbach, and Glasser 2007b). This action can, within
limits, increase the quantity of ettringite formed which leads to an increase in solid volume,
and thus slightly improved mechanical properties. In pure C3A systems, it has been shown
that a significant portion of the carbonate will be consumed after 24 hours (V. L. Bonavetti,
Rahhal, and Irassar 2001). In the case of OPC pastes, limestone is expected to react with
the aluminous clinker phases (Kakali et al. 2000), ensuring that, at low replacement levels
(< 5%, mass basis) much if not all of the calcite will be consumed through the course of
hydration (Matschei, Lothenbach, and Glasser 2007b).
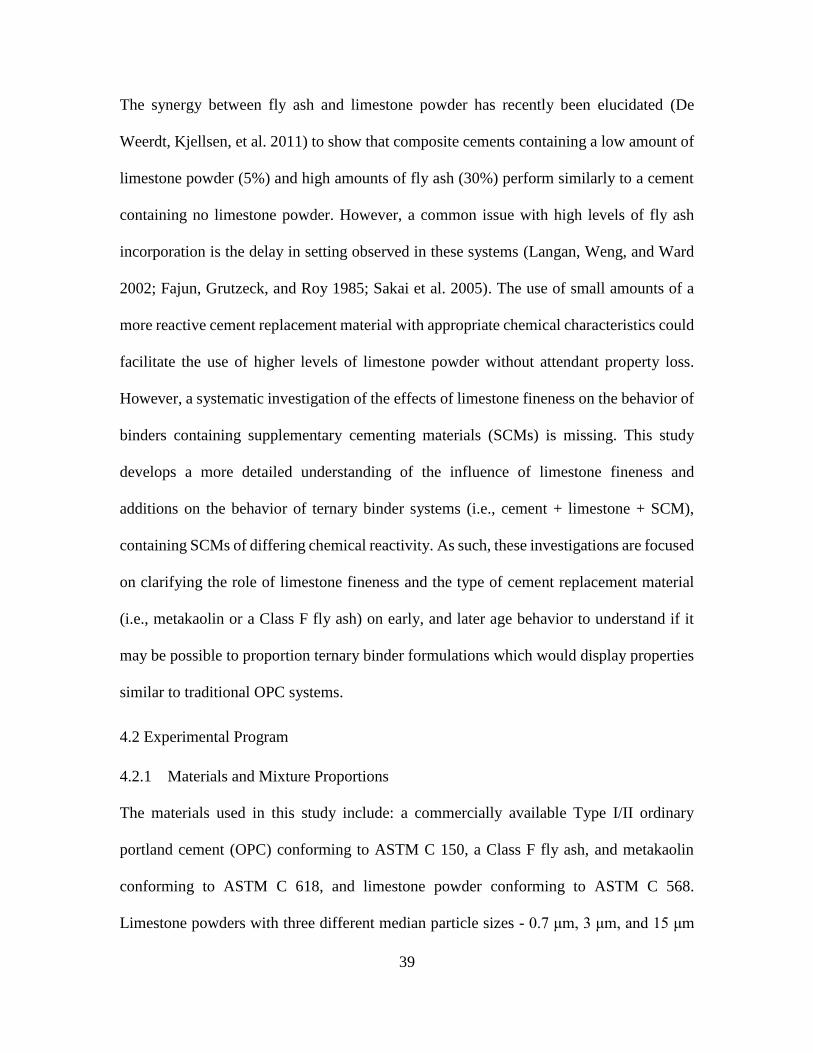
39
The synergy between fly ash and limestone powder has recently been elucidated (De
Weerdt, Kjellsen, et al. 2011) to show that composite cements containing a low amount of
limestone powder (5%) and high amounts of fly ash (30%) perform similarly to a cement
containing no limestone powder. However, a common issue with high levels of fly ash
incorporation is the delay in setting observed in these systems (Langan, Weng, and Ward
2002; Fajun, Grutzeck, and Roy 1985; Sakai et al. 2005). The use of small amounts of a
more reactive cement replacement material with appropriate chemical characteristics could
facilitate the use of higher levels of limestone powder without attendant property loss.
However, a systematic investigation of the effects of limestone fineness on the behavior of
binders containing supplementary cementing materials (SCMs) is missing. This study
develops a more detailed understanding of the influence of limestone fineness and
additions on the behavior of ternary binder systems (i.e., cement + limestone + SCM),
containing SCMs of differing chemical reactivity. As such, these investigations are focused
on clarifying the role of limestone fineness and the type of cement replacement material
(i.e., metakaolin or a Class F fly ash) on early, and later age behavior to understand if it
may be possible to proportion ternary binder formulations which would display properties
similar to traditional OPC systems.
4.2 Experimental Program
4.2.1 Materials and Mixture Proportions
The materials used in this study include: a commercially available Type I/II ordinary
portland cement (OPC) conforming to ASTM C 150, a Class F fly ash, and metakaolin
conforming to ASTM C 618, and limestone powder conforming to ASTM C 568.
Limestone powders with three different median particle sizes - 0.7 μm, 3 μm, and 15 μm
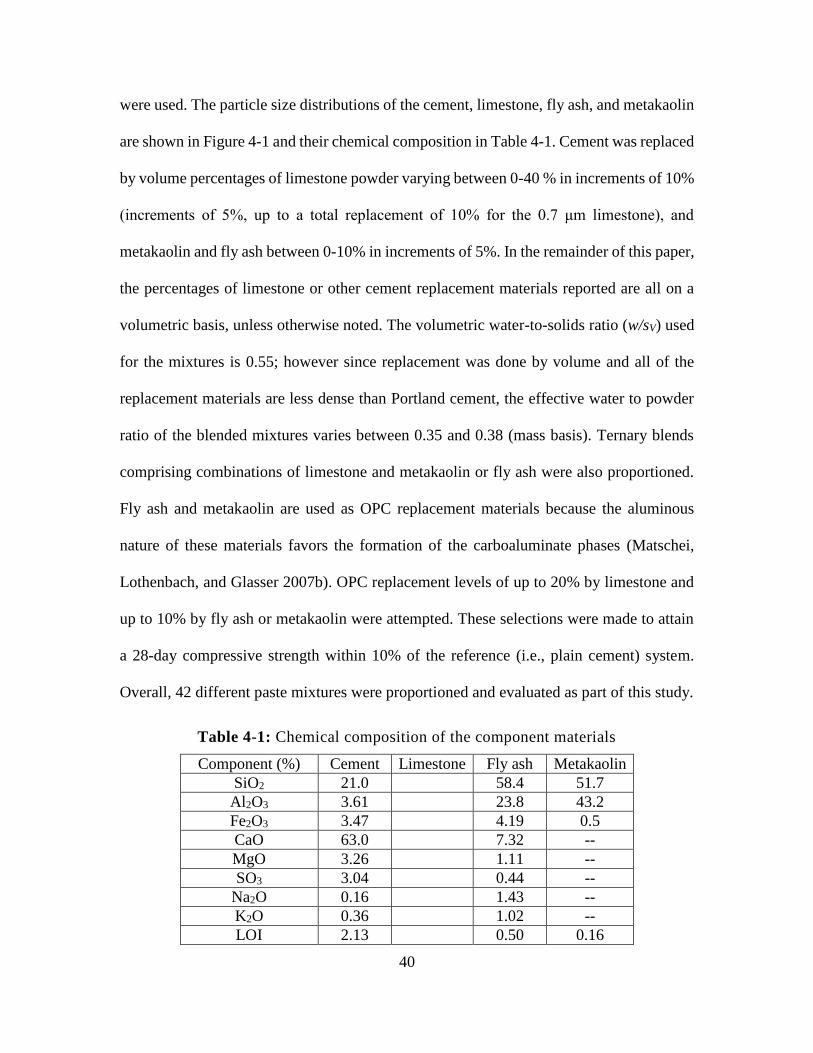
40
were used. The particle size distributions of the cement, limestone, fly ash, and metakaolin
are shown in Figure 4-1 and their chemical composition in Table 4-1. Cement was replaced
by volume percentages of limestone powder varying between 0-40 % in increments of 10%
(increments of 5%, up to a total replacement of 10% for the 0.7 μm limestone), and
metakaolin and fly ash between 0-10% in increments of 5%. In the remainder of this paper,
the percentages of limestone or other cement replacement materials reported are all on a
volumetric basis, unless otherwise noted. The volumetric water-to-solids ratio (w/sV) used
for the mixtures is 0.55; however since replacement was done by volume and all of the
replacement materials are less dense than Portland cement, the effective water to powder
ratio of the blended mixtures varies between 0.35 and 0.38 (mass basis). Ternary blends
comprising combinations of limestone and metakaolin or fly ash were also proportioned.
Fly ash and metakaolin are used as OPC replacement materials because the aluminous
nature of these materials favors the formation of the carboaluminate phases (Matschei,
Lothenbach, and Glasser 2007b). OPC replacement levels of up to 20% by limestone and
up to 10% by fly ash or metakaolin were attempted. These selections were made to attain
a 28-day compressive strength within 10% of the reference (i.e., plain cement) system.
Overall, 42 different paste mixtures were proportioned and evaluated as part of this study.
Table 4-1: Chemical composition of the component materials
Component (%) Cement Limestone Fly ash Metakaolin
SiO2 21.0 58.4 51.7
Al2O3 3.61 23.8 43.2
Fe2O3 3.47 4.19 0.5
CaO 63.0 7.32 --
MgO 3.26 1.11 --
SO3 3.04 0.44 --
Na2O 0.16 1.43 --
K2O 0.36 1.02 --
LOI 2.13 0.50 0.16
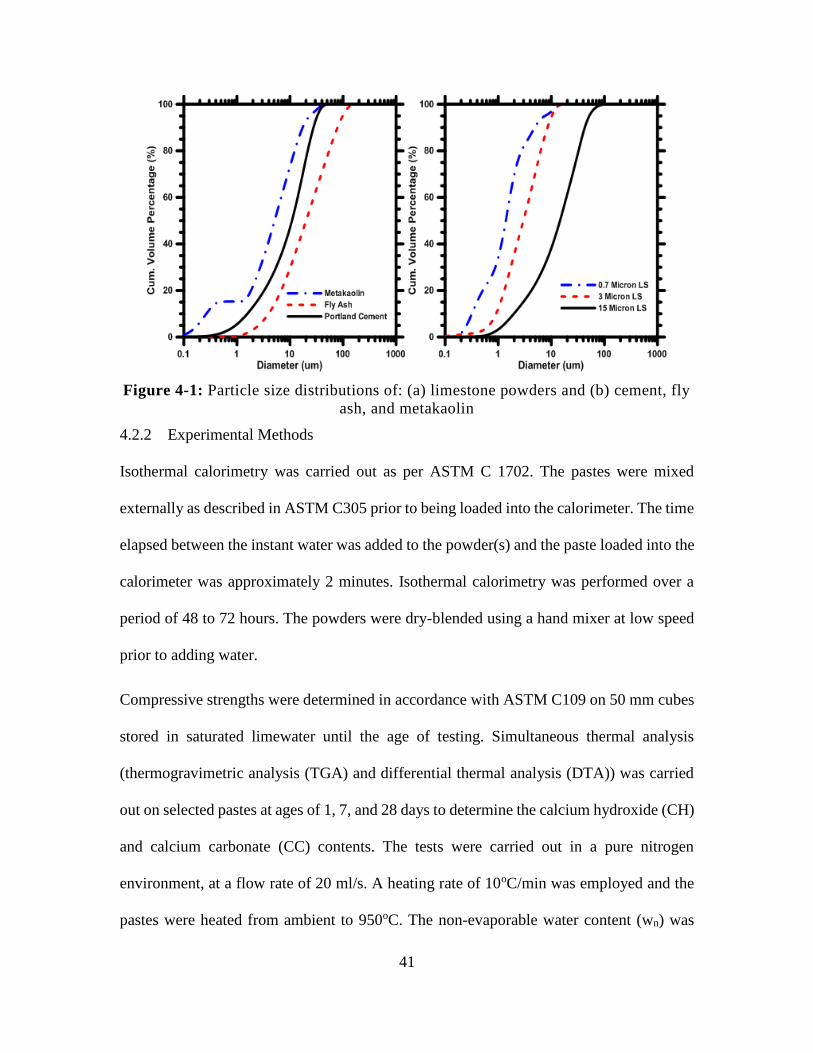
41
Figure 4-1: Particle size distributions of: (a) limestone powders and (b) cement, fly
ash, and metakaolin
4.2.2 Experimental Methods
Isothermal calorimetry was carried out as per ASTM C 1702. The pastes were mixed
externally as described in ASTM C305 prior to being loaded into the calorimeter. The time
elapsed between the instant water was added to the powder(s) and the paste loaded into the
calorimeter was approximately 2 minutes. Isothermal calorimetry was performed over a
period of 48 to 72 hours. The powders were dry-blended using a hand mixer at low speed
prior to adding water.
Compressive strengths were determined in accordance with ASTM C109 on 50 mm cubes
stored in saturated limewater until the age of testing. Simultaneous thermal analysis
(thermogravimetric analysis (TGA) and differential thermal analysis (DTA)) was carried
out on selected pastes at ages of 1, 7, and 28 days to determine the calcium hydroxide (CH)
and calcium carbonate (CC) contents. The tests were carried out in a pure nitrogen
environment, at a flow rate of 20 ml/s. A heating rate of 10oC/min was employed and the
pastes were heated from ambient to 950oC. The non-evaporable water content (wn) was
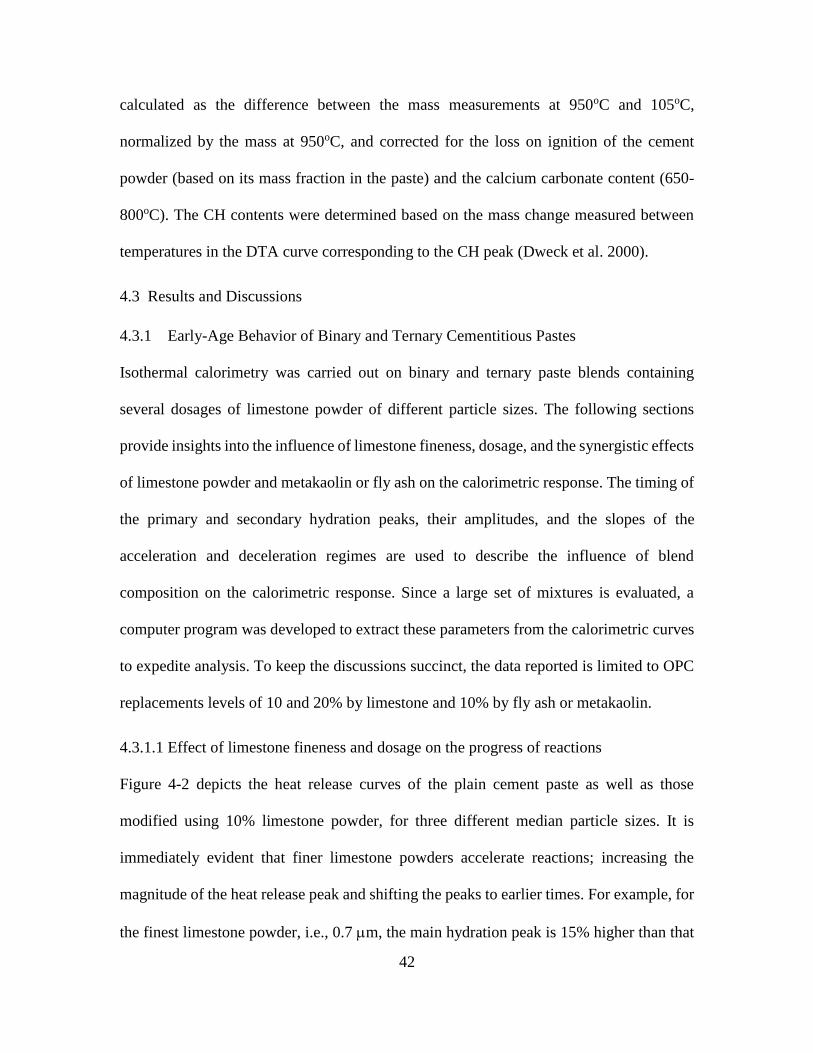
42
calculated as the difference between the mass measurements at 950oC and 105oC,
normalized by the mass at 950oC, and corrected for the loss on ignition of the cement
powder (based on its mass fraction in the paste) and the calcium carbonate content (650-
800oC). The CH contents were determined based on the mass change measured between
temperatures in the DTA curve corresponding to the CH peak (Dweck et al. 2000).
4.3 Results and Discussions
4.3.1 Early-Age Behavior of Binary and Ternary Cementitious Pastes
Isothermal calorimetry was carried out on binary and ternary paste blends containing
several dosages of limestone powder of different particle sizes. The following sections
provide insights into the influence of limestone fineness, dosage, and the synergistic effects
of limestone powder and metakaolin or fly ash on the calorimetric response. The timing of
the primary and secondary hydration peaks, their amplitudes, and the slopes of the
acceleration and deceleration regimes are used to describe the influence of blend
composition on the calorimetric response. Since a large set of mixtures is evaluated, a
computer program was developed to extract these parameters from the calorimetric curves
to expedite analysis. To keep the discussions succinct, the data reported is limited to OPC
replacements levels of 10 and 20% by limestone and 10% by fly ash or metakaolin.
4.3.1.1 Effect of limestone fineness and dosage on the progress of reactions
Figure 4-2 depicts the heat release curves of the plain cement paste as well as those
modified using 10% limestone powder, for three different median particle sizes. It is
immediately evident that finer limestone powders accelerate reactions; increasing the
magnitude of the heat release peak and shifting the peaks to earlier times. For example, for
the finest limestone powder, i.e., 0.7 m, the main hydration peak is 15% higher than that
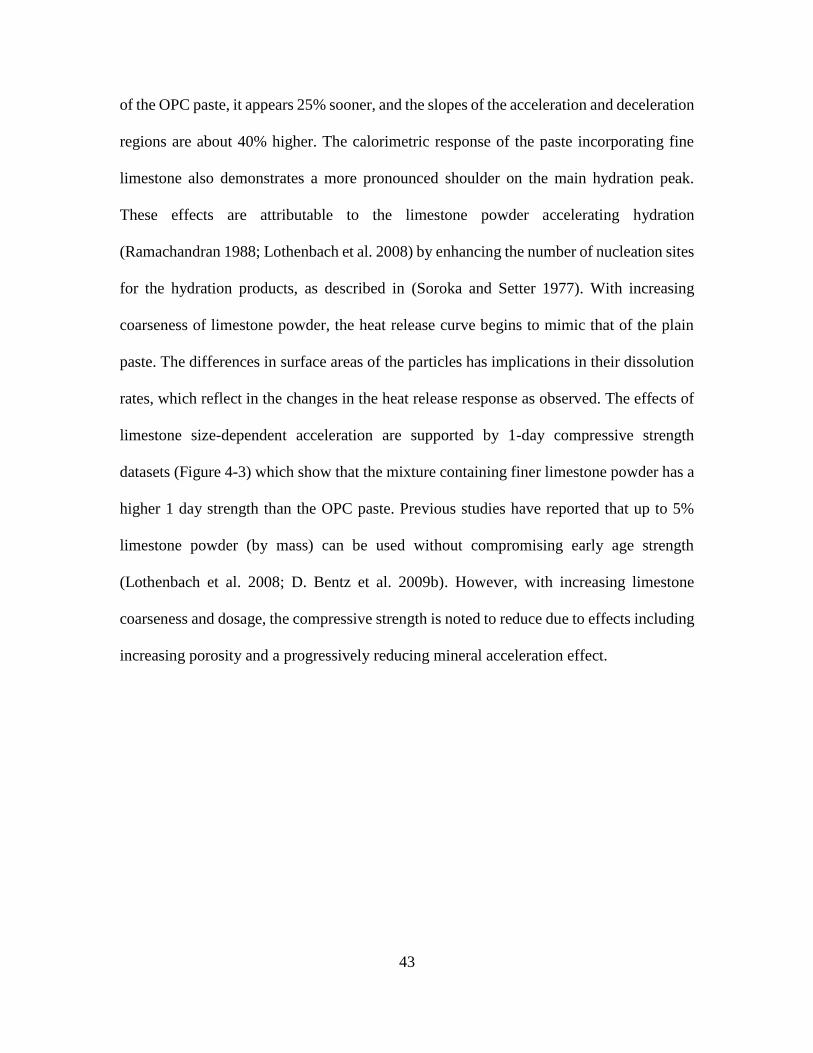
43
of the OPC paste, it appears 25% sooner, and the slopes of the acceleration and deceleration
regions are about 40% higher. The calorimetric response of the paste incorporating fine
limestone also demonstrates a more pronounced shoulder on the main hydration peak.
These effects are attributable to the limestone powder accelerating hydration
(Ramachandran 1988; Lothenbach et al. 2008) by enhancing the number of nucleation sites
for the hydration products, as described in (Soroka and Setter 1977). With increasing
coarseness of limestone powder, the heat release curve begins to mimic that of the plain
paste. The differences in surface areas of the particles has implications in their dissolution
rates, which reflect in the changes in the heat release response as observed. The effects of
limestone size-dependent acceleration are supported by 1-day compressive strength
datasets (Figure 4-3) which show that the mixture containing finer limestone powder has a
higher 1 day strength than the OPC paste. Previous studies have reported that up to 5%
limestone powder (by mass) can be used without compromising early age strength
(Lothenbach et al. 2008; D. Bentz et al. 2009b). However, with increasing limestone
coarseness and dosage, the compressive strength is noted to reduce due to effects including
increasing porosity and a progressively reducing mineral acceleration effect.
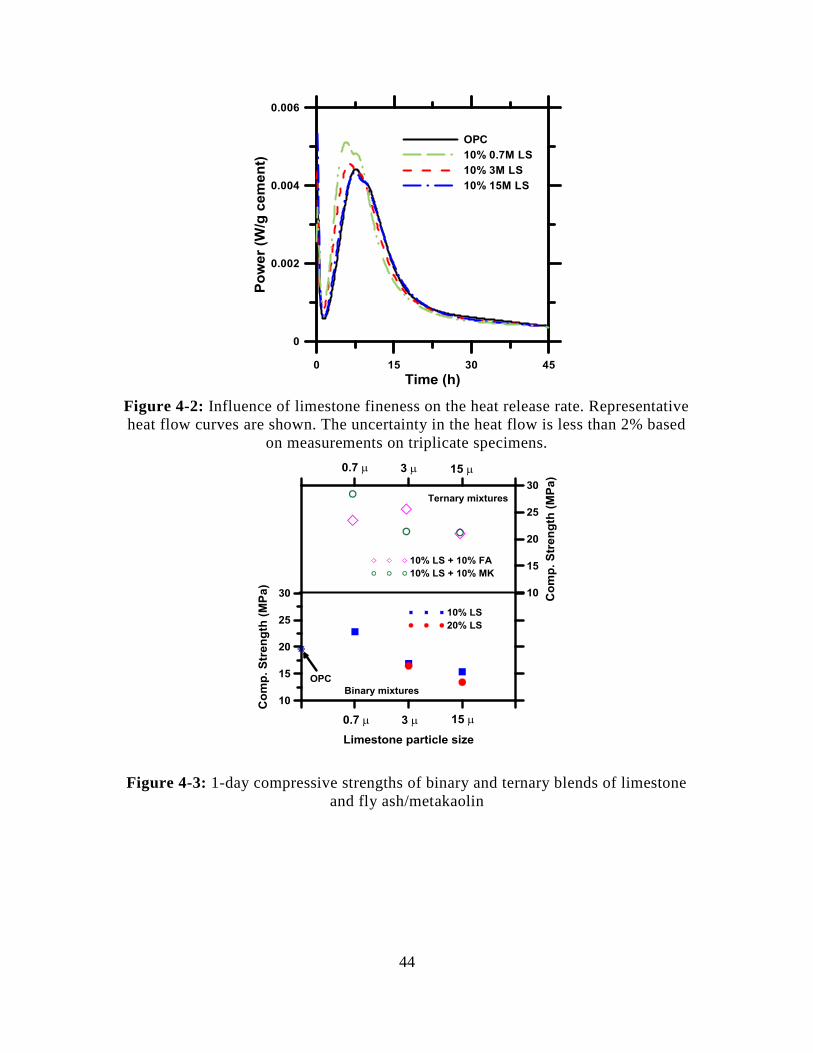
44
Figure 4-2: Influence of limestone fineness on the heat release rate. Representative
heat flow curves are shown. The uncertainty in the heat flow is less than 2% based
on measurements on triplicate specimens.
Figure 4-3: 1-day compressive strengths of binary and ternary blends of limestone
and fly ash/metakaolin
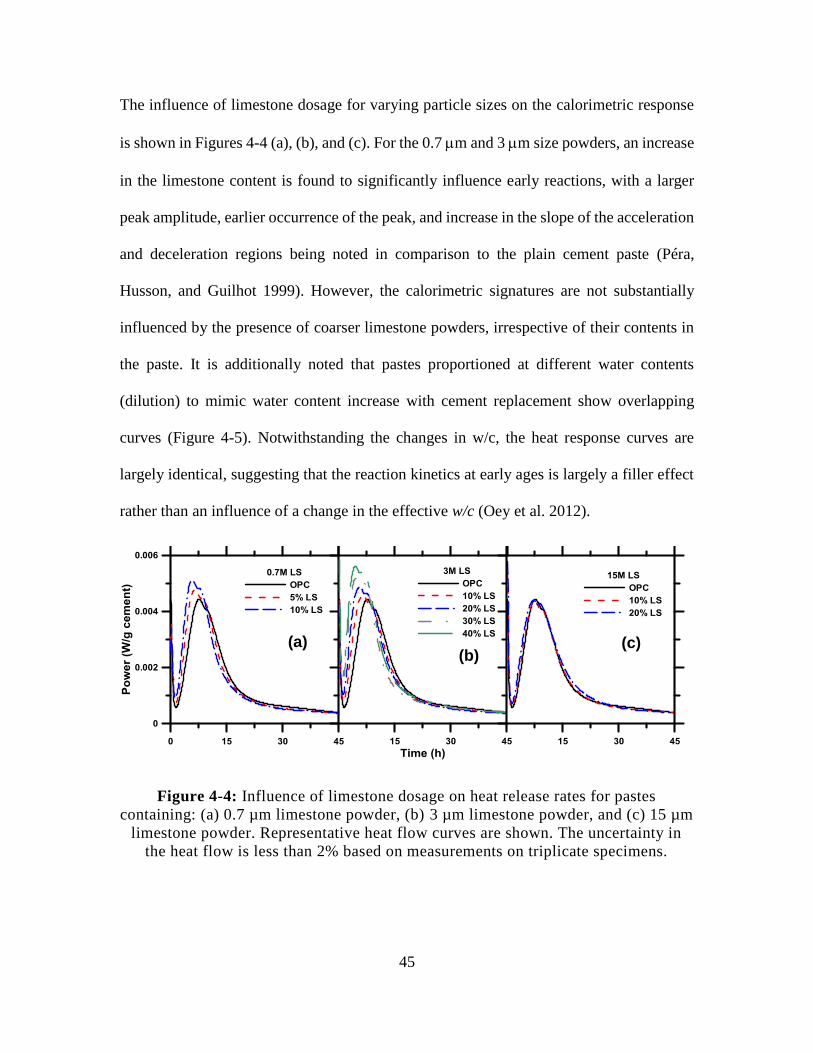
45
The influence of limestone dosage for varying particle sizes on the calorimetric response
is shown in Figures 4-4 (a), (b), and (c). For the 0.7 m and 3 m size powders, an increase
in the limestone content is found to significantly influence early reactions, with a larger
peak amplitude, earlier occurrence of the peak, and increase in the slope of the acceleration
and deceleration regions being noted in comparison to the plain cement paste (Péra,
Husson, and Guilhot 1999). However, the calorimetric signatures are not substantially
influenced by the presence of coarser limestone powders, irrespective of their contents in
the paste. It is additionally noted that pastes proportioned at different water contents
(dilution) to mimic water content increase with cement replacement show overlapping
curves (Figure 4-5). Notwithstanding the changes in w/c, the heat response curves are
largely identical, suggesting that the reaction kinetics at early ages is largely a filler effect
rather than an influence of a change in the effective w/c (Oey et al. 2012).
Figure 4-4: Influence of limestone dosage on heat release rates for pastes
containing: (a) 0.7 µm limestone powder, (b) 3 µm limestone powder, and (c) 15 µm
limestone powder. Representative heat flow curves are shown. The uncertainty in
the heat flow is less than 2% based on measurements on triplicate specimens.
(a) (b)
(c)
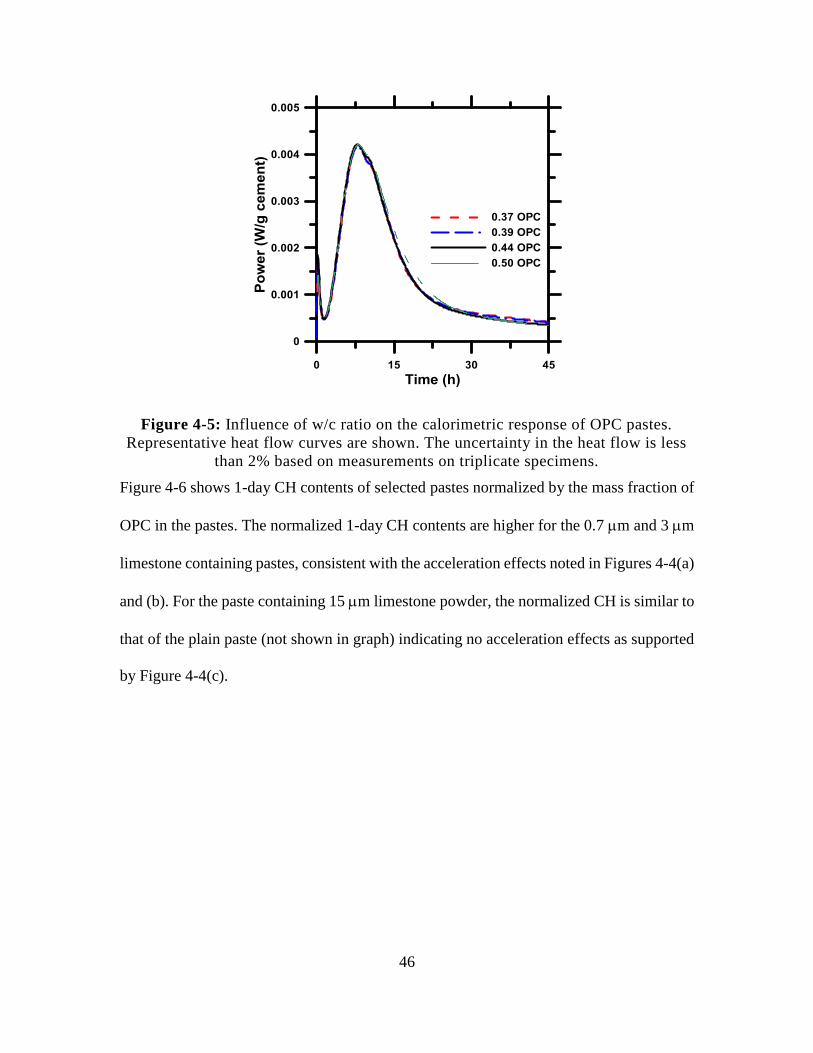
46
Figure 4-5: Influence of w/c ratio on the calorimetric response of OPC pastes.
Representative heat flow curves are shown. The uncertainty in the heat flow is less
than 2% based on measurements on triplicate specimens.
Figure 4-6 shows 1-day CH contents of selected pastes normalized by the mass fraction of
OPC in the pastes. The normalized 1-day CH contents are higher for the 0.7 m and 3 m
limestone containing pastes, consistent with the acceleration effects noted in Figures 4-4(a)
and (b). For the paste containing 15 m limestone powder, the normalized CH is similar to
that of the plain paste (not shown in graph) indicating no acceleration effects as supported
by Figure 4-4(c).
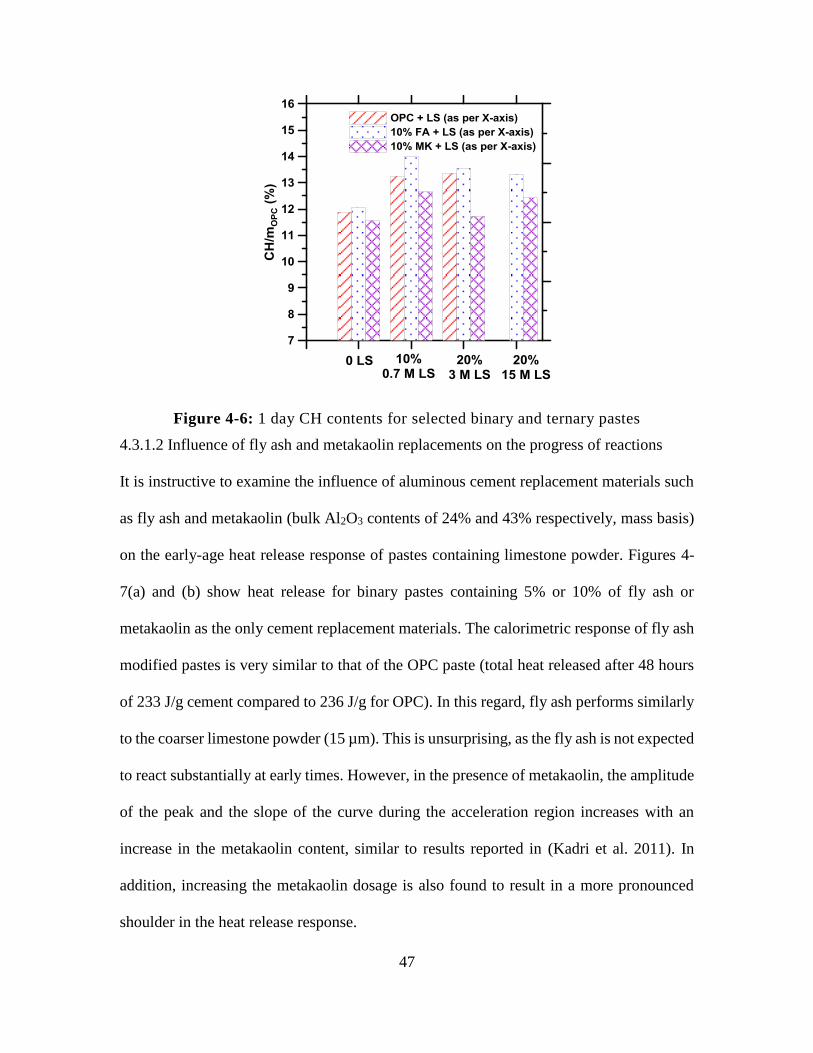
47
Figure 4-6: 1 day CH contents for selected binary and ternary pastes
4.3.1.2 Influence of fly ash and metakaolin replacements on the progress of reactions
It is instructive to examine the influence of aluminous cement replacement materials such
as fly ash and metakaolin (bulk Al2O3 contents of 24% and 43% respectively, mass basis)
on the early-age heat release response of pastes containing limestone powder. Figures 4-
7(a) and (b) show heat release for binary pastes containing 5% or 10% of fly ash or
metakaolin as the only cement replacement materials. The calorimetric response of fly ash
modified pastes is very similar to that of the OPC paste (total heat released after 48 hours
of 233 J/g cement compared to 236 J/g for OPC). In this regard, fly ash performs similarly
to the coarser limestone powder (15 µm). This is unsurprising, as the fly ash is not expected
to react substantially at early times. However, in the presence of metakaolin, the amplitude
of the peak and the slope of the curve during the acceleration region increases with an
increase in the metakaolin content, similar to results reported in (Kadri et al. 2011). In
addition, increasing the metakaolin dosage is also found to result in a more pronounced
shoulder in the heat release response.
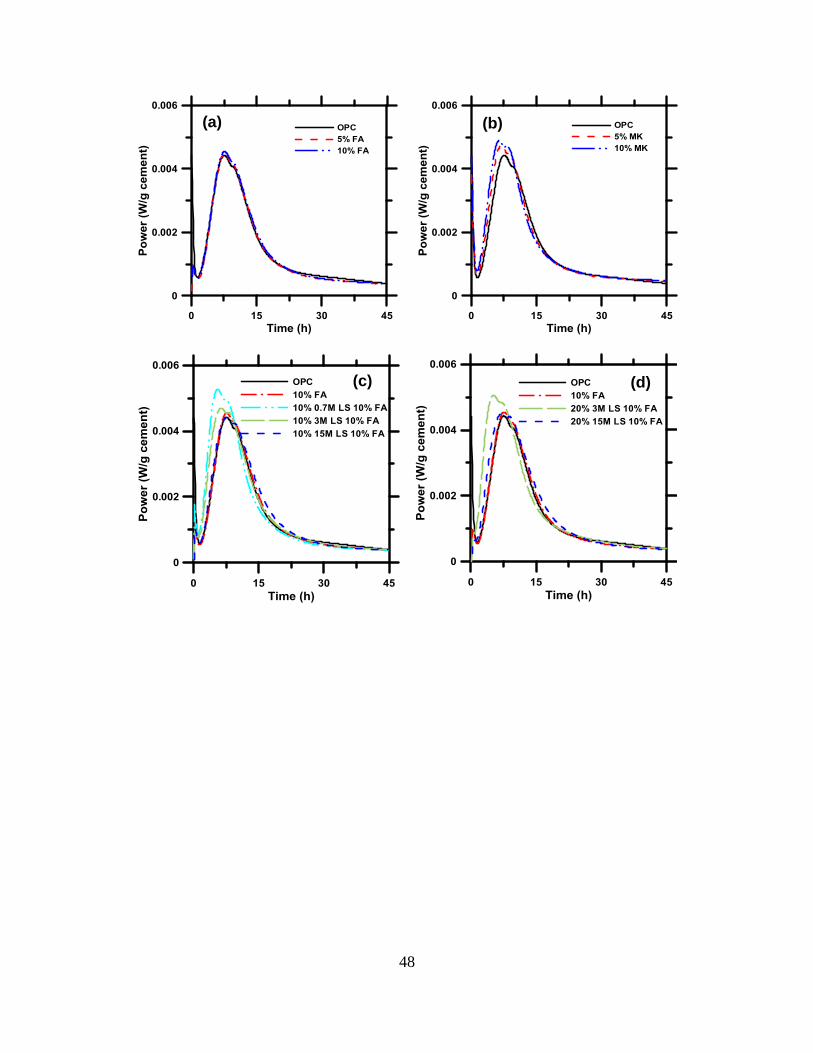
48
(a) (b)
(c) (d)
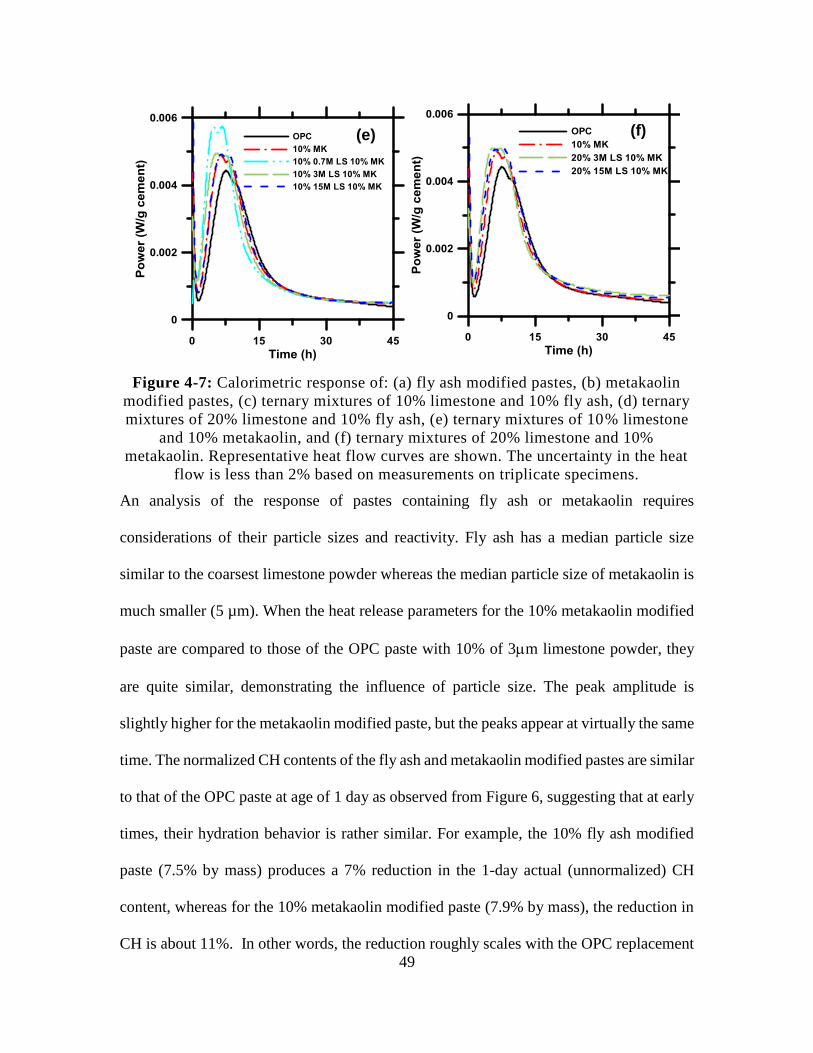
49
Figure 4-7: Calorimetric response of: (a) fly ash modified pastes, (b) metakaolin
modified pastes, (c) ternary mixtures of 10% limestone and 10% fly ash, (d) ternary
mixtures of 20% limestone and 10% fly ash, (e) ternary mixtures of 10% limestone
and 10% metakaolin, and (f) ternary mixtures of 20% limestone and 10%
metakaolin. Representative heat flow curves are shown. The uncertainty in the heat
flow is less than 2% based on measurements on triplicate specimens.
An analysis of the response of pastes containing fly ash or metakaolin requires
considerations of their particle sizes and reactivity. Fly ash has a median particle size
similar to the coarsest limestone powder whereas the median particle size of metakaolin is
much smaller (5 µm). When the heat release parameters for the 10% metakaolin modified
paste are compared to those of the OPC paste with 10% of 3m limestone powder, they
are quite similar, demonstrating the influence of particle size. The peak amplitude is
slightly higher for the metakaolin modified paste, but the peaks appear at virtually the same
time. The normalized CH contents of the fly ash and metakaolin modified pastes are similar
to that of the OPC paste at age of 1 day as observed from Figure 6, suggesting that at early
times, their hydration behavior is rather similar. For example, the 10% fly ash modified
paste (7.5% by mass) produces a 7% reduction in the 1-day actual (unnormalized) CH
content, whereas for the 10% metakaolin modified paste (7.9% by mass), the reduction in
CH is about 11%. In other words, the reduction roughly scales with the OPC replacement
(e) (f)
50
level even though metakaolin incorporation results in a slightly higher reduction of CH.
Figures 4-7(a) and (b) show that, while the incorporation of fly ash does not change the
reaction kinetics considerably, the use of metakaolin results in an acceleration of reactions.
This is likely due to the early age pozzolanic reactions and CH consumption in metakaolin
blended pastes, which are expected to be more reactive than fly ash or silica fume modified
pastes (Poon et al. 2001).
4.3.1.3 Progress of reactions in fly ash/metakaolin containing limestone containing pastes
The calorimetric response of ternary blends containing up to 10% of fly ash or metakaolin
with different particle sizes/dosages of limestone powder are discussed in this section.
Figures 4-7 (c) and (d) represent the effects of a combination of limestone powder and fly
ash on the heat release response of cement pastes. Figure 4-7(c) depicts the calorimetric
response of systems containing 10% of limestone and fly ash whereas Figure 4-7(d) shows
the response of the systems containing 20% limestone powder augmented with 10% fly
ash. From both the figures, it can be noticed that the behavior of the ternary systems are
different from those containing fly ash as the sole cement replacement material. When the
response of the systems containing 10% fly ash and 10% limestone powder of varying sizes
shown in Figure 4-7(c) is compared to those containing 10% limestone powder alone
(Figure 4-2), it is noticed that the early age behavior of limestone powder modified pastes
is not significantly modified by the presence of fly ash. To better facilitate these
comparisons, Table 4-2 shows the parameters of the heat release curves of the plain, binary,
and ternary mixtures. Comparing the 10% limestone powder modified pastes with and
without fly ash, the time of appearance of the main hydration peak and the shoulder, the
peak amplitudes, and the slopes of the acceleration and deceleration regions are found to
51
be very similar. While it has been reported that small amounts of limestone powder have
an influence on the reaction products and properties of OPC-fly ash blended systems (De
Weerdt, Kjellsen, et al. 2011; De Weerdt, Haha, et al. 2011), these are predominant at later
ages as driven by the somewhat slow, time dependent dissolution of fly ash which releases
aluminate species into the pore solution (Deschner et al. 2012). Increasing the limestone
content of the ternary blends to 20% as shown in Figure 4-7(d) results in a behavior fairly
similar to that of the 20% limestone powder pastes without fly ash; although a small
enhancement in the peak amplitude and slightly earlier appearances of the main hydration
peak and the shoulder peak are noted.

52
OP
C
FA
M
K
LS
L
S s
ize
(m
)
Mai
n h
yd
rati
on
pea
k
Slo
pes
Pea
k 1
P
eak
2
Acc
el.
(W/g
-h)
Dec
el.
(W/g
-h)
Tim
e (h
) P
(W
/g)
Tim
e (h
) P
(W
/g)
10
0
0
0
0
--
7.5
0
.00
44
--
--
0
.00
09
-0
.00
05
90
0
0
1
0
0.7
5
.7
0.0
05
1
7.6
0
.00
48
0
.00
13
-0
.00
07
3
6.4
0
.00
46
8
.2
0.0
04
3
0.0
01
0
-0.0
00
5
15
7
.4
0.0
04
4
9.1
0
.00
41
0
.00
08
-0
.00
04
90
1
0
0
0
--
7.6
0
.00
46
--
--
0
.00
09
-0
.00
04
80
1
0
0
10
0.7
5
.6
0.0
05
3
7.4
0
.00
50
0
.00
14
-0
.00
07
3
6.3
0
.00
47
8
.1
0.0
04
5
0.0
01
0
-0.0
00
5
15
7
.6
0.0
04
4
9.4
0
.00
42
0
.00
09
-0
.00
04
90
0
1
0
0
--
6.4
0
.00
48
8
.2
0.0
04
7
0.0
01
1
-0.0
00
6
80
0
1
0
10
0.7
4
.9
0.0
05
7
6.7
0
.00
57
0
.00
17
-0
.00
09
3
5.5
0
.00
50
7
.4
0.0
05
0
0.0
01
2
-0.0
00
5
15
6
.5
0.0
04
9
8.0
0
.00
49
0
.00
11
-0
.00
06
Tab
le 4
-2:
Par
amet
ers
of
the
calo
rim
etri
c re
sponse
for
bin
ary a
nd t
ernar
y c
emen
t pas
tes
53
or the pastes containing limestone powder along with 10% fly ash, Figure 4-6 shows that
increasing the limestone content increases the normalized CH content as expected.
Expectedly, increasing coarseness of the limestone powder and increasing dosage reduces
the normalized 1-day CH contents. However, it can be noticed that a further cement
reduction of 10% through fly ash incorporation in limestone powder modified concretes
does not result in a corresponding change in the normalized CH contents, suggesting that
the addition of fly ash does not influence early age behavior. A comparison of the
isothermal calorimetry results for limestone powder modified pastes with and without fly
ash (Figure 4-4 and Figures 4-7(c),(d)) also indicate that the benefits of low amounts of fly
ash addition, in conjunction with limestone powder, up to 20% are not readily observed at
early ages. This observation highlights the need to select a more reactive aluminous cement
replacement material, metakaolin, to be used in limestone powder modified systems so as
to induce changes in early age behavior.
Figure 4-7(e) shows the heat release response of pastes containing 10% limestone and 10%
metakaolin as (partial) cement replacement materials while Figure 4-7(f) shows the
response of pastes containing 20% limestone powder augmented with 10% metakaolin.
The synergistic early age effects of small amounts of metakaolin in conjunction with 10%
or 20% cement replacement by limestone powder are evident from these figures. For
example: from Figure 4-7 (e), it is noted that limestone powder in combination with
metakaolin results in two distinct peaks (corresponding to C3S and C3A hydration) of
similar magnitudes – indicating that aluminate hydration is potentially enhanced in the
presence of metakaolin. These peak heights increase with decreasing median particle size
of the limestone powder. The parameters of the heat release peaks of these ternary blends
54
for a limestone replacement level of 10% are shown in Table 4-2. The acceleration in
hydration reaction in the presence of finer limestone powder and metakaolin as compared
to limestone alone can be quantified based on the time of appearance of the peaks and the
peak amplitudes provided in Table 4-2. The fact that the secondary peak related to the
aluminate reaction is equal in magnitude to the primary peak in the ternary metakaolin
blends (note that when limestone or metakaolin alone is used as a cement replacement
material – Figure 4-4 and 4-7 (b) – the primary and secondary peak amplitudes are
different) suggests that the combination of finer limestone powder and metakaolin
enhances the reaction kinetics at early ages in a more direct fashion than any other
combination of binary or ternary blends evaluated here.
The normalized 1-day CH contents of metakaolin modified pastes are found to be
consistently lower than those of pastes containing only limestone or limestone/fly ash as
OPC replacement materials. The reaction of carbonate from limestone with Al from the
OPC and metakaolin results in the formation of the mono/hemi-carboaluminate hydrates.
Thermodynamic calculations suggest that the formation of the carboaluminates initiates as
early as 1 day in limestone containing systems (Lothenbach et al. 2008; De Weerdt, Haha,
et al. 2011), a point confirmed by XRD (Voglis et al. 2005; Ipavec et al. 2011). The
formation of carboaluminates (specifically, hemicarboaluminate) consumes CH (V. L.
Bonavetti, Rahhal, and Irassar 2001; Matschei, Lothenbach, and Glasser 2007b;
Lothenbach et al. 2008). While this action partly explains the reduced CH content observed
in ternary blends containing metakaolin, an additional contribution of the pozzolanic action
of metakaolin at ages as early as 1 day (Lagier and Kurtis 2007; Poon et al. 2001) may be
another factor to consider.
55
4.3.2 Compressive Strength Development
The compressive strengths of plain, binary, and ternary cement paste blends up to 28 days
of hydration are shown in Figure 4-8. The compressive strengths for the OPC-limestone
powder pastes are shown in Figure 4-8(a). The paste containing 10% of 0.7 m limestone
powder shows the highest strengths until 14 days of age, after which it shows strengths
similar to that of the plain paste. The enhancement in cement hydration facilitated by the
fine particles of limestone powder is responsible for this effect. Similar results are reported
for limestone powder modified cement pastes in (Tsivilis, Chaniotakis, Badogiannis, et al.
1999; Voglis et al. 2005; De Weerdt, Haha, et al. 2011). With increasing limestone content
and median particle size, the compressive strengths at all ages are found to reduce, as
expected. The reduction is not very prominent at early ages except for the higher
replacement levels with the coarser limestone powder, due in part to mineral acceleration
effects being able to partially compensate for the effects of OPC replacement. However,
for the 15 m limestone powder modified paste, a 20% replacement of cement by limestone
powder results in a 21% strength loss at 28 days, attesting to the effects of OPC by coarse
limestone powder on mechanical properties.
The compressive strength development of ternary blends containing fly ash or metakaolin
along with limestone powder is provided in Figures 4-8(b) and (c) respectively. The use of
metakaolin with 10% of the finer limestone powder provides compressive strengths similar
to or higher than that of 10% metakaolin modified cement pastes at the ages considered.
Note that similar or higher strengths are achieved in this case even when the cement
replacement level in the ternary blend is double that of the binary blend. However, for a
similar paste in which fly ash is used, the compressive strengths are generally substantially
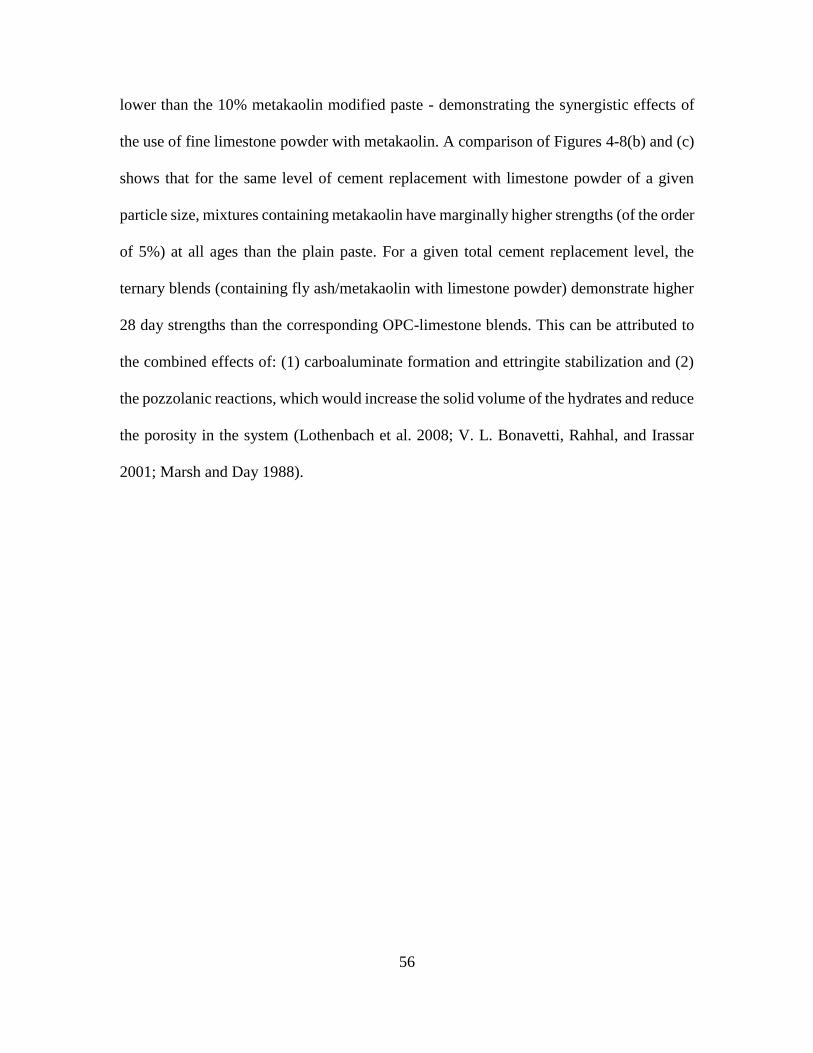
56
lower than the 10% metakaolin modified paste - demonstrating the synergistic effects of
the use of fine limestone powder with metakaolin. A comparison of Figures 4-8(b) and (c)
shows that for the same level of cement replacement with limestone powder of a given
particle size, mixtures containing metakaolin have marginally higher strengths (of the order
of 5%) at all ages than the plain paste. For a given total cement replacement level, the
ternary blends (containing fly ash/metakaolin with limestone powder) demonstrate higher
28 day strengths than the corresponding OPC-limestone blends. This can be attributed to
the combined effects of: (1) carboaluminate formation and ettringite stabilization and (2)
the pozzolanic reactions, which would increase the solid volume of the hydrates and reduce
the porosity in the system (Lothenbach et al. 2008; V. L. Bonavetti, Rahhal, and Irassar
2001; Marsh and Day 1988).
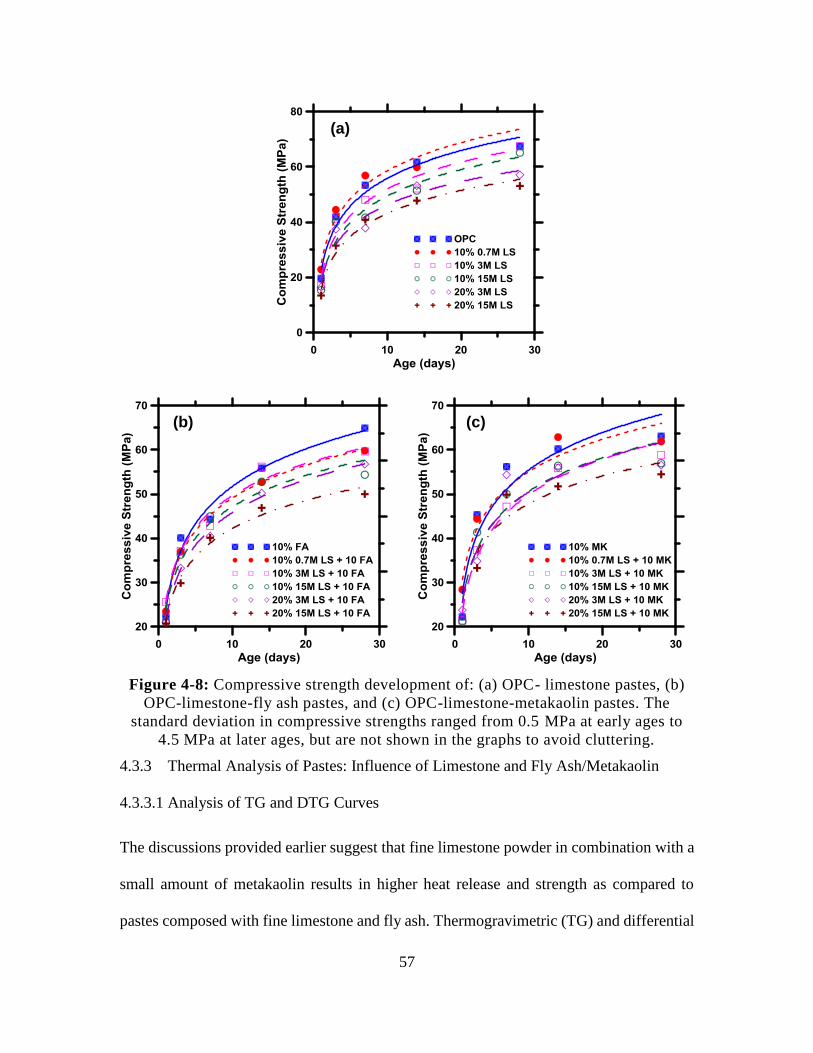
57
Figure 4-8: Compressive strength development of: (a) OPC- limestone pastes, (b)
OPC-limestone-fly ash pastes, and (c) OPC-limestone-metakaolin pastes. The
standard deviation in compressive strengths ranged from 0.5 MPa at early ages to
4.5 MPa at later ages, but are not shown in the graphs to avoid cluttering.
4.3.3 Thermal Analysis of Pastes: Influence of Limestone and Fly Ash/Metakaolin
4.3.3.1 Analysis of TG and DTG Curves
The discussions provided earlier suggest that fine limestone powder in combination with a
small amount of metakaolin results in higher heat release and strength as compared to
pastes composed with fine limestone and fly ash. Thermogravimetric (TG) and differential
(a)
(b) (c)
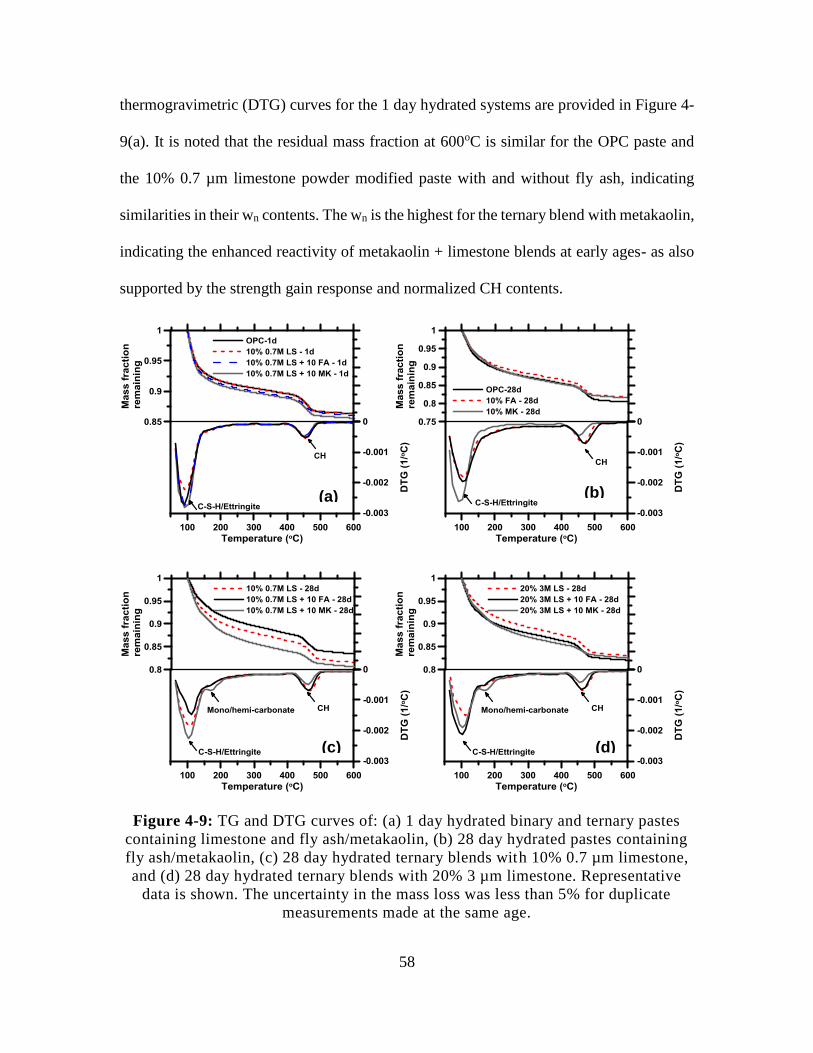
58
thermogravimetric (DTG) curves for the 1 day hydrated systems are provided in Figure 4-
9(a). It is noted that the residual mass fraction at 600oC is similar for the OPC paste and
the 10% 0.7 µm limestone powder modified paste with and without fly ash, indicating
similarities in their wn contents. The wn is the highest for the ternary blend with metakaolin,
indicating the enhanced reactivity of metakaolin + limestone blends at early ages- as also
supported by the strength gain response and normalized CH contents.
Figure 4-9: TG and DTG curves of: (a) 1 day hydrated binary and ternary pastes
containing limestone and fly ash/metakaolin, (b) 28 day hydrated pastes containing
fly ash/metakaolin, (c) 28 day hydrated ternary blends with 10% 0.7 µm limestone,
and (d) 28 day hydrated ternary blends with 20% 3 µm limestone. Representative
data is shown. The uncertainty in the mass loss was less than 5% for duplicate
measurements made at the same age.
(b) (a)
(d) (c)
59
The peak at 100oC, linked to the decomposition of C-S-H and ettringite (De Weerdt,
Kjellsen, et al. 2011; De Weerdt, Haha, et al. 2011) is slightly higher for the ternary blend
containing metakaolin, potentially suggesting increased amounts of C-S-H and/or the
stabilization of ettringite in the presence of limestone. However, no monocarbonate is
observed in the 1 day DTG curves, though slight (if any) formation is only expected at such
early ages (Voglis et al. 2005).
The TG and DTG curves of OPC, fly ash, and metakaolin modified pastes cured for 28
days are shown in Figure 4-9(b). The OPC and fly ash modified pastes show similar
behavior at 28 days. The beneficial effects of metakaolin in terms of increasing the C-S-H
content and decreasing the CH contents can be clearly seen in this figure. This figure
provides context to the TG and DTG analysis of ternary blends shown in Figures 4-9(c)
and (d). From the DTG curve of the ternary blend of 10% 0.7 µm limestone and metakaolin
shown in Figure 4-9(c), a distinct peak around 180oC corresponding to the carboaluminate
phases (De Weerdt, Haha, et al. 2011; Lothenbach et al. 2008) is observed. The formation
of the carboaluminates, in conjunction with the pozzolanic reaction decreases the CH
content even though the wn (and hence anticipated CH production) is the highest among all
the three pastes shown in this figure. The formation of carboaluminate phases can be
quantified using the residual amounts of CaCO3 in the pastes. Figure 4-10 shows the
residual mass fraction of CaCO3 in the pastes hydrated for 1 and 28 days, obtained by
dividing the mass fraction of CaCO3 from TG analysis by the initial mass fraction of CaCO3
in the paste. It can be readily noticed from this figure that the residual calcium carbonate
content is lower for the limestone modified pastes containing metakaolin, confirming the
increased consumption of limestone to form carboaluminate phases. For example, in the
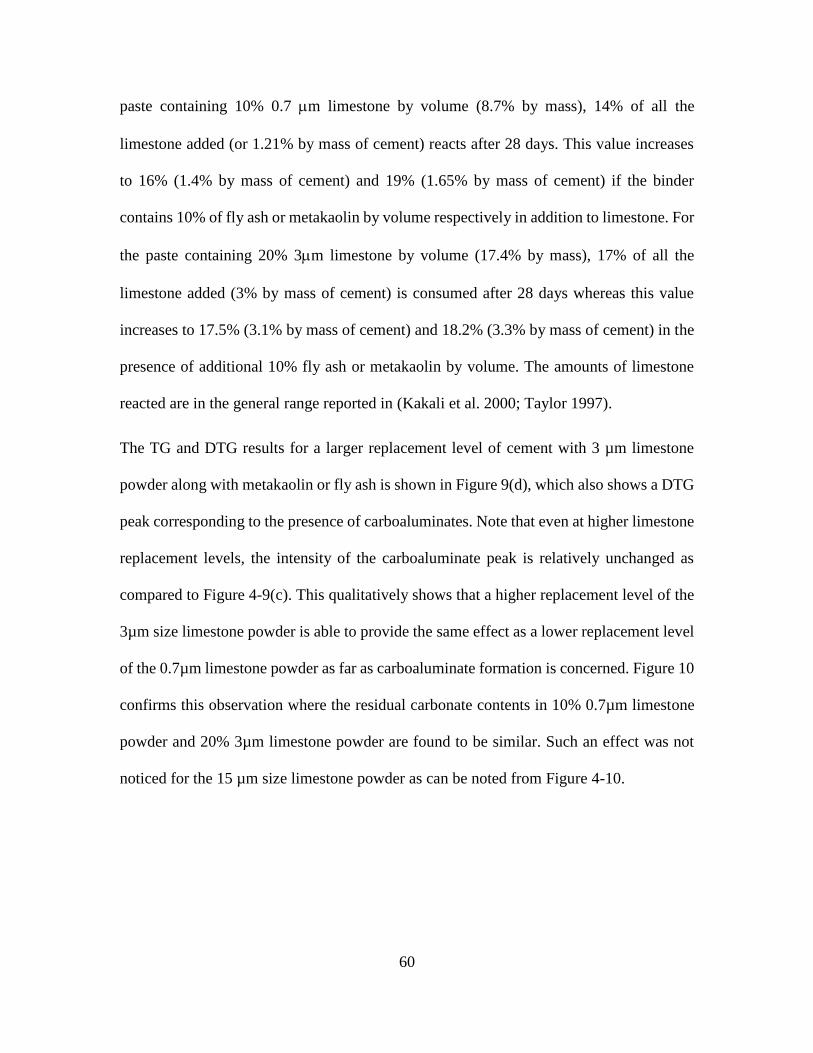
60
paste containing 10% 0.7 m limestone by volume (8.7% by mass), 14% of all the
limestone added (or 1.21% by mass of cement) reacts after 28 days. This value increases
to 16% (1.4% by mass of cement) and 19% (1.65% by mass of cement) if the binder
contains 10% of fly ash or metakaolin by volume respectively in addition to limestone. For
the paste containing 20% 3m limestone by volume (17.4% by mass), 17% of all the
limestone added (3% by mass of cement) is consumed after 28 days whereas this value
increases to 17.5% (3.1% by mass of cement) and 18.2% (3.3% by mass of cement) in the
presence of additional 10% fly ash or metakaolin by volume. The amounts of limestone
reacted are in the general range reported in (Kakali et al. 2000; Taylor 1997).
The TG and DTG results for a larger replacement level of cement with 3 µm limestone
powder along with metakaolin or fly ash is shown in Figure 9(d), which also shows a DTG
peak corresponding to the presence of carboaluminates. Note that even at higher limestone
replacement levels, the intensity of the carboaluminate peak is relatively unchanged as
compared to Figure 4-9(c). This qualitatively shows that a higher replacement level of the
3µm size limestone powder is able to provide the same effect as a lower replacement level
of the 0.7µm limestone powder as far as carboaluminate formation is concerned. Figure 10
confirms this observation where the residual carbonate contents in 10% 0.7µm limestone
powder and 20% 3µm limestone powder are found to be similar. Such an effect was not
noticed for the 15 µm size limestone powder as can be noted from Figure 4-10.
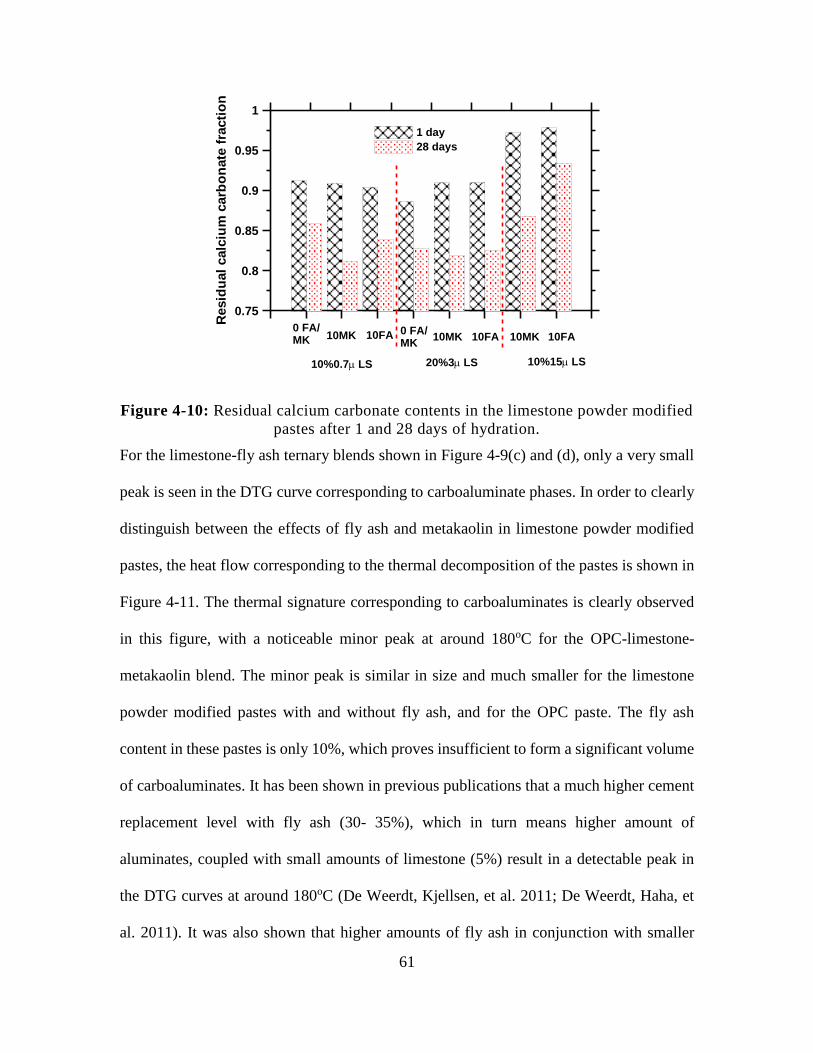
61
Figure 4-10: Residual calcium carbonate contents in the limestone powder modified
pastes after 1 and 28 days of hydration.
For the limestone-fly ash ternary blends shown in Figure 4-9(c) and (d), only a very small
peak is seen in the DTG curve corresponding to carboaluminate phases. In order to clearly
distinguish between the effects of fly ash and metakaolin in limestone powder modified
pastes, the heat flow corresponding to the thermal decomposition of the pastes is shown in
Figure 4-11. The thermal signature corresponding to carboaluminates is clearly observed
in this figure, with a noticeable minor peak at around 180oC for the OPC-limestone-
metakaolin blend. The minor peak is similar in size and much smaller for the limestone
powder modified pastes with and without fly ash, and for the OPC paste. The fly ash
content in these pastes is only 10%, which proves insufficient to form a significant volume
of carboaluminates. It has been shown in previous publications that a much higher cement
replacement level with fly ash (30- 35%), which in turn means higher amount of
aluminates, coupled with small amounts of limestone (5%) result in a detectable peak in
the DTG curves at around 180oC (De Weerdt, Kjellsen, et al. 2011; De Weerdt, Haha, et
al. 2011). It was also shown that higher amounts of fly ash in conjunction with smaller
0.75
0.8
0.85
0.9
0.95
1
Resid
ual
calc
ium
carb
on
ate
fra
cti
on
1 day
28 days
10%0.7LS 20%3LS 10%15LS
0 FA/MK 10MK 10FA 0 FA/
MK10MK 10FA 10MK 10FA
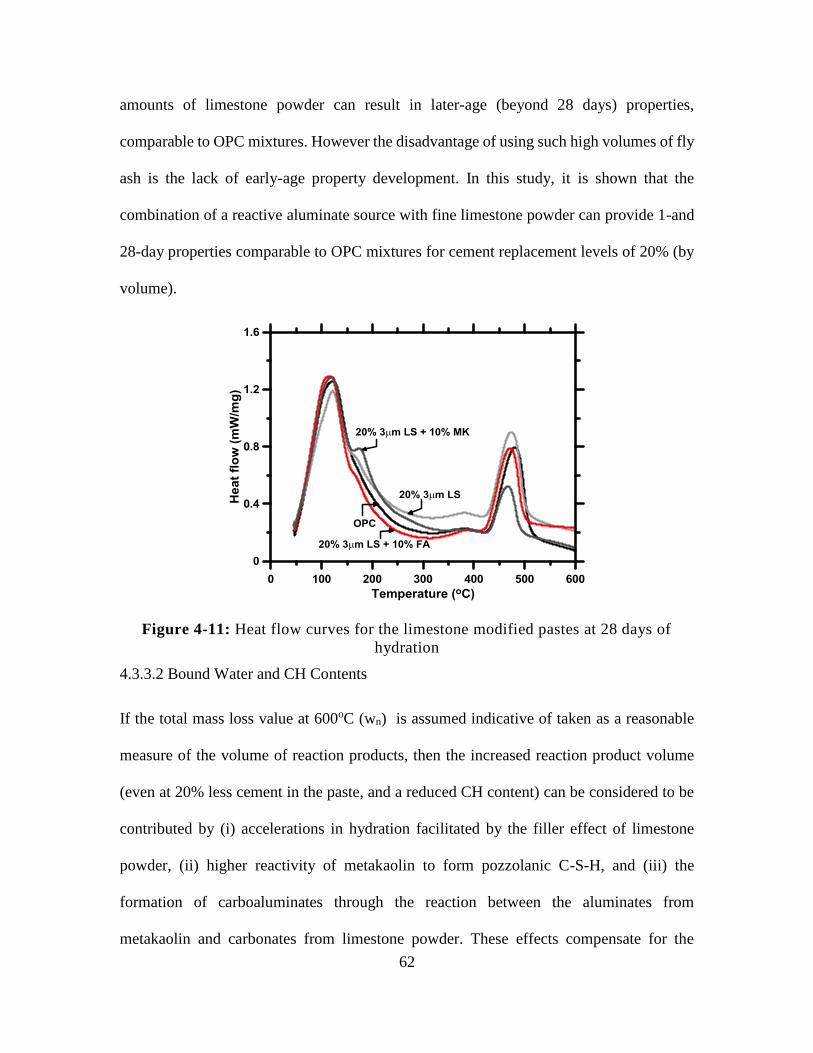
62
amounts of limestone powder can result in later-age (beyond 28 days) properties,
comparable to OPC mixtures. However the disadvantage of using such high volumes of fly
ash is the lack of early-age property development. In this study, it is shown that the
combination of a reactive aluminate source with fine limestone powder can provide 1-and
28-day properties comparable to OPC mixtures for cement replacement levels of 20% (by
volume).
Figure 4-11: Heat flow curves for the limestone modified pastes at 28 days of
hydration
4.3.3.2 Bound Water and CH Contents
If the total mass loss value at 600oC (wn) is assumed indicative of taken as a reasonable
measure of the volume of reaction products, then the increased reaction product volume
(even at 20% less cement in the paste, and a reduced CH content) can be considered to be
contributed by (i) accelerations in hydration facilitated by the filler effect of limestone
powder, (ii) higher reactivity of metakaolin to form pozzolanic C-S-H, and (iii) the
formation of carboaluminates through the reaction between the aluminates from
metakaolin and carbonates from limestone powder. These effects compensate for the
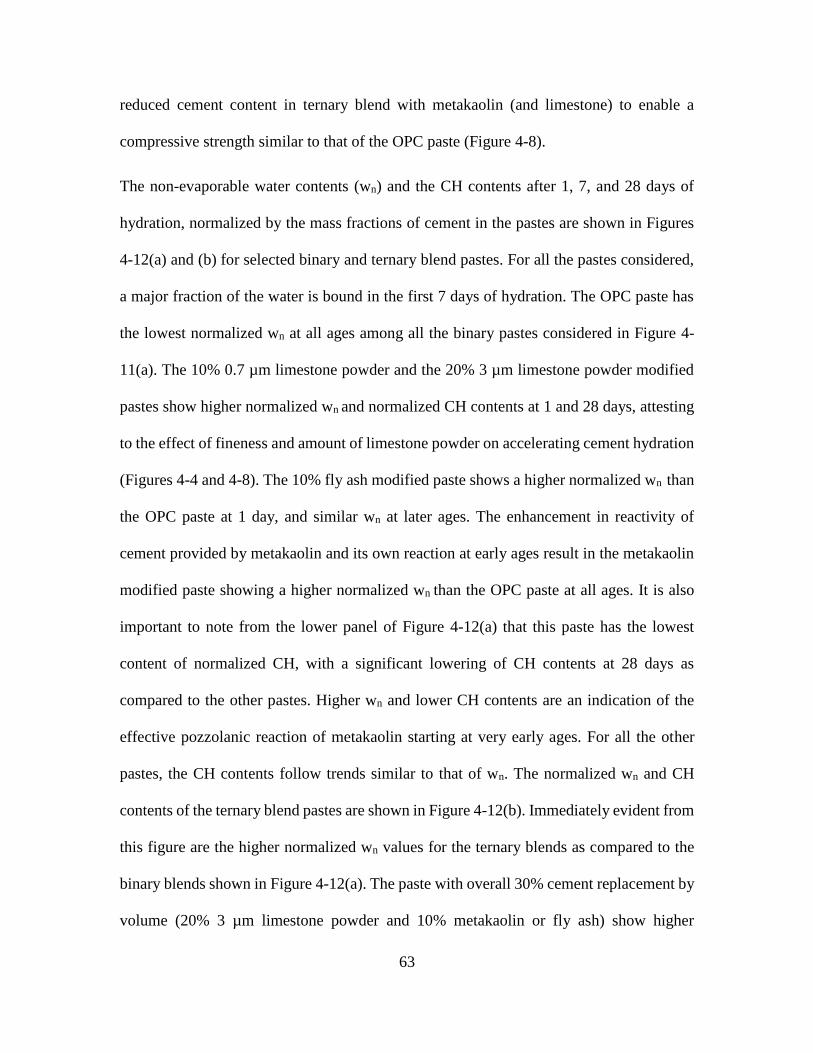
63
reduced cement content in ternary blend with metakaolin (and limestone) to enable a
compressive strength similar to that of the OPC paste (Figure 4-8).
The non-evaporable water contents (wn) and the CH contents after 1, 7, and 28 days of
hydration, normalized by the mass fractions of cement in the pastes are shown in Figures
4-12(a) and (b) for selected binary and ternary blend pastes. For all the pastes considered,
a major fraction of the water is bound in the first 7 days of hydration. The OPC paste has
the lowest normalized wn at all ages among all the binary pastes considered in Figure 4-
11(a). The 10% 0.7 µm limestone powder and the 20% 3 µm limestone powder modified
pastes show higher normalized wn and normalized CH contents at 1 and 28 days, attesting
to the effect of fineness and amount of limestone powder on accelerating cement hydration
(Figures 4-4 and 4-8). The 10% fly ash modified paste shows a higher normalized wn than
the OPC paste at 1 day, and similar wn at later ages. The enhancement in reactivity of
cement provided by metakaolin and its own reaction at early ages result in the metakaolin
modified paste showing a higher normalized wn than the OPC paste at all ages. It is also
important to note from the lower panel of Figure 4-12(a) that this paste has the lowest
content of normalized CH, with a significant lowering of CH contents at 28 days as
compared to the other pastes. Higher wn and lower CH contents are an indication of the
effective pozzolanic reaction of metakaolin starting at very early ages. For all the other
pastes, the CH contents follow trends similar to that of wn. The normalized wn and CH
contents of the ternary blend pastes are shown in Figure 4-12(b). Immediately evident from
this figure are the higher normalized wn values for the ternary blends as compared to the
binary blends shown in Figure 4-12(a). The paste with overall 30% cement replacement by
volume (20% 3 µm limestone powder and 10% metakaolin or fly ash) show higher
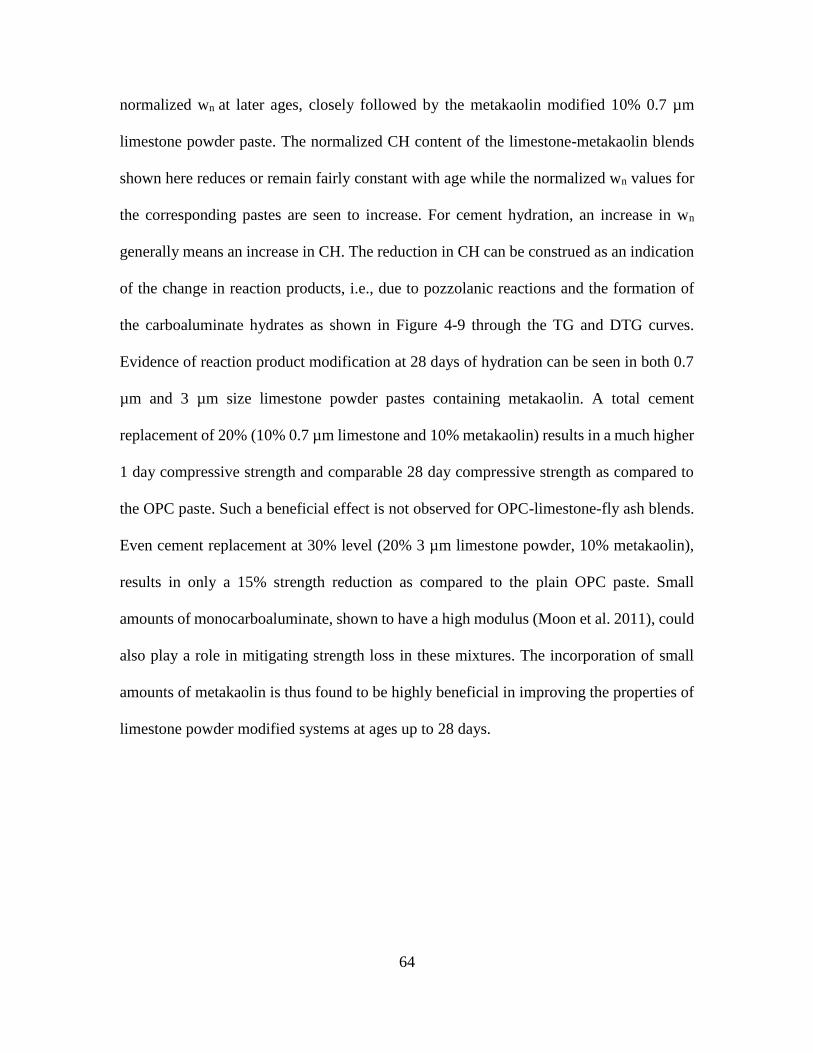
64
normalized wn at later ages, closely followed by the metakaolin modified 10% 0.7 µm
limestone powder paste. The normalized CH content of the limestone-metakaolin blends
shown here reduces or remain fairly constant with age while the normalized wn values for
the corresponding pastes are seen to increase. For cement hydration, an increase in wn
generally means an increase in CH. The reduction in CH can be construed as an indication
of the change in reaction products, i.e., due to pozzolanic reactions and the formation of
the carboaluminate hydrates as shown in Figure 4-9 through the TG and DTG curves.
Evidence of reaction product modification at 28 days of hydration can be seen in both 0.7
µm and 3 µm size limestone powder pastes containing metakaolin. A total cement
replacement of 20% (10% 0.7 µm limestone and 10% metakaolin) results in a much higher
1 day compressive strength and comparable 28 day compressive strength as compared to
the OPC paste. Such a beneficial effect is not observed for OPC-limestone-fly ash blends.
Even cement replacement at 30% level (20% 3 µm limestone powder, 10% metakaolin),
results in only a 15% strength reduction as compared to the plain OPC paste. Small
amounts of monocarboaluminate, shown to have a high modulus (Moon et al. 2011), could
also play a role in mitigating strength loss in these mixtures. The incorporation of small
amounts of metakaolin is thus found to be highly beneficial in improving the properties of
limestone powder modified systems at ages up to 28 days.
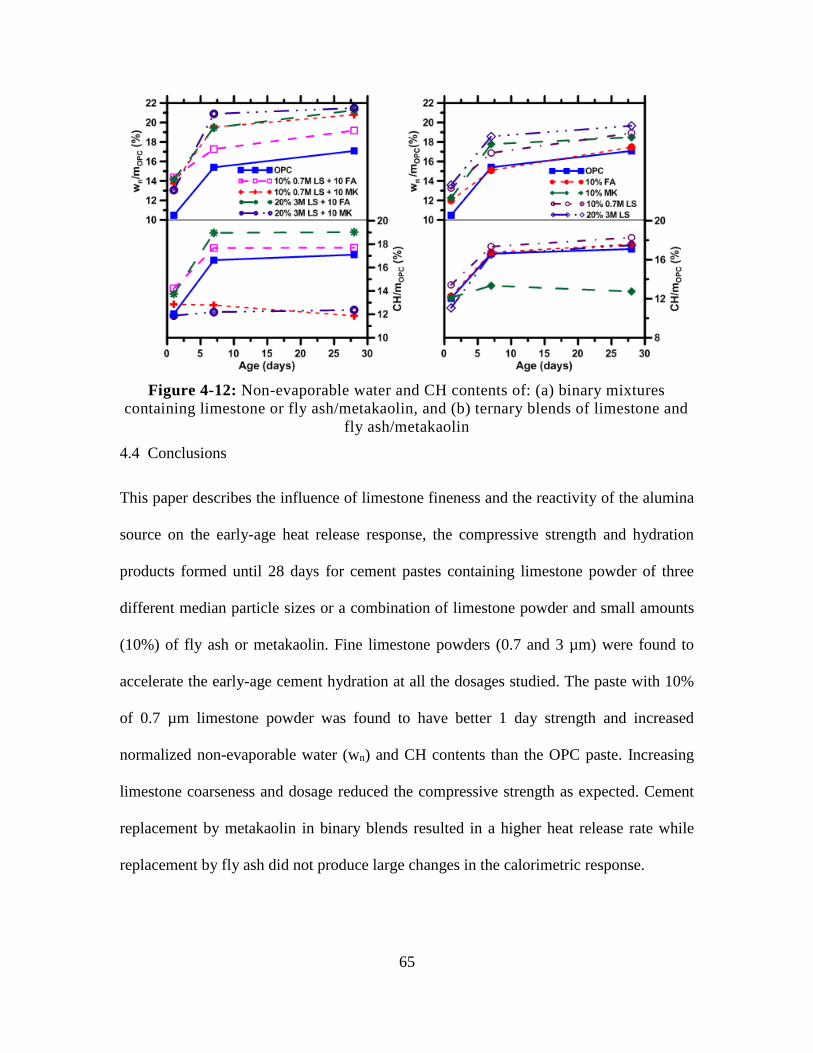
65
Figure 4-12: Non-evaporable water and CH contents of: (a) binary mixtures
containing limestone or fly ash/metakaolin, and (b) ternary blends of limestone and
fly ash/metakaolin
4.4 Conclusions
This paper describes the influence of limestone fineness and the reactivity of the alumina
source on the early-age heat release response, the compressive strength and hydration
products formed until 28 days for cement pastes containing limestone powder of three
different median particle sizes or a combination of limestone powder and small amounts
(10%) of fly ash or metakaolin. Fine limestone powders (0.7 and 3 µm) were found to
accelerate the early-age cement hydration at all the dosages studied. The paste with 10%
of 0.7 µm limestone powder was found to have better 1 day strength and increased
normalized non-evaporable water (wn) and CH contents than the OPC paste. Increasing
limestone coarseness and dosage reduced the compressive strength as expected. Cement
replacement by metakaolin in binary blends resulted in a higher heat release rate while
replacement by fly ash did not produce large changes in the calorimetric response.
66
The calorimetric response of the pastes containing limestone was not considerably
modified by the presence of fly ash whereas significant changes in the calorimetric
response was observed when metakaolin was used in conjunction with fine limestone
powder (0.7 and 3 µm). The enhanced reaction kinetics in ternary blends containing 10%
0.7 µm limestone powder and 10% metakaolin resulted in the highest 1 day compressive
strength and the 1-day normalized CH content was among the lowest of all the evaluated
pastes. While CH reduction could also be partially attributed to carboaluminate formation,
it was not detected in the thermal decomposition signatures of these pastes. It could also
be that the enhanced aluminate phase reaction contributed to increased incorporation of
Al3+ in the C-S-H at early ages rather than forming carboaluminates.
The fine limestone powder (0.7 and 3 µm) modified pastes at 10% cement replacement
level showed compressive strengths comparable to those of OPC pastes until 28 days. The
ternary blend of metakaolin along with 10% 0.7 µm limestone powder resulted in
compressive strengths that were higher than either of the corresponding binary blends, even
at a higher overall cement replacement level. Such a response was not observed in the case
of fly ash. The normalized wn at 28 days for the ternary blends of 0.7 and 3 µm limestone
powder and metakaolin was higher than that of the OPC paste, the binary blends, and the
ternary blends containing fly ash. While the normalized wn of these pastes increased with
age, the normalized CH contents were found to reduce or remain unchanged with age,
indicating changes in reaction products. The DTG curves for the 28 day cured ternary
pastes with both 0.7 and 3 µm limestone powder confirmed this through the observation of
the presence of carboaluminates. Thus, this paper considers the role of the overall chemical
compatibility of OPC replacement materials, with a view towards selecting replacement

67
material to produce synergistic effects and optimal OPC replacement efficiency. As such,
this work advances approaches to utilize multiple material solutions based on limestone
and metakaolin to proportion ternary binders, dedicated to reducing the use of OPC in
concrete.
68
5. COMPARATIVE INVESTIGATION OF TERNARY LIMESTONE AND FLY ASH
OR METAKAOLIN BLENDED CEMENT PASTE MICROSTRUCTURE VIA
MERCURY INTRUSION POROSIMETRY
5.1 Introduction
There continues to be a growing interest in the use of limestone as a cement replacement
material, acting as a filler increasing particle packing (V. Bonavetti et al. 2003), a location
for cement hydration product nucleation, and reacting to some extent with the aluminate
phases in cements (Lothenbach et al. 2008). Limestone replacement in portland cement
has generally been shown to result in some strength reduction (Hawkins, Tennis, and
Detwiler 2003), acceleration of hydration reactions (Lothenbach et al. 2008) and Chapter
4, and decrease setting time (Irassar et al. 2011) Recent work (De Weerdt, Kjellsen, et al.
2011; De Weerdt, Haha, et al. 2011) and in Chapter 4, has noted the synergistic benefit of
limestone and alumina inclusion in portland cement systems, including the use of fly ash,
metakaolin, and slag. Several benefits have been noted, including acceleration of cement
hydration reactions (De Weerdt, Haha, et al. 2011) and Chapter 4, improving the reactivity
of limestone in cement (De Weerdt, Haha, et al. 2011) and Chapter 4, offsetting potential
strength losses associated with limestone replacement as noted in Chapter 4, and possible
improvement to early age rheological performance as noted in the proceeding chapters, and
setting performance.
The current work aims to explore the potential benefits of ternary blended limestone and
metakaolin or fly ash on the pore structure of these systems. It has been proposed that fine
limestone inclusion may increase particle packing, thereby decreasing the porosity of the
resultant hardened cement paste. The current exploration is completed in the context of
69
mercury intrusion porosimetric investigations of these materials. Extensive work has been
completed on the use of mercury intrusion porosimetry (MIP) to investigate the pore
structure of micro-porous materials such as cement paste including (Zeng et al. 2012;
Beaudoin 1979; Cook and Hover 1999). Several recent concerns about this type of study
have recently been raised, including potential concerns from the so-called “ink bottle”
effect, wherein a pore with a small opening opens to a much larger pore is recorded as a
large volume of the small pore associated with the pore opening. This results from the
necessary assumption in mercury intrusion experiments that pores are all cylindrical in
shape, and have a constant diameter throughout their depth. Further, several recent studies
have investigated the influence of sample pre-treatment on the experimental results from
an MIP investigation. Pretreatment, or drying, of MIP samples is required to remove pore
water from the sample to ensure mercury is able to fully intrude into the sample. Several
common strategies are used including vacuum and oven drying as well as solvent exchange
(Gallé 2001; Cook and Hover 1999). The primary concern noted with these techniques
was changes to the pore structure induced as part of the drying process, potentially resulting
in significant error in the determination of the porosity of the material.
There have been several studies investigating the influence of limestone on the pore
structure of portland cement pastes, mortars and concretes (Tsivilis et al. 2003; Ye et al.
2007; Tsivilis, Chaniotakis, Batis, et al. 1999; Pipilikaki and Beazi-Katsioti 2009),
however these studies have been largely focused on interground portland limestone
cements and portland limestone cements with a coarser limestone phase. It has been
proposed that the stabilization of AFt phases, primarily ettringite, in hardened portland
limestone cement paste due to favored monocarbonate formation may result in a more
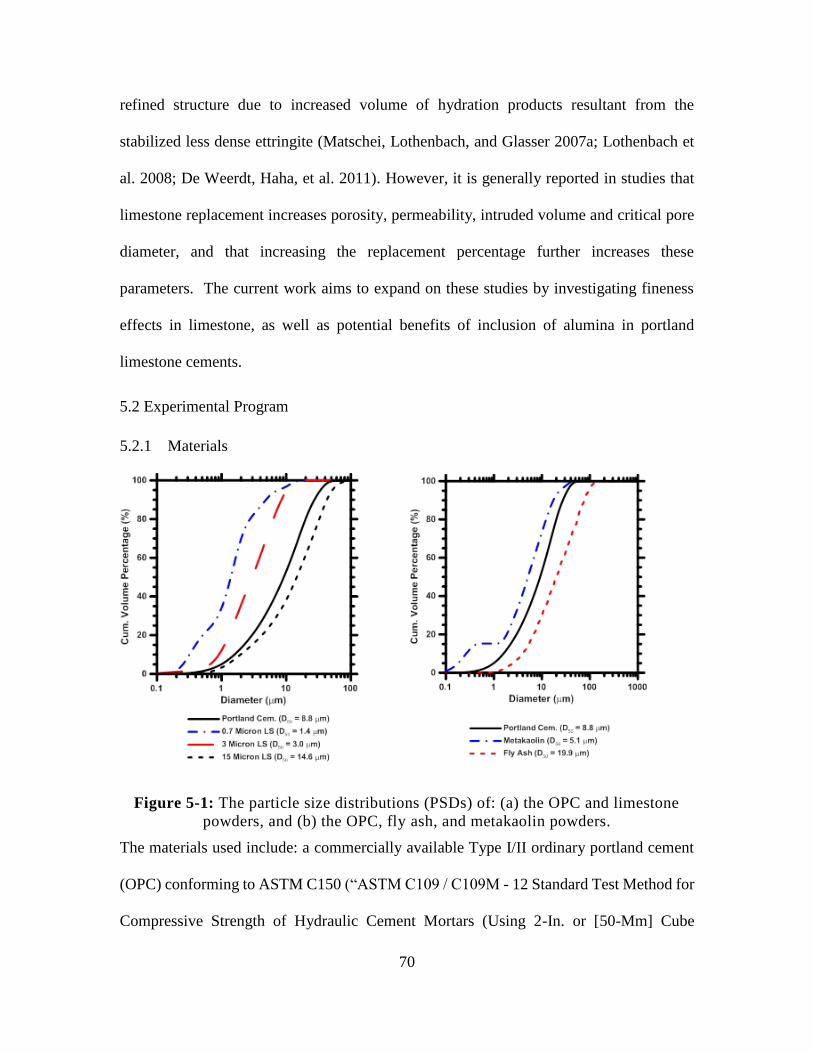
70
refined structure due to increased volume of hydration products resultant from the
stabilized less dense ettringite (Matschei, Lothenbach, and Glasser 2007a; Lothenbach et
al. 2008; De Weerdt, Haha, et al. 2011). However, it is generally reported in studies that
limestone replacement increases porosity, permeability, intruded volume and critical pore
diameter, and that increasing the replacement percentage further increases these
parameters. The current work aims to expand on these studies by investigating fineness
effects in limestone, as well as potential benefits of inclusion of alumina in portland
limestone cements.
5.2 Experimental Program
5.2.1 Materials
Figure 5-1: The particle size distributions (PSDs) of: (a) the OPC and limestone
powders, and (b) the OPC, fly ash, and metakaolin powders.
The materials used include: a commercially available Type I/II ordinary portland cement
(OPC) conforming to ASTM C150 (“ASTM C109 / C109M - 12 Standard Test Method for
Compressive Strength of Hydraulic Cement Mortars (Using 2-In. or [50-Mm] Cube
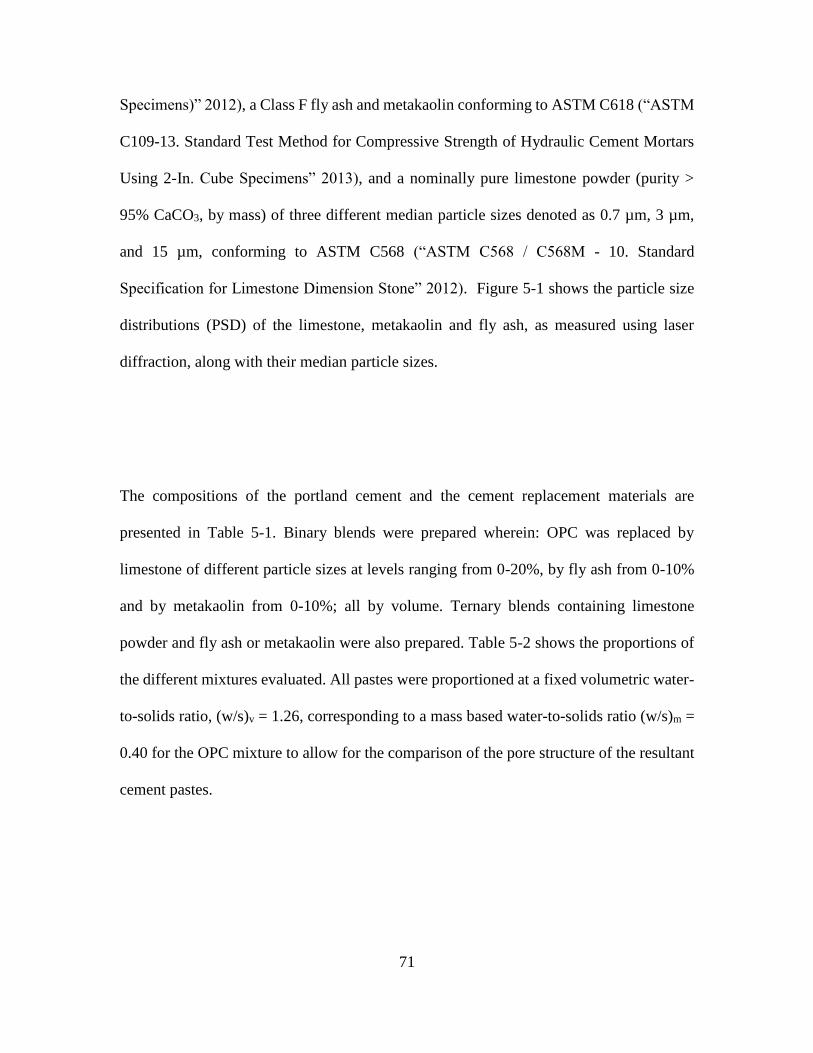
71
Specimens)” 2012), a Class F fly ash and metakaolin conforming to ASTM C618 (“ASTM
C109-13. Standard Test Method for Compressive Strength of Hydraulic Cement Mortars
Using 2-In. Cube Specimens” 2013), and a nominally pure limestone powder (purity >
95% CaCO3, by mass) of three different median particle sizes denoted as 0.7 µm, 3 µm,
and 15 µm, conforming to ASTM C568 (“ASTM C568 / C568M - 10. Standard
Specification for Limestone Dimension Stone” 2012). Figure 5-1 shows the particle size
distributions (PSD) of the limestone, metakaolin and fly ash, as measured using laser
diffraction, along with their median particle sizes.
The compositions of the portland cement and the cement replacement materials are
presented in Table 5-1. Binary blends were prepared wherein: OPC was replaced by
limestone of different particle sizes at levels ranging from 0-20%, by fly ash from 0-10%
and by metakaolin from 0-10%; all by volume. Ternary blends containing limestone
powder and fly ash or metakaolin were also prepared. Table 5-2 shows the proportions of
the different mixtures evaluated. All pastes were proportioned at a fixed volumetric water-
to-solids ratio, (w/s)v = 1.26, corresponding to a mass based water-to-solids ratio (w/s)m =
0.40 for the OPC mixture to allow for the comparison of the pore structure of the resultant
cement pastes.
(a) (b)
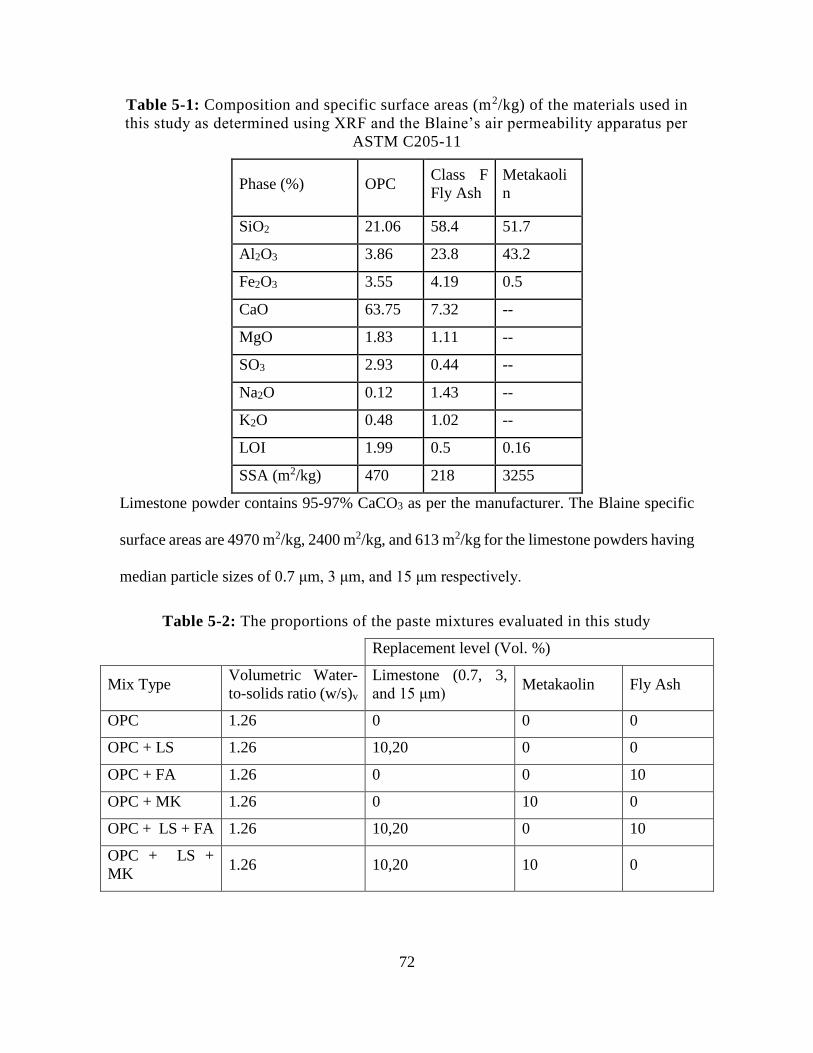
72
Table 5-1: Composition and specific surface areas (m2/kg) of the materials used in
this study as determined using XRF and the Blaine’s air permeability apparatus per
ASTM C205-11
Phase (%) OPC Class F
Fly Ash
Metakaoli
n
SiO2 21.06 58.4 51.7
Al2O3 3.86 23.8 43.2
Fe2O3 3.55 4.19 0.5
CaO 63.75 7.32 --
MgO 1.83 1.11 --
SO3 2.93 0.44 --
Na2O 0.12 1.43 --
K2O 0.48 1.02 --
LOI 1.99 0.5 0.16
SSA (m2/kg) 470 218 3255
Limestone powder contains 95-97% CaCO3 as per the manufacturer. The Blaine specific
surface areas are 4970 m2/kg, 2400 m2/kg, and 613 m2/kg for the limestone powders having
median particle sizes of 0.7 μm, 3 μm, and 15 μm respectively.
Table 5-2: The proportions of the paste mixtures evaluated in this study
Replacement level (Vol. %)
Mix Type Volumetric Water-
to-solids ratio (w/s)v
Limestone (0.7, 3,
and 15 μm) Metakaolin Fly Ash
OPC 1.26 0 0 0
OPC + LS 1.26 10,20 0 0
OPC + FA 1.26 0 0 10
OPC + MK 1.26 0 10 0
OPC + LS + FA 1.26 10,20 0 10
OPC + LS +
MK 1.26 10,20 10 0
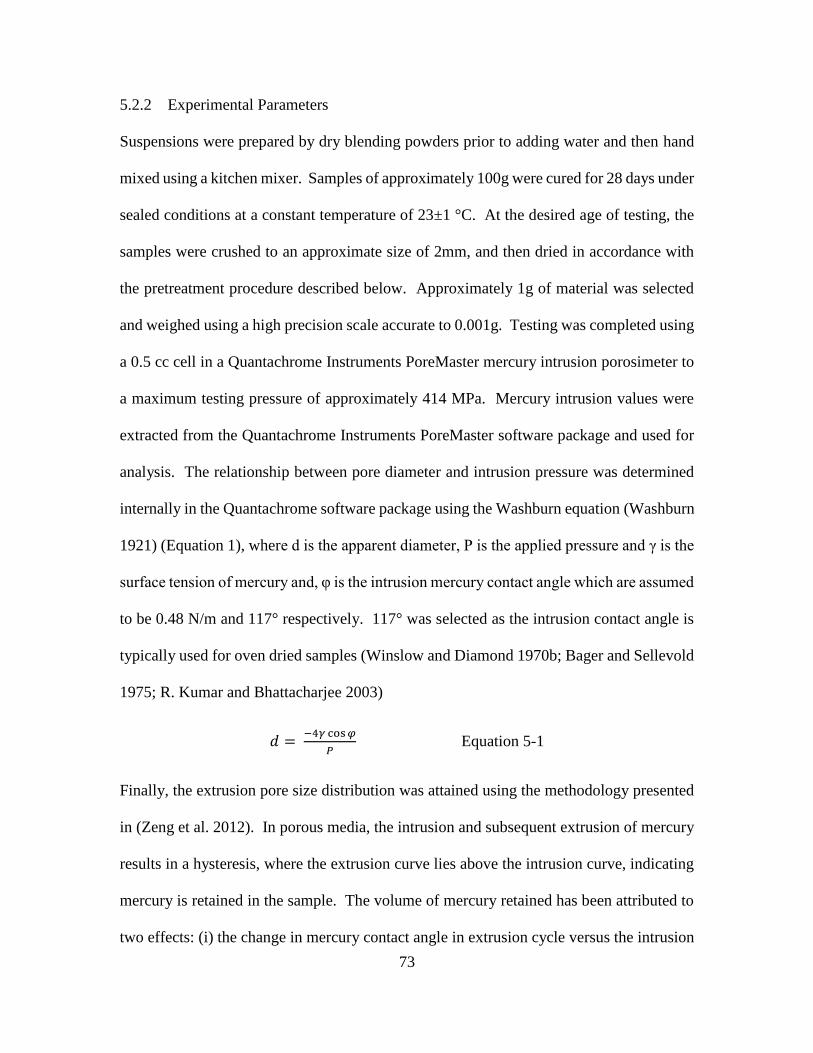
73
5.2.2 Experimental Parameters
Suspensions were prepared by dry blending powders prior to adding water and then hand
mixed using a kitchen mixer. Samples of approximately 100g were cured for 28 days under
sealed conditions at a constant temperature of 23±1 °C. At the desired age of testing, the
samples were crushed to an approximate size of 2mm, and then dried in accordance with
the pretreatment procedure described below. Approximately 1g of material was selected
and weighed using a high precision scale accurate to 0.001g. Testing was completed using
a 0.5 cc cell in a Quantachrome Instruments PoreMaster mercury intrusion porosimeter to
a maximum testing pressure of approximately 414 MPa. Mercury intrusion values were
extracted from the Quantachrome Instruments PoreMaster software package and used for
analysis. The relationship between pore diameter and intrusion pressure was determined
internally in the Quantachrome software package using the Washburn equation (Washburn
1921) (Equation 1), where d is the apparent diameter, P is the applied pressure and γ is the
surface tension of mercury and, φ is the intrusion mercury contact angle which are assumed
to be 0.48 N/m and 117° respectively. 117° was selected as the intrusion contact angle is
typically used for oven dried samples (Winslow and Diamond 1970b; Bager and Sellevold
1975; R. Kumar and Bhattacharjee 2003)
𝑑 = −4𝛾 cos 𝜑
𝑃 Equation 5-1
Finally, the extrusion pore size distribution was attained using the methodology presented
in (Zeng et al. 2012). In porous media, the intrusion and subsequent extrusion of mercury
results in a hysteresis, where the extrusion curve lies above the intrusion curve, indicating
mercury is retained in the sample. The volume of mercury retained has been attributed to
two effects: (i) the change in mercury contact angle in extrusion cycle versus the intrusion
74
cycle and (ii) the pore structure of the sample, in particular pores with small diameter
openings which open to larger pores, often referred to as the ink bottle effect (Zeng et al.
2012). The extrusion curve typically has a plateau at high pressure, where the intruded
volume of mercury remains constant; a behavior which has been assumed to be primarily
due to the decrease in contact angle from intrusion to extrusion. Based on this principle,
the change in the contact angle was determined by the determination of contact angle
modification factor (Zeng et al. 2012), as presented in Equation 5-2.
𝛼𝜃 = ∆𝑃
𝑃 Eq. 5-2
Where ΔP is determined as the change in pressure before extrusion begins, selected in this
study to be the point at which the extrusion rate exceeds 0.001 cc/g. This modification
factor is then used to determine the extrusion contact angle as:
𝜃𝑒𝑥 = cos−1(cos(𝜃𝑖𝑛) (1 − 𝛼𝜃)) Eq. 5-3
The extrusion contact angles determined with this methodology in this study varied by
sample, but were typically about 106°. After the extrusion contact angle was determined,
the extrusion distribution was determined using the modified angle in Eq. 5-1, and the total
volume retained determined as the volume remaining at the end of the extrusion cycle. The
retained volume is proposed to be related to the tortuosity of the pore structure, as it
measures the quantity of mercury that is “trapped” in the sample after pressure has been
removed. The retained volume in this paper is reported as a fraction of the total volume
intruded, as this ratio gives a better idea of the complexity of the pore structure in the
sample.
75
There has been significant recent discussion on the influence of pretreatment on determined
parameters in mercury intrusion porosimetry, including (Gallé 2001; Winslow and
Diamond 1970b). It has been noted that methods such as heating at high temperature effect
the pore structure of the sample due to the internal pressure resultant from the phase
transformation of water. A preliminary study was performed as part of this study on a fly
ash and OPC sample to determine an appropriate drying method for use in the
experimentation. The results of this preliminary study for the OPC sample are presented
in Figure 5-2. It is noted from these figures that the use of no pretreatment resulted in a
significant decrease in intruded mercury, while drying for long durations or at high
temperatures resulted in significant increases in the volume of mercury intruded. Drying
at lower temperature or vacuum drying resulted in comparable pore size distribution
curves. The critical (percolation) pore diameter is defined as the diameter at which the
maximum rate of intrusion occurs, as illustrated by the earliest major peak (Atahan, Oktar,
and Tasdemir 2009) as shown in Figure 5-2(b). Noted from this figure for both 60°C for
2 hours and vacuum drying comparable peak locations are determined. Based on this
analysis, the drying methodology of 60°C for 2 hours was selected for this study. As this
study is comparative in nature, and investigating relative differences, this was determined
to be sufficient for this study.
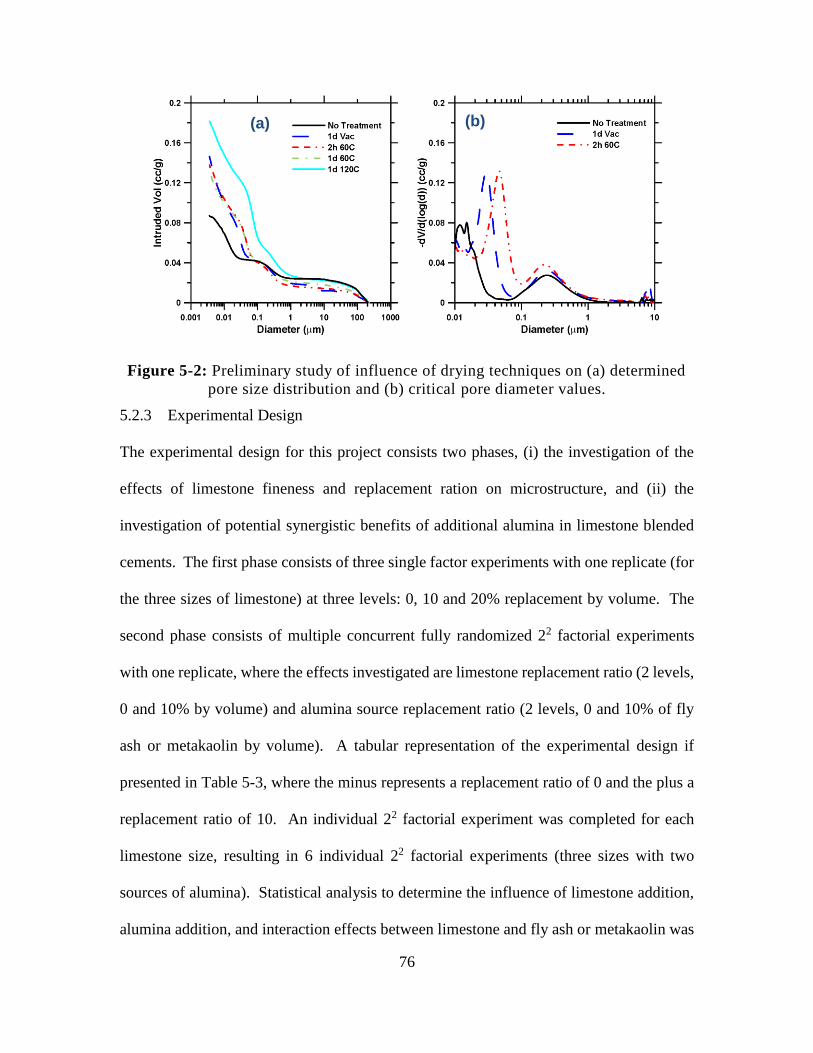
76
Figure 5-2: Preliminary study of influence of drying techniques on (a) determined
pore size distribution and (b) critical pore diameter values.
5.2.3 Experimental Design
The experimental design for this project consists two phases, (i) the investigation of the
effects of limestone fineness and replacement ration on microstructure, and (ii) the
investigation of potential synergistic benefits of additional alumina in limestone blended
cements. The first phase consists of three single factor experiments with one replicate (for
the three sizes of limestone) at three levels: 0, 10 and 20% replacement by volume. The
second phase consists of multiple concurrent fully randomized 22 factorial experiments
with one replicate, where the effects investigated are limestone replacement ratio (2 levels,
0 and 10% by volume) and alumina source replacement ratio (2 levels, 0 and 10% of fly
ash or metakaolin by volume). A tabular representation of the experimental design if
presented in Table 5-3, where the minus represents a replacement ratio of 0 and the plus a
replacement ratio of 10. An individual 22 factorial experiment was completed for each
limestone size, resulting in 6 individual 22 factorial experiments (three sizes with two
sources of alumina). Statistical analysis to determine the influence of limestone addition,
alumina addition, and interaction effects between limestone and fly ash or metakaolin was
(b) (a)
77
conducted using analysis of variance (ANOVA). Additional investigations were
completed at higher limestone volumetric replacement ratios to further examine the
influences of limestone as part of the randomized experiment but external to the ANOVA
statistical analysis. A p-value of less than 0.05 was used to define statistical significance
to reject the null hypothesis: there is no effect.
Table 5-3: Experimental Design Table
LS FA/MK
OPC - -
10 LS + -
10 FA/MK - +
10 LS 10
FA/MK + +
ANOVA analysis was completed on the response variables of volume intruded, critical
pore diameter, and volume fraction retained. These parameters were determined as
discussed in the previous section.
5.3 Results and Discussions
5.3.1 Influence of limestone replacement ratio and fineness on pore structure
Mercury intrusion experiments were conducted on binary blended limestone cements as
outlined in Section 5-2, the resultant determined intruded and extruded pore size
distributions are presented in Figure 5-3. The extrusion portion of these curves was
determined using the modified extruded mercury contact angle as determined using
Equation 5-3. Immediately evident from these figures is that the fineness of limestone
appears to have very little influence on the intrusion curves or the total volume of mercury
intruded. Further, it is noted that increasing the replacement ratio further increases the total
intruded volume, and appears to increase it at approximately the same ratio regardless of
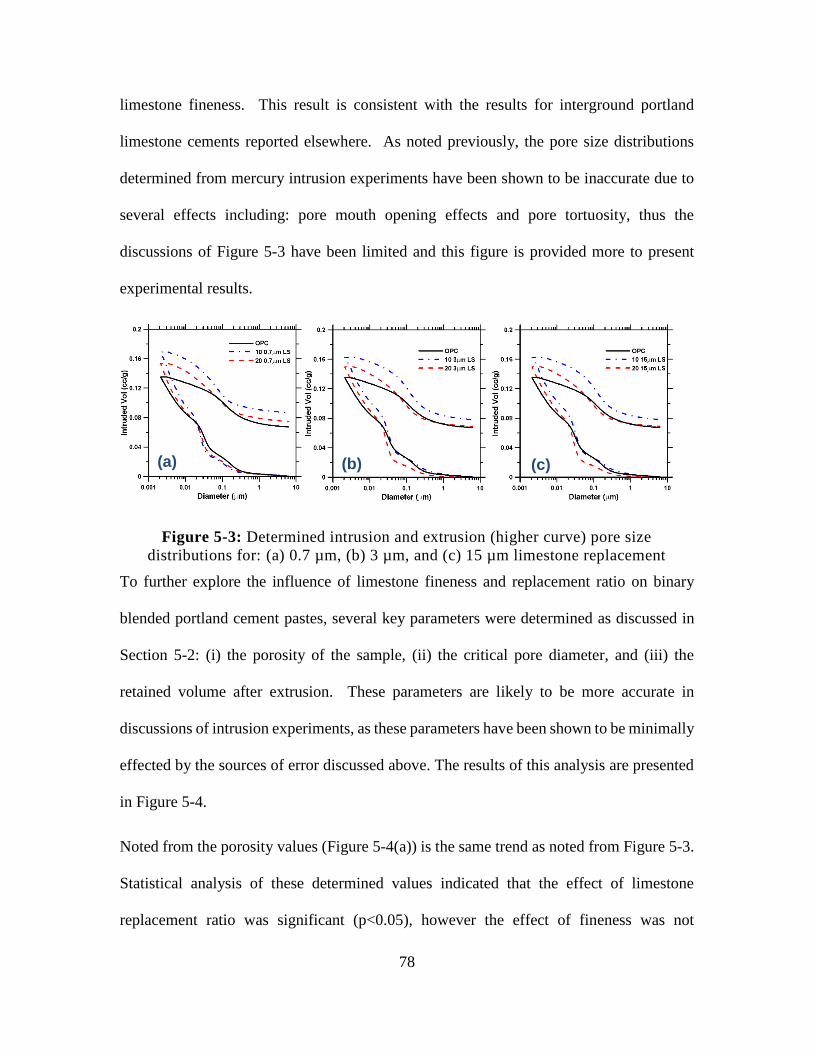
78
limestone fineness. This result is consistent with the results for interground portland
limestone cements reported elsewhere. As noted previously, the pore size distributions
determined from mercury intrusion experiments have been shown to be inaccurate due to
several effects including: pore mouth opening effects and pore tortuosity, thus the
discussions of Figure 5-3 have been limited and this figure is provided more to present
experimental results.
Figure 5-3: Determined intrusion and extrusion (higher curve) pore size
distributions for: (a) 0.7 µm, (b) 3 µm, and (c) 15 µm limestone replacement
To further explore the influence of limestone fineness and replacement ratio on binary
blended portland cement pastes, several key parameters were determined as discussed in
Section 5-2: (i) the porosity of the sample, (ii) the critical pore diameter, and (iii) the
retained volume after extrusion. These parameters are likely to be more accurate in
discussions of intrusion experiments, as these parameters have been shown to be minimally
effected by the sources of error discussed above. The results of this analysis are presented
in Figure 5-4.
Noted from the porosity values (Figure 5-4(a)) is the same trend as noted from Figure 5-3.
Statistical analysis of these determined values indicated that the effect of limestone
replacement ratio was significant (p<0.05), however the effect of fineness was not
(a) (b) (c)
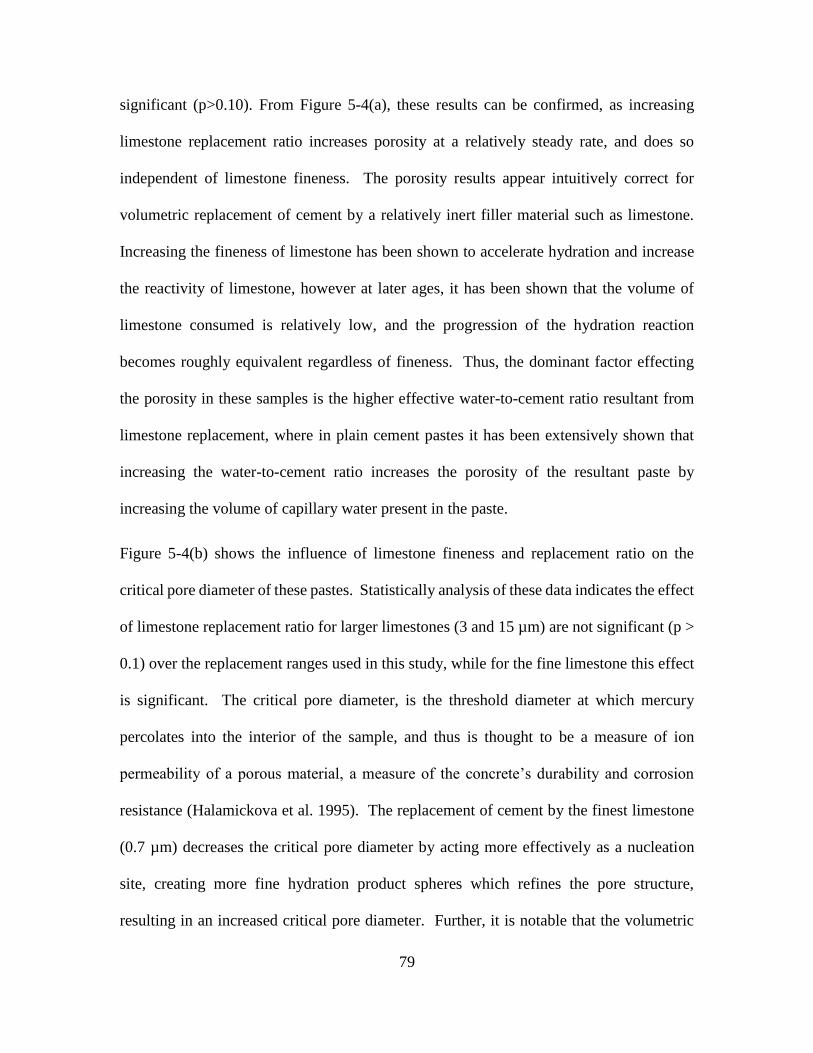
79
significant (p>0.10). From Figure 5-4(a), these results can be confirmed, as increasing
limestone replacement ratio increases porosity at a relatively steady rate, and does so
independent of limestone fineness. The porosity results appear intuitively correct for
volumetric replacement of cement by a relatively inert filler material such as limestone.
Increasing the fineness of limestone has been shown to accelerate hydration and increase
the reactivity of limestone, however at later ages, it has been shown that the volume of
limestone consumed is relatively low, and the progression of the hydration reaction
becomes roughly equivalent regardless of fineness. Thus, the dominant factor effecting
the porosity in these samples is the higher effective water-to-cement ratio resultant from
limestone replacement, where in plain cement pastes it has been extensively shown that
increasing the water-to-cement ratio increases the porosity of the resultant paste by
increasing the volume of capillary water present in the paste.
Figure 5-4(b) shows the influence of limestone fineness and replacement ratio on the
critical pore diameter of these pastes. Statistically analysis of these data indicates the effect
of limestone replacement ratio for larger limestones (3 and 15 µm) are not significant (p >
0.1) over the replacement ranges used in this study, while for the fine limestone this effect
is significant. The critical pore diameter, is the threshold diameter at which mercury
percolates into the interior of the sample, and thus is thought to be a measure of ion
permeability of a porous material, a measure of the concrete’s durability and corrosion
resistance (Halamickova et al. 1995). The replacement of cement by the finest limestone
(0.7 µm) decreases the critical pore diameter by acting more effectively as a nucleation
site, creating more fine hydration product spheres which refines the pore structure,
resulting in an increased critical pore diameter. Further, it is notable that the volumetric
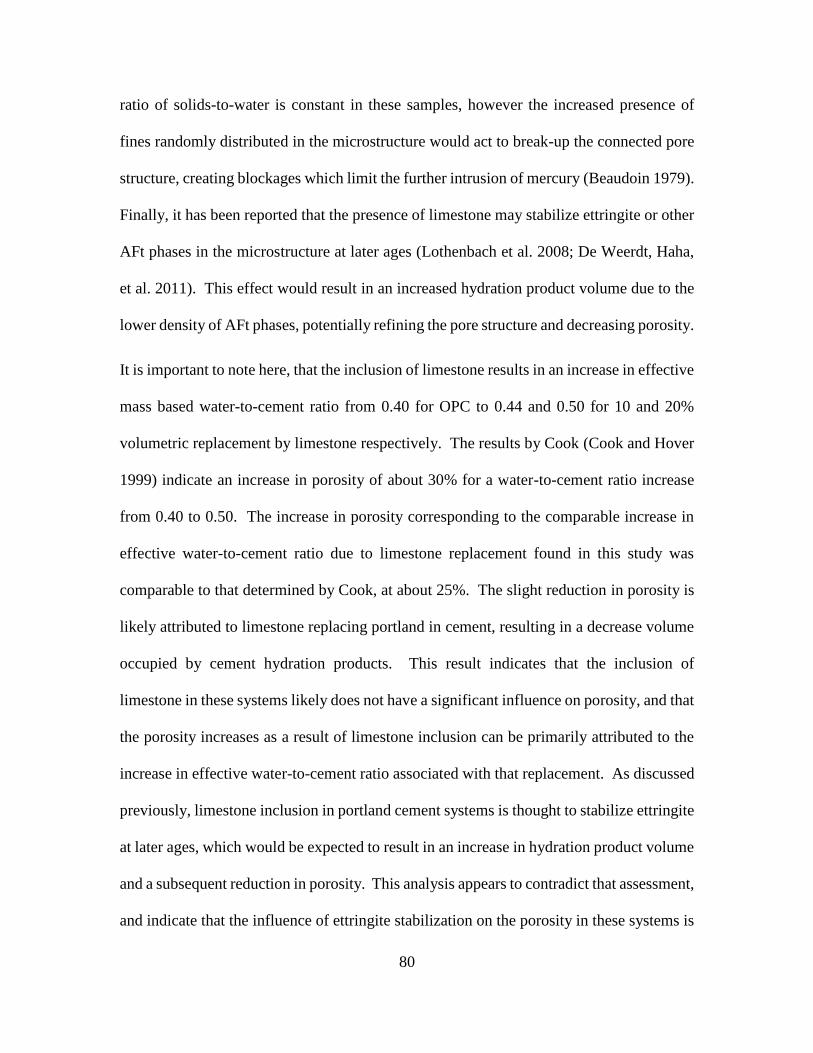
80
ratio of solids-to-water is constant in these samples, however the increased presence of
fines randomly distributed in the microstructure would act to break-up the connected pore
structure, creating blockages which limit the further intrusion of mercury (Beaudoin 1979).
Finally, it has been reported that the presence of limestone may stabilize ettringite or other
AFt phases in the microstructure at later ages (Lothenbach et al. 2008; De Weerdt, Haha,
et al. 2011). This effect would result in an increased hydration product volume due to the
lower density of AFt phases, potentially refining the pore structure and decreasing porosity.
It is important to note here, that the inclusion of limestone results in an increase in effective
mass based water-to-cement ratio from 0.40 for OPC to 0.44 and 0.50 for 10 and 20%
volumetric replacement by limestone respectively. The results by Cook (Cook and Hover
1999) indicate an increase in porosity of about 30% for a water-to-cement ratio increase
from 0.40 to 0.50. The increase in porosity corresponding to the comparable increase in
effective water-to-cement ratio due to limestone replacement found in this study was
comparable to that determined by Cook, at about 25%. The slight reduction in porosity is
likely attributed to limestone replacing portland in cement, resulting in a decrease volume
occupied by cement hydration products. This result indicates that the inclusion of
limestone in these systems likely does not have a significant influence on porosity, and that
the porosity increases as a result of limestone inclusion can be primarily attributed to the
increase in effective water-to-cement ratio associated with that replacement. As discussed
previously, limestone inclusion in portland cement systems is thought to stabilize ettringite
at later ages, which would be expected to result in an increase in hydration product volume
and a subsequent reduction in porosity. This analysis appears to contradict that assessment,
and indicate that the influence of ettringite stabilization on the porosity in these systems is
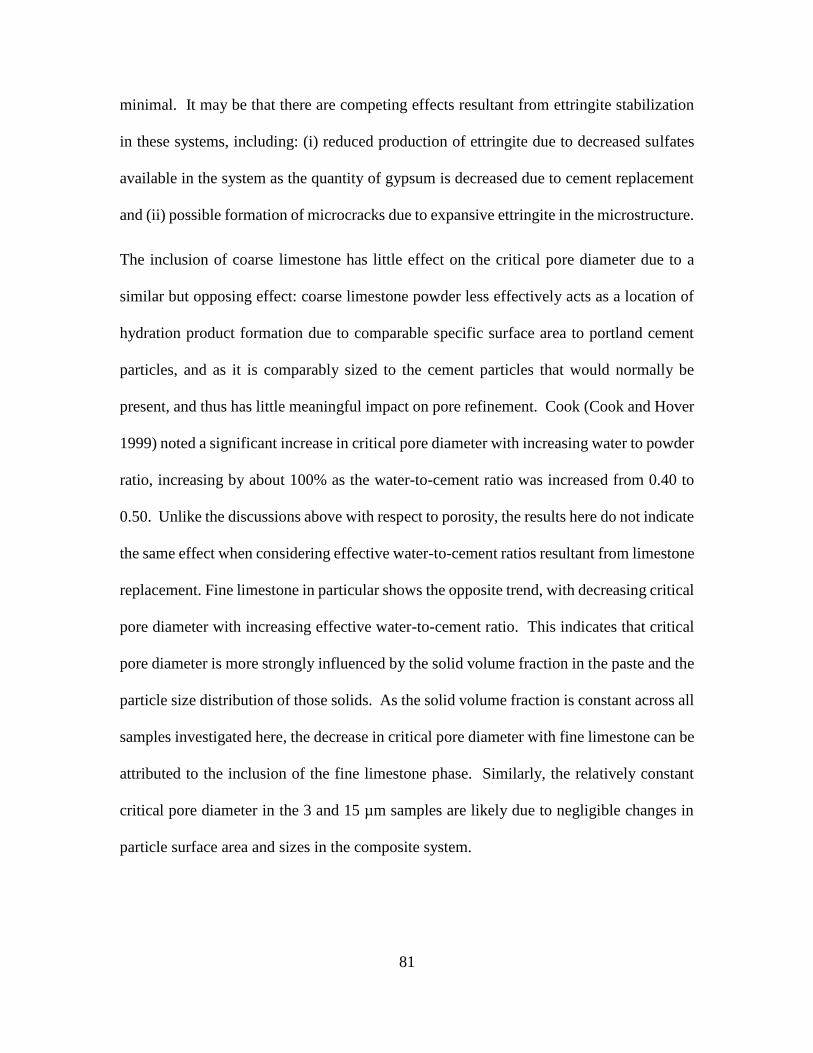
81
minimal. It may be that there are competing effects resultant from ettringite stabilization
in these systems, including: (i) reduced production of ettringite due to decreased sulfates
available in the system as the quantity of gypsum is decreased due to cement replacement
and (ii) possible formation of microcracks due to expansive ettringite in the microstructure.
The inclusion of coarse limestone has little effect on the critical pore diameter due to a
similar but opposing effect: coarse limestone powder less effectively acts as a location of
hydration product formation due to comparable specific surface area to portland cement
particles, and as it is comparably sized to the cement particles that would normally be
present, and thus has little meaningful impact on pore refinement. Cook (Cook and Hover
1999) noted a significant increase in critical pore diameter with increasing water to powder
ratio, increasing by about 100% as the water-to-cement ratio was increased from 0.40 to
0.50. Unlike the discussions above with respect to porosity, the results here do not indicate
the same effect when considering effective water-to-cement ratios resultant from limestone
replacement. Fine limestone in particular shows the opposite trend, with decreasing critical
pore diameter with increasing effective water-to-cement ratio. This indicates that critical
pore diameter is more strongly influenced by the solid volume fraction in the paste and the
particle size distribution of those solids. As the solid volume fraction is constant across all
samples investigated here, the decrease in critical pore diameter with fine limestone can be
attributed to the inclusion of the fine limestone phase. Similarly, the relatively constant
critical pore diameter in the 3 and 15 µm samples are likely due to negligible changes in
particle surface area and sizes in the composite system.
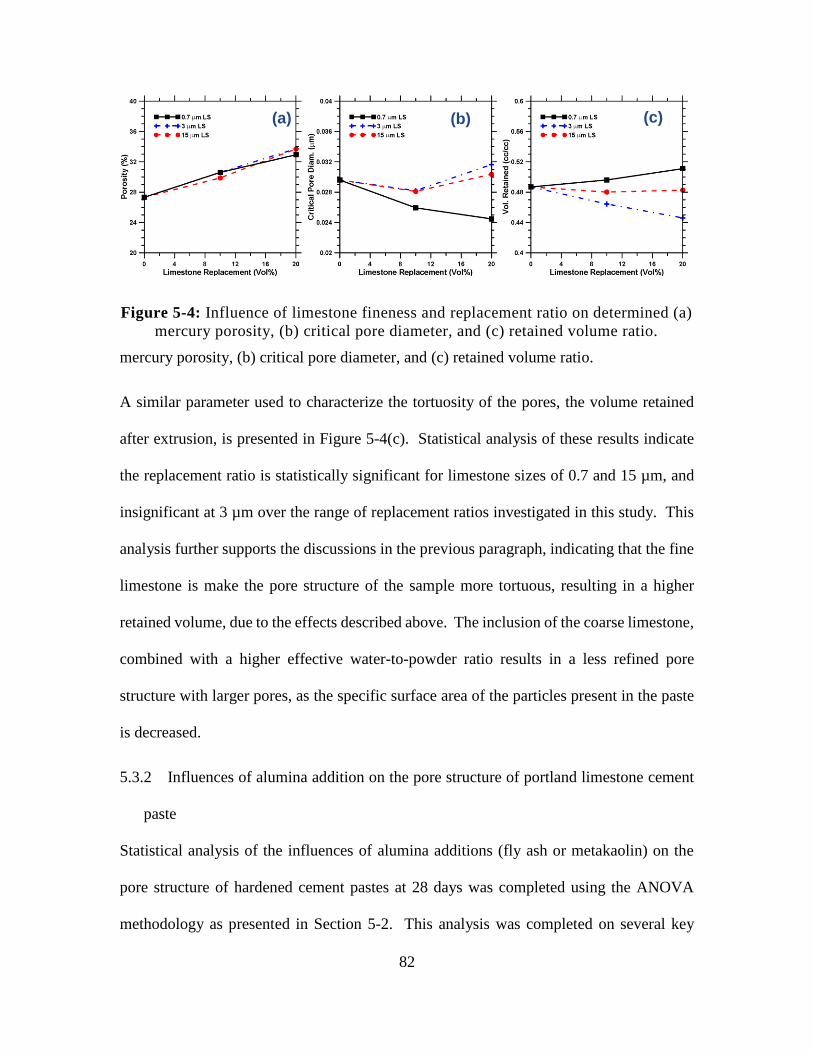
82
Figure 5-4: Influence of limestone fineness and replacement ratio on determined (a)
mercury porosity, (b) critical pore diameter, and (c) retained volume ratio.
mercury porosity, (b) critical pore diameter, and (c) retained volume ratio.
A similar parameter used to characterize the tortuosity of the pores, the volume retained
after extrusion, is presented in Figure 5-4(c). Statistical analysis of these results indicate
the replacement ratio is statistically significant for limestone sizes of 0.7 and 15 µm, and
insignificant at 3 µm over the range of replacement ratios investigated in this study. This
analysis further supports the discussions in the previous paragraph, indicating that the fine
limestone is make the pore structure of the sample more tortuous, resulting in a higher
retained volume, due to the effects described above. The inclusion of the coarse limestone,
combined with a higher effective water-to-powder ratio results in a less refined pore
structure with larger pores, as the specific surface area of the particles present in the paste
is decreased.
5.3.2 Influences of alumina addition on the pore structure of portland limestone cement
paste
Statistical analysis of the influences of alumina additions (fly ash or metakaolin) on the
pore structure of hardened cement pastes at 28 days was completed using the ANOVA
methodology as presented in Section 5-2. This analysis was completed on several key
(a) (b) (c)
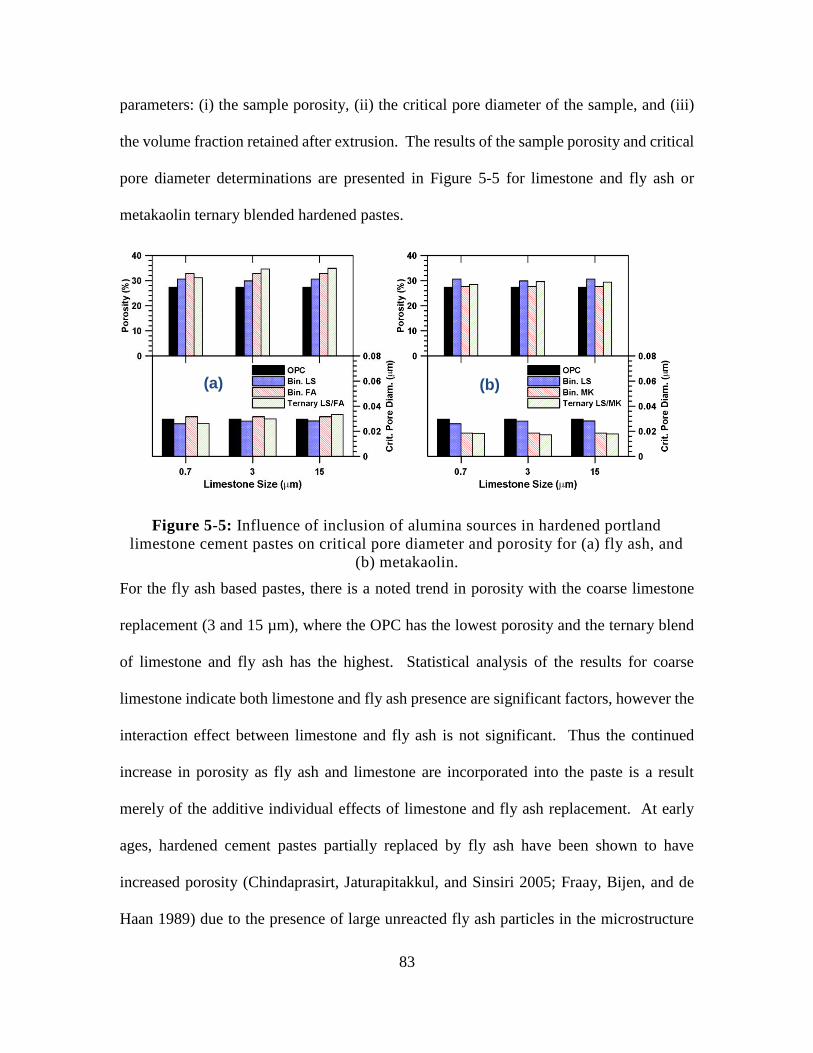
83
parameters: (i) the sample porosity, (ii) the critical pore diameter of the sample, and (iii)
the volume fraction retained after extrusion. The results of the sample porosity and critical
pore diameter determinations are presented in Figure 5-5 for limestone and fly ash or
metakaolin ternary blended hardened pastes.
Figure 5-5: Influence of inclusion of alumina sources in hardened portland
limestone cement pastes on critical pore diameter and porosity for (a) fly ash, and
(b) metakaolin.
For the fly ash based pastes, there is a noted trend in porosity with the coarse limestone
replacement (3 and 15 µm), where the OPC has the lowest porosity and the ternary blend
of limestone and fly ash has the highest. Statistical analysis of the results for coarse
limestone indicate both limestone and fly ash presence are significant factors, however the
interaction effect between limestone and fly ash is not significant. Thus the continued
increase in porosity as fly ash and limestone are incorporated into the paste is a result
merely of the additive individual effects of limestone and fly ash replacement. At early
ages, hardened cement pastes partially replaced by fly ash have been shown to have
increased porosity (Chindaprasirt, Jaturapitakkul, and Sinsiri 2005; Fraay, Bijen, and de
Haan 1989) due to the presence of large unreacted fly ash particles in the microstructure
(a) (b)
84
and the low pozzolanic reactivity of fly ash at relatively early ages, a result which is
confirmed in this study. Further, inclusion of coarse limestone particles results in a further
increase of porosity due to the increased effective water-to-powder ratio as described
above.
The combination of fine limestone (0.7 µm) and fly ash shows a different trend, however.
Both binary fly ash and binary limestone mixes are shown to increase the porosity of the
sample, for reasons discussed previously. When both fly ash and fine limestone replace
cement, the additive effect seen with coarse limestones is not present, and a reduction in
porosity as compared to the binary fly ash sample is noted. Statistical analysis of effects
indicates that fly ash and the interaction effect of fly ash and limestone are significant,
while the influence of limestone is less significant. This indicates there is a potential
synergistic benefit on porosity between fine limestone and fly ash. As discussed
previously, studies have indicated that fine limestone in combination with fly ash enhances
the reactivity of limestone (De Weerdt, Haha, et al. 2011) and in Chapter 4, and further
stabilizes ettringite at later ages. These two factors would increase hydration product
volume as compared to the binary fly ash mixture, resulting in a decrease in porosity.
The ternary blends of the coarsest limestone and fly ash shows a similar behavior for
critical pore diameter (lower panel of Figure 5-5(a)) as for porosity. Statistical analysis of
these results, however, indicate that none of the effects are statistically significant, as the
p-value is in excess of 0.10 for all tests. Observing the results in Figure 5(a), the coarsest
limestone shows a slight continued increase in critical pore diameter when limestone and
fly ash replace cement, likely attributed to the low pozzolanic activity of fly ash at the age
investigated and the increased effect water-to-cement ratio of the system. The finest and
85
median limestone (0.7 and 3 µm) show a different trend, with the inclusion of limestone
reducing the critical pore diameter as compared to OPC or binary fly ash. This is likely
resultant from the enhanced reactivity of limestone, combined with the increased fines
present in the sample and stabilization of ettringite leading to a more refined pore structure.
For metakaolin replacement pastes (Figure 5-5(b)), the addition of metakaolin is shown to
result in no significant change as compared to the OPC paste at the tested age which is
generally consistent with (Moisés Frı́as and Cabrera 2000), while the addition of
metakaolin to limestone blends can be seen to result in a slight reduction in porosity as
compared to the binary limestone sample. This is a noted difference from the fly ash
sample, where there was no apparent synergistic benefit except in the case of the finest
limestone used. This is attributed to the enhanced pozzolanic activity of metakaolin at
earlier ages as compared to fly ash (M. Frı́as, de Rojas, and Cabrera 2000) resulting in
increased hydration product formation, reducing the porosity of the sample. With respect
to critical pore diameter (lower panel of Figure 5-5(b)), the inclusion of metakaolin results
in a significant decrease as compared to both the OPC and binary limestone samples for all
sizes tested. Statistical analysis of this data indicated that metakaolin was the only
significant factor. Metakaolin results in a significant refinement of the pore structure of
the sample, particularly at later ages (Moisés Frı́as and Cabrera 2000).
The presence of mono/hemi-carbonate in ternary blends of limestone and metakaolin, as
noted in Chapter 4, indicates the presence of stabilized ettringite as the formation of
monocarbonate is favored preventing or delaying the transformation of ettringite to
monosulfate (De Weerdt, Haha, et al. 2011; Matschei, Lothenbach, and Glasser 2007a;
Kakali et al. 2000). The presence of less dense ettringite would be expected to indicate a
86
refined pore structure and decrease in porosity, with a decreased critical pore diameter and
porosity due to the increased volume of reaction products, however no such decrease is
noted in the critical pore diameter data in Figure 5-5(b) and only a slight decrease is
indicated in the overall porosity. This may be due to the less dense ettringite causing
microcracking in the sample, thus the increased volume of hydration products is balanced
by increased microcracking in the sample. It is further noted that statistical analysis of the
critical pore diameter data indicates metakaolin is a very significant influence and both the
inclusion of limestone and the limestone metakaolin interaction terms are not significant.
To explore these influences further, the volume fraction of mercury retained has been
determined for the ternary blends. The retained volume fraction of mercury is related to
the tortuosity of the pore structure, where a more tortuous structure makes full evacuation
of the pore structure more difficult resulting in an increased fraction of retained mercury.
The results of this analysis are shown in Figure 5-6. For the fly ash based suspensions
(Figure 5-6(a)), several trends are immediately evident. The binary mix of fly ash shows
the lowest volume fraction retained for all mixtures. The binary mixes of limestone show
differing trends, with the finest limestone showing an increase in retained volume fraction,
while the two coarser limestones show a reduction. The inclusion of both fly ash particles
and coarse limestone, in combination with their limited participation in cement hydration
at this age, gives rise to a less refined, less tortuous pore structure. In contrast, fine
limestone more effectively acts as a nucleation site for hydration products as well as more
effectively disperses in the microstructure, resulting a more tortuous pore structure and a
higher retained volume fraction of mercury. Ternary blends of limestone and fly ash all
show increased retained volume as compared to the binary fly ash mixtures, with the 0.7
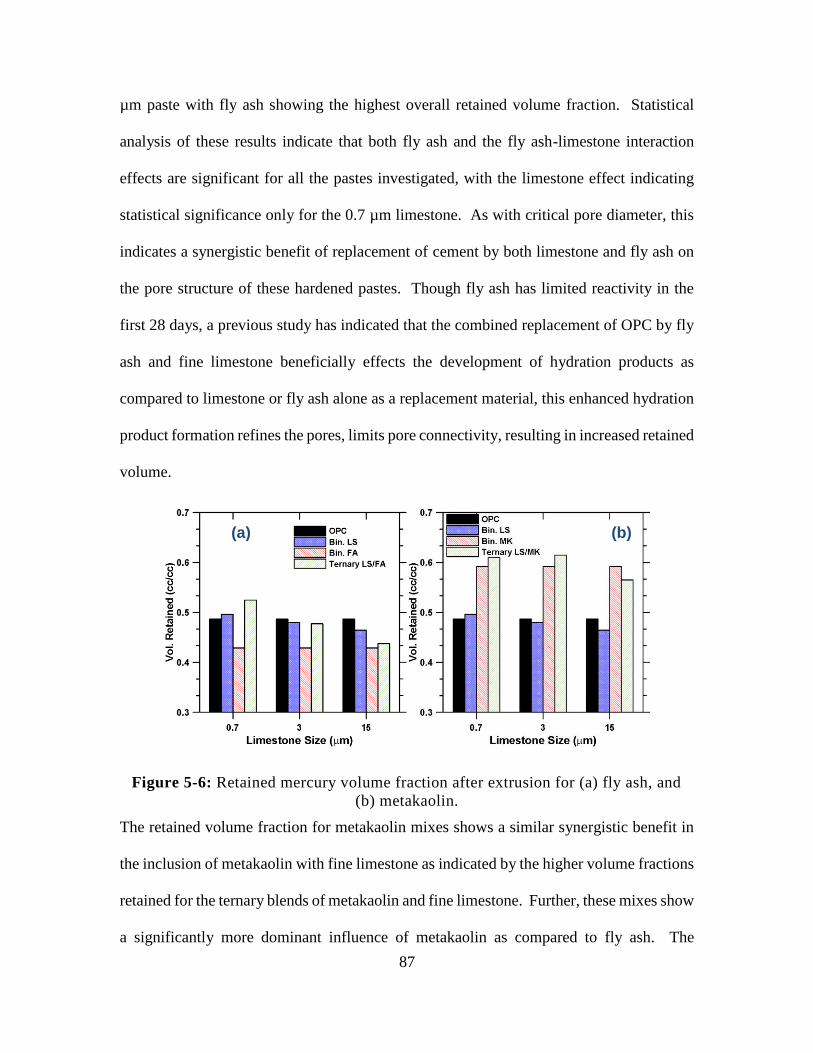
87
µm paste with fly ash showing the highest overall retained volume fraction. Statistical
analysis of these results indicate that both fly ash and the fly ash-limestone interaction
effects are significant for all the pastes investigated, with the limestone effect indicating
statistical significance only for the 0.7 µm limestone. As with critical pore diameter, this
indicates a synergistic benefit of replacement of cement by both limestone and fly ash on
the pore structure of these hardened pastes. Though fly ash has limited reactivity in the
first 28 days, a previous study has indicated that the combined replacement of OPC by fly
ash and fine limestone beneficially effects the development of hydration products as
compared to limestone or fly ash alone as a replacement material, this enhanced hydration
product formation refines the pores, limits pore connectivity, resulting in increased retained
volume.
Figure 5-6: Retained mercury volume fraction after extrusion for (a) fly ash, and
(b) metakaolin.
The retained volume fraction for metakaolin mixes shows a similar synergistic benefit in
the inclusion of metakaolin with fine limestone as indicated by the higher volume fractions
retained for the ternary blends of metakaolin and fine limestone. Further, these mixes show
a significantly more dominant influence of metakaolin as compared to fly ash. The
(a) (b)
88
inclusion of metakaolin results in a significant increase in volume fraction retained. As
discussed previously, metakaolin has significantly higher pozzolanic activity at early ages
as compared to fly ash, due in part to the higher surface area and alumina content (M. Frı́as,
de Rojas, and Cabrera 2000; Ambroise, Maximilien, and Pera 1994). This increased
reactivity results in a more tortuous structure, with hydration products blocking connected
paths.
5.3.3 Influences of limestone dosage on pore structure of cement pastes with metakaolin
or fly ash
A mercury intrusion porosimetric investigation was completed using 3 µm limestone at an
additional cement replacement level of 20% by volume with a fly ash or metakaolin
replacement ratio of 10% by volume. The results of this investigation showing the
influence of limestone dosage on mercury porosity, critical pore diameter, and volume
fraction retained are presented in Figure 5-7. It is first noted from these figures that the
trends for metakaolin or fly ash are nearly identical, although offset vertically. This
supports the concept that limestone is not significantly participating in the hydration
reactions, except primarily to dilute the portland cement content in the mixture, raising the
water-to-cement ratio. The porosity results indicate a behavior that would be expected
given the previous discussions on the influence of limestone dosage in binary limestone
systems. As the limestone dosage is increased, the effective water-to-cement ratio is
increased resulting in an increase in porosity. There does not appear to be a synergistic
benefit of limestone inclusion with additional alumina sources on the porosity of these
systems. The critical pore diameter (Figure 5-7(b)) shows a continued trend from what is
depicted above, continued replacement by limestone finer than OPC results in a continued
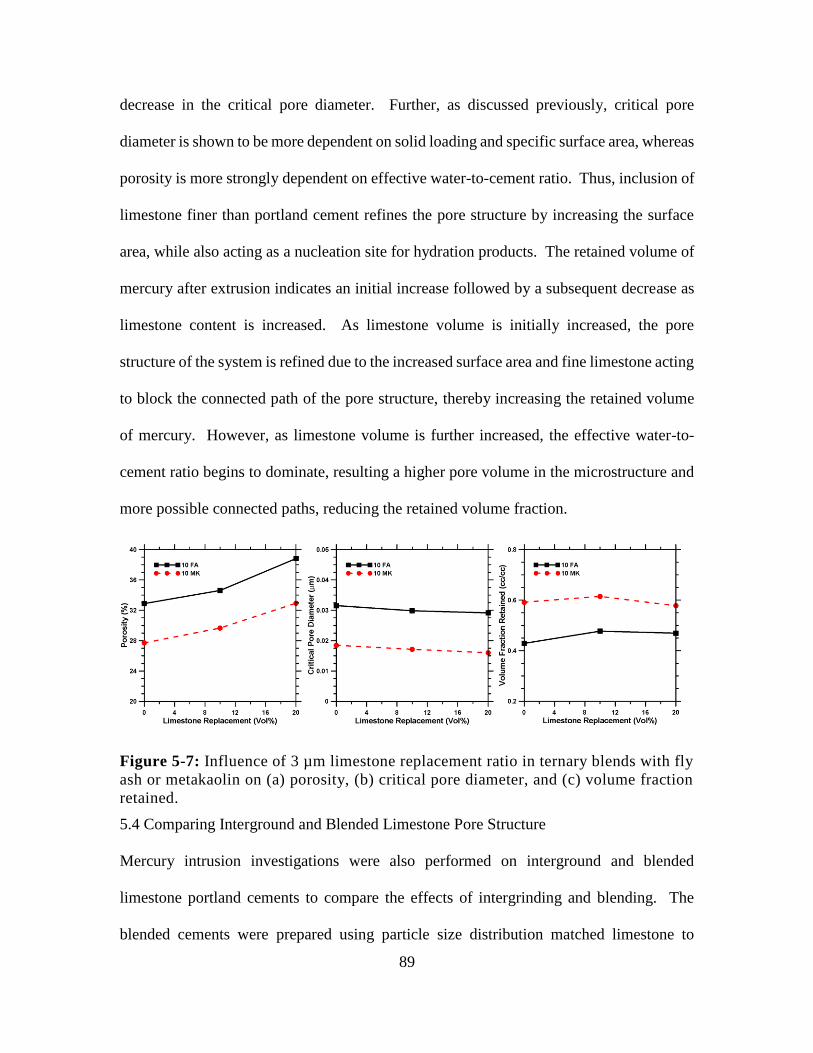
89
decrease in the critical pore diameter. Further, as discussed previously, critical pore
diameter is shown to be more dependent on solid loading and specific surface area, whereas
porosity is more strongly dependent on effective water-to-cement ratio. Thus, inclusion of
limestone finer than portland cement refines the pore structure by increasing the surface
area, while also acting as a nucleation site for hydration products. The retained volume of
mercury after extrusion indicates an initial increase followed by a subsequent decrease as
limestone content is increased. As limestone volume is initially increased, the pore
structure of the system is refined due to the increased surface area and fine limestone acting
to block the connected path of the pore structure, thereby increasing the retained volume
of mercury. However, as limestone volume is further increased, the effective water-to-
cement ratio begins to dominate, resulting a higher pore volume in the microstructure and
more possible connected paths, reducing the retained volume fraction.
Figure 5-7: Influence of 3 µm limestone replacement ratio in ternary blends with fly
ash or metakaolin on (a) porosity, (b) critical pore diameter, and (c) volume fraction
retained.
5.4 Comparing Interground and Blended Limestone Pore Structure
Mercury intrusion investigations were also performed on interground and blended
limestone portland cements to compare the effects of intergrinding and blending. The
blended cements were prepared using particle size distribution matched limestone to
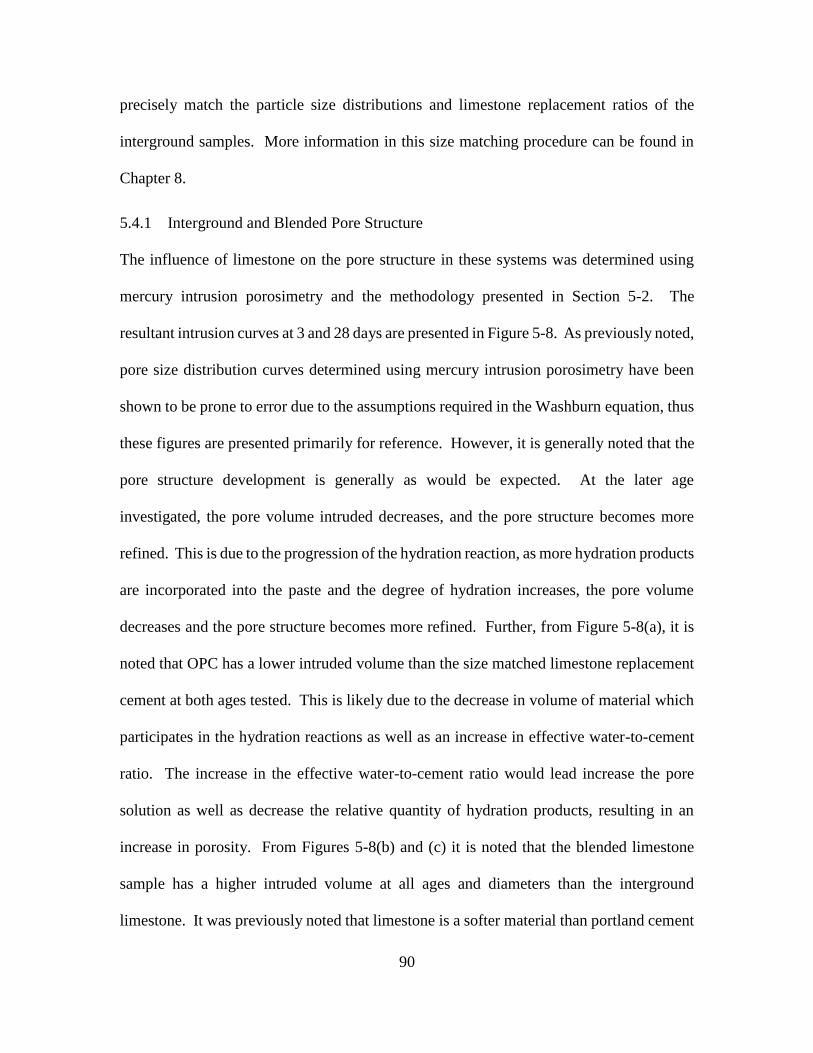
90
precisely match the particle size distributions and limestone replacement ratios of the
interground samples. More information in this size matching procedure can be found in
Chapter 8.
5.4.1 Interground and Blended Pore Structure
The influence of limestone on the pore structure in these systems was determined using
mercury intrusion porosimetry and the methodology presented in Section 5-2. The
resultant intrusion curves at 3 and 28 days are presented in Figure 5-8. As previously noted,
pore size distribution curves determined using mercury intrusion porosimetry have been
shown to be prone to error due to the assumptions required in the Washburn equation, thus
these figures are presented primarily for reference. However, it is generally noted that the
pore structure development is generally as would be expected. At the later age
investigated, the pore volume intruded decreases, and the pore structure becomes more
refined. This is due to the progression of the hydration reaction, as more hydration products
are incorporated into the paste and the degree of hydration increases, the pore volume
decreases and the pore structure becomes more refined. Further, from Figure 5-8(a), it is
noted that OPC has a lower intruded volume than the size matched limestone replacement
cement at both ages tested. This is likely due to the decrease in volume of material which
participates in the hydration reactions as well as an increase in effective water-to-cement
ratio. The increase in the effective water-to-cement ratio would lead increase the pore
solution as well as decrease the relative quantity of hydration products, resulting in an
increase in porosity. From Figures 5-8(b) and (c) it is noted that the blended limestone
sample has a higher intruded volume at all ages and diameters than the interground
limestone. It was previously noted that limestone is a softer material than portland cement
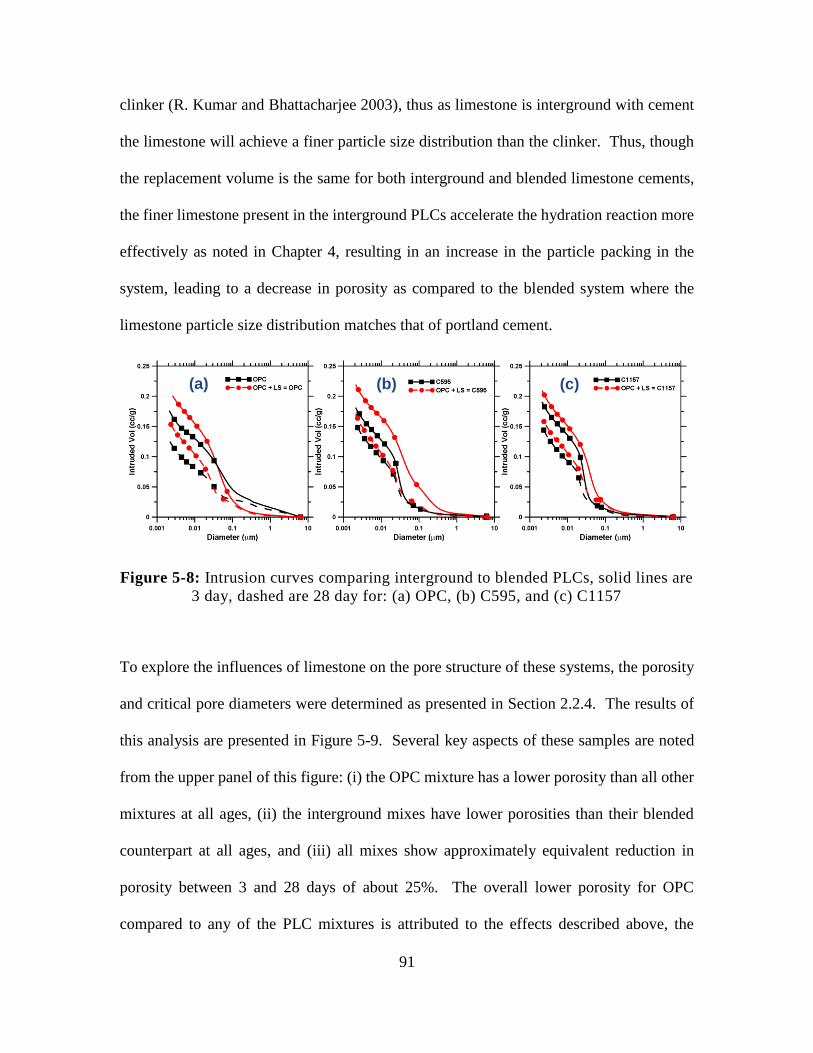
91
clinker (R. Kumar and Bhattacharjee 2003), thus as limestone is interground with cement
the limestone will achieve a finer particle size distribution than the clinker. Thus, though
the replacement volume is the same for both interground and blended limestone cements,
the finer limestone present in the interground PLCs accelerate the hydration reaction more
effectively as noted in Chapter 4, resulting in an increase in the particle packing in the
system, leading to a decrease in porosity as compared to the blended system where the
limestone particle size distribution matches that of portland cement.
Figure 5-8: Intrusion curves comparing interground to blended PLCs, solid lines are
3 day, dashed are 28 day for: (a) OPC, (b) C595, and (c) C1157
To explore the influences of limestone on the pore structure of these systems, the porosity
and critical pore diameters were determined as presented in Section 2.2.4. The results of
this analysis are presented in Figure 5-9. Several key aspects of these samples are noted
from the upper panel of this figure: (i) the OPC mixture has a lower porosity than all other
mixtures at all ages, (ii) the interground mixes have lower porosities than their blended
counterpart at all ages, and (iii) all mixes show approximately equivalent reduction in
porosity between 3 and 28 days of about 25%. The overall lower porosity for OPC
compared to any of the PLC mixtures is attributed to the effects described above, the
(a) (b) (c)
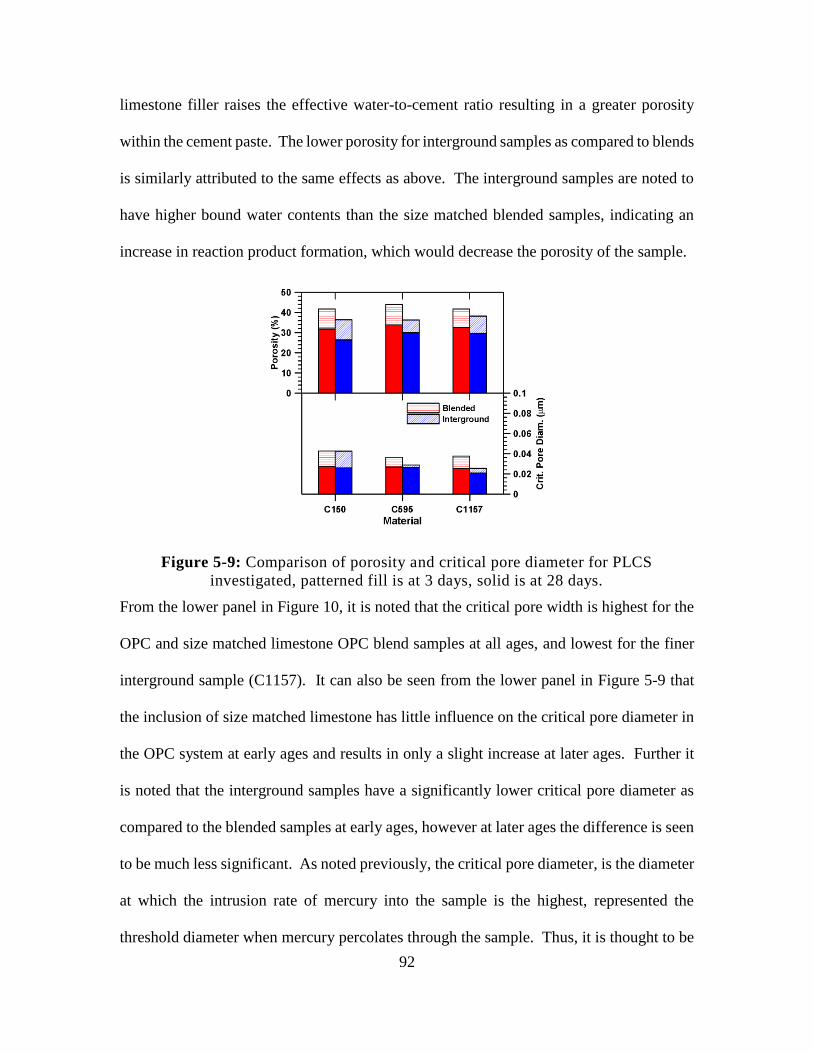
92
limestone filler raises the effective water-to-cement ratio resulting in a greater porosity
within the cement paste. The lower porosity for interground samples as compared to blends
is similarly attributed to the same effects as above. The interground samples are noted to
have higher bound water contents than the size matched blended samples, indicating an
increase in reaction product formation, which would decrease the porosity of the sample.
Figure 5-9: Comparison of porosity and critical pore diameter for PLCS
investigated, patterned fill is at 3 days, solid is at 28 days.
From the lower panel in Figure 10, it is noted that the critical pore width is highest for the
OPC and size matched limestone OPC blend samples at all ages, and lowest for the finer
interground sample (C1157). It can also be seen from the lower panel in Figure 5-9 that
the inclusion of size matched limestone has little influence on the critical pore diameter in
the OPC system at early ages and results in only a slight increase at later ages. Further it
is noted that the interground samples have a significantly lower critical pore diameter as
compared to the blended samples at early ages, however at later ages the difference is seen
to be much less significant. As noted previously, the critical pore diameter, is the diameter
at which the intrusion rate of mercury into the sample is the highest, represented the
threshold diameter when mercury percolates through the sample. Thus, it is thought to be
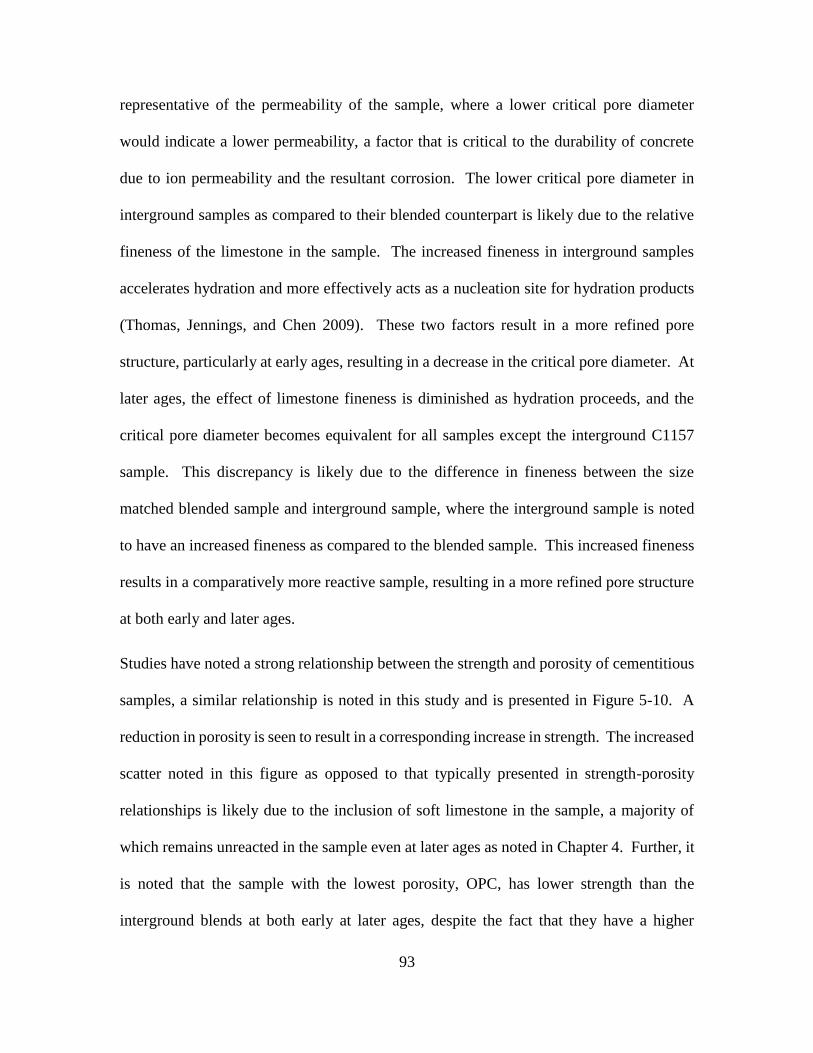
93
representative of the permeability of the sample, where a lower critical pore diameter
would indicate a lower permeability, a factor that is critical to the durability of concrete
due to ion permeability and the resultant corrosion. The lower critical pore diameter in
interground samples as compared to their blended counterpart is likely due to the relative
fineness of the limestone in the sample. The increased fineness in interground samples
accelerates hydration and more effectively acts as a nucleation site for hydration products
(Thomas, Jennings, and Chen 2009). These two factors result in a more refined pore
structure, particularly at early ages, resulting in a decrease in the critical pore diameter. At
later ages, the effect of limestone fineness is diminished as hydration proceeds, and the
critical pore diameter becomes equivalent for all samples except the interground C1157
sample. This discrepancy is likely due to the difference in fineness between the size
matched blended sample and interground sample, where the interground sample is noted
to have an increased fineness as compared to the blended sample. This increased fineness
results in a comparatively more reactive sample, resulting in a more refined pore structure
at both early and later ages.
Studies have noted a strong relationship between the strength and porosity of cementitious
samples, a similar relationship is noted in this study and is presented in Figure 5-10. A
reduction in porosity is seen to result in a corresponding increase in strength. The increased
scatter noted in this figure as opposed to that typically presented in strength-porosity
relationships is likely due to the inclusion of soft limestone in the sample, a majority of
which remains unreacted in the sample even at later ages as noted in Chapter 4. Further, it
is noted that the sample with the lowest porosity, OPC, has lower strength than the
interground blends at both early at later ages, despite the fact that they have a higher
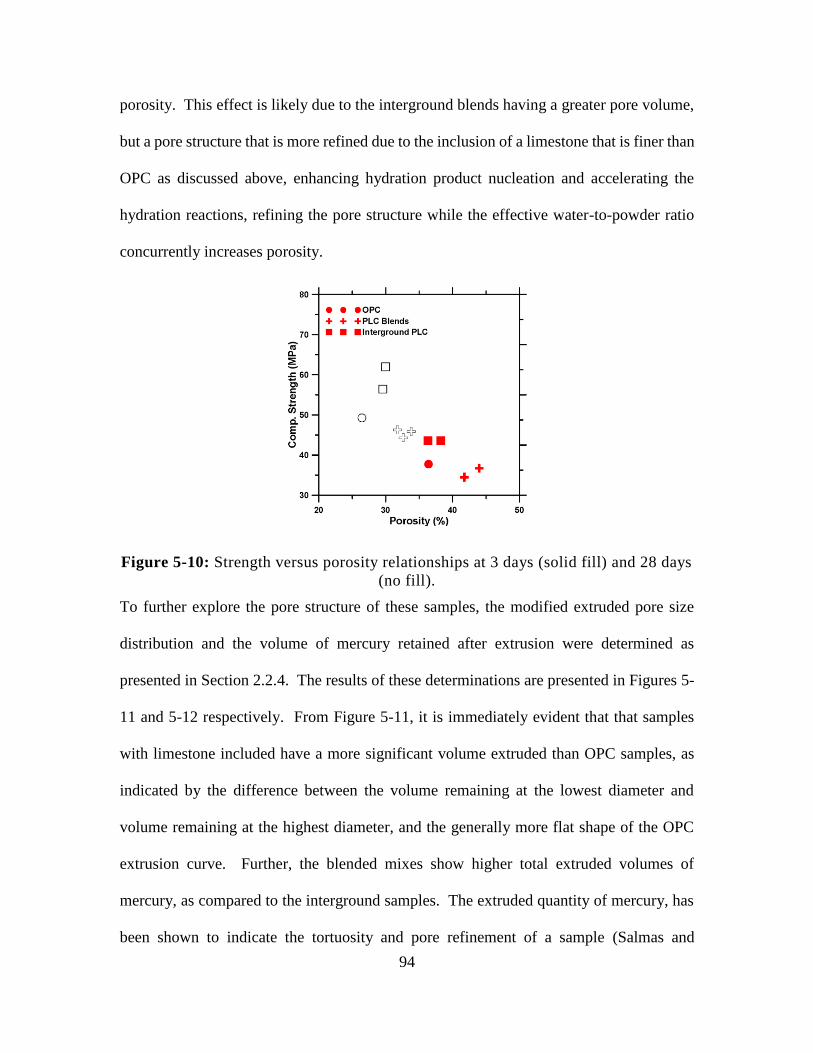
94
porosity. This effect is likely due to the interground blends having a greater pore volume,
but a pore structure that is more refined due to the inclusion of a limestone that is finer than
OPC as discussed above, enhancing hydration product nucleation and accelerating the
hydration reactions, refining the pore structure while the effective water-to-powder ratio
concurrently increases porosity.
Figure 5-10: Strength versus porosity relationships at 3 days (solid fill) and 28 days
(no fill).
To further explore the pore structure of these samples, the modified extruded pore size
distribution and the volume of mercury retained after extrusion were determined as
presented in Section 2.2.4. The results of these determinations are presented in Figures 5-
11 and 5-12 respectively. From Figure 5-11, it is immediately evident that that samples
with limestone included have a more significant volume extruded than OPC samples, as
indicated by the difference between the volume remaining at the lowest diameter and
volume remaining at the highest diameter, and the generally more flat shape of the OPC
extrusion curve. Further, the blended mixes show higher total extruded volumes of
mercury, as compared to the interground samples. The extruded quantity of mercury, has
been shown to indicate the tortuosity and pore refinement of a sample (Salmas and
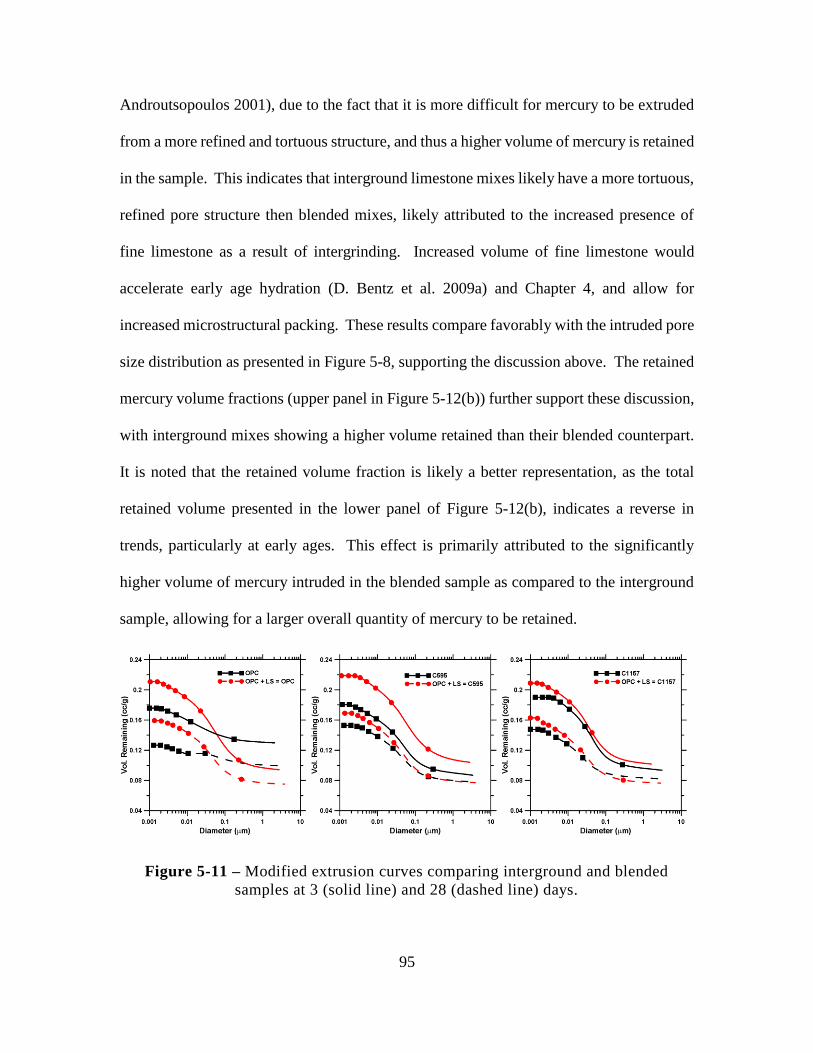
95
Androutsopoulos 2001), due to the fact that it is more difficult for mercury to be extruded
from a more refined and tortuous structure, and thus a higher volume of mercury is retained
in the sample. This indicates that interground limestone mixes likely have a more tortuous,
refined pore structure then blended mixes, likely attributed to the increased presence of
fine limestone as a result of intergrinding. Increased volume of fine limestone would
accelerate early age hydration (D. Bentz et al. 2009a) and Chapter 4, and allow for
increased microstructural packing. These results compare favorably with the intruded pore
size distribution as presented in Figure 5-8, supporting the discussion above. The retained
mercury volume fractions (upper panel in Figure 5-12(b)) further support these discussion,
with interground mixes showing a higher volume retained than their blended counterpart.
It is noted that the retained volume fraction is likely a better representation, as the total
retained volume presented in the lower panel of Figure 5-12(b), indicates a reverse in
trends, particularly at early ages. This effect is primarily attributed to the significantly
higher volume of mercury intruded in the blended sample as compared to the interground
sample, allowing for a larger overall quantity of mercury to be retained.
Figure 5-11 – Modified extrusion curves comparing interground and blended
samples at 3 (solid line) and 28 (dashed line) days.
96
Figure 5-12: Comparison of interground and blended limestone cements, (a)
volume extruded, and (b) volume and percent volume of intruded mercury retained;
at 3 days (dashed fill) and 28 days (solid fill).
5.5 Conclusions
This paper reports on the effects of limestone and combinations of limestone and fly ash
or metakaolin replacement on the pore structure of hardened cement pastes as determined
by mercury intrusion investigations. The influence of limestone fineness in these systems
is explored, in the context of porosity, critical pore diameter, and volume fraction of
intruded mercury retained after the extrusion cycle is completed.
The replacement of portland cement by limestone indicates an increase in porosity
regardless of limestone fineness. This effect is attributed to the increase in effective water-
to-cement ratio resultant from limestone replacement in these mixtures.
With respect to other pore structure parameters, the critical pore diameter and the volume
fraction retained, fine limestone is shown to have a beneficial influence on the pore
structure of these systems, decreasing the critical pore diameter and increasing the volume
retained. These factors indicate a more refined tortuous structure in these systems,
97
attributed to fine limestone particles acting as nucleation sites for hydration products and
more effectively blocking connected paths through the structure.
Ternary blends of fly ash and limestone show increasing porosity with fly ash replacement
or coarse limestone replacement. A synergistic interaction effect between fine limestone
and fly ash is noted, resulting in a decrease in porosity and critical pore diameter and
increase in volume retained as compared to binary fly ash-cement systems.
Ternary blends of fly ash and metakaolin indicate a strong influence of metakaolin, with
the inclusion of metakaolin significantly decreasing the porosity and critical pore diameter
while increasing the volume retained. A beneficial interaction effect is additionally noted
for ternary blends of fine limestone and metakaolin on the pore structure of the pastes
studied.

98
PART II – RHEOLOGY
99
6. THE RHEOLOGICAL PROPERTIES OF TERNARY BINDERS CONTAINING
LIMESTONE AND METAKAOLIN OR FLY ASH
6.1 Introduction
Several studies have shown the beneficial effects of limestone additions on both the fresh
and hardened properties of cementing systems (De Weerdt, Kjellsen, et al. 2011; Tennis,
Thomas, and Weiss 2011; Hawkins, Tennis, and Detwiler 2003; D. Bentz et al. 2009b).
The positive effects on the hardened properties are attributed to a combination of enhancing
hydration through the filler effect, improved particle packing and the formation of
carboaluminate phases (Lothenbach et al. 2008; Oey et al. 2012). However, limestone
powders, based on their particle characteristics and interactions with other solids in the
binder, can influence the fresh (rheological) properties of the paste fraction. Recent studies
have demonstrated strategies to formulate ternary blends containing limestone and an
aluminous cement replacement material such as metakaolin or fly ash without inducing
any reductions in the mechanical properties of these mixtures, as compared to pure OPC
formulations (De Weerdt, Haha, et al. 2011; De Weerdt et al. 2010). Thus, this work builds
on prior efforts to determine if the benefits realized in hardened properties, may also be
applicable to the fresh properties of these mixtures.
Several studies have evaluated the rheological properties of cementitious mixtures
containing a variety of cement replacement materials (Park, Noh, and Park 2005; Ferraris,
Obla, and Hill 2001; D. P. Bentz et al. 2012; D. P Bentz and Ferraris 2010; Hedda Vikan
and Justnes 2007). The rheological parameters (yield stress and plastic viscosity, based on
a Bingham or Herschel-Buckley representation) have been noted to be strongly dependent
on the water-to-powder mass ratio, type/dosage of cement replacement materials used, and
100
the particle size distributions of the solids (Park, Noh, and Park 2005; Ferraris, Obla, and
Hill 2001; D. P Bentz and Ferraris 2010; Hedda Vikan and Justnes 2007; D. P. Bentz et al.
2012).
This paper investigates the rheological properties of ternary blends containing limestone
and metakaolin or fly ash, with special emphasis on quantifying the influence of:
Limestone particle size and dosage, and
Fly ash or metakaolin additions for pastes proportioned at a fixed water-to-solids ratio (by
volume).
Experimental assessments of rheological properties are integrated with computational
packing studies to elucidate the influences of particle number density and water film
thickness. Overall, the results provide a clear understanding of the effects of limestone
replacement in combination with fly ash or metakaolin on the fresh properties, thus
enabling new strategies to proportion binder formulations which show comparable or
superior properties to traditional OPC formulations as indicated in Chapter 4.
6.2 Experimental Program
6.2.1 Materials and Mixtures
The materials used include: a commercially available Type I/II ordinary portland cement
(OPC) conforming to ASTM C150 (“ASTM C109 / C109M - 12 Standard Test Method for
Compressive Strength of Hydraulic Cement Mortars (Using 2-In. or [50-Mm] Cube
Specimens)” 2012), a Class F fly ash and metakaolin conforming to ASTM C618 (“ASTM
C109-13. Standard Test Method for Compressive Strength of Hydraulic Cement Mortars
Using 2-In. Cube Specimens” 2013), and a nominally pure limestone powder (purity >
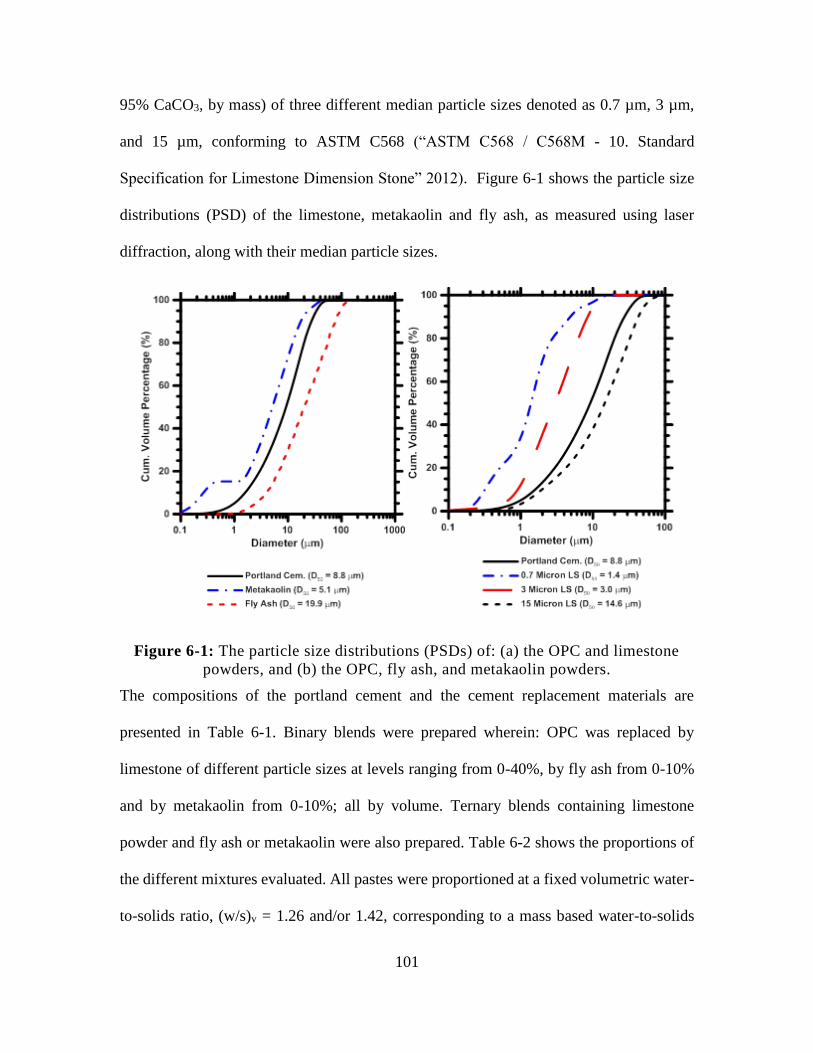
101
95% CaCO3, by mass) of three different median particle sizes denoted as 0.7 µm, 3 µm,
and 15 µm, conforming to ASTM C568 (“ASTM C568 / C568M - 10. Standard
Specification for Limestone Dimension Stone” 2012). Figure 6-1 shows the particle size
distributions (PSD) of the limestone, metakaolin and fly ash, as measured using laser
diffraction, along with their median particle sizes.
Figure 6-1: The particle size distributions (PSDs) of: (a) the OPC and limestone
powders, and (b) the OPC, fly ash, and metakaolin powders.
The compositions of the portland cement and the cement replacement materials are
presented in Table 6-1. Binary blends were prepared wherein: OPC was replaced by
limestone of different particle sizes at levels ranging from 0-40%, by fly ash from 0-10%
and by metakaolin from 0-10%; all by volume. Ternary blends containing limestone
powder and fly ash or metakaolin were also prepared. Table 6-2 shows the proportions of
the different mixtures evaluated. All pastes were proportioned at a fixed volumetric water-
to-solids ratio, (w/s)v = 1.26 and/or 1.42, corresponding to a mass based water-to-solids
(a) (b)
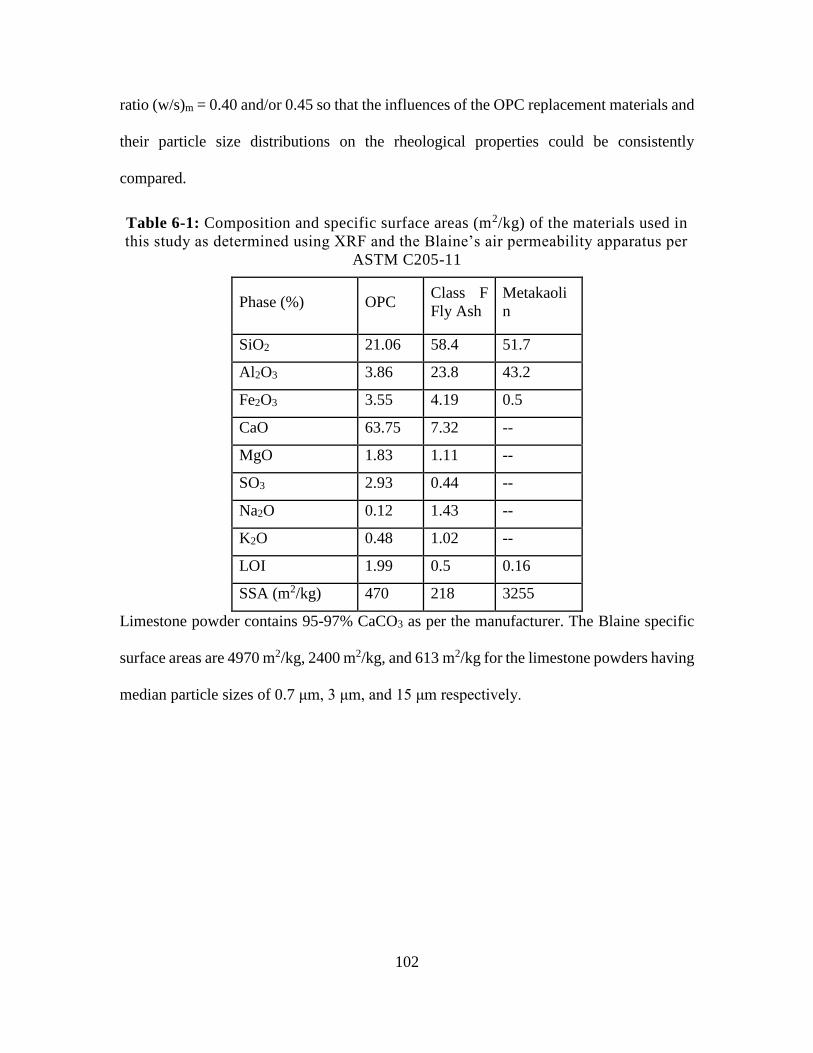
102
ratio (w/s)m = 0.40 and/or 0.45 so that the influences of the OPC replacement materials and
their particle size distributions on the rheological properties could be consistently
compared.
Table 6-1: Composition and specific surface areas (m2/kg) of the materials used in
this study as determined using XRF and the Blaine’s air permeability apparatus per
ASTM C205-11
Phase (%) OPC Class F
Fly Ash
Metakaoli
n
SiO2 21.06 58.4 51.7
Al2O3 3.86 23.8 43.2
Fe2O3 3.55 4.19 0.5
CaO 63.75 7.32 --
MgO 1.83 1.11 --
SO3 2.93 0.44 --
Na2O 0.12 1.43 --
K2O 0.48 1.02 --
LOI 1.99 0.5 0.16
SSA (m2/kg) 470 218 3255
Limestone powder contains 95-97% CaCO3 as per the manufacturer. The Blaine specific
surface areas are 4970 m2/kg, 2400 m2/kg, and 613 m2/kg for the limestone powders having
median particle sizes of 0.7 μm, 3 μm, and 15 μm respectively.
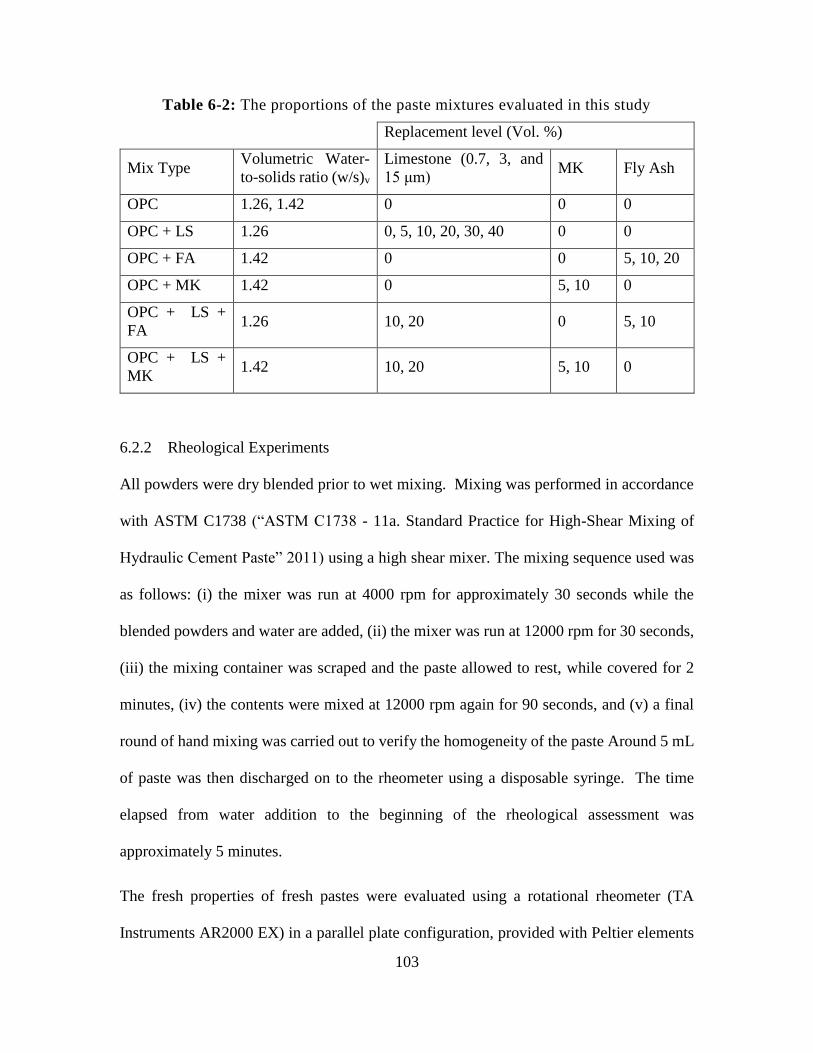
103
Table 6-2: The proportions of the paste mixtures evaluated in this study
Replacement level (Vol. %)
Mix Type Volumetric Water-
to-solids ratio (w/s)v
Limestone (0.7, 3, and
15 μm) MK Fly Ash
OPC 1.26, 1.42 0 0 0
OPC + LS 1.26 0, 5, 10, 20, 30, 40 0 0
OPC + FA 1.42 0 0 5, 10, 20
OPC + MK 1.42 0 5, 10 0
OPC + LS +
FA 1.26 10, 20 0 5, 10
OPC + LS +
MK 1.42 10, 20 5, 10 0
6.2.2 Rheological Experiments
All powders were dry blended prior to wet mixing. Mixing was performed in accordance
with ASTM C1738 (“ASTM C1738 - 11a. Standard Practice for High-Shear Mixing of
Hydraulic Cement Paste” 2011) using a high shear mixer. The mixing sequence used was
as follows: (i) the mixer was run at 4000 rpm for approximately 30 seconds while the
blended powders and water are added, (ii) the mixer was run at 12000 rpm for 30 seconds,
(iii) the mixing container was scraped and the paste allowed to rest, while covered for 2
minutes, (iv) the contents were mixed at 12000 rpm again for 90 seconds, and (v) a final
round of hand mixing was carried out to verify the homogeneity of the paste Around 5 mL
of paste was then discharged on to the rheometer using a disposable syringe. The time
elapsed from water addition to the beginning of the rheological assessment was
approximately 5 minutes.
The fresh properties of fresh pastes were evaluated using a rotational rheometer (TA
Instruments AR2000 EX) in a parallel plate configuration, provided with Peltier elements
104
located within the bottom plate which were conditioned to 25 ± 0.5°C. To reduce slip on
the plates, a serrated upper plate was used while the Peltier plate was covered with 150 grit
adhesive backed, resin coated sandpaper (mean surface roughness of 16.89 µm). The upper
plate used had a diameter of 50 mm, and the gap was set to 2 mm based on a series of trial
mixtures that achieved consistent results over the range of fluidities considered (Ferraris
1999a). The rheological procedure consisted of a ramp up pre-shear phase from 5-to-100/s
lasting around 90 seconds to homogenize the paste, followed by a ramp up from 5-to-100/s,
followed immediately by a ramp down from 100-to-5/s. A step up, or step down shear rate
of 10/s was implemented, as shown in Figure 6-2(a). Shear stress and shear rate data were
extracted using TA Instruments’ TRIOS software package. With the exception of the pre-
shear range, at each step, data is acquired every second, until a steady state is achieved –
as defined by three consecutive torque measurements within 5% of each other, at which
time the experiment advances to the next shear rate. The time at each shear step is typically
5 seconds.
A non-Newtonian relationship between the shear stress and shear rate as shown in Figure
6-2(b) was used to interpret the measurements. As such, the shear stress-shear rate datasets
for the descending (down ramp) curve were fitted using a least squares function
corresponding to the Bingham model as shown in Equation 6-1 (Bingham 1922). The
Bingham model is commonly used for the rheological characterization of cement pastes
(D. P. Bentz et al. 2012; Ferraris, Obla, and Hill 2001; Banfill and others 2003; Ferraris
1999a; Park, Noh, and Park 2005) and a good linear fit (R2 values > 0.95) between the
shear stress and shear rate is obtained for the shear rate range between 10 and 100/s.
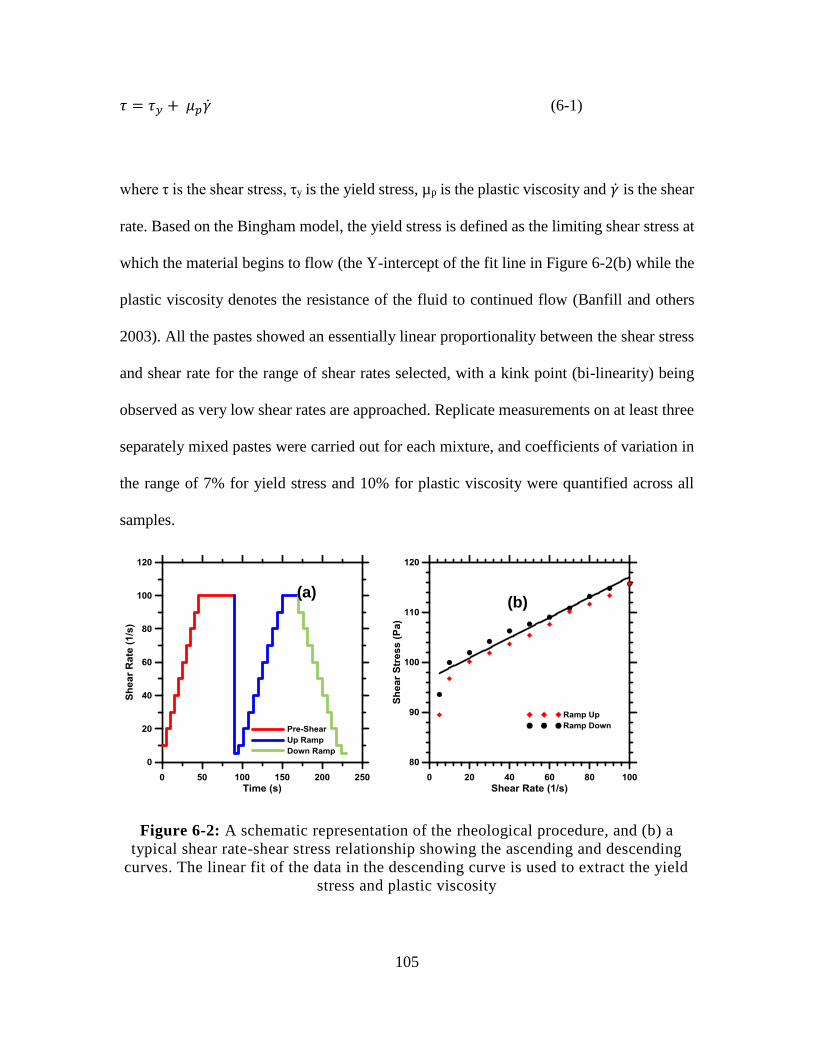
105
𝜏 = 𝜏𝑦 + 𝜇𝑝�̇� (6-1)
where τ is the shear stress, τy is the yield stress, µp is the plastic viscosity and �̇� is the shear
rate. Based on the Bingham model, the yield stress is defined as the limiting shear stress at
which the material begins to flow (the Y-intercept of the fit line in Figure 6-2(b) while the
plastic viscosity denotes the resistance of the fluid to continued flow (Banfill and others
2003). All the pastes showed an essentially linear proportionality between the shear stress
and shear rate for the range of shear rates selected, with a kink point (bi-linearity) being
observed as very low shear rates are approached. Replicate measurements on at least three
separately mixed pastes were carried out for each mixture, and coefficients of variation in
the range of 7% for yield stress and 10% for plastic viscosity were quantified across all
samples.
Figure 6-2: A schematic representation of the rheological procedure, and (b) a
typical shear rate-shear stress relationship showing the ascending and descending
curves. The linear fit of the data in the descending curve is used to extract the yield
stress and plastic viscosity
(b) (a)
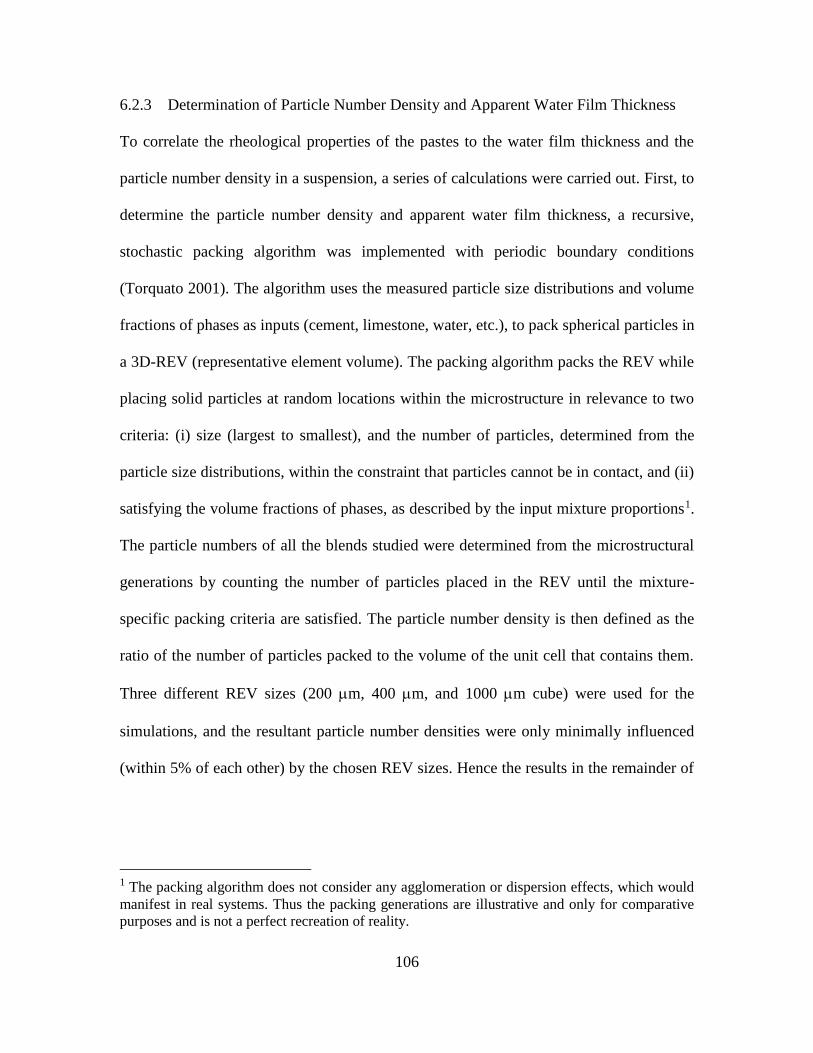
106
6.2.3 Determination of Particle Number Density and Apparent Water Film Thickness
To correlate the rheological properties of the pastes to the water film thickness and the
particle number density in a suspension, a series of calculations were carried out. First, to
determine the particle number density and apparent water film thickness, a recursive,
stochastic packing algorithm was implemented with periodic boundary conditions
(Torquato 2001). The algorithm uses the measured particle size distributions and volume
fractions of phases as inputs (cement, limestone, water, etc.), to pack spherical particles in
a 3D-REV (representative element volume). The packing algorithm packs the REV while
placing solid particles at random locations within the microstructure in relevance to two
criteria: (i) size (largest to smallest), and the number of particles, determined from the
particle size distributions, within the constraint that particles cannot be in contact, and (ii)
satisfying the volume fractions of phases, as described by the input mixture proportions1.
The particle numbers of all the blends studied were determined from the microstructural
generations by counting the number of particles placed in the REV until the mixture-
specific packing criteria are satisfied. The particle number density is then defined as the
ratio of the number of particles packed to the volume of the unit cell that contains them.
Three different REV sizes (200 m, 400 m, and 1000 m cube) were used for the
simulations, and the resultant particle number densities were only minimally influenced
(within 5% of each other) by the chosen REV sizes. Hence the results in the remainder of
1 The packing algorithm does not consider any agglomeration or dispersion effects, which would
manifest in real systems. Thus the packing generations are illustrative and only for comparative
purposes and is not a perfect recreation of reality.
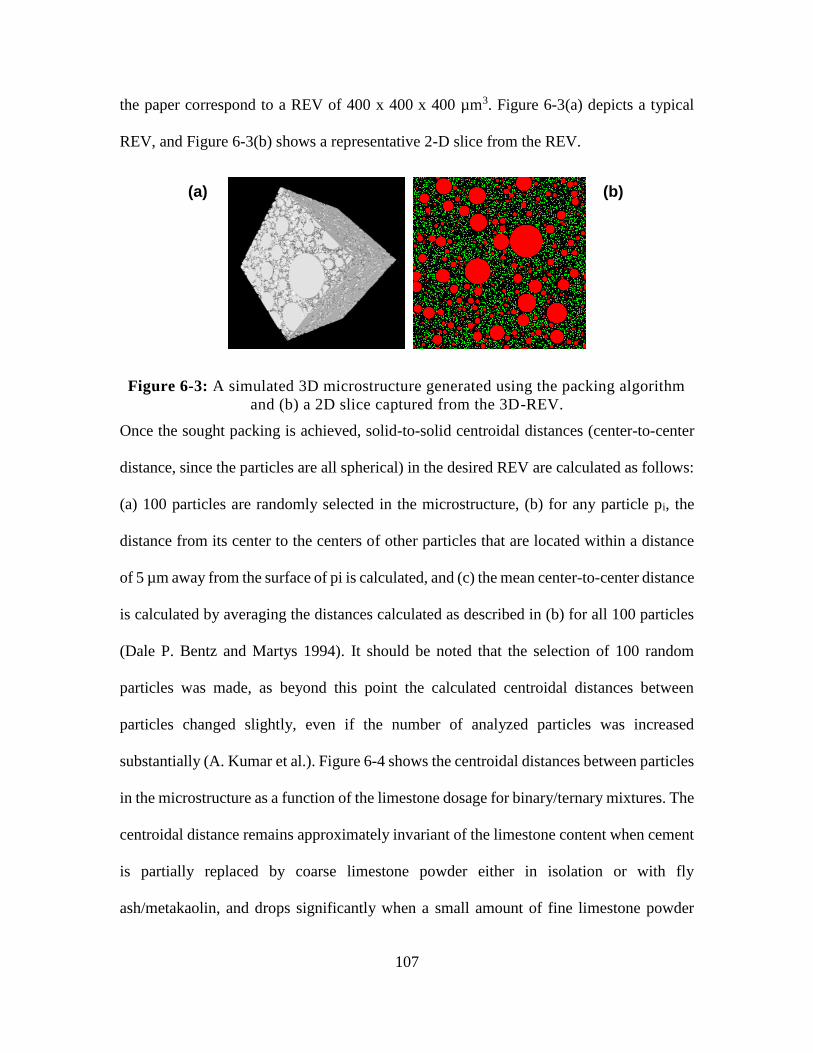
107
the paper correspond to a REV of 400 x 400 x 400 µm3. Figure 6-3(a) depicts a typical
REV, and Figure 6-3(b) shows a representative 2-D slice from the REV.
Figure 6-3: A simulated 3D microstructure generated using the packing algorithm
and (b) a 2D slice captured from the 3D-REV.
Once the sought packing is achieved, solid-to-solid centroidal distances (center-to-center
distance, since the particles are all spherical) in the desired REV are calculated as follows:
(a) 100 particles are randomly selected in the microstructure, (b) for any particle pi, the
distance from its center to the centers of other particles that are located within a distance
of 5 µm away from the surface of pi is calculated, and (c) the mean center-to-center distance
is calculated by averaging the distances calculated as described in (b) for all 100 particles
(Dale P. Bentz and Martys 1994). It should be noted that the selection of 100 random
particles was made, as beyond this point the calculated centroidal distances between
particles changed slightly, even if the number of analyzed particles was increased
substantially (A. Kumar et al.). Figure 6-4 shows the centroidal distances between particles
in the microstructure as a function of the limestone dosage for binary/ternary mixtures. The
centroidal distance remains approximately invariant of the limestone content when cement
is partially replaced by coarse limestone powder either in isolation or with fly
ash/metakaolin, and drops significantly when a small amount of fine limestone powder
(a) (b)
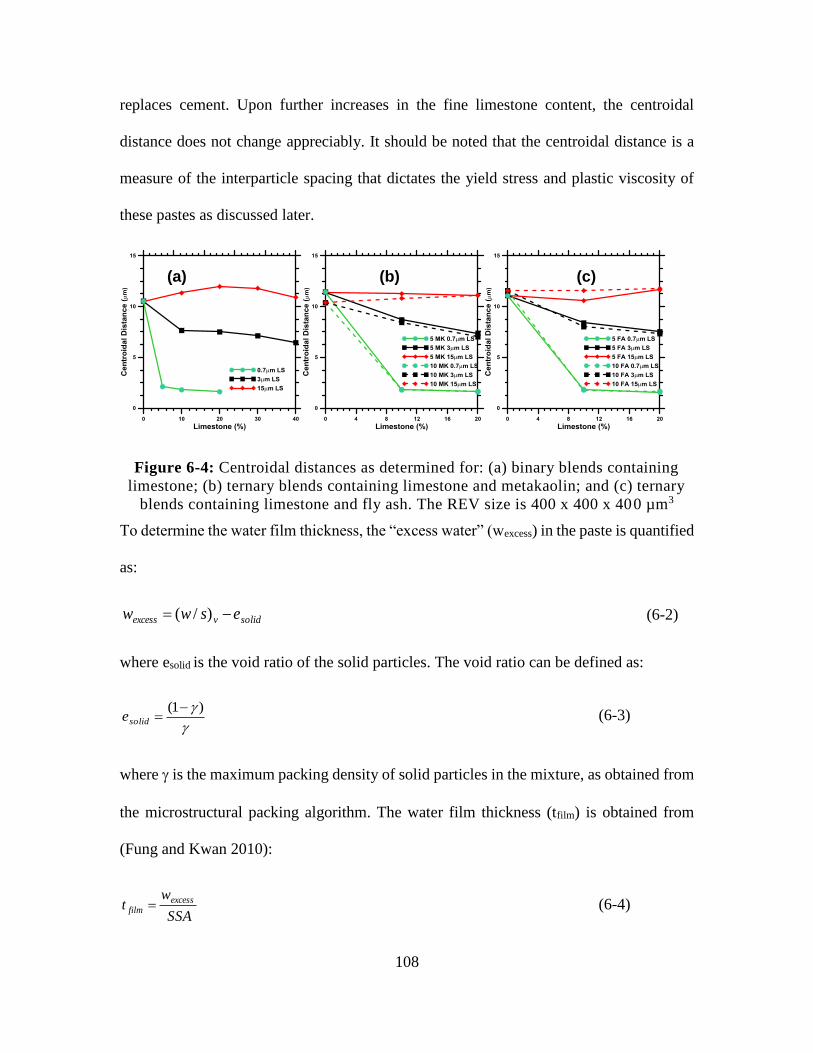
108
replaces cement. Upon further increases in the fine limestone content, the centroidal
distance does not change appreciably. It should be noted that the centroidal distance is a
measure of the interparticle spacing that dictates the yield stress and plastic viscosity of
these pastes as discussed later.
Figure 6-4: Centroidal distances as determined for: (a) binary blends containing
limestone; (b) ternary blends containing limestone and metakaolin; and (c) ternary
blends containing limestone and fly ash. The REV size is 400 x 400 x 400 µm3
To determine the water film thickness, the “excess water” (wexcess) in the paste is quantified
as:
solidvexcess esww )/( (6-2)
where esolid is the void ratio of the solid particles. The void ratio can be defined as:
)1( solide (6-3)
where is the maximum packing density of solid particles in the mixture, as obtained from
the microstructural packing algorithm. The water film thickness (tfilm) is obtained from
(Fung and Kwan 2010):
SSA
wt excess
film (6-4)
(a) (b) (c)
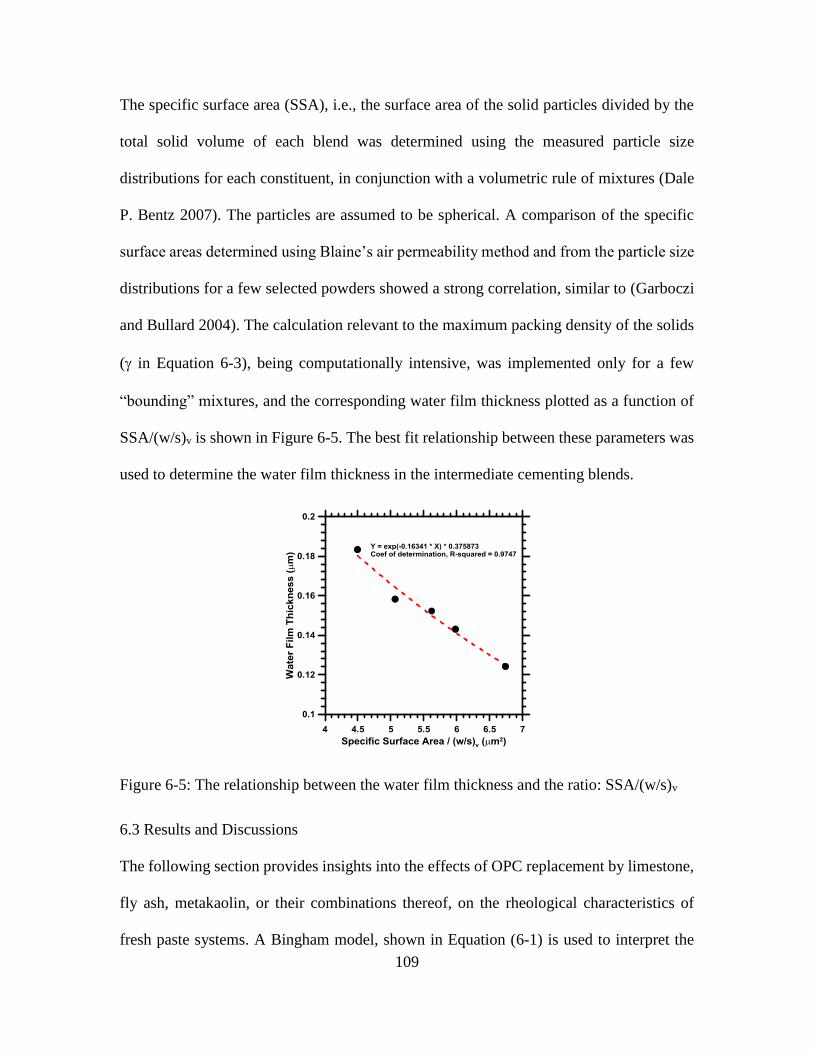
109
The specific surface area (SSA), i.e., the surface area of the solid particles divided by the
total solid volume of each blend was determined using the measured particle size
distributions for each constituent, in conjunction with a volumetric rule of mixtures (Dale
P. Bentz 2007). The particles are assumed to be spherical. A comparison of the specific
surface areas determined using Blaine’s air permeability method and from the particle size
distributions for a few selected powders showed a strong correlation, similar to (Garboczi
and Bullard 2004). The calculation relevant to the maximum packing density of the solids
( in Equation 6-3), being computationally intensive, was implemented only for a few
“bounding” mixtures, and the corresponding water film thickness plotted as a function of
SSA/(w/s)v is shown in Figure 6-5. The best fit relationship between these parameters was
used to determine the water film thickness in the intermediate cementing blends.
Figure 6-5: The relationship between the water film thickness and the ratio: SSA/(w/s)v
6.3 Results and Discussions
The following section provides insights into the effects of OPC replacement by limestone,
fly ash, metakaolin, or their combinations thereof, on the rheological characteristics of
fresh paste systems. A Bingham model, shown in Equation (6-1) is used to interpret the
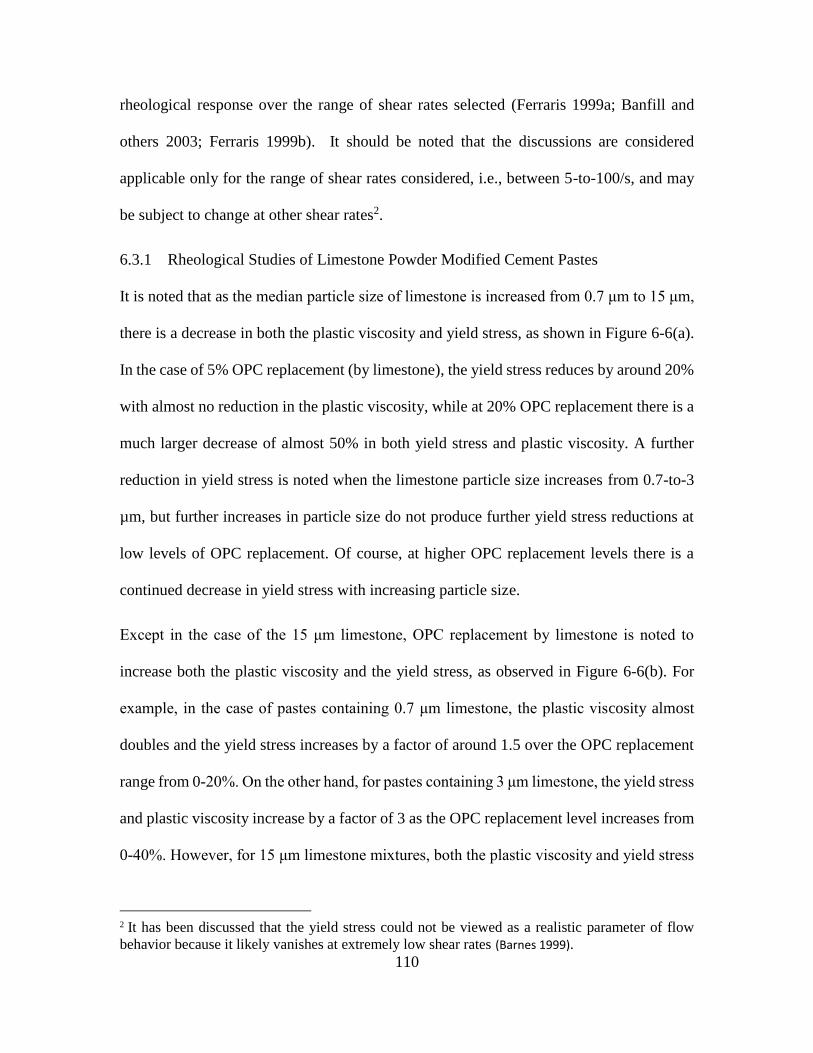
110
rheological response over the range of shear rates selected (Ferraris 1999a; Banfill and
others 2003; Ferraris 1999b). It should be noted that the discussions are considered
applicable only for the range of shear rates considered, i.e., between 5-to-100/s, and may
be subject to change at other shear rates2.
6.3.1 Rheological Studies of Limestone Powder Modified Cement Pastes
It is noted that as the median particle size of limestone is increased from 0.7 μm to 15 μm,
there is a decrease in both the plastic viscosity and yield stress, as shown in Figure 6-6(a).
In the case of 5% OPC replacement (by limestone), the yield stress reduces by around 20%
with almost no reduction in the plastic viscosity, while at 20% OPC replacement there is a
much larger decrease of almost 50% in both yield stress and plastic viscosity. A further
reduction in yield stress is noted when the limestone particle size increases from 0.7-to-3
µm, but further increases in particle size do not produce further yield stress reductions at
low levels of OPC replacement. Of course, at higher OPC replacement levels there is a
continued decrease in yield stress with increasing particle size.
Except in the case of the 15 μm limestone, OPC replacement by limestone is noted to
increase both the plastic viscosity and the yield stress, as observed in Figure 6-6(b). For
example, in the case of pastes containing 0.7 μm limestone, the plastic viscosity almost
doubles and the yield stress increases by a factor of around 1.5 over the OPC replacement
range from 0-20%. On the other hand, for pastes containing 3 μm limestone, the yield stress
and plastic viscosity increase by a factor of 3 as the OPC replacement level increases from
0-40%. However, for 15 μm limestone mixtures, both the plastic viscosity and yield stress
2 It has been discussed that the yield stress could not be viewed as a realistic parameter of flow
behavior because it likely vanishes at extremely low shear rates (Barnes 1999).
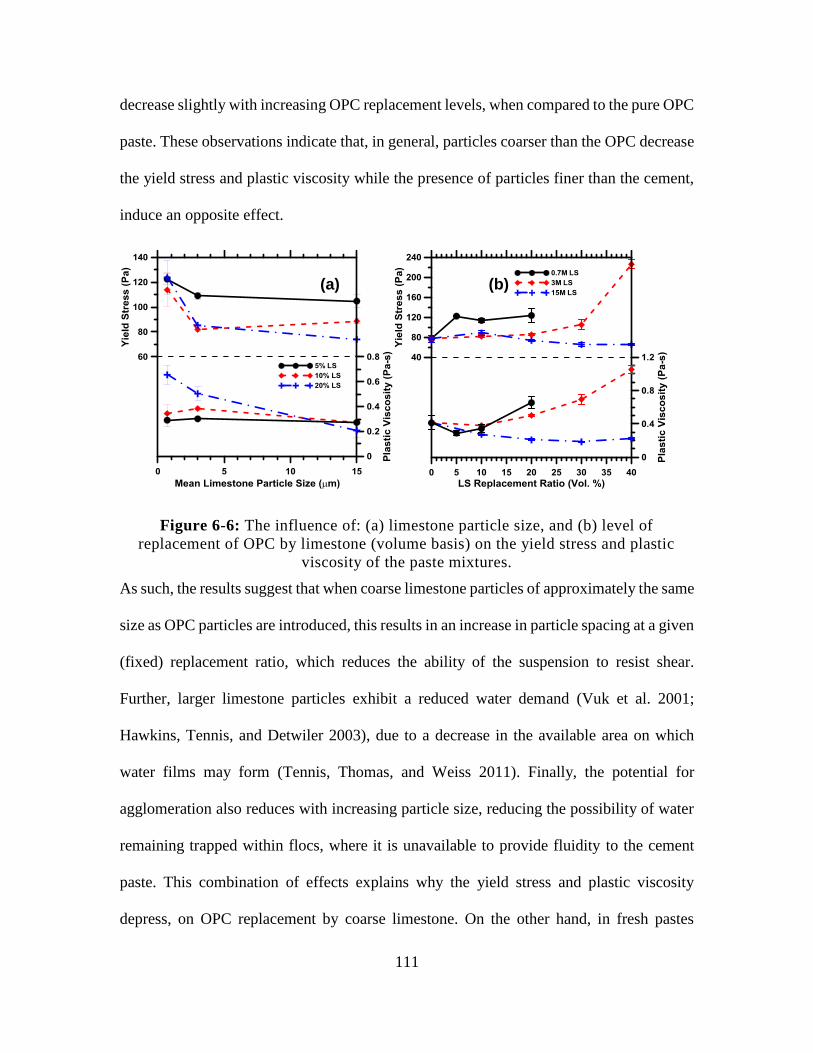
111
decrease slightly with increasing OPC replacement levels, when compared to the pure OPC
paste. These observations indicate that, in general, particles coarser than the OPC decrease
the yield stress and plastic viscosity while the presence of particles finer than the cement,
induce an opposite effect.
Figure 6-6: The influence of: (a) limestone particle size, and (b) level of
replacement of OPC by limestone (volume basis) on the yield stress and plastic
viscosity of the paste mixtures.
As such, the results suggest that when coarse limestone particles of approximately the same
size as OPC particles are introduced, this results in an increase in particle spacing at a given
(fixed) replacement ratio, which reduces the ability of the suspension to resist shear.
Further, larger limestone particles exhibit a reduced water demand (Vuk et al. 2001;
Hawkins, Tennis, and Detwiler 2003), due to a decrease in the available area on which
water films may form (Tennis, Thomas, and Weiss 2011). Finally, the potential for
agglomeration also reduces with increasing particle size, reducing the possibility of water
remaining trapped within flocs, where it is unavailable to provide fluidity to the cement
paste. This combination of effects explains why the yield stress and plastic viscosity
depress, on OPC replacement by coarse limestone. On the other hand, in fresh pastes
(a) (b)
112
containing fine limestone powders (0.7 and 3 µm), increasing OPC replacement by
limestone produces the opposite effect. The addition of fine limestone powders results in
an increased packing density of the paste, which decreases the interparticle spacing (Figure
6-4a) and increases the resistance of the suspension to applied shear. Moreover, in binary
pastes containing 0.7 µm limestone, agglomeration and water film formation as expected
to be substantial, and would decrease the amount of free water available in the paste (Sakai
et al. 2009). This decrease in the free water content depresses fluidity as indicated by
elevated plastic viscosities. It should be noted however, even in the case of well dispersed
pastes (e.g., those containing a plasticizer), since fine limestone additions do in any event
reduce interparticle spacing, mixtures containing such powders as OPC replacement
materials are expected to consistently demonstrate higher yield stresses as compared to
traditional pastes. However, the case of plastic viscosity in a well-dispersed case is not
trivial because of competing effects. As such, while increasing the fine limestone content
at a given (w/s)v will increase the specific surface area, the amount of excess water will
also increase (since the void ratio of the solid particles is reduced). The water film
thickness, and consequently the plastic viscosity could thus increase or decrease depending
on whichever effect is dominant, and is likely a mixture specific effect.
6.3.2 Influence of Fly Ash and Metakaolin on the Rheological Properties of Pastes
The incorporation of aluminous materials such as fly ash or metakaolin has been found to
beneficially influence the properties of limestone containing systems (De Weerdt, Haha, et
al. 2011; De Weerdt, Kjellsen, et al. 2011; De Weerdt et al. 2010). Thus, before the
rheological characteristics of the ternary systems are discussed, it is instructive to
summarize the rheology of pastes containing fly ash or metakaolin.
113
Figure 6-7 presents the yield stress and plastic viscosity as a function of the fly ash or
metakaolin content for the pastes evaluated in this study. For the fly ash modified pastes,
while the yield stress and plastic viscosity are generally noted to decrease with increasing
fly ash content, the opposite trend is noted in the case of metakaolin modified mixtures.
These observations are in agreement with effects produced by fly ash and metakaolin on
the workability of cementitious mixtures (Nehdi and Rahman 2004a; Moulin, Blanc, and
Sorrentino 2001). First, the reduction in yield stress and plastic viscosity that is noted when
fly ash replaces a part of the cement can be attributed to the spherical shape of fly ash
particles (Kutchko and Kim 2006) and their consequent ability to impart fluidity to the
paste . This effect is magnified due to the particle size distribution of the fly ash used,
which being slightly coarser than the cement used, elevates the physical separation between
neighboring particles, akin to the behavior of the paste with coarse limestone, which
reduces the yield stress and plastic viscosity. The aberration in the trend of plastic viscosity
at low replacement levels of fly ash is presumed to be a result of better particle packing
facilitated by spherical ash particles (that increases the plastic viscosity), thus overcoming
the effects of particle spacing and decreased surface friction. However, expected trends in
the rheological parameters are restored at higher fly ash replacement levels.
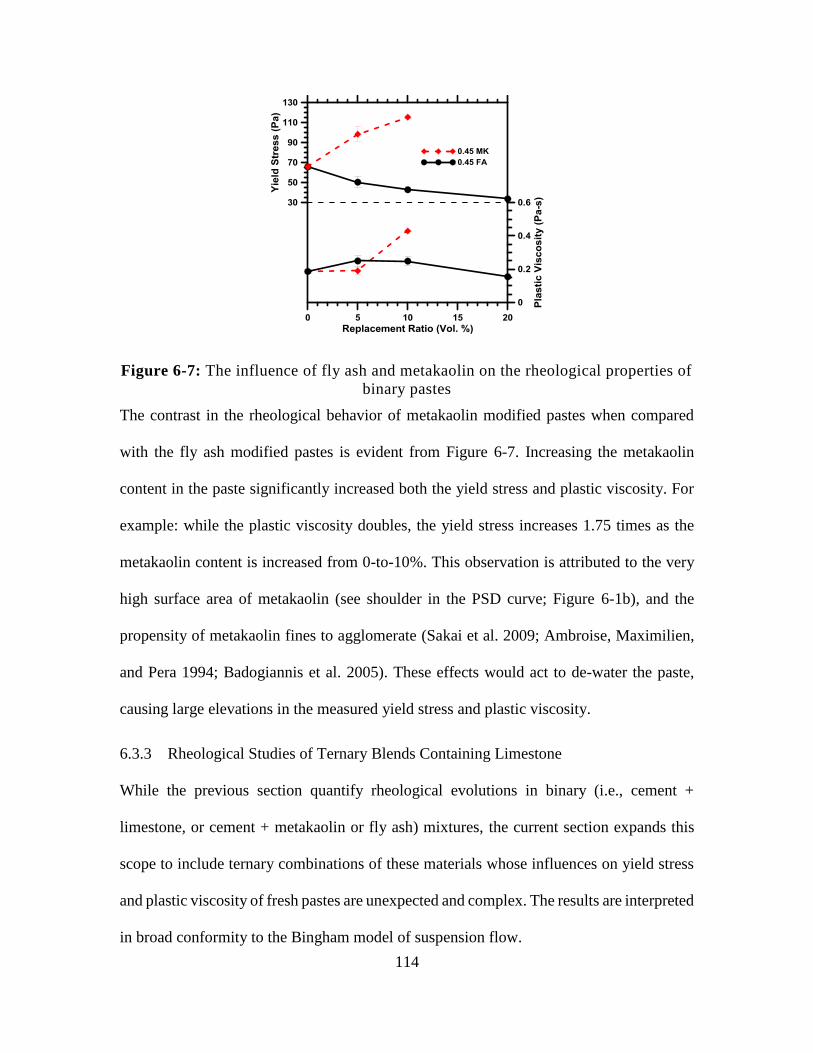
114
Figure 6-7: The influence of fly ash and metakaolin on the rheological properties of
binary pastes
The contrast in the rheological behavior of metakaolin modified pastes when compared
with the fly ash modified pastes is evident from Figure 6-7. Increasing the metakaolin
content in the paste significantly increased both the yield stress and plastic viscosity. For
example: while the plastic viscosity doubles, the yield stress increases 1.75 times as the
metakaolin content is increased from 0-to-10%. This observation is attributed to the very
high surface area of metakaolin (see shoulder in the PSD curve; Figure 6-1b), and the
propensity of metakaolin fines to agglomerate (Sakai et al. 2009; Ambroise, Maximilien,
and Pera 1994; Badogiannis et al. 2005). These effects would act to de-water the paste,
causing large elevations in the measured yield stress and plastic viscosity.
6.3.3 Rheological Studies of Ternary Blends Containing Limestone
While the previous section quantify rheological evolutions in binary (i.e., cement +
limestone, or cement + metakaolin or fly ash) mixtures, the current section expands this
scope to include ternary combinations of these materials whose influences on yield stress
and plastic viscosity of fresh pastes are unexpected and complex. The results are interpreted
in broad conformity to the Bingham model of suspension flow.
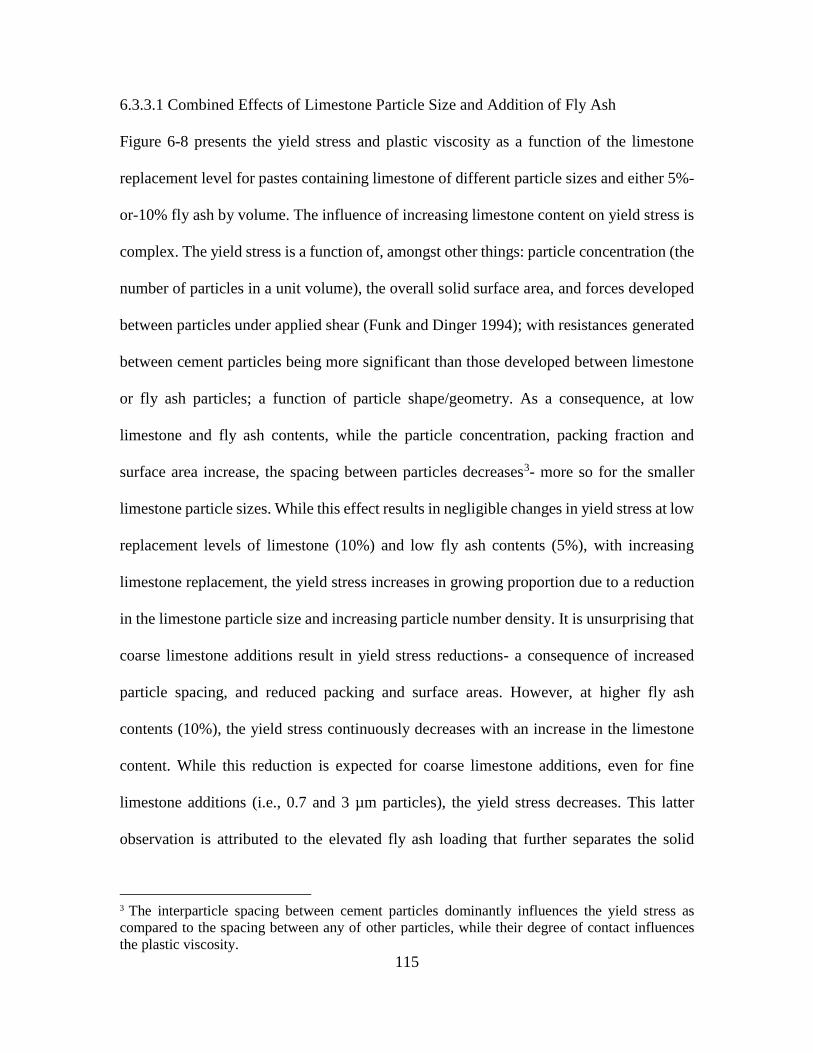
115
6.3.3.1 Combined Effects of Limestone Particle Size and Addition of Fly Ash
Figure 6-8 presents the yield stress and plastic viscosity as a function of the limestone
replacement level for pastes containing limestone of different particle sizes and either 5%-
or-10% fly ash by volume. The influence of increasing limestone content on yield stress is
complex. The yield stress is a function of, amongst other things: particle concentration (the
number of particles in a unit volume), the overall solid surface area, and forces developed
between particles under applied shear (Funk and Dinger 1994); with resistances generated
between cement particles being more significant than those developed between limestone
or fly ash particles; a function of particle shape/geometry. As a consequence, at low
limestone and fly ash contents, while the particle concentration, packing fraction and
surface area increase, the spacing between particles decreases3- more so for the smaller
limestone particle sizes. While this effect results in negligible changes in yield stress at low
replacement levels of limestone (10%) and low fly ash contents (5%), with increasing
limestone replacement, the yield stress increases in growing proportion due to a reduction
in the limestone particle size and increasing particle number density. It is unsurprising that
coarse limestone additions result in yield stress reductions- a consequence of increased
particle spacing, and reduced packing and surface areas. However, at higher fly ash
contents (10%), the yield stress continuously decreases with an increase in the limestone
content. While this reduction is expected for coarse limestone additions, even for fine
limestone additions (i.e., 0.7 and 3 µm particles), the yield stress decreases. This latter
observation is attributed to the elevated fly ash loading that further separates the solid
3 The interparticle spacing between cement particles dominantly influences the yield stress as
compared to the spacing between any of other particles, while their degree of contact influences
the plastic viscosity.
116
grains and thus more than compensates for the increased particle concentration and specific
surface area that is produced on fine particle additions.
Figure 6-8: Influence of limestone dosage on measured rheological properties in
limestone
Next, increasing limestone addition in fly ash blended pastes is noted to increase the plastic
viscosity when fine limestone is used, and hold the plastic viscosity relatively unchanged
when coarse limestone is used, as observed in the lower panels of Figure 6-8. This is in
line with prior observations of plastic viscosity in binary (OPC + limestone) pastes shown
in Figure 6-6(b) where coarse limestone additions are shown to render the plastic viscosity
of the paste unchanged--- a function of negligible changes in the packing density and
interparticle spacing (i.e., centroidal distances, Fig. 6-4a) - a point which is confirmed from
the microstructural generations. Obviously then, fine limestone, by increasing the overall
packing density and reducing particle spacing, increases the number of interparticle
contacts and elevates the plastic viscosity. These effects are noted to be less significant
with increasing fly ash contents as the spherical nature of fly ash particles likely
compensates against other “viscosity enhancing” effects. For example: it has been
rigorously demonstrated that particle shape dramatically influences the plastic viscosity of
(a) (b)
117
suspensions (much more so than yield stress), with a unit volume of spherical particle
additions reducing the plastic viscosity of the system by a much greater extent than an
equal volume of cuboidal particle additions (Erdoğan et al. 2008).
6.3.3.2 Combined effects of limestone particle size and addition of metakaolin
Figure 6-9 presents the combined influence of metakaolin and limestone of different
particle sizes on the yield stress and plastic viscosity of pastes. In general, for a fixed
metakaolin content, an increasing limestone content decreases the yield stress and increases
the plastic viscosity. Also, while fine limestone additions shows the most significant
increase in plastic viscosity, coarse limestone additions shows the most significant decrease
in the measured yield stress.
In ternary blends containing metakaolin, the yield stress is noted to decrease with an
increase in the limestone content (OPC replacement) as shown in Figure 6-9. Previously,
it has been shown that metakaolin additions (in isolation, Figure 6-7) and fine limestone
additions (in isolation, Figure 6-6) act to elevate the yield stress, with yield stress
reductions being noted only in the case of coarse limestone containing binary pastes. Hence
the observation herein, of reducing yield stress with increasing limestone content in
metakaolin modified pastes, requires more careful evaluation. While yield stress reductions
in the case of coarse limestone additions can be easily explained as a consequence of
enhanced particle spacing (as confirmed by the microstructural generations), in the case of
fine limestone additions, it is expected that two competing effects operate. First, while fine
limestone additions act to increase the packing density and hence yield stress, this action
is offset by the second effect, i.e., electrostatic effects produced between the negatively
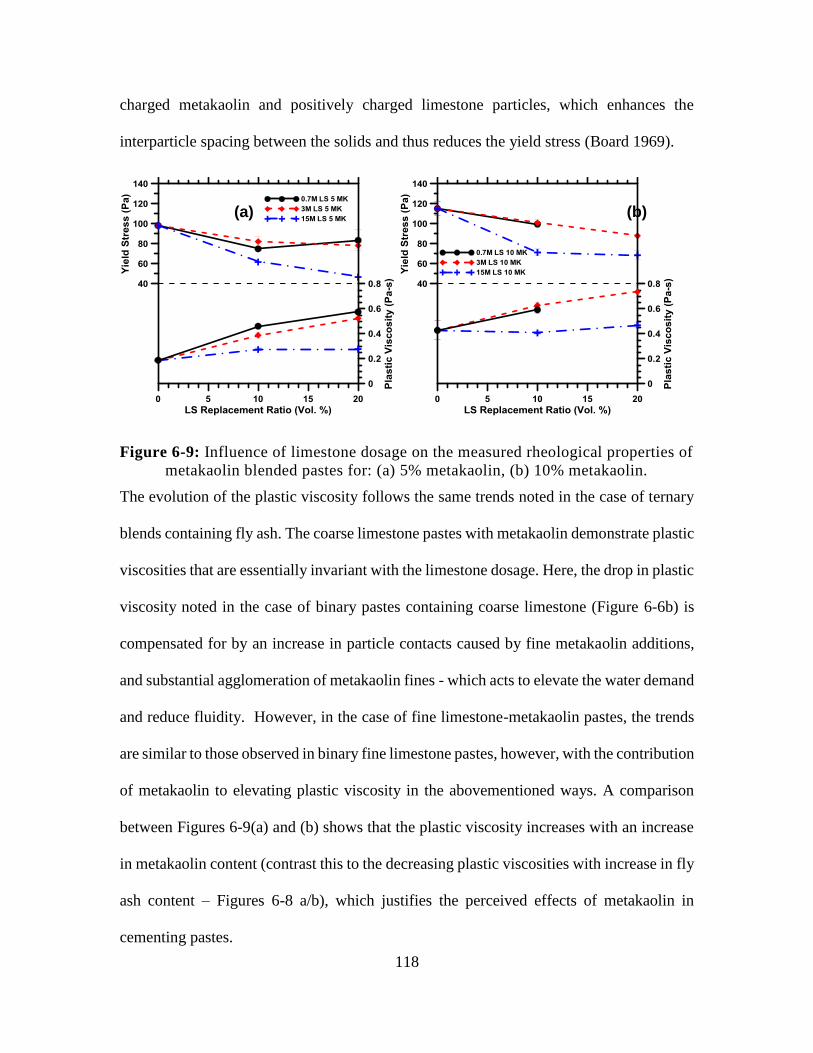
118
charged metakaolin and positively charged limestone particles, which enhances the
interparticle spacing between the solids and thus reduces the yield stress (Board 1969).
Figure 6-9: Influence of limestone dosage on the measured rheological properties of
metakaolin blended pastes for: (a) 5% metakaolin, (b) 10% metakaolin.
The evolution of the plastic viscosity follows the same trends noted in the case of ternary
blends containing fly ash. The coarse limestone pastes with metakaolin demonstrate plastic
viscosities that are essentially invariant with the limestone dosage. Here, the drop in plastic
viscosity noted in the case of binary pastes containing coarse limestone (Figure 6-6b) is
compensated for by an increase in particle contacts caused by fine metakaolin additions,
and substantial agglomeration of metakaolin fines - which acts to elevate the water demand
and reduce fluidity. However, in the case of fine limestone-metakaolin pastes, the trends
are similar to those observed in binary fine limestone pastes, however, with the contribution
of metakaolin to elevating plastic viscosity in the abovementioned ways. A comparison
between Figures 6-9(a) and (b) shows that the plastic viscosity increases with an increase
in metakaolin content (contrast this to the decreasing plastic viscosities with increase in fly
ash content – Figures 6-8 a/b), which justifies the perceived effects of metakaolin in
cementing pastes.
(a) (b)
119
6.3.4 Representing the Rheological Properties as Functions of the Mixture Parameters:
Observations from Experiments and Microstructural Generations
The rheological response of particle suspensions in fluids such as cement pastes are
influenced significantly by the particle size ranges and their distribution, volume fraction
of particles and their interactions (Flatt and Bowen 2006; Buscall et al. 1987; Farris 1968;
Chong, Christiansen, and Baer 2003; Olhero and Ferreira 2004; Lee et al. 2003; Zhou et
al. 1999; D. P. Bentz et al. 2012). This section harmonizes the influence of particle number
density, specific surface area of the solids (consisting of OPC, limestone, and fly
ash/metakaolin), and the water film thickness on the yield stress and plastic viscosity of all
mixtures studied. To facilitate an understanding of the influence of the particle number
density (related to the volume fraction of particles in the suspension) and water film
thickness, simulated microstructures consisting of spherical particles packed according to
their PSDs and the specified mixture inputs, were used. It is anticipated that a better
understanding of the combined influence of (w/s)v that influences the water film thickness,
and the particle characteristics (number density and specific surface area) on the
rheological characteristics will thus facilitate strategies to proportion binary and ternary
blends that have beneficial fresh properties.
Figure 6-10 presents the relationship between the particle number density and the
rheological parameters for several mixtures studied. Both the yield stress and plastic
viscosity are correlated with the particle number density, though yield stress is in fact better
correlated (D. P. Bentz et al. 2012). An increase in the particle number density corresponds
to an increase in the packing fraction and a decrease in interparticle spacing; thus this
representation clearly illustrates that the packing density of the suspension (i.e., a
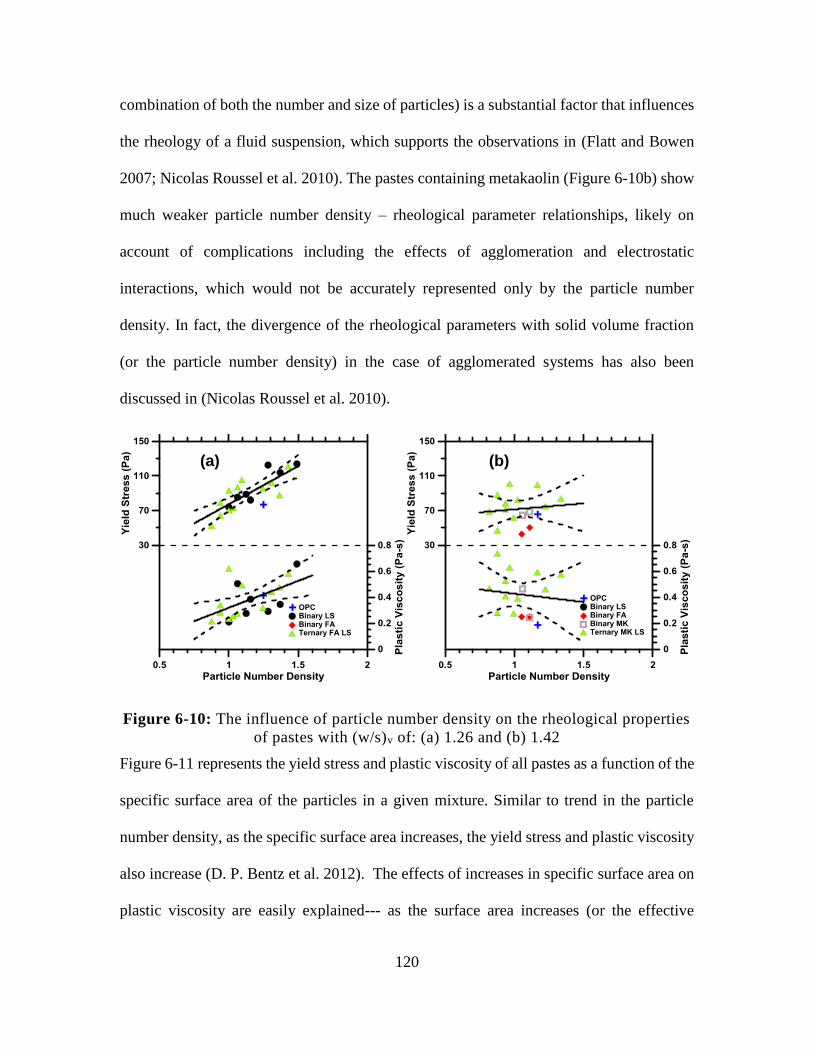
120
combination of both the number and size of particles) is a substantial factor that influences
the rheology of a fluid suspension, which supports the observations in (Flatt and Bowen
2007; Nicolas Roussel et al. 2010). The pastes containing metakaolin (Figure 6-10b) show
much weaker particle number density – rheological parameter relationships, likely on
account of complications including the effects of agglomeration and electrostatic
interactions, which would not be accurately represented only by the particle number
density. In fact, the divergence of the rheological parameters with solid volume fraction
(or the particle number density) in the case of agglomerated systems has also been
discussed in (Nicolas Roussel et al. 2010).
Figure 6-10: The influence of particle number density on the rheological properties
of pastes with (w/s)v of: (a) 1.26 and (b) 1.42
Figure 6-11 represents the yield stress and plastic viscosity of all pastes as a function of the
specific surface area of the particles in a given mixture. Similar to trend in the particle
number density, as the specific surface area increases, the yield stress and plastic viscosity
also increase (D. P. Bentz et al. 2012). The effects of increases in specific surface area on
plastic viscosity are easily explained--- as the surface area increases (or the effective
(a) (b)
121
particle size decreases), and interparticle spacing decreases, there is an increase in the
number of interparticle contacts and interparticle friction, and thus plastic viscosity. Next,
the trend in yield stress can be explained in terms of the two major effects that control yield
stress: (1) packing density and (2) interparticle interactions. An increase in the specific
surface area implies an increase in the packing density, decrease in interparticle spacing
and increased interparticle interactions, which results in elevations in the yield stress. A
yield stress model for suspensions reported in (Flatt and Bowen 2007; Flatt and Bowen
2006) predicts an inverse relationship between yield stress and particle size for suspensions
(which equates to a direct relationship between yield stress and specific surface area as
shown in Figure 6-11). The increased scatter seen at lower (w/s)v (upper panel of Figure 6-
11a) is likely caused due to increased agglomeration at low (w/s)v, which would have a
significant influence on the free water availability, packing density, and interparticle
spacing in these pastes. The specific surface areas shown here were obtained using the
spherical particle assumption described in Section 6.2.3; however the use of Blaine’s
surface area also provided similar trends.
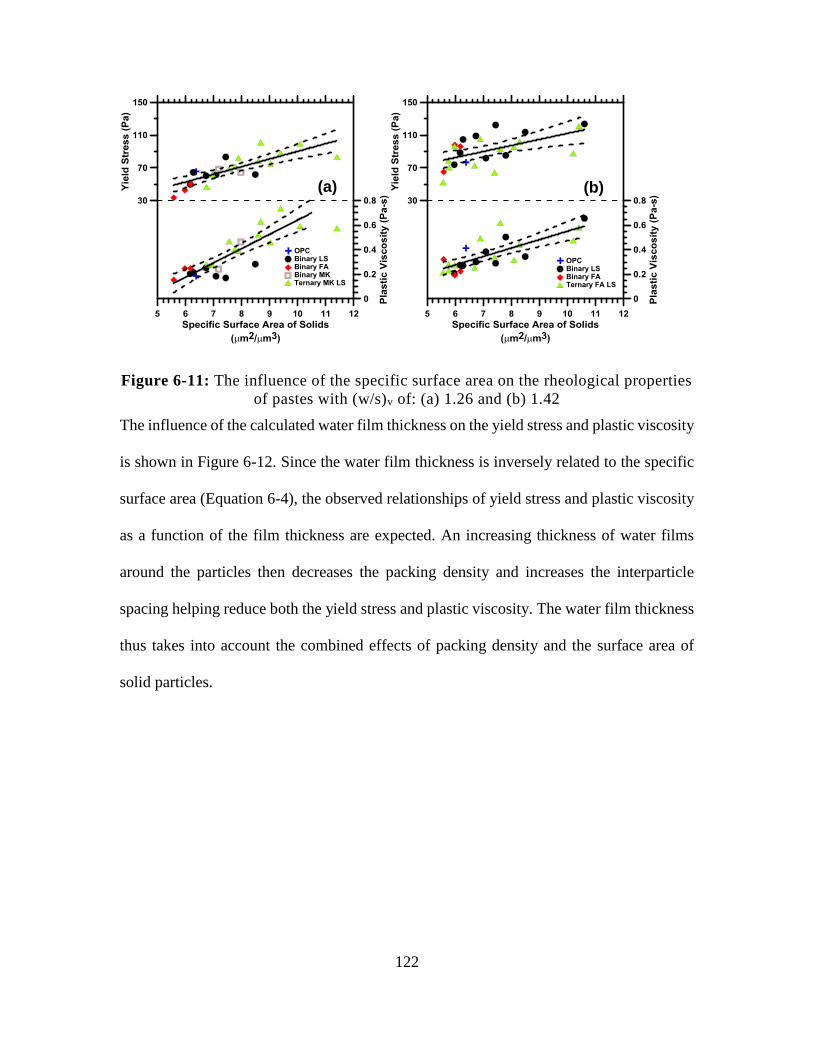
122
Figure 6-11: The influence of the specific surface area on the rheological properties
of pastes with (w/s)v of: (a) 1.26 and (b) 1.42
The influence of the calculated water film thickness on the yield stress and plastic viscosity
is shown in Figure 6-12. Since the water film thickness is inversely related to the specific
surface area (Equation 6-4), the observed relationships of yield stress and plastic viscosity
as a function of the film thickness are expected. An increasing thickness of water films
around the particles then decreases the packing density and increases the interparticle
spacing helping reduce both the yield stress and plastic viscosity. The water film thickness
thus takes into account the combined effects of packing density and the surface area of
solid particles.
(a)
(b) (a)
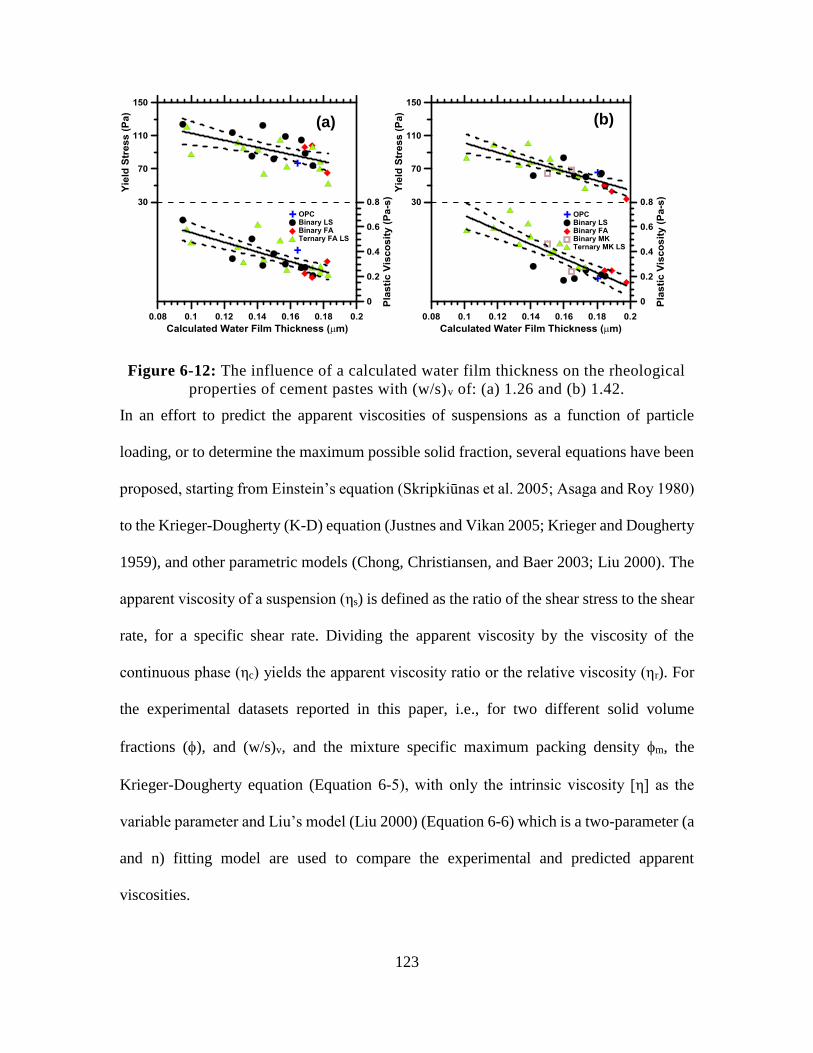
123
Figure 6-12: The influence of a calculated water film thickness on the rheological
properties of cement pastes with (w/s)v of: (a) 1.26 and (b) 1.42.
In an effort to predict the apparent viscosities of suspensions as a function of particle
loading, or to determine the maximum possible solid fraction, several equations have been
proposed, starting from Einstein’s equation (Skripkiūnas et al. 2005; Asaga and Roy 1980)
to the Krieger-Dougherty (K-D) equation (Justnes and Vikan 2005; Krieger and Dougherty
1959), and other parametric models (Chong, Christiansen, and Baer 2003; Liu 2000). The
apparent viscosity of a suspension (ηs) is defined as the ratio of the shear stress to the shear
rate, for a specific shear rate. Dividing the apparent viscosity by the viscosity of the
continuous phase (ηc) yields the apparent viscosity ratio or the relative viscosity (ηr). For
the experimental datasets reported in this paper, i.e., for two different solid volume
fractions (), and (w/s)v, and the mixture specific maximum packing density m, the
Krieger-Dougherty equation (Equation 6-5), with only the intrinsic viscosity [η] as the
variable parameter and Liu’s model (Liu 2000) (Equation 6-6) which is a two-parameter (a
and n) fitting model are used to compare the experimental and predicted apparent
viscosities.
(a) (b)
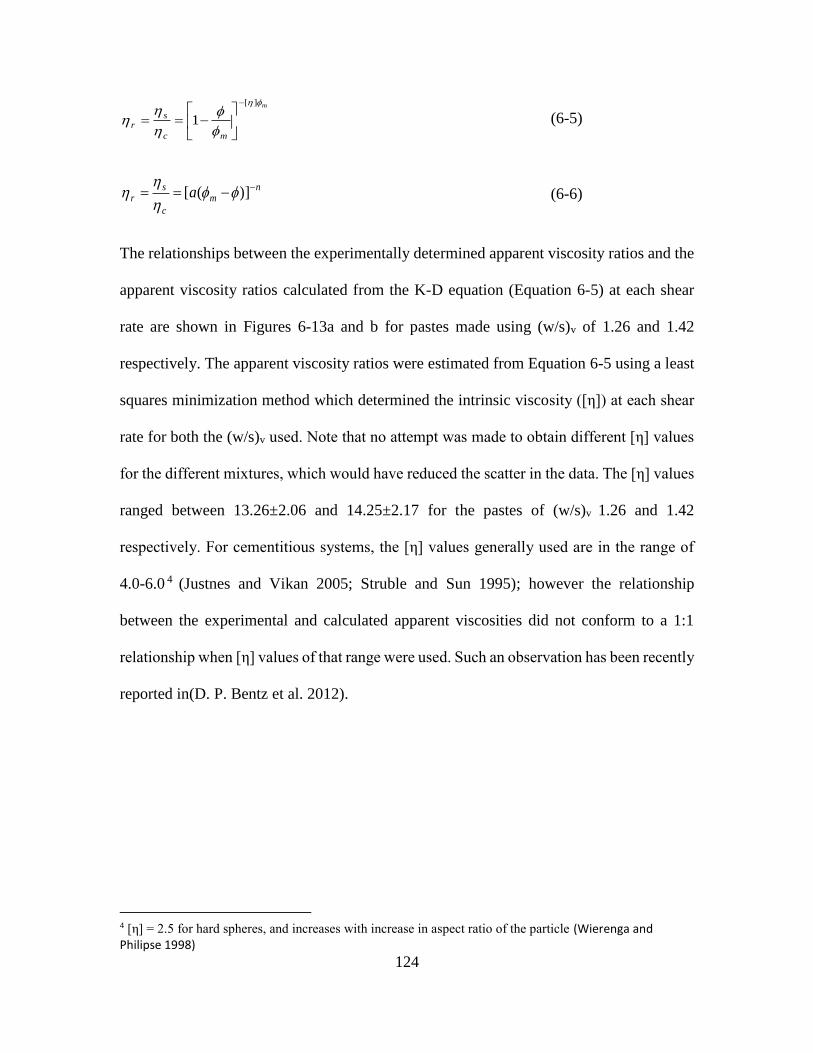
124
m
mc
sr
][
1
(6-5)
nm
c
sr a )]([
(6-6)
The relationships between the experimentally determined apparent viscosity ratios and the
apparent viscosity ratios calculated from the K-D equation (Equation 6-5) at each shear
rate are shown in Figures 6-13a and b for pastes made using (w/s)v of 1.26 and 1.42
respectively. The apparent viscosity ratios were estimated from Equation 6-5 using a least
squares minimization method which determined the intrinsic viscosity ([η]) at each shear
rate for both the (w/s)v used. Note that no attempt was made to obtain different [η] values
for the different mixtures, which would have reduced the scatter in the data. The [η] values
ranged between 13.26±2.06 and 14.25±2.17 for the pastes of (w/s)v 1.26 and 1.42
respectively. For cementitious systems, the [η] values generally used are in the range of
4.0-6.0 4 (Justnes and Vikan 2005; Struble and Sun 1995); however the relationship
between the experimental and calculated apparent viscosities did not conform to a 1:1
relationship when [η] values of that range were used. Such an observation has been recently
reported in(D. P. Bentz et al. 2012).
4 [η] = 2.5 for hard spheres, and increases with increase in aspect ratio of the particle (Wierenga and Philipse 1998)
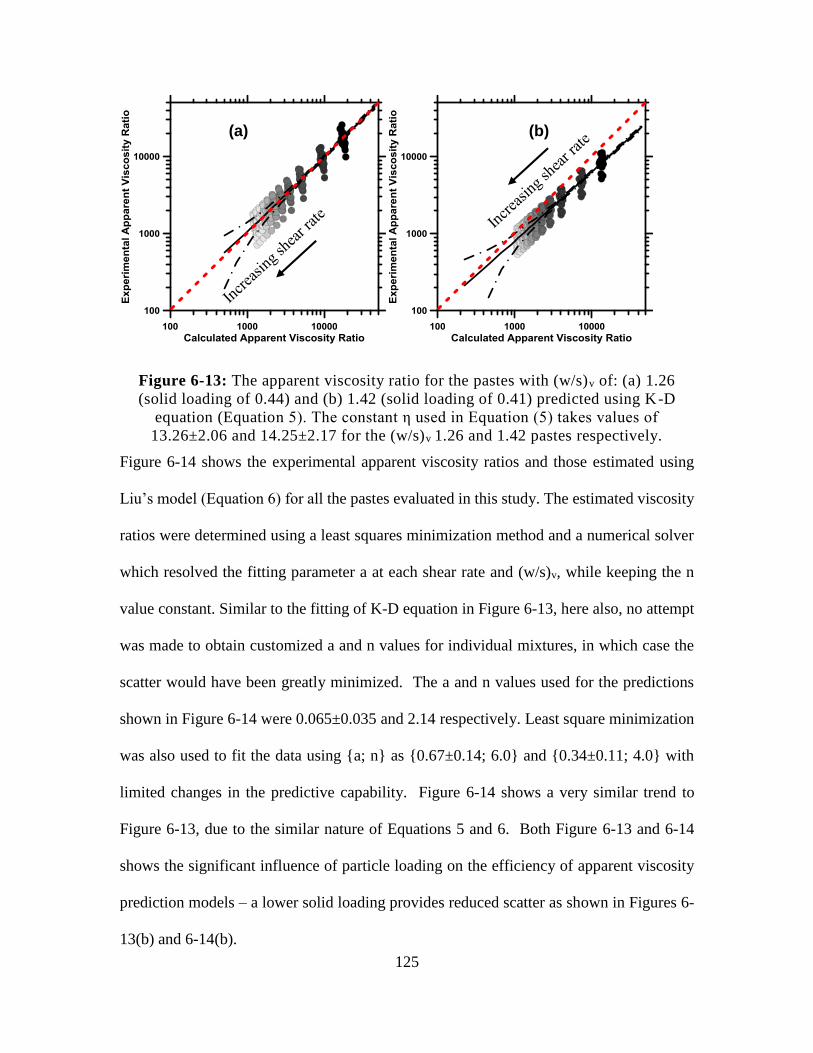
125
Figure 6-13: The apparent viscosity ratio for the pastes with (w/s)v of: (a) 1.26
(solid loading of 0.44) and (b) 1.42 (solid loading of 0.41) predicted using K-D
equation (Equation 5). The constant η used in Equation (5) takes values of
13.26±2.06 and 14.25±2.17 for the (w/s)v 1.26 and 1.42 pastes respectively.
Figure 6-14 shows the experimental apparent viscosity ratios and those estimated using
Liu’s model (Equation 6) for all the pastes evaluated in this study. The estimated viscosity
ratios were determined using a least squares minimization method and a numerical solver
which resolved the fitting parameter a at each shear rate and (w/s)v, while keeping the n
value constant. Similar to the fitting of K-D equation in Figure 6-13, here also, no attempt
was made to obtain customized a and n values for individual mixtures, in which case the
scatter would have been greatly minimized. The a and n values used for the predictions
shown in Figure 6-14 were 0.065±0.035 and 2.14 respectively. Least square minimization
was also used to fit the data using {a; n} as {0.67±0.14; 6.0} and {0.34±0.11; 4.0} with
limited changes in the predictive capability. Figure 6-14 shows a very similar trend to
Figure 6-13, due to the similar nature of Equations 5 and 6. Both Figure 6-13 and 6-14
shows the significant influence of particle loading on the efficiency of apparent viscosity
prediction models – a lower solid loading provides reduced scatter as shown in Figures 6-
13(b) and 6-14(b).
(b) (a)
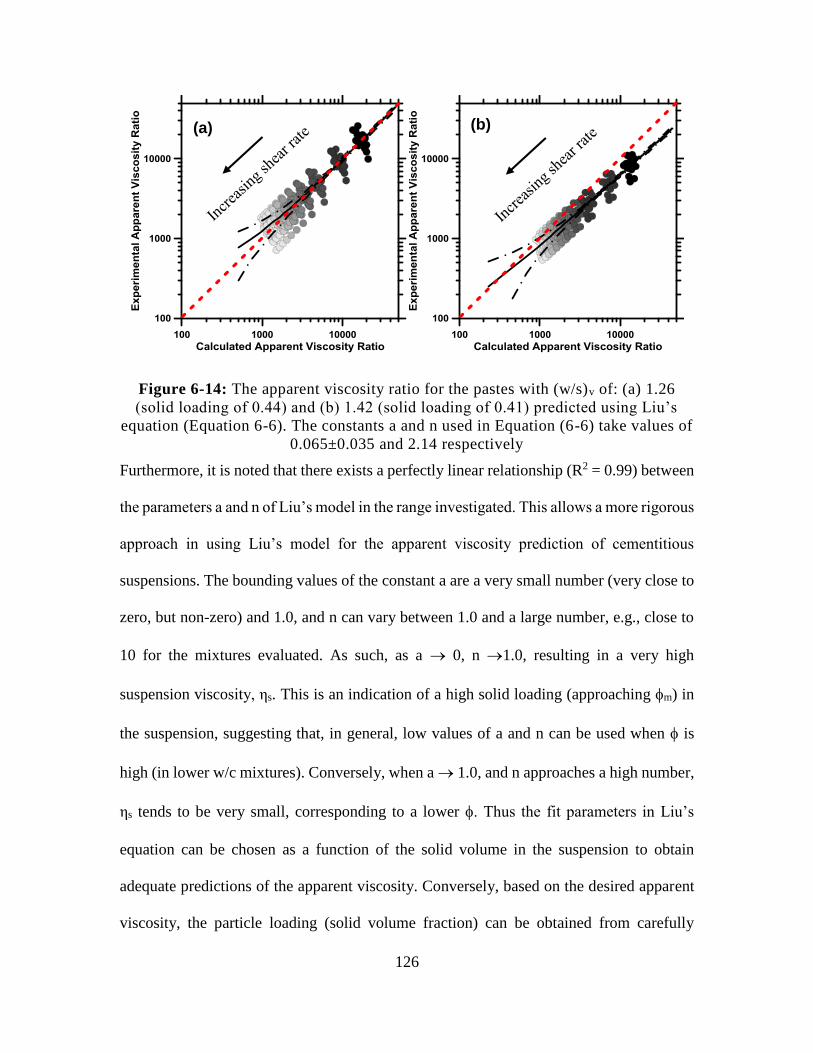
126
Figure 6-14: The apparent viscosity ratio for the pastes with (w/s)v of: (a) 1.26
(solid loading of 0.44) and (b) 1.42 (solid loading of 0.41) predicted using Liu’s
equation (Equation 6-6). The constants a and n used in Equation (6-6) take values of
0.065±0.035 and 2.14 respectively
Furthermore, it is noted that there exists a perfectly linear relationship (R2 = 0.99) between
the parameters a and n of Liu’s model in the range investigated. This allows a more rigorous
approach in using Liu’s model for the apparent viscosity prediction of cementitious
suspensions. The bounding values of the constant a are a very small number (very close to
zero, but non-zero) and 1.0, and n can vary between 1.0 and a large number, e.g., close to
10 for the mixtures evaluated. As such, as a 0, n 1.0, resulting in a very high
suspension viscosity, ηs. This is an indication of a high solid loading (approaching m) in
the suspension, suggesting that, in general, low values of a and n can be used when is
high (in lower w/c mixtures). Conversely, when a 1.0, and n approaches a high number,
ηs tends to be very small, corresponding to a lower . Thus the fit parameters in Liu’s
equation can be chosen as a function of the solid volume in the suspension to obtain
adequate predictions of the apparent viscosity. Conversely, based on the desired apparent
viscosity, the particle loading (solid volume fraction) can be obtained from carefully
(b) (a)
127
chosen constants. Another potential benefit of this approach, when well-calibrated, is its
capability to predict the maximum solids concentration (m). The measurement of this
parameter is quite complex since it depends on the shape and size distribution of particles
and computational methods that rely on a number of assumptions are generally used.
However, it must be noted that the shear rate also needs consideration while choosing the
constant a, where low values of a correspond to low shear rates.
6.4 Summary Conclusions
This study has reported the influence of binary blends of limestone, fly ash, or metakaolin
and ternary blends of limestone and fly ash or metakaolin on the rheological properties of
cement pastes. The Bingham model for fluid suspensions was used to interpret the material
behavior. Replacement of OPC by coarse limestone powder (15 µm) depressed the yield
stress and plastic viscosity of cement pastes, as attributed to a reduction in the packing
density and specific surface area of solids and an increase in the particle spacing. Opposing
effects in these parameters were noted when fine limestone powder (0.7 µm and 3 µm) is
incorporated, resulting in higher yield stress and plastic viscosity. Binary blends containing
fly ash behaved similar to those containing coarse limestone powder, whereas binary
metakaolin blends demonstrated behavior similar to that of a fine limestone containing
paste because of higher surface area and the agglomeration potential of metakaolin. In
ternary blends containing limestone and fly ash or metakaolin, the plastic viscosity
increased with increasing limestone content for fine limestone additions, as was the case
for binary limestone blends, and remained unchanged for coarse limestone additions. The
yield stress depression at higher fly ash contents even for pastes containing fine limestone
powder results from the spherical geometry of fly ash particles that compensate for the
128
increased surface area and packing. In ternary blends containing metakaolin and fine
limestone, the yield stress was noted to reduce with increasing limestone content. In this
case, increases in the packing density effected by fine limestone additions were likely
compensated by the electrostatic effects produced between metakaolin and limestone
particles that enhance interparticle spacing.
The influence of particle number density, water film thickness and the specific surface area
of the solids on the yield stress and plastic viscosity of suspensions containing binary or
ternary blends containing size classified limestone powder has been quantified. The yield
stress and plastic viscosity of all the pastes were found to increase with the particle number
density and specific surface area, and decrease with water film thickness. A two-parameter
model was used to relate the apparent viscosities to the solid volume fraction and maximum
packing density, with a substantial predictive capability being realized.
129
7. THE RHEOLOGY OF CEMENTITIOUS SUSPENSIONS: A CLOSER LOOK AT
EXPERIMENTAL PARAMETERS AND PROPERTY DETERMINATIONS USING
COMMONLY USED RHEOLOGICAL MODELS.
7.1 Introduction
Rheological studies of concentrated suspensions of solid particles in a continuous liquid
medium are commonly used to assess the characteristics of materials in industries ranging
from food to pharmaceuticals to construction materials. The flow behavior of these
concentrated suspensions is influenced by surface contacts between solid particles and
interparticle forces such as van Der Waals and steric forces (Mueller, Llewellin, and Mader
2010). Rheological studies of cementitious suspensions provide an understanding of how
these materials behave in the fresh state and serve to monitor structure development that
dictates the development of the mechanical properties (Sant, Ferraris, and Weiss 2008).
However, in order to apply rheological experiments to cementitious suspensions, it is
important to clearly understand the influences of experimental parameters and the selected
rheological model on both, measured and predicted characteristics of flow to establish their
relevance and applicability.
Rheological experiments are typically carried out using a rotational rheometer, which
monitors the change in torque required to change the shear rate (constant strain) or the
change in strain required to change the torque (constant stress). There exist several
experimental parameters of significance, including but not limited to: testing geometry
(parallel plate, coaxial cylinder, cup and vane etc.), the gap between shearing surfaces,
roughness of the shearing surfaces, testing temperature, and the state of dispersion
determined by the particle characteristics and the mixing method. Models including
130
formulations by Bingham, Herschel-Bulkley, and/or Casson (Nehdi and Rahman 2004a;
Ferraris 1999a; De Larrard, Ferraris, and Sedran 1998; Schwartzentruber, Le Roy, and
Cordin 2006) are commonly applied to the shear stress-shear rate response to extract the
rheological parameters that describe flow, e.g., plastic viscosity and yield stress.
Previous studies (Nehdi and Rahman 2004a; D. P. Bentz et al. 2012; Ferraris, Obla, and
Hill 2001) have reported the influence of the experimental setup on the yield stress and
plastic viscosity of cementitious suspensions extracted using a Bingham model. The plastic
viscosity is a measure of the rate of increase in shear stress with increasing strain, and is
thus a measure of the flowability of a fluid. The plastic viscosity of fluid suspensions is
thought to be primarily influenced by interparticle friction and surface contacts (Banfill
2006), wherein decreasing the interparticle (friction) forces by increasing particle spacing
(or by decreasing surface contacts) results in a decrease in plastic viscosity. The yield
stress is a more complex parameter, defined as the non-zero (finite) stress at a “zero” strain
rate5. Several methods have been proposed to determine the yield stress, including: an
extended duration constant stress experiment (Møller, Mewis, and Bonn 2006), stress
growth and strain reduction experiments (Cheng 1986), and oscillatory experiments
(Nguyen and Boger 1992). Yield stress is typically determined in cementitious suspensions
using strain reduction experiments with reverse extrapolation to a zero strain rate using a
rheological model fit to the measured shear strain rate-shear stress dataset (Banfill 2006).
Yield stress has been attributed to the effects of both the surface contacts between particles
which prevent flow (jamming) below a certain applied stress, as well as interparticle
5 It should be noted that a “zero” strain rate does not practically exist. A non-zero strain rate (even if infinitesimally small)
needs to be applied in order to obtain a resistance to flow (shear stress). The apparent “zero” strain rate is thus a
mathematical simplification through which a value for the yield stress is obtained.
131
attractive forces (Funk and Dinger 1994; Lowke 2009; Mueller, Llewellin, and Mader
2010). Yield stress is commonly reported as the stress required to initiate flow of a fluid
(Banfill 2006); however some authors distinguish between a dynamic yield stress and static
yield stress (M.-H. Zhang et al. 2010). The dynamic yield stress is the stress required to
maintain flow once it has commenced, while the static yield stress is the stress required to
initiate flow from rest. This indicates that the dynamic yield stress is a model-dependent
parameter, i.e. the choice of model can have a significant influence on the calculated yield
stress, as can be seen from the data presented in (Nehdi and Rahman 2004a). This
distinction is significant when comparative rheological studies of cementitious suspensions
are to be performed, as selection of different shear rate ranges or models will result in
substantial variations in the calculated yield stress, indicating that the dynamic yield stress
is not a material parameter in the truest sense. This paper explores this idea in some detail
in the context of cementing systems. Furthermore, an understanding of the influence of the
shear history of the suspension, as represented using different mixing procedures is
developed in addition to new evaluations of the influences of experimental parameters
including: the gap between shearing surfaces and the surface roughness of the bottom plate
on the measured rheological response.
7.2 Experimental Program
7.2.1 Materials
The materials used in this study are a commercially available Type I/II ordinary portland
cement (OPC) conforming to ASTM C 150 (“ASTM C109 / C109M - 12 Standard Test
Method for Compressive Strength of Hydraulic Cement Mortars (Using 2-In. or [50-Mm]
Cube Specimens)” 2012), Class F fly ash conforming to ASTM C 618 (“ASTM C109-13.
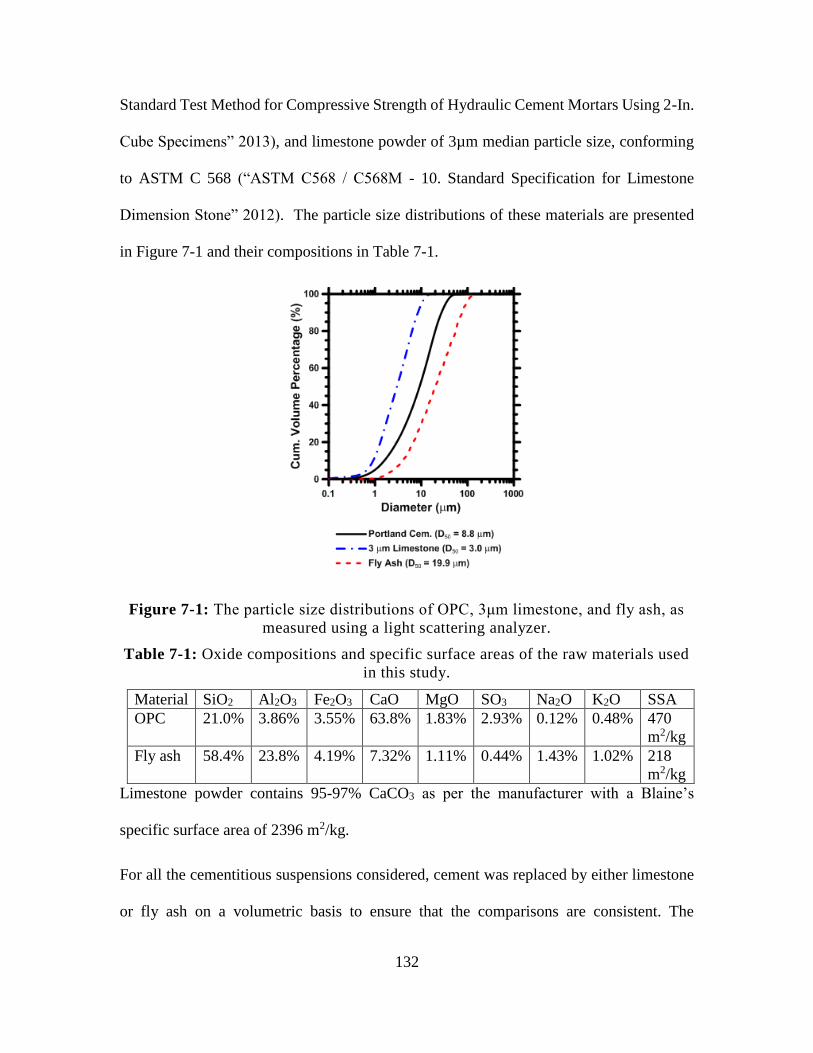
132
Standard Test Method for Compressive Strength of Hydraulic Cement Mortars Using 2-In.
Cube Specimens” 2013), and limestone powder of 3µm median particle size, conforming
to ASTM C 568 (“ASTM C568 / C568M - 10. Standard Specification for Limestone
Dimension Stone” 2012). The particle size distributions of these materials are presented
in Figure 7-1 and their compositions in Table 7-1.
Figure 7-1: The particle size distributions of OPC, 3μm limestone, and fly ash, as
measured using a light scattering analyzer.
Table 7-1: Oxide compositions and specific surface areas of the raw materials used
in this study.
Material SiO2 Al2O3 Fe2O3 CaO MgO SO3 Na2O K2O SSA
OPC 21.0% 3.86% 3.55% 63.8% 1.83% 2.93% 0.12% 0.48% 470
m2/kg
Fly ash 58.4% 23.8% 4.19% 7.32% 1.11% 0.44% 1.43% 1.02% 218
m2/kg
Limestone powder contains 95-97% CaCO3 as per the manufacturer with a Blaine’s
specific surface area of 2396 m2/kg.
For all the cementitious suspensions considered, cement was replaced by either limestone
or fly ash on a volumetric basis to ensure that the comparisons are consistent. The
133
suspensions were prepared at a constant volumetric water-to-solid ratios, (w/s)v, of 1.42,
equivalent to mass-based water-to-solid ratio, (w/s)m, of approximately 0.45. No chemical
admixtures were used.
7.2.2 Experimental Parameters and Suspensions
The rheological response of the suspensions is considered in the context of 4 distinct
parameters: (i) gap between the top and bottom plates in a parallel plate configuration (top
plate diameter of 50 mm, serrated to a depth of 1.0 mm), (ii) roughness and surface
treatment of the bottom plate6 (serrated to a depth of 0.15mm, or resin-coated sandpaper7
of mean surface roughness, MSR = 0.12mm or 0.017mm), (iii) type and speed of mixing
of the suspension, and (iv) range of shear rates considered. Further details regarding the
parameters are noted in Table 7-2. The suspensions consisted of: (i) OPC + water and (ii)
OPC + limestone + water where the fine limestone (d50 3μm) replaced 10% of OPC by
volume, and (iii) OPC + fly ash + water where fly ash replaced 10% OPC by volume. A
gap of 2.0 mm, a bottom plate with 0.15 mm deep serrations, a shear rate of 5-to-100/s,
and high-shear mixing corresponding to ASTM C 1738 (“ASTM C1738 - 11a. Standard
Practice for High-Shear Mixing of Hydraulic Cement Paste” 2011) were used as the general
“default” evaluation parameters.
6 The influence of the surface condition of the Peltier plate on rheological measurements including the effects of slippage
and plug flow have been reported elsewhere (Nehdi and Rahman 2004a; Banfill and others 2003). 7 Care should be taken to ensure that the sandpaper is non-absorbent as otherwise it will result in changes in water
availability and thus the rheological parameters.
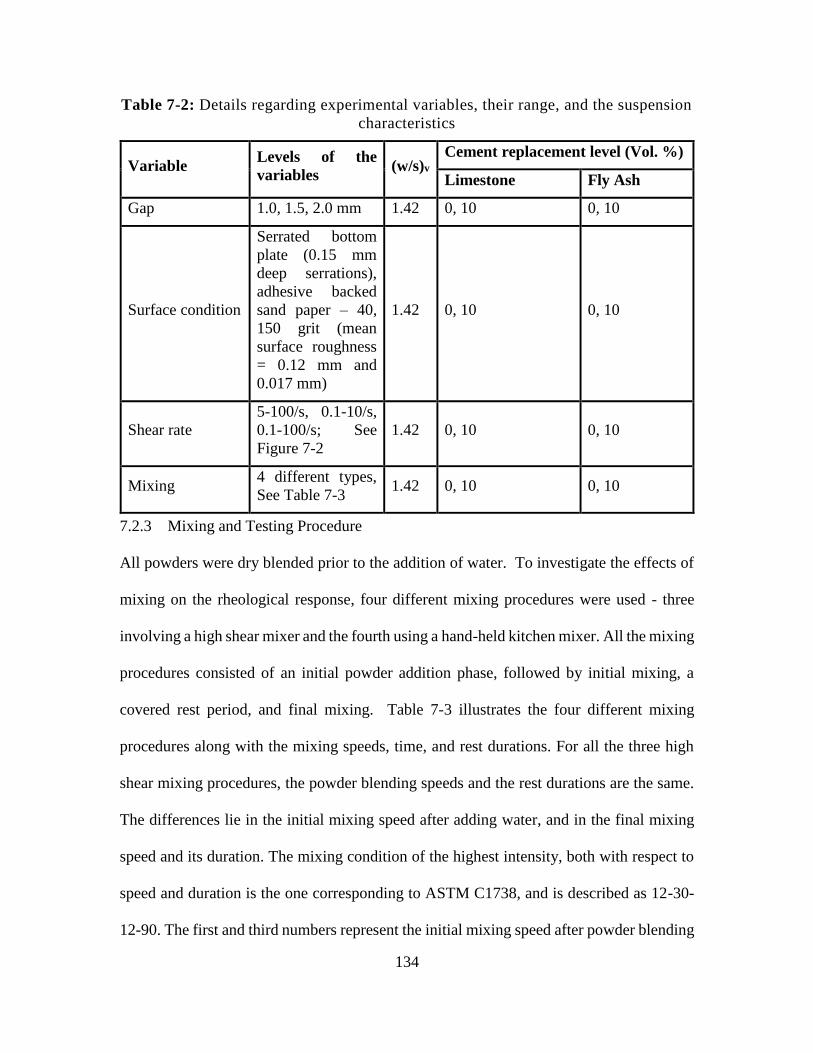
134
Table 7-2: Details regarding experimental variables, their range, and the suspension
characteristics
Variable Levels of the
variables (w/s)v
Cement replacement level (Vol. %)
Limestone Fly Ash
Gap 1.0, 1.5, 2.0 mm 1.42 0, 10 0, 10
Surface condition
Serrated bottom
plate (0.15 mm
deep serrations),
adhesive backed
sand paper – 40,
150 grit (mean
surface roughness
= 0.12 mm and
0.017 mm)
1.42 0, 10 0, 10
Shear rate
5-100/s, 0.1-10/s,
0.1-100/s; See
Figure 7-2
1.42 0, 10 0, 10
Mixing 4 different types,
See Table 7-3 1.42 0, 10 0, 10
7.2.3 Mixing and Testing Procedure
All powders were dry blended prior to the addition of water. To investigate the effects of
mixing on the rheological response, four different mixing procedures were used - three
involving a high shear mixer and the fourth using a hand-held kitchen mixer. All the mixing
procedures consisted of an initial powder addition phase, followed by initial mixing, a
covered rest period, and final mixing. Table 7-3 illustrates the four different mixing
procedures along with the mixing speeds, time, and rest durations. For all the three high
shear mixing procedures, the powder blending speeds and the rest durations are the same.
The differences lie in the initial mixing speed after adding water, and in the final mixing
speed and its duration. The mixing condition of the highest intensity, both with respect to
speed and duration is the one corresponding to ASTM C1738, and is described as 12-30-
12-90. The first and third numbers represent the initial mixing speed after powder blending
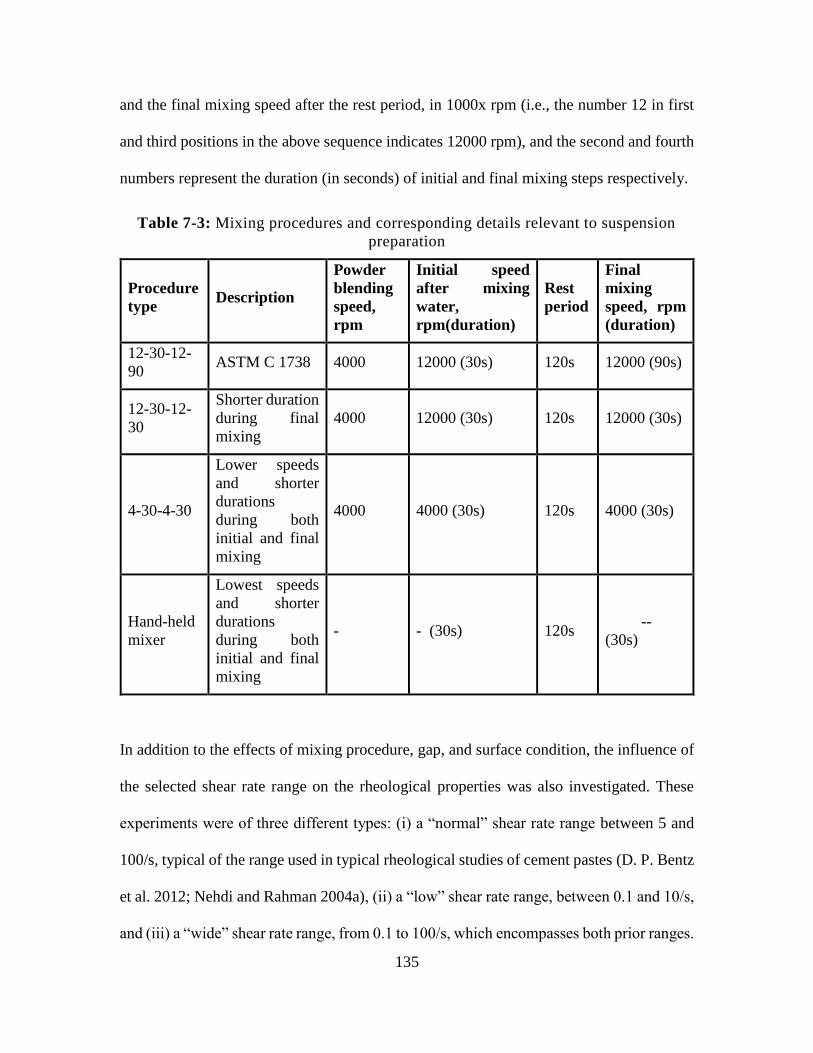
135
and the final mixing speed after the rest period, in 1000x rpm (i.e., the number 12 in first
and third positions in the above sequence indicates 12000 rpm), and the second and fourth
numbers represent the duration (in seconds) of initial and final mixing steps respectively.
Table 7-3: Mixing procedures and corresponding details relevant to suspension
preparation
Procedure
type Description
Powder
blending
speed,
rpm
Initial speed
after mixing
water,
rpm(duration)
Rest
period
Final
mixing
speed, rpm
(duration)
12-30-12-
90 ASTM C 1738 4000 12000 (30s) 120s 12000 (90s)
12-30-12-
30
Shorter duration
during final
mixing
4000 12000 (30s) 120s 12000 (30s)
4-30-4-30
Lower speeds
and shorter
durations
during both
initial and final
mixing
4000 4000 (30s) 120s 4000 (30s)
Hand-held
mixer
Lowest speeds
and shorter
durations
during both
initial and final
mixing
- - (30s) 120s --
(30s)
In addition to the effects of mixing procedure, gap, and surface condition, the influence of
the selected shear rate range on the rheological properties was also investigated. These
experiments were of three different types: (i) a “normal” shear rate range between 5 and
100/s, typical of the range used in typical rheological studies of cement pastes (D. P. Bentz
et al. 2012; Nehdi and Rahman 2004a), (ii) a “low” shear rate range, between 0.1 and 10/s,
and (iii) a “wide” shear rate range, from 0.1 to 100/s, which encompasses both prior ranges.
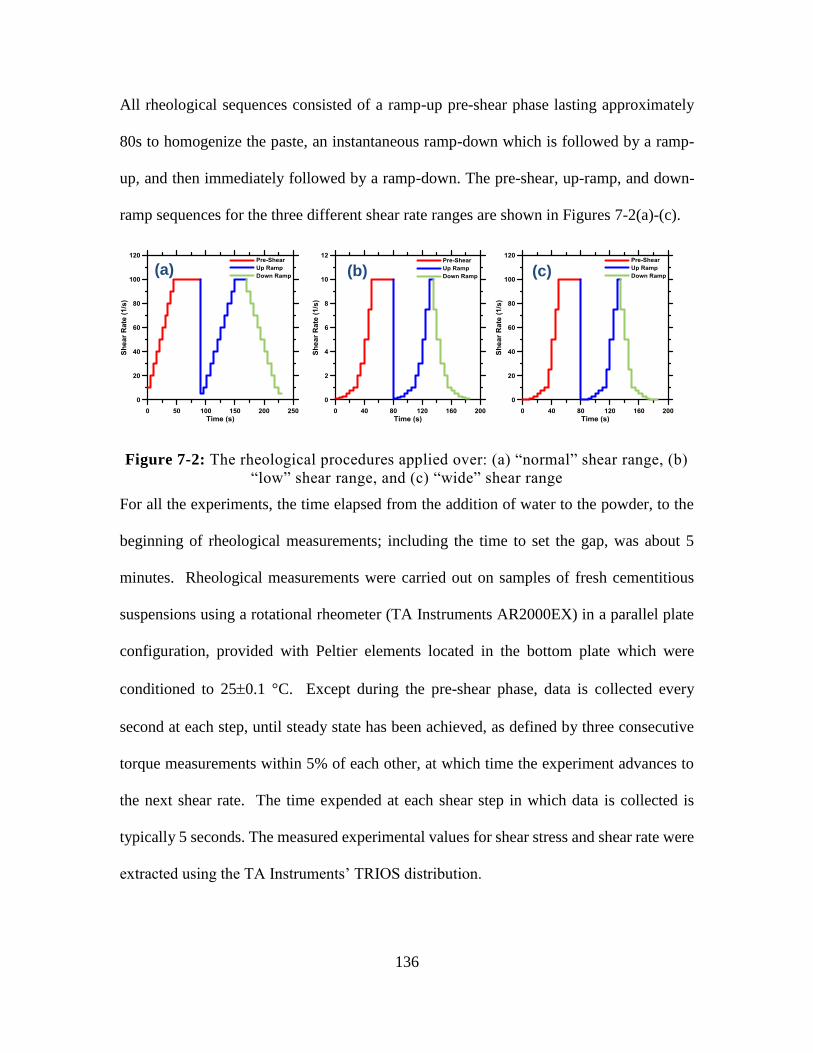
136
All rheological sequences consisted of a ramp-up pre-shear phase lasting approximately
80s to homogenize the paste, an instantaneous ramp-down which is followed by a ramp-
up, and then immediately followed by a ramp-down. The pre-shear, up-ramp, and down-
ramp sequences for the three different shear rate ranges are shown in Figures 7-2(a)-(c).
Figure 7-2: The rheological procedures applied over: (a) “normal” shear range, (b)
“low” shear range, and (c) “wide” shear range
For all the experiments, the time elapsed from the addition of water to the powder, to the
beginning of rheological measurements; including the time to set the gap, was about 5
minutes. Rheological measurements were carried out on samples of fresh cementitious
suspensions using a rotational rheometer (TA Instruments AR2000EX) in a parallel plate
configuration, provided with Peltier elements located in the bottom plate which were
conditioned to 250.1 °C. Except during the pre-shear phase, data is collected every
second at each step, until steady state has been achieved, as defined by three consecutive
torque measurements within 5% of each other, at which time the experiment advances to
the next shear rate. The time expended at each shear step in which data is collected is
typically 5 seconds. The measured experimental values for shear stress and shear rate were
extracted using the TA Instruments’ TRIOS distribution.
(b) (c) (a)
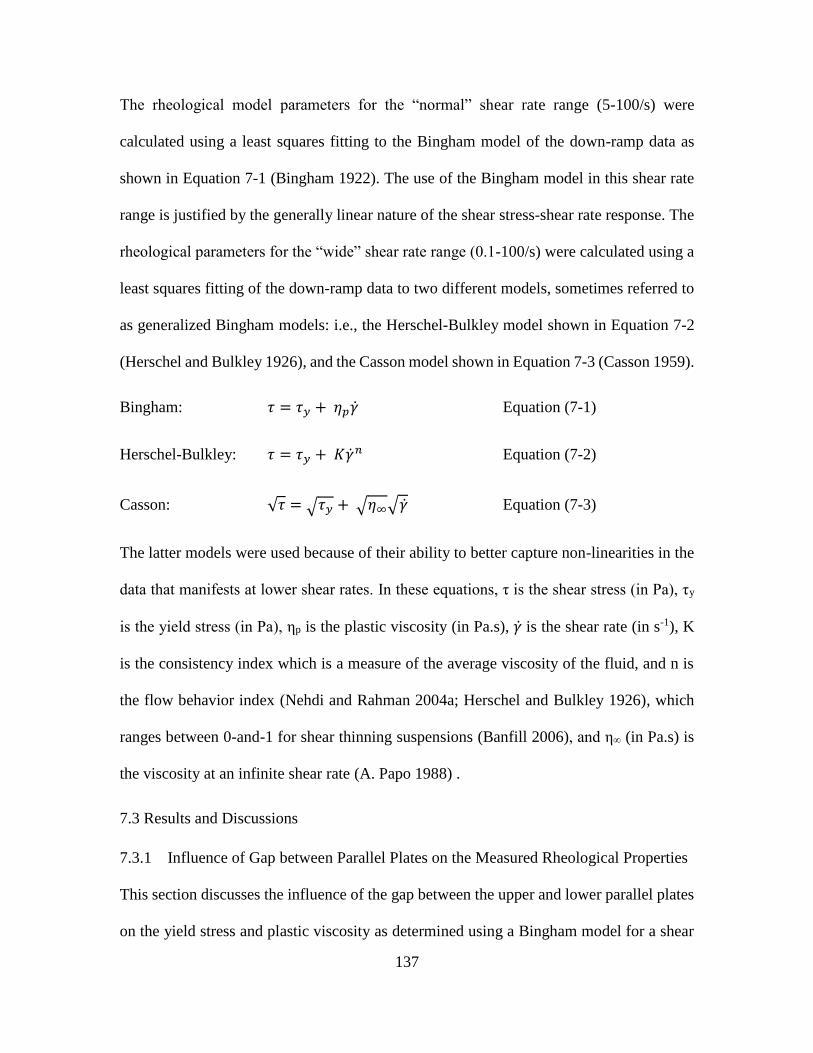
137
The rheological model parameters for the “normal” shear rate range (5-100/s) were
calculated using a least squares fitting to the Bingham model of the down-ramp data as
shown in Equation 7-1 (Bingham 1922). The use of the Bingham model in this shear rate
range is justified by the generally linear nature of the shear stress-shear rate response. The
rheological parameters for the “wide” shear rate range (0.1-100/s) were calculated using a
least squares fitting of the down-ramp data to two different models, sometimes referred to
as generalized Bingham models: i.e., the Herschel-Bulkley model shown in Equation 7-2
(Herschel and Bulkley 1926), and the Casson model shown in Equation 7-3 (Casson 1959).
Bingham: 𝜏 = 𝜏𝑦 + 𝜂𝑝�̇� Equation (7-1)
Herschel-Bulkley: 𝜏 = 𝜏𝑦 + 𝐾�̇�𝑛 Equation (7-2)
Casson: √𝜏 = √𝜏𝑦 + √𝜂∞√�̇� Equation (7-3)
The latter models were used because of their ability to better capture non-linearities in the
data that manifests at lower shear rates. In these equations, τ is the shear stress (in Pa), τy
is the yield stress (in Pa), ηp is the plastic viscosity (in Pa.s), �̇� is the shear rate (in s-1), K
is the consistency index which is a measure of the average viscosity of the fluid, and n is
the flow behavior index (Nehdi and Rahman 2004a; Herschel and Bulkley 1926), which
ranges between 0-and-1 for shear thinning suspensions (Banfill 2006), and η∞ (in Pa.s) is
the viscosity at an infinite shear rate (A. Papo 1988) .
7.3 Results and Discussions
7.3.1 Influence of Gap between Parallel Plates on the Measured Rheological Properties
This section discusses the influence of the gap between the upper and lower parallel plates
on the yield stress and plastic viscosity as determined using a Bingham model for a shear
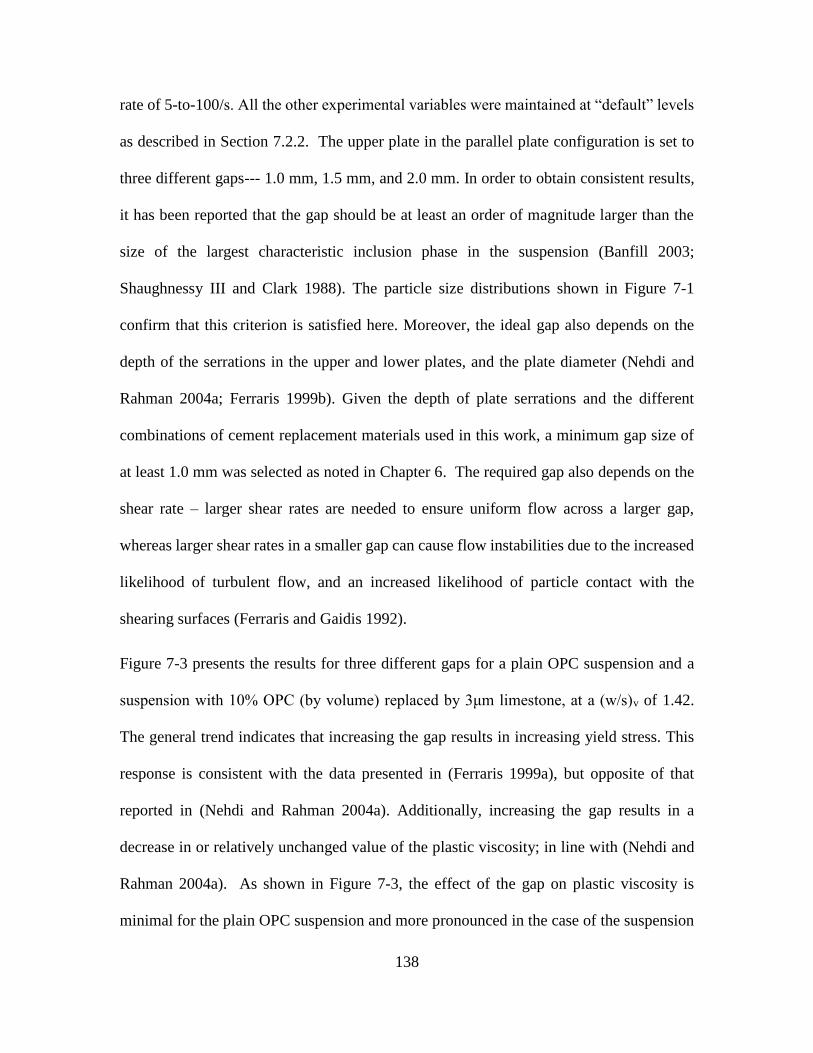
138
rate of 5-to-100/s. All the other experimental variables were maintained at “default” levels
as described in Section 7.2.2. The upper plate in the parallel plate configuration is set to
three different gaps--- 1.0 mm, 1.5 mm, and 2.0 mm. In order to obtain consistent results,
it has been reported that the gap should be at least an order of magnitude larger than the
size of the largest characteristic inclusion phase in the suspension (Banfill 2003;
Shaughnessy III and Clark 1988). The particle size distributions shown in Figure 7-1
confirm that this criterion is satisfied here. Moreover, the ideal gap also depends on the
depth of the serrations in the upper and lower plates, and the plate diameter (Nehdi and
Rahman 2004a; Ferraris 1999b). Given the depth of plate serrations and the different
combinations of cement replacement materials used in this work, a minimum gap size of
at least 1.0 mm was selected as noted in Chapter 6. The required gap also depends on the
shear rate – larger shear rates are needed to ensure uniform flow across a larger gap,
whereas larger shear rates in a smaller gap can cause flow instabilities due to the increased
likelihood of turbulent flow, and an increased likelihood of particle contact with the
shearing surfaces (Ferraris and Gaidis 1992).
Figure 7-3 presents the results for three different gaps for a plain OPC suspension and a
suspension with 10% OPC (by volume) replaced by 3μm limestone, at a (w/s)v of 1.42.
The general trend indicates that increasing the gap results in increasing yield stress. This
response is consistent with the data presented in (Ferraris 1999a), but opposite of that
reported in (Nehdi and Rahman 2004a). Additionally, increasing the gap results in a
decrease in or relatively unchanged value of the plastic viscosity; in line with (Nehdi and
Rahman 2004a). As shown in Figure 7-3, the effect of the gap on plastic viscosity is
minimal for the plain OPC suspension and more pronounced in the case of the suspension
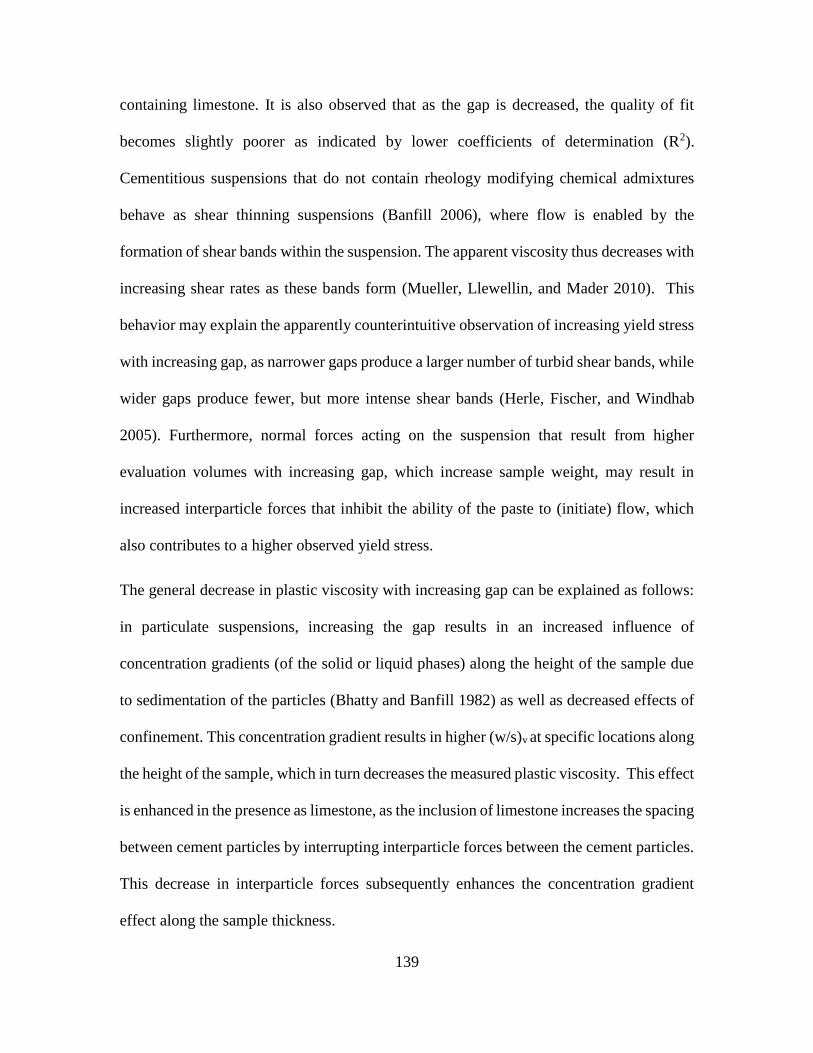
139
containing limestone. It is also observed that as the gap is decreased, the quality of fit
becomes slightly poorer as indicated by lower coefficients of determination (R2).
Cementitious suspensions that do not contain rheology modifying chemical admixtures
behave as shear thinning suspensions (Banfill 2006), where flow is enabled by the
formation of shear bands within the suspension. The apparent viscosity thus decreases with
increasing shear rates as these bands form (Mueller, Llewellin, and Mader 2010). This
behavior may explain the apparently counterintuitive observation of increasing yield stress
with increasing gap, as narrower gaps produce a larger number of turbid shear bands, while
wider gaps produce fewer, but more intense shear bands (Herle, Fischer, and Windhab
2005). Furthermore, normal forces acting on the suspension that result from higher
evaluation volumes with increasing gap, which increase sample weight, may result in
increased interparticle forces that inhibit the ability of the paste to (initiate) flow, which
also contributes to a higher observed yield stress.
The general decrease in plastic viscosity with increasing gap can be explained as follows:
in particulate suspensions, increasing the gap results in an increased influence of
concentration gradients (of the solid or liquid phases) along the height of the sample due
to sedimentation of the particles (Bhatty and Banfill 1982) as well as decreased effects of
confinement. This concentration gradient results in higher (w/s)v at specific locations along
the height of the sample, which in turn decreases the measured plastic viscosity. This effect
is enhanced in the presence as limestone, as the inclusion of limestone increases the spacing
between cement particles by interrupting interparticle forces between the cement particles.
This decrease in interparticle forces subsequently enhances the concentration gradient
effect along the sample thickness.
140
Figure 7-3: The influence of gap on the rheological properties, estimated using the
Bingham model
7.3.2 Influence of the Surface Condition of the Bottom Plate
Measurement of rheological properties can be considerably influenced by the friction
between the sample and the shearing surface. Several studies have shown that the use of a
smooth shearing surface increases the likelihood of slippage and plug flow which can result
in incorrect estimations of the rheological properties (Saak, Jennings, and Shah 2001;
Mannheimer 1983; Banfill 2006). This section adds to this premise by studying the effects
of surface roughness, as described by the mean surface roughness (MSR), which is the
arithmetical mean height of the irregularities measured from the datum surface, on the
rheological parameters as determined using the Bingham model (Equation 7-1). The
bottom plate with 0.15 mm deep serrations has a MSR = 0.15mm, and the MSR values of
the other surfaces (sandpaper) used are shown in Table 7-2.
141
Figure 7-4: The influence of the surface condition of the bottom plate one the
rheological properties as estimated using the Bingham model.
Figure 7-4 presents the influences of surface roughness on the rheological properties.
Three surface conditions were used, ranging from a serrated bottom plate (MSR = 0.15mm)
to 150 grit sandpaper (MSR = 0.017mm), at a constant gap value of 2.0 mm. In general,
the yield stress and plastic viscosity increase with increasing MSR, as can be observed
from Figure 7-4. It is important to note that, as the surface roughness increases, the
likelihood of slip decreases. Since slip is caused due to a localized decrease in the solid
concentration near the shearing surface (Saak, Jennings, and Shah 2001), the use of
textured surfaces acts to maintain constant the solid fraction in the vicinity of these
surfaces. Hence, as the roughness increases, the yield stress and more so, the plastic
viscosity increases because of a reduction in slip at the shearing surface (Saak, Jennings,
and Shah 2001; Mannheimer 1983).
7.3.3 Influence of Mixing Procedure on Rheological Properties as Estimated Using the
Bingham Model
The shear history of fresh cementitious suspensions, which is attributed mainly to the
mixing process, influences their rheological properties (Banfill 2006). Different mixing
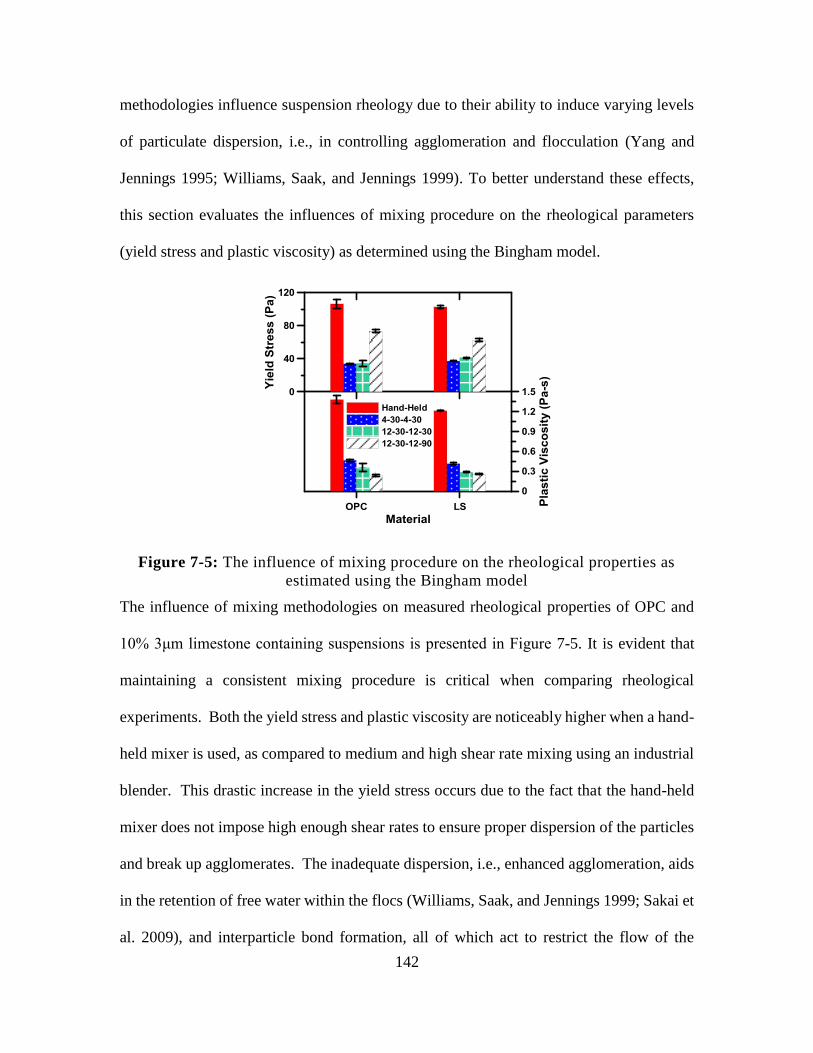
142
methodologies influence suspension rheology due to their ability to induce varying levels
of particulate dispersion, i.e., in controlling agglomeration and flocculation (Yang and
Jennings 1995; Williams, Saak, and Jennings 1999). To better understand these effects,
this section evaluates the influences of mixing procedure on the rheological parameters
(yield stress and plastic viscosity) as determined using the Bingham model.
Figure 7-5: The influence of mixing procedure on the rheological properties as
estimated using the Bingham model
The influence of mixing methodologies on measured rheological properties of OPC and
10% 3μm limestone containing suspensions is presented in Figure 7-5. It is evident that
maintaining a consistent mixing procedure is critical when comparing rheological
experiments. Both the yield stress and plastic viscosity are noticeably higher when a hand-
held mixer is used, as compared to medium and high shear rate mixing using an industrial
blender. This drastic increase in the yield stress occurs due to the fact that the hand-held
mixer does not impose high enough shear rates to ensure proper dispersion of the particles
and break up agglomerates. The inadequate dispersion, i.e., enhanced agglomeration, aids
in the retention of free water within the flocs (Williams, Saak, and Jennings 1999; Sakai et
al. 2009), and interparticle bond formation, all of which act to restrict the flow of the
143
suspension. In the case of mixing procedures that employ high shear rates, there is a
consistent trend of decreasing plastic viscosity with increasing mixing intensity (both in
terms of speed and duration). As the shear rate (i.e., the mixing speed) is increased, the
mixing shifts from primarily extensive to intensive (Hetsroni 1982)8, and thus particle
dispersion increases and agglomerations are reduced or destroyed (Williams, Saak, and
Jennings 1999; Tattersall and Banfill 1983; Yang and Jennings 1995). This results in a
decrease in interparticle surface contacts and friction forces, thereby increasing the fluidity
of the suspension. It is also notable that the influence of limestone addition varies across
different mixing regimes. The plastic viscosity reduces on limestone incorporation across
all mixing cases. On the other hand, the yield stress influence of limestone incorporation
is inconsistent; both the lowest (hand-held) and highest (ASTM C1768) intensity mixing
result in decreased yield stress while the intermediate levels show an increase in yield
stress. This indicates that modifications to mixing procedures may produce different
results, as well as different interpretations therein when comparing suspensions containing
multiple solids with varying particle characteristics. While this could be attributed to
competing effects of dispersion/agglomeration and bond destruction/formation, it is
another example of yield stress being highly dependent on experimental parameters as will
be discussed in the following section.
8 It should be noted that extensive or distributive mixing causes a rearrangement of the components of the mixture and
is responsible for the spatial (re)distribution of the particles within the fluid matrix while intensive or dispersive mixing
normally involves a rupture of agglomerates through shear stresses at the particle/host fluid interface.
144
7.3.4 Influence of Shear Rate and Model Selection on Rheological Property
7.3.4.1 Shear Rate Range Effects
A discussion of the influence of shear rates on the yield stress and plastic viscosity as
determined using the three shear rate ranges reported in Section 7.2.2: (a) 5-100/s, (b) 0.1-
10/s, and (c) 0.1-100/s is presented here. While several different cementitious suspensions
of (w/s)v = 1.42 (including ternary blends of limestone of different particle sizes and fly
ash) were evaluated, the results of three representative suspensions: (i) OPC, (ii) 10% OPC
replaced by 3μm limestone, and (iii) 10% OPC replaced by fly ash, are presented in Figures
7-6 to 7-8. The datasets are plotted in both linear and logarithmic scales so as to
appropriately elucidate the differences at lower shear rates. Note the appearance of a shear
stress plateau at lower shear rates in the plot when the shear rate axis is plotted in the
logarithmic scale, is similar in trend to that reported in (Schwartzentruber, Le Roy, and
Cordin 2006). The fit lines shown on these plots are applicable for the Bingham model for
the “normal” range which is generally linear (5-100/s) and the Herschel-Bulkley and
Casson models on the “wide” shear range (0.1-100/s) as presented in Equations (7-1 to 7-
3). The Herschel-Bulkley (H-B) model was not fit on datasets for the “normal” range,
where the shear rate-shear stress response was quite linear because fitting the three-
parameter H-B model (Equation 7-2) to a linear dataset does not provide unique fits, i.e.,
there exist multiple combinations of the parameters (i.e., even within the constraints such
as 0 n 1.0) with negligible least squares error and very high coefficients of
determination9. The non-linearity of the data in the “wide” shear rate range experiments
9 Many commercial equation-fitting programs pick one among the many possible combinations, based on the initial
assumed values of the fitting parameters. While the use of H-B model has been suggested by some researchers over the
Bingham model even in the event of a linear -γ relationship to avoid obtaining negative 0 values, this approach is not
ideal. This section of the paper provides suggestions to overcome these artifacts of such “spurious curve fitting”.
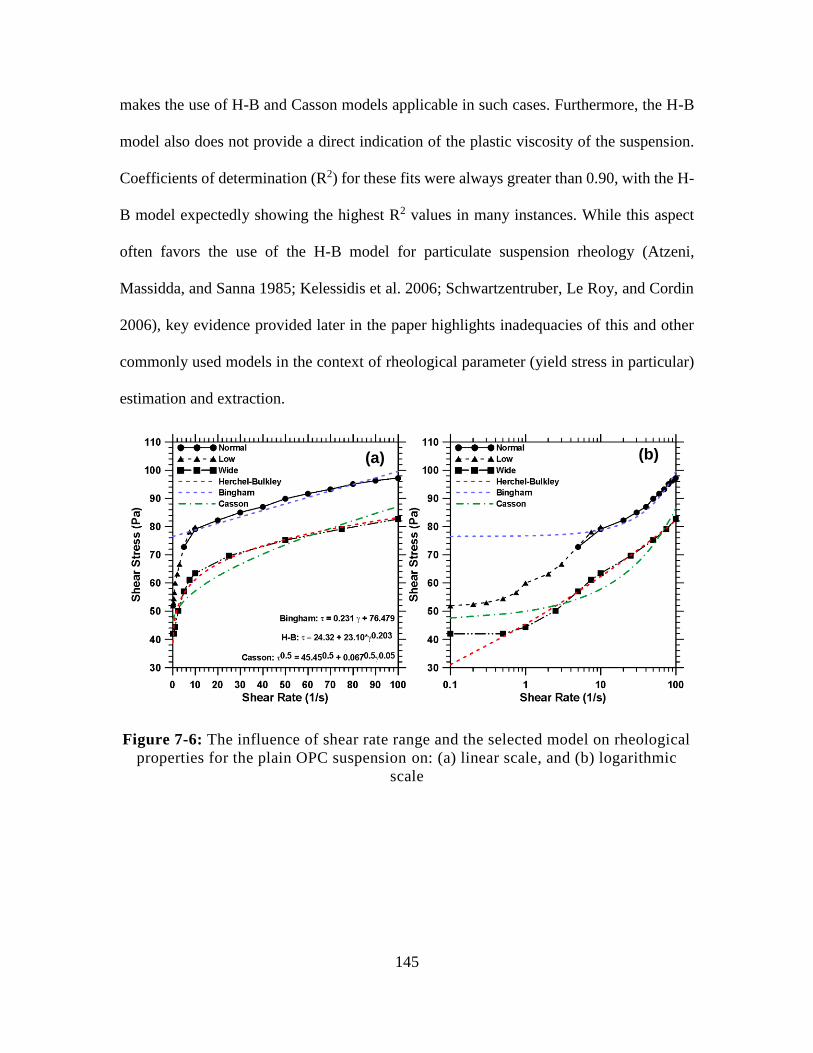
145
makes the use of H-B and Casson models applicable in such cases. Furthermore, the H-B
model also does not provide a direct indication of the plastic viscosity of the suspension.
Coefficients of determination (R2) for these fits were always greater than 0.90, with the H-
B model expectedly showing the highest R2 values in many instances. While this aspect
often favors the use of the H-B model for particulate suspension rheology (Atzeni,
Massidda, and Sanna 1985; Kelessidis et al. 2006; Schwartzentruber, Le Roy, and Cordin
2006), key evidence provided later in the paper highlights inadequacies of this and other
commonly used models in the context of rheological parameter (yield stress in particular)
estimation and extraction.
Figure 7-6: The influence of shear rate range and the selected model on rheological
properties for the plain OPC suspension on: (a) linear scale, and (b) logarithmic
scale
(a) (b)
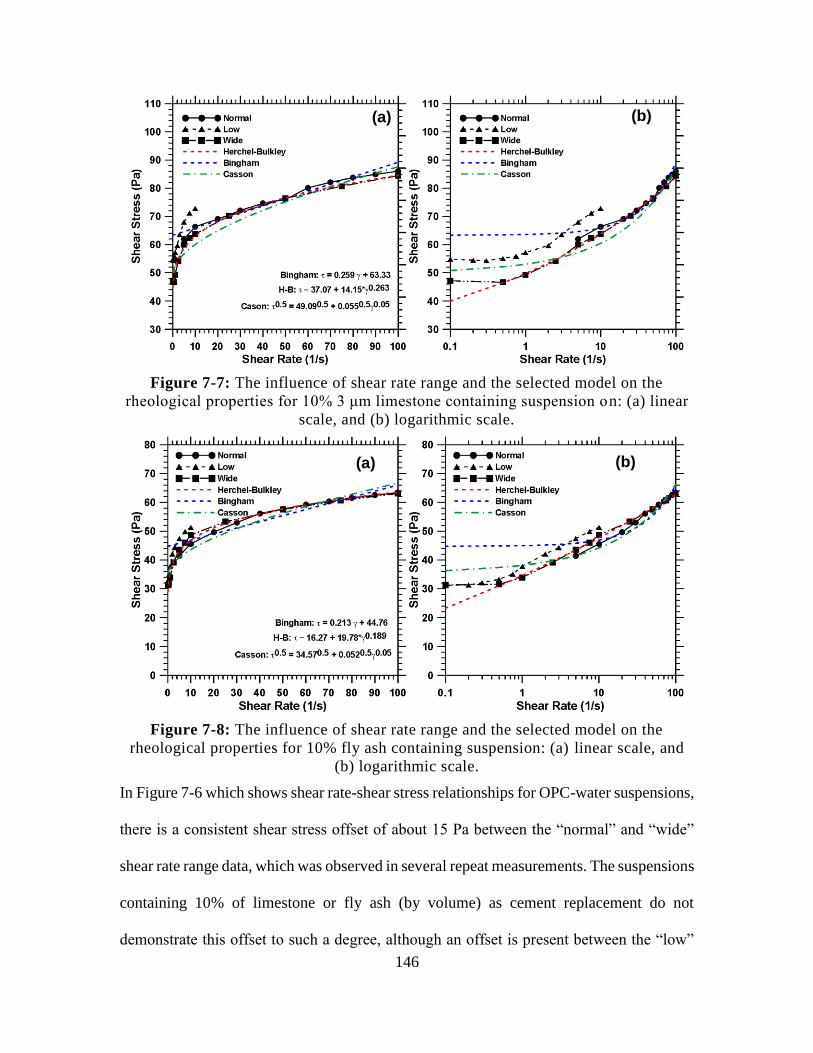
146
Figure 7-7: The influence of shear rate range and the selected model on the
rheological properties for 10% 3 μm limestone containing suspension on: (a) linear
scale, and (b) logarithmic scale.
Figure 7-8: The influence of shear rate range and the selected model on the
rheological properties for 10% fly ash containing suspension: (a) linear scale, and
(b) logarithmic scale.
In Figure 7-6 which shows shear rate-shear stress relationships for OPC-water suspensions,
there is a consistent shear stress offset of about 15 Pa between the “normal” and “wide”
shear rate range data, which was observed in several repeat measurements. The suspensions
containing 10% of limestone or fly ash (by volume) as cement replacement do not
demonstrate this offset to such a degree, although an offset is present between the “low”
(a) (b)
(a) (b)
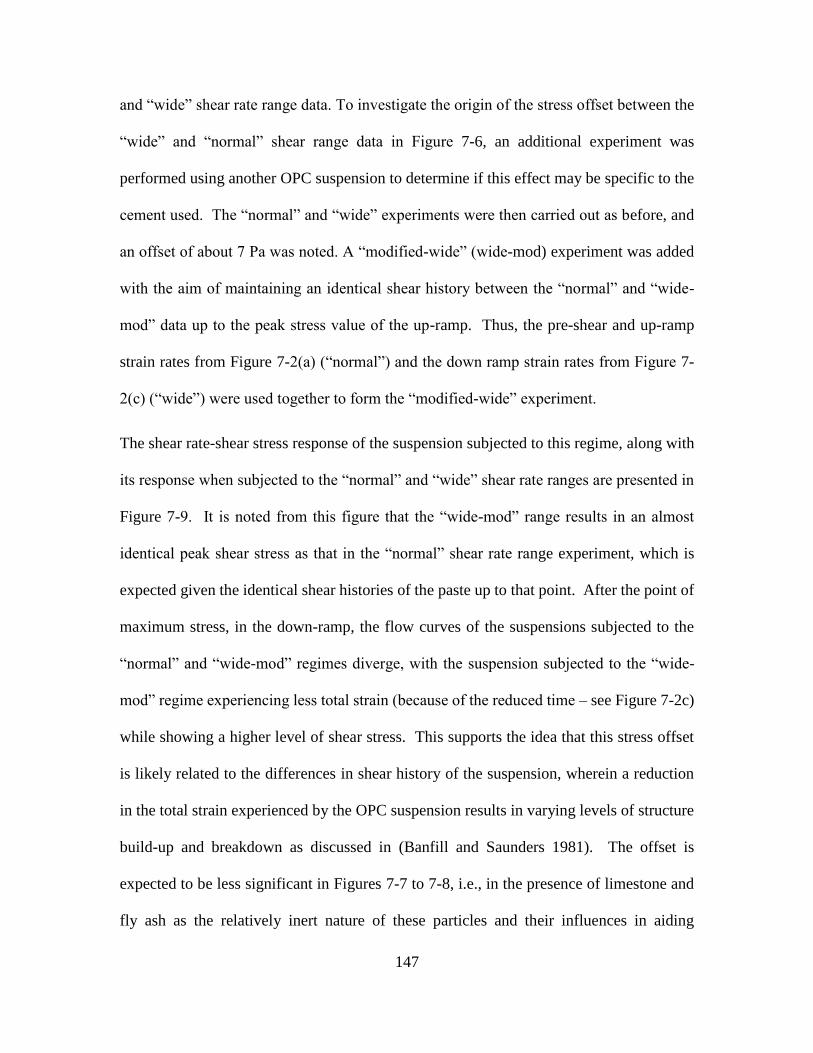
147
and “wide” shear rate range data. To investigate the origin of the stress offset between the
“wide” and “normal” shear range data in Figure 7-6, an additional experiment was
performed using another OPC suspension to determine if this effect may be specific to the
cement used. The “normal” and “wide” experiments were then carried out as before, and
an offset of about 7 Pa was noted. A “modified-wide” (wide-mod) experiment was added
with the aim of maintaining an identical shear history between the “normal” and “wide-
mod” data up to the peak stress value of the up-ramp. Thus, the pre-shear and up-ramp
strain rates from Figure 7-2(a) (“normal”) and the down ramp strain rates from Figure 7-
2(c) (“wide”) were used together to form the “modified-wide” experiment.
The shear rate-shear stress response of the suspension subjected to this regime, along with
its response when subjected to the “normal” and “wide” shear rate ranges are presented in
Figure 7-9. It is noted from this figure that the “wide-mod” range results in an almost
identical peak shear stress as that in the “normal” shear rate range experiment, which is
expected given the identical shear histories of the paste up to that point. After the point of
maximum stress, in the down-ramp, the flow curves of the suspensions subjected to the
“normal” and “wide-mod” regimes diverge, with the suspension subjected to the “wide-
mod” regime experiencing less total strain (because of the reduced time – see Figure 7-2c)
while showing a higher level of shear stress. This supports the idea that this stress offset
is likely related to the differences in shear history of the suspension, wherein a reduction
in the total strain experienced by the OPC suspension results in varying levels of structure
build-up and breakdown as discussed in (Banfill and Saunders 1981). The offset is
expected to be less significant in Figures 7-7 to 7-8, i.e., in the presence of limestone and
fly ash as the relatively inert nature of these particles and their influences in aiding
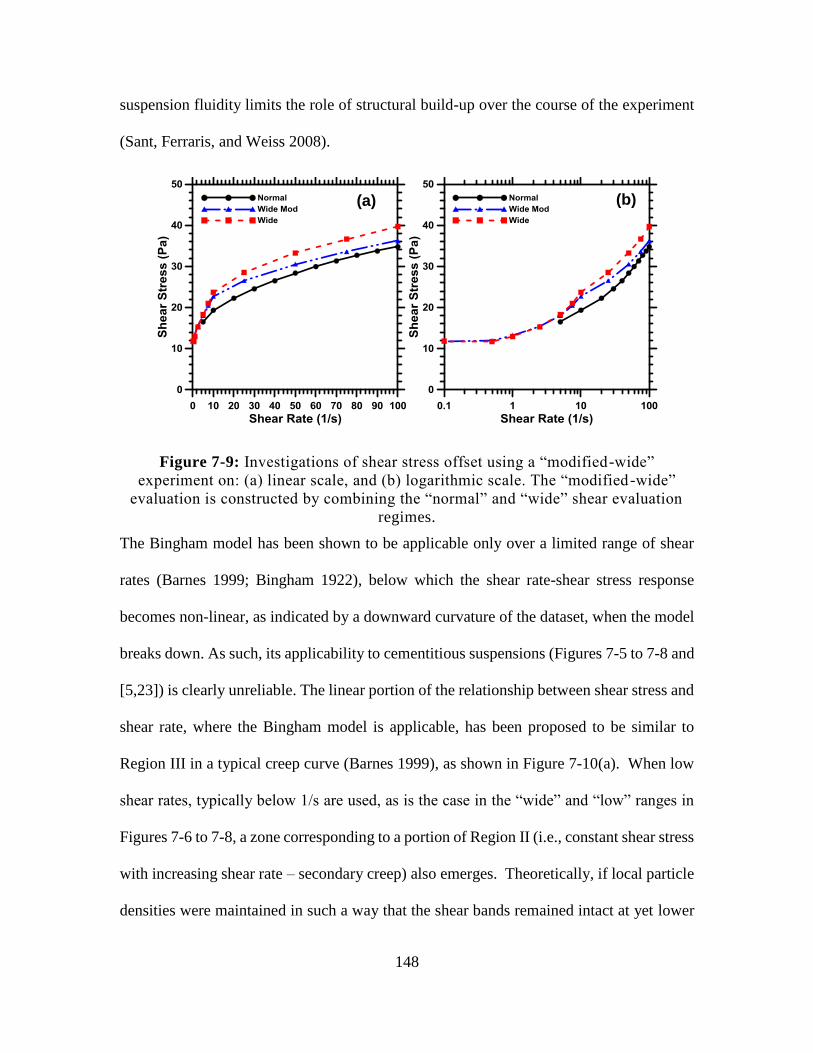
148
suspension fluidity limits the role of structural build-up over the course of the experiment
(Sant, Ferraris, and Weiss 2008).
Figure 7-9: Investigations of shear stress offset using a “modified-wide”
experiment on: (a) linear scale, and (b) logarithmic scale. The “modified -wide”
evaluation is constructed by combining the “normal” and “wide” shear evaluation
regimes.
The Bingham model has been shown to be applicable only over a limited range of shear
rates (Barnes 1999; Bingham 1922), below which the shear rate-shear stress response
becomes non-linear, as indicated by a downward curvature of the dataset, when the model
breaks down. As such, its applicability to cementitious suspensions (Figures 7-5 to 7-8 and
[5,23]) is clearly unreliable. The linear portion of the relationship between shear stress and
shear rate, where the Bingham model is applicable, has been proposed to be similar to
Region III in a typical creep curve (Barnes 1999), as shown in Figure 7-10(a). When low
shear rates, typically below 1/s are used, as is the case in the “wide” and “low” ranges in
Figures 7-6 to 7-8, a zone corresponding to a portion of Region II (i.e., constant shear stress
with increasing shear rate – secondary creep) also emerges. Theoretically, if local particle
densities were maintained in such a way that the shear bands remained intact at yet lower
(a) (b)
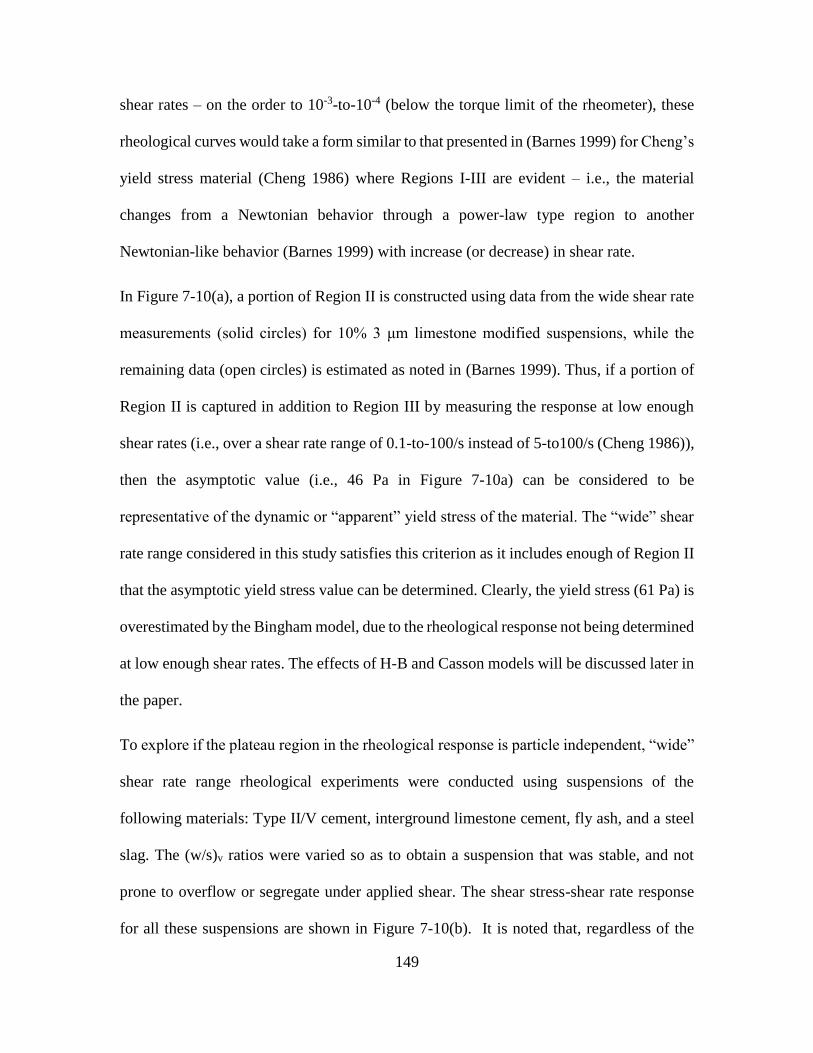
149
shear rates – on the order to 10-3-to-10-4 (below the torque limit of the rheometer), these
rheological curves would take a form similar to that presented in (Barnes 1999) for Cheng’s
yield stress material (Cheng 1986) where Regions I-III are evident – i.e., the material
changes from a Newtonian behavior through a power-law type region to another
Newtonian-like behavior (Barnes 1999) with increase (or decrease) in shear rate.
In Figure 7-10(a), a portion of Region II is constructed using data from the wide shear rate
measurements (solid circles) for 10% 3 μm limestone modified suspensions, while the
remaining data (open circles) is estimated as noted in (Barnes 1999). Thus, if a portion of
Region II is captured in addition to Region III by measuring the response at low enough
shear rates (i.e., over a shear rate range of 0.1-to-100/s instead of 5-to100/s (Cheng 1986)),
then the asymptotic value (i.e., 46 Pa in Figure 7-10a) can be considered to be
representative of the dynamic or “apparent” yield stress of the material. The “wide” shear
rate range considered in this study satisfies this criterion as it includes enough of Region II
that the asymptotic yield stress value can be determined. Clearly, the yield stress (61 Pa) is
overestimated by the Bingham model, due to the rheological response not being determined
at low enough shear rates. The effects of H-B and Casson models will be discussed later in
the paper.
To explore if the plateau region in the rheological response is particle independent, “wide”
shear rate range rheological experiments were conducted using suspensions of the
following materials: Type II/V cement, interground limestone cement, fly ash, and a steel
slag. The (w/s)v ratios were varied so as to obtain a suspension that was stable, and not
prone to overflow or segregate under applied shear. The shear stress-shear rate response
for all these suspensions are shown in Figure 7-10(b). It is noted that, regardless of the
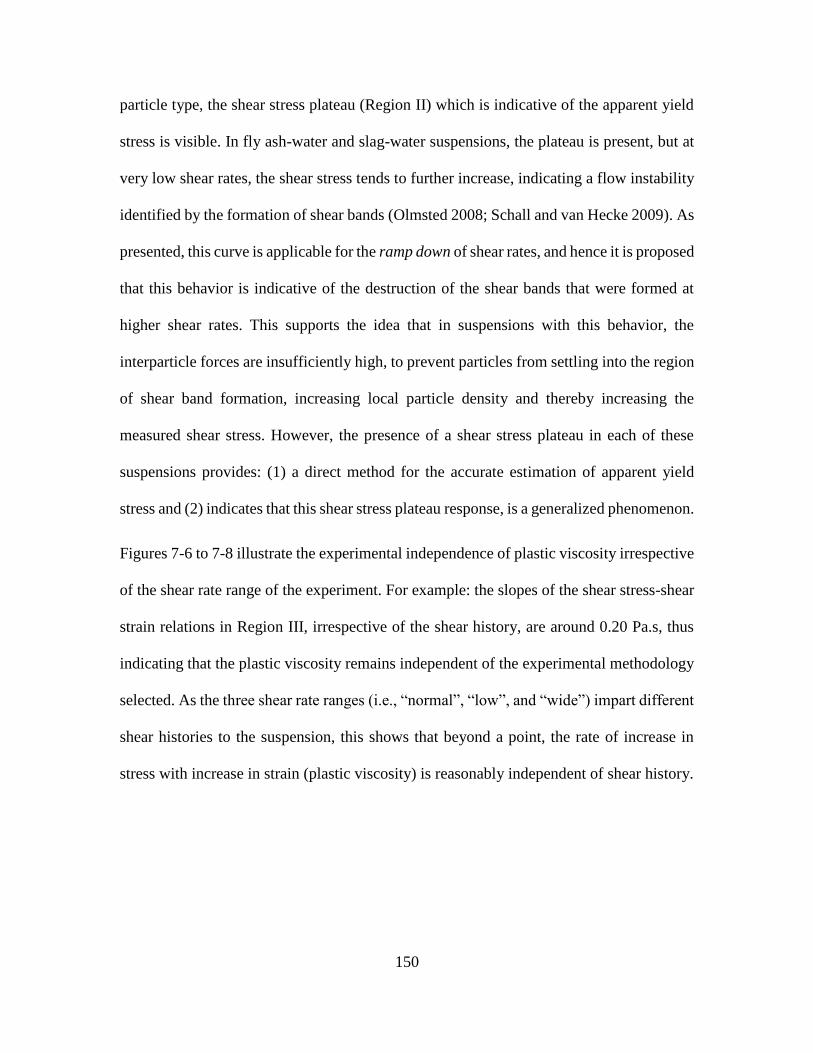
150
particle type, the shear stress plateau (Region II) which is indicative of the apparent yield
stress is visible. In fly ash-water and slag-water suspensions, the plateau is present, but at
very low shear rates, the shear stress tends to further increase, indicating a flow instability
identified by the formation of shear bands (Olmsted 2008; Schall and van Hecke 2009). As
presented, this curve is applicable for the ramp down of shear rates, and hence it is proposed
that this behavior is indicative of the destruction of the shear bands that were formed at
higher shear rates. This supports the idea that in suspensions with this behavior, the
interparticle forces are insufficiently high, to prevent particles from settling into the region
of shear band formation, increasing local particle density and thereby increasing the
measured shear stress. However, the presence of a shear stress plateau in each of these
suspensions provides: (1) a direct method for the accurate estimation of apparent yield
stress and (2) indicates that this shear stress plateau response, is a generalized phenomenon.
Figures 7-6 to 7-8 illustrate the experimental independence of plastic viscosity irrespective
of the shear rate range of the experiment. For example: the slopes of the shear stress-shear
strain relations in Region III, irrespective of the shear history, are around 0.20 Pa.s, thus
indicating that the plastic viscosity remains independent of the experimental methodology
selected. As the three shear rate ranges (i.e., “normal”, “low”, and “wide”) impart different
shear histories to the suspension, this shows that beyond a point, the rate of increase in
stress with increase in strain (plastic viscosity) is reasonably independent of shear history.
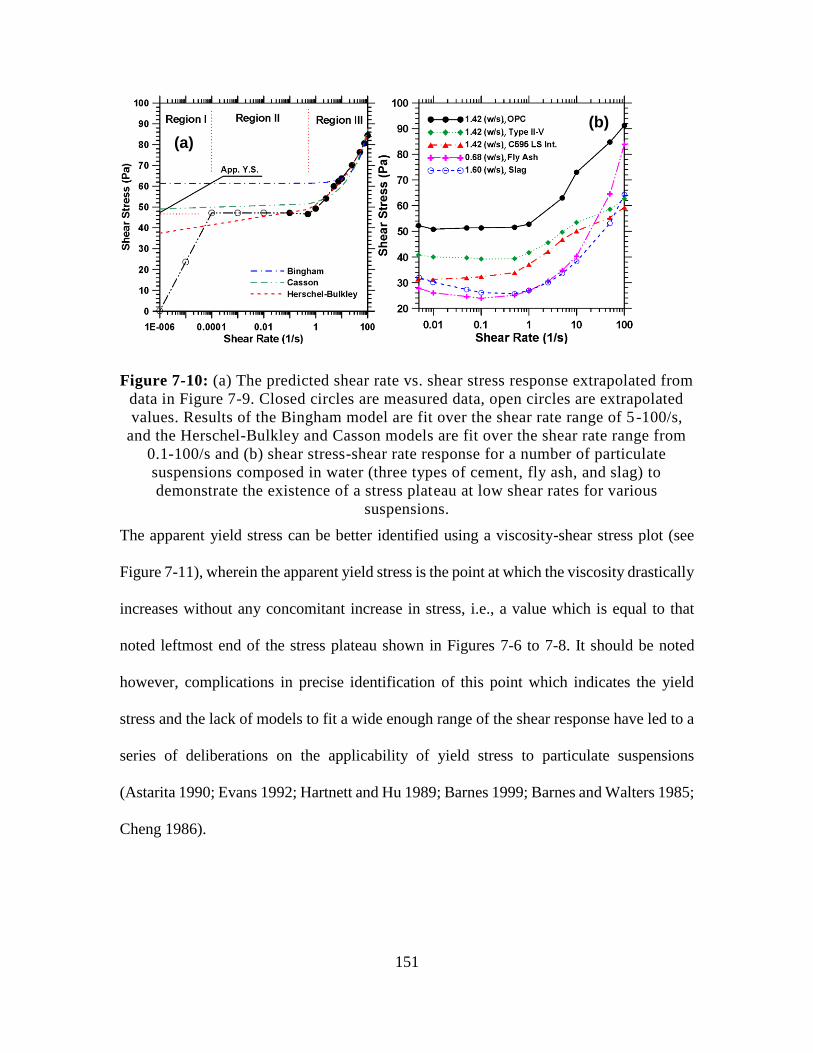
151
Figure 7-10: (a) The predicted shear rate vs. shear stress response extrapolated from
data in Figure 7-9. Closed circles are measured data, open circles are extrapolated
values. Results of the Bingham model are fit over the shear rate range of 5-100/s,
and the Herschel-Bulkley and Casson models are fit over the shear rate range from
0.1-100/s and (b) shear stress-shear rate response for a number of particulate
suspensions composed in water (three types of cement, fly ash, and slag) to
demonstrate the existence of a stress plateau at low shear rates for various
suspensions.
The apparent yield stress can be better identified using a viscosity-shear stress plot (see
Figure 7-11), wherein the apparent yield stress is the point at which the viscosity drastically
increases without any concomitant increase in stress, i.e., a value which is equal to that
noted leftmost end of the stress plateau shown in Figures 7-6 to 7-8. It should be noted
however, complications in precise identification of this point which indicates the yield
stress and the lack of models to fit a wide enough range of the shear response have led to a
series of deliberations on the applicability of yield stress to particulate suspensions
(Astarita 1990; Evans 1992; Hartnett and Hu 1989; Barnes 1999; Barnes and Walters 1985;
Cheng 1986).
(a)
(b)
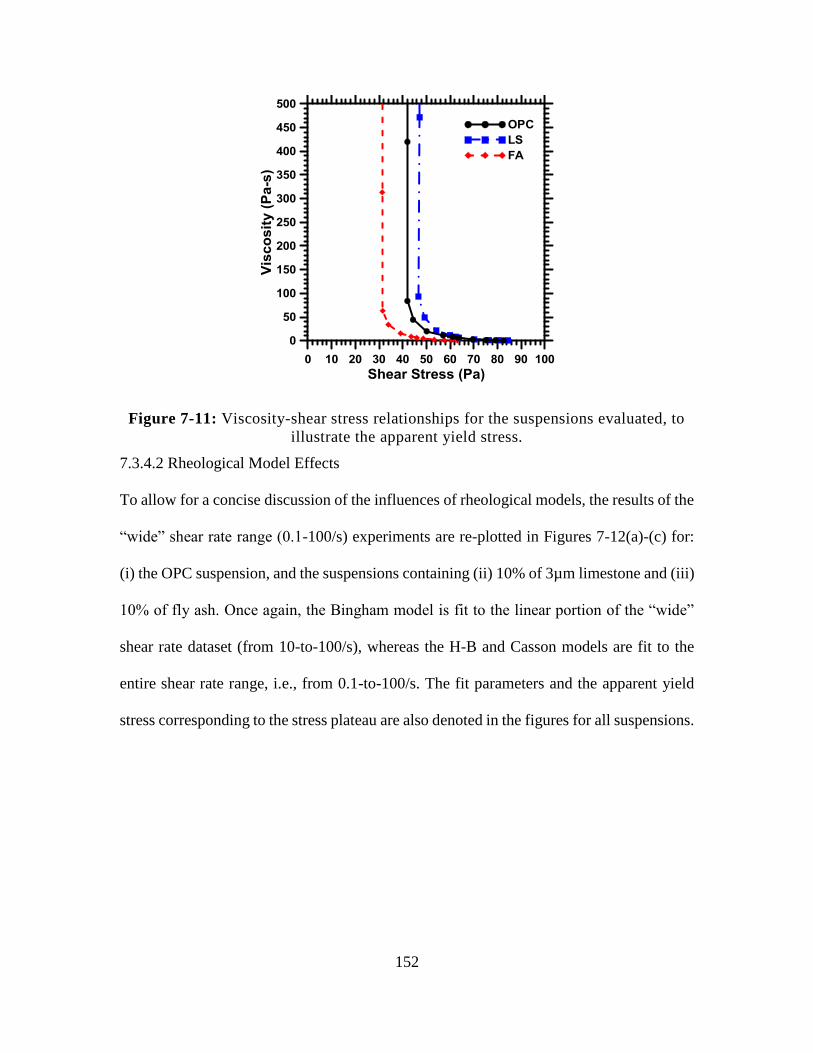
152
Figure 7-11: Viscosity-shear stress relationships for the suspensions evaluated, to
illustrate the apparent yield stress.
7.3.4.2 Rheological Model Effects
To allow for a concise discussion of the influences of rheological models, the results of the
“wide” shear rate range (0.1-100/s) experiments are re-plotted in Figures 7-12(a)-(c) for:
(i) the OPC suspension, and the suspensions containing (ii) 10% of 3µm limestone and (iii)
10% of fly ash. Once again, the Bingham model is fit to the linear portion of the “wide”
shear rate dataset (from 10-to-100/s), whereas the H-B and Casson models are fit to the
entire shear rate range, i.e., from 0.1-to-100/s. The fit parameters and the apparent yield
stress corresponding to the stress plateau are also denoted in the figures for all suspensions.
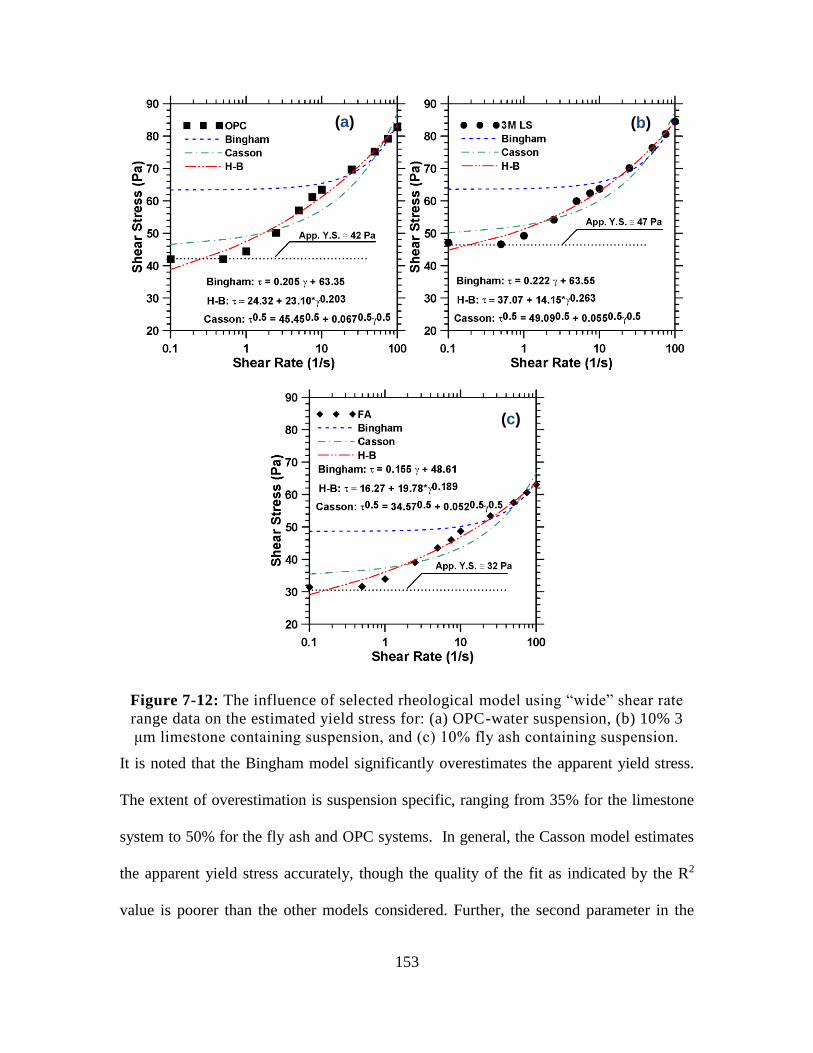
153
Figure 7-12: The influence of selected rheological model using “wide” shear rate
range data on the estimated yield stress for: (a) OPC-water suspension, (b) 10% 3
μm limestone containing suspension, and (c) 10% fly ash containing suspension.
It is noted that the Bingham model significantly overestimates the apparent yield stress.
The extent of overestimation is suspension specific, ranging from 35% for the limestone
system to 50% for the fly ash and OPC systems. In general, the Casson model estimates
the apparent yield stress accurately, though the quality of the fit as indicated by the R2
value is poorer than the other models considered. Further, the second parameter in the
(a) (b)
(c)
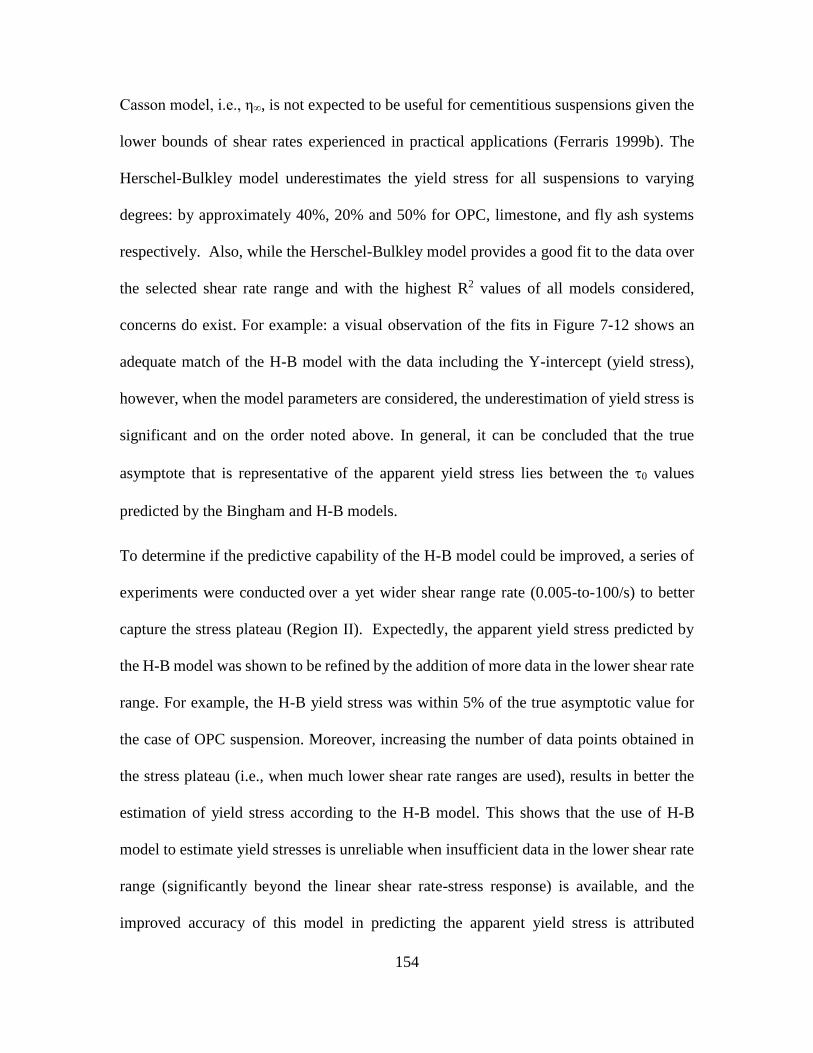
154
Casson model, i.e., η∞, is not expected to be useful for cementitious suspensions given the
lower bounds of shear rates experienced in practical applications (Ferraris 1999b). The
Herschel-Bulkley model underestimates the yield stress for all suspensions to varying
degrees: by approximately 40%, 20% and 50% for OPC, limestone, and fly ash systems
respectively. Also, while the Herschel-Bulkley model provides a good fit to the data over
the selected shear rate range and with the highest R2 values of all models considered,
concerns do exist. For example: a visual observation of the fits in Figure 7-12 shows an
adequate match of the H-B model with the data including the Y-intercept (yield stress),
however, when the model parameters are considered, the underestimation of yield stress is
significant and on the order noted above. In general, it can be concluded that the true
asymptote that is representative of the apparent yield stress lies between the 0 values
predicted by the Bingham and H-B models.
To determine if the predictive capability of the H-B model could be improved, a series of
experiments were conducted over a yet wider shear range rate (0.005-to-100/s) to better
capture the stress plateau (Region II). Expectedly, the apparent yield stress predicted by
the H-B model was shown to be refined by the addition of more data in the lower shear rate
range. For example, the H-B yield stress was within 5% of the true asymptotic value for
the case of OPC suspension. Moreover, increasing the number of data points obtained in
the stress plateau (i.e., when much lower shear rate ranges are used), results in better the
estimation of yield stress according to the H-B model. This shows that the use of H-B
model to estimate yield stresses is unreliable when insufficient data in the lower shear rate
range (significantly beyond the linear shear rate-stress response) is available, and the
improved accuracy of this model in predicting the apparent yield stress is attributed
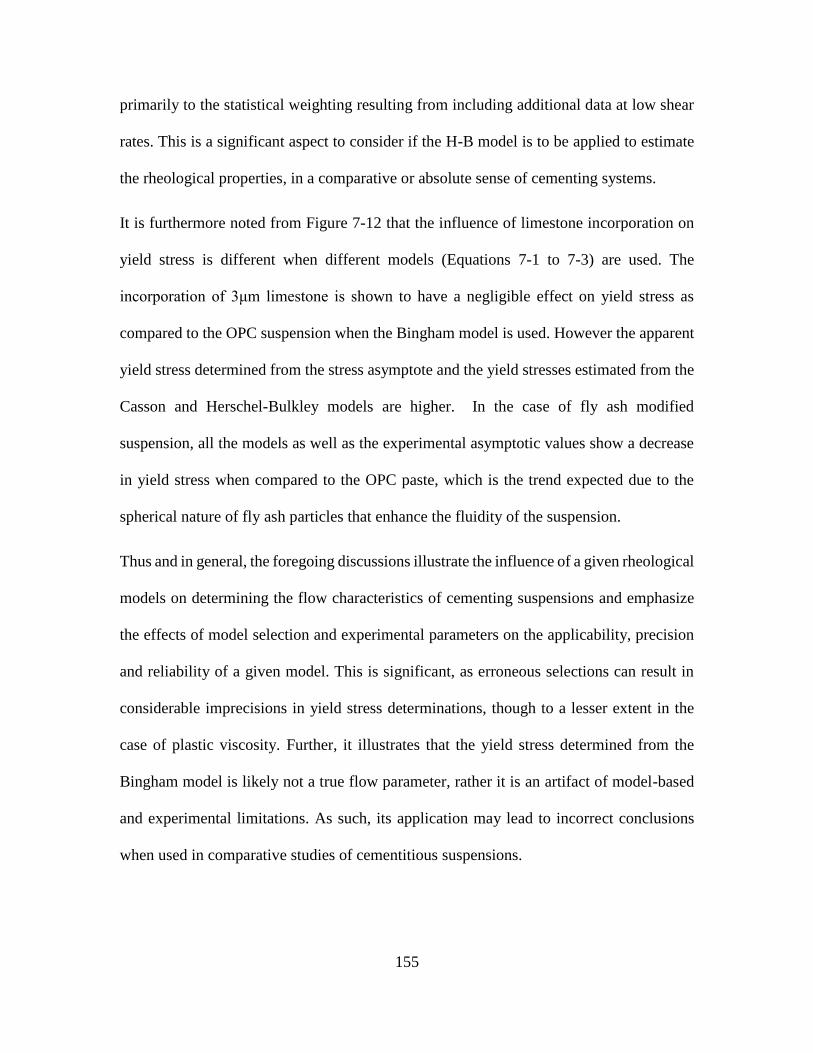
155
primarily to the statistical weighting resulting from including additional data at low shear
rates. This is a significant aspect to consider if the H-B model is to be applied to estimate
the rheological properties, in a comparative or absolute sense of cementing systems.
It is furthermore noted from Figure 7-12 that the influence of limestone incorporation on
yield stress is different when different models (Equations 7-1 to 7-3) are used. The
incorporation of 3μm limestone is shown to have a negligible effect on yield stress as
compared to the OPC suspension when the Bingham model is used. However the apparent
yield stress determined from the stress asymptote and the yield stresses estimated from the
Casson and Herschel-Bulkley models are higher. In the case of fly ash modified
suspension, all the models as well as the experimental asymptotic values show a decrease
in yield stress when compared to the OPC paste, which is the trend expected due to the
spherical nature of fly ash particles that enhance the fluidity of the suspension.
Thus and in general, the foregoing discussions illustrate the influence of a given rheological
models on determining the flow characteristics of cementing suspensions and emphasize
the effects of model selection and experimental parameters on the applicability, precision
and reliability of a given model. This is significant, as erroneous selections can result in
considerable imprecisions in yield stress determinations, though to a lesser extent in the
case of plastic viscosity. Further, it illustrates that the yield stress determined from the
Bingham model is likely not a true flow parameter, rather it is an artifact of model-based
and experimental limitations. As such, its application may lead to incorrect conclusions
when used in comparative studies of cementitious suspensions.
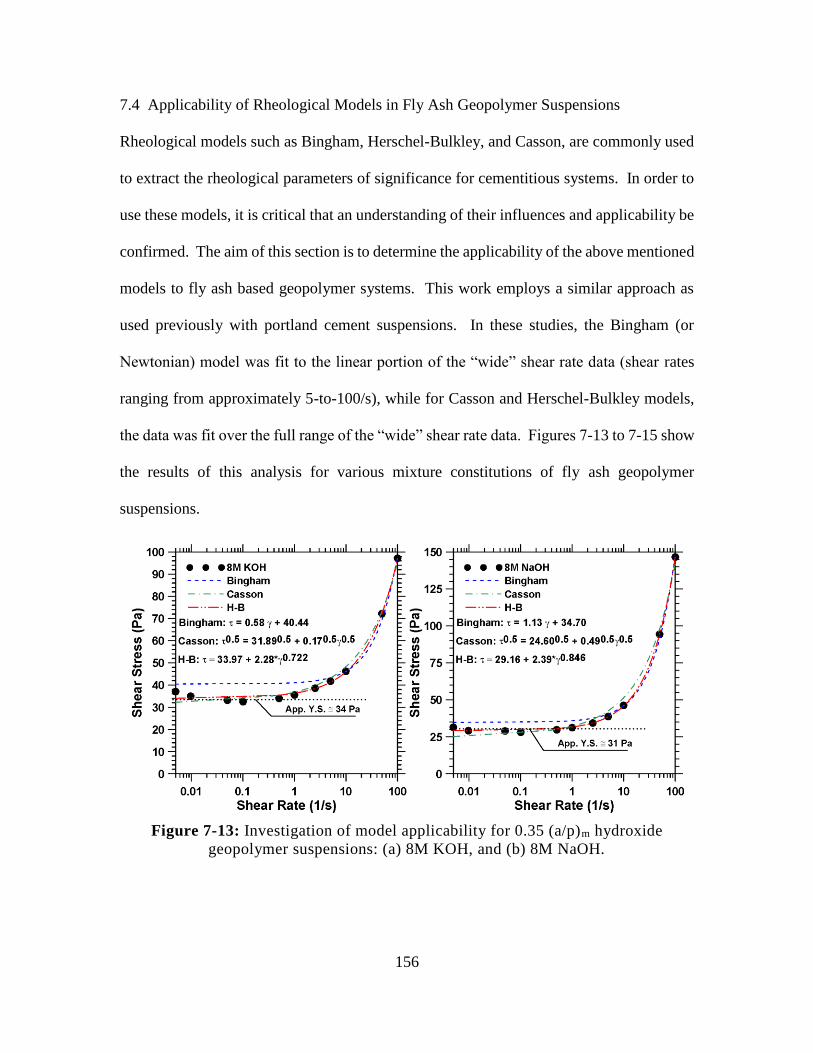
156
7.4 Applicability of Rheological Models in Fly Ash Geopolymer Suspensions
Rheological models such as Bingham, Herschel-Bulkley, and Casson, are commonly used
to extract the rheological parameters of significance for cementitious systems. In order to
use these models, it is critical that an understanding of their influences and applicability be
confirmed. The aim of this section is to determine the applicability of the above mentioned
models to fly ash based geopolymer systems. This work employs a similar approach as
used previously with portland cement suspensions. In these studies, the Bingham (or
Newtonian) model was fit to the linear portion of the “wide” shear rate data (shear rates
ranging from approximately 5-to-100/s), while for Casson and Herschel-Bulkley models,
the data was fit over the full range of the “wide” shear rate data. Figures 7-13 to 7-15 show
the results of this analysis for various mixture constitutions of fly ash geopolymer
suspensions.
Figure 7-13: Investigation of model applicability for 0.35 (a/p)m hydroxide
geopolymer suspensions: (a) 8M KOH, and (b) 8M NaOH.
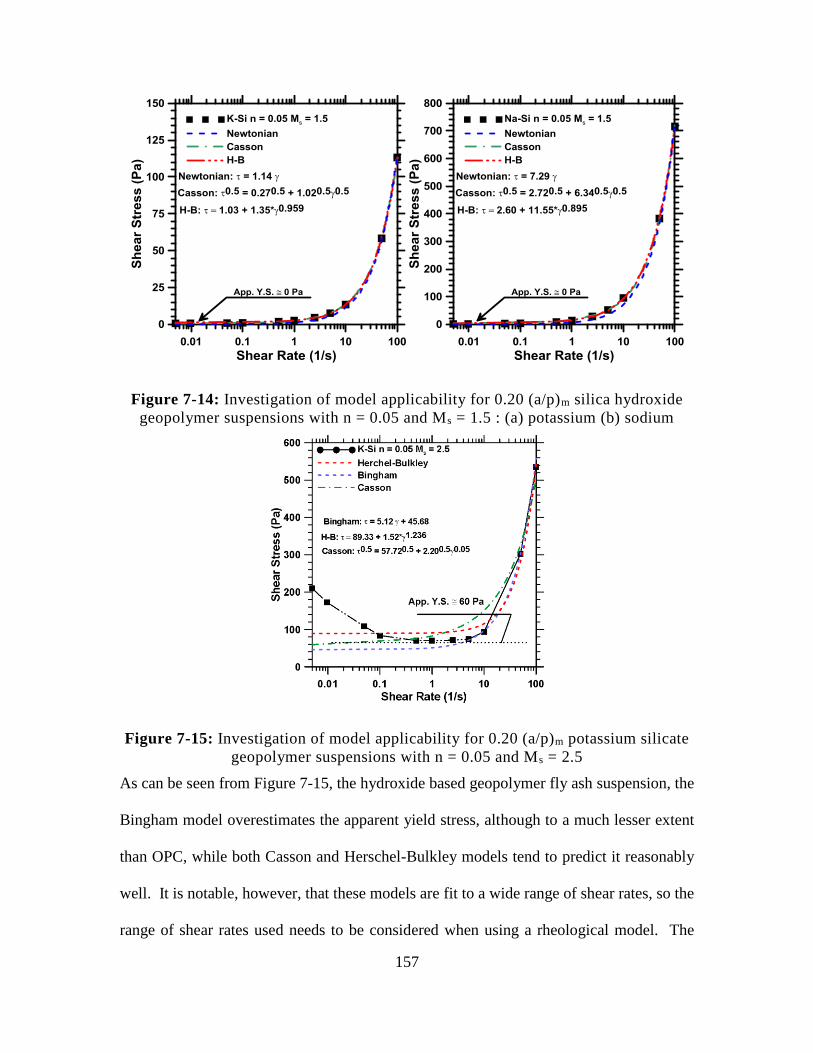
157
Figure 7-14: Investigation of model applicability for 0.20 (a/p)m silica hydroxide
geopolymer suspensions with n = 0.05 and Ms = 1.5 : (a) potassium (b) sodium
Figure 7-15: Investigation of model applicability for 0.20 (a/p)m potassium silicate
geopolymer suspensions with n = 0.05 and Ms = 2.5
As can be seen from Figure 7-15, the hydroxide based geopolymer fly ash suspension, the
Bingham model overestimates the apparent yield stress, although to a much lesser extent
than OPC, while both Casson and Herschel-Bulkley models tend to predict it reasonably
well. It is notable, however, that these models are fit to a wide range of shear rates, so the
range of shear rates used needs to be considered when using a rheological model. The
158
coefficients of determination of all of the fits in Figure 7-15 were above 0.95, indicating
that over the selected shear range all of the models provided a reasonable fit to the data.
Based on these results, given that the shear rate range includes an appropriate number of
points on the stress plateau, either the Herschel-Bulkley or the Casson model would be
appropriate for the determination of yield stress. It is notable, that neither of these models
provide an estimation of plastic viscosity, which may be a good indicator of the flowability
of a suspension, thus given the shear rates commonly experienced by cementitious systems
in mixing, determination of plastic viscosity (slope of the line) over the linear portion of
the “wide” data is proposed to be a reasonable method for determining plastic viscosity.
7.5 Conclusions
This paper has presented a detailed study on the influence of experimental parameters and
models on the rheological response of cement suspensions. The major findings of this study
are:
An increase in the Bingham yield stress and decrease in plastic viscosity was
observed with increasing gap, attributable to changes in the local particle density
and influence of increased particle contacts with the shearing surface. Increasing
surface roughness (i.e., for the range studied), resulted in little change in the
Bingham yield stress and increasing plastic viscosity.
The shear history imparted to the paste through mixing was found to significantly
influence the yield stress and plastic viscosity. With increasing mixing intensity,
the plastic viscosity was noted to decrease due to the effectiveness of the mixing
procedure in reducing the tendency of agglomeration in the paste.
159
Modifying the shear rate range in the rheological experiments to include more data
points at lower shear rates (0.5/s) revealed the existence of a well-defined shear
stress plateau. This corresponds to a drastic increase in apparent viscosity with
minimal increase in stress, and this value of the shear stress is recommended to be
used as the apparent yield stress of the suspension. Significantly, such evaluations
facilitate the model-less extraction of yield stress. However, plastic viscosities
estimated as the slope of the line fit to the linear region of the shear stress-shear rate
stress response were noted to be less influenced by shear rate effects.
The influences and artifacts of the rheological model used in extraction of the
apparent yield stress are highlighted. When compared to the value at the stress
plateau, the Bingham and H-B models, overestimate and underestimate
respectively, the apparent yield stress of a given cementitious suspension. The
prediction of the Casson model was noted to be more accurate, but at the cost of a
slightly poorer mathematical fit to the rheological dataset. The yield stress
estimated by H-B model was found to be comparable to the (true) apparent yield
stress noted from the shear stress asymptote when rheological evaluations were
extended to much lower shear rates. This improvement is a function of the statistical
weighting in the least squares fit, rather than an indicator of the H-B model to
comprehensively estimation the flow response.
160
8. RHEOLOGICAL EVALUATION OF INTERGROUND AND BLENDED
LIMESTONE-PORTLAND CEMENT SUSPENSIONS
8.1 Introduction
There continues to be a growing interest in the use of limestone as a cement replacement
material to enhance portland cement concrete sustainability, acting as a filler by increasing
particle packing and offsetting unhydrated cement in low water-to-cement concretes (V.
Bonavetti et al. 2003), a location for cement hydration product nucleation (Caldarone and
Zemajtis 2008; D. Bentz et al. 2009a; Hawkins, Tennis, and Detwiler 2003), and reacting
to some extent with the aluminate phases in cements (De Weerdt, Haha, et al. 2011;
Lothenbach et al. 2008). There are currently two strategies for replacing limestone by
portland cement: (i) intergrinding the limestone with the clinker in a ball mill and (ii)
mechanical mixing or blending of the cement with limestone. Blending of the limestone
with portland cement will maintain the particle size distributions of the limestone and the
portland cement in the composite mixture, while intergrinding limestone with portland
cement clinker will result in a composite system where the two phases have differing
particle size distributions. As limestone is known to be a softer material than clinker,
intergrinding results in a limestone phase that is less fine than the clinker phase (Tsivilis,
Voglis, and Photou 1999; Ludmilla Opoczky 1996), while blending will produce a PLC
mix with a particle size distribution that is an average composition of the components
included. Several studies have investigated the influence of limestone on the rheological
performance of portland cement suspensions, including (Sakai et al. 2009; Mikanovic and
Jolicoeur 2008; Hedda Vikan and Justnes 2007), and the work completed in Chapter 6.
These studies have investigated the influence of fineness, superplasticizers, and
161
replacement ratio on the rheology of these systems. However, due to the fact that the
limestone sizes that are either coarser or finer than OPC, the behavior of limestone in these
systems is difficult to discern as it is confounded with the effects of changes in particle
surface area and particle packing.
The current study aims to disconnect these two effects in exploring the exact nature of
limestone in cementitious suspensions. Particle size distribution matched limestone is used
in this study to minimize or eliminate these effects, making the exact influence of limestone
on rheological performance clear, as well as allowing for the determination of causation of
these effects. Rheological characterization of cementitious suspensions is commonly
completed using strain or stress growth experiments, resulting in flow diagrams of the
cement. From these diagrams, key rheological parameters such as apparent yield stress
and plastic viscosity are extracted. The apparent yield stress is indicated by a non-zero
stress at a zero strain rate and the plastic viscosity is a measure of the strain rate increase
required for a unit increase in stress. The current work determines the apparent yield stress
using the stress plateau method presented in (Barnes 1999) and in Chapter 7, and the plastic
viscosity from the linear portion of the flow curve. The apparent yield stress has been
shown to be primarily influenced by particle effects, such as jamming, particle spacing,
surface area and roughness (D. P. Bentz et al. 2012; Erdoğan et al. 2008) and Chapter 6,
and interparticle dispersion forces (van der Waals and electrostatic repulsive forces) (Flatt
2004; Mikanovic et al. 2006). The interaction potential between particles in a colloidal
suspension is governed by DLVO theory (named for Derjaguin, Landau, Verwey, and
Overbeek), which states there are competing effects of electrostatic repulsive forces.
Electrostatic repulsive forces originate from the adsorbed ions in the diffuse layer of the
162
electric double layer (EDL). Wherein the EDL is defined by an inner stern layer of tightly
held ions with opposite charge of the surface of the particle and the more weakly held ions
in the diffuse outer layer with ions with the same charge as the particle surface. The
electrostatic repulsive effects have been shown to be proportional to exp[-κ(r-2a)] (Hunter
and White 1987; Neubauer, Yang, and Jennings 1998), where r is the distance from the
center of the particle, κ is the Debye length, and a is the particle diameter. Van der waals
forces, on the other hand have been shown to be proportional to 1/r2, and thus do not fall
off as quickly as electrostatic repulsive forces. Further, it is noted that van der Waals forces
between the same material are always attractive, while between two different materials
they may be repulsive. Above a certain particle concentration, called the coagulation limit,
the effect of the attractive forces dominate over the electrostatic repulsive forces, and it has
been shown the cementitious suspensions are commonly above this limit (Neubauer, Yang,
and Jennings 1998; Yang, Neubauer, and Jennings 1997). Though cementitious
suspensions have larger particles than would generally be considered colloidal, the DLVO
theory is likely still applicable. Further, the influence of Brownian motion in cementitious
suspensions is likely minimal due to the relative size of the particles present in the
suspension. The plastic viscosity, on the other hand, is more strongly influenced by solid
loading and particle separation, as it is a measure of resistance to flow once it has
commenced.
8.2 Experimental Program
8.2.1 Materials
Two Interground PLCs were used in this study, one conforming to ASTM C1157 (“ASTM
C1157/C1157M-11 Standard Performance Specification for Hydraulic Cement” 2013) and
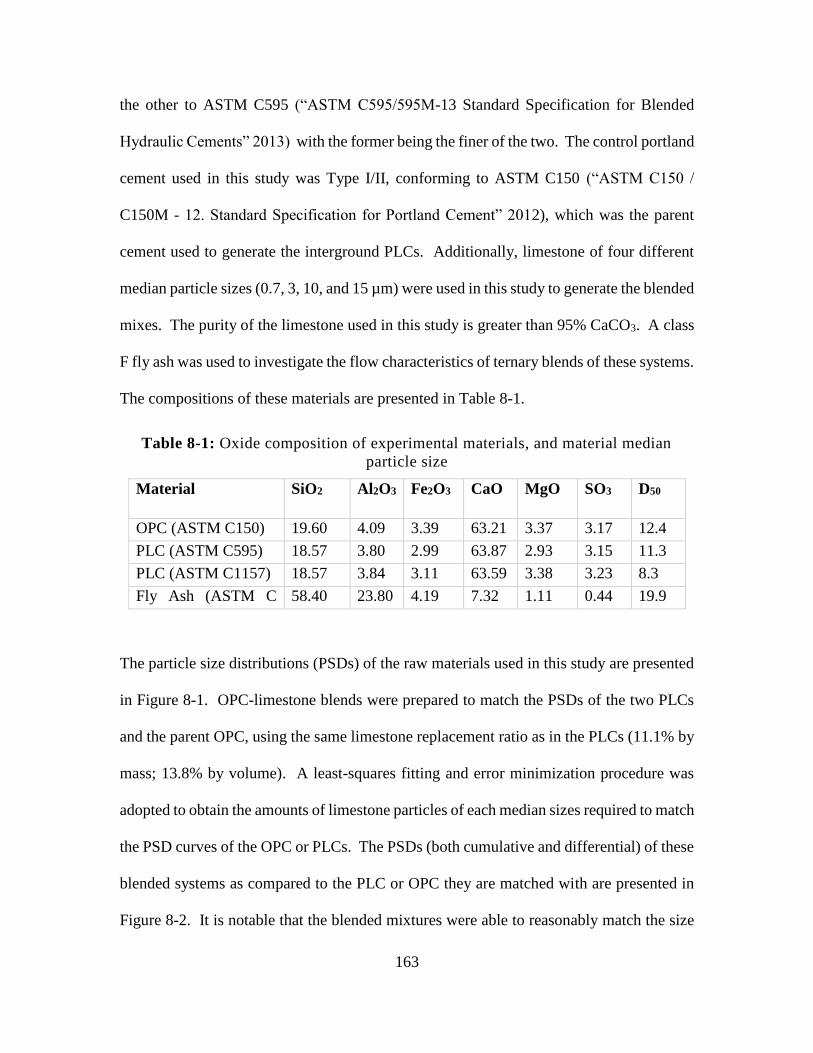
163
the other to ASTM C595 (“ASTM C595/595M-13 Standard Specification for Blended
Hydraulic Cements” 2013) with the former being the finer of the two. The control portland
cement used in this study was Type I/II, conforming to ASTM C150 (“ASTM C150 /
C150M - 12. Standard Specification for Portland Cement” 2012), which was the parent
cement used to generate the interground PLCs. Additionally, limestone of four different
median particle sizes (0.7, 3, 10, and 15 µm) were used in this study to generate the blended
mixes. The purity of the limestone used in this study is greater than 95% CaCO3. A class
F fly ash was used to investigate the flow characteristics of ternary blends of these systems.
The compositions of these materials are presented in Table 8-1.
Table 8-1: Oxide composition of experimental materials, and material median
particle size
Material SiO2
(%)
Al2O3
(%)
Fe2O3
(%)
CaO
(%)
MgO
(%)
SO3
(%)
D50
(µm) OPC (ASTM C150) 19.60 4.09 3.39 63.21 3.37 3.17 12.4
PLC (ASTM C595) 18.57 3.80 2.99 63.87 2.93 3.15 11.3
PLC (ASTM C1157) 18.57 3.84 3.11 63.59 3.38 3.23 8.3
Fly Ash (ASTM C
618)
58.40 23.80 4.19 7.32 1.11 0.44 19.9
The particle size distributions (PSDs) of the raw materials used in this study are presented
in Figure 8-1. OPC-limestone blends were prepared to match the PSDs of the two PLCs
and the parent OPC, using the same limestone replacement ratio as in the PLCs (11.1% by
mass; 13.8% by volume). A least-squares fitting and error minimization procedure was
adopted to obtain the amounts of limestone particles of each median sizes required to match
the PSD curves of the OPC or PLCs. The PSDs (both cumulative and differential) of these
blended systems as compared to the PLC or OPC they are matched with are presented in
Figure 8-2. It is notable that the blended mixtures were able to reasonably match the size
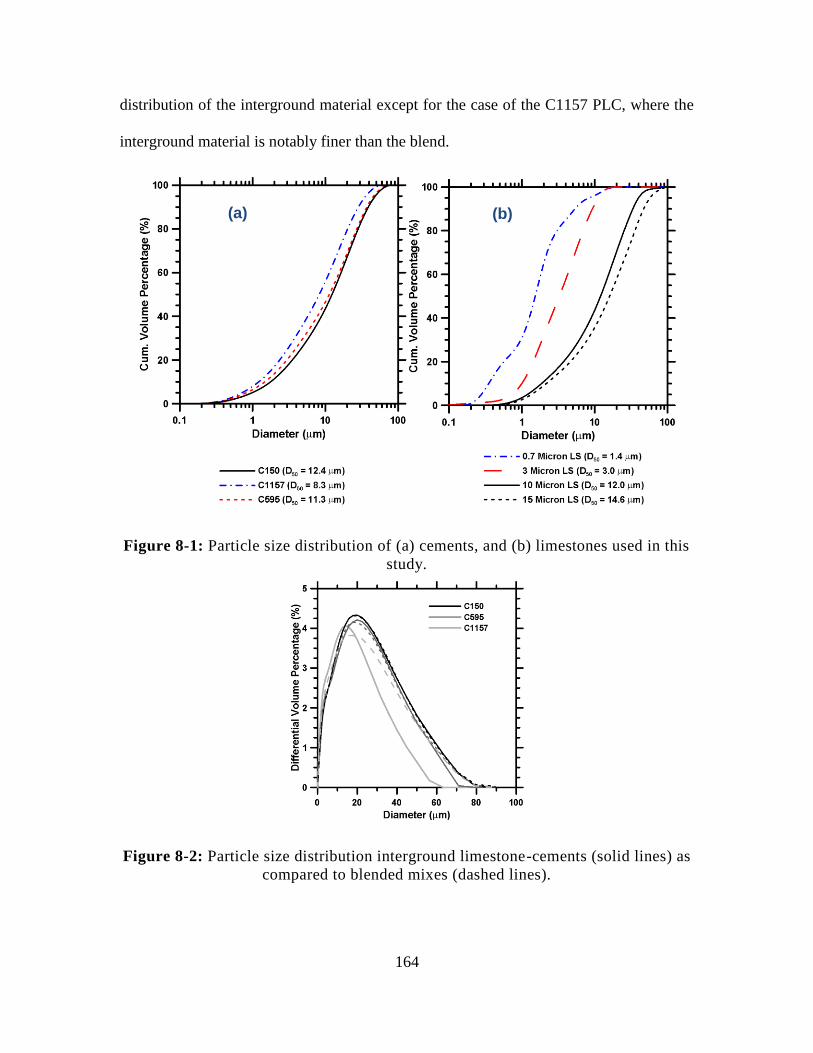
164
distribution of the interground material except for the case of the C1157 PLC, where the
interground material is notably finer than the blend.
Figure 8-1: Particle size distribution of (a) cements, and (b) limestones used in this
study.
Figure 8-2: Particle size distribution interground limestone-cements (solid lines) as
compared to blended mixes (dashed lines).
(b) (a)
165
8.2.2 Experimental Parameters
Suspensions were prepared using a constant volumetric water-to-solids ratio (w/s) of 1.42,
which corresponds to a mass based w/s ratio of 0.45 for OPC suspensions, and a slightly
higher mass-based w/s for blends of limestone or fly ash due to the lower specific gravity
of these replacement materials. The constant volumetric ratio was used as the flow
behavior of concentrated suspensions is heavily influenced by the volume fraction of solids
(Chong, Christiansen, and Baer 2003; Jeffrey and Acrivos 1976). The specimens were
mixed in accordance with ASTM C1738 (“ASTM C1738 - 11a. Standard Practice for High-
Shear Mixing of Hydraulic Cement Paste” 2011), using a low shear rate of 5000 RPM for
initial mixing, followed by a 30 second period at a high shear rate of 12000 RPM, a two
minute covered rest period, and a 90 second final mixing at the high shear rate.
Two different rheological experiments were conducted as part of this study, the first a
typical shear rate ramp study similar to the one developed in Chapter 7, using the parallel
plate configuration, and the second a stress growth, low-amplitude oscillatory shear study
using a concentric cylinder configuration. Both studies were completed with a TA
Instruments AR 2000EX stress controlled dynamic shear rheometer, and rheological
parameters (stress, strain rate, storage modulus, and loss modulus) were extracted using the
TA Instruments Trios software package. The shear rate ramp study was conducted using a
50 mm parallel plate configuration with the Peltier plate conditioned to a surface
temperature of 25±0.1 °C. The surface of the upper geometry was serrated to a depth of
1mm and the surface of the lower geometry (Peltier cover plate) was serrated to a depth of
0.15 mm to prevent slip at the shearing surface. Slip causes local particle concentration
changes near the shearing surface, potentially resulting in significant underestimation of
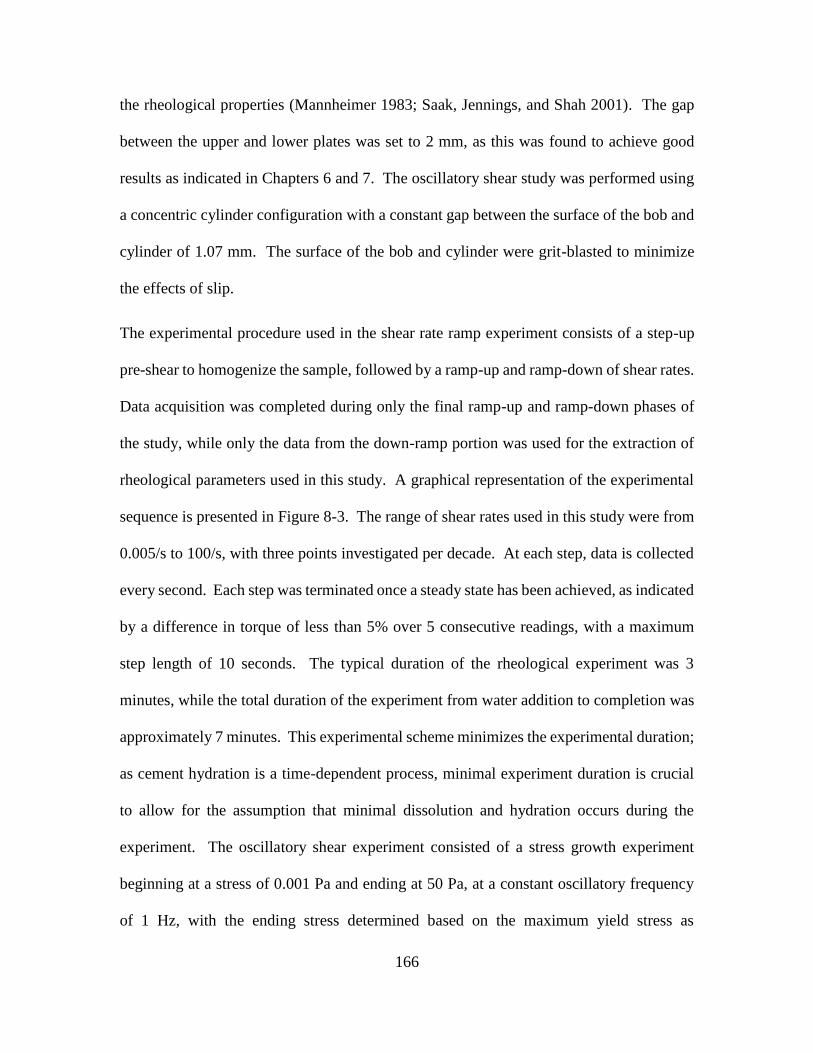
166
the rheological properties (Mannheimer 1983; Saak, Jennings, and Shah 2001). The gap
between the upper and lower plates was set to 2 mm, as this was found to achieve good
results as indicated in Chapters 6 and 7. The oscillatory shear study was performed using
a concentric cylinder configuration with a constant gap between the surface of the bob and
cylinder of 1.07 mm. The surface of the bob and cylinder were grit-blasted to minimize
the effects of slip.
The experimental procedure used in the shear rate ramp experiment consists of a step-up
pre-shear to homogenize the sample, followed by a ramp-up and ramp-down of shear rates.
Data acquisition was completed during only the final ramp-up and ramp-down phases of
the study, while only the data from the down-ramp portion was used for the extraction of
rheological parameters used in this study. A graphical representation of the experimental
sequence is presented in Figure 8-3. The range of shear rates used in this study were from
0.005/s to 100/s, with three points investigated per decade. At each step, data is collected
every second. Each step was terminated once a steady state has been achieved, as indicated
by a difference in torque of less than 5% over 5 consecutive readings, with a maximum
step length of 10 seconds. The typical duration of the rheological experiment was 3
minutes, while the total duration of the experiment from water addition to completion was
approximately 7 minutes. This experimental scheme minimizes the experimental duration;
as cement hydration is a time-dependent process, minimal experiment duration is crucial
to allow for the assumption that minimal dissolution and hydration occurs during the
experiment. The oscillatory shear experiment consisted of a stress growth experiment
beginning at a stress of 0.001 Pa and ending at 50 Pa, at a constant oscillatory frequency
of 1 Hz, with the ending stress determined based on the maximum yield stress as
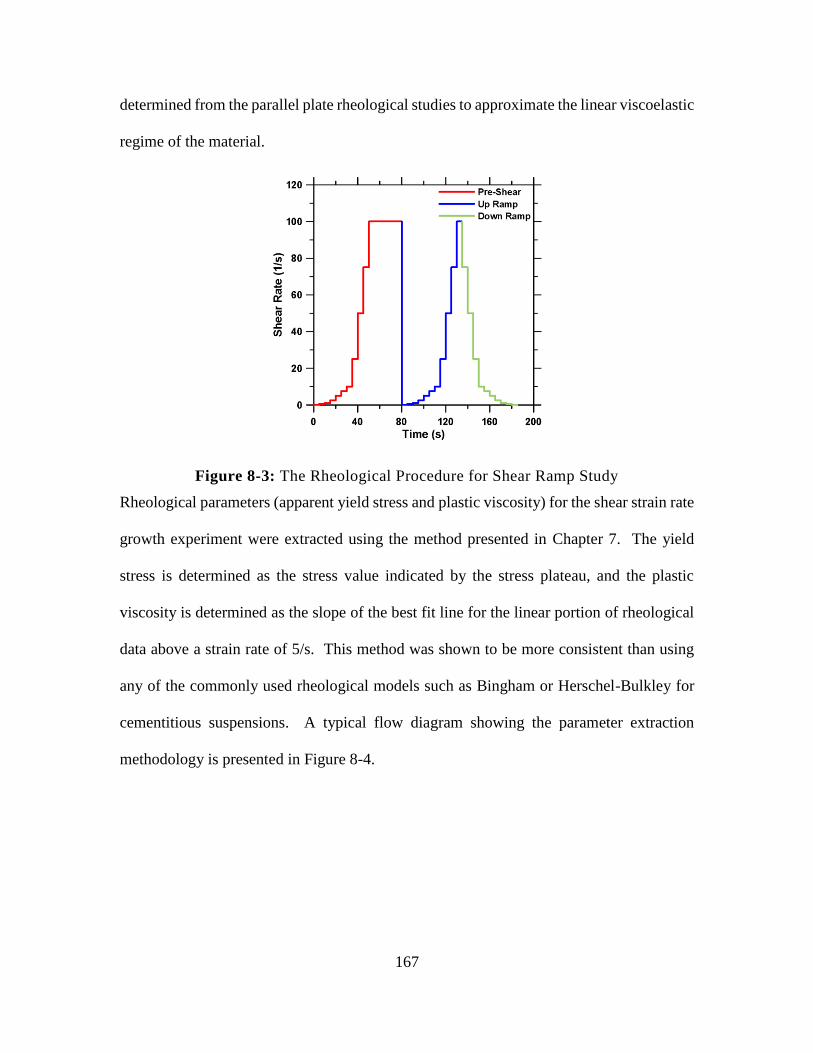
167
determined from the parallel plate rheological studies to approximate the linear viscoelastic
regime of the material.
Figure 8-3: The Rheological Procedure for Shear Ramp Study
Rheological parameters (apparent yield stress and plastic viscosity) for the shear strain rate
growth experiment were extracted using the method presented in Chapter 7. The yield
stress is determined as the stress value indicated by the stress plateau, and the plastic
viscosity is determined as the slope of the best fit line for the linear portion of rheological
data above a strain rate of 5/s. This method was shown to be more consistent than using
any of the commonly used rheological models such as Bingham or Herschel-Bulkley for
cementitious suspensions. A typical flow diagram showing the parameter extraction
methodology is presented in Figure 8-4.
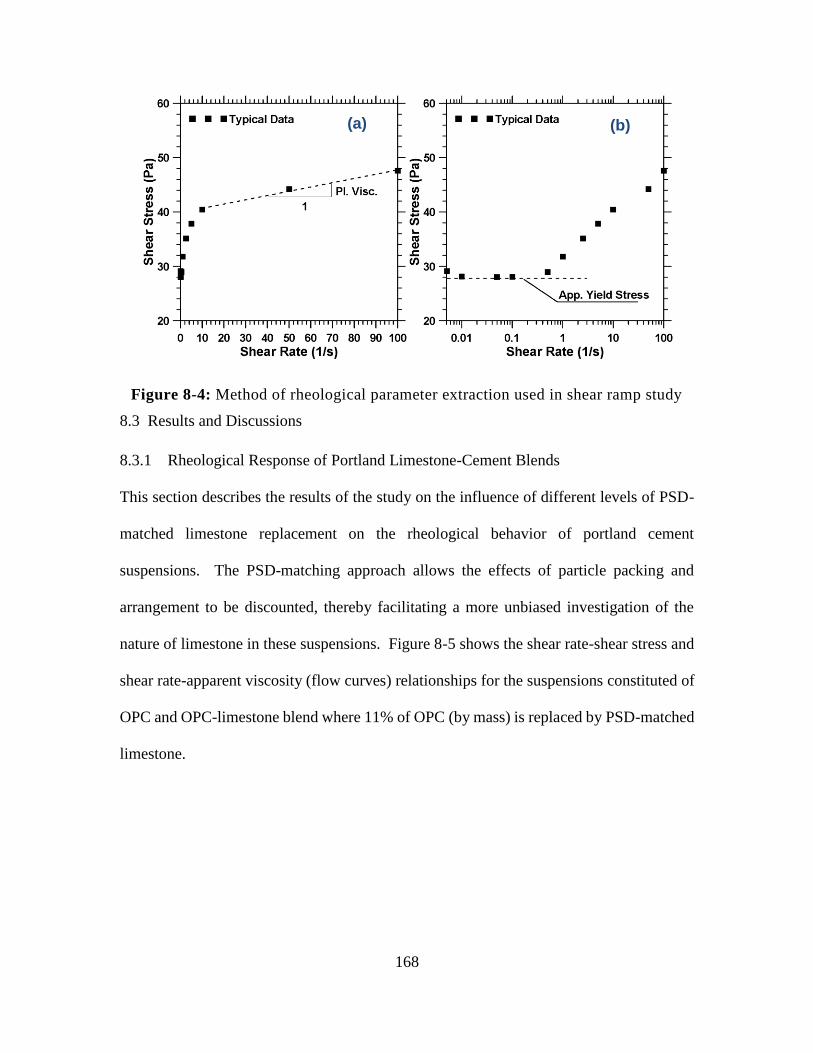
168
Figure 8-4: Method of rheological parameter extraction used in shear ramp study
8.3 Results and Discussions
8.3.1 Rheological Response of Portland Limestone-Cement Blends
This section describes the results of the study on the influence of different levels of PSD-
matched limestone replacement on the rheological behavior of portland cement
suspensions. The PSD-matching approach allows the effects of particle packing and
arrangement to be discounted, thereby facilitating a more unbiased investigation of the
nature of limestone in these suspensions. Figure 8-5 shows the shear rate-shear stress and
shear rate-apparent viscosity (flow curves) relationships for the suspensions constituted of
OPC and OPC-limestone blend where 11% of OPC (by mass) is replaced by PSD-matched
limestone.
(b) (a)
169
Figure 8-5: Representative flow curves for OPC and OPC-limestone suspension
(OPC replacement by PSD-matched limestone 11.8% by mass)
Immediately noted from this figure is the fact that the inclusions of PSD-matched limestone
in a portland cement suspension induces minimal changes on the plastic viscosity (as noted
by the nearly parallel lines in Figure 8-5, and a reduction in the apparent yield stress of
about the same magnitude as the volumetric limestone replacement level in the system.
The rheological performance of portland cement suspensions has been shown to be
strongly influenced by solid loading, fineness and the size distribution of the particles (D.
P. Bentz et al. 2012) and Chapter 6, and the surface interaction between cement particles.
As discussed previously dispersion (van der Waals) forces exist between cement particles,
and above the coagulation limit will dominate over electrostatic repulsive forces (Lesko et
al. 2001; Gmira et al. 2004; Flatt 2004). Aqueous suspensions of calcium carbonate at a
high pH have similarly been shown to develop large dispersion forces, indicative of
coagulation (Mikanovic et al. 2006). The minimal changes in plastic viscosity in this
system suggest that these dispersion forces are less significant in the flow of suspensions
once sufficient flow has been initiated. This concept can be intuitively confirmed by
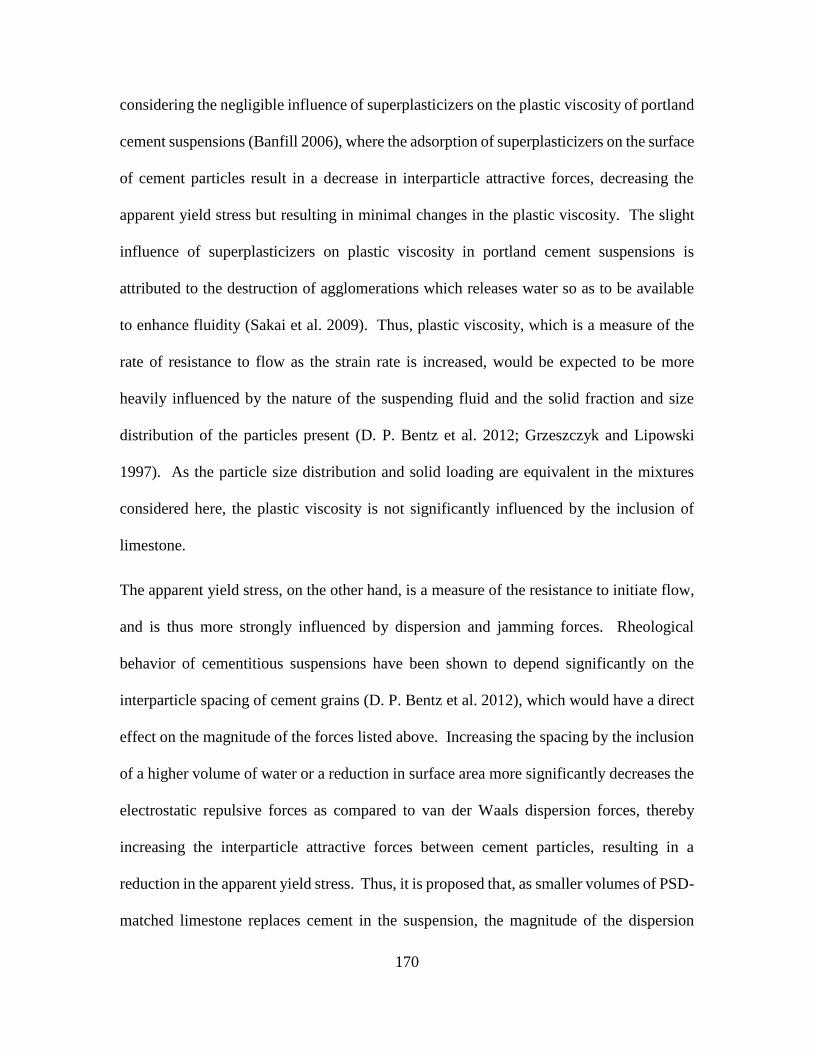
170
considering the negligible influence of superplasticizers on the plastic viscosity of portland
cement suspensions (Banfill 2006), where the adsorption of superplasticizers on the surface
of cement particles result in a decrease in interparticle attractive forces, decreasing the
apparent yield stress but resulting in minimal changes in the plastic viscosity. The slight
influence of superplasticizers on plastic viscosity in portland cement suspensions is
attributed to the destruction of agglomerations which releases water so as to be available
to enhance fluidity (Sakai et al. 2009). Thus, plastic viscosity, which is a measure of the
rate of resistance to flow as the strain rate is increased, would be expected to be more
heavily influenced by the nature of the suspending fluid and the solid fraction and size
distribution of the particles present (D. P. Bentz et al. 2012; Grzeszczyk and Lipowski
1997). As the particle size distribution and solid loading are equivalent in the mixtures
considered here, the plastic viscosity is not significantly influenced by the inclusion of
limestone.
The apparent yield stress, on the other hand, is a measure of the resistance to initiate flow,
and is thus more strongly influenced by dispersion and jamming forces. Rheological
behavior of cementitious suspensions have been shown to depend significantly on the
interparticle spacing of cement grains (D. P. Bentz et al. 2012), which would have a direct
effect on the magnitude of the forces listed above. Increasing the spacing by the inclusion
of a higher volume of water or a reduction in surface area more significantly decreases the
electrostatic repulsive forces as compared to van der Waals dispersion forces, thereby
increasing the interparticle attractive forces between cement particles, resulting in a
reduction in the apparent yield stress. Thus, it is proposed that, as smaller volumes of PSD-
matched limestone replaces cement in the suspension, the magnitude of the dispersion
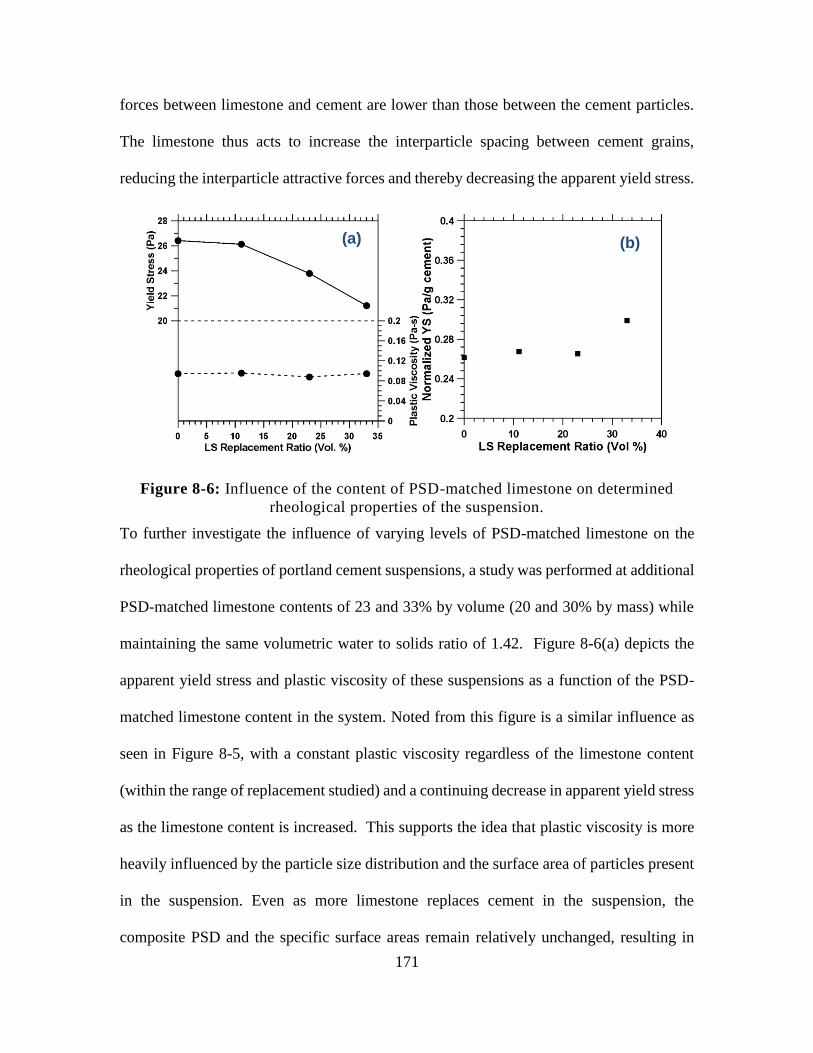
171
forces between limestone and cement are lower than those between the cement particles.
The limestone thus acts to increase the interparticle spacing between cement grains,
reducing the interparticle attractive forces and thereby decreasing the apparent yield stress.
Figure 8-6: Influence of the content of PSD-matched limestone on determined
rheological properties of the suspension.
To further investigate the influence of varying levels of PSD-matched limestone on the
rheological properties of portland cement suspensions, a study was performed at additional
PSD-matched limestone contents of 23 and 33% by volume (20 and 30% by mass) while
maintaining the same volumetric water to solids ratio of 1.42. Figure 8-6(a) depicts the
apparent yield stress and plastic viscosity of these suspensions as a function of the PSD-
matched limestone content in the system. Noted from this figure is a similar influence as
seen in Figure 8-5, with a constant plastic viscosity regardless of the limestone content
(within the range of replacement studied) and a continuing decrease in apparent yield stress
as the limestone content is increased. This supports the idea that plastic viscosity is more
heavily influenced by the particle size distribution and the surface area of particles present
in the suspension. Even as more limestone replaces cement in the suspension, the
composite PSD and the specific surface areas remain relatively unchanged, resulting in
(b) (a)
172
unchanged plastic viscosity. The apparent yield stress, on the other hand, is more strongly
influenced by dispersion forces between cement particles. These results support the
discussions above, wherein the van der Waals forces between limestone and cement
particles are significantly lower than those between cement particles, and thus increasing
the limestone content in the suspension at a constant solid loading with an unchanged PSD
results in a continued reduction in interparticle forces, and subsequent reduction in the
apparent yield stress.
Figure 8-6(b) shows the yield stress of these suspensions normalized by the mass of cement
and plotted against the volumetric limestone content. The normalized yield stress is found
to remain relatively constant at lower limestone contents, but increases as the replacement
level increases beyond a certain value. At low OPC replacement levels, cement-cement
and cement-limestone particle contacts would likely dominate. The unchanged normalized
yield stresses at lower replacement levels supports the idea that interparticle attractive
forces between limestone and cement particles is likely negligible as compared to those
between cement particles. However, as the limestone content increases further, limestone-
limestone contacts become increasingly prevalent. It has been shown that suspensions of
limestone result in similar dispersion forces as suspensions of cement (Mikanovic et al.
2006), and when the limestone-limestone contacts in the suspension become more
prevalent, the normalized apparent yield stress increases.
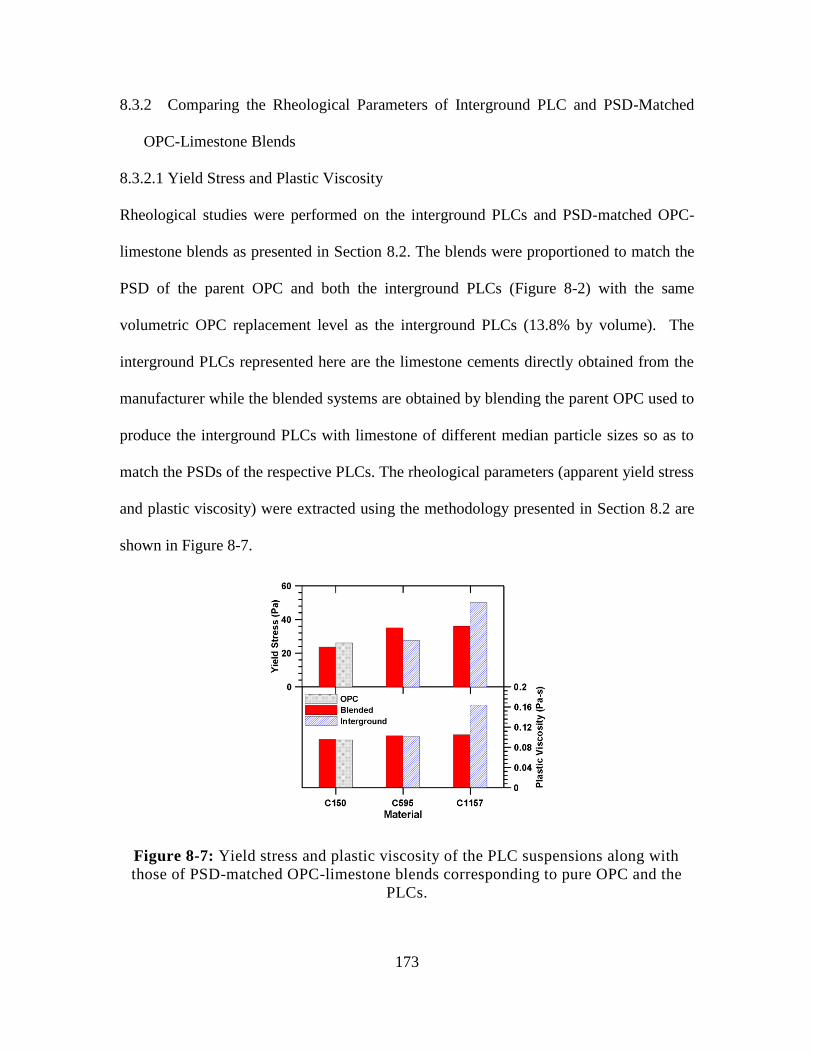
173
8.3.2 Comparing the Rheological Parameters of Interground PLC and PSD-Matched
OPC-Limestone Blends
8.3.2.1 Yield Stress and Plastic Viscosity
Rheological studies were performed on the interground PLCs and PSD-matched OPC-
limestone blends as presented in Section 8.2. The blends were proportioned to match the
PSD of the parent OPC and both the interground PLCs (Figure 8-2) with the same
volumetric OPC replacement level as the interground PLCs (13.8% by volume). The
interground PLCs represented here are the limestone cements directly obtained from the
manufacturer while the blended systems are obtained by blending the parent OPC used to
produce the interground PLCs with limestone of different median particle sizes so as to
match the PSDs of the respective PLCs. The rheological parameters (apparent yield stress
and plastic viscosity) were extracted using the methodology presented in Section 8.2 are
shown in Figure 8-7.
Figure 8-7: Yield stress and plastic viscosity of the PLC suspensions along with
those of PSD-matched OPC-limestone blends corresponding to pure OPC and the
PLCs.
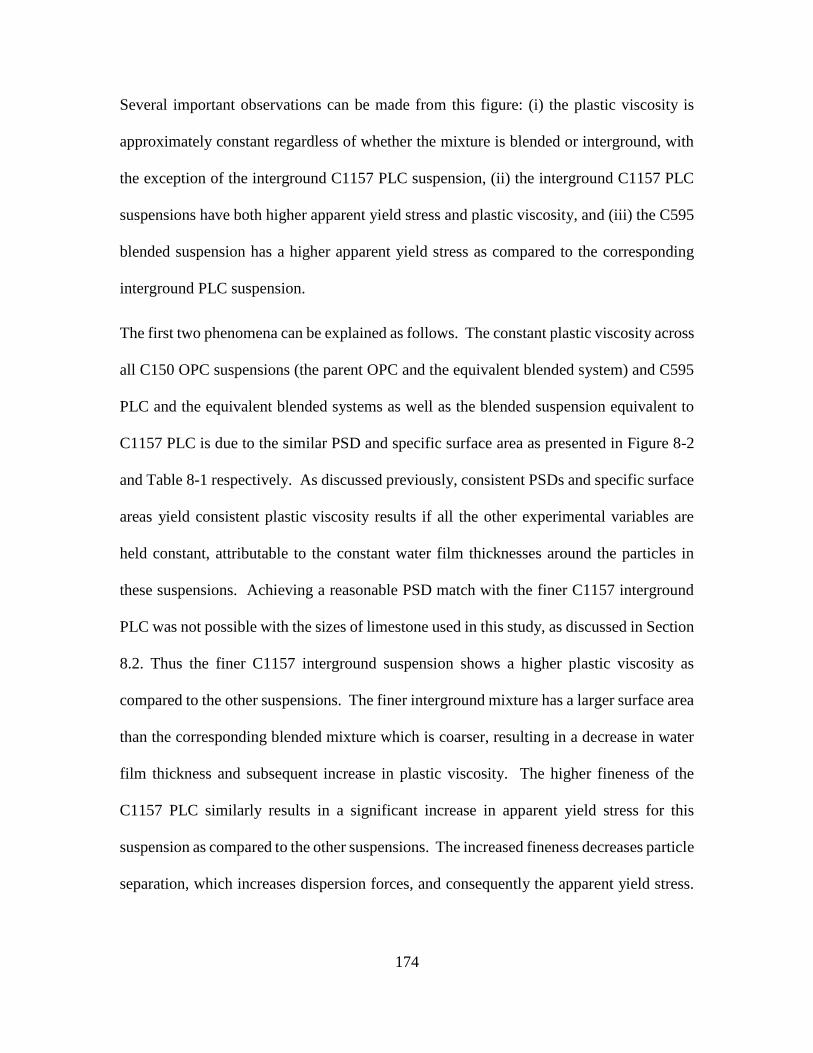
174
Several important observations can be made from this figure: (i) the plastic viscosity is
approximately constant regardless of whether the mixture is blended or interground, with
the exception of the interground C1157 PLC suspension, (ii) the interground C1157 PLC
suspensions have both higher apparent yield stress and plastic viscosity, and (iii) the C595
blended suspension has a higher apparent yield stress as compared to the corresponding
interground PLC suspension.
The first two phenomena can be explained as follows. The constant plastic viscosity across
all C150 OPC suspensions (the parent OPC and the equivalent blended system) and C595
PLC and the equivalent blended systems as well as the blended suspension equivalent to
C1157 PLC is due to the similar PSD and specific surface area as presented in Figure 8-2
and Table 8-1 respectively. As discussed previously, consistent PSDs and specific surface
areas yield consistent plastic viscosity results if all the other experimental variables are
held constant, attributable to the constant water film thicknesses around the particles in
these suspensions. Achieving a reasonable PSD match with the finer C1157 interground
PLC was not possible with the sizes of limestone used in this study, as discussed in Section
8.2. Thus the finer C1157 interground suspension shows a higher plastic viscosity as
compared to the other suspensions. The finer interground mixture has a larger surface area
than the corresponding blended mixture which is coarser, resulting in a decrease in water
film thickness and subsequent increase in plastic viscosity. The higher fineness of the
C1157 PLC similarly results in a significant increase in apparent yield stress for this
suspension as compared to the other suspensions. The increased fineness decreases particle
separation, which increases dispersion forces, and consequently the apparent yield stress.
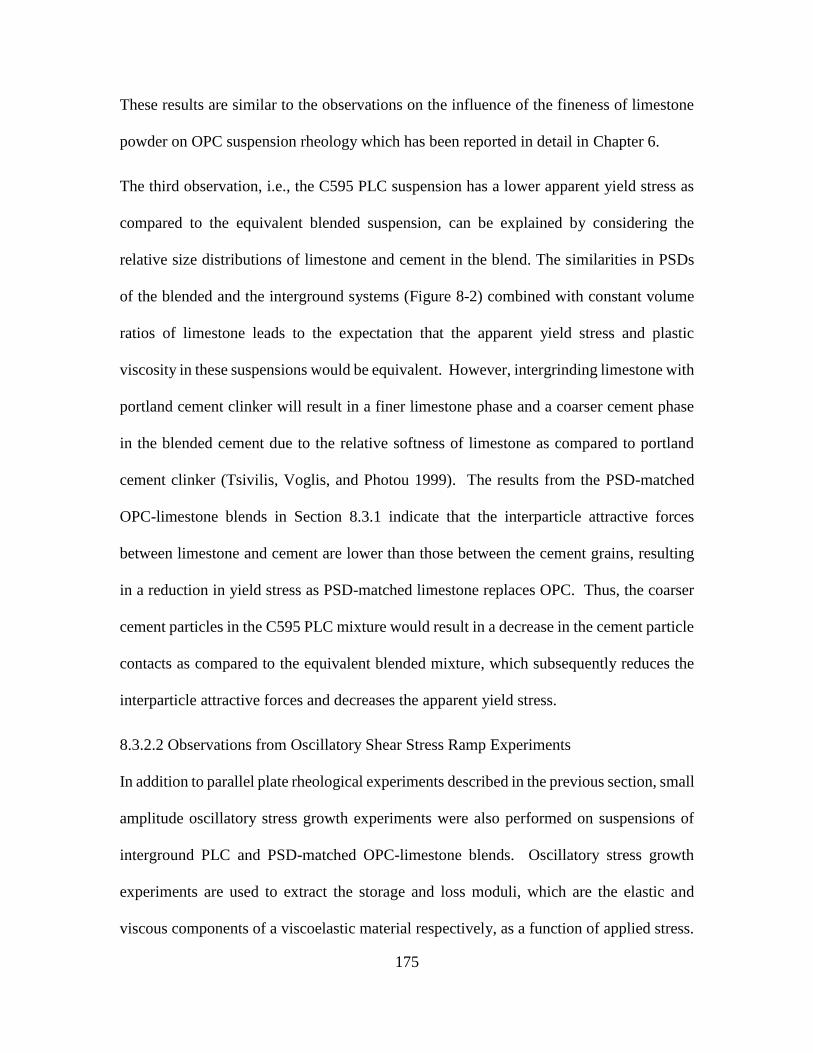
175
These results are similar to the observations on the influence of the fineness of limestone
powder on OPC suspension rheology which has been reported in detail in Chapter 6.
The third observation, i.e., the C595 PLC suspension has a lower apparent yield stress as
compared to the equivalent blended suspension, can be explained by considering the
relative size distributions of limestone and cement in the blend. The similarities in PSDs
of the blended and the interground systems (Figure 8-2) combined with constant volume
ratios of limestone leads to the expectation that the apparent yield stress and plastic
viscosity in these suspensions would be equivalent. However, intergrinding limestone with
portland cement clinker will result in a finer limestone phase and a coarser cement phase
in the blended cement due to the relative softness of limestone as compared to portland
cement clinker (Tsivilis, Voglis, and Photou 1999). The results from the PSD-matched
OPC-limestone blends in Section 8.3.1 indicate that the interparticle attractive forces
between limestone and cement are lower than those between the cement grains, resulting
in a reduction in yield stress as PSD-matched limestone replaces OPC. Thus, the coarser
cement particles in the C595 PLC mixture would result in a decrease in the cement particle
contacts as compared to the equivalent blended mixture, which subsequently reduces the
interparticle attractive forces and decreases the apparent yield stress.
8.3.2.2 Observations from Oscillatory Shear Stress Ramp Experiments
In addition to parallel plate rheological experiments described in the previous section, small
amplitude oscillatory stress growth experiments were also performed on suspensions of
interground PLC and PSD-matched OPC-limestone blends. Oscillatory stress growth
experiments are used to extract the storage and loss moduli, which are the elastic and
viscous components of a viscoelastic material respectively, as a function of applied stress.
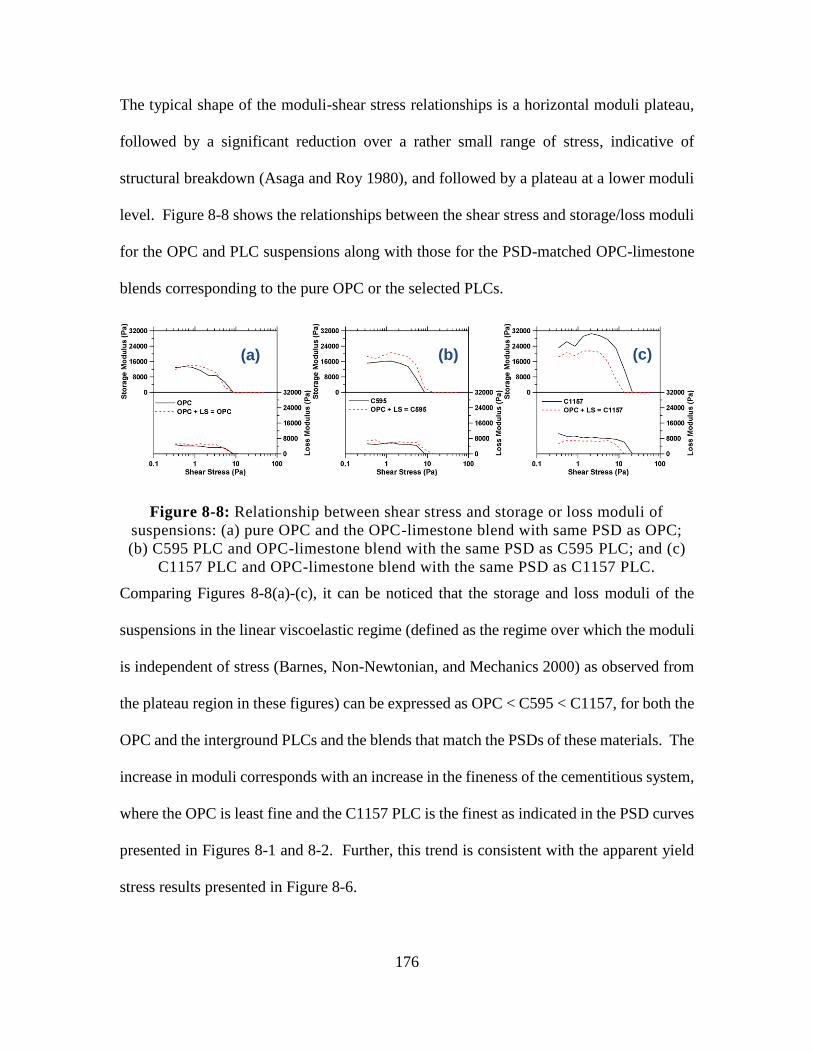
176
The typical shape of the moduli-shear stress relationships is a horizontal moduli plateau,
followed by a significant reduction over a rather small range of stress, indicative of
structural breakdown (Asaga and Roy 1980), and followed by a plateau at a lower moduli
level. Figure 8-8 shows the relationships between the shear stress and storage/loss moduli
for the OPC and PLC suspensions along with those for the PSD-matched OPC-limestone
blends corresponding to the pure OPC or the selected PLCs.
Figure 8-8: Relationship between shear stress and storage or loss moduli of
suspensions: (a) pure OPC and the OPC-limestone blend with same PSD as OPC;
(b) C595 PLC and OPC-limestone blend with the same PSD as C595 PLC; and (c)
C1157 PLC and OPC-limestone blend with the same PSD as C1157 PLC.
Comparing Figures 8-8(a)-(c), it can be noticed that the storage and loss moduli of the
suspensions in the linear viscoelastic regime (defined as the regime over which the moduli
is independent of stress (Barnes, Non-Newtonian, and Mechanics 2000) as observed from
the plateau region in these figures) can be expressed as OPC < C595 < C1157, for both the
OPC and the interground PLCs and the blends that match the PSDs of these materials. The
increase in moduli corresponds with an increase in the fineness of the cementitious system,
where the OPC is least fine and the C1157 PLC is the finest as indicated in the PSD curves
presented in Figures 8-1 and 8-2. Further, this trend is consistent with the apparent yield
stress results presented in Figure 8-6.
(b) (a) (c)
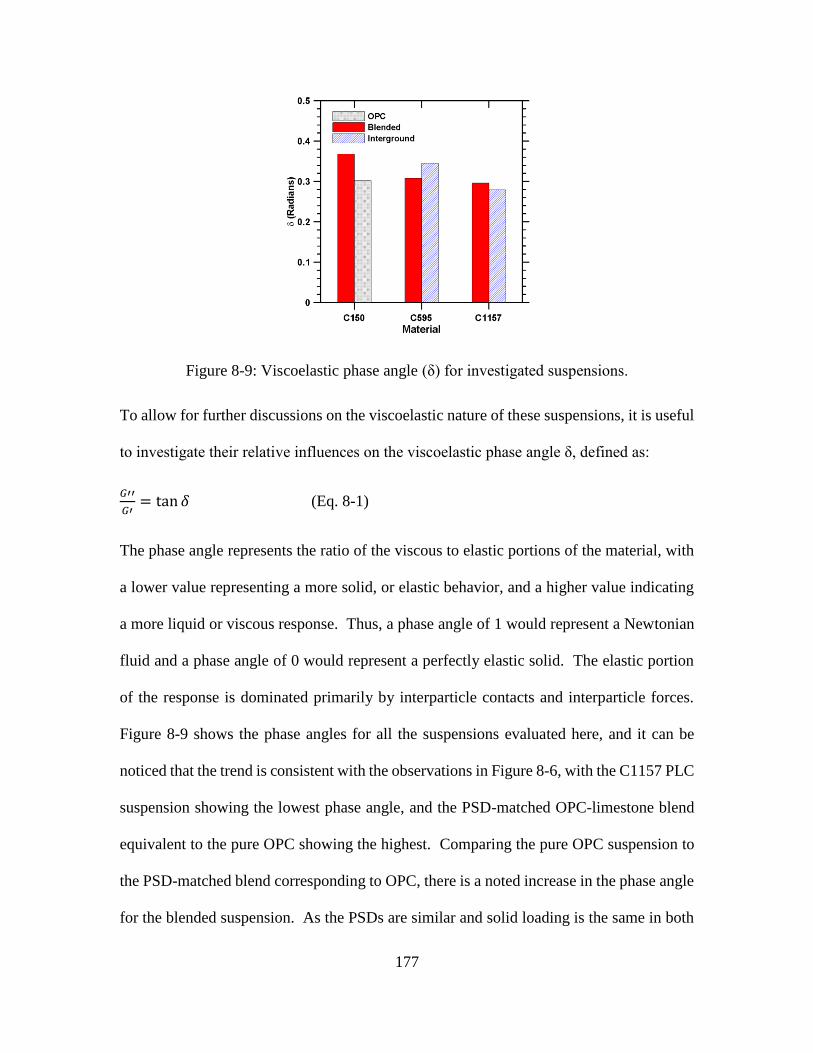
177
Figure 8-9: Viscoelastic phase angle (δ) for investigated suspensions.
To allow for further discussions on the viscoelastic nature of these suspensions, it is useful
to investigate their relative influences on the viscoelastic phase angle δ, defined as:
𝐺′′
𝐺′= tan 𝛿 (Eq. 8-1)
The phase angle represents the ratio of the viscous to elastic portions of the material, with
a lower value representing a more solid, or elastic behavior, and a higher value indicating
a more liquid or viscous response. Thus, a phase angle of 1 would represent a Newtonian
fluid and a phase angle of 0 would represent a perfectly elastic solid. The elastic portion
of the response is dominated primarily by interparticle contacts and interparticle forces.
Figure 8-9 shows the phase angles for all the suspensions evaluated here, and it can be
noticed that the trend is consistent with the observations in Figure 8-6, with the C1157 PLC
suspension showing the lowest phase angle, and the PSD-matched OPC-limestone blend
equivalent to the pure OPC showing the highest. Comparing the pure OPC suspension to
the PSD-matched blend corresponding to OPC, there is a noted increase in the phase angle
for the blended suspension. As the PSDs are similar and solid loading is the same in both
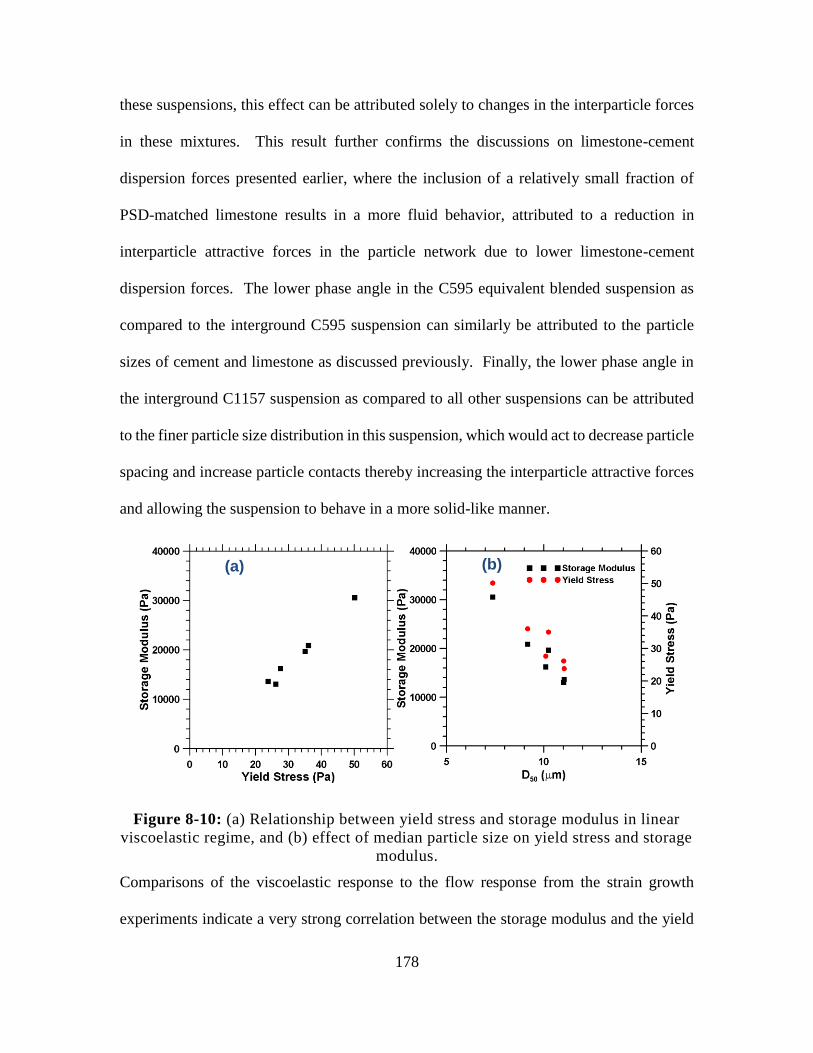
178
these suspensions, this effect can be attributed solely to changes in the interparticle forces
in these mixtures. This result further confirms the discussions on limestone-cement
dispersion forces presented earlier, where the inclusion of a relatively small fraction of
PSD-matched limestone results in a more fluid behavior, attributed to a reduction in
interparticle attractive forces in the particle network due to lower limestone-cement
dispersion forces. The lower phase angle in the C595 equivalent blended suspension as
compared to the interground C595 suspension can similarly be attributed to the particle
sizes of cement and limestone as discussed previously. Finally, the lower phase angle in
the interground C1157 suspension as compared to all other suspensions can be attributed
to the finer particle size distribution in this suspension, which would act to decrease particle
spacing and increase particle contacts thereby increasing the interparticle attractive forces
and allowing the suspension to behave in a more solid-like manner.
Figure 8-10: (a) Relationship between yield stress and storage modulus in linear
viscoelastic regime, and (b) effect of median particle size on yield stress and storage
modulus.
Comparisons of the viscoelastic response to the flow response from the strain growth
experiments indicate a very strong correlation between the storage modulus and the yield
(b) (a)
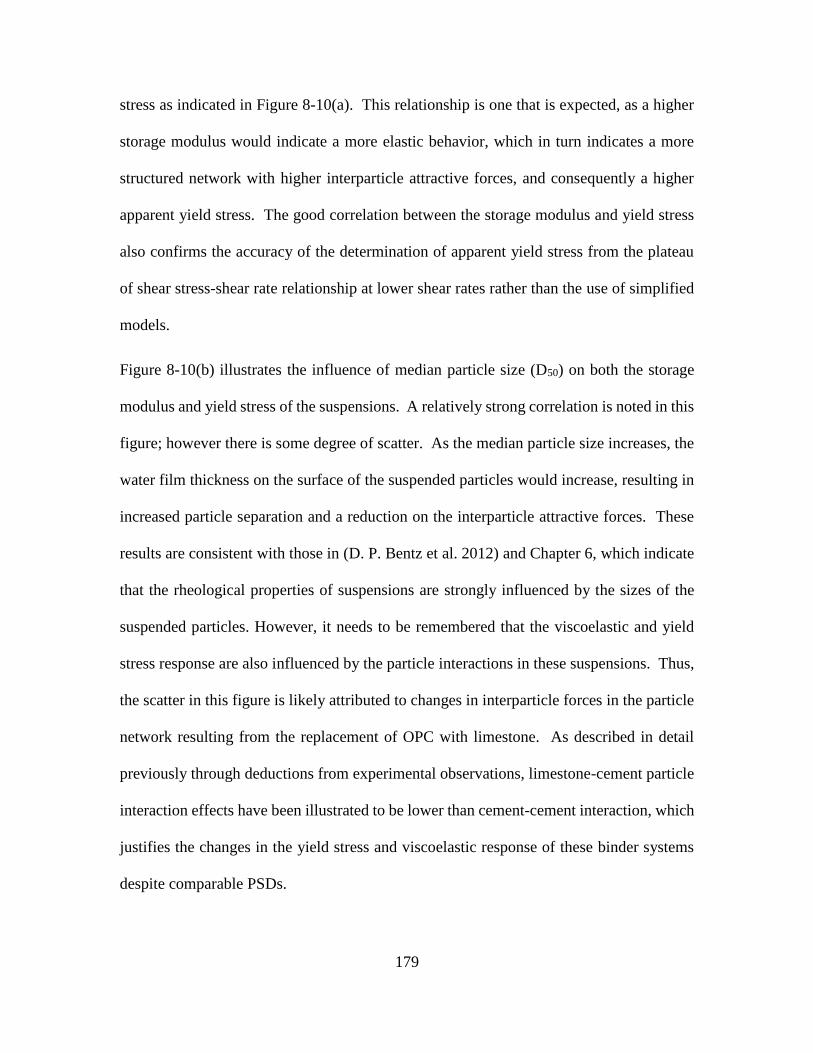
179
stress as indicated in Figure 8-10(a). This relationship is one that is expected, as a higher
storage modulus would indicate a more elastic behavior, which in turn indicates a more
structured network with higher interparticle attractive forces, and consequently a higher
apparent yield stress. The good correlation between the storage modulus and yield stress
also confirms the accuracy of the determination of apparent yield stress from the plateau
of shear stress-shear rate relationship at lower shear rates rather than the use of simplified
models.
Figure 8-10(b) illustrates the influence of median particle size (D50) on both the storage
modulus and yield stress of the suspensions. A relatively strong correlation is noted in this
figure; however there is some degree of scatter. As the median particle size increases, the
water film thickness on the surface of the suspended particles would increase, resulting in
increased particle separation and a reduction on the interparticle attractive forces. These
results are consistent with those in (D. P. Bentz et al. 2012) and Chapter 6, which indicate
that the rheological properties of suspensions are strongly influenced by the sizes of the
suspended particles. However, it needs to be remembered that the viscoelastic and yield
stress response are also influenced by the particle interactions in these suspensions. Thus,
the scatter in this figure is likely attributed to changes in interparticle forces in the particle
network resulting from the replacement of OPC with limestone. As described in detail
previously through deductions from experimental observations, limestone-cement particle
interaction effects have been illustrated to be lower than cement-cement interaction, which
justifies the changes in the yield stress and viscoelastic response of these binder systems
despite comparable PSDs.
180
8.3.3 Influence of Fly Ash on the Rheological Performance of PLC Suspensions
Rheological performance of OPC and interground PLCs were studied with an additional
replacement by fly ash at a volumetric ratio of 10% using the parallel plate configuration
and the experimental procedure presented in Section 8.2. The determined rheological
properties as a result of this study are presented in Figure 8-11. The incorporation of fly
ash in these systems results in a reduction of both the plastic viscosity and apparent yield
stress, as expected. The inclusion fly ash, with a median particle size (D50) of 19.9 µm,
which is coarser than OPC, replaces OPC or PLC both having smaller D50 values than fly
ash, resulting in decreased overall surface area of the particles. This, in turn, results in an
increase in the water-film-thickness around particles, reducing interparticle forces and
increasing particle separation (Fung and Kwan 2010). These effects, in additional with the
spherical shape effect of fly ash, result in a decrease in both plastic viscosity and apparent
yield stress.
Further noted from this figure is the plastic viscosity remains relatively constant across all
of the blends similar to the results shown in Figure 7-6, with the exception of the finer
interground C1157 PLC. This divergence is attributed to the higher fineness of this
mixture. Similarly, apparent yield stress is also seen to maintain similar trends as that of
systems without limestone (Section 8.3.2.1). It is shown that the incorporation of fly ash
in these systems generally reduces the rheological parameters as expected, but do not
change the overall nature of the suspension.
181
Figure 8-11: Influence of fly ash addition on the rheological properties of blended
and interground limestone-cement suspensions.
8.4 Conclusions
This paper extensively studies the rheological influences of limestone inclusion in portland
cement suspensions. The effects of packing and surface area changes have been
disconnected from these influences by using PSD matched limestone replacement. It is
noted in this study that the inclusion of limestone results in a diminished apparent yield
stress due to decreased interparticle dispersion forces. The cause of this is due to lower
electrostatic attractive forces between limestone and cement particles as compared to
between cement particles. This phenomena is confirmed through viscoelastic testing of the
suspensions. It is further noted that interground PLC blends are likely to have lower
apparent yield stresses and more fluid-like behavior than blended PLC suspensions of the
same size distribution. This is attributed to the fact that softer limestone is more readily
ground than portland cement clinker, resulting in a finer limestone phase in the PLC. This
decreases the yield stress as compared to the blended mixture due to the larger cement
particles present decreasing surface contacts between cement particles and lowering the net
interparticle attractive forces in the network. Finally, the use of the stress plateau method

182
for yield stress determinations is confirmed as reliable, by relating the apparent yield stress
to the viscoelastic response.
183
9. OBSERVATIONS ON THE RHEOLOGICAL RESPONSE OF ALKALI
ACTIVATED FLY ASH SUSPENSIONS: THE ROLE OF ACTIVATOR TYPE AND
CONCENTRATION
9.1 Introduction
Ordinary portland cement (OPC) based concrete is one of the most widely used materials
globally, and production of OPC has been shown to require a significant quantity of energy
and release significant quantities of CO2. One of the sustainable alternatives to OPC that
has been gaining attention is the use of geopolymeric or alkali activated materials, where
alumino-siliceous waste/by-product materials such as fly ash or slag can be activated using
alkalis to create a binding medium that is X-ray amorphous and has a three-dimensional
network structure (Puertas and Fernández-Jiménez 2003; Palomo, Grutzeck, and Blanco
1999; Škvára et al. 2009). The formation of the binding gel is a complex process including
the dissolution process where some Si and Al from the source materials are dissolved by
the highly alkaline solution, precipitation of aluminosilicate gel, and further polymerization
and condensation to develop the final microstructure (Davidovits 1999; Davidovits 2005).
Geopolymeric systems are reported to demonstrate similar or superior mechanical and
durability properties compared to OPC-based concretes (Bernal, Mejía de Gutiérrez, and
Provis 2012; Bijen 1996; Fernández-Jiménez, Garcia-Lodeiro, and Palomo 2007).
Geopolymers based on coal fly ash are of particular interest because of the potential
utilization of a waste material that is available in large quantities as well as the beneficial
properties of the resulting binder (Provis et al. 2007).
While several studies have examined the mechanical and durability properties of fly ash-
based geopolymeric systems, there have been scant studies on aspects related to their
184
fundamental rheological response. A few studies have investigated the flow behavior of fly
ash-based geopolymeric systems using conventional concrete workability techniques
(Qing-Hua and Sarkar 1994; Poulesquen, Frizon, and Lambertin 2013b) and investigated
the influence of admixtures (superplasticizers and retarders) (Termkhajornkit and Nawa
2004; Criado et al. 2009; Burgos-Montes et al. 2012; Palacios et al. 2009b) on the rheology
of these systems. Studies on the influence of superplasticizers on the flowability of
geopolymer suspensions have generally found mixed results (Palacios et al. 2009b; Criado
et al. 2009), indicating that the nature of these suspensions is likely different from that of
OPC suspensions.
This paper aims to develop a fundamental understanding of the rheological nature of these
systems and explore the influence of activator type and composition on their rheological
properties. Two different classes of activators are used in this study where Class F fly ash
is used as the source material: (i) sodium or potassium-hydroxide solutions, and (ii) sodium
or potassium-silicate solutions with different SiO2-Na2O ratios (Ms) and Na2O-to-powder
ratios (n). The main rheological parameters considered are the yield stress and plastic
viscosity of the suspensions determined using the well-known Bingham model. Obtaining
a detailed understanding of the rheological influences of alkali cation type and activation
solution viscosity is emphasized. Additionally an in-depth investigation of the rheological
nature of these suspensions is also attempted using a wider shear range method developed
previously (Vance, Sant, and Neithalath), where model-less estimations of rheological
parameters are achieved. This experimental approach is used to compare the rheological
nature of these suspensions to those of OPC-water suspensions. Limited shear stress growth
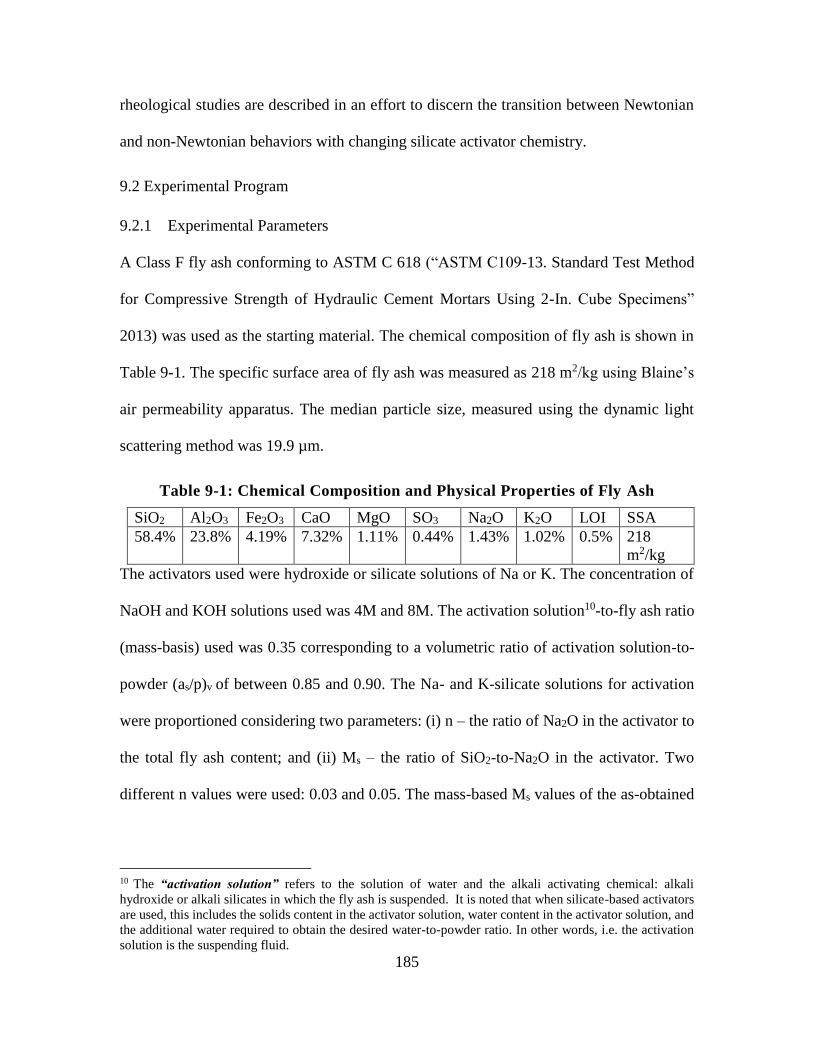
185
rheological studies are described in an effort to discern the transition between Newtonian
and non-Newtonian behaviors with changing silicate activator chemistry.
9.2 Experimental Program
9.2.1 Experimental Parameters
A Class F fly ash conforming to ASTM C 618 (“ASTM C109-13. Standard Test Method
for Compressive Strength of Hydraulic Cement Mortars Using 2-In. Cube Specimens”
2013) was used as the starting material. The chemical composition of fly ash is shown in
Table 9-1. The specific surface area of fly ash was measured as 218 m2/kg using Blaine’s
air permeability apparatus. The median particle size, measured using the dynamic light
scattering method was 19.9 µm.
Table 9-1: Chemical Composition and Physical Properties of Fly Ash
SiO2 Al2O3 Fe2O3 CaO MgO SO3 Na2O K2O LOI SSA
58.4% 23.8% 4.19% 7.32% 1.11% 0.44% 1.43% 1.02% 0.5% 218
m2/kg
The activators used were hydroxide or silicate solutions of Na or K. The concentration of
NaOH and KOH solutions used was 4M and 8M. The activation solution10-to-fly ash ratio
(mass-basis) used was 0.35 corresponding to a volumetric ratio of activation solution-to-
powder (as/p)v of between 0.85 and 0.90. The Na- and K-silicate solutions for activation
were proportioned considering two parameters: (i) n – the ratio of Na2O in the activator to
the total fly ash content; and (ii) Ms – the ratio of SiO2-to-Na2O in the activator. Two
different n values were used: 0.03 and 0.05. The mass-based Ms values of the as-obtained
10 The “activation solution” refers to the solution of water and the alkali activating chemical: alkali
hydroxide or alkali silicates in which the fly ash is suspended. It is noted that when silicate-based activators
are used, this includes the solids content in the activator solution, water content in the activator solution, and
the additional water required to obtain the desired water-to-powder ratio. In other words, i.e. the activation
solution is the suspending fluid.
186
Na- and K-silicates were 3.22 and 2.10 respectively, which corresponds to mole-based
values of 3.32 and 3.29. The solids content in both the silicate solutions were approximately
36%. Requisite amounts of NaOH or KOH were added to the silicate solutions to adjust
the Ms (mole-based) to 2.5 or 1.5 for both Na- and K-silicate solutions. Ms values in this
range have been shown to be necessary to induce sufficient activation and strength
development (Ravikumar and Neithalath 2012b; Ravikumar and Neithalath 2012a). For the
Na- and K-silicate activated fly ashes, the mass-based water-to-solids ratio - (w/s)m - used
was 0.20 and 0.25 which corresponds to a (as/p)v between 0.59 and 0.74 and between 0.72
and 0.88 respectively. The solids in (w/s)m consists of fly ash, the solid fraction of the K-
or Na-silicate activator, and the solid fraction of the alkali hydroxide used to adjust the Ms,
and the liquid consists of the water in the activator solution and the water added to achieve
at the desired (w/s)m. In order to facilitate comparisons between the rheological
performances of these suspensions, it is may be necessary to consider the binder loading
on a volume basis. Hence in the discussion section, the actual volume-based activation
solution-to-powder ratios - (as/p)v for the corresponding (w/s)m are used. An OPC
suspension proportioned at a mass-based water-to-cement ratio (w/c) of 0.45 (which
corresponds to a w/c of 1.42 on a volume-basis), was also proportioned so as to provide a
point of comparison of fly ash geopolymer rheology to those of commonly used OPC
systems.
9.2.2 Mixing and Testing Procedure
Liquid activators were prepared prior to mixing with the binder (fly ash), and allowed to
cool down for a period of 3 to 4 hours to ambient temperature (222oC) as measured with
an infrared thermometer. For the rheological studies of activation solutions, approximately
187
12 mL of solution was placed using a disposable syringe in a TA Instruments AR2000EX
rheometer in the concentric cylinder configuration, in which both the cup and bob were
textured, to reduce slip. The gap between the concentric cylinders was fixed at 1.0 mm.
For studies of fresh geopolymer suspensions, approximately 200 g of the suspension was
mixed using a kitchen blender as follows: (1) initial hand mixing to disperse the powder in
the activation solution and to ensure that particles do not adhere to the edges of mixing
container, (2) mixing in the blender at high speed for 30s, (3) 30s covered rest period, and
(4) final mixing at high speed in the blender for 30s. This mixing sequence is a
modification to ASTM C1738 (“ASTM C1738 - 11a. Standard Practice for High-Shear
Mixing of Hydraulic Cement Paste” 2011) which provides recommendations for
measurements of cement paste rheology (Nehdi and Rahman 2004b); but demonstrated to
provide similar fluidity and mixing consistency. After mixing, approximately 6 mL of
sample was extracted using a disposable syringe and placed between in the rheometer in
the parallel plate configuration. The gap between the top and bottom plates parallel plates
(top plate diameter of 50 mm, serrated to a depth of 1.0 mm) was set to 2.0 mm during the
experiments, as this gap has been noted to provide consistent results in cementitious
suspensions as shown in Chapters 5 and 6. The bottom plate was serrated to a depth of 0.15
mm. The rheological studies were carried out with the Peltier plate set to a temperature of
250.1 °C. The approximate time from the addition of the activation solution to the start
of the rheological experiment was 150s. Treatment and conditioning of experimental data
was carried out for shear stress and shear rates using the TA Instruments TRIOS software
package.
188
The general experimental procedure consists of varying the shear rate as follows: (1) a
stepped ramp-up pre-shear phase, (2) a subsequent stepped ramp-up, and (3) a stepped
ramp-down phase. The actual data acquisition is carried out during steps (2) and (3). Shear
stress values are recorded every second, with a given shear step being terminated when a
steady state has been achieved, as defined by 3 consecutive measurements within 5% of
each other. For all the studies, the values used in determining rheological properties are
the steady state values of shear stress and the related shear rate in the down ramp. Two
different rheological evaluations are conducted. The shear rate range used for the
rheological studies of activation solutions and the suspension was 5-to-100/s, hereinafter
referred to as the “normal” shear rate range. This is the shear rate range that is used in a
majority of rheological studies on cementitious suspensions (Banfill 2006; Nehdi and
Rahman 2004b). For the comparative study of geopolymer and cementitious suspensions,
a “wide” shear rate range: 0.005-to-100/s was used. The “wide” experiment follows a
similar procedure as that used in Chapter 6 in an effort to characterize and adequately
model the stress plateau which only manifests are very lower shear rates (Barnes 1999). A
graphical representation of the two rheological procedures used in this study is presented
in Figure 9-1. In addition, an oscillatory shear stress growth study was carried out to
investigate the unexpected Newtonian behavior when an activation solution with a low(er)
Ms was used. Here, a coaxial cylinder geometry was used with an oscillatory frequency of
1 Hz and a stress range from 0.005 Pa to 50 Pa was employed. Stress ranges below 0.1 Pa
resulted in torque readings that were close to the torque limit of the instrument, resulting
in significant data scatter and thus such data is disregarded in the analysis.
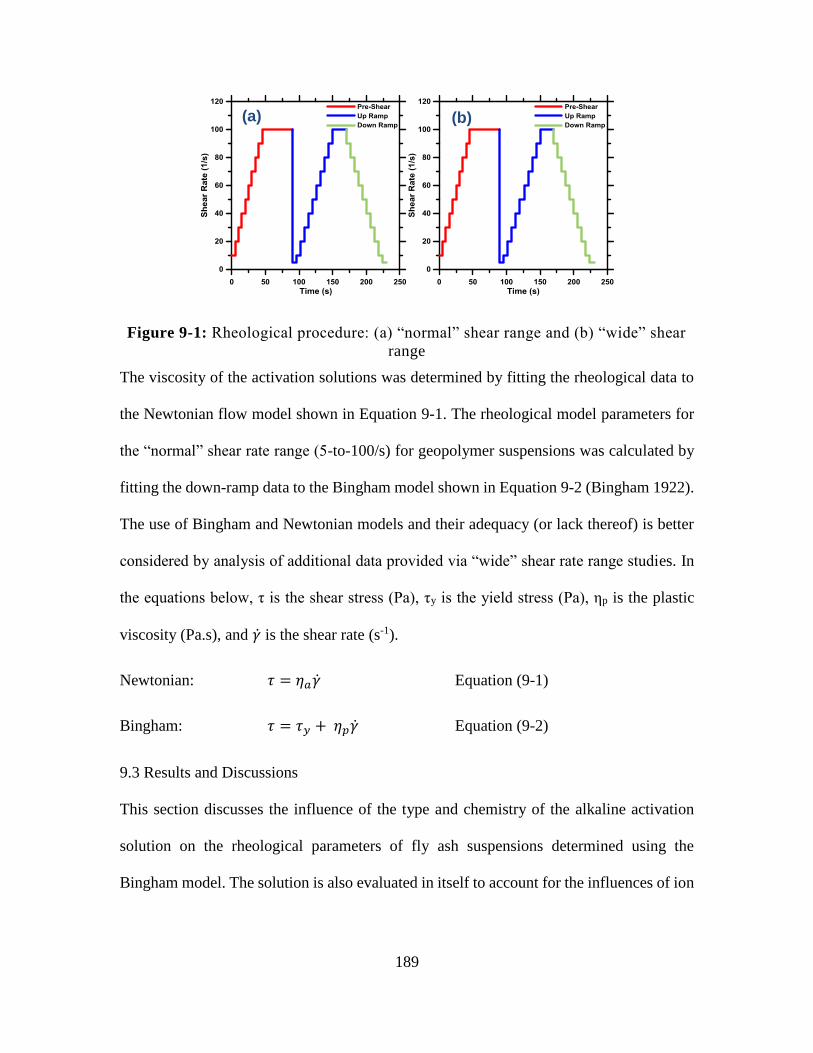
189
Figure 9-1: Rheological procedure: (a) “normal” shear range and (b) “wide” shear
range
The viscosity of the activation solutions was determined by fitting the rheological data to
the Newtonian flow model shown in Equation 9-1. The rheological model parameters for
the “normal” shear rate range (5-to-100/s) for geopolymer suspensions was calculated by
fitting the down-ramp data to the Bingham model shown in Equation 9-2 (Bingham 1922).
The use of Bingham and Newtonian models and their adequacy (or lack thereof) is better
considered by analysis of additional data provided via “wide” shear rate range studies. In
the equations below, τ is the shear stress (Pa), τy is the yield stress (Pa), ηp is the plastic
viscosity (Pa.s), and �̇� is the shear rate (s-1).
Newtonian: 𝜏 = 𝜂𝑎�̇� Equation (9-1)
Bingham: 𝜏 = 𝜏𝑦 + 𝜂𝑝�̇� Equation (9-2)
9.3 Results and Discussions
This section discusses the influence of the type and chemistry of the alkaline activation
solution on the rheological parameters of fly ash suspensions determined using the
Bingham model. The solution is also evaluated in itself to account for the influences of ion
(b) (a)
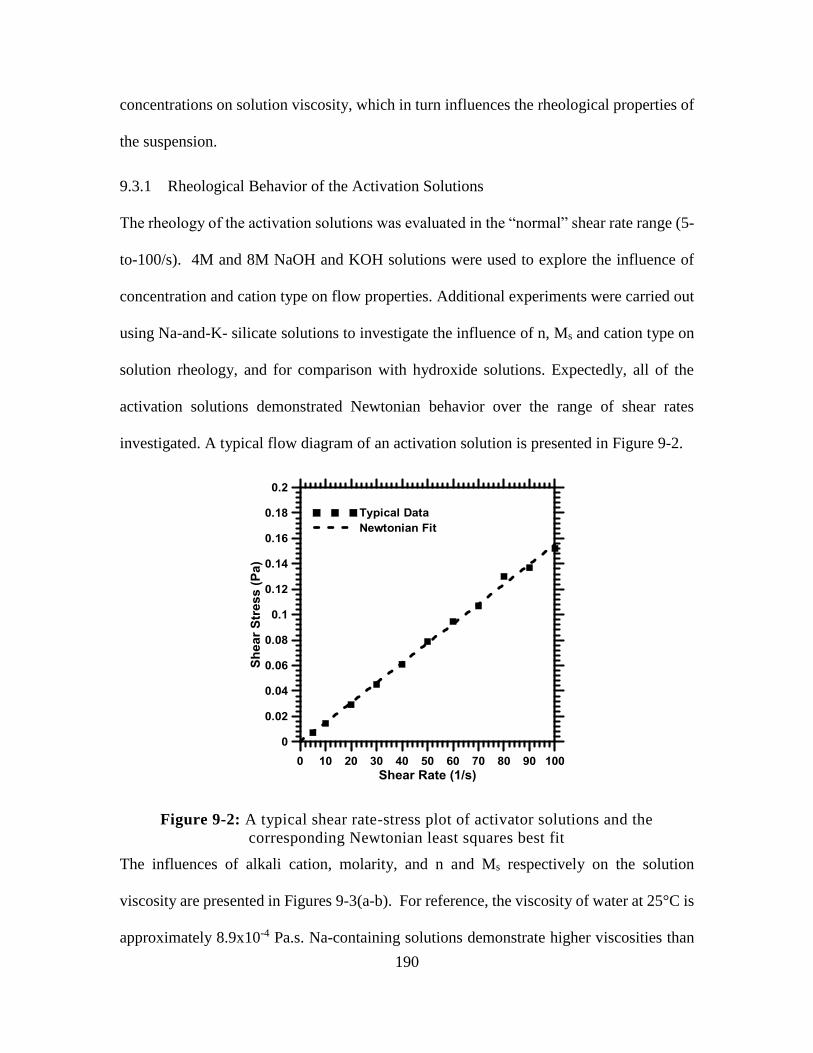
190
concentrations on solution viscosity, which in turn influences the rheological properties of
the suspension.
9.3.1 Rheological Behavior of the Activation Solutions
The rheology of the activation solutions was evaluated in the “normal” shear rate range (5-
to-100/s). 4M and 8M NaOH and KOH solutions were used to explore the influence of
concentration and cation type on flow properties. Additional experiments were carried out
using Na-and-K- silicate solutions to investigate the influence of n, Ms and cation type on
solution rheology, and for comparison with hydroxide solutions. Expectedly, all of the
activation solutions demonstrated Newtonian behavior over the range of shear rates
investigated. A typical flow diagram of an activation solution is presented in Figure 9-2.
Figure 9-2: A typical shear rate-stress plot of activator solutions and the
corresponding Newtonian least squares best fit
The influences of alkali cation, molarity, and n and Ms respectively on the solution
viscosity are presented in Figures 9-3(a-b). For reference, the viscosity of water at 25°C is
approximately 8.9x10⁻⁴ Pa.s. Na-containing solutions demonstrate higher viscosities than
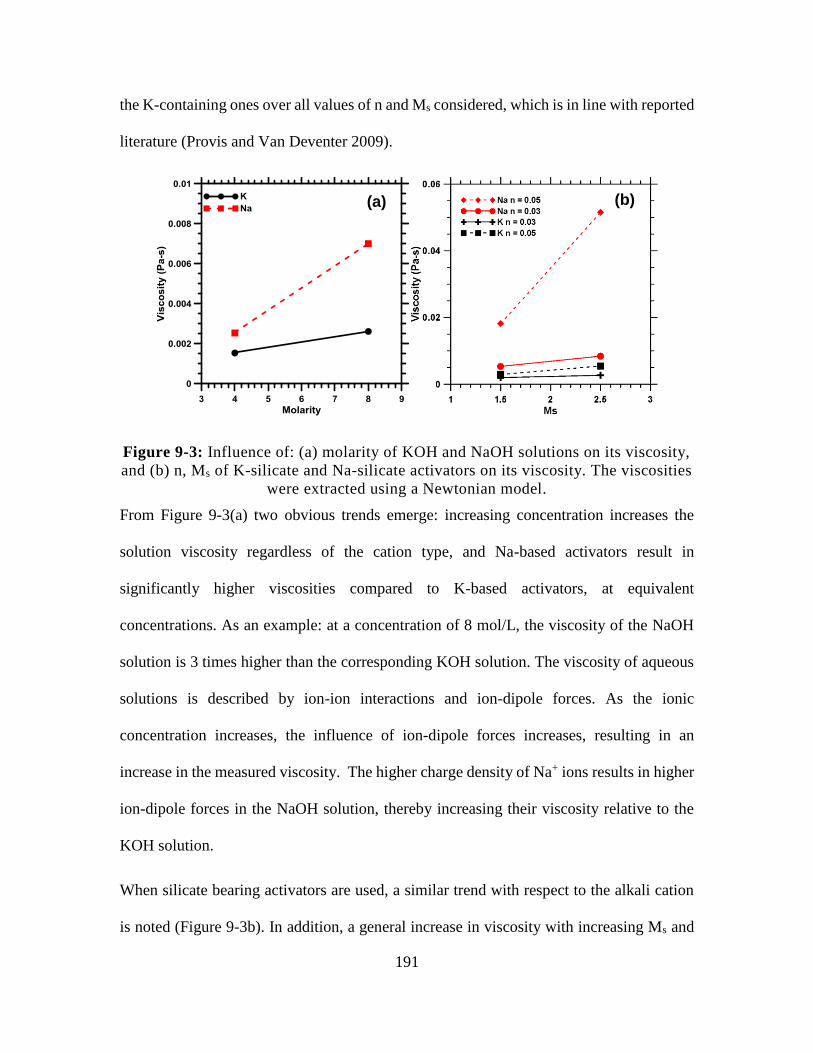
191
the K-containing ones over all values of n and Ms considered, which is in line with reported
literature (Provis and Van Deventer 2009).
Figure 9-3: Influence of: (a) molarity of KOH and NaOH solutions on its viscosity,
and (b) n, Ms of K-silicate and Na-silicate activators on its viscosity. The viscosities
were extracted using a Newtonian model.
From Figure 9-3(a) two obvious trends emerge: increasing concentration increases the
solution viscosity regardless of the cation type, and Na-based activators result in
significantly higher viscosities compared to K-based activators, at equivalent
concentrations. As an example: at a concentration of 8 mol/L, the viscosity of the NaOH
solution is 3 times higher than the corresponding KOH solution. The viscosity of aqueous
solutions is described by ion-ion interactions and ion-dipole forces. As the ionic
concentration increases, the influence of ion-dipole forces increases, resulting in an
increase in the measured viscosity. The higher charge density of Na+ ions results in higher
ion-dipole forces in the NaOH solution, thereby increasing their viscosity relative to the
KOH solution.
When silicate bearing activators are used, a similar trend with respect to the alkali cation
is noted (Figure 9-3b). In addition, a general increase in viscosity with increasing Ms and
(a) (b)
192
n is observed, with the effect once again being more noticeable for the Na cation than for
K. NMR studies of concentrated alkali silicate solutions have indicated the presence of
colloidal Si-O-H-M complexes (where M denotes Na or K species) on the order of 0.6 nm
in size, which form aggregates on the order of a few nm (Stebbins, Farnan, and Xue 1992;
Tognonvi et al. 2010), the presence of which increases the solution viscosity (Brady 1993).
The quantity/size of these colloidal species and aggregates likely increases with Ms due to
an increased Si (i.e., complex) content and the reduced abundance of OH- species to break
Si-O-Si bonds (Iler 1979), which in turn results in an increase in the solution viscosity
(Svensson, Sjöberg, and Öhman 1986; Wijnen et al. 1989). The influence of n on the
solution viscosity can be explained as follows. An increase in n increases the ionic
concentration of Na or K, as well as an increase of Si in the solution, resulting in increased
ion-dipole forces as well as increased quantity of Si-O-H-M complexes. In addition, to
obtain identical n and Ms values for Na and K silicate solutions, more Na-silicate is needed
(than K-Silicate) due to the lower molecular weight of sodium. This results in inequivalent
ion-dipole forces in these solutions, as a result of which Na-bearing silicate solution show
higher viscosities. Figure 9-3(b) also shows that, with an increasing value of n, the viscosity
enhancement is higher with increasing Ms when Na+ is the cation in solution. This behavior
is attributed to the more significant influence of ion-dipole forces with more charge dense
Na+ ions combined with higher colloidal species concentration.
9.3.2 Rheological Behavior of Fly Ash Suspensions Activated with NaOH or KOH
Rheological studies were performed on suspensions where fly ash was dispersed in NaOH
or KOH solutions (4M and 8M) using the “normal” shear rate range as described in Section
9.2. From Figure 9-4 it is observed that increasing the activation solution concentration
193
results in an increase in the plastic viscosity and yield stress of the suspensions. This
behavior is primarily attributed to the increase in the viscosity of the activation solution
with concentration. Similarly, the effect of the cation on the rheological performance of
the suspension can also be related to the rheology of the medium in which the fly ash is
dispersed. As seen in Figure 9-3(a), NaOH solutions demonstrate higher viscosity than the
KOH solutions. The steeper slope associated with the change in plastic viscosity of the fly
ash-NaOH suspension as compared to the fly ash-KOH suspension when the concentration
increases also mimics trends in the viscosity of the activation solution. Yield stress,
however, increases at a greater rate with an increase in activation solution concentration
when fly ash is dispersed in KOH. At lower concentrations, the yield stress of the fly ash-
NaOH suspension is higher than that of the fly ash-KOH suspension, while at higher
concentrations, the yield stress values of the two suspensions are similar. The yield stress
of a suspension is influenced by several competing effects: (i) the viscosity of the fluid, (ii)
interparticle forces (interaction potential or steric forces and van der Waals forces), and
(iii) the influence of particle jamming (Lowke 2009; Barnes 1999). As the volume fraction
of solids (fly ash) is similar for all these mixtures and the fly ash particles are spherical, the
influence of particle jamming can be ignored in comparative evaluations. Similarly,
particle spacing also will be approximately similar across these suspensions, and thus the
influence of van Der Waals forces is likely redundant. The yield stress can be considered
to be proportional to the inverse square of particle separation (van der Waals forces) minus
the square of the interaction potential (zeta potential) (Scales et al. 1998). Increased
particle separation will decrease the effect of van Der Waals forces, while a higher net
surface charge on the particles will increase the repulsive force between particles, both
194
effects resulting in a decrease in yield stress. This behavior can be conceptually verified by
considering the surface interaction effect that results from the use of superplasticizers in
cementitious suspensions (Adriano Papo and Piani 2004). Based on the above analysis,
there are two remaining influences which may be attributable to the relative increase in
yield stress with increasing molarity: interaction potential and viscosity of the activation
solution. Studies have shown the zeta-potential of fly ash is dependent on ion type, ion
concentration and the pH of the suspending solution (Nägele 1986; Nägele and Schneider
1989). In solutions of NaOH and KOH, the zeta potential of fly ash has been shown to be
negative, with those in NaOH solutions showing a larger net potential (Nägele 1986). This
behavior is attributed to the enhanced adsorption of K+ on the fly ash particle surfaces than
Na+ ions (Franks 2002), resulting in a less negative surface charge as the K+ concentration
is increased. As the zeta potential decreases, the yield stress increases due to a decreased
repulsive force between fly ash particles. The smaller increase in yield stress in NaOH
solutions as compared to KOH solutions with increasing molarity can thus be attributed to
the greater net surface charge of fly ash particles in NaOH that result in more significant
repulsive forces.
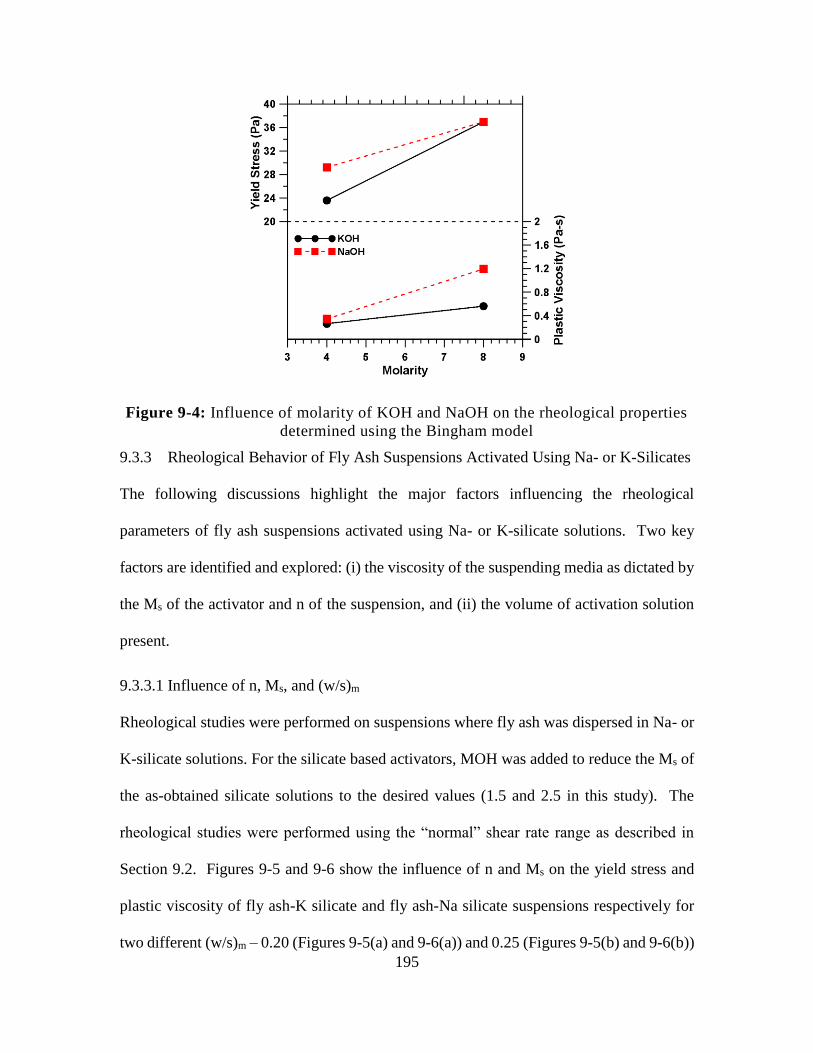
195
Figure 9-4: Influence of molarity of KOH and NaOH on the rheological properties
determined using the Bingham model
9.3.3 Rheological Behavior of Fly Ash Suspensions Activated Using Na- or K-Silicates
The following discussions highlight the major factors influencing the rheological
parameters of fly ash suspensions activated using Na- or K-silicate solutions. Two key
factors are identified and explored: (i) the viscosity of the suspending media as dictated by
the Ms of the activator and n of the suspension, and (ii) the volume of activation solution
present.
9.3.3.1 Influence of n, Ms, and (w/s)m
Rheological studies were performed on suspensions where fly ash was dispersed in Na- or
K-silicate solutions. For the silicate based activators, MOH was added to reduce the Ms of
the as-obtained silicate solutions to the desired values (1.5 and 2.5 in this study). The
rheological studies were performed using the “normal” shear rate range as described in
Section 9.2. Figures 9-5 and 9-6 show the influence of n and Ms on the yield stress and
plastic viscosity of fly ash-K silicate and fly ash-Na silicate suspensions respectively for
two different (w/s)m – 0.20 (Figures 9-5(a) and 9-6(a)) and 0.25 (Figures 9-5(b) and 9-6(b))
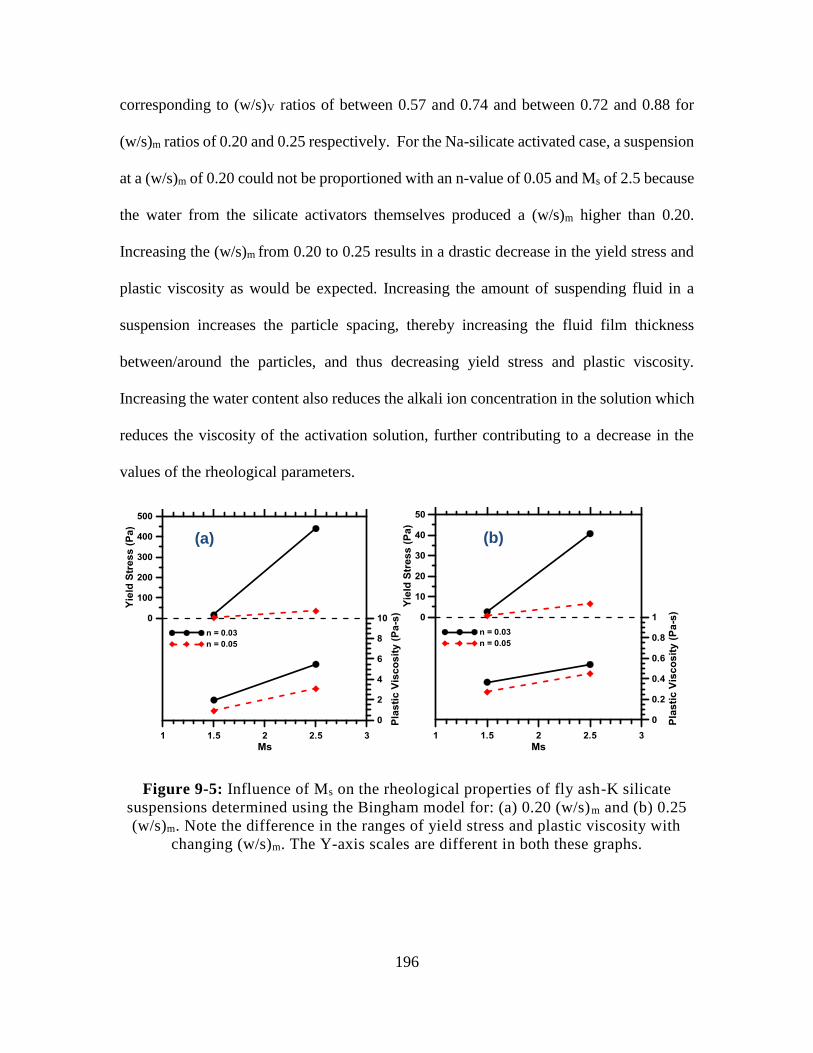
196
corresponding to (w/s)V ratios of between 0.57 and 0.74 and between 0.72 and 0.88 for
(w/s)m ratios of 0.20 and 0.25 respectively. For the Na-silicate activated case, a suspension
at a (w/s)m of 0.20 could not be proportioned with an n-value of 0.05 and Ms of 2.5 because
the water from the silicate activators themselves produced a (w/s)m higher than 0.20.
Increasing the (w/s)m from 0.20 to 0.25 results in a drastic decrease in the yield stress and
plastic viscosity as would be expected. Increasing the amount of suspending fluid in a
suspension increases the particle spacing, thereby increasing the fluid film thickness
between/around the particles, and thus decreasing yield stress and plastic viscosity.
Increasing the water content also reduces the alkali ion concentration in the solution which
reduces the viscosity of the activation solution, further contributing to a decrease in the
values of the rheological parameters.
Figure 9-5: Influence of Ms on the rheological properties of fly ash-K silicate
suspensions determined using the Bingham model for: (a) 0.20 (w/s)m and (b) 0.25
(w/s)m. Note the difference in the ranges of yield stress and plastic viscosity with
changing (w/s)m. The Y-axis scales are different in both these graphs.
(b) (a)
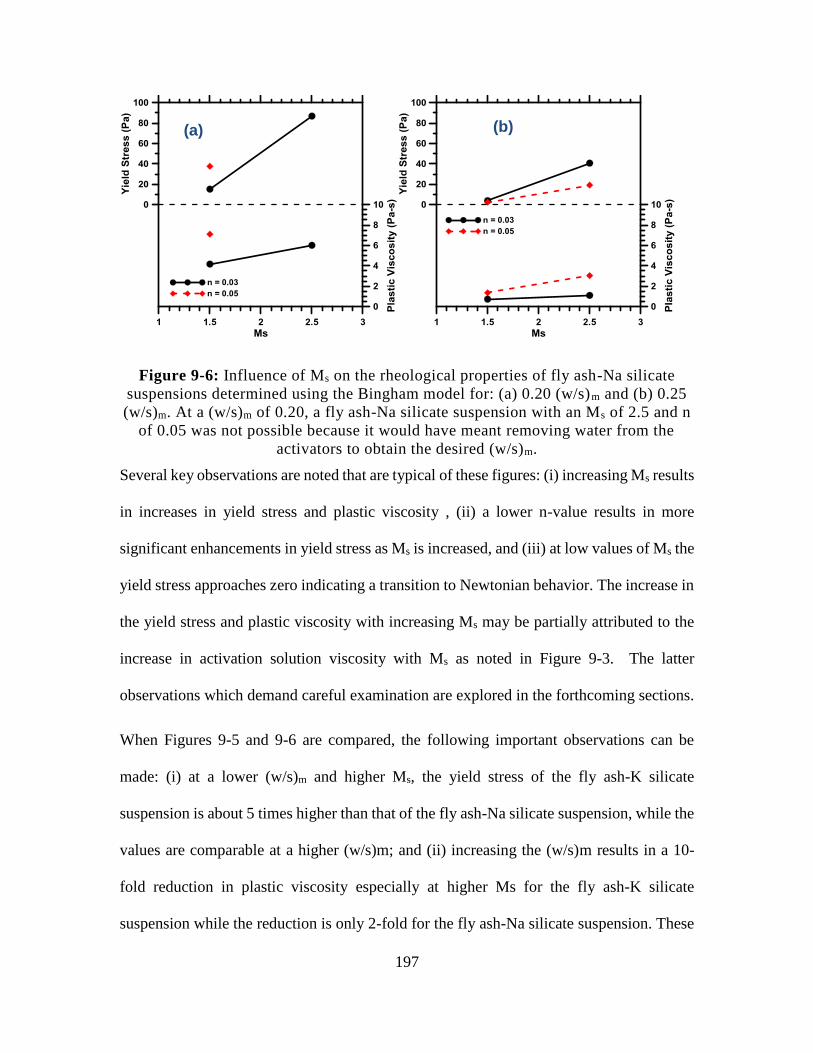
197
Figure 9-6: Influence of Ms on the rheological properties of fly ash-Na silicate
suspensions determined using the Bingham model for: (a) 0.20 (w/s)m and (b) 0.25
(w/s)m. At a (w/s)m of 0.20, a fly ash-Na silicate suspension with an Ms of 2.5 and n
of 0.05 was not possible because it would have meant removing water from the
activators to obtain the desired (w/s)m.
Several key observations are noted that are typical of these figures: (i) increasing Ms results
in increases in yield stress and plastic viscosity , (ii) a lower n-value results in more
significant enhancements in yield stress as Ms is increased, and (iii) at low values of Ms the
yield stress approaches zero indicating a transition to Newtonian behavior. The increase in
the yield stress and plastic viscosity with increasing Ms may be partially attributed to the
increase in activation solution viscosity with Ms as noted in Figure 9-3. The latter
observations which demand careful examination are explored in the forthcoming sections.
When Figures 9-5 and 9-6 are compared, the following important observations can be
made: (i) at a lower (w/s)m and higher Ms, the yield stress of the fly ash-K silicate
suspension is about 5 times higher than that of the fly ash-Na silicate suspension, while the
values are comparable at a higher (w/s)m; and (ii) increasing the (w/s)m results in a 10-
fold reduction in plastic viscosity especially at higher Ms for the fly ash-K silicate
suspension while the reduction is only 2-fold for the fly ash-Na silicate suspension. These
(b) (a)
198
observations support the idea that flow parameters are influenced to a great extent by the
adsorption of cations on particle surfaces. At higher (w/s)m, the surface adsorption of ions
and van Der Waals forces become less significant as the particle spacing increases, and
thus the influence of the alkali cation from the activation solution is reduced. In addition,
Na-based fly ash suspensions demonstrate similar or higher yield stress as compared to K-
based suspensions. Increasing the n-value is shown to decrease both the yield stress and
plastic viscosity in K-based suspensions, while generally increasing those values in Na-
based suspensions (except for the fly ash-Na silicate suspension with an Ms of 2.5 at a
(w/s)m of 0.25). The increased rheological properties in Na silicate-fly ash suspensions as
compared to K silicate-fly ash suspensions can be primarily attributed to the significantly
greater viscosity of the Na-based suspensions as compared to K-based suspensions as noted
in Figure 9-3. Further, in K silicate-fly ash suspensions, the behavior is Newtonian (zero
yield stress) at low Ms values regardless of (w/s)m ratio, whereas the Na-silicate
suspensions exhibit the Newtonian behavior only at the higher (w/s)m. The shift to a
Newtonian flow regime at low Ms values is explored in detail in a later section.
9.3.3.2 Dependence of rheological parameters on the volumetric activator solution-binder
ratio
The (w/s)m ratio is a mass-based ratio of the water in the activator (along with any
additional water added) to the total solids (the binder material, fly ash in this case and the
solids present in any of the activating chemicals) in the suspension. The (as/b)V ratio, on
the other hand, is the volumetric ratio of the activation solution to the binder. The activation
solution implicitly includes the dissolved solids present in the solution: both the silicate
solutions used in this study have the same solids content. The use of (as/b)V ratio, rather
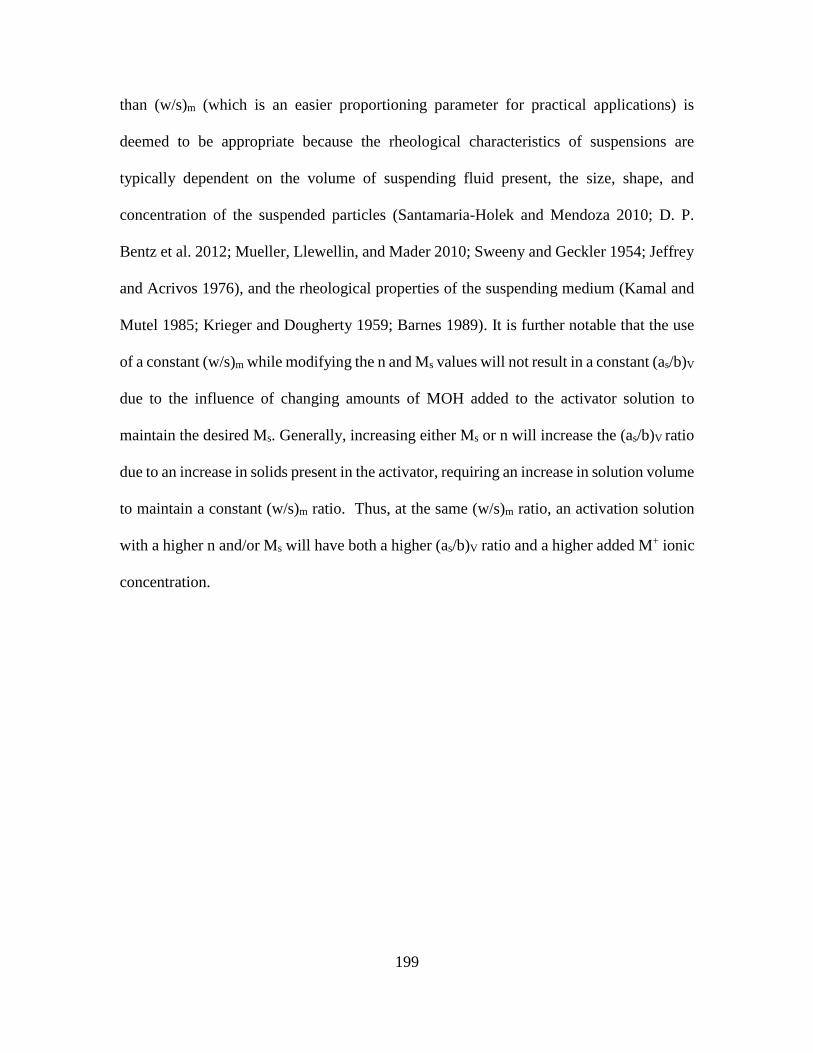
199
than (w/s)m (which is an easier proportioning parameter for practical applications) is
deemed to be appropriate because the rheological characteristics of suspensions are
typically dependent on the volume of suspending fluid present, the size, shape, and
concentration of the suspended particles (Santamaria-Holek and Mendoza 2010; D. P.
Bentz et al. 2012; Mueller, Llewellin, and Mader 2010; Sweeny and Geckler 1954; Jeffrey
and Acrivos 1976), and the rheological properties of the suspending medium (Kamal and
Mutel 1985; Krieger and Dougherty 1959; Barnes 1989). It is further notable that the use
of a constant (w/s)m while modifying the n and Ms values will not result in a constant (as/b)V
due to the influence of changing amounts of MOH added to the activator solution to
maintain the desired Ms. Generally, increasing either Ms or n will increase the (as/b)V ratio
due to an increase in solids present in the activator, requiring an increase in solution volume
to maintain a constant (w/s)m ratio. Thus, at the same (w/s)m ratio, an activation solution
with a higher n and/or Ms will have both a higher (as/b)V ratio and a higher added M+ ionic
concentration.
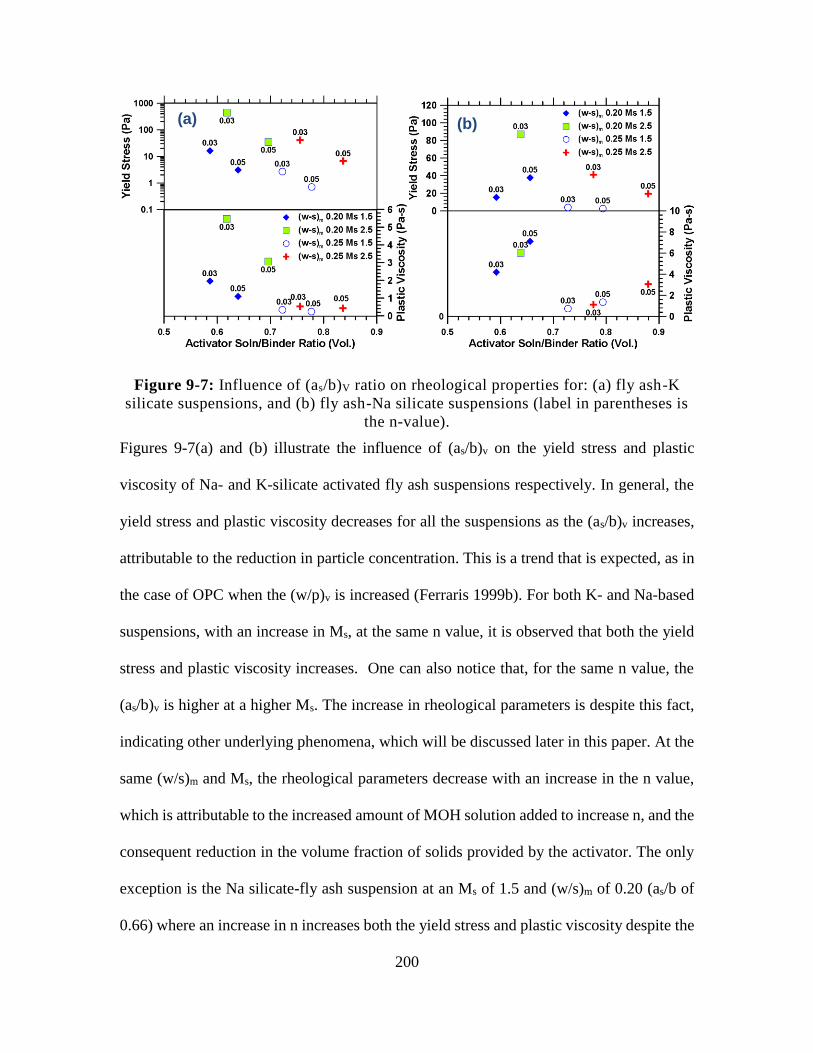
200
Figure 9-7: Influence of (as/b)V ratio on rheological properties for: (a) fly ash-K
silicate suspensions, and (b) fly ash-Na silicate suspensions (label in parentheses is
the n-value).
Figures 9-7(a) and (b) illustrate the influence of (as/b)v on the yield stress and plastic
viscosity of Na- and K-silicate activated fly ash suspensions respectively. In general, the
yield stress and plastic viscosity decreases for all the suspensions as the (as/b)v increases,
attributable to the reduction in particle concentration. This is a trend that is expected, as in
the case of OPC when the (w/p)v is increased (Ferraris 1999b). For both K- and Na-based
suspensions, with an increase in Ms, at the same n value, it is observed that both the yield
stress and plastic viscosity increases. One can also notice that, for the same n value, the
(as/b)v is higher at a higher Ms. The increase in rheological parameters is despite this fact,
indicating other underlying phenomena, which will be discussed later in this paper. At the
same (w/s)m and Ms, the rheological parameters decrease with an increase in the n value,
which is attributable to the increased amount of MOH solution added to increase n, and the
consequent reduction in the volume fraction of solids provided by the activator. The only
exception is the Na silicate-fly ash suspension at an Ms of 1.5 and (w/s)m of 0.20 (as/b of
0.66) where an increase in n increases both the yield stress and plastic viscosity despite the
(b) (a)
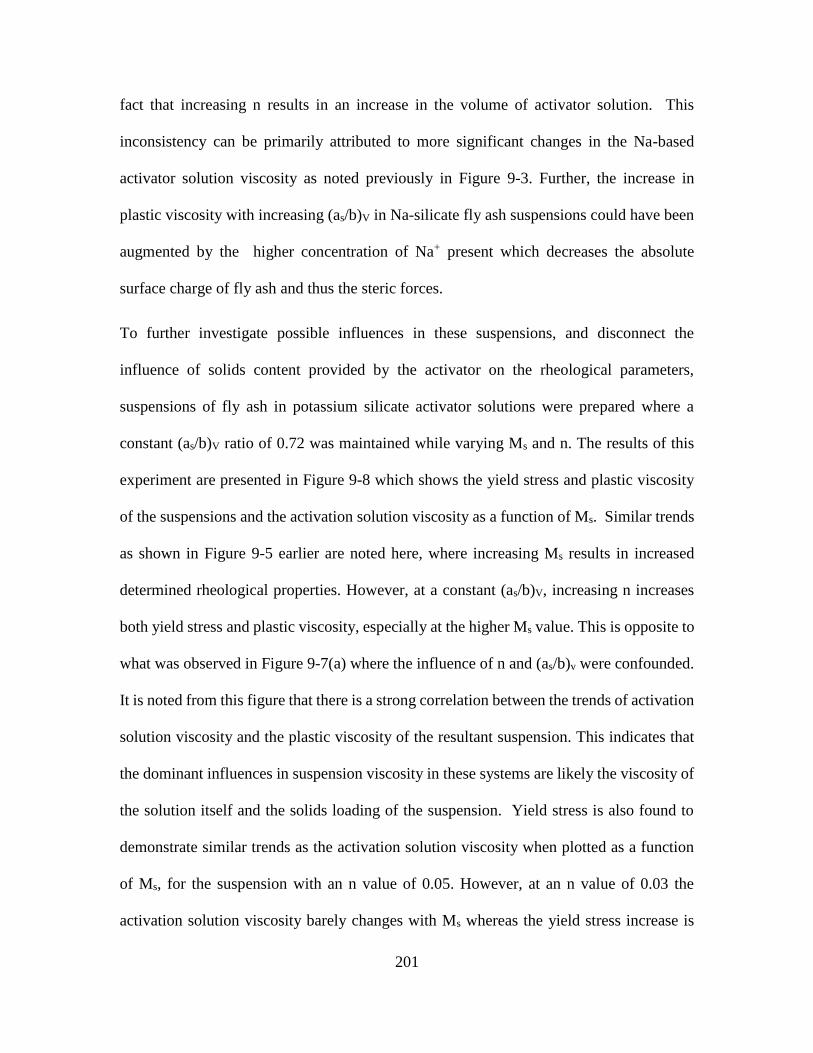
201
fact that increasing n results in an increase in the volume of activator solution. This
inconsistency can be primarily attributed to more significant changes in the Na-based
activator solution viscosity as noted previously in Figure 9-3. Further, the increase in
plastic viscosity with increasing (as/b)V in Na-silicate fly ash suspensions could have been
augmented by the higher concentration of Na+ present which decreases the absolute
surface charge of fly ash and thus the steric forces.
To further investigate possible influences in these suspensions, and disconnect the
influence of solids content provided by the activator on the rheological parameters,
suspensions of fly ash in potassium silicate activator solutions were prepared where a
constant (as/b)V ratio of 0.72 was maintained while varying Ms and n. The results of this
experiment are presented in Figure 9-8 which shows the yield stress and plastic viscosity
of the suspensions and the activation solution viscosity as a function of Ms. Similar trends
as shown in Figure 9-5 earlier are noted here, where increasing Ms results in increased
determined rheological properties. However, at a constant (as/b)V, increasing n increases
both yield stress and plastic viscosity, especially at the higher Ms value. This is opposite to
what was observed in Figure 9-7(a) where the influence of n and (as/b)v were confounded.
It is noted from this figure that there is a strong correlation between the trends of activation
solution viscosity and the plastic viscosity of the resultant suspension. This indicates that
the dominant influences in suspension viscosity in these systems are likely the viscosity of
the solution itself and the solids loading of the suspension. Yield stress is also found to
demonstrate similar trends as the activation solution viscosity when plotted as a function
of Ms, for the suspension with an n value of 0.05. However, at an n value of 0.03 the
activation solution viscosity barely changes with Ms whereas the yield stress increase is
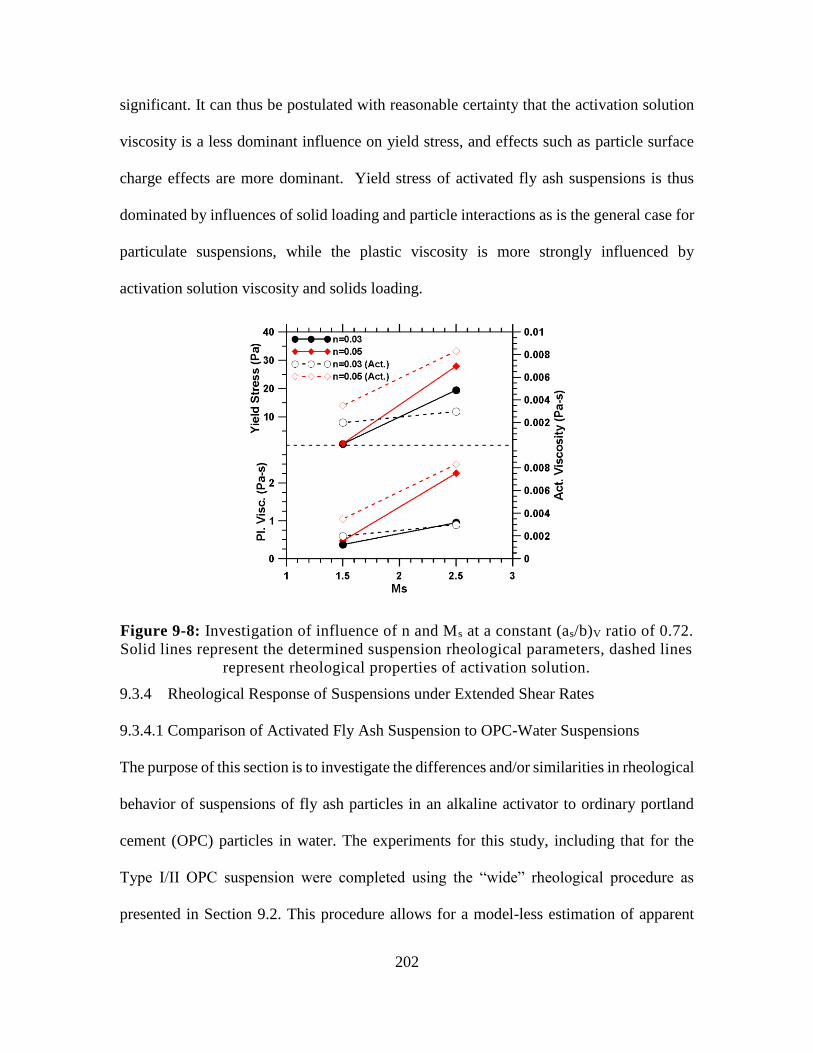
202
significant. It can thus be postulated with reasonable certainty that the activation solution
viscosity is a less dominant influence on yield stress, and effects such as particle surface
charge effects are more dominant. Yield stress of activated fly ash suspensions is thus
dominated by influences of solid loading and particle interactions as is the general case for
particulate suspensions, while the plastic viscosity is more strongly influenced by
activation solution viscosity and solids loading.
Figure 9-8: Investigation of influence of n and Ms at a constant (as/b)V ratio of 0.72.
Solid lines represent the determined suspension rheological parameters, dashed lines
represent rheological properties of activation solution.
9.3.4 Rheological Response of Suspensions under Extended Shear Rates
9.3.4.1 Comparison of Activated Fly Ash Suspension to OPC-Water Suspensions
The purpose of this section is to investigate the differences and/or similarities in rheological
behavior of suspensions of fly ash particles in an alkaline activator to ordinary portland
cement (OPC) particles in water. The experiments for this study, including that for the
Type I/II OPC suspension were completed using the “wide” rheological procedure as
presented in Section 9.2. This procedure allows for a model-less estimation of apparent
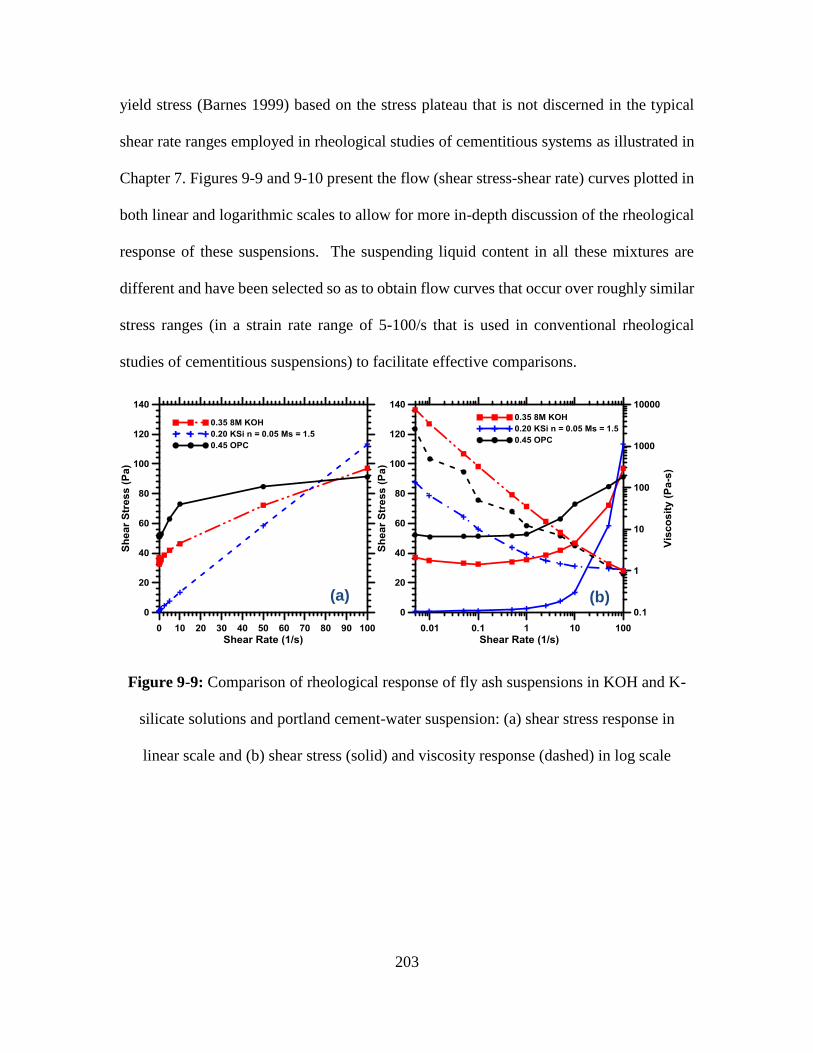
203
yield stress (Barnes 1999) based on the stress plateau that is not discerned in the typical
shear rate ranges employed in rheological studies of cementitious systems as illustrated in
Chapter 7. Figures 9-9 and 9-10 present the flow (shear stress-shear rate) curves plotted in
both linear and logarithmic scales to allow for more in-depth discussion of the rheological
response of these suspensions. The suspending liquid content in all these mixtures are
different and have been selected so as to obtain flow curves that occur over roughly similar
stress ranges (in a strain rate range of 5-100/s that is used in conventional rheological
studies of cementitious suspensions) to facilitate effective comparisons.
Figure 9-9: Comparison of rheological response of fly ash suspensions in KOH and K-
silicate solutions and portland cement-water suspension: (a) shear stress response in
linear scale and (b) shear stress (solid) and viscosity response (dashed) in log scale
(a) (b)
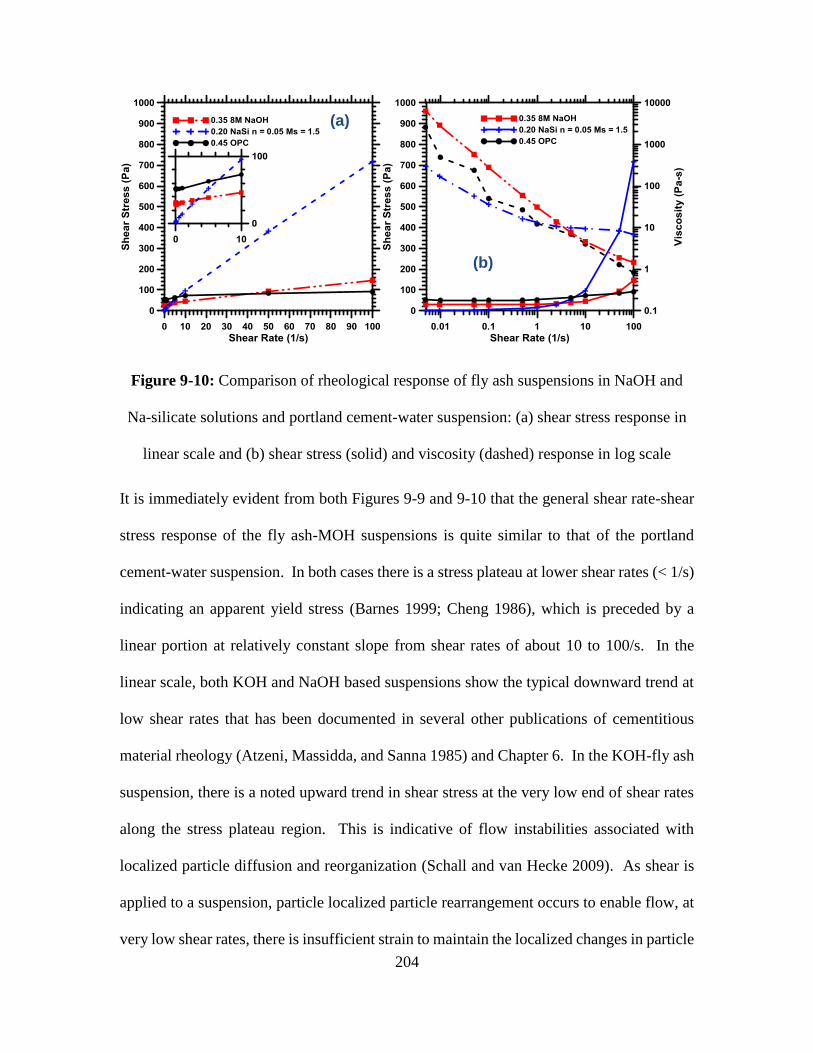
204
Figure 9-10: Comparison of rheological response of fly ash suspensions in NaOH and
Na-silicate solutions and portland cement-water suspension: (a) shear stress response in
linear scale and (b) shear stress (solid) and viscosity (dashed) response in log scale
It is immediately evident from both Figures 9-9 and 9-10 that the general shear rate-shear
stress response of the fly ash-MOH suspensions is quite similar to that of the portland
cement-water suspension. In both cases there is a stress plateau at lower shear rates (< 1/s)
indicating an apparent yield stress (Barnes 1999; Cheng 1986), which is preceded by a
linear portion at relatively constant slope from shear rates of about 10 to 100/s. In the
linear scale, both KOH and NaOH based suspensions show the typical downward trend at
low shear rates that has been documented in several other publications of cementitious
material rheology (Atzeni, Massidda, and Sanna 1985) and Chapter 6. In the KOH-fly ash
suspension, there is a noted upward trend in shear stress at the very low end of shear rates
along the stress plateau region. This is indicative of flow instabilities associated with
localized particle diffusion and reorganization (Schall and van Hecke 2009). As shear is
applied to a suspension, particle localized particle rearrangement occurs to enable flow, at
very low shear rates, there is insufficient strain to maintain the localized changes in particle
(a)
(b)
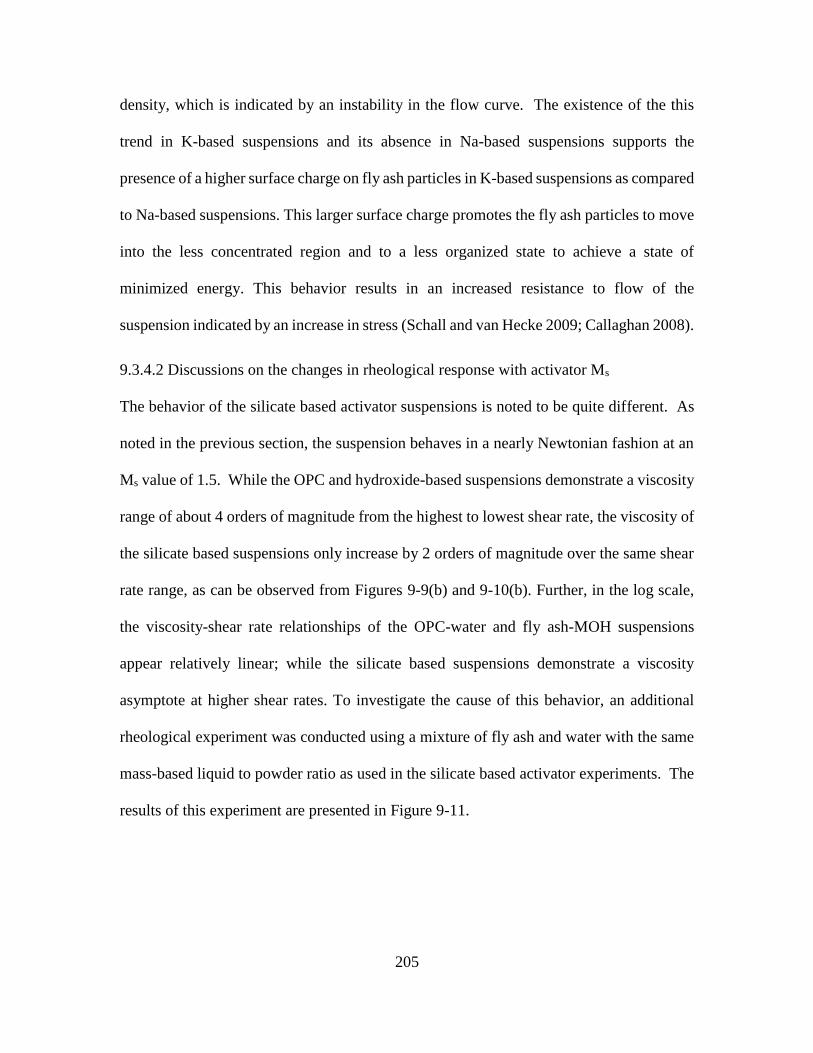
205
density, which is indicated by an instability in the flow curve. The existence of the this
trend in K-based suspensions and its absence in Na-based suspensions supports the
presence of a higher surface charge on fly ash particles in K-based suspensions as compared
to Na-based suspensions. This larger surface charge promotes the fly ash particles to move
into the less concentrated region and to a less organized state to achieve a state of
minimized energy. This behavior results in an increased resistance to flow of the
suspension indicated by an increase in stress (Schall and van Hecke 2009; Callaghan 2008).
9.3.4.2 Discussions on the changes in rheological response with activator Ms
The behavior of the silicate based activator suspensions is noted to be quite different. As
noted in the previous section, the suspension behaves in a nearly Newtonian fashion at an
Ms value of 1.5. While the OPC and hydroxide-based suspensions demonstrate a viscosity
range of about 4 orders of magnitude from the highest to lowest shear rate, the viscosity of
the silicate based suspensions only increase by 2 orders of magnitude over the same shear
rate range, as can be observed from Figures 9-9(b) and 9-10(b). Further, in the log scale,
the viscosity-shear rate relationships of the OPC-water and fly ash-MOH suspensions
appear relatively linear; while the silicate based suspensions demonstrate a viscosity
asymptote at higher shear rates. To investigate the cause of this behavior, an additional
rheological experiment was conducted using a mixture of fly ash and water with the same
mass-based liquid to powder ratio as used in the silicate based activator experiments. The
results of this experiment are presented in Figure 9-11.
206
Figure 9-11: Rheological study of 0.20 (w/s)m suspension of fly ash and water: (a)
linear scale and (b) logarithmic scale
The fly ash-water suspension indicates a rheological behavior that bears more resemblance
to that of the fly ash-MOH or OPC-water suspensions. In this case, a noted stress plateau
and an increase in viscosity by almost 4 orders of magnitude over the range of shear rates
investigated are observed. Given that the activation solutions in these suspensions have
viscosities of 0.0017 and 0.0054 Pa-s (Figure 9-3) for potassium silicate and sodium silicate
respectively, which are meaningfully greater than that of water (approximately 0.00089
Pa-s at 25 °C), this behavior is somewhat counterintuitive. It can be noted from Figures 9-
5 and 9-6 that at higher values of Ms, in all suspensions investigated, the existence of an
apparent yield stress is observed; i.e., the fly ash suspensions employing activators of
higher Ms are non-Newtonian. As the Newtonian behavior is not present in fly ash-water
suspensions, and it disappears at a higher value of Ms, this indicates a clear influence of the
siliceous species and the free M+ ion concentration present in the suspension. Additional
experiments were conducted at Ms values of 1.0 and 2.0 to investigate the range in which
this phenomenon is present, and the results are presented in Figure 9-12. At low Ms values
(1.0 and 1.5), the Newtonian shift is visible with the absence of a stress plateau in Figure
(a)
(b)
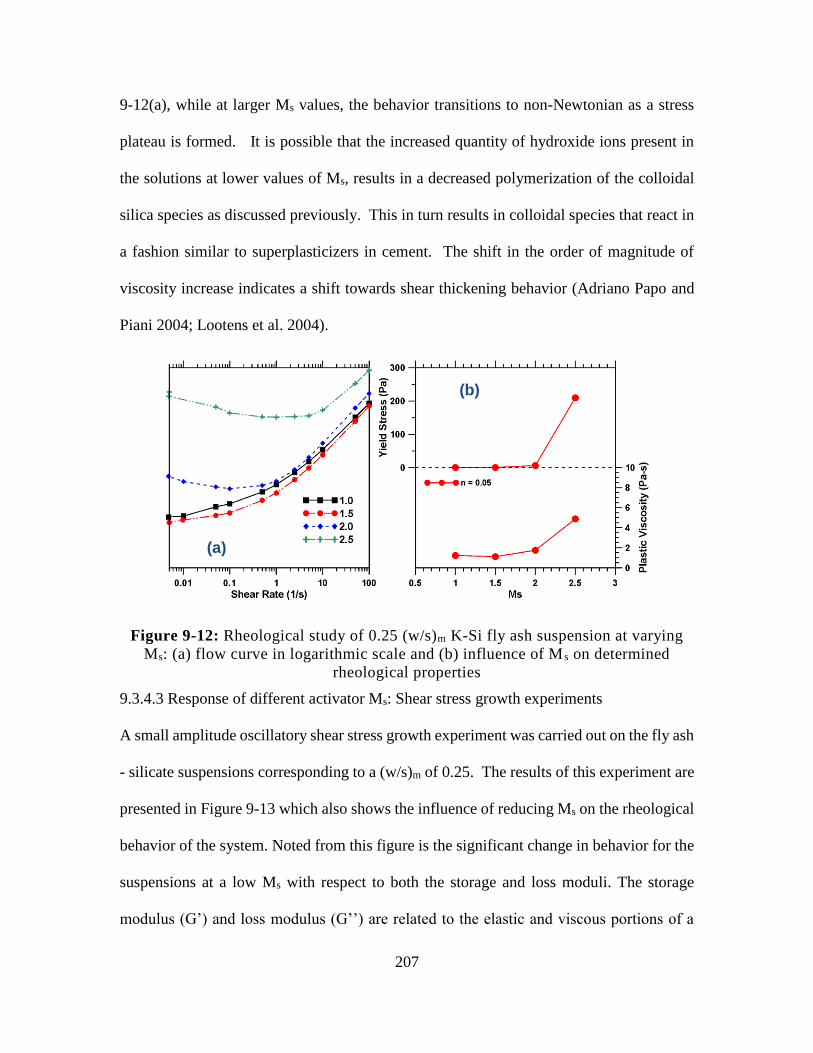
207
9-12(a), while at larger Ms values, the behavior transitions to non-Newtonian as a stress
plateau is formed. It is possible that the increased quantity of hydroxide ions present in
the solutions at lower values of Ms, results in a decreased polymerization of the colloidal
silica species as discussed previously. This in turn results in colloidal species that react in
a fashion similar to superplasticizers in cement. The shift in the order of magnitude of
viscosity increase indicates a shift towards shear thickening behavior (Adriano Papo and
Piani 2004; Lootens et al. 2004).
Figure 9-12: Rheological study of 0.25 (w/s)m K-Si fly ash suspension at varying
Ms: (a) flow curve in logarithmic scale and (b) influence of M s on determined
rheological properties
9.3.4.3 Response of different activator Ms: Shear stress growth experiments
A small amplitude oscillatory shear stress growth experiment was carried out on the fly ash
- silicate suspensions corresponding to a (w/s)m of 0.25. The results of this experiment are
presented in Figure 9-13 which also shows the influence of reducing Ms on the rheological
behavior of the system. Noted from this figure is the significant change in behavior for the
suspensions at a low Ms with respect to both the storage and loss moduli. The storage
modulus (G’) and loss modulus (G’’) are related to the elastic and viscous portions of a
(a)
(b)
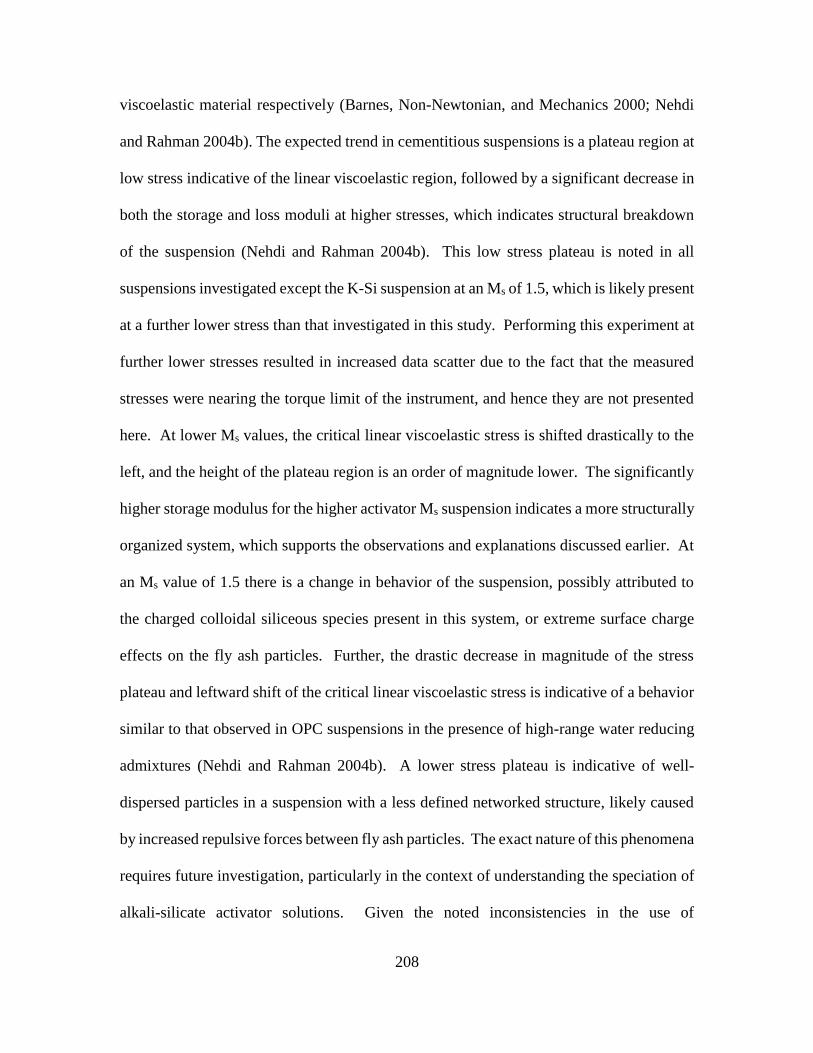
208
viscoelastic material respectively (Barnes, Non-Newtonian, and Mechanics 2000; Nehdi
and Rahman 2004b). The expected trend in cementitious suspensions is a plateau region at
low stress indicative of the linear viscoelastic region, followed by a significant decrease in
both the storage and loss moduli at higher stresses, which indicates structural breakdown
of the suspension (Nehdi and Rahman 2004b). This low stress plateau is noted in all
suspensions investigated except the K-Si suspension at an Ms of 1.5, which is likely present
at a further lower stress than that investigated in this study. Performing this experiment at
further lower stresses resulted in increased data scatter due to the fact that the measured
stresses were nearing the torque limit of the instrument, and hence they are not presented
here. At lower Ms values, the critical linear viscoelastic stress is shifted drastically to the
left, and the height of the plateau region is an order of magnitude lower. The significantly
higher storage modulus for the higher activator Ms suspension indicates a more structurally
organized system, which supports the observations and explanations discussed earlier. At
an Ms value of 1.5 there is a change in behavior of the suspension, possibly attributed to
the charged colloidal siliceous species present in this system, or extreme surface charge
effects on the fly ash particles. Further, the drastic decrease in magnitude of the stress
plateau and leftward shift of the critical linear viscoelastic stress is indicative of a behavior
similar to that observed in OPC suspensions in the presence of high-range water reducing
admixtures (Nehdi and Rahman 2004b). A lower stress plateau is indicative of well-
dispersed particles in a suspension with a less defined networked structure, likely caused
by increased repulsive forces between fly ash particles. The exact nature of this phenomena
requires future investigation, particularly in the context of understanding the speciation of
alkali-silicate activator solutions. Given the noted inconsistencies in the use of
209
superplasticizers in geopolymer suspensions (Palacios et al. 2009b), an understanding of
this phenomena may allow for optimization of the flow properties of geopolymer concretes
without the use of chemical admixtures.
Figure 9-13: Oscillatory shear study of 0.25 (w/s)m fly ash suspensions with (a) K-
Si based activator, and (b) Na-Si based activator
9.4 Conclusions
The influence of activator type and concentration on the rheological characteristics of fly
ash suspension is reported in this paper. Hydroxides and silicates of Na and K were used
as the activation solutions, the viscosities of which increased with molarity (for hydroxides)
or Ms (for silicates), with the Na-based activators demonstrating increased viscosity. The
rheological properties of NaOH or KOH activated fly ash were found to be primarily
influenced by the changes in the viscosity of the suspending fluid and surface charge of the
fly ash particles. Na-based suspensions demonstrated a large increase in viscosity due to
the more significant increase in the viscosity of the suspending fluid while K-based
suspensions showed a more significant increase in yield stress, attributed to the greater
adsorption of weakly hydrated K+ ions onto the surface of the fly ash particles, reducing
the repulsive effect between fly ash particles.
(a) (b)
210
The rheological response of fly ash-alkali silicate suspensions were found to be more
complex. The yield stress and plastic viscosity of suspensions were observed to increase
with Ms with the yield stress tending to zero (approaching a Newtonian behavior) at low
activator Ms values. Increasing the water-to-solids ratio and/or the n value of the suspension
resulted in significantly different yield stress and plastic viscosity trends for the Na- and
K-based suspensions, pointing to the influence of both the activation solution viscosity and
cationic adsorption on the fly ash particle surfaces that greatly influence the suspension
rheology. Experiments on suspensions with controlled activation solution-to-binder ratios
(volume-basis) showed the influence of several key parameters on the rheological
properties. The plastic viscosity was found to be influenced strongly by the solid loading
and the activation solution viscosity, while yield stress appears to be less influenced by
activation solution viscosity and more strongly influenced by interaction effects produced
by the surface charges on the fly ash particles, which are dependent on the cationic type.
In silicate based suspensions, at low Ms values, the suspension demonstrated a transition
to a Newtonian behavior, with a zero yield stress. While the OPC and hydroxide-based
suspensions demonstrated a viscosity range of about 4 orders of magnitude from the highest
to lowest shear rate (100/s to 0.005/s), the viscosity of the silicate based suspensions
increased by only 2 orders of magnitude over the same shear rate range. The fly ash-water
suspension also behaved similar to the OPC-water and fly ash-MOH suspensions. A small
amplitude oscillatory stress growth experiment showed that the critical linear viscoelastic
stress plateau shifts to much lower shear stress ranges, and the storage/loss moduli reduces
at lower Ms values, akin to the response of superplasticized cementitious suspensions. The
exact nature of this transition is not fully understood and requires additional work.
211
Rheological Characterization of Fresh Alkali Activated Slag Suspensions: Influence of
Activator Type
9.5 Introduction
Geopolymers are a type of gel binders that was first introduced by Davidovits in 1970 (4).
These materials are referred to using several names: (i) alkali-activated-cement (5), (ii)
inorganic polymer (6), (iii) geopolymer (4,7–10), and (iv) pozzolonas. These products can
be synthesized at room temperature by mixing reactive aluminosilicate materials with
strong alkaline solutions. These solution activators generally include hydroxides, silicates,
carbonates, aluminates etc. (such as NaOH, KOH, Na2SiO3, K2SiO3 etc.). The
aluminosilicate raw materials predominantly used are fly ash (class C and F), slag,
metakaolin etc. Although in our study we have used configurations of slags prominently,
some with combination of slag and fly ash as well. Geopolymers based on coal fly ash
display superior paste workability with less water, which may result in improved
mechanical properties (11). There has been some work done on the effects of admixtures
on geopolymer systems (12–15). Although very less research in rheology has been carried
out to study the effect of activator on the raw material and the resultant constitution of the
paste obtained (16,17).
Millions of tons of metallurgical slags, consisting mainly of silicate and glassy phases, are
produced every year. The generation of slags reaches almost 15% of the quantity of metal
produced (18–20). On rapidly chilling the molten slag with by immersion in water, a
vitreous phase of Ca-Al-Mg silicate fine grain is obtained having more cementations
properties. Slag contains much reactive SiO2 and Al2O3, and thus can prove to be a better
raw material to synthesize high value geopolymer. Large quantities of slags are still
disposed of in surface dumps or under the sea in several countries (8,21).
212
The current study aims to explore the rheological performance of slag based geopolymer
materials activated using solutions of sodium or potassium hydroxide as well as sodium or
potassium silicate. An understanding of the effects of activator constitution of the flow
properties of these suspensions provides insight into preferential activator methodologies
with respect to concrete workability, as well as gives insight into the nature of fresh
geopolymer materials. A review of the literature has found very little work done on the
influence of activator type and constitution on the rheological properties of these pastes
(15,16). This paper aims to add to the understanding of these systems as well as determine
the influence of activator type and constitution on the rheological properties of these
systems. The current study has three primary goals with respect to blast furnace slag based
geopolymeric suspensions: (Part 1) to determine the influence of activator type and
chemical constitution on the rheological properties in the fresh state and (Part 2) to examine
the nature of the rheological properties of these systems as compared with portland cement
and fly ash based suspensions.
9.6 Experimental Program
9.6.1 Experimental Materials
A low calcium slag was used for all experiments. Two different slags were used, the first
for the “Normal” range studies and the second for the “Wide” studies. The chemical
composition of these slags is presented in Table 10-1. Additionally, a fly ash was used for
rheological investigation of fly ash-slag mixtures. It is notable, that due to the flash setting
behavior of some alkali-activated slag systems, particularly with the second slag with
higher magnesium content, some rheological experiments could not be completed for
certain mixtures. Two different types of activators were used in this study, hydroxide based
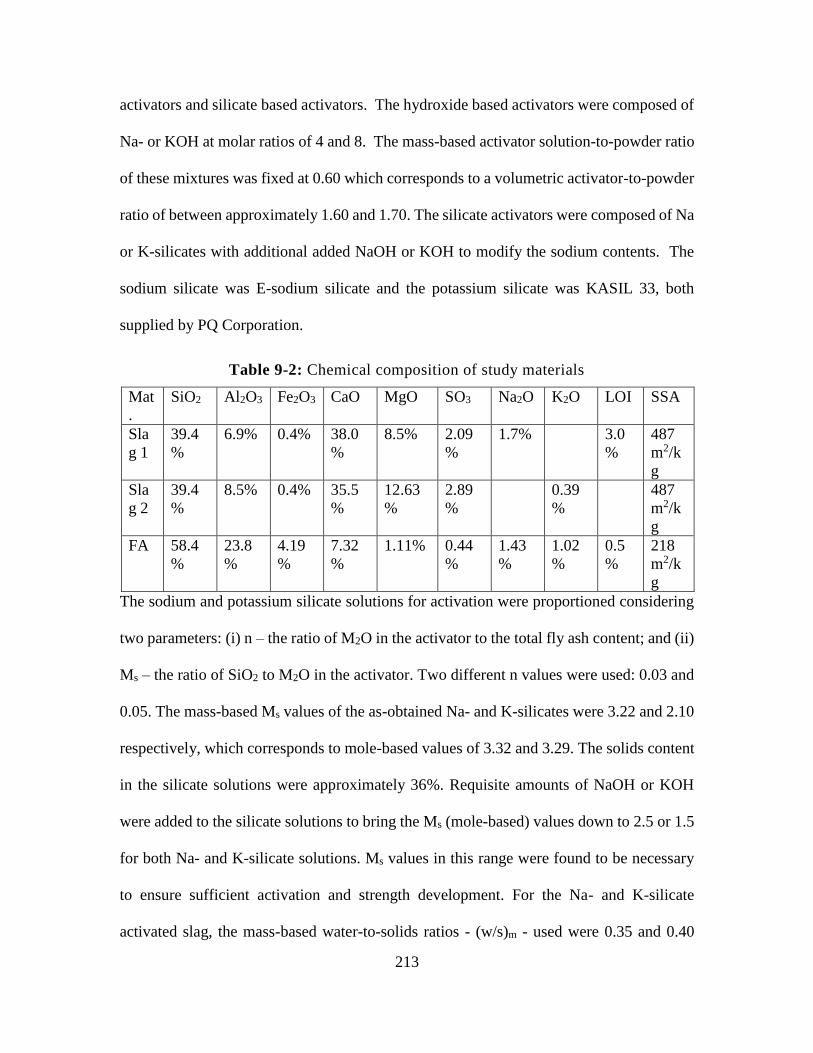
213
activators and silicate based activators. The hydroxide based activators were composed of
Na- or KOH at molar ratios of 4 and 8. The mass-based activator solution-to-powder ratio
of these mixtures was fixed at 0.60 which corresponds to a volumetric activator-to-powder
ratio of between approximately 1.60 and 1.70. The silicate activators were composed of Na
or K-silicates with additional added NaOH or KOH to modify the sodium contents. The
sodium silicate was E-sodium silicate and the potassium silicate was KASIL 33, both
supplied by PQ Corporation.
Table 9-2: Chemical composition of study materials
Mat
.
SiO2 Al2O3 Fe2O3 CaO MgO SO3 Na2O K2O LOI SSA
Sla
g 1
39.4
%
6.9% 0.4% 38.0
%
8.5% 2.09
%
1.7% 3.0
%
487
m2/k
g
Sla
g 2
39.4
%
8.5% 0.4% 35.5
%
12.63
%
2.89
%
0.39
%
487
m2/k
g
FA 58.4
%
23.8
%
4.19
%
7.32
%
1.11% 0.44
%
1.43
%
1.02
%
0.5
%
218
m2/k
g
The sodium and potassium silicate solutions for activation were proportioned considering
two parameters: (i) n – the ratio of M2O in the activator to the total fly ash content; and (ii)
Ms – the ratio of SiO2 to M2O in the activator. Two different n values were used: 0.03 and
0.05. The mass-based Ms values of the as-obtained Na- and K-silicates were 3.22 and 2.10
respectively, which corresponds to mole-based values of 3.32 and 3.29. The solids content
in the silicate solutions were approximately 36%. Requisite amounts of NaOH or KOH
were added to the silicate solutions to bring the Ms (mole-based) values down to 2.5 or 1.5
for both Na- and K-silicate solutions. Ms values in this range were found to be necessary
to ensure sufficient activation and strength development. For the Na- and K-silicate
activated slag, the mass-based water-to-solids ratios - (w/s)m - used were 0.35 and 0.40
214
which corresponds to a (as/p)v of between 1.09 and 1.39 and between 1.10 and 1.44 for
0.20 and 0.25 mixtures of K- and Na-silicate respectively.
9.6.2 Mixing and Testing Procedure
The experimental design has been divided into two distinct studies, the first a study using
typical shear rate ranges common in rheological studies of cementitious systems (REF),
and the second an exploration of these systems over wider shear rates to determine the
accuracy of model prediction and to more thoroughly compare these materials with
portland cement based materials as presented in Chapter 7.
Liquid activators were prepared prior to mixing with the binder (slag), and allowed to cool
to room temperature prior to use, typically a period of 3-4 hours. For rheological studies
of the activators, approximately 12 mL of solution was extracted using a disposable syringe
and placed in the rheometer geometry as soon as the solution had achieved room
temperature as measured by an infrared thermometer. For investigation of the fresh
geopolymer solutions, approximately 200g of the suspension was prepared and mixed in a
kitchen blender at the high setting using the following sequence: (1) initial hand mix to
disperse powder in activator and assure no powder has stuck to edges of mixing container,
(2) mixing in blender on high for 30 seconds, (3) 30 second covered rest period, and (4)
final mixing at high in blender for 30 seconds. This mixing sequence was selected as a
modification to the ASTM C1738 procedure, as it showed similar results, and the reduced
size of the kitchen blender versus the high shear blender allowed for significant material
savings. After mixing was completed, approximately 6mL of sample was extracted using
a disposable syringe and placed immediately in a TA Instruments AR2000EX rotational
rheometer configured for the given experiment. For the characterization of the activator
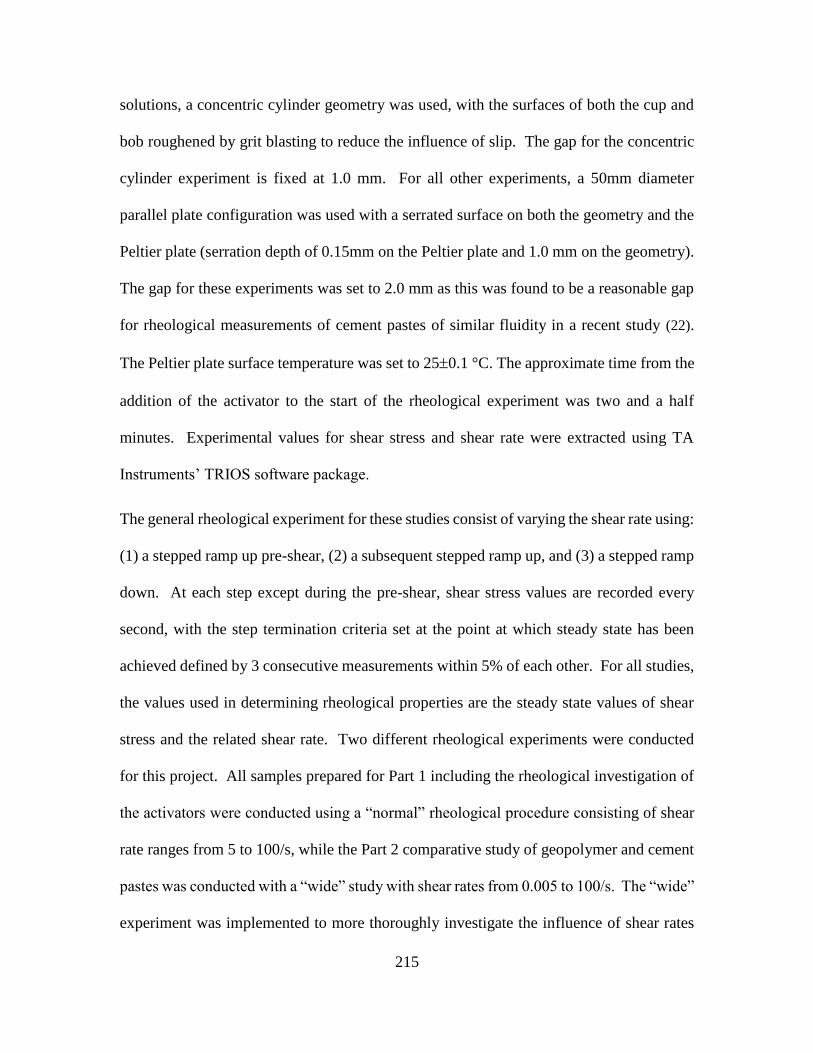
215
solutions, a concentric cylinder geometry was used, with the surfaces of both the cup and
bob roughened by grit blasting to reduce the influence of slip. The gap for the concentric
cylinder experiment is fixed at 1.0 mm. For all other experiments, a 50mm diameter
parallel plate configuration was used with a serrated surface on both the geometry and the
Peltier plate (serration depth of 0.15mm on the Peltier plate and 1.0 mm on the geometry).
The gap for these experiments was set to 2.0 mm as this was found to be a reasonable gap
for rheological measurements of cement pastes of similar fluidity in a recent study (22).
The Peltier plate surface temperature was set to 250.1 °C. The approximate time from the
addition of the activator to the start of the rheological experiment was two and a half
minutes. Experimental values for shear stress and shear rate were extracted using TA
Instruments’ TRIOS software package.
The general rheological experiment for these studies consist of varying the shear rate using:
(1) a stepped ramp up pre-shear, (2) a subsequent stepped ramp up, and (3) a stepped ramp
down. At each step except during the pre-shear, shear stress values are recorded every
second, with the step termination criteria set at the point at which steady state has been
achieved defined by 3 consecutive measurements within 5% of each other. For all studies,
the values used in determining rheological properties are the steady state values of shear
stress and the related shear rate. Two different rheological experiments were conducted
for this project. All samples prepared for Part 1 including the rheological investigation of
the activators were conducted using a “normal” rheological procedure consisting of shear
rate ranges from 5 to 100/s, while the Part 2 comparative study of geopolymer and cement
pastes was conducted with a “wide” study with shear rates from 0.005 to 100/s. The “wide”
experiment was implemented to more thoroughly investigate the influence of shear rates
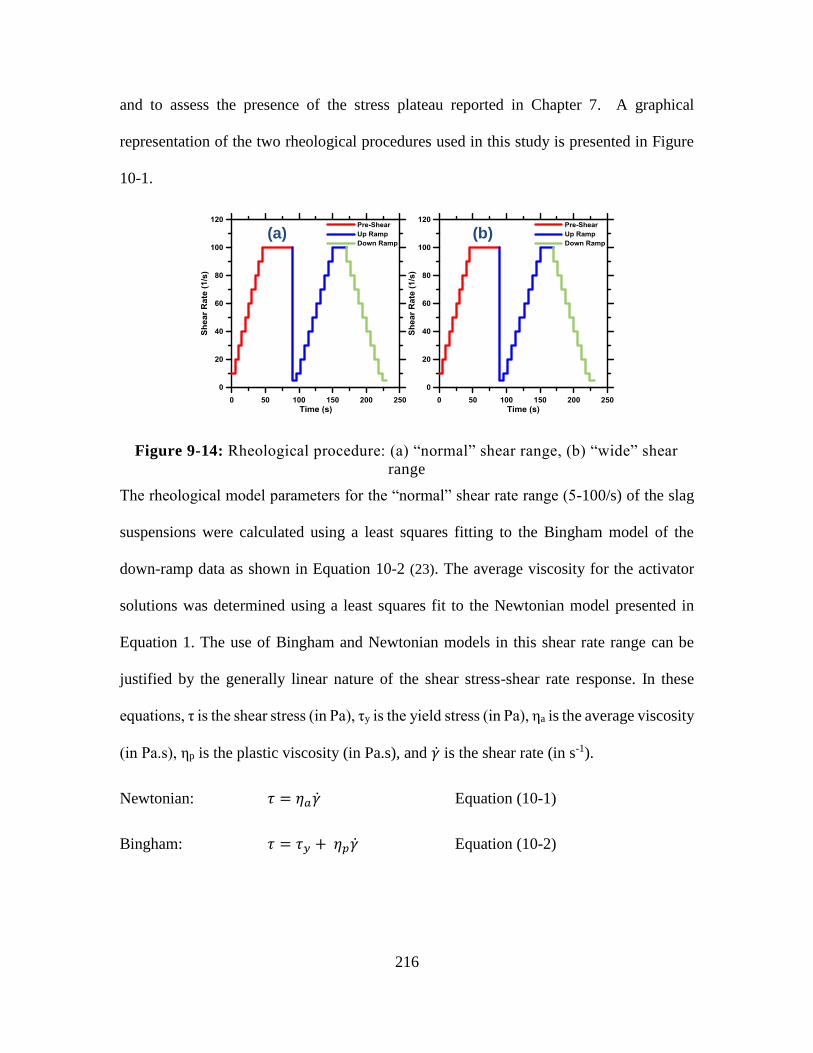
216
and to assess the presence of the stress plateau reported in Chapter 7. A graphical
representation of the two rheological procedures used in this study is presented in Figure
10-1.
Figure 9-14: Rheological procedure: (a) “normal” shear range, (b) “wide” shear
range
The rheological model parameters for the “normal” shear rate range (5-100/s) of the slag
suspensions were calculated using a least squares fitting to the Bingham model of the
down-ramp data as shown in Equation 10-2 (23). The average viscosity for the activator
solutions was determined using a least squares fit to the Newtonian model presented in
Equation 1. The use of Bingham and Newtonian models in this shear rate range can be
justified by the generally linear nature of the shear stress-shear rate response. In these
equations, τ is the shear stress (in Pa), τy is the yield stress (in Pa), ηa is the average viscosity
(in Pa.s), ηp is the plastic viscosity (in Pa.s), and �̇� is the shear rate (in s-1).
Newtonian: 𝜏 = 𝜂𝑎�̇� Equation (10-1)
Bingham: 𝜏 = 𝜏𝑦 + 𝜂𝑝�̇� Equation (10-2)
(b) (a)
217
9.7 Results and Discussions
This section discusses the influence of the constitution of the alkali activator solution on
determined rheological parameters extracted using the Bingham model. Rheological
studies of the activator solution itself, as well as the influences of the activator solution on
the resultant slag geopolymer suspension are presented.
9.7.1 Rheological Behavior of Activated Solution
A rheological study of the activator solutions were performed using the “normal”
procedure as discussed in Section 2 and the concentric cylinder geometry. Sodium and
potassium based activators were examined to explore the influence of molarity as well as
alkali ion on the rheological properties of the activator solutions. Additionally,
experiments were completed on both sodium and potassium silicate solutions to investigate
the influence of n, Ms and alkali ion on the rheological properties of these solutions. All
of the activator solutions investigated indicated Newtonian behavior over the range of shear
rates investigated, indicating, as would be expected for an aqueous solution, the lack of a
yield stress. The average viscosity was extracted using a least squares fit to the Newtonian
model (Equation 10-1), with a stress intercept set to zero. A typical flow diagram of this
activator study is presented in Figure 10-2, indicating Newtonian behavior.
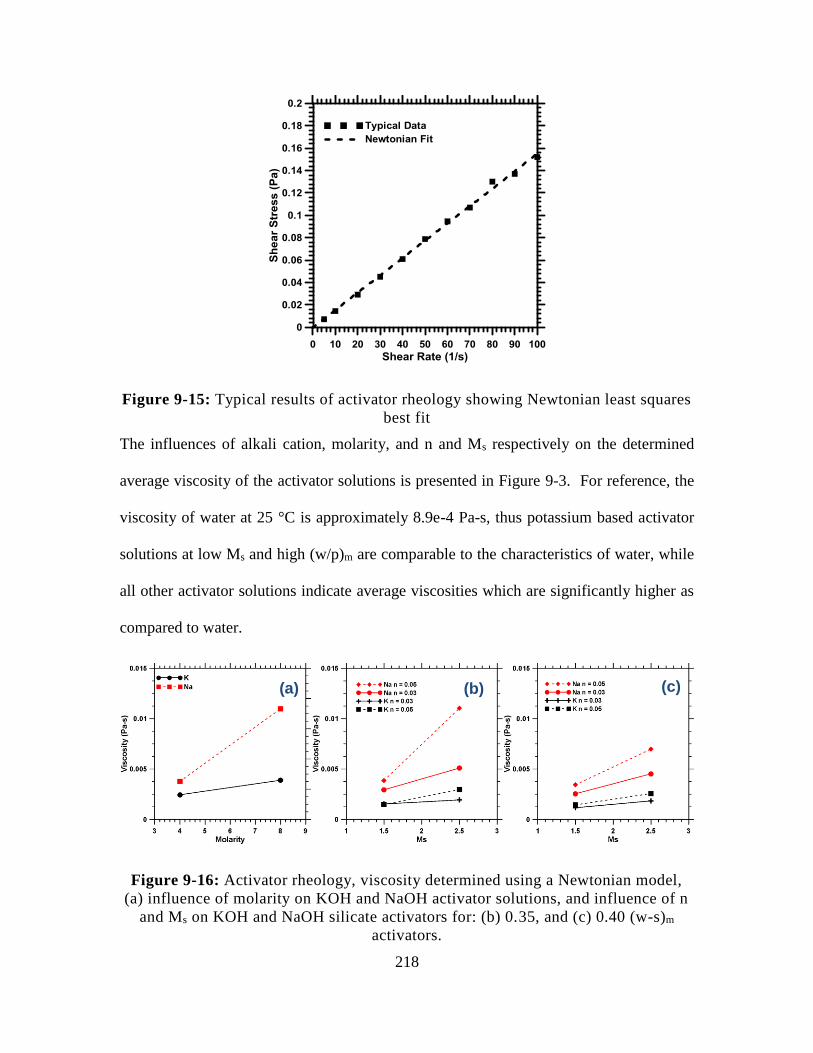
218
Figure 9-15: Typical results of activator rheology showing Newtonian least squares
best fit
The influences of alkali cation, molarity, and n and Ms respectively on the determined
average viscosity of the activator solutions is presented in Figure 9-3. For reference, the
viscosity of water at 25 °C is approximately 8.9e-4 Pa-s, thus potassium based activator
solutions at low Ms and high (w/p)m are comparable to the characteristics of water, while
all other activator solutions indicate average viscosities which are significantly higher as
compared to water.
Figure 9-16: Activator rheology, viscosity determined using a Newtonian model,
(a) influence of molarity on KOH and NaOH activator solutions, and influence of n
and Ms on KOH and NaOH silicate activators for: (b) 0.35, and (c) 0.40 (w-s)m
activators.
(b) (a) (c)
219
The results presented are similar to those in a companion study on fly ash geopolymer
suspensions reported in Chapter 9, as would be expected. For a more thorough discussion
of changes in rheological behavior in the activator solutions the author directs the readers
to Chapter 9. However, it is generally noted that increasing the molarity in hydroxide based
solutions result in an increase in average viscosity, further this increase is more substantial
in Na based solutions. This behavior is attributed to the greater charge density of the Na+
ions in solution which results in more significant ion-dipole forces as compared to the less
charge dense K+ ions. With alkali-silicate solutions, it is noted that an increase in Ms
corresponds with an increase in activator viscosity. It has been reported that both ionic and
colloidal silica species are present in these solutions (24,25). Decreasing the Ms of the
solution requires the increased inclusion of alkali-hydroxide, the presence of these
hydroxides break Si-O-Si chains in the polymerized colloidal species, resulting in
decreased molecular size and decreased polymerization. This subsequently results in a
decrease in determined activator viscosity, due to decreased colloidal particle size.
Alternatively, as the n-value is decreased, this indicates an increase in silicon, which would
result in an increase in colloidal molecule concentration and increase the activator
viscosity. Comparing the values for Na and K-based solutions in alkali-silica solutions,
Na-based solutions are noted to have significantly higher determined viscosities at the same
value of n and Ms. This behavior is attributed to the fact that due to the relative molecular
weights of the two alkali elements, there is a significantly higher ionic quantity of Na
required as compared to K, when combined with the fact that sodium ions are more charge
dense, results in significantly higher determined rheological properties.
220
9.7.2 Rheological Behavior of Fresh Slag Suspensions Activated Using KOH or NaOH
Rheological studies of fresh slag suspensions were performed with plain cation-hydroxide
based activators. These studies were performed using the “Normal” shear rate range as
presented in Section 10.2, with rheological parameters determined using a least squares fit
of the Bingham model (Equation 10-2).
The results of rheological studies of hydroxide based slag geopolymers are presented in
Figure 10-4. Notable from this figure are the generally increasing trends in both plastic
viscosity and yield stress with increasing molarity. Further, at all levels tested, sodium
based suspensions have a higher determined yield stress and plastic viscosity than
potassium-based suspensions. For both potassium and sodium based activator solutions,
yield stress is noted to increase at approximately the same rate, while plastic viscosity
increases more drastically in the case of sodium based activator solutions.
The yield stress of concentrated suspensions is dictated by particle interactions,
interparticle forces (Van der Waals and steric), and the viscosity of the suspending fluid
(26–30). As the volume of suspending fluid is roughly constant in these experiments, the
effects of particle interactions and Van der Waals forces can be neglected from this
comparative discussion. The increase in yield stress with increasing Ms can thus be
partially attributed to the increase in activator viscosity as presented in Figure 10-2. It is,
however, noted from Figure 10-2 that Na-based suspensions show a significantly higher
increase in activator viscosity as compared to K-based suspensions. As the upper panel in
Figure 10-4 indicates a consistent increase between Na and K-based suspensions, there is
clearly a secondary effect present. Based on the above listed influences on yield stress, it
is clear that this effect is interparticle steric (repulsive) forces. Zeta potential studies of the
221
slag at a neutral pH indicate that it possesses a negative surface charge under these
conditions, which is in general agreement with the literature (31,32). Zeta potential studies
of these suspensions under the experimental conditions of this study were not possible due
to the extremely high pH of the system (on the order of 14) and particle concentrations in
excess of the instrument specifications. Thus, zeta potential studies were performed on a
significantly more dilute solution with a pH of about 10, these results cannot conclusively
be used to verify the behavior of these suspensions in this study, as the ion concentrations
would be 4 orders of magnitude greater, however they generally indicate that K-based
suspensions have a lower absolute surface charge (closer to zero) than Na-based
suspensions. This result is consistent with that reported by (33), where the poorly hydrated
K+ ion adsorbs more readily on the surface of the particle resulting in a more significant
change in surface charge in the presence of K+ ions as compared to the well hydrated Na+
ions. Thus, the consistent trend with respect to yield stress can be explained as follows. In
Na-based suspensions, increasing the molarity results in an increase in activator viscosity
and a negligible change in slag particle surface charge, thus the more significant increase
in activator viscosity is counteracted by the large interparticle repulsive forces between
slag particles. Conversely, in K-based suspensions the diminished increase in activator
viscosity is supplemented by the diminished influence of steric forces due to a decrease in
the absolute surface charge of the slag particles, which results in a decrease in repulsive
forces between slag particles.
The determined plastic viscosity results in the lower panel of Figure 10-4 indicate a trend
that is similar in nature to the viscosity of the activator solutions presented in Figure 10-2.
Increasing the molarity of the solution results in a more significant increase in plastic
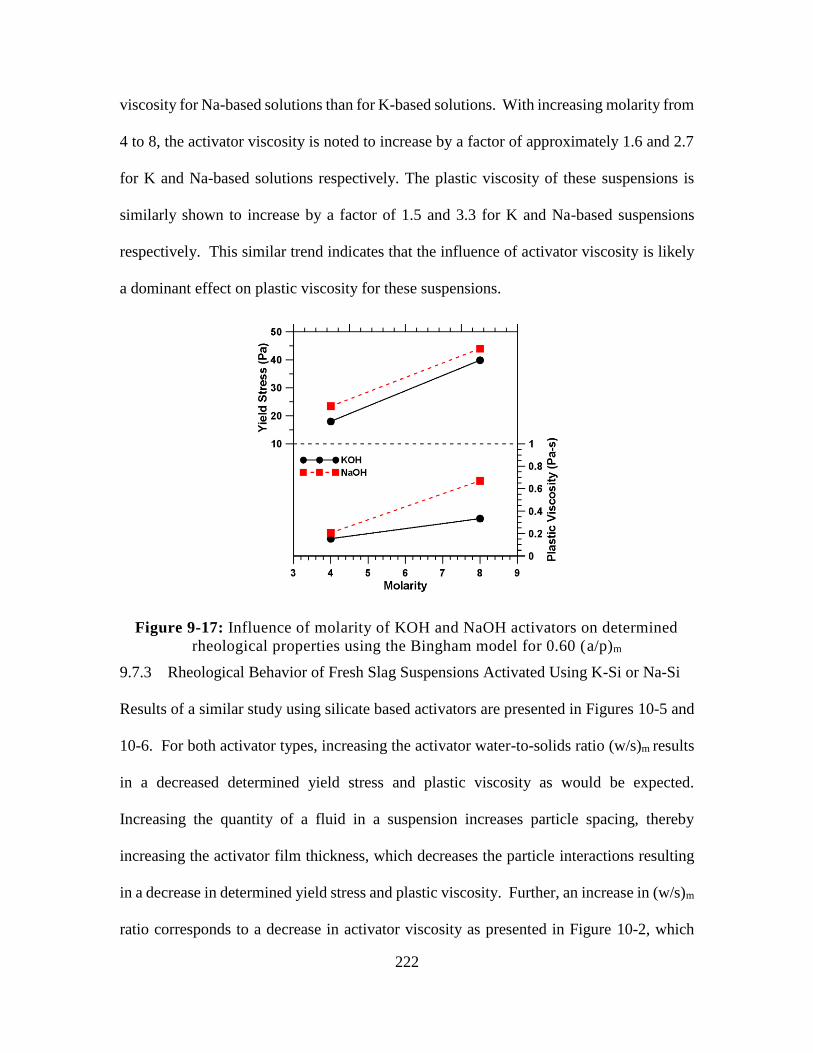
222
viscosity for Na-based solutions than for K-based solutions. With increasing molarity from
4 to 8, the activator viscosity is noted to increase by a factor of approximately 1.6 and 2.7
for K and Na-based solutions respectively. The plastic viscosity of these suspensions is
similarly shown to increase by a factor of 1.5 and 3.3 for K and Na-based suspensions
respectively. This similar trend indicates that the influence of activator viscosity is likely
a dominant effect on plastic viscosity for these suspensions.
Figure 9-17: Influence of molarity of KOH and NaOH activators on determined
rheological properties using the Bingham model for 0.60 (a/p)m
9.7.3 Rheological Behavior of Fresh Slag Suspensions Activated Using K-Si or Na-Si
Results of a similar study using silicate based activators are presented in Figures 10-5 and
10-6. For both activator types, increasing the activator water-to-solids ratio (w/s)m results
in a decreased determined yield stress and plastic viscosity as would be expected.
Increasing the quantity of a fluid in a suspension increases particle spacing, thereby
increasing the activator film thickness, which decreases the particle interactions resulting
in a decrease in determined yield stress and plastic viscosity. Further, an increase in (w/s)m
ratio corresponds to a decrease in activator viscosity as presented in Figure 10-2, which
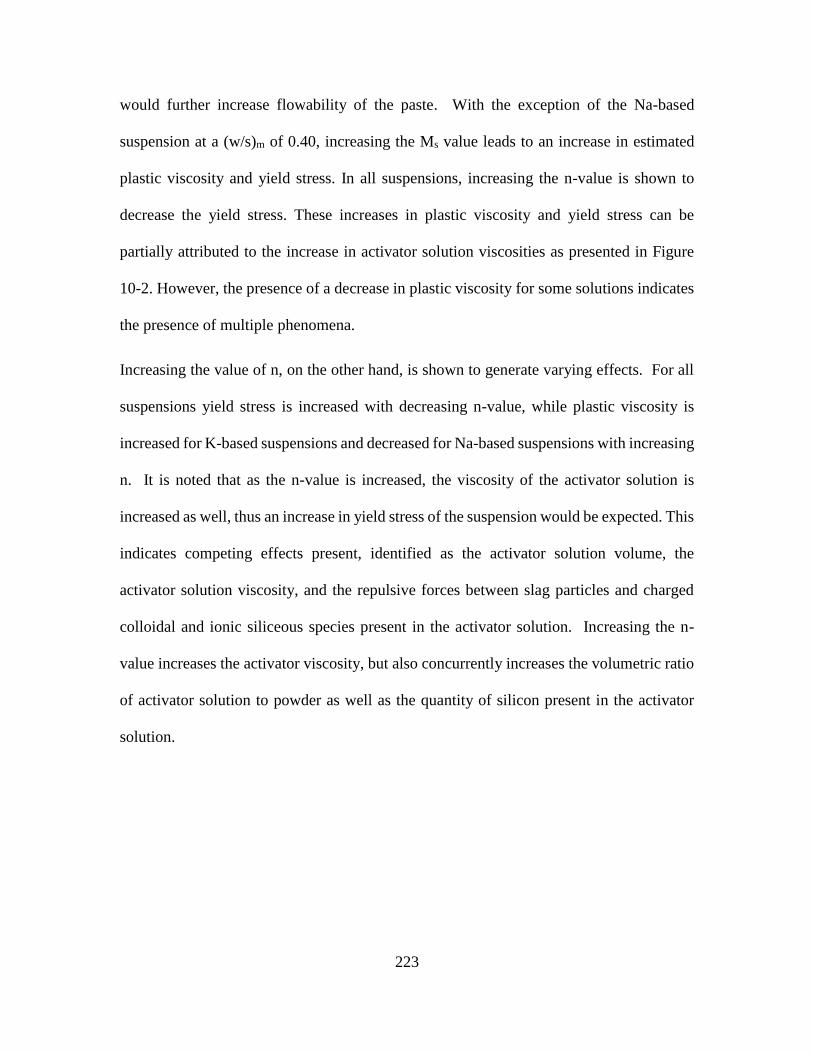
223
would further increase flowability of the paste. With the exception of the Na-based
suspension at a (w/s)m of 0.40, increasing the Ms value leads to an increase in estimated
plastic viscosity and yield stress. In all suspensions, increasing the n-value is shown to
decrease the yield stress. These increases in plastic viscosity and yield stress can be
partially attributed to the increase in activator solution viscosities as presented in Figure
10-2. However, the presence of a decrease in plastic viscosity for some solutions indicates
the presence of multiple phenomena.
Increasing the value of n, on the other hand, is shown to generate varying effects. For all
suspensions yield stress is increased with decreasing n-value, while plastic viscosity is
increased for K-based suspensions and decreased for Na-based suspensions with increasing
n. It is noted that as the n-value is increased, the viscosity of the activator solution is
increased as well, thus an increase in yield stress of the suspension would be expected. This
indicates competing effects present, identified as the activator solution volume, the
activator solution viscosity, and the repulsive forces between slag particles and charged
colloidal and ionic siliceous species present in the activator solution. Increasing the n-
value increases the activator viscosity, but also concurrently increases the volumetric ratio
of activator solution to powder as well as the quantity of silicon present in the activator
solution.
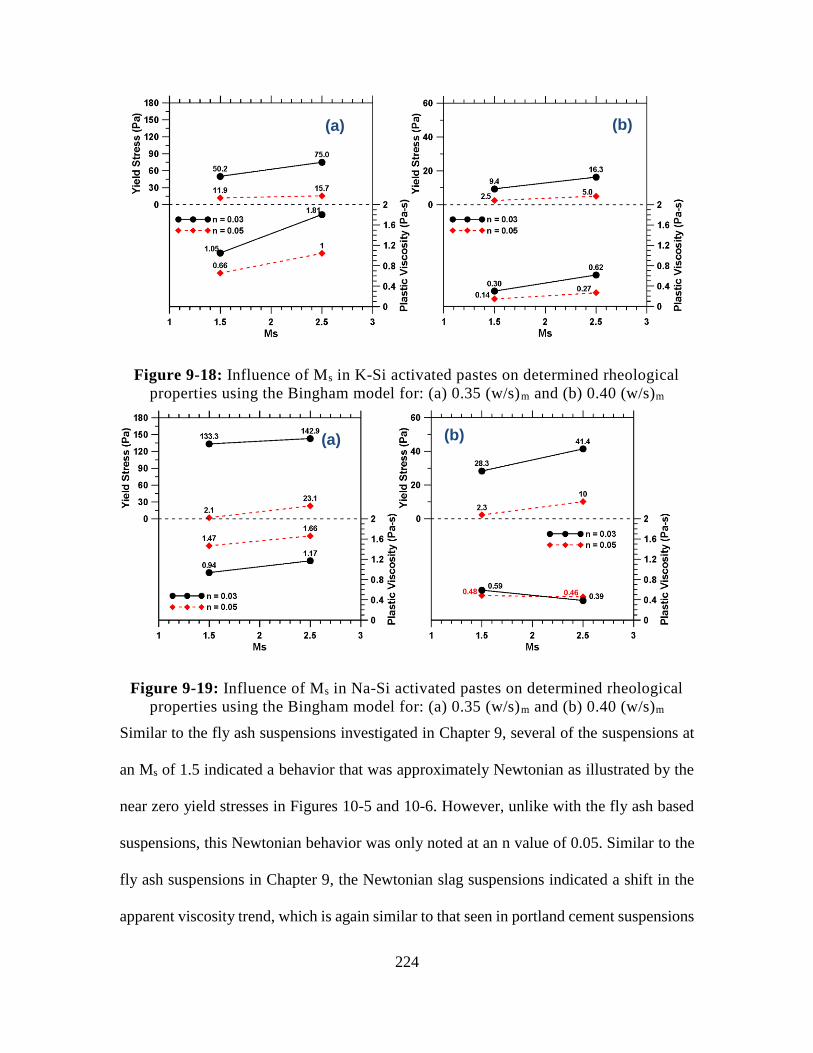
224
Figure 9-18: Influence of Ms in K-Si activated pastes on determined rheological
properties using the Bingham model for: (a) 0.35 (w/s)m and (b) 0.40 (w/s)m
Figure 9-19: Influence of Ms in Na-Si activated pastes on determined rheological
properties using the Bingham model for: (a) 0.35 (w/s)m and (b) 0.40 (w/s)m
Similar to the fly ash suspensions investigated in Chapter 9, several of the suspensions at
an Ms of 1.5 indicated a behavior that was approximately Newtonian as illustrated by the
near zero yield stresses in Figures 10-5 and 10-6. However, unlike with the fly ash based
suspensions, this Newtonian behavior was only noted at an n value of 0.05. Similar to the
fly ash suspensions in Chapter 9, the Newtonian slag suspensions indicated a shift in the
apparent viscosity trend, which is again similar to that seen in portland cement suspensions
(b) (a)
(b) (a)
225
with superplasticizers present. This indicates that this Newtonian shift may be resultant
from the presence of charged siliceous species present in the activator solution acting to
repulse slag particles and decrease the influence of agglomeration formation thereby
increasing the available free solution and increasing the flowability of the paste.
Further notable from Figures 10-5 and 10-6 is the increase in flowability of the suspension
when silicates are present as compared to without (Figure 10-4). For the suspensions
investigated, the volumetric activator solution to powder ratio for hydroxide based
suspensions is approximately 1.6, while for silicate based suspensions it varies from
approximately 1.2 to 1.4 at a (w/s)m of 0.40. Comparing Figure 10-4 with Figures 10-5(b)
and 10-6(b), it is noted that all of the silicate based suspensions had comparable or lower
determined rheological properties, while the volume of the suspending fluid was lower.
This effect may be partially attributed to the fact that the viscosity of these activating
solutions at a (w/s)m of 0.40 was considerably lower for silicate based activators as
compared to pure hydroxide based activators. The increased flowability of silicate based
suspensions compared to hydroxide based suspensions may also be attributed to the charge
of the siliceous species present in the activator solution and the increased absolute surface
charge of the slag particles in the presence of siliceous species resulting in increased steric
forces between slag particles.
To further explore the nature of these suspensions, Figure 10-7 presents the results of the
above data plotted against the activator solution to powder ratio (As/p)V. It is notable that
this ratio is different from the (w/s)m ratio in that it is the volumetric ratio of the total
activator solution (including dissolved solids) to the volume of powder added, while the
(w/s)m ratio is the mass ratio of water to all solids added (including those added in the
226
activator). The (As/p)V ratio is a more appropriate ratio for these studies as rheological
performance of suspensions is strongly influenced by the volumetric ratio of the
suspending solution to the suspending particles. Figure 10-7 illustrates an expected trend
in these suspensions of decreasing measured rheological properties with increasing (As/p)V,
as an increased volume of suspending solution increases particle spacing and decreases
particle interaction. However, this trend is not as consistent as would be expected with
increasing volume of solution for typical suspensions. For K-silicate suspensions (Figure
10-7(a)), the trend is quite consistent for both determined yield stress and plastic viscosity,
with two approximately parallel lines as the volume of activator solution is increased, with
the higher offset line noted to be the values at the higher Ms. This offset may be partially
attributed to changes in the viscosity of the activator solution as presented in Figure 10-2.
Increasing Ms is noted to increase the viscosity of the activator, which would subsequently
decrease the flowability of the suspension. For Na-silicate suspensions (Figure 10-7(b)),
the trend is less consistent. Yield stress continues to show a generally decreasing trend with
increasing (As/p)V, however as Figure 10-7(b), there is a noted increase in scatter. The two
points that deviate most significantly from this trend are noted to again be at n-values of
0.05 and Ms values of 1.5, the points that indicate a transition to Newtonian behavior. The
increase in scatter may also be attributed to the more significant influence of activator
viscosity. Similarly, the plastic viscosity figure for Na-silicate suspensions show increased
scatter with respect to (As/p)V, though the general trend is decreasing plastic viscosity with
increasing (As/p)V. As previously noted, unlike for K-silicate suspensions, increasing the
n-value increases the plastic viscosity, a behavior indicating a more significant influence
of activator viscosity and a decreased influence of ion adsorption on the surface of slag.
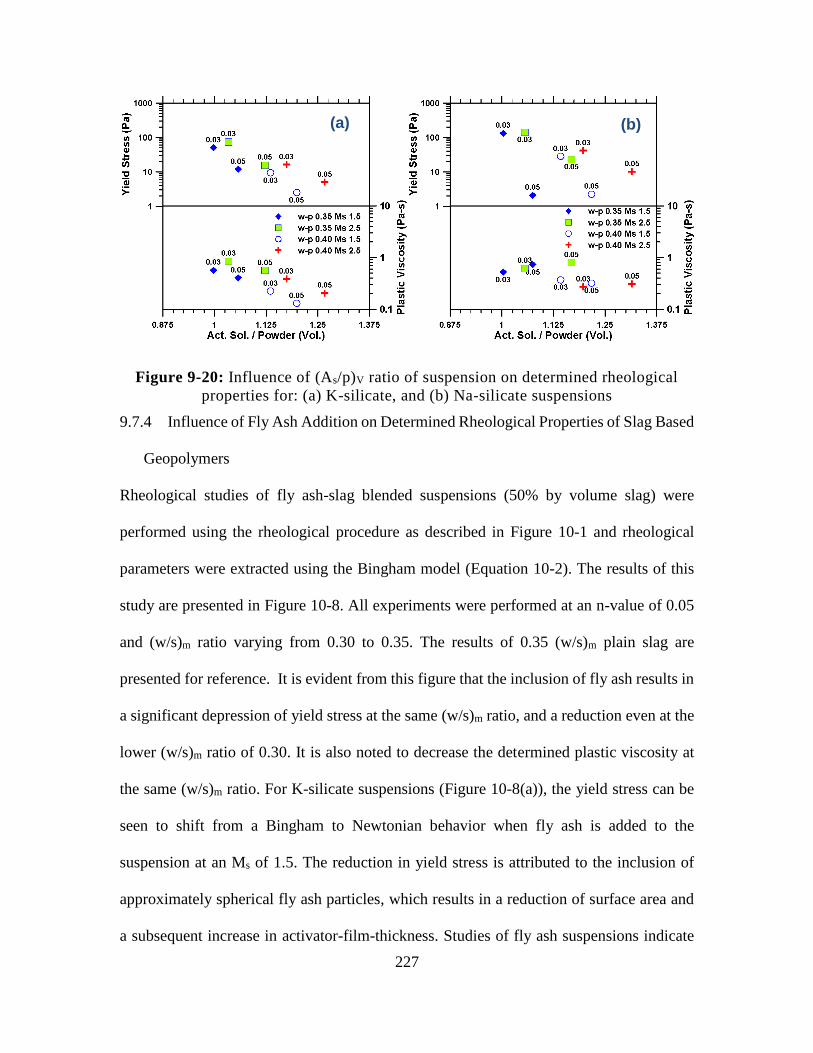
227
Figure 9-20: Influence of (As/p)V ratio of suspension on determined rheological
properties for: (a) K-silicate, and (b) Na-silicate suspensions
9.7.4 Influence of Fly Ash Addition on Determined Rheological Properties of Slag Based
Geopolymers
Rheological studies of fly ash-slag blended suspensions (50% by volume slag) were
performed using the rheological procedure as described in Figure 10-1 and rheological
parameters were extracted using the Bingham model (Equation 10-2). The results of this
study are presented in Figure 10-8. All experiments were performed at an n-value of 0.05
and (w/s)m ratio varying from 0.30 to 0.35. The results of 0.35 (w/s)m plain slag are
presented for reference. It is evident from this figure that the inclusion of fly ash results in
a significant depression of yield stress at the same (w/s)m ratio, and a reduction even at the
lower (w/s)m ratio of 0.30. It is also noted to decrease the determined plastic viscosity at
the same (w/s)m ratio. For K-silicate suspensions (Figure 10-8(a)), the yield stress can be
seen to shift from a Bingham to Newtonian behavior when fly ash is added to the
suspension at an Ms of 1.5. The reduction in yield stress is attributed to the inclusion of
approximately spherical fly ash particles, which results in a reduction of surface area and
a subsequent increase in activator-film-thickness. Studies of fly ash suspensions indicate
(b) (a)
228
Newtonian behavior at an Ms value of 1.5 as noted in Chapter 9, thus the inclusion of fly
ash promotes the shift to this behavior. This behavior importantly illustrates that the surface
charge of fly ash and slag in these suspensions is likely of the same sign, otherwise addition
of fly ash would likely have shown yield stress increases due to the presence of interparticle
attractive forces between particles with opposite surface charges. Plastic viscosity similarly
decreases to the increased flowability of the solution resultant from the inclusion of
spherical fly ash particles with a lower surface area increasing the amount of free
suspending solution present and decreasing particle contacts.
Similarly, for Na-silicate suspensions (Figure 10-7(b)) both the yield stress is seen to
decrease at either (w/s)m ratio studied and the plastic viscosity is shown to decrease at the
same (w/s)m ratio. However, the reduction is not as significant at the low Ms when
compared to K-silicate suspensions. This is due to the fact that the Newtonian behavior is
already present in slag suspensions at this (w/s)m, n-value and Ms (Figure 10-6(b)). As with
K-silicate suspensions, the changes in yield stress and plastic viscosity with fly ash addition
are attributed to the decrease in surface area and inclusion of the spherical fly ash particles
which enhance flow. Similarly, the decrease upon fly ash addition indicates a likely same
sign of surface charge for fly ash and slag in these Na-silicate solutions.
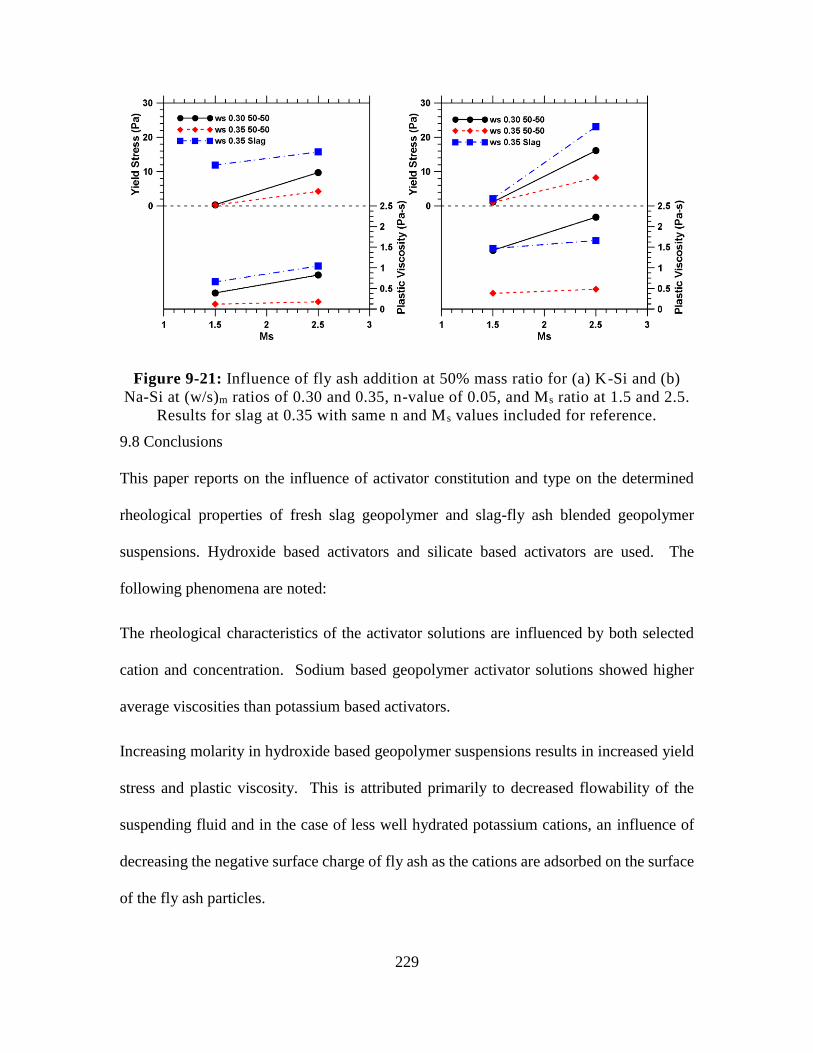
229
Figure 9-21: Influence of fly ash addition at 50% mass ratio for (a) K-Si and (b)
Na-Si at (w/s)m ratios of 0.30 and 0.35, n-value of 0.05, and Ms ratio at 1.5 and 2.5.
Results for slag at 0.35 with same n and Ms values included for reference.
9.8 Conclusions
This paper reports on the influence of activator constitution and type on the determined
rheological properties of fresh slag geopolymer and slag-fly ash blended geopolymer
suspensions. Hydroxide based activators and silicate based activators are used. The
following phenomena are noted:
The rheological characteristics of the activator solutions are influenced by both selected
cation and concentration. Sodium based geopolymer activator solutions showed higher
average viscosities than potassium based activators.
Increasing molarity in hydroxide based geopolymer suspensions results in increased yield
stress and plastic viscosity. This is attributed primarily to decreased flowability of the
suspending fluid and in the case of less well hydrated potassium cations, an influence of
decreasing the negative surface charge of fly ash as the cations are adsorbed on the surface
of the fly ash particles.
230
Silicate based suspensions illustrate a more complex behavior. At intermediate Ms values
the fluid behavior transitions to Newtonian, with a very low yield stress, the existing of a
similar behavior in fly ash based geopolymer suspensions indicate that this effect is likely
due to the chemical composition of the activator solution and may be related to the presence
of highly charged colloidal siliceous species present acting to disperse slag particles.
However, the nature of this phenomena requires further exploration.
231
10. CONCLUSIONS
10.1 Part I Conclusion
The use of limestone as portland cement replacement is thoroughly investigated from an
early age hydration and pore structure perspective with and without the inclusion of
additional alumina. Several key aspects are noted:
There is a noted size effect of limestone inclusion, when limestone which is as
coarse as OPC is used, it acts primarily as a filler, leading to a reduction in desired
mechanical properties and pore structure characteristics, with no noted hydration
benefits. This effect is attributed to a dilution of OPC in the system. Fine limestone
illustrates more beneficial properties, enhancing the tortuosity and accelerating
hydration product formation, with minimized impacts on strength.
The addition of alumina (fly ash or metakaolin) in limestone replacement systems
is shown to be beneficial with respect to hydration product formation, hydration,
and pore structure.
10.2 Part II Conclusion
The rheological characterization of various cementitious materials brought about
explorations of several key phenomena in these systems:
The influence of dispersion, electrostatic repulsive forces, and solid loading are
found to be dominant on the determined apparent yield stress. Plastic viscosity, on
the other hand, is not particularly influenced by interparticle forces, however is
more strongly influenced by the viscosity of the suspending solution.
232
A yield stress plateau method is used and confirmed to be reliable for determination
of rheological properties in concentrated suspensions, it is shown to be less prone
to error than other commonly used models.
The influence of limestone in cementitious systems is fully explored, it is noted that
limestone inclusion decreases net interparticle attractive forces in the particle
network, decreasing the yield stress when all other suspension parameters are held
constant. The size effect is crucial to suspensions, where despite the increase in
attractive forces, inclusion of fine limestone increases determined rheological
properties due to increased surface area and decreased particle spacing and water
film thickness.
10.3 Future Work
The following is a brief overview of proposed activities to continue the work in this
dissertation
Further investigation of the rheological nature of concentrated suspensions,
including effects of particle self-diffusion and localized areas of lower particle
concentration. These effects influence the flow of cementitious suspensions, and
may have influences on later age durability characteristics.
Investigations of the chemical nature of alkali activator solutions, including
investigations of their nature and the chemical species present in the solutions. This
exploration will provide insight into the Newtonian transition noted in some alkali
activated geopolymer suspensions.
Further investigation of the pore structure of portland limestone cement systems,
including investigations of potential synergistic benefits of inclusion of alumina
sources in these mixtures. Impedance spectroscopy and thermoporometry will
provide additional insight into the nature of these hardened pastes.

233
Investigating the use of rheometry to determine the time dependent viscoelastic
property development of cementitious pastes using oscillatory shear techniques.
234
BIBLIOGRAPHY
Alonso, C, C Andrade, M Castellote, and P Castro. 2000. “Chloride Threshold Values to
Depassivate Reinforcing Bars Embedded in a Standardized OPC Mortar.” Cement
and Concrete Research 30 (7): 1047–55. doi:10.1016/S0008-8846(00)00265-9.
Ambroise, J., S. Maximilien, and J. Pera. 1994. “Properties of Metakaolin Blended
Cements.” Advanced Cement Based Materials 1 (4): 161–68.
Antoni, M., J. Rossen, F. Martirena, and K. Scrivener. 2012. “Cement Substitution by a
Combination of Metakaolin and Limestone.” Cement and Concrete Research 42
(12): 1579–89. doi:10.1016/j.cemconres.2012.09.006.
Asaga, K., and D.M. Roy. 1980. “Rheological Properties of Cement Mixes: IV. Effects of
Superplasticizers on Viscosity and Yield Stress.” Cement and Concrete Research
10 (2): 287–95. doi:10.1016/0008-8846(80)90085-X.
Astarita, Gianni. 1990. “Letter to the Editor: The Engineering Reality of the Yield
Stress.” Journal of Rheology 34: 275.
“ASTM C109 / C109M - 12 Standard Test Method for Compressive Strength of
Hydraulic Cement Mortars (Using 2-In. or [50-Mm] Cube Specimens).” 2012. In
ASTM International, West Conshohocken, PA.
“ASTM C109-13. Standard Test Method for Compressive Strength of Hydraulic Cement
Mortars Using 2-In. Cube Specimens.” 2013. In ASTM International, West
Conshohocken, PA.
“ASTM C1157/C1157M-11 Standard Performance Specification for Hydraulic Cement.”
2013. In ASTM International, West Conshohocken, PA.
“ASTM C143 - 12. Standard Test Method for Slump of Hydraulic-Cement Concrete.”
2012. In ASTM International, West Conshohocken, PA.
“ASTM C150 / C150M - 12. Standard Specification for Portland Cement.” 2012. In
ASTM International, West Conshohocken, PA.
“ASTM C1738 - 11a. Standard Practice for High-Shear Mixing of Hydraulic Cement
Paste.” 2011. In ASTM International, West Conshohocken, PA.
“ASTM C568 / C568M - 10. Standard Specification for Limestone Dimension Stone.”
2012. In ASTM International, West Conshohocken, PA.
“ASTM C595/595M-13 Standard Specification for Blended Hydraulic Cements.” 2013.
In ASTM International, West Conshohocken, PA.
Atahan, Hakan Nuri, Osman Nuri Oktar, and Mehmet Ali Tasdemir. 2009. “Effects of
Water–cement Ratio and Curing Time on the Critical Pore Width of Hardened
Cement Paste.” Construction and Building Materials 23 (3): 1196–1200.
Atzeni, C., L. Massidda, and U. Sanna. 1985. “Comparison between Rheological Models
for Portland Cement Pastes.” Cement and Concrete Research 15 (3): 511–19.
doi:16/0008-8846(85)90125-5.
235
Badogiannis, E., G. Kakali, G. Dimopoulou, E. Chaniotakis, and S. Tsivilis. 2005.
“Metakaolin as a Main Cement Constituent. Exploitation of Poor Greek Kaolins.”
Cement and Concrete Composites 27 (2): 197–203.
Bágel’, L’., and V. Živica. 1997. “Relationship between Pore Structure and Permeability
of Hardened Cement Mortars: On the Choice of Effective Pore Structure
Parameter.” Cement and Concrete Research 27 (8): 1225–35. doi:10.1016/S0008-
8846(97)00111-7.
Bager, Dirch H., and Erik J. Sellevold. 1975. “Mercury Porosimetry of Hardened Cement
Paste: The Influence of Particle Size.” Cement and Concrete Research 5 (2): 171–
77.
Bakharev, T., J. G. Sanjayan, and Y. B. Cheng. 2000. “Effect of Admixtures on
Properties of Alkali-Activated Slag Concrete.” Cement and Concrete Research 30
(9): 1367–74.
Banfill, P. F. G. 2003. “Rheology of Fresh Cement and Concrete - A Review.” In
Durban.
———. 2006. “Rheology of Fresh Cement and Concrete.” Rheology Reviews 2006: 61.
Banfill, P. F. G., and others. 2003. “The Rheology of Fresh Cement and Concrete-a
Review.” In Proceedings of the 11th International Cement Chemistry Congress,
50–62.
Banfill, P.F.G., and D.C. Saunders. 1981. “On the Viscometric Examination of Cement
Pastes.” Cement and Concrete Research 11 (3): 363–70. doi:10.1016/0008-
8846(81)90108-3.
Barnes, H. A, Institute of Non-Newtonian, and Fluid Mechanics. 2000. A Handbook of
Elementary Rheology. Univ. of Wales, Institute of Non-Newtonian Fluid
Mechanics.
Barnes, H. A. 1989. “Shear-Thickening (‘dilatancy’) in Suspensions of Nonaggregating
Solid Particles Dispersed in Newtonian Liquids.” Journal of Rheology 33: 329.
———. 1999. “The Yield Stress—a Review or ‘παντα Ρε$ıota$’—everything Flows?”
Journal of Non-Newtonian Fluid Mechanics 81 (1): 133–78.
Barnes, H. A., and K. Walters. 1985. “The Yield Stress Myth?” Rheologica Acta 24 (4):
323–26.
Bayod, Elena, Ene Pilman Willers, and Eva Tornberg. 2008. “Rheological and Structural
Characterization of Tomato Paste and Its Influence on the Quality of Ketchup.”
LWT-Food Science and Technology 41 (7): 1289–1300.
Beaudoin, J. J. 1979. “Porosity Measurement of Some Hydrated Cementitious Systems
by High Pressure Mercury Intrusion-Microstructural Limitations.” Cement and
Concrete Research 9 (6): 771–81. doi:10.1016/0008-8846(79)90073-5.
Bensted, John. 1999. “Thaumasite -- Background and Nature in Deterioration of
Cements, Mortars and Concretes.” Cement and Concrete Composites 21 (2): 117–
21. doi:16/S0958-9465(97)00076-0.
236
Bentz, D., E. F Irassar, B. Bucher, and W. J Weiss. 2009a. “Limestone Fillers Conserve
Cement: Part 1: An Analysis Based on Powers Model.” Concrete International 31
(11): 41–46.
———. 2009b. “Limestone Fillers Conserve Cement; Part 2: Durability Issues and the
Effects of Limestone Fineness on Mixtures.” Concrete International 31 (12): 35–
39.
Bentz, D. P, and C. F Ferraris. 2010. “Rheology and Setting of High Volume Fly Ash
Mixtures.” Cement and Concrete Composites 32 (4): 265–70.
Bentz, D. P., C. F. Ferraris, M. A. Galler, A. S. Hansen, and J. M. Guynn. 2012.
“Influence of Particle Size Distributions on Yield Stress and Viscosity of
Cement–fly Ash Pastes.” Cement and Concrete Research.
http://www.sciencedirect.com/science/article/pii/S0008884611002912.
Bentz, D. P., T. Sato, I. de la Varga, and W. J. Weiss. 2011. “Fine Limestone Additions
to Regulate Setting in High Volume Fly Ash Mixtures.” Cement and Concrete
Composites.
http://www.sciencedirect.com.ezproxy1.lib.asu.edu/science/article/pii/S09589465
11001612.
Bentz, D.P. 2005. “Replacement of ‘Coarse’ Cement Particles by Inert Fillers in Low
W/c Ratio Concretes: II. Experimental Validation.” Cement and Concrete
Research 35 (1): 185–88. doi:16/j.cemconres.2004.09.003.
Bentz, Dale P. 2006. “Influence of Water-to-Cement Ratio on Hydration Kinetics: Simple
Models Based on Spatial Considerations.” Cement and Concrete Research 36 (2):
238–44. doi:10.1016/j.cemconres.2005.04.014.
———. 2007. “Cement Hydration: Building Bridges and Dams at the Microstructure
Level.” Materials and Structures 40 (4): 397–404.
Bentz, Dale P., Edward J. Garboczi, Claus J. Haecker, and Ole M. Jensen. 1999. “Effects
of Cement Particle Size Distribution on Performance Properties of Portland
Cement-Based Materials.” Cement and Concrete Research 29 (10): 1663–71.
doi:10.1016/S0008-8846(99)00163-5.
Bentz, Dale P., and Nicos S. Martys. 1994. “Hydraulic Radius and Transport in
Reconstructed Model Three-Dimensional Porous Media.” Transport in Porous
Media 17 (3): 221–38.
Bentz, Dale P., and Max A. Peltz. 2008. “Reducing Thermal and Autogenous Shrinkage
Contributions to Early-Age Cracking.” ACI Materials Journal 105 (4).
http://www.concrete.org/Publications/ACIMaterialsJournal/ACIJournalSearch.asp
x?m=details&ID=19904.
Bernal, Susan A., Ruby Mejía de Gutiérrez, and John L. Provis. 2012. “Engineering and
Durability Properties of Concretes Based on Alkali-Activated Granulated Blast
Furnace Slag/metakaolin Blends.” Construction and Building Materials 33: 99–
108.
237
Bhatty, J.I., and P.F.G. Banfill. 1982. “Sedimentation Behaviour in Cement Pastes
Subjected to Continuous Shear in Rotational Viscometers.” Cement and Concrete
Research 12 (1): 69–78. doi:10.1016/0008-8846(82)90100-4.
Bijen, Jan. 1996. “Benefits of Slag and Fly Ash.” Construction and Building Materials
10 (5): 309–14.
Bingham, E. C. 1922. “Fluidity and Plasticity.” http://orton.catie.ac.cr/cgi-
bin/wxis.exe/?IsisScript=BFHIA.xis&method=post&formato=2&cantidad=1&ex
presion=mfn=011959.
Board, National Research Council (U S. ) Building Research Advisory. 1969. Chemical
Soil Stabilization. National Academies.
Bonavetti, V., H. Donza, G. Menéndez, O. Cabrera, and E. F. Irassar. 2003. “Limestone
Filler Cement in Low W/c Concrete: A Rational Use of Energy.” Cement and
Concrete Research 33 (6): 865–71. doi:16/S0008-8846(02)01087-6.
Bonavetti, V. L., V. F. Rahhal, and E. F. Irassar. 2001. “Studies on the Carboaluminate
Formation in Limestone Filler-Blended Cements.” Cement and Concrete
Research 31 (6): 853–59. doi:16/S0008-8846(01)00491-4.
Brady, John F. 1993. “The Rheological Behavior of Concentrated Colloidal Dispersions.”
Journal of Chemical Physics 99 (1): 567–81.
Bullard, Jeffrey W., Hamlin M. Jennings, Richard A. Livingston, Andre Nonat, George
W. Scherer, Jeffrey S. Schweitzer, Karen L. Scrivener, and Jeffrey J. Thomas.
2011. “Mechanisms of Cement Hydration.” Cement and Concrete Research 41
(12): 1208–23.
Burgos-Montes, Olga, Marta Palacios, Patricia Rivilla, and Francisca Puertas. 2012.
“Compatibility between Superplasticizer Admixtures and Cements with Mineral
Additions.” Construction and Building Materials 31: 300–309.
Buscall, R., P. D. A. Mills, R. F. Stewart, D. Sutton, L. R. White, and G. E. Yates. 1987.
“The Rheology of Strongly-Flocculated Suspensions.” Journal of Non-Newtonian
Fluid Mechanics 24 (2): 183–202.
C. F Ferraris, and de Larrard, Francois. “Testing and Modelling of Fresh Concrete
Rheology”. National Institute of Standards and Technology.
Caldarone, M. A., and J. Z. Zemajtis. 2008. “Effect of Use of Limestone on Various
Properties of Portland Cement–Part II”. PCA R & D SN 2891a. Skokie (IL):
Portland Cement Association. http://trid.trb.org/view.aspx?id=844287.
Callaghan, Paul T. 2008. “Rheo NMR and Shear Banding.” Rheologica Acta 47 (3): 243–
55.
Cam, Hieu T., and Narayanan Neithalath. 2010. “Moisture and Ionic Transport in
Concretes Containing Coarse Limestone Powder.” Cement and Concrete
Composites 32 (7): 486–96. doi:16/j.cemconcomp.2010.04.002.
Casson, N. 1959. “A Flow Equation for Pigment-Oil Suspensions of the Printing Ink
Type.” Rheology of Disperse Systems 84.
238
Cerny, L. C., F. B. Cook, and C. C. Walker. 1962. “Rheology of Blood.” American
Journal of Physiology–Legacy Content 202 (6): 1188–94.
Cheng, D. C.-H. 1986. “Yield Stress: A Time-Dependent Property and How to Measure
It.” Rheologica Acta 25 (5): 542–54. doi:10.1007/BF01774406.
Chindaprasirt, Prinya, Chai Jaturapitakkul, and Theerawat Sinsiri. 2005. “Effect of Fly
Ash Fineness on Compressive Strength and Pore Size of Blended Cement Paste.”
Cement and Concrete Composites 27 (4): 425–28.
doi:10.1016/j.cemconcomp.2004.07.003.
Chomton, G., and P. J. Valyer. 1972. “Applied Rheology of Asphalt Mixes Practical
Application.” In Presented at the Third International Conference on the
Structural Design of Asphalt Pavements, Grosvenor House, Park Lane, London,
England, Sept. 11-15, 1972. Vol. 1. http://trid.trb.org/view.aspx?id=138840.
Chong, J. S., E. B. Christiansen, and A. D. Baer. 2003. “Rheology of Concentrated
Suspensions.” Journal of Applied Polymer Science 15 (8): 2007–21.
Cook, Raymond A., and Kenneth C. Hover. 1999. “Mercury Porosimetry of Hardened
Cement Pastes.” Cement and Concrete Research 29 (6): 933–43.
Criado, M., A. Palomo, A. Fernández-Jiménez, and P. F. G. Banfill. 2009. “Alkali
Activated Fly Ash: Effect of Admixtures on Paste Rheology.” Rheologica Acta 48
(4): 447–55.
Daimon, M., and D. M. Roy. 1979. “Rheological Properties of Cement Mixes: II. Zeta
Potential and Preliminary Viscosity Studies.” Cement and Concrete Research 9
(1): 103–9. doi:10.1016/0008-8846(79)90100-5.
Davidovits, Joseph. 1991. “Geopolymers.” Journal of Thermal Analysis and Calorimetry
37 (8): 1633–56.
———. 1999. “Chemistry of Geopolymeric Systems, Terminology.” In Geopolymer,
99:9–40.
———. 2005. “Geopolymer Chemistry and Sustainable Development. The Poly (sialate)
Terminology: A Very Useful and Simple Model for the Promotion and
Understanding of Green-Chemistry.” In Proceedings of 2005 Geopolymer
Conference, 1:9–15.
De Larrard, F., C. F. Ferraris, and T. Sedran. 1998. “Fresh Concrete: A Herschel-Bulkley
Material.” Materials and Structures 31 (7): 494–98.
De Weerdt, K., M. Ben Haha, G. Le Saout, K.O. Kjellsen, H. Justnes, and B. Lothenbach.
2011. “Hydration Mechanisms of Ternary Portland Cements Containing
Limestone Powder and Fly Ash.” Cement and Concrete Research 41 (3): 279–91.
doi:16/j.cemconres.2010.11.014.
De Weerdt, K., H. Justnes, K. O. Kjellsen, and E. Sellevold. 2010. “Fly Ash-Limestone
Ternary Composite Cements: Synergetic Effect at 28 Days.” Nordic Concrete
Research 42 (2): 51–70.
239
De Weerdt, K., K.O. Kjellsen, E. Sellevold, and H. Justnes. 2011. “Synergy between Fly
Ash and Limestone Powder in Ternary Cements.” Cement and Concrete
Composites 33 (1): 30–38. doi:16/j.cemconcomp.2010.09.006.
Deschner, F., F. Winnefeld, B. Lothenbach, S. Seufert, P. Schwesig, S. Dittrich, F.
Goetz-Neunhoeffer, and J. Neubauer. 2012. “Hydration of Portland Cement with
High Replacement by Siliceous Fly Ash.” Cement and Concrete Research.
http://www.sciencedirect.com/science/article/pii/S0008884612001585.
Dhir, R. K., M. C. Limbachiya, M. J. McCarthy, and A. Chaipanich. 2007. “Evaluation of
Portland Limestone Cements for Use in Concrete Construction.” Materials and
Structures 40 (5): 459–73.
Dintenfass, Leopold. 1976. Rheology of Blood in Diagnostic and Preventive Medicine:
An Introduction to Clinical Haemorheology. Butterworths London, Boston.
http://www.getcited.org/pub/101581210.
Dweck, Jo, Pedro Mauricio Buchler, Antonio Carlos Vieira Coelho, and Frank K.
Cartledge. 2000. “Hydration of a Portland Cement Blended with Calcium
Carbonate.” Thermochimica Acta 346 (1-2): 105–13. doi:16/S0040-
6031(99)00369-X.
Elkhadiri, I, A Diouri, A Boukhari, J Aride, and F Puertas. 2002. “Mechanical Behaviour
of Various Mortars Made by Combined Fly Ash and Limestone in Moroccan
Portland Cement.” Cement and Concrete Research 32 (10): 1597–1603.
doi:10.1016/S0008-8846(02)00834-7.
Erdoğan, S. T., N. S. Martys, C. F. Ferraris, and D. W. Fowler. 2008. “Influence of the
Shape and Roughness of Inclusions on the Rheological Properties of a
Cementitious Suspension.” Cement and Concrete Composites 30 (5): 393–402.
Evans, Ian David. 1992. “Letter to the Editor: On the Nature of the Yield Stress.” Journal
of Rheology 36: 1313.
Fajun, Wei, Michael W. Grutzeck, and Della M. Roy. 1985. “The Retarding Effects of
Fly Ash upon the Hydration of Cement Pastes: The First 24 Hours.” Cement and
Concrete Research 15 (1): 174–84. doi:10.1016/0008-8846(85)90024-9.
Farris, R. J. 1968. “Prediction of the Viscosity of Multimodal Suspensions from
Unimodal Viscosity Data.” Journal of Rheology 12: 281.
Felekoğlu, B., K. Tosun, B. Baradan, A. Altun, and B. Uyulgan. 2006. “The Effect of Fly
Ash and Limestone Fillers on the Viscosity and Compressive Strength of Self-
Compacting Repair Mortars.” Cement and Concrete Research 36 (9): 1719–26.
Fernández-Jiménez, Ana, I. Garcia-Lodeiro, and A. Palomo. 2007. “Durability of Alkali-
Activated Fly Ash Cementitious Materials.” Journal of Materials Science 42 (9):
3055–65.
Ferraris, C. F. 1999a. “Measurement of the Rheological Properties of Cement Paste: A
New Approach.” In PRO 5: International RILEM Conference on The Role of
Admixtures in High Performance Concrete, 5:333.
240
———. 1999b. “Measurement of the Rheological Properties of High Performance
Concrete: State of the Art Report.” JOURNAL OF RESEARCH-NATIONAL
INSTITUTE OF STANDARDS AND TECHNOLOGY 104 (5): 461–78.
Ferraris, C. F., and J. M. Gaidis. 1992. “Connection between the Rheology of Concrete
and Rheology of Cement Paste.” ACI Materials Journal 89 (4).
http://www.concrete.org/PUBS/JOURNALS/OLJDetails.asp?Home=MJ&ID=257
5.
Ferraris, C. F., K. H. Obla, and R. Hill. 2001. “The Influence of Mineral Admixtures on
the Rheology of Cement Paste and Concrete.” Cement and Concrete Research 31
(2): 245–55.
Flatt, Robert J. 2004. “Dispersion Forces in Cement Suspensions.” Cement and Concrete
Research 34 (3): 399–408.
Flatt, Robert J., and Paul Bowen. 2006. “Yodel: A Yield Stress Model for Suspensions.”
Journal of the American Ceramic Society 89 (4): 1244–56.
———. 2007. “Yield Stress of Multimodal Powder Suspensions: An Extension of the
YODEL (Yield Stress mODEL).” Journal of the American Ceramic Society 90
(4): 1038–44.
Fraay, A. L. A., J. M. Bijen, and Y. M. de Haan. 1989. “The Reaction of Fly Ash in
Concrete a Critical Examination.” Cement and Concrete Research 19 (2): 235–46.
doi:10.1016/0008-8846(89)90088-4.
Franks, George V. 2002. “Zeta Potentials and Yield Stresses of Silica Suspensions in
Concentrated Monovalent Electrolytes: Isoelectric Point Shift and Additional
Attraction.” Journal of Colloid and Interface Science 249 (1): 44–51.
Frı́as, M., M. I. Sánchez de Rojas, and J. Cabrera. 2000. “The Effect That the Pozzolanic
Reaction of Metakaolin Has on the Heat Evolution in Metakaolin-Cement
Mortars.” Cement and Concrete Research 30 (2): 209–16. doi:10.1016/S0008-
8846(99)00231-8.
Frı́as, Moisés, and Joseph Cabrera. 2000. “Pore Size Distribution and Degree of
Hydration of Metakaolin–cement Pastes.” Cement and Concrete Research 30 (4):
561–69. doi:10.1016/S0008-8846(00)00203-9.
Fung, W. W. S., and A. K. H. Kwan. 2010. “Role of Water Film Thickness in Rheology
of CSF Mortar.” Cement and Concrete Composites 32 (4): 255–64.
Funk, J. E., and D. R. Dinger. 1994. Predictive Process Control of Crowded Particulate
Suspensions: Applied to Ceramic Manufacturing. Springer.
http://books.google.com/books?hl=en&lr=&id=xq5KAsfGQ_YC&oi=fnd&pg=P
R9&dq=Predictive+process+control+of+crowded+particulate+suspensions,+Klu
wer++funk&ots=6tj4Nms5wo&sig=bxnc4XKtpf4DwvlY0M7LSS1Kx08.
Gallé, C. 2001. “Effect of Drying on Cement-Based Materials Pore Structure as
Identified by Mercury Intrusion Porosimetry: A Comparative Study between
Oven-, Vacuum-, and Freeze-Drying.” Cement and Concrete Research 31 (10):
1467–77. doi:10.1016/S0008-8846(01)00594-4.
241
Garboczi, E. J., and J. W. Bullard. 2004. “Shape Analysis of a Reference Cement.”
Cement and Concrete Research 34 (10): 1933–37.
Gaskins, Frederick H., John G. Brodnyan, Wladimir Philippoff, and Edmund Thelen.
1960. “The Rheology of Asphalt. II. Flow Characteristics of Asphalt.” Journal of
Rheology 4: 265–78.
Geiker, Mette, Erik Pram Nielsen, and Duncan Herfort. 2007. “Prediction of Chloride
Ingress and Binding in Cement Paste.” Materials and Structures 40 (4): 405–17.
Gmira, A., M. Zabat, RJ-M. Pellenq, and H. Van Damme. 2004. “Microscopic Physical
Basis of the Poromechanical Behavior of Cement-Based Materials.” Materials
and Structures 37 (1): 3–14.
Government of Canada, Natural Resources Canada. 2009. “Energy Consumption
Benchmark Guide: Cement Clinker Production | Office of Energy Efficiency.”
April 22. http://oee.nrcan.gc.ca/publications/industrial/6527.
Grzeszczyk, S., and G. Lipowski. 1997. “Effect of Content and Particle Size Distribution
of High-Calcium Fly Ash on the Rheological Properties of Cement Pastes.”
Cement and Concrete Research 27 (6): 907–16.
Halamickova, Pavla, Rachel J. Detwiler, Dale P. Bentz, and Edward J. Garboczi. 1995.
“Water Permeability and Chloride Ion Diffusion in Portland Cement Mortars:
Relationship to Sand Content and Critical Pore Diameter.” Cement and Concrete
Research 25 (4): 790–802. doi:10.1016/0008-8846(95)00069-O.
Hartnett, James P., and Robert YZ Hu. 1989. “Technical Note: The Yield Stress—an
Engineering Reality.” Journal of Rheology 33: 671.
Hartshorn, S. A., J. H. Sharp, and R. N. Swamy. 1999. “Thaumasite Formation in
Portland-Limestone Cement Pastes.” Cement and Concrete Research 29 (8):
1331–40.
Hawkins, P., P. Tennis, and R. Detwiler. 2003. “The Use of Limestone in Portland
Cement: A State-of-the-Art Review.” EB227, Portland Cement Association,
Skokie, IL 44.
Hendriks, C. A., E. Worrell, D. De Jager, K. Blok, and P. Riemer. 2002. “Emission
Reduction of Greenhouse Gases from the Cement Industry.” International Energy
Agency (IEA).
http://www.moleconomics.org/files/sustainability%20documents/EmissionReduct
ionofGreenhouseGasesfromtheCementIndustry.pdf.
Herle, Vishweshwara, Peter Fischer, and Erich J. Windhab. 2005. “Stress Driven Shear
Bands and the Effect of Confinement on Their Structures A Rheological, Flow
Visualization, and Rheo-SALS Study.” Langmuir 21 (20): 9051–57.
Herschel, W. H., and R. Bulkley. 1926. “Measurement of Consistency as Applied to
Rubber-Benzene Solutions.” In Proceedings of the American Society for the
Testing of Materials, 26:621–33.
Hetsroni, Gad. 1982. “Handbook of Multiphase Systems.”
http://www.osti.gov/energycitations/product.biblio.jsp?osti_id=5474196.
242
Hooton, R. D. 1990. “Effects of Carbonate Additions on Heat of Hydration and Sulfate
Resistance of Portland Cements.” Carbonate Additions to Cement, 73.
Hoshino, Seiichi, Kazuo Yamada, and Hiroshi Hirao. 2006. “XRD/Rietveld Analysis of
the Hydration and Strength Development of Slag and Limestone Blended
Cement.” Journal of Advanced Concrete Technology 4 (3): 357–67.
Hunter, Robert J., and Lee R. White. 1987. Foundations of Colloid Science. Clarendon
Press.
Iler, Ralph K. 1979. “The Chemistry of Silica: Solubility, Polymerization, Colloid and
Surface Properties, and Biochemistry.”
http://www.lavoisier.fr/livre/notice.asp?ouvrage=1353889.
Ingram, K., M. Poslusny, K. Daugherty, W. Rowe, P. Klieger, and R. D. Hooton. 1990.
“Carboaluminate Reactions as Influenced by Limestone Additions.” Proc
Carbonate Additions to Cement 1064: 14–23.
Ipavec, A., R. Gabrovsek, T. Vuk, V. Kacivc, J. Macek, and A. Meden. 2011.
“Carboaluminate Phases Formation During the Hydration of Calcite-Containing
Portland Cement.” Journal of the American Ceramic Society 94 (4): 1238–42.
Irassar, E. F. 2001. “Mechanical Properties and Durability of Concrete Made with
Portland Limestone Cement.” ACI Special Publication 202.
http://www.concrete.org/Publications/GetArticle.aspx?m=icap&pubID=10798.
Irassar, E.F., D. Violini, V.F. Rahhal, C. Milanesi, M.A. Trezza, and V.L. Bonavetti.
2011. “Influence of Limestone Content, Gypsum Content and Fineness on Early
Age Properties of Portland Limestone Cement Produced by Inter-Grinding.”
Cement and Concrete Composites 33 (2): 192–200.
doi:16/j.cemconcomp.2010.10.001.
Jeffrey, D. J., and Andreas Acrivos. 1976. “The Rheological Properties of Suspensions of
Rigid Particles.” AIChE Journal 22 (3): 417–32.
Justnes, Harald. 2003. “Thaumasite Formed by Sulfate Attack on Mortar with Limestone
Filler.” Cement and Concrete Composites 25 (8): 955–59. doi:16/S0958-
9465(03)00120-3.
Justnes, Harald, and Hedda Vikan. 2005. “Viscosity of Cement Slurries as a Function of
Solids Content.” Ann. Trans. Nordic Rheology Soc 13: 75–82.
Kadri, E. H., S. Kenai, K. Ezziane, R. Siddique, and G. De Schutter. 2011. “Influence of
Metakaolin and Silica Fume on the Heat of Hydration and Compressive Strength
Development of Mortar.” Applied Clay Science.
http://www.sciencedirect.com.ezproxy1.lib.asu.edu/science/article/pii/S01691317
11002171.
Kakali, G., S. Tsivilis, E. Aggeli, and M. Bati. 2000. “Hydration Products of C3A, C3S
and Portland Cement in the Presence of CaCO3.” Cement and Concrete Research
30 (7): 1073–77. doi:16/S0008-8846(00)00292-1.
243
Kakali, G., S. Tsivilis, A. Skaropoulou, J. H. Sharp, and R. N. Swamy. 2003. “Parameters
Affecting Thaumasite Formation in Limestone Cement Mortar.” Cement and
Concrete Composites 25 (8): 977–81.
Kamal, M.R., and A. Mutel. 1985. “Rheological Properties of Suspensions in Newtonian
and Non-Newtonian Fluids.” Journal of Polymer Engineering 5 (4): 293–382.
doi:10.1515/POLYENG.1985.5.4.293.
Kelessidis, V. C., R. Maglione, C. Tsamantaki, and Y. Aspirtakis. 2006. “Optimal
Determination of Rheological Parameters for Herschel–Bulkley Drilling Fluids
and Impact on Pressure Drop, Velocity Profiles and Penetration Rates during
Drilling.” Journal of Petroleum Science and Engineering 53 (3): 203–24.
Koch, Gerhardus H., Michiel PH Brongers, Neil G. Thompson, Y. Paul Virmani, and Joe
H. Payer. 2002. “Corrosion Cost and Preventive Strategies in the United States.”
http://trid.trb.org/view.aspx?id=707382.
Krieger, Irvin M., and Thomas J. Dougherty. 1959. “A Mechanism for Non-Newtonian
Flow in Suspensions of Rigid Spheres.” Transactions of the Society of Rheology 3
(1): 137–52.
Kumar, A., T. Oey, S Kim, Thomas, D, Badran, S, Li, J, Fernandes, F, Neithalath, N, and
Sant, G. “Simple Methods to Estimate the Influence of Limestone Fillers on
Reaction and Property Evaluation in Cementitious Materials.” Submitted to
Cement and Concrete Research.
Kumar, Rakesh, and B. Bhattacharjee. 2003. “Study on Some Factors Affecting the
Results in the Use of MIP Method in Concrete Research.” Cement and Concrete
Research 33 (3): 417–24.
Kutchko, Barbara G., and Ann G. Kim. 2006. “Fly Ash Characterization by SEM–EDS.”
Fuel 85 (17–18): 2537–44. doi:10.1016/j.fuel.2006.05.016.
Lachemi, M., K. M. A. Hossain, V. Lambros, P. -C. Nkinamubanzi, and N. Bouzoubaâ.
2004. “Performance of New Viscosity Modifying Admixtures in Enhancing the
Rheological Properties of Cement Paste.” Cement and Concrete Research 34 (2):
185–93. doi:16/S0008-8846(03)00233-3.
Lagier, F., and K. E. Kurtis. 2007. “Influence of Portland Cement Composition on Early
Age Reactions with Metakaolin.” Cement and Concrete Research 37 (10): 1411–
17.
Langan, B.W., K. Weng, and M.A. Ward. 2002. “Effect of Silica Fume and Fly Ash on
Heat of Hydration of Portland Cement.” Cement and Concrete Research 32 (7):
1045–51. doi:10.1016/S0008-8846(02)00742-1.
Lee, S. H., H. J. Kim, E. Sakai, and M. Daimon. 2003. “Effect of Particle Size
Distribution of Fly Ash–cement System on the Fluidity of Cement Pastes.”
Cement and Concrete Research 33 (5): 763–68.
Lesko, Samuel, Eric Lesniewska, André Nonat, Jean-Claude Mutin, and Jean-Pierre
Goudonnet. 2001. “Investigation by Atomic Force Microscopy of Forces at the
Origin of Cement Cohesion.” Ultramicroscopy 86 (1): 11–21.
244
Liu, Dean-Mo. 2000. “Particle Packing and Rheological Property of Highly-Concentrated
Ceramic Suspensions: Φm Determination and Viscosity Prediction.” Journal of
Materials Science 35 (21): 5503–7.
Livesey, P. 1991. “Performance of Limestone-Filled Cements.” In BLENDED CEMENTS
IN CONSTRUCTION. PAPERS PRESENTED AT THE INTERNATIONAL
CONFERENCE, UNIVERSITY OF SHEFFIELD, UK, 9-12 SEPTEMBER 1991.
http://trid.trb.org/view.aspx?id=376797.
Loose, W., and S. Hess. 1989. “Rheology of Dense Model Fluids via Nonequilibrium
Molecular Dynamics: Shear Thinning and Ordering Transition.” Rheologica Acta
28 (2): 91–101.
Lootens, D., P. Hébraud, E. Lécolier, and H. Van Damme. 2004. “Gelation, Shear-
Thinning and Shear-Thickening in Cement Slurries.” Oil & Gas Science and
Technology 59 (1): 31–40.
Lothenbach, Barbara, Gwenn Le Saout, Emmanuel Gallucci, and Karen Scrivener. 2008.
“Influence of Limestone on the Hydration of Portland Cements.” Cement and
Concrete Research 38 (6): 848–60. doi:16/j.cemconres.2008.01.002.
Lowke, D. 2009. “Interparticle Forces and Rheology of Cement Based Suspensions.” In
Nanotechnology in Construction 3, 295–301. Springer.
http://link.springer.com/chapter/10.1007/978-3-642-00980-8_39.
Mannheimer, R. J. 1983. “Effect Of Slip On The Flow Properties Of Cement Slurries.” In
Annual Meeting Papers, Divison of Production.
http://www.onepetro.org/mslib/servlet/onepetropreview?id=API-83-H001.
Marsh, B. K., and R. L. Day. 1988. “Pozzolanic and Cementitious Reactions of Fly Ash
in Blended Cement Pastes.” Cement and Concrete Research 18 (2): 301–10.
Matschei, T., B. Lothenbach, and F. P. Glasser. 2007a. “The AFm Phase in Portland
Cement.” Cement and Concrete Research 37 (2): 118–30.
doi:10.1016/j.cemconres.2006.10.010.
Matschei, T., B. Lothenbach, and F.P. Glasser. 2007b. “The Role of Calcium Carbonate
in Cement Hydration.” Cement and Concrete Research 37 (4): 551–58.
doi:16/j.cemconres.2006.10.013.
Mehta, P. Kumar, and Paulo J. M. Monteiro. 2005. Concrete : Microstructure,
Properties, and Materials. Blacklick, OH, USA: McGraw-Hill Professional
Publishing. http://site.ebrary.com/lib/asulib/docDetail.action?docID=10196829.
Mehta, P.K. 2002. “Greeningof the Concrete Industry for Sustainable Development.”
Concrete International, 23.
Menéndez, G, V Bonavetti, and E. F Irassar. 2003. “Strength Development of Ternary
Blended Cement with Limestone Filler and Blast-Furnace Slag.” Cement and
Concrete Composites 25 (1): 61–67. doi:10.1016/S0958-9465(01)00056-7.
Mikanovic, Nikola, and Carmel Jolicoeur. 2008. “Influence of Superplasticizers on the
Rheology and Stability of Limestone and Cement Pastes.” Cement and Concrete
Research 38 (7): 907–19. doi:16/j.cemconres.2008.01.015.
245
Mikanovic, Nikola, Kamal Khayat, Monique Pagé, and Carmel Jolicoeur. 2006.
“Aqueous CaCO< Sub> 3</sub> Dispersions as Reference Systems for Early-Age
Cementitious Materials.” Colloids and Surfaces A: Physicochemical and
Engineering Aspects 291 (1): 202–11.
Møller, Peder CF, Jan Mewis, and Daniel Bonn. 2006. “Yield Stress and Thixotropy: On
the Difficulty of Measuring Yield Stresses in Practice.” Soft Matter 2 (4): 274–83.
Moon, J., J. E. Oh, M. Balonis, F. P. Glasser, S. M. Clark, and P. J. M. Monteiro. 2011.
“High Pressure Study of Low Compressibility Tetracalcium Aluminum Carbonate
Hydrates 3CaO· Al2O3·CaCO3· 11H2O.” Cement and Concrete Research.
http://www.sciencedirect.com/science/article/pii/S0008884611002262.
Moreno, M., W. Morris, M. G. Alvarez, and G. S. Duffó. 2004. “Corrosion of
Reinforcing Steel in Simulated Concrete Pore Solutions: Effect of Carbonation
and Chloride Content.” Corrosion Science 46 (11): 2681–99.
doi:10.1016/j.corsci.2004.03.013.
Moulin, E, P Blanc, and D Sorrentino. 2001. “Influence of Key Cement Chemical
Parameters on the Properties of Metakaolin Blended Cements.” Cement and
Concrete Composites 23 (6): 463–69. doi:10.1016/S0958-9465(00)00093-7.
Mueller, S., E. W. Llewellin, and H. M. Mader. 2010. “The Rheology of Suspensions of
Solid Particles.” Proceedings of the Royal Society A: Mathematical, Physical and
Engineering Science 466 (2116): 1201–28. doi:10.1098/rspa.2009.0445.
Nägele, E. 1986. “The Zeta-Potential of Cement: Part II: Effect of pH-Value.” Cement
and Concrete Research 16 (6): 853–63.
Nägele, E., and U. Schneider. 1989. “The Zeta-Potential of Blast Furnace Slag and Fly
Ash.” Cement and Concrete Research 19 (5): 811–20.
Nehdi, M., and M. -A. Rahman. 2004a. “Estimating Rheological Properties of Cement
Pastes Using Various Rheological Models for Different Test Geometry, Gap and
Surface Friction.” Cement and Concrete Research 34 (11): 1993–2007.
doi:16/j.cemconres.2004.02.020.
Nehdi, M., and M.-A. Rahman. 2004b. “Effect of Geometry and Surface Friction of Test
Accessory on Oscillatory Rheological Properties of Cement Pastes.” ACI
Materials Journal 101 (5).
http://www.concrete.org/PUBS/JOURNALS/OLJDetails.asp?Home=MJ&ID=134
28.
Neubauer, Christopher M, Ming Yang, and Hamlin M Jennings. 1998. “Interparticle
Potential and Sedimentation Behavior of Cement Suspensions: Effects of
Admixtures.” Advanced Cement Based Materials 8 (1): 17–27.
doi:10.1016/S1065-7355(98)00005-4.
Nguyen, Q. D., and D. V. Boger. 1992. “Measuring the Flow Properties of Yield Stress
Fluids.” Annual Review of Fluid Mechanics 24 (1): 47–88.
246
Oey, T., A. Kumar, J.W. Bullard, N. Neithalath, and G. Sant. 2012. “The Filler Effect:
The Influence of Filler Content and Surface Area on Cementitious Reaction
Rates.”
Olhero, S. M., and J. M. F. Ferreira. 2004. “Influence of Particle Size Distribution on
Rheology and Particle Packing of Silica-Based Suspensions.” Powder Technology
139 (1): 69–75.
Olmsted, Peter D. 2008. “Perspectives on Shear Banding in Complex Fluids.” Rheologica
Acta 47 (3): 283–300.
Opoczky, L. 1992. “Progress of Particle Size Distribution during the Intergrinding of a
Clinker-Limestone Mixture.” ZEMENT KALK GIPS 45: 648–648.
Opoczky, Ludmilla. 1996. “Grinding Technical Questions of Producing Composite
Cement.” International Journal of Mineral Processing 44: 395–404.
Palacios, M., Y. F. Houst, P. Bowen, and F. Puertas. 2009a. “Adsorption of
Superplasticizer Admixtures on Alkali-Activated Slag Pastes.” Cement and
Concrete Research 39 (8): 670–77.
———. 2009b. “Adsorption of Superplasticizer Admixtures on Alkali-Activated Slag
Pastes.” Cement and Concrete Research 39 (8): 670–77.
Palacios, M., and F. Puertas. 2005. “Effect of Superplasticizer and Shrinkage-Reducing
Admixtures on Alkali-Activated Slag Pastes and Mortars.” Cement and Concrete
Research 35 (7): 1358–67.
Palomo, A., M. W. Grutzeck, and M. T. Blanco. 1999. “Alkali-Activated Fly Ashes: A
Cement for the Future.” Cement and Concrete Research 29 (8): 1323–29.
Papo, A. 1988. “Rheological Models for Cement Pastes.” Materials and Structures 21
(1): 41–46.
Papo, Adriano, and Luciano Piani. 2004. “Effect of Various Superplasticizers on the
Rheological Properties of Portland Cement Pastes.” Cement and Concrete
Research 34 (11): 2097–2101.
Park, C.K., M.H. Noh, and T.H. Park. 2005. “Rheological Properties of Cementitious
Materials Containing Mineral Admixtures.” Cement and Concrete Research 35
(5): 842–49. doi:16/j.cemconres.2004.11.002.
Péra, Jean, Sophie Husson, and Bernard Guilhot. 1999. “Influence of Finely Ground
Limestone on Cement Hydration.” Cement and Concrete Composites 21 (2): 99–
105. doi:16/S0958-9465(98)00020-1.
Phair, J. W., J. D. Smith, and J. S. J. Van Deventer. 2003. “Characteristics of
Aluminosilicate Hydrogels Related to Commercial ‘Geopolymers.’” Materials
Letters 57 (28): 4356–67.
Pipilikaki, P., and M. Beazi-Katsioti. 2009. “The Assessment of Porosity and Pore Size
Distribution of Limestone Portland Cement Pastes.” Construction and Building
Materials 23 (5). Compatibility of Plasters and Renders on Salt Loaded
Substrates: 1966–70. doi:10.1016/j.conbuildmat.2008.08.028.
247
Poon, C. S., L. Lam, S. C. Kou, Y. L. Wong, and R. Wong. 2001. “Rate of Pozzolanic
Reaction of Metakaolin in High-Performance Cement Pastes.” Cement and
Concrete Research 31 (9): 1301–6.
Popescu, C. D., M. Muntean, and J. H. Sharp. 2003. “Industrial Trial Production of Low
Energy Belite Cement.” Cement and Concrete Composites 25 (7): 689–93.
doi:10.1016/S0958-9465(02)00097-5.
Poslinski, A. J., M. E. Ryan, R. K. Gupta, S. G. Seshadri, and F. J. Frechette. 1988.
“Rheological Behavior of Filled Polymeric Systems I. Yield Stress and Shear-
Thinning Effects.” Journal of Rheology (1978-Present) 32 (7): 703–35.
Poulesquen, A., F. Frizon, and D. Lambertin. 2013. “Rheological Behavior of Alkali-
Activated Metakaolin during Geopolymerization.” In Cement-Based Materials for
Nuclear Waste Storage, 225–38. Springer.
http://link.springer.com/chapter/10.1007/978-1-4614-3445-0_20.
Powers, T.C., and T.L. Brownyard. 1947. “Studies of the Physical Properties of Hardened
Portland Cement Paste.” In Journal Proceedings, 43:549–602.
Provis, John L., Yolandi Muntingh, Redmond R. Lloyd, Hua Xu, Louise M. Keyte, Leon
Lorenzen, Pavel V. Krivenko, Jannie SJ van Deventer, and UKRAINE Kiev.
2007. “Will Geopolymers Stand the Test of Time?” Developments in Porous,
Biological and Geopolymer Ceramics: Ceramic Engineering and Science
Proceedings, 235.
Provis, John L., and Jan Stephanus Jakob Van Deventer. 2009. Geopolymers: Structure,
Processing, Properties and Industrial Applications. Woodhead Cambridge, UK.
http://www.lavoisier.fr/livre/notice.asp?ouvrage=1862690.
Puertas, F., and A. Fernández-Jiménez. 2003. “Mineralogical and Microstructural
Characterisation of Alkali-Activated Fly Ash/slag Pastes.” Cement and Concrete
Composites 25 (3): 287–92.
Qing-Hua, C., and S. L. Sarkar. 1994. “A Study of Rheological and Mechanical
Properties of Mixed Alkali Activated Slag Pastes.” Advanced Cement Based
Materials 1 (4): 178–84.
Ramachandran, V. S. 1988. “Thermal Analyses of Cement Components Hydrated in the
Presence of Calcium Carbonate.” Thermochimica Acta 127: 385–94.
Ravikumar, Deepak, and Narayanan Neithalath. 2012a. “Reaction Kinetics in Sodium
Silicate Powder and Liquid Activated Slag Binders Evaluated Using Isothermal
Calorimetry.” Thermochimica Acta.
http://www.sciencedirect.com/science/article/pii/S0040603112003437.
———. 2012b. “Effects of Activator Characteristics on the Reaction Product Formation
in Slag Binders Activated Using Alkali Silicate Powder and NaOH.” Cement and
Concrete Composites 34 (7): 809–18. doi:10.1016/j.cemconcomp.2012.03.006.
Roussel, N., and P. Coussot. 2005. “‘Fifty-Cent Rheometer’ for Yield Stress
Measurements: From Slump to Spreading Flow.” Journal of Rheology (1978-
Present) 49 (3): 705–18. doi:10.1122/1.1879041.
248
Roussel, Nicolas. 2006. “Correlation between Yield Stress and Slump: Comparison
between Numerical Simulations and Concrete Rheometers Results.” Materials
and Structures 39 (4): 501–9.
Roussel, Nicolas, Anael Lemaître, Robert J. Flatt, and Philippe Coussot. 2010. “Steady
State Flow of Cement Suspensions: A Micromechanical State of the Art.” Cement
and Concrete Research 40 (1): 77–84.
Saak, Aaron W., Hamlin M. Jennings, and Surendra P. Shah. 2001. “The Influence of
Wall Slip on Yield Stress and Viscoelastic Measurements of Cement Paste.”
Cement and Concrete Research 31 (2): 205–12.
———. 2004. “A Generalized Approach for the Determination of Yield Stress by Slump
and Slump Flow.” Cement and Concrete Research 34 (3): 363–71.
Sabir, B. B, S Wild, and J Bai. 2001. “Metakaolin and Calcined Clays as Pozzolans for
Concrete: A Review.” Cement and Concrete Composites 23 (6). Metakaolin and
Calcined Clays: 441–54. doi:10.1016/S0958-9465(00)00092-5.
Sakai, E., K. Masuda, Y. Kakinuma, and Y. Aikawa. 2009. “Effects of Shape and
Packing Density of Powder Particles on the Fluidity of Cement Pastes with
Limestone Powder.” Journal of Advanced Concrete Technology 7 (3): 347–54.
Sakai, E., S. Miyahara, S. Ohsawa, S. H. Lee, and M. Daimon. 2005. “Hydration of Fly
Ash Cement.” Cement and Concrete Research 35 (6): 1135–40.
Salmas, Constantinos E., and George P. Androutsopoulos. 2001. “A Novel Pore Structure
Tortuosity Concept Based on Nitrogen Sorption Hysteresis Data.” Industrial &
Engineering Chemistry Research 40 (2): 721–30.
Sánchez de Rojas, M. I., M. P. Luxán, M. Frías, and N. García. 1993. “The Influence of
Different Additions on Portland Cement Hydration Heat.” Cement and Concrete
Research 23 (1): 46–54. doi:10.1016/0008-8846(93)90134-U.
Sant, Gaurav, Chiara F. Ferraris, and Jason Weiss. 2008. “Rheological Properties of
Cement Pastes: A Discussion of Structure Formation and Mechanical Property
Development.” Cement and Concrete Research 38 (11): 1286–96.
doi:16/j.cemconres.2008.06.008.
Santamaria-Holek, I., and Carlos I. Mendoza. 2010. “The Rheology of Concentrated
Suspensions of Arbitrarily-Shaped Particles.” arXiv:1005.5707 [cond-Mat], May.
http://arxiv.org/abs/1005.5707.
Scales, Peter J., Stephen B. Johnson, Thomas W. Healy, and Prakash C. Kapur. 1998.
“Shear Yield Stress of Partially Flocculated Colloidal Suspensions.” AIChE
Journal 44 (3): 538–44.
Schall, Peter, and Martin van Hecke. 2009. “Shear Bands in Matter with Granularity.”
Annual Review of Fluid Mechanics 42 (1): 67.
Schwartzentruber, L. D’Aloia, R. Le Roy, and J. Cordin. 2006. “Rheological Behaviour
of Fresh Cement Pastes Formulated from a Self Compacting Concrete (SCC).”
Cement and Concrete Research 36 (7): 1203–13.
doi:16/j.cemconres.2004.10.036.
249
Shaughnessy III, Richard, and Peter E. Clark. 1988. “The Rheological Behavior of Fresh
Cement Pastes.” Cement and Concrete Research 18 (3): 327–41.
Shaw, D. 1992. Introduction to Colloid and Surface Chemistry. Butterworth-Heinemann.
http://store.elsevier.com/product.jsp?isbn=9780750611824&gdftrk=gdfV26763_a
_7c349_a_7c883_a_7c9780750611824&mckv=dvgJdFEm_dc&pcrid=342612294
72&gclid=CI728JnH7b0CFVKFfgodPrMAHA.
Skripkiūnas, Gintautas, Mindaugas Dauksys, Arminas Stuopys, and Rimantas Levinskas.
2005. “The Influence of Cement Particles Shape and Concentration on the
Rheological Properties of Cement Slurry.” Materials Science (Medziagotyra) 11
(2). http://internet.ktu.lt/lt/mokslas/zurnalai/medz/pdf/medz0-
81/10%20Skripkiuno%20str%20150-158.pdf.
Škvára, František, Lubomír Kopecký, Vít Šmilauer, and Zdeněk Bittnar. 2009. “Material
and Structural Characterization of Alkali Activated Low-Calcium Brown Coal Fly
Ash.” Journal of Hazardous Materials 168 (2–3): 711–20.
doi:10.1016/j.jhazmat.2009.02.089.
Soroka, I., and N. Setter. 1977. “The Effect of Fillers on Strength of Cement Mortars.”
Cement and Concrete Research 7 (4): 449–56.
Soroka, I., and N. Stern. 1976. “Calcareous Fillers and the Compressive Strength of
Portland Cement.” Cement and Concrete Research 6 (3): 367–76. doi:16/0008-
8846(76)90099-5.
Stebbins, Jonathan F., Ian Farnan, and Xianyu Xue. 1992. “The Structure and Dynamics
of Alkali Silicate Liquids: A View from NMR Spectroscopy.” Chemical Geology
96 (3): 371–85.
Steffe, James Freeman. 1996. Rheological Methods in Food Process Engineering.
Freeman press.
http://books.google.com/books?hl=en&lr=&id=LrrdONuST9kC&oi=fnd&pg=PR
9&dq=rheology+of+catsup&ots=kYZPqy7ae0&sig=xDl3z2hvuWFQAaOFUavtQ
EGFCuw.
Struble, Leslie, and Guo-Kuang Sun. 1995. “Viscosity of Portland Cement Paste as a
Function of Concentration.” Advanced Cement Based Materials 2 (2): 62–69.
Svensson, Ingvar L., Staffan Sjöberg, and Lars-Olof Öhman. 1986. “Polysilicate
Equilibria in Concentrated Sodium Silicate Solutions.” J. Chem. Soc., Faraday
Trans. 1 82 (12): 3635–46.
Sweeny, Keith H., and Richard D. Geckler. 1954. “The Rheology of Suspensions.”
Journal of Applied Physics 25 (9): 1135–44. doi:doi:10.1063/1.1721828.
Tattersall, Geoffrey Howarth, and P. F. G. Banfill. 1983. The Rheology of Fresh
Concrete. Monograph. http://trid.trb.org/view.aspx?id=199391.
Taylor, H. F. W. 1997. Cement Chemistry. Thomas Telford.
http://books.google.com/books?hl=en&lr=&id=1BOETtwi7mMC&oi=fnd&pg=P
A1&dq=taylor+h.f.w.+cement+chemistry+second+edition+thomas+telford&ots=
6XveOt_Tuz&sig=4uomsHTLnBj1RXtnwKOXAPWJQLc.
250
Tennis, P., M.D.A. Thomas, and W.J. Weiss. 2011. State-of-the-Art Report on Use of
Limestone in Cements at Levels of up to 15%, SN3148. Skokie, Illinois, USA:
Portland Cement Association.
Termkhajornkit, Pipat, and Toyoharu Nawa. 2004. “The Fluidity of Fly Ash–cement
Paste Containing Naphthalene Sulfonate Superplasticizer.” Cement and Concrete
Research 34 (6): 1017–24.
Texas Department of Transportation. 2012. “Where Has the Fly Ash Gone?” April.
http://ftp.dot.state.tx.us/pub/txdot-info/cst/tips/fly_ash_0412.pdf.
Thomas, Jeffrey J., Hamlin M. Jennings, and Jeffrey J. Chen. 2009. “Influence of
Nucleation Seeding on the Hydration Mechanisms of Tricalcium Silicate and
Cement.” The Journal of Physical Chemistry C 113 (11): 4327–34.
Tognonvi, Monique Tohoué, Dominique Massiot, André Lecomte, Sylvie Rossignol, and
Jean-Pierre Bonnet. 2010. “Identification of Solvated Species Present in
Concentrated and Dilute Sodium Silicate Solutions by Combined< Sup>
29</sup> Si NMR and SAXS Studies.” Journal of Colloid and Interface Science
352 (2): 309–15.
Torquato, Salvatore. 2001. Random Heterogeneous Materials: Microstructure and
Macroscopic Properties. Vol. 16. Springer.
http://books.google.com/books?hl=en&lr=&id=PhG_X4-
8DPAC&oi=fnd&pg=PA1&dq=Torquato,+S.,+Random+Heterogeneous+Materia
ls:+Microstructure+and+Macroscopic+Properties,+New+York,+Springer,+2002&
ots=SY79oX84qP&sig=IEz4lfxhdGIT2r4mE4Q_O_xJ250.
Tsivilis, S., G. Batis, E. Chaniotakis, Gr. Grigoriadis, and D. Theodossis. 2000.
“Properties and Behavior of Limestone Cement Concrete and Mortar.” Cement
and Concrete Research 30 (10): 1679–83. doi:10.1016/S0008-8846(00)00372-0.
Tsivilis, S., E. Chaniotakis, E. Badogiannis, G. Pahoulas, and A. Ilias. 1999. “A Study on
the Parameters Affecting the Properties of Portland Limestone Cements.” Cement
and Concrete Composites 21 (2): 107–16. doi:16/S0958-9465(98)00031-6.
Tsivilis, S., E. Chaniotakis, G. Batis, C. Meletiou, V. Kasselouri, G. Kakali, A.
Sakellariou, G. Pavlakis, and C. Psimadas. 1999. “The Effect of Clinker and
Limestone Quality on the Gas Permeability, Water Absorption and Pore Structure
of Limestone Cement Concrete.” Cement and Concrete Composites 21 (2): 139–
46. doi:16/S0958-9465(98)00037-7.
Tsivilis, S., J. Tsantilas, G. Kakali, E. Chaniotakis, and A. Sakellariou. 2003. “The
Permeability of Portland Limestone Cement Concrete.” Cement and Concrete
Research 33 (9): 1465–71. doi:16/S0008-8846(03)00092-9.
Tsivilis, S., N. Voglis, and J. Photou. 1999. “A Study of the Intergrinding of Clinker and
Limestone.” Minerals Engineering 12 (7): 837–40.
Vance, Kirk, Aditya Kumar, Gaurav Sant, and Narayanan Neithalath. 2013. “The
Rheological Properties of Ternary Binders Containing Portland Cement,
Limestone and Metakaolin or Fly Ash.” Cement and Concrete Research
251
Submitted for Review. doi:10.1016/j.cemconcomp.2013.03.028.
http://www.sciencedirect.com/science/article/pii/S0958946513000474.
Vance, Kirk, Gaurav Sant, and Narayanan Neithalath. “Rheology of Cement Pastes: A
Closer Look at Experimental Parameters and Property Determination Using
Common Rheological Models.” Cement and Concrete Research Submitted.
Vikan, H., H. Justnes, F. Winnefeld, and R. Figi. 2007. “Correlating Cement
Characteristics with Rheology of Paste.” Cement and Concrete Research 37 (11):
1502–11. doi:16/j.cemconres.2007.08.011.
Vikan, Hedda, and Harald Justnes. 2007. “Rheology of Cementitious Paste with Silica
Fume or Limestone.” Cement and Concrete Research 37 (11): 1512–17.
doi:16/j.cemconres.2007.08.012.
Voglis, N., G. Kakali, E. Chaniotakis, and S. Tsivilis. 2005. “Portland-Limestone
Cements. Their Properties and Hydration Compared to Those of Other Composite
Cements.” Cement and Concrete Composites 27 (2): 191–96.
doi:16/j.cemconcomp.2004.02.006.
Vuk, T., V. Tinta, R. Gabrovsek, and V. Kaucic. 2001. “The Effects of Limestone
Addition, Clinker Type and Fineness on Properties of Portland Cement.” Cement
and Concrete Research 31 (1): 135–39. doi:16/S0008-8846(00)00427-0.
Washburn, Edward W. 1921. “Note on a Method of Determining the Distribution of Pore
Sizes in a Porous Material.” Proceedings of the National Academy of Sciences of
the United States of America, 115–16.
Wierenga, Anieke M., and Albert P. Philipse. 1998. “Low-Shear Viscosity of Isotropic
Dispersions of (Brownian) Rods and Fibres; a Review of Theory and
Experiments.” Colloids and Surfaces A: Physicochemical and Engineering
Aspects 137 (1): 355–72.
Wijnen, PWJG, T. P. M. Beelen, J. W. De Haan, C. P. J. Rummens, L. J. M. Van de Ven,
and R. A. Van Santen. 1989. “Silica Gel Dissolution in Aqueous Alkali Metal
Journal of Non-Crystalline
Solids 109 (1): 85–94.
Wild, S., and J. M. Khatib. 1997. “Portlandite Consumption in Metakaolin Cement Pastes
and Mortars.” Cement and Concrete Research 27 (1): 137–46.
doi:10.1016/S0008-8846(96)00187-1.
Wild, S., J. M. Khatib, and A. Jones. 1996. “Relative Strength, Pozzolanic Activity and
Cement Hydration in Superplasticised Metakaolin Concrete.” Cement and
Concrete Research 26 (10): 1537–44. doi:10.1016/0008-8846(96)00148-2.
Williams, David A., Aaron W. Saak, and Hamlin M. Jennings. 1999. “The Influence of
Mixing on the Rheology of Fresh Cement Paste.” Cement and Concrete Research
29 (9): 1491–96.
Winslow, Douglas N., and S. Diamond. 1970. “A Mercury Porosimetry Study of the
Porosity in Portland Cement.” Journal of Materials.
http://trid.trb.org/view.aspx?id=96627.
252
Worrell, E., L. Price, N. Martin, C. Hendriks, and L. O. Meida. 2001. “Carbon Dioxide
Emissions from the Global Cement Industry 1.” Annual Review of Energy and the
Environment 26 (1): 303–29.
Yahia, A., M. Tanimura, and Y. Shimoyama. 2005. “Rheological Properties of Highly
Flowable Mortar Containing Limestone Filler-Effect of Powder Content and W/C
Ratio.” Cement and Concrete Research 35 (3): 532–39.
Yang, M., and H.M. Jennings. 1995. “Influences of Mixing Methods on the
Microstructure and Rheological Behavior of Cement Paste.” Advanced Cement
Based Materials 2 (2): 70–78. doi:10.1016/1065-7355(95)90027-6.
Yang, M., C. M. Neubauer, and H. M. Jennings. 1997. “Interparticle Potential and
Sedimentation Behavior of Cement Suspensions: Review and Results from
Paste.” Advanced Cement Based Materials 5 (1): 1–7. doi:10.1016/S1065-
7355(97)90009-2.
Ye, G., X. Liu, G. De Schutter, A. -M. Poppe, and L. Taerwe. 2007. “Influence of
Limestone Powder Used as Filler in SCC on Hydration and Microstructure of
Cement Pastes.” Cement and Concrete Composites 29 (2): 94–102.
doi:10.1016/j.cemconcomp.2006.09.003.
Yuan, Qiang, Caijun Shi, Geert De Schutter, Katrien Audenaert, and Dehua Deng. 2009.
“Chloride Binding of Cement-Based Materials Subjected to External Chloride
Environment–a Review.” Construction and Building Materials 23 (1): 1–13.
Yunovich, M., and N. G. Thompson. 2003. “CORROSION OF HIGHWAY BRIDGES:
ECONOMIC IMPACT AND CONTROL METHODOLOGIES.” Concrete
International 25 (1). http://trid.trb.org/view.aspx?id=732496.
Zeng, Qiang, Kefei Li, Teddy Fen-Chong, and Patrick Dangla. 2012. “Analysis of Pore
Structure, Contact Angle and Pore Entrapment of Blended Cement Pastes from
Mercury Porosimetry Data.” Cement and Concrete Composites 34 (9): 1053–60.
doi:10.1016/j.cemconcomp.2012.06.005.
Zhang, Min-Hong, Chiara F. Ferraris, Huaning Zhu, Vincent Picandet, Max A. Peltz,
Paul Stutzman, and Daniel De Kee. 2010. “Measurement of Yield Stress for
Concentrated Suspensions Using a Plate Device.” Materials and Structures 43 (1-
2): 47–62.
Zhang, Xiong, and Jihong Han. 2000. “The Effect of Ultra-Fine Admixture on the
Rheological Property of Cement Paste.” Cement and Concrete Research 30 (5):
827–30. doi:10.1016/S0008-8846(00)00236-2.
Zhou, Zhongwu, Michael J. Solomon, Peter J. Scales, and David V. Boger. 1999. “The
Yield Stress of Concentrated Flocculated Suspensions of Size Distributed
Particles.” Journal of Rheology 43: 651.