Embed Size (px)
Citation preview
OVERVIEW OF EXPLORATION AND PRODUCTIONWASTE VOLUMES AND WASTE MANAGEMENT PRACTICESIN THE UNITED STATES
Based onAPI Survey of Onshore and Coastal Exploration andProduction Operations for 1995andAPI Survey of Natural Gas Processing Plants for 1995
Prepared for:The American Petroleum Institute
Prepared by:ICF Consulting
May 2000

i
TABLE OF CONTENTS
Table of Contents ..................................................................................................................................... i
List of Tables .......................................................................................................................................... iii
Executive Summary................................................................................................................................. 1
1. Introduction......................................................................................................................................... 4
1.1. Overview of Survey Methodology ............................................................................................... 5
1.2.Estimated Production Facilities, 1995 Production, Active Wells, and Other Supplemental Data.... 5
2. Survey Results: Production Pits, Tanks, Land Treatment Operations, and Produced Water................. 7
2.1.Production Pits............................................................................................................................ 7
2.1.1. E&P Operations - Pits ..................................................................................................... 7
2.1.2. Gas Plants - Pits.............................................................................................................. 7
2.2.Tank Batteries and Total Tanks................................................................................................... 8
2.2.1. Tanks and Tank Batteries – E&P Operations ................................................................... 8
2.2.2. Non-pressurized Tanks – Gas Plants............................................................................... 9
2.3.Landspreading/Land Treatment Operations............................................................................... 10
2.4.Produced Water ........................................................................................................................ 10
2.4.1. Estimated Volume of Produced Water – E&P Operations.............................................. 10
2.4.2. Produced Water Disposal – E&P Operations................................................................. 11
2.4.3. Produced Water – Gas Processing Plants..................................................................... 12
3. Survey Results: Associated Wastes, Gas Dehydration/Sweetening Wastes, Drilling Wastes, andWaste Management Practices ......................................................................................................... 14
3.1.Associated Wastes and Waste Management............................................................................. 14
3.1.1. Types of Associated Wastes......................................................................................... 14
3.1.2. Estimated Volume of Associated Wastes – 1995 E&P Operations Survey...................... 15
3.1.3. Associated Waste Disposal........................................................................................... 16
3.2. Gas Processing Plant Wastes and Waste Management ........................................................... 19
3.2.1. Types of Gas Processing Plant Wastes......................................................................... 19
3.2.2. Gas Processing Plant Waste Disposal Methods and Estimated Volumes of Waste........ 19
3.3.Drilling and Drilling Waste Management .................................................................................... 21
3.3.1. Drilling Techniques ....................................................................................................... 21
3.3.2. Percentage of Drilling Wastes by Base Drilling Fluid ..................................................... 21
3.3.3. Volume of Drilling Wastes............................................................................................. 22
3.3.4. Types of Drilling Wastes and Drilling Waste Disposal...................................................... 23
4. Summary of Results.......................................................................................................................... 27
References ........................................................................................................................................... 29

ii
Appendix A 1995 Production Facilities and Oil and Gas Production....................................................... 30
A.1. Estimated Oil and Gas Production Facilities............................................................................. 30
Appendix B Production Pits, Tank Batteries, Tanks............................................................................... 32
Appendix C Produced Water................................................................................................................. 40
Appendix D Associated Wastes ............................................................................................................ 42
Appendix E Drilling Wastes................................................................................................................... 48
Appendix F Gas Processing Plants: Produced Water and Associated Wastes ..................................... 56
Appendix G Survey Methodology ......................................................................................................... 62
G.1. Survey Forms ......................................................................................................................... 62
G.2. Design of Survey Sample........................................................................................................ 62
G.2.1. 1995 E&P Operations Survey excluding Appalachia....................................................... 62
G.2.2. 1995 E&P Operations Survey – Appalachian States....................................................... 63
G.2.3. 1995 Natural Gas Processing Plant Survey.................................................................... 64
G.3. Survey Data Analysis .............................................................................................................. 65
G.3.1. Survey Data Extrapolation ............................................................................................. 65
Appendix H Survey Form - API Survey of Onshore and Coastal Exploration and Production Operationsfor 1995........................................................................................................................................... 74
Appendix I Survey Form - API Survey of Natural Gas Processing Plants for 1995 ................................ 91

iii
LIST OF TABLES
Table ES.1. 1995 Estimated Volume of Oil and Gas E&P Wastes Disposed by Method (million barrels).. 1
Table 1.1. Comparison of U.S. Exploration and Production Activity, 1985 and 1995 ................................ 5
Table 2.1. Gas Processing Plants – Pits...................................................................................................8
Table 2.2. National Estimate of Total Tank Batteries and Tanks Associated with E&P Operations ..........9
Table 2.3. Estimate of Total Non-Pressurized Tanks Associated with Gas Plants ...................................10
Table 2.4. 1995 Produced Water Disposal Method – Reported Data ......................................................11
Table 2.5. Comparison of 1985 and 1995 Produced Water Disposal Methods .......................................12
Table 2.6. Gas Plants, Produced Water Volume – Reported Data and Estimated Volumes ....................13
Table 2.7. Gas Plants; Produced Water Disposal Method – Reported Data ............................................13
Table 3.1. Summary of Total Estimated Associated Wastes from 1985 Production Waste Survey (barrels) ........................................................................................................................................15
Table 3.2. 1995 E&P Operations Survey – Total Estimated Volume of Associated Wastes ....................15
Table 3.3. Estimated Associated Waste Disposal Practices for the Total U.S.; Total Associated WasteStream – 1995 E&P Operations Survey .........................................................................................17
Table 3.4. Estimated Volume of Associated Wastes by Disposal Techniques From 1985 ProductionWaste Survey ................................................................................................................................17
Table 3.5. Estimated Volumes of Associated Wastes by Disposal Method; Completion Fluids andWorkover Fluids, 1995 E&P Operations Survey.............................................................................18
Table 3.6. Estimated Volumes of Associated Wastes by Disposal Method; Tank Bottoms/Oily Sludge and Dehydration Wastes, 1995 E&P Operations Survey................................................................18
Table 3.7. Gas Processing Plant Wastes – Estimated Volumes (extrapolated on gas throughput) .........20
Table 3.8. Gas Processing Plants; Estimated Volume of Wastes by Disposal Method ...........................20
Table 3.9. Estimated Total Volume of Drilling Wastes............................................................................23
Table 3.10. Summary of Estimated Drilling Wastes by Type of Waste From 1995 E&P Operations Survey(barrels) .........................................................................................................................................24
Table 3.11. Summary of Estimated Drilling Wastes by Type of Waste From 1985 Production WasteSurvey (barrels) .............................................................................................................................24
Table 3.12. Estimated Drilling Waste Disposal Practices - 1995 E&P Operations Survey......................25
Table 3.13. Comparison of 1985 and 1995 Estimated Drilling Waste Disposal Practices .......................26
Table 5.1. 1995 Estimated Volume of E&P Wastes Disposed by Method (million barrels).......................28
Table A.1. 1995 Producing Wells and Estimated Production Facilities by State .....................................30
Table A.2. Total 1995 Oil, Gas, and Natural Gas Liquids Production by State........................................32
Table B.1. Production Pits – Reported Data .........................................................................................33
Table B.2. Estimated Number of Production Pits ..................................................................................34
Table B.3. Oil Tank Batteries and Oil Tanks – Reported Data ...............................................................35
Table B.4. Condensate Tank Batteries and Condensate Tanks – Reported Data...................................36
Table B.5. Estimated Oil Tank Batteries and Total Tanks Associated With Oil Production Facilities .....37

iv
Table B.6. Estimated Condensate Tank Batteries and Total Tanks Associated with Gas ProductionFacilities ........................................................................................................................................38
Table B.7. Gas Plants, Non-Pressurized Tanks – Reported Data ...........................................................39
Table C.1. Estimated Volume of Produced Water by State (1,000 barrels/year).....................................40
Table C.2. Produced Water Volumes Disposed by Method – Reported Data (Barrels/day andPercentages) .................................................................................................................................41
Table D.1. Associated Waste Volume by State – Reported Data (Barrels per year) ..............................42
Table D.2. Estimated Volume of Associated Wastes by State (Barrels/Year).........................................43
Table D.3. Volume of Completion Fluids and Workover/Stimulation Fluids by Disposal Method – Reported Data ...........................................................................................................................44
Table D.4. Volume of Tank Bottoms/Oily Sludge and Dehydration/Sweetening Wastes by DisposalMethod – Reported Data................................................................................................................45
Table D.5. Total Associated Waste; Percentage Waste Disposed by Method – Reported Data..............46
Table D.6. Total Associated Waste; Volume of Waste Disposed by Method – Reported Data(Barrels per Year) ..........................................................................................................................47
Table E.1. Percentage of New Wells Drilled by Technique - Reported Data...........................................48
Table E.2. Percentage of Drilling Wastes by Base Drilling Fluid – Reported Data ...................................49
Table E.3. Estimated Percentage of Drilling Wastes by Base Drilling Fluid ............................................50
Table E.4. Appalachian States, Volumes of Drilling Wastes – Reported Data .......................................51
Table E.5. Alternative Estimation of Total Drilling Waste for Appalachian States and Other States withSignificant Air Drilling .....................................................................................................................51
Table E.6. Liquid Drilling Waste Disposal- Reported Data (as % of Total Drilling Wastes)......................52
Table E.7. Solid Drilling Waste Disposal- Reported Data (As % of Total Drilling Wastes)........................53
Table E.8. Estimated Volume of Liquid Drilling Wastes Disposed by Method; Estimated for States withReported Data (Barrels) ................................................................................................................54
Table E.9. Estimated Volume of Solid Drilling Wastes Disposed by Method; Estimated for States withReported Data (Barrels) .................................................................................................................55
Table F.1. Gas Plants: Produced Water Disposal by Method and Region – Reported Data (Barrels/dayand Percentages)...........................................................................................................................56
Table F.2. Gas Plants: Disposal of Glycol Wastes by Method and Region – Reported Data..................57
Table F.3. Gas Plants: Disposal of Used Filters/Filter Media by Method and Region – Reported Data ..58
Table F.4. Gas Plants: Disposal of Scrubber Liquids/Sludge by Method and Region – Reported Data..59
Table F.5. Gas Plants: Disposal of Other Dehydration/Sweetening Wastes by Method and Region –Reported Data ...............................................................................................................................60
Table F.6. Gas Processing Plant Wastes – Reported Data.....................................................................61
Table F.7. Gas Processing Plants; Reported Volume of Wastes Disposed by Method ...........................61
Table G.1. Operations Survey Sample Design - Basin/State Categories................................................63
Table G.2. Operations Survey Sample Design - No. of Large and Small Companies in Sample byBasin/State Category .....................................................................................................................63
Table G.3. Appalachian State Respondents ..........................................................................................64
Table G.4. Gas Plants Survey - Regions and Sample Size.....................................................................65

v
Table G.5. E&P Operations Survey Sample Design Total 1994 Production (Mboe) in Basin/StateCombinations.................................................................................................................................68
Table G.6. E&P Operations Survey Design – Number of Survey Respondents by State, Company Size,and by Basin/State Combination ....................................................................................................69
Table G.7. Gas Plants Survey Sample Design – Range in Gas Plant Capacity and Throughput(mmcfd) for Survey Sample Strata .................................................................................................71
Table G.8. Survey Response by State ..................................................................................................73

1
EXECUTIVE SUMMARY
During 1996, the American Petroleum Institute (API) conducted a survey of onshore oil and gasexploration and production (E&P) operations and natural gas processing plant operations for the year 1995.The survey sought data on current waste volumes and waste management practices, produced watermanagement, and drilling practices. The 1995 survey was designed to update a similar survey ofproducers’ waste management practices that was published by API in 1987, and was based on data for1985. This report provides an evaluation of the results of the 1995 survey pertaining to E&P waste volumesand waste management practices. The survey covers the three primary categories of wastes produced bythe oil and gas exploration and production industry:
• Produced water – the saline water brought to the surface with oil and gas;• Drilling waste – the rock cuttings and fluids that are produced from drilling a new wellbore into
the subsurface; and• Associated wastes – a broad category of a variety of small volume waste streams that
encompasses all other types of wastes “associated” with oil and natural gas production.
The total volume of wastes generated annually by the oil and gas industry has decreasedsubstantially over the past decade. In 1995, the onshore oil and gas E&P industry generated an estimated17,900 million barrels of produced water, 149 million barrels of drilling wastes, and 20.5 million barrels ofassociated wastes. In addition, natural gas processing contributed an estimated 9.5 million barrels ofproduced water and 0.10 million barrels of dehydration wastes. A decade earlier, in 1985, the E&P industrygenerated 21,000 million barrels of produced water, 361 million barrels of drilling wastes, and 12 millionbarrels of associated wastes.1 The decreased volume of wastes generated by E&P operations in 1995 isconsistent with the general decline in E&P industry activity between 1985 and 1995 (lower oil production,fewer producing wells, fewer new wells drilled) which affects the two largest waste streams – producedwater and drilling wastes.
Table ES-1 summarizes the total estimated volumes of E&P wastes disposed in 1995 by wastedisposal method. Because E&P wastes are predominately liquid wastes, over 90 percent of E&P wastes areinjected. Another 2 percent of E&P wastes are reused or reclaimed. A brief discussion of the 1995 resultsfor each category of E&P waste follows in Table ES-1.
Table ES.1. 1995 Estimated Volume of Oil and Gas E&P Wastes Disposed by Method(million barrels)
Disposal MethodProduced
Water1DrillingWastes
AssociatedWastes2
Total WasteVolume
% Disposedby Method
Injection (includes EOR3) 16,386.5 19.3 7.9 16,413.7 90.7 %Evaporation 0 69.9 2.3 72.2 0.4 %Burial Onsite 0 31.2 0 31.2 0.2 %Commercial E&P WasteFacility 90.3 3.0 3.1 96.4 0.5 %
Reuse, Recycle, Reclaim 358.1 10.4 3.9 372.4 2.1 %Discharge 537.0 1.5 0 538.5 3.0 %Land Spread 0 10.4 1.0 11.4Road Spread 1.8 0b 0.5 2.3 >0.1 %
All Other 537.0 3.0 1.9 541.9 3.0 %Total 17,910.7 148.7 20.6 18,080.0 100.0 %
1 Includes produced water removed at gas plants.2 Includes wastes from gas processing plants.3 Enhanced oil recovery
1 The 1985 survey excluded completion fluids from the associated wastes volume, while the 1995 survey includes these
wastes in the total volume of associated wastes.

2
Produced Water. In 1995, E&P operations produced an estimated 17,900 million barrels of water,of which 92 percent was injected. Seventy-one percent of the total volume of produced water was injectedfor enhanced oil recovery (EOR) in 1995. Another 21 percent of produced water was disposed in Class IIinjection wells.2 In 1985, 62 percent of produced water was injected for EOR and 30 percent was disposedin Class II injection wells. An estimated 6 percent of produced water was discharged under NPDES permitsin 1985. By 1995, only 3 percent of produced water was discharged, with almost all of the dischargedvolume from coalbed methane operations. In 1995, 2 percent of the total volume of produced water was putto beneficial use and 3 percent was disposed by various “other” disposal methods such as percolation pits,onsite evaporation, and public water treatment works.
Drilling Wastes. The total volume of drilling wastes estimated in 1995 was based on the calculationof waste volume per foot varied by well depth that was developed during the 1985 survey, and subsequentlyconfirmed by later analyses. Consequently, the volume of drilling wastes estimated for 1995 is consistentwith the 1985 estimate, adjusted for the substantial decline in drilling activity. Nonetheless, otherimprovements in drilling practice between 1985 and 1995 are indicated by the 1995 E&P operations survey. By 1995, 69 percent of reserve pits were lined, up from 35 percent lined in 1985. Moreover, an estimated25 percent of new wells were drilled with a closed mud system and did not require reserve pits. Anestimated 92 percent of onshore drilling wastes in the most recent survey were derived from freshwaterbased mud systems, compared to 64 percent of drilling wastes in 1985. In 1995, 68 percent of drillingwastes were disposed onsite through evaporation and burial, compared to 41 percent in 1985. Disposal bysurface discharge and landspreading decreased from an estimated 17 percent of drilling wastes in 1985 to 8percent in 1995.
Associated Wastes. Associated wastes represent only about 0.11 percent of E&P wastes estimatednationwide. Although, the estimated volume of associated wastes increased from 1985 to 1995, this may beattributed to general characteristics of the survey (inclusion of certain waste streams and exclusion of otherwaste streams), as well as industry trends toward better tracking and reporting of E&P wastes. A key factorin the difference is the exclusion of completion fluid volumes from the 1985 survey to avoid potential doublecounting of those wastes with produced water (with which they are typically co-mingled). The 1995 surveyexplicitly addressed completion fluid volumes so that they could be included. In addition, a marked increasein the volume of workover/stimulation wastes (from operators’ attempts to keep older wells operatingprofitably) likely contributed to the increase in associated wastes. In 1995, an estimated 89 percent ofassociated wastes were aqueous fluid. The remaining 11 percent of associated wastes consist of oily solidsand glycol-based wastes from dehydration. In 1995, the estimated volume of tank bottoms and oily sludgedeclined by 21 percent, from 2.5 million barrels in 1985 to less than 2 million barrels in 1995. Over 68percent of associated wastes were disposed by a combination of injection into Class II wells, evaporation,re-use and reclamation. Disposal by surface discharge and land/road spreading dropped from 24 percent in1985 to less than 8 percent in 1995.
Natural Gas Processing Plants Natural gas processing plants contribute only a small fraction ofE&P wastes, and were not covered by the 1985 waste survey. Gas plants managed an estimated 10 millionbarrels of produced water in 1995, 93 percent of which were disposed by injection into Class II wells. In1995, gas plants produced 0.1 million barrels of associated wastes, an average of 167 barrels of waste perplant. Seventy-nine percent of gas processing plant wastes consist of scrubber liquids and sludge, 3 percentconsist of glycol compounds and used filter media, and the remaining 18 percent consist of miscellaneousother waste streams. Seventy-six percent of gas processing plant wastes were disposed by injection and13 percent were disposed at commercial E&P waste facilities and industrial or municipal disposal facilities.
The results of API’s 1995 E&P operations survey demonstrate increased use of improved drillingpractices and improved waste management practices.3 The survey results suggest a trend towards overallreduction of oily tank bottoms and sludges, glycol dehydration wastes, and drilling wastes from operations 2 Class II injection wells are those associated with the oil and gas industry, using a numbering scheme described in the Safe
Drinking Water Act.3 For more information about how advanced exploration and production technologies are producing waste reductions and
other environmental benefits, see “Environmental Benefits of Advanced Oil and Gas Exploration and Production Technology,”issued by the U.S. Department of Energy, Office of Fossil Energy, 1999.

3
using oil based mud. Over 90 percent of E&P wastes continue to be disposed by injection, andunderground injection continues to offer the best method to safely and efficiently dispose of liquid E&Pwastes.

4
1. INTRODUCTION
Exploring for and producing oil and natural gas results in the production of substantial volumes ofwastes, the largest portion of which is naturally occurring material removed from the subsurface. Becauseexploration and production in the United States takes place at nearly 900,000 separate sites across thecountry, no mechanism exists for tabulating the total volume of wastes produced and managed by theindustry. Nevertheless, it is important to the industry to understand its waste volumes and how they aremanaged. In the past, the American Petroleum Institute (API) has used statistical surveys of industryoperations to estimate waste volumes and characterize management practices. The oil and gas industry’swastes are characterized in three primary categories:
• Produced water – the saline water brought to the surface with oil and gas;• Drilling waste – the rock cuttings and fluids that are produced from drilling a new wellbore into the
subsurface; and• Associated wastes – a broad category of a variety of small volume waste streams that encompasses
all other types of wastes “associated” with oil and natural gas production.
In the fall of 1995, API conducted a survey of onshore oil and gas exploration and production (E&P)operations and natural gas processing plant operations. The survey collected data on current wastevolumes and waste management practices, field equipment and facilities, produced water management,and drilling practices.4 The purpose of the survey was to update current understanding of wastemanagement practices in the oil and gas exploration and production industry. The last comprehensivesurvey of industry waste management practices was API’s 1985 Production Waste Survey. During thedecade between 1985 and 1995, substantial changes occurred in the U.S. oil and gas industry as illustratedin Table 1.1. In 1995, API determined that an update of the 1985 waste management survey was needed tounderstand how waste management had changed in response to the other changes in the industry. Themanagement and disposal of oil and gas exploration and production wastes continues to be an importantconcern to states, industry, and the public. The survey results presented here demonstrate how the industryhas responded to internal and external concerns about waste management, as well as highlighting some ofthe challenges that can be undertaken to further enhance protection of human health and the environment.
Section 2 of this report discusses survey results pertaining to production pits, tanks, land treatmentoperations, and produced water. Section 3 discusses survey results pertaining to associated wastes, drillingpractices, drilling wastes and waste management. Section 4 provides a summary of the survey results. Appendix G provides a discussion of the survey methodology including design of the survey forms, designof the survey sample, and methodology for extrapolation of reported data. A brief summary of the surveymethodology is provided below. Throughout the report, the 1995 survey results are compared to API’s 1985Production Waste Survey wherever possible.
4 The survey form was modified just prior to mailing to include some questions related to equipment such as engines, turbines,
and boilers. These data were collected to provide input to a data collection effort by the U.S. Environmental ProtectionAgency for some specific air emission control related rulemakings. The data collected were provided to EPA on anaggregated basis. The focus of this report, like the primary focus of the survey, is on wastes, and thus the other datacollected are not reported here.

5
Table 1.1. Comparison of U.S. Exploration and Production Activity, 1985 and 1995
1985 1995PercentChange
Total U.S. Crude Oil Production 3,274.6 million barrels 2,394.3 million barrels -27%Total U.S. Natural Gas Production 17.2 trillion cubic feet 19.5 trillion cubic feet +13%Total U.S. Natural Gas Liquids Prod. 753 million barrels 791 million barrels +5%Total U.S. Production 7,093.6 MMboec 6,661.2 MMboec -6%Producing Oil Wellsa 642,408 oil wells 569,508 oil wells -11%Stripper Oil Wellsb 452,543 stripper oil wells 434,422 stripper oil wells -4%Producing Gas & Condensate Wells 243,344 gas wells 298,541 gas wells +23%New Wells Completed 71,108 wells 21,695 wells -69%Total Footage Drilled 316,778,000 feet 117,886,366 feet -63%a Federal offshore wells are not included.b Stripper wells are a subset of total producing oil wells, and includes those wells that produce 10 barrels of oil per dayor less.c Million barrels of oil equivalent – converts natural gas to oil equivalent based on heating values.Source: API, Basic Petroleum Data Book, January 1999, Volume XIX, Number 1: Tables III-2, III-10, III-12, III-14, III-15; Table IV-4; Table XIII-3, XIII-9.
1.1. Overview of Survey Methodology
Two forms were developed for API’s 1995 survey: API Survey of Onshore and Coastal Explorationand Production Operations for 1995 and API Survey of Natural Gas Processing Plants for 1995. Theonshore operations survey form is included as Appendix H and the gas processing plant survey form isincluded as Appendix I. A detailed discussion of survey methodology is included as Appendix G.
The operations survey form was designed to focus on all the facilities operated by an E&P companywithin a single field. An E&P company selected for the survey was asked to complete one survey form perselected field. Participating companies were selected for the survey sample from databases maintained byPetroleum Information (PI) Corporation. For a given geological basin/state/company size combination, acompany’s probability of being included in the sample was proportional to its 1994 production in thebasin/state combination. The PI database that served as a sampling frame for the 1995 Onshore andCoastal E&P Operations survey did not contain production information for the Appalachian states. For thesestates, API contacted the Oil and Gas Associations of each state and asked for a list of member companies.API sent survey forms to a selection of the member companies and asked the companies to complete theforms for any two of their fields in the designated state.
All of the responses received for a state were aggregated. The total responses received for eachstate were used to generate a single extrapolation factor for the state, such as number of tanks per oilproduction facility or volume of completion fluids generated per well completion. Reported data from theoperations survey were extrapolated on production, estimated number of production facilities, or number ofwells, as appropriate to the survey question under consideration. Similarly, reported data from the gasplants survey were extrapolated on gas throughput or number of gas plants as appropriate.
1.2. Estimated Production Facilities, 1995 Production, Active Wells, and OtherSupplemental Data
Appendix A contains two tables which summarize the supplemental data used in this report toestimate total state values for various elements of the operations survey – waste volumes, produced watervolumes, waste management practices, drilling practices, and production facilities. Appendix A, Table 1 liststhe 1995 producing wells and estimated number of production facilities for each state. Appendix A, Table 2

6
provides 1995 oil, gas, and natural gas liquids production by state.5 The bases for extrapolation for all thesurvey elements discussed in this report are the following:
• Production Pits – extrapolated on the estimated number of 1995 production facilities;supplemented by state estimates and reported data
• Oil Tank Batteries – estimated to be equivalent to the number of oil production facilities• Condensate Tank Batteries – extrapolated on the number of active gas wells.6 Extrapolation
factor determined from survey data.• Total Tanks – extrapolated on the estimated number of tank batteries• Produced Water Volume – extrapolated on 1995 oil and gas production; supplemented by
state estimates, reported data and estimates from Petroleum Information• Associated Wastes: Completion Fluids – extrapolated on 1995 completed wells• Associated Wastes: Workover/Stimulation Fluids – extrapolated on 1995 active wells• Associated Wastes: Tank Bottoms/Oil Sludge – extrapolated on 1995 production• Associated Wastes: Dehydration/Sweetening Wastes – extrapolated on 1995 gas production• Drilling Wastes – extrapolated on 1995 footage drilled using drilling waste extrapolation
factors identified in API’s 1985 Production Waste Survey
For the gas processing plant survey, the following survey elements were extrapolated to regional andnationwide values:
• Production Pits – extrapolated on number of gas plants in a region provided by the Oil andGas Journal (OGJ), Gas Processing Survey.
• Non-pressurized tanks – extrapolated on number of gas plants in a region• Produced water – extrapolated on total gas throughput for a region provided by the OGJ, Gas
Processing Survey• Dehydration wastes – extrapolated on gas throughput.
5 A consulting engineer with over 30 years of experience in the industry estimated the number of production facilities in each
state. He based his estimates on data from PI, as well as prior analyses, engineering relationships, and professionalexperience.
6 Although the total number of oil tank batteries is estimated as the number of oil production facilities, this estimation cannot beused for condensate tank batteries because condensate is not always associated with gas production. If all condensate tankbatteries are estimated as the number of gas production facilities, the result is an unreasonably large number of condensatetank batteries and associated tanks. As an alternative, the number of condensate tank batteries is estimated using a nationalextrapolation factor of six gas wells per tank battery determined from the reported data.

7
2. SURVEY RESULTS: PRODUCTION PITS, TANKS, LAND TREATMENTOPERATIONS, AND PRODUCED WATER
2.1. Production Pits
2.1.1. E&P Operations - Pits
Production pits include all types of pits operated except those associated with drilling operations. Examples of production pits include evaporation, blowdown, produced water, percolation, workover, andemergency pits. These types of pits are used when needed to enhance the safety or efficiency of fieldoperations. Active pits are defined as pits currently in service as part of field operations, whether or not theycontain fluids. Inactive pits are pits that are no longer part of the field operating system but have not beenclosed. Reported data on production pits are presented in Appendix B, Table 1. Survey respondentsreported a total of 2,444 production pits of which 97 percent are active and 59 percent are lined. Severalstates have encouraged operators to close production pits and phase out the use of many types of pits inE&P operations. Louisiana has ordered the closure of pits in many areas of the state since 1986. Texasand Oklahoma report a very small number of pits relative to the size of the E&P industry in these states andnone of the respondents from Appalachian states report production pits.
Appendix B, Table 2 shows estimated total production pits extrapolated based on the number ofproduction facilities. (The estimated number of oil and gas production facilities for each state is shown inAppendix A, Table 1.) For selected states, the numbers of pits estimated in Table B.2 are based on datacollected by state regulatory agencies. These state data were used to represent certain states because theyare believed to be more accurate than the estimates extrapolated from the survey responses. Generally,one production pit is assumed per oil production facility. If survey respondents for a given state reportedproduction pits associated with gas production, then one production pit was assumed for each gasproduction facility as well. No production pits were extrapolated for states that did not report pits for the E&Poperations survey. Due to relatively low survey response rates on this question, the extrapolated number ofpits for individual states is highly uncertain. The estimated total numbers of pits from Table B.2 are bestinterpreted as an estimate of the potential order of magnitude of production pits in an individual state.Nationwide, an estimated 55,000 pits are associated with production operations. Based on the survey datareported in Table B.1, 97 percent of the 55,000 estimated pits are assumed to be active pits and 60 percentare assumed to be lined pits.
2.1.2. Gas Plants - Pits
Gas plant pits include all types of pits operated at the plant except small collection sumps. The pitsincluded are identical to many types of production pits for E&P operations, namely: evaporation, blowdown,produced water, and emergency pits. Table 2.1 summarizes the reported numbers of gas plant productionpits as well as the extrapolated number of gas plant pits. Survey respondents reported a total of 78 pits ofwhich 97 percent are active and 62 percent are lined. The estimated number of pits was extrapolated on thenumber of gas plants in a region. No pits were estimated for regions that did not report pits for the survey. Approximately 875 gas plant pits are estimated to be associated with gas processing plants. The total of gasplant pits plus production pits from E&P operations are estimated to be about 56,000 pits nationwide.

8
Table 2.1. Gas Processing Plants – Pits
Reported Data from Survey
Region
# Plantsin
Regiona
Numberof Pits
Operated
Numberof Active
Pits
Number ofInactive
Pits
% ActivePits withLiners
EstimatedNumber ofActive Pitsb
Alaska 3 11 11 0 45% 11California 25 0 0 0 0 0Eastern U.S. 47 0 0 0 0 0Mid-West 92 0 0 0 0 0New Mexico 27 8 8 0 63% 43Rockies 104 14 14 0 64% 208Southeast 68 4 4 0 0% 18Texas 233 41 39 2 72% 606
Total 599 78 76 2 62% 875a Based on 1996 OGJ Survey.b Extrapolated based on number of plants.
2.2. Tank Batteries and Total Tanks
2.2.1. Tanks and Tank Batteries – E&P Operations
Survey respondents were asked to report either tank batteries on individual leases, or the numberof central or primary separation facilities in unitized fields where storage tanks are present. Produced waterinjection facilities and produced water disposal facilities are not included in the count of tank batteries/centralfacilities. Survey respondents were also asked to report the numbers and types of tanks at the tankbatteries. The E&P operations survey forms sent to operators in the Appalachian states asked only for thenumber of tanks in operation and did not ask for an estimate of tank batteries or central facilities.
Appendix B, Table 3 summarizes the reported data for oil tank batteries, oil tanks and other tanksassociated with oil production. Appendix B, Table 4 summarizes the reported data for condensate tankbatteries, condensate tanks, and other tanks associated with gas production. Table B.3 indicates that thetypical oil tank battery contains two oil tanks, one produced water tank, and an emergency tank and/or“waste” tank. For condensate tank batteries, the data reported in Table B.4 suggest that the typicalcondensate tank battery contains one condensate tank, one or two produced water tanks, and may includean emergency or “waste” tank.7 Combining the reported data from Tables B.3 and B.4, suggests that thetypical tank battery services five to six wells and is comprised of four tanks: two oil or condensate tanks, oneproduced water tank, and one emergency tank or waste oil/water tank.
Because no survey data were collected on tank batteries for Appalachian operations, it cannot bedetermined whether the reported components of a typical tank battery represent Appalachian operations.The combined data from Tables B.3 and B.4 for Appalachian operations suggests that the ratio of producttanks to produced water tanks for Appalachian operations is 1:2 (i.e., one oil or condensate tank to twoproduced water tanks). Also, only about one-third of oil or condensate tanks in Appalachian operationsappear to be associated with either a waste tank or emergency tank.
Estimated total numbers of tank batteries and tanks associated with E&P operations for individualstates were extrapolated from the reported data. Appendix B, Table 5 summarizes the estimated oil tank 7 Reported data for condensate tank batteries includes some responses for Arkansas and Kansas that report very large
numbers of produced water tanks per tank battery. Although these responses are outliers compared to the other reporteddata, they are not necessarily invalid responses. If the outlying responses are removed from the reported data, the typicalcondensate tank battery appears to include only two to three tanks: one condensate tank, one produced water tank, andpossibly a waste or emergency tank.

9
batteries associated with oil production and Appendix B, Table 6 summarizes the estimated condensatetank batteries associated with gas production. The number of oil tank batteries was estimated as thenumber of oil production facilities (as illustrated in Appendix A). The number of condensate tank batterieswas estimated by applying the ratio of six gas wells per tank battery to the number of active gas wells. Thenumber of tank batteries estimated for each state was then multiplied by the average number of tanks pertank battery determined for that state from the survey responses received for the state (shown in Tables B.3and B.4). If a state had no survey data, a national average of four tanks per oil tank battery or two tanks percondensate tank battery was assumed.8
Table 2.2. summarizes the national estimate of tank batteries and tanks associated with E&Poperations. A typical ratio of oil or condensate tanks, produced water and “other” tanks can be determinedfrom the survey data in Appendix Tables B.3 and B.4. If these ratios are applied to the estimated totalnumber of tanks in Table 2.2, the total number of oil tanks is estimated to be approximately 627,500 and thetotal number of condensate tanks is estimated to be 204,300. Therefore, the estimated total number of tanksassociated with E&P operations (oil tanks plus condensate tanks) is approximately 831,800 tanks. About 75percent of these tanks are estimated to be associated with oil production operations. The remaining 25percent are estimated to be associated with gas production operations.
Table 2.2. National Estimate of Total Tank Batteries and Tanks Associated with E&P Operations
Estimated OilTank
Batteries
AssociatedTanks (Oil
Production)
EstimatedCondensate
TankBatteries
AssociatedTanks (Gas/CondensateProduction)
Total Tanks (oilplus
gas/condensateproduction)
All States ExcludingAppalachian Region 144,100 517,800 27,800 109,600 627,400
Appalachian Region Only 27,400 109,700 20,500 94,700 204,400
Estimated National Total(includes Appalachian
Region)171,500 627,500 48,300 204,300 831,800
2.2.2. Non-pressurized Tanks – Gas Plants
The number of tanks reported includes all non-pressurized tanks used at the plant for storage ofproduced water, condensate, and liquid products and all tanks used for emergency conditions. Table 2.3shows the estimated number of tanks associated with gas plants. The reported data for gas plant tanks issummarized in Appendix B, Table 7. Nationwide, gas plants are estimated to have about five associatednon-pressurized tanks. The typical gas plant has approximately two liquid product tanks per plant, onecondensate tank, and one or two produced water tanks. About 40 percent of plants are estimated to havean emergency tank. Table 2.3 also indicates the regional variation from the national estimate. For example,the New Mexico region is estimated to have about six to seven tanks per gas plant. A typical gas plant inNew Mexico is estimated to have three liquid product tanks, two condensate tanks, and one emergencytank. About 60 percent of New Mexico plants are estimated to have a produced water tank as well.
8 Alternate estimates of total tanks for the Appalachian states were obtained by applying a survey-derived ratio of six oil wells
per tank to a state’s total active oil wells and 1.3 gas wells per tank to a state’s total active gas wells. The alternate estimatesfor the Appalachian states are included in Appendix Tables B.5 and B.6. The alternate estimate of tanks associated with oilproduction appears to be quite low and is not included in Table 2.2. The alternate estimate of tanks associated withcondensate production is reasonably close to the estimate obtained from applying the method used for non-Appalachianstates. The alternate estimate of tanks associated with condensate production is included in Table 2.2 because this estimateincorporates survey reported data for the Appalachian region.

10
Table 2.3. Estimate of Total Non-Pressurized Tanks Associated with Gas Plants
Region
# Plantsin
Regiona
EstimatedNumber ofProduced
WaterTanksb
EstimatedNumber of
CondensateTanksb
EstimatedNumber of
LiquidProductTanksb
EstimatedNumber ofEmergency
Tanksb
EstimatedTotal Non-
PressurizedTanksb
Alaska 3 0 0 18 1 19California 25 no data no data no data no data 0Eastern U.S. 47 20 94 275 27 416Mid-West 92 153 123 92 0 368New Mexico 27 16 54 81 22 173Rockies 104 134 149 401 89 773Southeast 68 59 59 59 5 181Texas 233 466 186 342 124 1,118
Total 599 848 665 1268 267 3,048a Based on 1996 OGJ survey.b Extrapolated based on number of plants.
2.3. Landspreading/Land Treatment Operations
Landspreading/land treatment operations dispose of solid wastes through application to the land orincorporation into the soil. This process uses the physical, chemical, and biological capabilities of the soil todecompose constituents of the wastes. Nutrients and water may be added to enhance biodegradation andthe treatment area may be tilled periodically to improve aeration. In this context, “landspreading” or “landtreatment” excludes the practice of landspreading or burying drill cuttings and other drilling wastes. Anexample of the type of land treatment operation included here might be land treatment or bioremediation ofhydrocarbon contaminated soil on leased land surrounding a production facility. Land treatment operationstypically require a state permit but some states prohibit land treatment. Question 18 of the E&P operationssurvey simply asked operators if on-site landspreading or land treatment operations are carried out in thefield for which they were reporting. Thirty respondents (19 percent) report on-site land treatment operationsand 127 respondents (81 percent) report no land treatment operations:
On-site Land Treatment - Yes On-site Land Treatment – No
Total Responses: 30 (19%) 127 (81%)
2.4. Produced Water
2.4.1. Estimated Volume of Produced Water – E&P Operations
The estimated total volume of produced water by state is shown in Appendix C, Table 1. Anestimated national total of 17.9 billion barrels of water was produced in 1995. As indicated in Table C.1, theestimated total produced water for most states was obtained from state data, state estimates, or industrysources (Petroleum Information estimates). Where indicated, a produced water volume was extrapolatedbased on 1995 oil production using extrapolation factors estimated from survey responses for question sixon the E&P operations survey form.
The API 1985 Production Waste Survey reports two estimates for produced water. The firstestimate, 16.3 billion barrels, was obtained from state records, operator inventories and EPA estimates. Thesecond estimate, 20.9 billion barrels, was based on statistical analysis of data received from a supplemental

11
survey form sent to individual companies. The 1985 estimates suggest that, on average, 5.0 barrels to 6.4barrels of water were produced per barrel of oil. The 1995 estimate indicates that, a decade later, theproduced water cut increased to approximately 7.5 barrels of water per barrel of oil. The 1995 estimate ofproduced water, 17.9 billion barrels, represents a 14 percent decline from the 1985 estimate of 20.9 billionbarrels. This corresponds to the 27 percent decline in U.S. oil production over the same period. Theapparent decline in produced water volume was not as great as the decline in oil production for two reasons.First, declining oil production between 1985 and 1995 was offset, in part, by a 13 percent increase in gasproduction. Although, gas wells generally produce less water than oil wells, water production associatedwith gas production can be substantial in some regions. Second, as oil production declined, associatedwater production increased on a per barrel basis, reflecting a growing population of aging oil wells
2.4.2. Produced Water Disposal – E&P Operations
The reported volumes of produced water and reported disposal methods are tabulated in AppendixC, Table 2. Survey respondents reported the production of approximately 4.8 million barrels of water per dayor 1,750 million barrels annually. The survey respondents represent about 10 percent of the estimatednational total volume of produced water. Table 2.4 below summarizes the frequency of produced waterdisposal methods estimated from the aggregate survey response. Nationwide, 71 percent of produced wateris injected into producing reservoirs to enhance recovery of oil and natural gas. Another 21 percent ofproduced water is injected for disposal. Subsurface formation water and waste fluids produced by the oiland gas industry are injected into Class II wells as required under the Safe Drinking Water Act. Thus,approximately 92 percent of produced water is managed through Class II well injection into subsurfacereservoirs, generally considered the safest and most effective method for handling these type fluids.Although only 3 percent of produced water is discharged; almost all of the discharged volume is obtainedfrom coalbed methane operations in Alabama and is discharged under NPDES permits. Less than half ofone percent of produced water is disposed at commercial disposal facilities.
Table 2.4. 1995 Produced Water Disposal Method – Reported Data
Produced Water Disposal Method
Percentage ofProduced Water
Disposed byMethod
Inject for Enhanced Oil Recovery (EOR) 71.0 %Inject for Disposal Onsite 18.0 %Treat and Discharge a 3.0 %Inject for Disposal Offsite 2.5 %Beneficial Reuse b 2.0 %Inject at Commercial Disposal Facility < 0.5%Road Spread < 0.01%Other c (“percolation ponds”) 3.0 %a Over 99 percent of surface discharged water originates from coalbedmethane operations in Alabama. The remaining discharged water iscomprised of small volumes reported from gas production operations inAppalachian states.b Beneficial reuse takes place under NPDES permits and allowsproduced water to be used for irrigation, livestock watering, and similaruses in the Western U.S.c Almost the entire volume in the “Other” category is reported byoperators in California and appears to represent a produced watermanagement method unique to California.
The percentage of produced water disposed by the methods summarized in Table 2.4 was appliedto the 17,900 million barrels total volume estimated in Appendix C.1. An estimated 16,500 million barrelswere injected into Class II wells in 1995, of which 12,700 million barrels were used for enhanced oil recovery

12
and 3,800 million barrels were disposed. Approximately 500 million barrels were discharged via NPDESpermit, an estimated 400 million barrels were re-used for beneficial purposes, and 500 million barrels weredisposed by other methods.
As Appendix C, Table 2 indicates, there is significant regional variation from the nationwideaggregate produced water disposal methods presented in Table 2.4 above. For example, surface dischargeof produced water is permitted for large coalbed methane operations in Alabama. Consequently, thepercentage of water disposed by NPDES discharge in Alabama is quite large relative to other states, andrepresents a special case resulting from the coalbed methane operations in that state. The AppalachianStates (KY, OH, PA, NY, VA, WV) and the Rocky Mountain States (CO, WY, UT, MT) provide furtherexamples of regional variation in produced water disposal methods. In the Appalachian states, 85 percent ofproduced water is injected, 15 percent is reported as being surface discharged, and 6 percent of producedwater is disposed at commercial facilities. Only 30 percent of injected produced water is used for enhancedoil recovery operations in the Appalachian states. In contrast, 85 percent of produced water is injected forEOR in the Rocky Mountain States, 7 percent is injected onsite for disposal, but less than 1 percent ofproduced water is disposed at offsite commercial facilities. In the Rocky Mountain States approximately 7percent of produced water is reused for beneficial purposes (e.g., livestock watering, irrigation).
Table 2.5 compares the produced water disposal methods reported in API’s 1985 Production WasteSurvey with the disposal methods reported in API’s 1995 E&P operations survey. While the totalpercentage of produced water injected remained constant between 1985 and 1995; the percentage injectedfor enhanced recovery increased significantly by 1995. Disposal by injection was not distinguished asonsite, offsite, or commercial disposal in the 1985 survey. The percentage of produced water disposed byNPDES surface discharge decreased by half between 1985 and 1995. This was mainly due to a prohibitionof coastal discharges in Louisiana and Texas, which was phased in during the early 1990s. In 1995,disposal by NPDES surface discharge is limited to a few unique, regional operations.
Table 2.5. Comparison of 1985 and 1995 Produced Water Disposal Methods
Produced Water Disposal Method
% ProducedWater Disposed
by Method1985
% ProducedWater Disposed
by Method1995
Inject for Enhanced Oil Recovery (EOR) 62 % 71 %Injected for Disposal 30 % 21 %
NPDES Discharge 6 % 3 %a
Reuse 0 % 2 %Other (percolation, evaporation, publictreatment works) 2 % 3 %
Total 100% 100%a Nearly all surface discharge is from coalbed methane operations in Alabama.
2.4.3. Produced Water – Gas Processing Plants
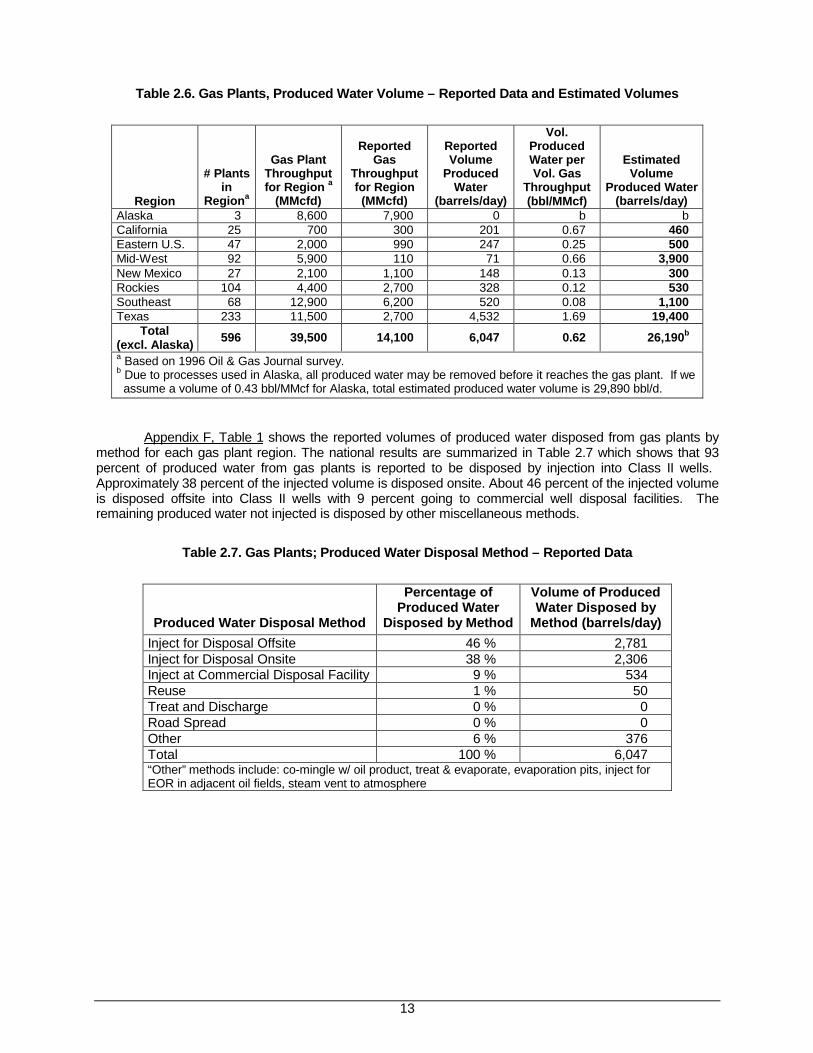
Gas plant survey respondents reported the removal of over 6,000 barrels of produced water perday. This is water that was not separated from the gas in the field but must be removed prior to processing.When extrapolated on gas throughput, the total volume of produced water from gas processing plants isestimated to be at least 9.5 million barrels per year. Table 2.6 summarizes the reported data andextrapolated volume of produced water for each gas plant region. The Alaskan region reported no volume ofproduced water. If an estimated volume of produced water is assumed for Alaska, then the total estimatedvolume of produced water from gas plants may be as much as 10.9 million barrels per year.
13
Table 2.6. Gas Plants, Produced Water Volume – Reported Data and Estimated Volumes
Region
# Plantsin
Regiona
Gas PlantThroughputfor Region a
(MMcfd)
ReportedGas
Throughputfor Region(MMcfd)
ReportedVolume
ProducedWater
(barrels/day)
Vol.ProducedWater perVol. Gas
Throughput(bbl/MMcf)
EstimatedVolume
Produced Water(barrels/day)
Alaska 3 8,600 7,900 0 b bCalifornia 25 700 300 201 0.67 460Eastern U.S. 47 2,000 990 247 0.25 500Mid-West 92 5,900 110 71 0.66 3,900New Mexico 27 2,100 1,100 148 0.13 300Rockies 104 4,400 2,700 328 0.12 530Southeast 68 12,900 6,200 520 0.08 1,100Texas 233 11,500 2,700 4,532 1.69 19,400
Total(excl. Alaska) 596 39,500 14,100 6,047 0.62 26,190b
a Based on 1996 Oil & Gas Journal survey.b Due to processes used in Alaska, all produced water may be removed before it reaches the gas plant. If we assume a volume of 0.43 bbl/MMcf for Alaska, total estimated produced water volume is 29,890 bbl/d.
Appendix F, Table 1 shows the reported volumes of produced water disposed from gas plants bymethod for each gas plant region. The national results are summarized in Table 2.7 which shows that 93percent of produced water from gas plants is reported to be disposed by injection into Class II wells. Approximately 38 percent of the injected volume is disposed onsite. About 46 percent of the injected volumeis disposed offsite into Class II wells with 9 percent going to commercial well disposal facilities. Theremaining produced water not injected is disposed by other miscellaneous methods.
Table 2.7. Gas Plants; Produced Water Disposal Method – Reported Data
Produced Water Disposal Method
Percentage ofProduced Water
Disposed by Method
Volume of ProducedWater Disposed by
Method (barrels/day)Inject for Disposal Offsite 46 % 2,781Inject for Disposal Onsite 38 % 2,306Inject at Commercial Disposal Facility 9 % 534Reuse 1 % 50Treat and Discharge 0 % 0Road Spread 0 % 0Other 6 % 376Total 100 % 6,047“Other” methods include: co-mingle w/ oil product, treat & evaporate, evaporation pits, inject forEOR in adjacent oil fields, steam vent to atmosphere

14
3. SURVEY RESULTS: ASSOCIATED WASTES, GAS DEHYDRATION/SWEETENINGWASTES, DRILLING WASTES, AND WASTE MANAGEMENT PRACTICES
3.1. Associated Wastes and Waste Management
3.1.1. Types of Associated Wastes
Associated wastes include a wide range of small volume waste streams that are associated withexploration and production of oil and natural gas. These wastes are often grouped under the term“associated wastes” as the third category of wastes (along with produced water and drilling wastes) that areexempt from regulation as hazardous wastes under the Resource Conservation and Recovery Act.9 The1995 E&P operations survey considered four categories of wastes that together comprise the majority ofassociated wastes:
• Completion Fluids – All fluids from initial well completion activities, including any initial acidstimulation or hydraulic fracturing.
• Workover/Stimulation Fluids – All fluids from subsequent workover and stimulationoperations.
• Tank Bottoms/Oily Sludges – Tank sediment and water, produced sand and other tankbottoms.
• Dehydration/Sweetening Wastes – Includes glycol-based compounds, glycol filters, molecularsieves, amines, amine filter, precipitated amine sludge, iron sponge, scrubber liquids andsludge, backwash, filter media and other wastes associated with the dehydration andsweetening of natural gas.
Appendix D, Table 1 lists the 1995 reported volumes of associated wastes by state. Completion fluids andworkover fluids comprise 91 percent of the reported volume of associated wastes. Tank bottoms and sludgecomprise almost 9 percent of the reported volumes, and dehydration/sweetening wastes comprise only 0.25percent.
The associated waste streams considered in the 1995 E&P operations survey differ somewhat fromthe API 1985 Production Waste Survey. The types and volumes of associated wastes considered in the1985 Production Waste Survey are summarized in Table 3.1. The 1985 Production Waste Survey estimatedthe total volume of associated wastes generated in 1985 to be 11.76 million barrels; the 1995 surveyestimates the total volume of associated wastes generated annually to be about 20.5 million barrels. Themost significant difference is the 1995 survey defined completion fluids and workover/stimulation fluids astwo separate categories of associated wastes, whereas the 1985 survey combined the two waste streamsinto a single category. In the 1985 survey, workover fluids were described as: “… workover, swabbing,unloading, and completion fluids recovered from a well bore that are not recombined with the productionstream. They include spent acid or stimulation fluids and swab tank fluids sent directly to disposal. Theyexclude fluids sent down flow lines, hauled to field batteries or NPDES permitted pits because these fluidsare captured in other waste categories or under produced water disposal statistics.” Unlike the 1985 survey,the 1995 survey captures the volume of completion and workover fluids injected into Class II wells asassociated waste. Consequently, the large percentage of completion and workover fluids that were reporteddisposed by injection in 1995 were not captured as associated waste in the 1985 survey, but were insteadincluded in the estimated volume of produced water. For this reason, the percentage of associated wastescomprised of aqueous liquids in 1995 is almost twice the percentage of aqueous liquid associated waste in1985. The 1985 survey also includes oil-contaminated soil as associated waste, as well as a number ofother small waste streams such as solvents, cooling tower blowdown water, and used oils that were not
9 A fourth category of wastes, ‘industrial wastes’ includes wastes generated at E&P sites that are not uniquely associated with
oil and gas E&P operations and thus are not exempt from regulation as hazardous under RCRA. These include wastes suchas paint and used solvents. Industrial wastes were not addressed by the survey.

15
included in the 1995 survey. Approximately 25 percent of the total associated wastes estimated in 1985were contributed by waste streams not considered in the 1995 E&P operations survey.
Table 3.1. Summary of Total Estimated Associated Wastes from1985 Production Waste Survey (barrels)
Associated Waste % Waste
Est. WasteVolume
(bbls./yr.)Workover Fluids 48 % 5,656,000Produced Sand 11 % 1,276,000Oily Debris (contaminated soil, rags, etc.) 11 % 1,261,000Tank Bottoms 10% 1,232,000Dehydration/Sweetening Unit Wastes 4 % 460,000Untreatable Emulsions 3 % 355,000Used Solvents/Degreasers 2 % 252,000Cooling Water 2 % 219,000Used Oils 2 % 212,000Spent Iron Sponge < 1 % 54,000Other Liquid Wastes 5 % 591,000Other Solid Wastes 2 % 192,000
Total 11,760,000
3.1.2. Estimated Volume of Associated Wastes – 1995 E&P Operations Survey
Appendix D, Table 2 shows the estimated volumes of associated wastes by state. Completion fluidswere extrapolated based on the number of completed wells, workover/stimulation fluids were extrapolatedon the number of active wells, tank bottoms were extrapolated on total production, anddehydration/sweetening wastes were extrapolated on gas production. Table 3.2 summarizes the nationaltotal volume of associated wastes estimated from the 1995 E&P operations survey.
Table 3.2. 1995 E&P Operations Survey – Total Estimated Volume of Associated Wastes
Associated Waste % Waste
Est. WasteVolume
(bbls./yr.)Completion Fluids 43 % 8,778,000Workover/Stimulation Fluids 46 % 9,527,000Tank Bottoms/Oily Sludge 10 % 1,987,000Dehydration/Sweetening Unit Wastes 1 % 193,000Total 20,485,000Total (excluding completion fluids as inthe 1985 Survey) (11,707,000)
In 1985, the injected volume of workover and completion fluids was largely counted with the 1985volume of produced water. Consequently, the total 1995 volume of associated wastes minus the 1995volume of completion fluids provides an estimate of the total 1995 volume of associated wastes, 11.7 millionbarrels, that is directly comparable to the total 1985 volume of 11.76 million barrels (illustrated in Tables 3.1and 3.2). The 1995 volume of associated wastes may be underestimated because oily debris and othermiscellaneous waste streams were not included in the 1995 data. For example, in 1985 oily debriscontributed approximately 11 percent of associated wastes, or about 1.3 million barrels, but this wastestream is not included in 1995. Another 1.0 million barrels, or about 9 percent of the 1985 total associated

16
wastes, were contributed by miscellaneous solid and non-aqueous waste streams that were not included in1995.
There are several other noteworthy differences between the 1995 estimated volumes of associatedwastes and the 1985 estimated volumes. Aqueous fluids comprise 89 percent of associated wastes in 1995.The remaining 11 percent of associated wastes are solids, sludges, and glycol compound wastes. In 1985,solids, sludges, and non-aqueous liquids were estimated to comprise 45 percent of associated wastes, andworkover fluids, cooling tower blowdown water, and miscellaneous other liquid wastes comprised theremaining 55 percent of associated wastes. In 1995, the estimated total volume of workover fluid was 68percent greater than the total volume of workover fluid estimated in 1985. This increase probably reflects asubstantial increase in the number of well workovers, recompletions, and well stimulations between 1985and 1995. In 1995, the estimated volume of tank bottoms/oily sludge (includes produced sand) was about21 percent less than the 1985 estimated volume of 2.51 million barrels (produced sand plus tank bottoms).Because tank bottoms were extrapolated on production, the decreased volume of tank bottoms/oily sludgebetween 1985 and 1995 reflects the 27 percent decline in crude oil production during the period. Theestimated total volume of dehydration/sweetening wastes in 1995 is less than half the volume ofdehydration/sweetening wastes estimated in 1985. The 1995 estimated volume of dehydration wastes issurprisingly low considering that total U.S. gas production increased by 13 percent between 1985 and 1995and the number of active gas wells increased by 23 percent. The apparent decline in the estimated volumeof dehydration wastes may be the result of a combination of factors: 1) Recycled glycol waste fluids werenot reported in the survey; 2) By 1995, the percentage of production that is “new” gas increased relative tototal gas production, and new production tends to be dry gas that does not require dehydration; 3) Thesurvey response was insufficient to characterize gas dehydration wastes for the total United States.10
In comparing the estimated volumes of associated wastes between 1985 and 1995, another factorto consider is better record keeping. At the time of the 1985 survey, the term “associated wastes” was newand many companies simply did not keep track of these waste streams (which tend to be only a few barrelsper well annually). By 1995, increased environmental awareness and the availability of better informationmanagement systems enhanced the accuracy of the data reported on the survey forms. Thus, a portion ofthe apparent “increase” in associated wastes may simply be due to better tracking and reporting of thesewaste streams within companies.
3.1.3. Associated Waste Disposal
Table 3.3. reports the estimated associated waste disposal practices for the aggregate associatedwaste stream for the total United States. The disposal practices reported in Table 3.3 reflect the largevolume of aqueous liquid associated wastes that were identified in the 1995 survey. In 1995, the mostcommon disposal practice was injection, 7.78 million barrels, followed by recycling, reclamation or beneficialreuse, 3.89 million barrels. Approximately, 3 million barrels were disposed at commercial E&P wastefacilities and 2.25 million barrels were evaporated.
10 In the 1995 survey, only 17 respondents reported dehydration waste in a total of 11 states. It is possible that the sample
reporting gas dehydration wastes were not representative of gas dehydration operations in the U.S. as a whole.

17
Table 3.3. Estimated Associated Waste Disposal Practices for the Total U.S.;Total Associated Waste Stream – 1995 E&P Operations Survey
Associated Waste Disposal Method % Waste
Total EstimatedWaste Volume
(bbls./year)Disposal by Injection 38 % 7,784,000Recycle, Reuse, Oil Reclamation 19 % 3,892,000Commercial E&P Waste Facility 15 % 3,073,000Evaporate from Pits 11 % 2,253,000Land Spread 5 % 1,024,000Road Spread 2.5 % 512,000Incinerate 0.4% 82,000Municipal or Industrial Landfill <0.1 % 20,500Other: (land treatment, burial onsite, disposalpits, other commercial disposal) 9% 1,844,000
Total (Bbls./Yr.) 100% 20,484,500
Table 3.4 shows the total volume of associated wastes by disposal practice estimated in the 1985Production Waste Survey. In 1985, the largest volume of associated wastes, 6.1 million barrels, wasdisposed in offsite commercial facilities. In 1995, only half this volume, 3.1 million barrels was estimated tobe disposed at commercial E&P facilities. It is possible that the additional 3 million barrels disposed at offsitecommercial facilities in 1985 includes some of the associated waste streams and volumes not identified inthe 1995 survey, such as oil contaminated soil, spent solvents, emulsions, and miscellaneous oily debris.Between 1985 and 1995, the estimated volume of associated wastes disposed by land spreading or roadspreading declined by over 40 percent from 2.7 million barrels to 1.5 million barrels. In 1995, 10 millionbarrels were estimated disposed by injection and evaporation compared to 1.18 million barrels in 1985. Thisreflects the inclusion of completion fluids as an associated waste in 1995, as well as the significant increasein workover/stimulation fluids between 1985 and 1995.
Table 3.4. Estimated Volume of Associated Wastes by Disposal Techniques From 1985 Production Waste Survey
Associated Waste DisposalMethod % Waste
Total EstimatedWaste Volume
(bbls./year)Offsite Commercial Facility 52 % 6,114,000Road Spread 14 % 1,646,000Land Spread 9 % 1,058,000Injection 7 % 823,000Recycle 7 % 823,000Onsite Burial 5 % 588,000Evaporation/Onsite Pit 3 % 353,000Surface Discharge 1 % 116,000Other: (incinerate, burned as fuel) 2% 235,000Total (Bbls./Yr.) 100.0% 11,756,000
Table 3.5 and Table 3.6 show the estimated volume of wastes disposed by waste disposal practicefor each of the associated waste streams considered in the 1995 E&P operations survey. Appendix D,Table 3 and Table 4 contain the reported data on which Table 3.5 and Table 3.6 are based. Associatedwaste disposal practices vary significantly depending upon the type of waste stream. Appendix D, Table 5and Table 6 show the reported volumes of associated wastes disposed by state. These tables indicatevariations in associated waste disposal practices between states and regions.

18
Table 3.5. Estimated Volumes of Associated Wastes by Disposal Method;Completion Fluids and Workover Fluids,
1995 E&P Operations Survey
Associated Waste Disposal Methods
%Completion
Fluids
Est. VolumeCompletion
Fluids(bbls/yr.)
%Workover
Fluids
Est. VolumeWorkover
Fluids(bbls./yr.)
Disposal by Injection 21 % 1,843,000 59 % 5,621,000Recycle, Beneficial Reuse, OilReclamation 33 % 2,897,000 <0.1 % 10,000
Commercial E&P Waste Facility 29 % 2,546,000 4 % 381,000Evaporate from Pits 8 % 702,000 16 % 1,524,000Land Spread 6 % 527,000 2 % 191,000Road Spread 0 0.4% 38,000Incinerate 0 1 % 95,000Municipal or Industrial Landfill 0 0Other: (land treatment) 3 % 263,000 17.5 % 1,667,000
Total 100% 8,778,000 100% 9,527,000
Table 3.6. Estimated Volumes of Associated Wastes by Disposal Method; Tank Bottoms/Oily Sludgeand Dehydration Wastes, 1995 E&P Operations Survey
Associated WasteDisposal Methods
% TankBottoms
Est. VolumeTank Bottoms/
Sludge(bbls./yr.)
%Dehydration
Wastes
Est. VolumeDehydration
Wastes(bbls./yr.)
Disposal by Injection 24 % 477,000 4 % 7,700Recycle, Beneficial Reuse, OilReclamation 37 % 735,000 7 % 13,500
Commercial E&P Waste Facility 2 % 40,000 32 % 61,700Evaporate from Pits 0.2 % 4,000 0Land Spread 16.5 % 328,000 8 % 15,400Road Spread 18 % 358,000 48.5 % a 93,500Incinerate <0.1 % 2,000 0.1 % 200Municipal or Industrial Landfill <0.1 % 2,000 0Other: (onsite burial, othercommercial disposal, disposal pits) 2 % 40,000 0.5 % 1,000
Total 100% 1,986,000 100% 193,000a Of the 17 survey respondents reporting gas dehydration waste, a single respondent accounted foralmost half the total reported volume of dehydration waste. This same respondent reported alldehydration waste was roadspread in 1995. If this response is excluded from the reported data, thenthe total extrapolated volume of dehydration/sweetening waste is 99,000 barrels with an estimated 62.5percent disposed at commercial E&P waste disposal facilities.
Comparison of the associated waste disposal practices and waste volumes reported in 1985 and1995 suggest that significant changes occurred over the decade:
• The estimated total volume of associated wastes did not decrease between 1985 and 1995despite the decline in oil production during that period. Between 1985 and 1995 the volume ofaqueous liquid wastes increased relative to the volume of solid and oily wastes, with acorresponding increase in the volume of associated wastes disposed by Class II injection andevaporation.

19
• The volume of workover/stimulation fluids increased between 1985 and 1995, possiblyreflecting an increase in workovers, recompletions, and well stimulations during that time.
• The volume of tank bottoms/oily sludge declined between 1985 and 1995. The decreasedvolume of oily wastes may, in part, be the result of the decline in oil production during thattime, as well as improved waste minimization and waste treatment efforts.
• There appears to be an almost 50 percent decrease in the use of offsite commercial E&Pfacilities for associated waste disposal between 1985 and 1995. The estimated volume ofassociated wastes disposed at commercial facilities was 3 million barrels in 1995, down from6 million barrels in 1985. This result suggests that a greater percentage of associated wasteswere managed onsite in 1995 than in 1985.
• The estimated volume of associated waste disposed by surface disposal methods such assurface discharge, land spreading, and road spreading declined between 1985 and 1995.
3.2. Gas Processing Plant Wastes and Waste Management
3.2.1. Types of Gas Processing Plant Wastes
Like other types of wastes uniquely associated with oil and natural gas production, gas processingplant wastes are exempt from regulation as hazardous under the Resource Conservation and Recovery Act(RCRA). Exempt gas plant wastes include glycol and glycol-based compounds, glycol filters, molecularsieves, amines, amine filters, precipitated amine sludge, iron sponge, scrubber liquids and sludge,backwash, filter media, and miscellaneous other wastes associated with dehydration or sweetening ofnatural gas. The 1995 survey of gas processing plant wastes considered four categories of wastes thatrepresent the primary exempt waste streams from gas processing operations. The waste streamsconsidered include:
• Spent glycol/glycol compounds• Used filters and filter media• Scrubber liquids and sludge• All other dehydration and sweetening wastes.
Detailed survey data reported for each gas plant dehydration waste stream are presented by region inAppendix F, Tables 2, Table 3, Table 4, and Table 5. Appendix F, Table 6 summarizes the reportedvolumes of gas processing plant wastes for the total United States.
3.2.2. Gas Processing Plant Waste Disposal Methods and Estimated Volumes of Waste
The total estimated volume of gas processing plant wastes for the United States is shown in Table3.7. No wastes were extrapolated for the Alaska region because no wastes were reported for that region.The total estimated volume of wastes from gas processing plants is less than 1 percent of the estimatednational total volume of associated wastes. Scrubber liquids and sludge comprise an estimated 79 percentof the waste stream from gas plants. Glycol compounds and used filters/filter media each contribute 1percent to 2 percent of the gas plant dehydration waste stream. The remaining 18 percent of the wastesinclude other unspecified dehydration wastes.

20
Table 3.7. Gas Processing Plant Wastes – Estimated Volumes(extrapolated on gas throughput)
Region
GasThroughputfor Region
(MMcfd)
Est. VolumeSpentGlycol/Glycol
Compounds(bbls./yr.)
Est.Volume
UsedFilters/
Filter Media(bbls/yr.)
Est.Volume
ScrubberLiquids &
Sludge(bbls./yr.)
Est. VolumeAll Other
Dehydration/Sweetening
Wastes(bbls./yr.)
Est. TotalReportedVolume ofGas Plant
Wastes(bbls./yr.)
Alaska 8,637 0 0 0 0 0California 679 50 60 460 0 570Eastern U.S. 2,005 220 1 120 0 340Mid-West 5,894 0 10 0 830 840New Mexico 2,122 0 50 40 2,140 2,230Rockies 4,384 710 420 70 1,950 3,150Southeast 12,864 210 150 66,370 9,280 76,010Texas 11,502 10 820 13,470 4,090 18,390Total 48,087 1,200 1,510 80,530 18,290 101,530
Table 3.8. lists the estimated volume of gas processing plant wastes by disposal method. Thereported volumes of gas plant wastes by disposal method are summarized in Appendix F, Table 7. Table3.8 suggests that scrubber liquids comprise the largest component of gas processing plant wastes.Consequently, most gas plant wastes, 78.5 percent, are disposed by injection or evaporation. Thirteenpercent of gas plant wastes are disposed offsite at commercial E&P waste facilities or landfills. Data werenot collected on gas processing plant wastes in the 1985 production survey, so no comparison can be madewith 1985 waste volumes and disposal practices.
Table 3.8. Gas Processing Plants; Estimated Volume of Wastes by Disposal Method
Waste Disposal Method
Percentage of GasProcessing PlantWastes Disposed
by Method
Estimated Volume ofWastes Disposed by
Method(barrels/year)
Disposal by Injection 76 % 77,200Commercial E&P WasteDisposal Facility 9 % 9,100
Land Spread Onsite 6 % 6,100Industrial or Municipal Landfill 4 % 4,100Evaporate from Pits 2.5 % 2,500Recycle or Reuse 1 % 1,000Incinerate 0.25% 300Road Spread Onsite 0.01 % 10Other 1 % 1,000Total 100% 101,310“Other” methods include: “co-mingle w/ oil product, waste disposal contractor, onsiteburial w/ permit, incineration in “waste-to energy” plant”

21
3.3. Drilling and Drilling Waste Management
3.3.1. Drilling Techniques
Traditionally, wells are drilled using one of two techniques. Most wells are drilled using a rotary rigwith drilling mud to cool the bit and lubricate the hole. Wells drilled with a rotary rig generally have a reservepit to store and dispose the used drilling fluids and cuttings. An older drilling technique, common inAppalachia, uses a truck-mounted cable tool drilling rig. But new technologies have made in-roads. Insensitive areas, reserve pits are increasingly replaced with storage tanks in what is termed as a “closedsystem.” Certain types of wells are drilled using pneumatic tools and air, gas, or foam in place of drillingmud. The survey requested information on drilling techniques to better understand the percentage of wellsdrilled with techniques other than a rotary rig and open mud systems. Appendix E, Table 1 summarizes thereported data on drilling techniques used for new wells in 1995.
Survey respondents reported a total of 1,244 new wells drilled. Operators from the Appalachianstates reported 124 new wells, or approximately 10 percent of the total. With a few regional exceptions, the1995 E&P operations survey indicates that the majority of new wells in the onshore U.S. were drilled using areserve pit to store and dispose used drilling muds and cuttings. The primary regional exceptions are Alaska(100 percent wells reported drilled with closed system), New Mexico (73 percent of new wells drilled with airor gas), and Appalachia (96 percent drilled with air, gas, or pneumatics).
Table E.1 shows that for the total United States, 66 percent of new wells were reported drilled with amud system discharging to reserve pits, 23 percent of new wells were drilled with a closed system (noreserve pits), 11 percent were drilled with air or gas (no drilling mud), and less than 0.1 percent werereported drilled with a cable tool.11 Sixty-nine percent of mud reserve pits was reported to be lined. For theAppalachian states reporting, 96 percent of new wells were drilled with air and the remaining 4 percent weredrilled using a reserve pit. No respondents from Appalachian states reported wells drilled with a cable tool. Ifthe Appalachian component is removed from the reported data in Table E.1, for the remaining states, 74percent of new wells were drilled using a reserve pit, 25 percent with a closed system, and only 1 percentwas drilled with air or gas.
A significant improvement in drilling practices between 1985 and 1995 is indicated by the differencein drilling techniques reported in the 1995 E&P operations survey and the drilling techniques inferred fromthe 1985 survey.12 Between 1985 and 1995, the percentage of lined reserve pits increased from 35 percentto 69 percent. By 1995, one quarter of new wells were drilled with a closed system and did not requirereserve pits.
3.3.2. Percentage of Drilling Wastes by Base Drilling Fluid
Appendix E, Table 2 contains reported percentages of drilling wastes by base drilling fluid. TableE.2 indicates that most of the new wells, with a few local exceptions, are drilled with freshwater base mud.Alaska is the only state that reports a significant percentage of new drilling with synthetic based drilling mud(30 percent). Most drilling with oil based mud is reported only in Louisiana and Oklahoma. Drilling withsaltwater-based mud is reported in only six states known to have salt bearing formations.
In Appendix E, Table 3, the percentage of drilling wastes by base drilling fluid (from Table E.2) wereapplied to reported drilling waste volumes to estimate a national percentage of drilling wastes by basedrilling fluid. Table E.3 shows that in 1995, 92.5 percent of drilling wastes were derived from freshwaterbased drilling fluid, 5.5 percent of drilling wastes were derived from saltwater based drilling fluids, oil baseddrilling fluid produced less than 1.5 percent of wastes, and the remaining 0.5 percent were derived from 11 Only one well was reported drilled with a cable tool.12 In the API 1985 Production Waste Survey, 91 percent of wells were reported drilled with a mud system. The remaining 9
percent of new wells reported as “other” in 1985 is inferred to represent air- or gas-drilled wells. Of the 91 percent of new wellsdrilled with mud systems in 1985, 2 percent were drilled with a polymer mud system, which are inferred to be closed systems.Nationwide, an estimated 35 percent of reserve pits was estimated to be lined.

22
synthetic based drilling fluid. The 1985 Production Waste Survey reported that 64 percent of drilling wasteswere derived from freshwater based mud systems; 23 percent of drilling wastes were derived from saltwaterbased muds; oil based muds produced 7 percent of drilling wastes; and polymer or “other” muds producedthe remaining 6 percent of drilling wastes. The decline in drilling waste from oil-based drilling reflects theavailability of better water-based and synthetic-based drilling formulas, along with industry practice tosubstitute more environmentally friendly materials where feasible.
3.3.3. Volume of Drilling Wastes
Table 3.9 provides an estimate of the volume of drilling wastes generated within each state during1995. Drilling waste volumes for the 1995 survey were estimated by multiplying the total 1995 footage drilledby the average waste extrapolation factor determined for the state (by depth category) in the API 1985Production Waste Survey.13 The estimated national total volume of drilling wastes for 1995 is 148.7 millionbarrels or approximately 1.21 barrels of waste per foot drilled. This estimated 1995 volume is less than halfthe 361 million barrels of drilling wastes estimated in 1985. Because the approach used to estimate the1995 volume of drilling wastes does not account for improvements in the efficiency of drilling systemsbetween 1985 and 1995, the actual volumes of drilling wastes may be over stated.
Appalachian States The 1995 E&P operations survey form sent to operators in the Appalachianstates asked respondents to report volumes of drilling waste. This information had not been collected for theAppalachian states in the 1985 Production Waste Survey. Appendix E, Table 4 shows the reported drillingwaste volumes and reported footage drilled for the Appalachian region. Only eight respondents in the regionreported drilling in 1995 and almost 97 percent of the reported footage was drilled with air rather than a mudsystem. The remaining 3 percent of reported footage was drilled with a mud system.
The reported data collected for the Appalachian region (0.07 barrels waste/foot) may representtypical waste volumes generated by air drilling, and may not be representative of typical drilling wastevolumes generated for the Appalachian region as whole. In Appendix E, Table 5 the estimated wasteextrapolation factor for air drilling, 0.07 barrels/foot, (from Table E.4) is applied to the Appalachian states, aswell as other states, which report significant air drilling in the 1995 survey (New Mexico, Oklahoma, andUtah). Table E.5 provides alternative estimates of drilling wastes for these states (NM, OK, UT, KY, NY, OH,PA, TN, VA, WV) that are considerably lower than the drilling waste volumes estimated in Table 3.9. If thealternative drilling waste volumes estimated for the selected states in Table E.5 are substituted for thedrilling waste volume estimated in Table 3.9, the estimated national total volume of drilling waste for 1995becomes 132.8 million barrels, or approximately 1.08 barrels of waste per foot drilled.
13 API 1985 Production Waste Survey, Table 90, Total Drilling Waste Volumes Discharged to the Reserve Pit.

23
Table 3.9. Estimated Total Volume of Drilling Wastes
STATE
Est. TotalFootage Drilledin 1995 – SurveyReported Data a
(feet)
Est. VolumeTotal Drilling
Waste per FootDrilled b (bbls/ft)
Est. Vol. DrillingWaste for 1995
Drilling - SurveyReported Data c
(barrels)
1995 TotalFootageDrilled d
(CompletedWells)
Est. TotalVolume Drilling
Wastes forState e
(barrels)AK 132,000 0.84 110,880 1,911,300 1,605,492AL 0 3.26 0 1,087,500 3,545,250AR 0 2.05 0 1,289,500 2,643,475AZ 1.92 0 5,400 10,368CA 830,325 0.61 506,498 2,994,100 1,826,401CO 72,000 0.87 62,640 4,117,600 3,582,312FL 3.71 0 15,500 57,505IL 55,800 0.51 28,458 749,100 382,041IN 0.62 0 172,200 106,764KS 1,024,428 0.9 921,985 5,344,700 4,810,230KY 83,500 1.43 119,405 1,465,100 2,095,093LA 175,390 1.95 342,011 11,526,800 22,477,260MI 11,900 1.1 13,090 1,573,900 1,731,290MO 1.13 0 0MS 0 2.94 1,370,100 4,028,094MT 58,616 1.52 89,096 898,500 1,365,720ND 0 1.05 841,500 883,575NE 0 0.55 159,800 87,890NM 60,911 1.29 78,575 5,752,500 7,420,725NV 1.57 104,600 164,222NY 18,200 1.28 23,296 108,000 138,240OH 44,650 0.56 25,004 3,073,700 1,721,272OK 133,600 1.11 148,296 11,857,800 13,162,158OR 0.36 0 0PA 98,600 1.03 101,558 2,357,100 2,427,813SD 1.03 9,300 9,579TN 2.39 93,000 222,270TX 2,488,209 1.13 2,811,676 57,847,100 65,367,223UT 100,250 1.68 168,420 929,400 1,561,392VA 93,793 0.41 38,455 139,900 57,359WV 254,160 0.54 137,246 1,585,000 855,900WY 24,000 1.27 30,480 3,443,900 4,373,753
Total 5,760,332 1.2 5,757,070 122,823,900 148,720,666a Extrapolated from survey form question 22a: reported # new wells drilled in each depth zone x average drillingdepth reported for each depth zoneb Average for state from API 1985 Production Waste Surveyc (Column 2) x (Column 3)d Oil and Gas Journal, Energy Statistics Sourcebook, 12th edition, Table “Footage Drilled by State”e (Column 3) x (Column 5)
3.3.4. Types of Drilling Wastes and Drilling Waste Disposal
Appendix E, Table 6 summarizes the disposal methods reported for liquid drilling wastes. Thepercentage of liquid wastes disposed by each method is expressed as a percentage of total drilling wastes.In California for example, survey respondents report that 19 percent of total drilling wastes are liquid wastesdisposed by evaporation. Appendix E, Table 7 summarizes the disposal methods reported for solid drillingwastes. The percentage of solid wastes disposed by each method is expressed as a percentage of totaldrilling wastes. In Texas for example, survey respondents report that 13 percent of total drilling wastes aresolid wastes disposed by burial onsite.

24
Table 3.10 illustrates that, for the total United States, almost 74 percent of drilling wastes werecharacterized as liquid wastes and 26 percent were characterized as solid drilling wastes. The estimatedwaste volumes disposed by various disposal methods are summarized in Appendix E, Table 8 for liquiddrilling wastes and in Appendix E, Table 9 for solid drilling wastes.
Table 3.10. Summary of Estimated Drilling Wastes by Type of WasteFrom 1995 E&P Operations Survey (barrels)
Estimated Total Liquid Wastes 109,443,000 73.6 %a
Estimated Total Solid Wastes 39,257,000 26.4 %Estimated Total Drilling Waste Volume 148,700,000 100 %a Estimated relative percentages of solid and liquid drilling waste are derived fromAppendix E, Tables 8 and 9, “Estimated Volumes of Liquid and Solid Drilling Waste forStates with Reported Data.”
The relative volumes of solid and liquid drilling wastes reported in Table 3.10. were derived in thefollowing manner. The estimated volume of drilling wastes for each state (shown in Table 3.9.) wasmultiplied by the reported percentage of wastes disposed by each method (shown in Appendix E, Table 6and Appendix E, Table 7). This was done only for states that reported drilling wastes in the 1995 survey.This exercise produced an estimate of the volume of drilling wastes disposed by each method for each statewith reported data. These estimated volumes were aggregated to obtain an estimate of the relative volumeof solid and liquid drilling wastes for the total United States, and an estimate of the aggregate drilling wastedisposal practices for the total United States.
In the 1985 waste survey, liquid drilling wastes were estimated to comprise almost 90 percent ofdrilling wastes. Ten percent of drilling wastes were estimated to be solids, primarily drill cuttings. Table 3.11summarizes the types of drilling wastes identified in the API 1985 Production Waste Survey. Comparison ofTables 3.10 and Table 3.11 indicate a significant increase in the relative volumes of solid drilling wastes toliquid wastes from 1985 to 1995.
Table 3.11. Summary of Estimated Drilling Wastes by Type of WasteFrom 1985 Production Waste Survey (barrels)
Mud andCompletion Fluid 226,801,000 62.75%
All Other Water 87,724,000 24.3 %Formation TestingFluids 916,000 0.25 %
Other Fluids 8,222,000 2.3 %Total LiquidWastes 323,663,000 89.6 %
Drill Cuttings 35,674,000 9.9%Circulated Cement 1,876,000 0.5 %Other Solids 196,000Total SolidWastes 37,746,000 10.4 %
Total Volume 361,409,000

25
Two factors may contribute to the apparent increase in solid drilling wastes relative to liquid drillingwastes in the 1995 survey:
1. There appears to be more air drilling represented in the 1995 E&P operations survey relative tothe 1985 survey due, in part, to an increase in air-drilled coalbed methane wells by 1995 and inpart, to greater representation of Appalachian operations in the 1995 survey. If Appalachianstates are omitted from total drilling waste estimate, the percentage of solid drilling wastes areestimated to be 25 percent.
2. In the 1985 survey, drilling mud was characterized as a liquid waste, and a significant portion ofdrilling mud was reported hauled offsite for disposal as a liquid waste. In the 1995 survey, mostdrilling wastes were reported disposed onsite through evaporation of the liquid portion andburial of the solid portion. The 1995 E&P operations survey may have more effectively capturedthe solid component of drilling mud as a solid drilling waste. The mud solids remaining afteronsite evaporation of freshwater based liquid drilling waste would generally be incorporatedwith drill cuttings and disposed through onsite burial. This would increase the volume of soliddrilling wastes relative to liquid drilling wastes in the 1995 E&P operations survey.
Table 3.12 shows the aggregate nationwide drilling waste disposal practices estimated from the1995 E&P waste survey. Nationwide, over two-thirds of drilling wastes (68 percent) were disposed onsitethrough evaporation and burial. Injection and reuse of liquid wastes account for another 20 percent ofdrilling wastes. Approximately 8 percent of drilling wastes were disposed on the land surface through landspreading and surface discharge. Disposal at commercial E&P waste facilities appears to be a minordisposal practice used for less than 3 percent of onshore drilling wastes.
Table 3.12. Estimated Drilling Waste Disposal Practices - 1995 E&P Operations Survey
Evaporate On or Offsite 47 % Liquid Drilling WasteBurial Onsite 21 % Solid Drilling WasteInjection (includes injection down annulus) 13 % Liquid WasteReuse for Drilling 7 % Liquid WasteLand Spread Onsite 6 % Solid and Liquid WasteLand Spread Offsite 1 % Solid and Liquid WasteCommercial Disposal Facility 2 % Solid WasteTreat and Discharge 1 % Liquid WasteRecycle, Road Spread, Municipal Landfill <0.5 % Solid and Liquid Waste
Other < 1.5 %
Includes: grind and inject – solidwaste; commercial disposal – liquidwaste; onsite remediation – solids &liquid waste; disposal pits – solidwaste.
Total 100%
The greatest change in drilling waste disposal practices between 1985 and 1995 appears to be amarked increase in onsite disposal and a decrease in surface discharge of liquid drilling wastes. In the 1985Production Waste Survey, 28 percent of drilling wastes were estimated to be hauled offsite for disposal. By1995, less than 3 percent of drilling wastes were disposed at offsite commercial facilities. This increase inonsite disposal, particularly onsite evaporation, may be a function of the increased use of lined reserve pits.The estimated drilling waste disposal practices from the 1985 Production Waste Survey are summarized inTable 3.13 for comparison with the 1995 E&P operations survey results.

26
Table 3.13. Comparison of 1985 and 1995 Estimated Drilling Waste Disposal Practices
% Drilling Wastes Disposed by MethodDrilling WasteDisposal Method 1985 1995
Evaporate Onsite 29 % 47 %Hauled Offsite 28 % 2 %Injection 13 % 13 %Buried Onsite 12 % 21 %Discharge to Surface 10 % 1 %Land Spread 7 % 7 %Reuse for Other Drilling 0 % 7 %Other (includessolidification, incineration) 1 % 2 %
Total 100% 100%

27
4. SUMMARY OF RESULTS
Following is a summary of the extrapolated results of the survey questions evaluated in this report.The results presented here are national totals estimated for onshore operations for the total United States. The detailed survey results presented in the foregoing sections demonstrate that there is significant regionalvariation in E&P operations, the volume of wastes generated, and waste management practices.
• Production Pits – E&P OperationsNationwide, an estimated 55,000 pits are associated with production operations; 97 percent of
production pits are estimated to be active. An estimated 60 percent of production pits are lined.
• Production Pits – Gas PlantsAn estimated 875 production pits are associated with gas plants in the total United States; 97
percent of pits are estimated to be active. An estimated 62 percent of gas plant pits are lined.
• Tank Batteries and Tanks – E&P Operations and Gas PlantsThe estimated total number of oil tank batteries is 171,500 batteries. The estimated total number of
condensate tank batteries is 48,300 batteries. The estimated total number of tanks associated with E&Poperations is approximately 832,000 tanks. Over 3,000 additional non-pressurized tanks are estimated to beassociated with gas processing plants.
• Produced Water – E&P OperationsAn estimated national total of 17,900 million barrels of water was produced in 1995. This volume
represents approximately 7.5 barrels of produced water per barrel of oil. Most produced water, an estimated92 percent, was injected into Class II wells for enhanced oil recovery or disposal. Three percent of producedwater, primarily from coal bed methane wells in Alabama, was treated and discharged under NPDESpermits. Two percent of produced water was beneficially reused, and 3 percent was disposed by othermethods.14
• Produced Water – Gas PlantsAn estimated 9.5 million barrels of water was produced by gas plants in 1995. Ninety-three percent
of produced water from gas plants was disposed by injection into Class II wells. Only 1 percent was reused,and 6 percent was disposed by a variety of miscellaneous methods including co-mingling with oil production,evaporation, EOR injection into adjacent oil fields, and steam venting to the atmosphere.
• Associated WastesThe total estimated volume of associated wastes produced in 1995 was 20.5 million barrels. This
total is comprised of 8.9 million barrels of completion fluids, 9.5 million barrels of workover/stimulation fluids,2.0 million barrels of tank bottoms/oily sludge, and 0.2 million barrels of dehydration/sweetening wastes. Ofthe aggregate associated wastes, 38 percent were disposed by injection, 19 percent were recycled, reused,or reclaimed, 15 percent were disposed at offsite commercial E&P waste facilities, 11 percent wereevaporated, and 8 percent were land spread or road spread.
• Gas Processing Plant WastesThe total estimated volume of gas processing plant wastes produced in 1995 was 0.1 million
barrels. This total is comprised of approximately 80,500 barrels of scrubber liquids and sludge, 1,200 barrelsof spent glycol compounds, 1,500 barrels of used filters and filter media, and 18,300 barrels ofmiscellaneous other dehydration wastes. Seventy-six percent of gas processing plant wastes weredisposed by injection, 1 percent were recycled or reused, 9 percent were disposed at commercial E&Pwaste facilities, 3 percent were evaporated, 6 percent were land spread, and 4 percent were sent to landfills.
14 “Other” produced water disposal methods include percolation ponds, which are used only in California.

28
• Drilling TechniqueDrilling practices improved significantly between 1985 and 1995. In 1995, 66 percent of wells
nationwide were drilled with reserve pits compared to 89 percent of wells drilled with reserve pits in 1985. In1995, 69 percent of reserve pits were lined compared to 35 percent in 1985. Almost 25 percent of wellswere drilled with a closed system in 1995 compared to an inferred 2 percent of wells in 1985.
• Drilling WastesThe results from the 1995 E&P waste survey indicate an apparent decline in the use of oil and
saltwater based drilling fluids since 1985. In 1995, an estimated 93 percent of drilling wastes were derivedfrom freshwater based mud systems compared to 64 percent of drilling wastes in 1985. In 1995, 6 percentof drilling wastes were produced from saltwater-based mud systems compared to 23 percent in 1985.Finally, only 2 percent of drilling wastes were derived from oil based muds in 1995 compared to 7 percent ofwastes in 1985. Polymer and “other “ drilling fluids produced the remaining 6 percent of drilling wastes in1985. In 1995, synthetic based drilling fluids produced less than 0.5 percent of drilling wastes from onshoreoperations.
In 1995, almost 74 percent of drilling wastes were characterized as liquid wastes and 26 percentwere characterized as solid wastes. The total drilling wastes generated in 1995 are estimated to be 148.7million barrels or about 1.21 barrels/wastes per foot drilled. An alternative drilling waste estimateincorporates the survey-derived waste estimation factor for air-drilled wells of 0.07 barrels of waste per footdrilled. This alternative national estimate of the total volume of drilling wastes is 132.8 million barrels orabout 1.08 barrels of waste per foot drilled. Most drilling wastes in 1995 were disposed onsite. Forty-sevenpercent of drilling wastes was evaporated, 21 percent were buried onsite, 13 percent of drilling wastes wereinjected and 7 percent were reused for drilling other wells. Seven percent of drilling wastes were landspread and only 2 percent were disposed at commercial E&P waste facilities.
• Summary of Total Waste Volumes Disposed by Method in the United States
Table 5.1. 1995 Estimated Volume of E&P Wastes Disposed by Method (million barrels)
Disposal Method ProducedWater a
DrillingWastes
AssociatedWastes b
Total WasteVolume
% TotalWastes
Disposedby Method
Injection (includes EOR) 16,386.5 19.0 7.9 16,413.7 90.8 %Evaporation 0 69.9 2.3 72.2 0.4 %Burial Onsite 0 31.2 0 31.2 0.2 %Commercial E&P Waste Facility 90.3 3.0 3.1 96.4 0.5 %Reuse, Recycle, Reclaim 358.1 10.4 3.9 372.4 2.1 %Discharge 537.0 1.5 0 538.5 3.0 %Land Spread 0 10.4 1.0 11.4Road Spread 1.8 - 0.5 2.3 >0.1 %
All Other 537.0 3.0 1.9 541.9 3.0 %Total 17,910.7 148.7 20.6 18,080.0 100.0%a Includes produced water removed at gas plants.b Includes associated wastes generated at gas plants.

29
REFERENCES
American Petroleum Institute. Basic Petroleum Data Book, Volume XVIII, Number 1, January 1998.
American Petroleum Institute. 1985 Production Waste Survey, Statistical Analysis and Survey Results,October 1987.
American Petroleum Institute. 1985 Production Waste Survey, Part II - Associated and Other Wastes,Statistical Analysis and Survey Results, June 1988.
Energy and Environmental Research Center, Onshore Gas-Well Drilling Wastes: Character, Distribution,Management, and Research Issues report prepared for Gas Research Institute, March 1994.
Entropy Limited, Aboveground Storage Tank Survey report prepared for American Petroleum Institute,April 1989.
Gruy and Associates, Inc., memorandum from M.A. Brown to Glenda Smith, American Petroleum Instituteand Bill Freeman, Shell E&P Technology Company, February 3, 1998.
Gruy and Associates, Inc., memorandum from M.A. Brown to Glenda Smith, American Petroleum Instituteand Bill Freeman, Shell E&P Technology Company, March 10, 1998.
Independent Petroleum Association of America. The Oil and Gas Producing Industry in Your State, 1996-1997.
Oil & Gas Journal, 1995 Survey of Natural Gas Processing.

APPENDIX A
1995 PRODUCTION FACILITIES AND OIL AND GAS PRODUCTION
30
Table A.1. 1995 Producing Wells and Estimated Production Facilities by State
STATE
1995ProducingOil Wells a
1995ProducingGas Wells b
1995 TotalProducing
Wells
1995 OilProductionFacilities c
1995 GasProductionFacilities c
1995Well
Completions d
AK 2,086 100 2,186 417 44 165AL 913 3,526 4,439 302 1,728 176AR 7,834 3,988 11,822 2,611 2,659 215AZ 22 7 29 6 0 7CA 39,365 997 40,362 8,610 421 1,293CO 9,022 7,017 16,039 3,007 6,049 868FL 85 0 85 21 0 1IL 31,128 372 31,500 10,376 248 365IN 7,135 1,347 8,482 2,162 806 106KS 44,235 22,020 66,255 14,745 9,919 1,495KY 23,538 13,311 36,849 7,846 8,874 763LA 24,430 14,169 38,599 8,143 9,446 1,307MI 4,079 5,258 9,337 1,360 3,081 873MO 518 15 533 64 0 0MS 1,516 535 2,051 444 304 155MT 3,100 2,918 6,018 1,033 2,000 217ND 3,171 99 3,270 1,057 63 150NE 1,489 87 1,576 496 52 47NM 17,976 23,510 41,486 5,753 18,069 1,005NV 72 0 72 18 0 26NY 3,670 6,134 9,804 918 3,008 33OH 29,622 34,380 64,002 7,406 11,500 786OK 91,289 29,733 121,022 22,822 14,669 1,797OR 0 17 17 0 3 0PA 18,157 31,792 49,949 5,295 18,094 570SD 150 56 206 45 29 7TN 701 0 701 186 258 52TX 174,527 54,635 229,162 56,498 33,999 7,957UT 1,851 1,127 2,978 617 571 230VA 23 1,671 1,694 0 805 53WV 17,436 35,148 52,584 5,784 23,978 385WY 10,368 4,196 14,564 3,456 2,433 530
Total 569,508 298,165 867,673 171,498 173,110 21,634a API Basic Petroleum Data Book, Vol.18, No. 1, Table III-19.b API Basic Petroleum Data Book, Vol. 18, No. 1, Table III-17. c Memorandum from M.A. Brown, Gruy and Associates, Inc. to Glenda Smith, API dated March 10, 1998.Status report for work performed under contract to American Petroleum Instituted API Basic Petroleum Data Book, Vol. 18, No.1, Table III –15.
A.1. Estimated Oil and Gas Production Facilities
Table A.1 contains an estimated number of oil and gas production facilities by state. This estimateof 1995 oil and gas production facilities was developed by Gruy and Associates for API to providesupplemental data for extrapolation of API’s 1995 waste survey data. The estimate of 1995 productionfacilities/tank batteries is compiled from several sources including standard industry data, a custom 1990report prepared for API and Gruy Associates by the Petroleum Information Corporation (PI), otherproprietary company data, plus specific industry knowledge of contributing individuals.15
15 M.A. Brown, Gruy and Associates, March 10 1998 memorandum to Glenda Smith, American Petroleum Institute and Bill
Freeman, Shell E & P Technology Center.

APPENDIX A
1995 PRODUCTION FACILITIES AND OIL AND GAS PRODUCTION
31
The 1990 PI report lists all active producing wells and “reporting entities” for each state categorizedby producing rate and depth of production. A reporting entity usually corresponds to a lease or productionunit and is the point of product measurement and custody transfer. Stock tanks, separators, and othertreating equipment are usually located at the same site. Each lease must have separate metering andtreating facilities because the ownership of each lease is usually different. For states that require productionreported by lease, unit, or other custody transfer point, the number of production facilities/tank batteries canbe estimated fairly accurately.
Some states require oil production to be reported by well. For these states, the number of oilproduction facilities/tank batteries is estimated with considerably less certainty. In areas where production isshallow and the leases are relatively small, there are fewer producing wells per facility. In western states,the leases tend to be larger and may have more wells per producing facility/tank battery. Deep wells aregenerally widely spaced (up to one mile apart) and often have a production facility/tank battery for each well.Shallow wells are more closely spaced and have more wells per producing facility/tank battery.
Gas wells are usually more widely spaced than oil wells. Overall, there are fewer gas wells per gasfacility than there are oil wells per oil facility. Most states require gas production to be reported by well or by“gas unit”. When gas fields are first drilled there is usually only one gas well per unit and each unit has itsown facility. However, as gas fields mature and are infill drilled, several gas wells may be tied into the gasunit facility. If a field has both oil wells and gas wells, the facilities may be located at the same site. This caseis considered to represent two facilities.
This document contains two different estimates for the number of gas production facilities, whichwere derived differently. This appendix includes a large estimated number of facilities, based on PI data, asdescribed above. In Table 3-2 and Appendix B, figures are provided for condensate tank batteries, whichare essentially analogous to gas production facilities. The estimated number of condensate tank batterieswas derived from survey data. Comparing the two numbers and the number of gas wells per facility thateach represents, it seems likely that the actual number of gas production facilities/tank batteries issomewhere between these two estimates.

APPENDIX A
1995 PRODUCTION FACILITIES AND OIL AND GAS PRODUCTION
32
Table A.2. Total 1995 Oil, Gas, and Natural Gas Liquids Production by State
STATE
Total 1995 Oil Production a
(Mbbl)
Total 1995Gas Production b
(MMcf)
Total 1995 NaturalGas LiquidsProduction c
(estimated)(Mbbl)
AK 541,654 469,550 8,395AL 18,731 519,661 33,945AR 8,910 187,242 460AZ 71 558 - CA 350,686 279,555 8,030CO 27,976 523,084 14,600FL 5,693 6,463 1,260IL 16,190 335 145IN 2,778 249 - KS 43,767 721,436 35,309KY 3,492 74,754 1,582LA 426,322 5,108,366 93,425MI 11,383 238,203 4,597MO 120 16 - MS 19,911 95,533 304MT 16,529 50,264 322ND 29,335 49,468 2,804NE 3,794 2,240 9NM 64,508 1,625,837 59,651NV 1,342 13 - NY 304 18,400 - OH 8,258 126,336 84OK 87,491 1,811,734 63,501OR 0 1,923 - PA 1,939 111,000 104SD 1,344 1,252 - TN 382 1,820 - TX 600,527 6,330,048 264,512UT 19,988 241,290 2,329VA 12 49,818WV 1,948 186,231 7,891WY 78,884 673,775 10,368
Total 2,394,269 19,506,454 613,627a API Basic Petroleum Data Book, Vol. 18, No. 1, Table IV-5.b API Basic Petroleum Data Book, Vol. 18, No. 1, Table XIII-9.c IPAA, The Oil and Gas Industry in Your State, 1996-1997.

APPENDIX B
PRODUCTION PITS, TANK BATTERIES, TANKS
33
Table B.1. Production Pits – Reported Data
Percentage of Total Pits
State
TotalProduction
PitsReported
TotalWorkover
Pits
TotalActivePits
TotalInactive
Pits
TotalLinedPits Workover Active Inactive Lined
AK 7 0 7 0 7 100% 100%AL 48 0 48 0 48 100% 100%AR 0 0 0 0 0CA 234 27 209 25 87 12% 89% 11% 37%CO 884 6 881 3 846 1% 100% 96%FL 5 0 5 0 5 100% 100%IL 1 0 1 0 1 100% 100%KS 7 0 7 0 0 100% 0%LA 22 0 17 5 0 77% 23% 0%MI 0 0 0 0 0MS 2 0 2 0 2 100% 100%MT 39 1 38 1 5 3% 97% 3% 13%ND 8 0 8 0 0 100% 0%NE 4 0 2 2 0 50% 50% 0%NM 5 0 0 5 0 100% 0%OK 0 0 0 0 0TX 310 282 307 3 300 91% 99% 1% 97%UT 498 38 468 30 143 8% 94% 6% 29%WY 370 253 369 1 1 68% 100% 0%
Total 2,444 607 2,369 75 1,445 25% 97% 3% 59%

APPENDIX B
PRODUCTION PITS, TANK BATTERIES, TANKS
34
Table B.2. Estimated Number of Production Pits
State Dataa (Where Available)
State
EstimatedTotal Number
of PitsWorkover
PitsActive
PitsInactive
Pits
TotalNumber ofLined Pits Comments
AK 400 Assumes 1 pit per oil productionfacility
AL 2,000 Assumes 1 pit per oil and gasproduction facility
AR no pits reported
CA 8, 600 Assumes 1 pit per oil productionfacility
CO 9, 271 "unknown" 9, 271 "unknown" 588 1998 data from state
FL 20 Assumes 1 pit per oil productionfacility
IL 10,400 Assumes 1 pit per oil productionfacility
KS 14,700 Assumes 1 pit per oil productionfacility
LA 8,099 5,339"reserve"
1,795 "openprod."
965 "orphan
prod."402 1997/ 98 State data b
MI no pits reportedMS 48 48 48 1997/ 98 State data b
MT 3,000 Assumes 1 pit per oil and gasproduction facility
ND 1,100 Assume 1 pit per oil productionfacility
NE 500 Assume 1 pit per oil productionfacility
NM 5,800 Assume 1 pit per oil productionfacility
OH 0 1998 data from stateOK 93 1998 data from stateTX 4,830c "unknown" 4,830 "unknown" 2,490 1998 data from state
UT 1,200 Assume 1 pit per oil and gasproduction facility
WY 3,500 800 3,500 1997/ 98 State estimate b
Total d 55,690a Where data was available from a state agency, either estimates or reported data, these have been provided.b Source: Gruy memorandum, 1998.c This likely understates the total number of production pits in the state. In Texas, certain types of pits requirepermits, while some types of production pits do not require permits. This includes permitted pits only.d Assumes zero pits in the Appalachian states. No survey respondents from Appalachian states reported pits. Recent state data from Ohio (6/99) indicates that Ohio has no active production pits.

APPENDIX B
PRODUCTION PITS, TANK BATTERIES, TANKS
35
Table B.3. Oil Tank Batteries and Oil Tanks – Reported Data
State
Active OilWells
ReportedOil TankBatteries
OilTanks
Oil Tanksper TankBattery
WasteOil/
WaterTanks
ProducedWaterTanks
ProducedWater Tanks
per TankBattery
EmergencyTanks
TotalTanks perOil TankBattery
AK 355 11 9 1 6 7 1 11 3AL 140 24 135 6 3 49 2 0 8AR 5 5 10 2 0 7 1 0 3CA 6,570 152 308 2 73 101 1 70 4CO 437 67 101 2 3 44 1 4 2FL 50 1 2 2 0 2 2 0 4IL 291 14 29 2 2 26 2 3 4KS 497 174 343 2 5 112 1 9 3LA 330 79 190 2 8 74 1 28 4MI 6 1 2 2 0 1 1 0 3MS 125 41 183 4 2 66 2 0 6MT 425 41 129 3 3 22 1 11 4ND 8 8 20 3 0 8 1 0 4NE 3 3 7 2 0 1 0 0 3NM 16 10 19 2 0 3 0 0 2OK 72 52 113 2 15 16 0 9 3TX 5,599 1,647 3,475 2 508 1,209 1 926 4UT 486 264 416 2 6 346 1 18 3WY 1,064 114 351 3 7 136 1 0 4
Total(excluding
AppalachianStates)
16,479 2,708 5,842 2 641 2,230 1 1,089 4
AppalachianStates:
Active OilWells
Reported Oil Tanks
OilWells
per OilTank
ProducedWaterTanks
Oil Wellsper
ProducedWaterTank
WasteOil/
WaterTanks
EmergencyTanks
Total TanksReported
Total OilWells per
TankKY 340 15 23 3 113 0 0 18 19NY 125 11 11 4 31 0 0 15 8OH 8 17 0.5 9 1 0 0 26 0.3PA 8 0 0 0 0 0VA 1 2 0.5 0 0 0 0 2 1WV 230 41 6 13 18 0 0 54 4
Total -Appalachian
States712 86 8 29 24 0 0 115 6

APPENDIX B
PRODUCTION PITS, TANK BATTERIES, TANKS
36
Table B.4. Condensate Tank Batteries and Condensate Tanks – Reported Data
State
Active GasWells
Reported
CondensateTank
BatteriesCondensate
Tanks
CondensateTanks per
Battery
WasteOil/ Water
Tanks
ProducedWaterTanks
ProducedWater
Tanks perBattery
EmergencyTanks
Total Tanksper
CondensateTank Battery
AK 15 1 0 0 2 1 1 3 6AL 976 2 2 1 26 15 8 0 22AR 152 3 9 3 0 33 11 0 14CA 47 1 0 0 1 1 1 0 2CO 1,516 816 974 1 8 212 0 1 1FL 0 0 0 0 0 0 0 0 0IL 0 0 0 0 0 0 0 0 0KS 4,960 40 60 2 2 2,269 57 1 58LA 89 51 118 2 6 15 0 2 3MI 45 1 1 1 3 3 0 4MS 15 2 2 1 0 0 1MT 23 0 0 0 0 0 0 0 0ND 0 0 0 0 0NE 0 0 0 0 0NM 878 251 278 1 1 611 2 583 6OK 226 58 70 1 6 148 3 0 4TX 413 61 84 1 4 78 1 0 3UT 361 322 322 1 0 0 0 2 1WY 32 20 29 1 3 24 1 13 3
Total(excluding
AppalachianStates)
9,748 1,629 1,949 1 59 3,410 2 605 4
AppalachianStates:
Active GasWells
ReportedCondensate
Tanks
Gas Wellsper
CondensateTank
ProducedWaterTanks
Gas Wellsper
ProducedWaterTank
Waste WaterTanks
Emergency Tanks
Total TanksReported
Total ActiveGas Wells per
TankKY 4,127 1,038 4 1,776 2 15 0 2,829 1NY 108 0 0 113 1 1 0 114 1OH 333 351 1 116 3 0 0 467 1PA 1,124 19 59 981 1 51 4 1,055 1VA 908 39 23 443 2 11 0 493 2WV 1,062 32 33 353 3 395 0 780 1
Total -Appalachian
States7,662 1,479 5 3,782 2 473 4 5,738 1

APPENDIX B
PRODUCTION PITS, TANK BATTERIES, TANKS
37
Table B.5. Estimated Oil Tank Batteries and Total TanksAssociated With Oil Production Facilities
State1995 Active Oil
WellsEstimated Oil Tank
Batteries a
Estimated TotalTanks per Tank
Battery b
Estimated Total Tanks(Associated w/ Oil
Production Facilities)AK 2,086 417 3 1,251AL 913 302 8 2,416AR 7,834 2,611 3 7,833AZ 22 6 4 24CA 39,365 8,610 4 34,440CO 9,022 3,007 2 6,014FL 85 21 4 84IL 31,128 10,376 4 41,504IN 7,136 2,162 4 8,648KS 44,235 14,745 3 44,235LA 24,430 8,143 4 32,572MI 4,079 1,360 3 4,080MO 518 64 4 256MS 1,516 444 6 2,664MT 3,100 1,033 4 4,132ND 3,171 1,057 4 4,228NE 1,489 496 3 1,488NM 17,976 5,753 2 11,506NV 72 18 4 72OK 91,289 22,822 3 68,466OR 0 0 4 0SD 150 45 4 180TX 174,527 56,498 4 225,992UT 1,851 617 3 1,851WY 10,368 3,456 4 13,824
Estimated Total(excluding
AppalachianStates)
476,362 144,063 517,760
AppalachianStates:
1995 Active OilWells
Estimated Oil TankBatteries a
Estimated TotalTanks
(based on wells) cEstimated Total Tanks(based on facilities) d
KY 23,538 7,846 3,923 31,384NY 3,670 918 459 3,672OH 29,622 7,406 4,937 29,624PA 18,157 5,295 3,026 21,180TN 701 186 117 744VA 0 0 0 0WV 17,436 5,784 4,359 23,136
EstimatedAppalachian Total 93,124 27,435 16,821 109,740
Estimated NationalTotal 569,486 171,498 627,500
a Equals estimated number of oil production facilitiesb Based on reported data for statec Based on reported survey data for Appalachian States; average 6 oil wells per tankd Based on national estimate of 4 tanks per production facility or oil tank battery.

APPENDIX B
PRODUCTION PITS, TANK BATTERIES, TANKS
38
Table B.6. Estimated Condensate Tank Batteries and Total Tanks Associated with Gas Production Facilities
State 1995 Gas Wells
EstimatedNumber of Gas
ProductionFacilities a
EstimatedCondensate
Tank Batteries b
Estimated TotalTanks per Tank
Battery c
Estimated TotalTanks at GasProductionFacilities
AK 109 44 18 6 109AL 3,455 1,728 576 22 12,668AR 3,988 2,659 665 2d 1,329AZ 0 0 0 2 0CA 962 421 160 2 321CO 7,259 6,049 1,210 1 1,210FL 0 0 0 2 0IL 372 248 62 2 124IN 1,330 806 222 2 443KS 14,878 9,919 2,480 3d 7,439LA 14,169 9,446 2,362 3 7,085MI 4,621 3,081 770 4 3,081MO 0 0 0 2 0MS 518 304 86 1 86MT 3,000 2,000 500 2 1,000ND 94 63 16 2 31NE 78 52 13 2 26NM 28,231 18,069 4,705 6 28,231NV 0 0 0 2 0OK 29,337 14,669 4,890 4 19,558OR 18 3 3 2 6SD 49 29 8 2 16TX 49,639 33,999 8,273 3 24,820UT 1,142 571 190 1 190WY 3,649 2,433 608 3 1,825
Estimated Total(excluding
AppalachianStates)
166,898 106,593 27,816 109,598
AppalachianStates: 1995 Gas Wells
EstimatedNumber of Gas
ProductionFacilities a
EstimatedCondensate
Tank Batteries b
Estimated TotalTanks
(based onwells) e
Estimated TotalTanks
(based onfacilities) f
KY 13,311 8,874 2,219 10,239 8,874NY 6,016 3,008 1,003 4,628 4,011OH 34,501 11,500 5,750 26,539 23,001PA 31,025 18,094 5,171 23,865 20,683TN 485 258 81 373 323VA 1,610 805 268 1,238 1,073WV 36,144 23,978 6,024 27,803 24,096
EstimatedAppalachian
Total123,092 66,517 20,515 94,686 82,061
EstimatedNational Total 289,990 173,110 48,332 204,284 191,659
a From Appendix G b Based on 6 gas wells per tank battery (from reported data)c Based on reported data for state d When outliers in Kansas and Arkansas are removed (responses reportingunusually large number of produced water tanks), national estimate of tanks per condensate tank battery is 2 to 3tanks per battery. e Based on survey reported data; average 1.3 gas wells per tankf Based on estimated number of tank batteries and national estimate of 4 tanks per gas production facility/tankbattery.

APPENDIX B
PRODUCTION PITS, TANK BATTERIES, TANKS
39
Table B.7. Gas Plants, Non-Pressurized Tanks – Reported Data
Region# Plants inRegion a
ReportedNo.
ProducedWaterTanks
Reported No.Condensate
Tanks
ReportedNo. LiquidProductTanks
Reported No.Emergency
TanksAlaska 3 0 0 18 1California 25 0 0 0 0Eastern U.S. 47 3 14 41 4Mid-West 92 5 4 3 0New Mexico 27 3 10 15 4Rockies 104 9 10 27 6Southeast 68 13 13 13 1Texas 233 30 12 22 8Total 599 63 63 139 24a Based on 1996 Oil and Gas Journal survey.

APPENDIX C
PRODUCED WATER
40
Table C.1. Estimated Volume of Produced Water by State(1,000 barrels/year)
StateEstimated Volume of
Produced Water a NOTES
AK 1,090,000 Estimated from survey response & 1995production
AL 320,000 Estimated from survey response & 1995production for state
AR 110,000 Estimated from survey response & 1995production
AZ 100 Estimated from survey response & 1995production for state
CA 1,684,200 PI estimateCO 210,600 PI estimateFL 76,500 PI estimateIL 285,000 state estimateIN 48,900 Based on bbl PW/bbl oil ratio for ILKS 683,700 State estimateKY 3,000 Estimated from survey response
LA 1,346,400 State estimate adjusted for onshore/coastalproduction only
MI 52,900 PI estimateMO 100 Estimated from survey responseMS 234,700 PI estimateMT 103,300 State estimateND 79,800 State estimateNE 61,200 PINM 706,000 Estimated from survey responseNV 6,700 StateNY 300 Estimated from survey responseOH 7,900 State estimateOK 1,642,500 State estimateOR 40 State estimatePA 2,100 State estimateSD 4,000 State estimateTN 400 Estimated from survey responseTX 7,630,000 State estimateUT 124,600 PI estimateVA 300 Estimated from survey responseWV 6,000 Estimated from survey responseWY 1,401,000 PI estimate
Total 17,922,240a State data were used where available. PI estimate is from the Petroleum Information Corp.produced water database. If state or PI estimates for 1995 were not available, the producedwater volume for a state was estimated from 1995 production for the state using extrapolationfactors developed from the 1995 survey responses.

APPENDIX C
PRODUCED WATER
41
Table C.2. Produced Water Volumes Disposed by Method – Reported Data(Barrels/day and Percentages)
State
ReportedVolume
ProducedWater(b/d)
Inject forEOR(b/d)
% PWInject
for EOR
Injected forDisposal
Onsite (b/d)
% PWInjectOnsite
InjectedOffsite(b/d)
% PWInjectOffsite
Injected @CommercialFacility (b/d)
% PWInject @Comm.Facility
Treat andDischarge
(b/d)
% PWTreat andDischarge
Reuse(b/d)
% PWReuse
AK 797,037 787,500 99% 9,500 1% 37 <0.01%AL 151,897 206 0.1% 8,087 5% 1,710 1% 141,894a 93%AR 302 276 91% 1 0.3%CA 713,904 365,844 51% 179,573 25% 5,050 0.7%CO 322,505 269,525 84% 52,828 16% 11 <0.01% 141 0.04%FL 190,550 190,550 100%IL 79,650 79,650 100%KS 75,533 3,646 5% 64,302 85% 7,356 10% 225 0.3%KY 518 34 7% 465 90% 19 4%LA 131,645 131,645 100%MI 1,838 1,708 93% 130 7%MS 74,045 74,045 100%MT 137,616 119,735 87% 2,302 2% 555 0.4% 22 0.02% 15,000 11%ND 29 29 100%NE 524 44 8%NM 7,086 5,405 76% 507 7% 1,175 17%NY 213 210 99%OH 107 96 90% 11 10%OK 6,575 4,706 72% 997 15% 10 0.2% 862 13%PA 198 61 31% 86 43%TX 1,226,786 831,820 68% 276,872 23% 97,652 8% 17,478 1% 2,964 0.2%UT 113,214 65,000 57% 36,368 32% 7,533 7% 4,313 4%VA 568 550 97% 18 3%WV 736 661 90% 6 1% 10 1% 59 8%WY 775,879 689,206 89% 6,600 1% 21 <.01% 80,000 10%
SurveyTotal 4,808,955 3,408,083 71% 851,108 18% 121,133 2.5% 24,386 0.5% 142,227 3% 97,964 2%
a In Alabama, surface discharge of produced water is allowed under NPDES permits for coalbed methane operations.

APPENDIX D
ASSOCIATED WASTES
42
Table D.1. Associated Waste Volume by State – Reported Data(Barrels per year)
State
ReportedVolume
CompletionFluids
ReportedVolume
StimulationFluids
ReportedVolume TankBottoms/ Oily
Sludge
ReportedVolume
Dehydration/Sweetening
Wastes
Total ReportedVolume
AssociatedWaste
AK 0 110 15,051 16 15,177AL 0 5,600 1,955 0 7,555AR 0 0 0 0 0CA 262,300 155,020 39,600 1,042 457,962CO 156,071 177,157 6,800 0 340,028FL 0 595 1,051 0 1,646IL 3,650 8,600 460 0 12,710KS 66,670 26,620 1,430 1,600 96,320KY 2,250 850 70 0 3,170LA 3,242 55,700 258 18 59,218MI 0 200 0 80 280MS 0 0 4,600 0 4,600MT 37,000 9,635 2,300 0 48,935ND 0 0 100 0 100NE 0 0 0 0 0NM 11,800 17,000 0 238 29,038NY 500 250 10 2 762OH 1,200 2,000 0 0 3,200OK 3,900 20,000 825 270 24,995PA 14,000 3,200 0 0 17,200TX 19,580 19,375 29,699 20 68,674UT 0 32,895 888 0 33,783VA 5,050 530 0 10 5,590WV 20,800 13,262 2,670 0 36,732WY 700 26,000 6,700 0 33,400
Survey Total 608,713 574,599 114,467 3,296 1,301,075

APPENDIX D
ASSOCIATED WASTES
43
Table D.2. Estimated Volume of Associated Wastes by State(Barrels/Year)
State Completion
Fluids a
Workover/Stimulation
Fluids b Tank Bottoms/Oily Sludges c
Dehydration/ GasSweetening
Wastes d
Total EstimatedAssociated
WastesAK 72,800 18,500 217,800 5,130 314,230AL 77,600 22,300 25,200 5,670 130,770AR 94,800 201,000 9,900 2,040 307,740AZ 2,300 700 100 10 3,110CA 431,300 945,600 220,300 29,290 1,626,490CO 382,800 305,000 35,900 5,710 729,410FL 400 1,000 400 10 1,810IL 57,900 931,000 15,800 320 1,005,020IN 16,900 144,200 14,300 2,070 177,470KS 939,200 366,600 207,300 7,880 1,520,980KY 65,000 24,600 19,400 1,840 110,840LA 571,400 656,200 217,300 9,080 1,453,980MI 385,000 143,600 12,600 8,560 549,760MO 0 9,100 3,600 30 12,730MS 68,400 34,900 10,800 1,040 115,140MT 95,700 135,800 9,500 550 241,550ND 66,200 75,200 12,600 540 154,540NE 20,700 26,800 1,500 80 49,080NM 494,600 788,900 80,900 2,150 1,366,550NV 8,700 1,700 400 20 10,820NY 1,200 10,500 2,000 490 14,190OH 295,900 375,400 12,800 3,200 687,300OK 1,427,300 968,200 121,000 19,780 2,536,280OR 0 300 0 10 310PA 443,300 308,600 10,000 4,990 766,890SD 3,100 3,500 1,000 90 7,690TN 17,600 2,800 200 40 20,640TX 2,152,900 1,882,200 619,900 69,110 4,724,110UT 101,400 115,700 10,400 2,630 230,130VA 9,400 1,500 200 540 11,640WV 195,300 539,800 10,500 2,630 748,230WY 279,200 485,500 83,100 7,360 855,160
Total 8,778,300 9,526,700 1,986,700 192,890 20,484,590a Extrapolated on number of completed wellsb Extrapolated on number of active oil and gas wellsc Extrapolated on oil and gas productiond Extrapolated on gas production.

APPENDIX D
ASSOCIATED WASTES
44
Table D.3. Volume of Completion Fluids and Workover/Stimulation Fluidsby Disposal Method – Reported Data
Associated WasteDisposal Method
%Completion
Fluids
Volume-Completion
Fluids(Bbls./Year)
% Workover/Stimulation
Fluids
Volume –Workover/
StimulationFluids
(Bbls./Year)Disposal by injection 21.3% 129,605 59.1% 339,714Landspread within field 6.0% 36,275 1.9% 11,130Landspread outside field 0% 0 0% 0Roadspread w/in field 0% 0 < 0.1% 100Roadspread outside field 0.4% 2,500 0.3% 1,500Commercial E&P waste facility 28.8% 175,142 3.9% 22,380Industrial or municipal landfill 0% 0 0% 0Crude oil reclamation 0.1% 500 0% 45Recycling/beneficial reuse 32.9% 200,450 < 0.1% 3Incinerate 0% 0 1.0% 5,503Evaporate from pits or tanks 8.0% 48,441 16.3% 93,833Other: 2.6% 15,800a 17.5% 100,392b
Total (Bbls./Yr.) 100% 608,713 100.0% 574,599a Land treatment disposal site within fieldb Land treatment and onsite burial

APPENDIX D
ASSOCIATED WASTES
45
Table D.4. Volume of Tank Bottoms/Oily Sludge and Dehydration/Sweetening Wastesby Disposal Method – Reported Data
Associated Waste DisposalMethod
% TankBottoms/
Oily Sludge
Volume-Tank
Bottoms/Oily Sludge(Bbls./Year)
%Dehydration/Sweetening
Wastes
Volume –Dehydration/Sweetening
Wastes(Bbls./Year)
Disposal by injection 23.9% 27,311 4.2% 140Landspread within field 9.0% 10,256 8.2% 270Landspread outside field 7.5% 8,621 0% 0Roadspread within field 17.4% 19,885 0% 0Roadspread outside field 0.3% 400 48.5% 1,600a
Commercial E&P waste facility 2.0% 2,327 31.7% 1,045Industrial or municipal landfill < 0.1% 3 0% 0Crude oil reclamation 18.3% 20,973 0% 0Recycling/beneficial reuse 19.0% 21,738 6.8% 223Incinerate <0.1% 44 0.1% 2Evaporate from pits or tanks 0.2% 200 0% 0Other: 2.4% 2,709b 0.5% 16c
Total (Bbls./Yr.) 100.0% 114,467 100.0% 3,296a Volume is reported by a single respondent. If this volume is excluded from total, 62.5% ofdehydration wastes are disposed at commercial disposal facility.b Respondents noted this as oil containment berms and working pits.c Respondent noted this as commercial disposal.

APPENDIX D
ASSOCIATED WASTES
46
Table D.5. Total Associated Waste; Percentage Waste Disposed by Method – Reported Data
State
%Disposal
byInjection
% LandSpreadwithinField
% LandSpreadoutsideof Field
% RoadSpreadwithinField
% RoadSpreadoutsideof Field
%Comm.
E&PWaste
Disposal% to
Landfill
%Crude
OilReclaim.
%Recycle/
BeneficialUse Incinerated
AK 98.8% 1.1%AL 76.7% 13% 0.1% 10.0%AR No waste volumes reportedCA 1.5% 3% 1.0% 2% 0.2% 0.7% 48.3%CO 52.0% 2% 46.0% 0.2%FLIL 99.2% 1%KS 77.8% 6% 1.6% 1.5%KY 15.8% 82% 1.3% 1%LA 12.0% 32.3%MI 100.0%MS 97.8% 2.0%MT 87.8% 0.2% 0.6%ND 100.0%NENM 55.1% 8.0%NY 13.1% 3% 13% 0.4% 6.6% 59.6%OH 100.0%OK 89.6% 1% 1% 1% 6.1% 0.8%PA 18.6% 81.4%TX 63.7% 3.0% 12% 5.7% 14.2% 0.1%UT 96.9% 2.5%VA 100% 0.2%WV 16.1% 84%WY 78.8% 6.0% 10% 0.6% 4.5%
SurveyTotal 38.2% 4% 0.7% 2% 0.5% 15.4% < 0.10% 1.7% 17.1%

APPENDIX D
ASSOCIATED WASTES
47
Table D.6. Total Associated Waste; Volume of Waste Disposed by Method – Reported Data(Barrels per Year)
StateDisposed
by Injection
LandSpreadwithinField
LandSpreadoutsideof Field
RoadSpreadwithinField
RoadSpread
outside ofField
Comm. E&PWaste
Disposal
Landfill
CrudeOil
Reclaim.
Recycle/Beneficial
Use IncineratedAK 15,000 161AL 5,796 1,000 4 755AR No waste volumes reportedCA 7,060 12,400 4,500 7,300 800 3,000 221,000 2CO 176,908 6,000 156,320 770 30FL 42IL 12,610 100KS 74,899 5,600 1,500 1,430KY 500 2,600 42 28LA 7,100 19,105 13 5,500MI 280MS 10 4,500 90MT 42,985 100 300ND 100NENM 16,000 2,330 8 0NY 100 25 100 0 3 50 454 5OH 3,200OK 22,400 270 300 300 1,525 200PA 3,200 14,000TX 43,730 246 2,079 8,057 0 3,910 0 9,764 63UT 32,750 833VA 5,580 10WV 5,932 30,800WY 26,320 2,000 3,200 200 1,500
SurveyTotal 496,770 57,931 8,621 19,985 6,000 200,894 3 21,518 222,413 5,549

APPENDIX E
DRILLING WASTES
48
Table E.1. Percentage of New Wells Drilled by Technique - Reported Data
State
No. Of New Wells
% With Mud Reserve Pits
% With ClosedSystem
% With Air,Gas, or
PneumaticDrilling
% WithCableTool
% Of MudReserve
Pits -Lined
Number ofResponses
AK 11 100% 1CA 349 79% 21% 0% 8CO 9 78% 22% 0% 2IL 25 96% 4% 0% 2KS 306 39% 61% 17% 6LA 21 100% 71% 4MI 7 100% 100% 1MT 7 100% 86% 2NM 11 27% 73% 100% 3OK 14 64% 36% 22% 2TX 349 99% 1% 87% 8UT 9 22% 56% 22% 100% 3WY 2 100% 100% 1
Survey Total 1,120 74% 25% 1% < 0.1% 69% 43Appalachian
States:KY 22 5% 95% 0% 3NY 14 100% Not reptd. 1OH 3 38% 62% 33% 3PA 26 100% Not reptd. 2VA 16 100% Not reptd. 2WV 38 3% 97% 100% 4
AppalachianTotal 124 4% 0% 96% 0% 15
NationwideTotal 1,244 66% 23% 11% < 0.1% 69% 58

APPENDIX E
DRILLING WASTES
49
Table E.2. Percentage of Drilling Wastes by Base Drilling Fluid – Reported Data
Percentage of Wastes by Base FluidState Freshwater Saltwater Oil Synthetic
No. OfResponses
AK 70% 30% 1CA 98% 1.5% 0.5% 8CO 100% 2IL 100% 2KS 99% 1% 6LA 93% 7% 4MI 100% 1MT 14% 86% 2NM 82% 16% 2% 3OK 63% 37% 2TX 93% 7% 8UT 100% 3WY 100% 1
AppalachianStates:
KY Air drill onlyNY Air drill onlyOH 67% 33% 3PA Air drill onlyVA Air drill onlyWV 83% 17% 1

APPENDIX E
DRILLING WASTES
50
Table E.3. Estimated Percentage of Drilling Wastes by Base Drilling Fluid
Percentage of Wastes by Base Fluid
State
EstimatedVolume Drilling
WastesReported by
Respondents a
(barrels) Freshwater Saltwater Oil SyntheticNo. of
ResponsesAK 111,000 70% 30% 1CA 506,000 98% 1.5% 0.5% 8CO 63,000 100% 2IL 28,000 100% 2KS 922,000 99% 1% 6LA 342,000 93% 7% 4MI 13,000 100% 1MT 89,000 14% 86% 2NM 21,000 82% 16% 2% 3OK 95,000 63% 37% 2TX 2,812,000 93% 7% 8UT 131,000 100% 3WY 30,000 100% 1
EstimatedSurveyTotal
5,163,000 92.5% 5.5% 1.3% < 0.6% 43
a Estimated volume of drilling waste for rotary drilling w/ open mud system. Air/pneumatic drillingis excluded. Estimate is based on reported footage drilled multiplied by appropriate factors fordrilling waste volume per foot by depth category. This is not, and should not be interpreted as, atotal volume of drilling waste (see Table 3.9). This is based on the respondents only and wasused solely to calculate national average distribution of drilling wastes by base fluid.

APPENDIX E
DRILLING WASTES
51
Table E.4. Appalachian States, Volumes of Drilling Wastes – Reported Data
State
FootageDrilled –
Rotary w/ mud
FootageDrilled –
AirDrilling
Volume ofDrilling
Wastes toMud
ReservePits
Volume ofDrilling
Wastes –Air/Pneum.
Drilling
DrillingWastes to
Reserve Pit:Approx.
Volume perFoot Drilled
(bblwaste/ft)
Air DrillingWastes:Approx.
Volume perFoot Drilled
(bblwaste/ft.)
TotalNumber ofResponses
KY 0 80,000 0 2,000 N/A 0.025 1OH 11,890 32,760 1,900 2,800 0.16 0.085 3PA 0 55,800 0 2,900 N/A 0.052 1WV 1,740 232,920 800 20,300 0.46 0.087 3
TOTAL 13,630 401,480 2,700 28,000 0.20 0.070 8
Table E.5. Alternative Estimation of Total Drilling Waste for Appalachian States and Other Stateswith Significant Air Drilling
State
1995 TotalFootage
Drilled forState a (ft)
Estimated1995
FootageDrilled w/Mud b (ft)
Estimated1995
FootageDrilled w/Air b (ft)
Estimated1995 Volume
of DrillingWastes -
Rotary Drill w/Mud c (bbls)
Estimated1995 Volume
of DrillingWastes – AirDrill d (bbls)
TotalAlternativeEstimatedVolume of
Drilling Wastesfor State (bbls)
NM 5,752,500 1,553,175 4,199,325 2,003,596 293,953 2,297,549OK 11,857,800 7,588,992 4,268,808 8,423,781 298,817 8,722,598UT 929,400 724,932 204,468 1,217,886 14,313 1,232,199
AppalachianStates:
KY 1,465,100 73,255 1,391,845 104,755 97,429 202,184NY 108,000 4,320 103,680 5,530 7,258 12,788OH 3,073,700 1,168,006 1,905,694 654,083 161,984 816,067PA 2,357,100 94,284 2,262,816 97,113 158,397 255,510TN 93,000 3,720 89,280 8,891 6,250 15,141VA 139,900 0 139,900 0 9,793 9,793WV 1,585,000 47,550 1,537,450 25,677 133,758 159,435
AppalachianTotal: 8,821,800 1,391,135 7,430,665 896,049 574,869 1,470,918
a From Table 3.9, “Estimated Total Volume of Drilling Wastes”b From Table E.1, “Percentage of New Wells Drilled by Technique.” (Total for all the Appalachian States is appliedto PA, NY, TN)c (Column 3) x (waste extrapolation factor, bbl waste per foot drilled, from API 1985 Production Waste Survey)d (Column 4) x (estimated extrapolation factor for air drilling, 0.07 bbl waste per foot drilled, from Table E.4)

APPENDIX E
DRILLING WASTES
52
Table E.6. Liquid Drilling Waste Disposal- Reported Data (as % of Total Drilling Wastes)
Percentage of Total Drilling Waste Disposed by Method
State InjectionDown
AnnulusTreat &
DischargeRoad
Spread
EvaporateOn orOffsite
LandSpreadOnsite
LandSpreadOffsite
Reusefor
Drilling Other ResponseAK 50% 1AR 70% 1CA 19% 44% <0.1% 1.2% 14%a 8CO 36% 52% 2IL 83% 2KS 1% 19% 37% 6LA 7% 45% 1% 10% 0.5% 4MI 80% 1MT 51% 10% 2NM 4% 78% 3% 3OK 1% 49% 2TX 1% 0.1% 82% 0.9% 2% 8UT 39% 5% 3WY 50% 1
Appalachian States:KY 64% 6% 3NY No liquid wastes reported; air drilling only 1OH 74% 3PA 7% 32%b 2VA 56% 4% 2WV 22% 13% 4
a liquids and solids remediated onsiteb commercial disposal facility

APPENDIX E
DRILLING WASTES
53
Table E.7. Solid Drilling Waste Disposal- Reported Data (As % of Total Drilling Wastes)
Percentage of Total Drilling Waste Disposed by Method
StateBuriedOnsite
LandSpreadOnsite
LandSpreadOffsite
CommercialDisposalFacility
Industrial orMunicipalLandfill
Reuseor
Recycle Other ResponseAK 50%a 1AR 30% 1CA 21% 0.3% 0.1% 0.2% 0.1% 8CO 3% 9% 2IL 1% 16% 2KS 42% 6LA 20% 4% 13% 4MI 20% 1MT 39% 2NM 13% 3% 3OK 50% 2TX 13% 0.3% 0.1% 0.6% 0.1%b 8UT 56% 3WY 50% 1
Appalachian States:KY 28% 2% 3NY 100% 1OH 26% 3PA 2% 59% 2VA 40% 2WV 66% 4
a grind and inject in Class II wellb pit

APPENDIX E
DRILLING WASTES
54
Table E.8. Estimated Volume of Liquid Drilling Wastes Disposed by Method;Estimated for States with Reported Data (Barrels)
State
Est. TotalVolumeDrilling
Wastes forState Injection
InjectedDown
AnnulusTreat &
DischargeRoad
Spread
EvaporateOn orOffsite
LandSpreadOnsite
LandSpreadOffsite
Reuse forDrilling Other
AK 1,605,000 803,000AR 2,643,000 1,850,000CA 1,826,000 347,000 804,000 1,000 22,000 256,000CO 3,582,000 1,290,000 1,863,000IL 382,000 317,000KS 4,810,000 48,000 914,000 1,780,000LA 22,477,000 1,573,000 10,115,000 225,000 2,245,000 112,000MI 1,731,000 1,385,000MT 1,366,000 697,000 137,000NM 7,421,000 297,000 5,788,000 223,000OK 13,162,000 132,000 6,449,000TX 65,367,000 654,000 65,000 53,601,000 588,000 1,307,000UT 1,561,000 609,000 78,000WY 4,374,000 2,187,000
Total Volume(excludes
AppalachianStates):
132,307,000 7,529,000 10,115,000 0 65,000 65,666,000 4,657,000 589,000 9,885,000 256,000
Appalachian States:KY 2,095,000 1,341,000 126,000NY 138,000OH 1,721,000 1,274,000PA 2,428,000 170,000 777,000VA 57,000 32,000 2,000WV 856,000 188,000 111,000
Total Volume(AppalachianStates Only):
7,295,000 1,444,000 0 1,529,000 0 0 269,000 2,000 0 777,000
National Est.Total
Volume a:139,602,000 8,973,000 10,115,000 1,529,000 65,000 65,666,000 4,926,000 591,000 9,885,000 1,033,000
NationalTotal, % byDisposalMethod
Liquid Wastes= 73.6% 6% 7% 1% 0.05% 47% 3.5% 0.4% 7% 0.7%
a Table only includes states with reported data. Therefore, the estimated total volume of drilling waste is less than the 148.7million barrels discussed in the text. The estimated total volume reported in the text, 148.7 million barrels, includes drilling wastevolumes estimated for states for which no responses to drilling related questions were received on the 1995 survey.

APPENDIX E
DRILLING WASTES
55
Table E.9. Estimated Volume of Solid Drilling Wastes Disposed by Method;Estimated for States with Reported Data (Barrels)
State
EstimatedTotal
VolumeDrilling
Wastes forState a
BuriedOnsite
LandSpreadOnsite
LandSpreadOffsite
CommercialDisposalFacility
Industrial orMunicipalLandfill
Reuse orRecycle Other
AK 1,605,000 803,000AR 2,643,000 793,000CA 1,826,000 383,000 5,000 2,000 4,000 2,000CO 3,582,000 107,000 322,000IL 382,000 4,000 61,000KS 4,810,000 2,020,000LA 22,477,000 4,495,000 899,000 2,922,000MI 1,731,000 346,000MT 1,366,000 533,000NM 7,421,000 965,000 223,000OK 13,162,000 6,581,000TX 65,367,000 8,533,000 197,000 65,000 394,000 65,000UT 1,561,000 874,000WY 4,374,000 2,187,000
TotalVolume
(excludesAppalachian
States):
132,307,000 28,060,000 1,492,000 389,000 2,926,000 2,000 394,000 868,000
Appalachian StatesKY 2,095,000 587,000 42,000NY 138,000 138,000OH 1,721,000 448,000PA 2,428,000 49,000 1,432,000VA 57,000 23,000WV 856,000 565,000
TotalVolume
(AppalachianStates Only):
7,295,000 1,672,000 1,612,000
National Est.Total
Volume a:139,602,000 29,732,000 3,104,000 389,000 2,926,000 2,000 394,000 868,000
NationalTotal, % byDisposalMethod
SolidWastes =26.4 %
21% 2.2% 0.3% 2% 0.001% 0.3% 0.6%
a Table only includes states with reported data. Therefore, the estimated total volume of drilling waste is less than the 148.7million barrels discussed in the text. The estimated total volume reported in the text, 148.7 million barrels, includes drillingwaste volumes estimated for states for which no responses to drilling related questions were received on the 1995 survey.
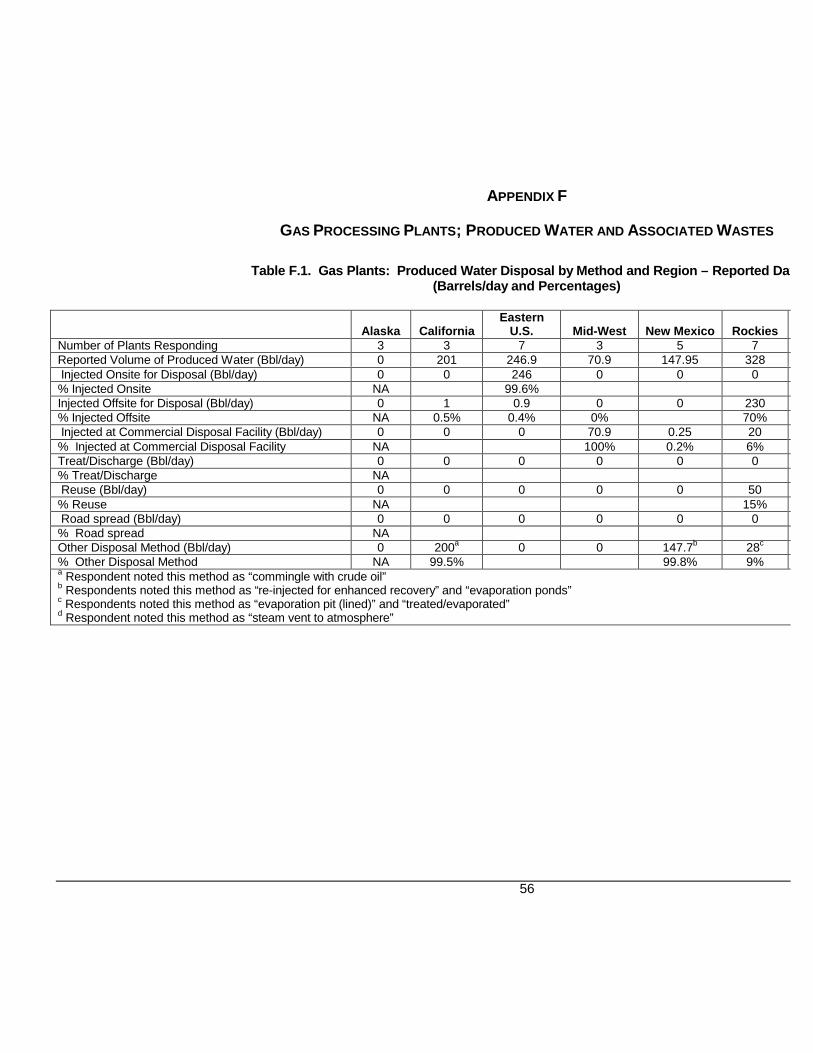
APPENDIX F
GAS PROCESSING PLANTS; PRODUCED WATER AND ASSOCIATED WASTES
56
Table F.1. Gas Plants: Produced Water Disposal by Method and Region – Reported Data(Barrels/day and Percentages)
Alaska CaliforniaEastern
U.S. Mid-West New Mexico RockiesNumber of Plants Responding 3 3 7 3 5 7Reported Volume of Produced Water (Bbl/day) 0 201 246.9 70.9 147.95 328 Injected Onsite for Disposal (Bbl/day) 0 0 246 0 0 0% Injected Onsite NA 99.6%Injected Offsite for Disposal (Bbl/day) 0 1 0.9 0 0 230% Injected Offsite NA 0.5% 0.4% 0% 70% Injected at Commercial Disposal Facility (Bbl/day) 0 0 0 70.9 0.25 20% Injected at Commercial Disposal Facility NA 100% 0.2% 6%Treat/Discharge (Bbl/day) 0 0 0 0 0 0% Treat/Discharge NA Reuse (Bbl/day) 0 0 0 0 0 50% Reuse NA 15% Road spread (Bbl/day) 0 0 0 0 0 0% Road spread NAOther Disposal Method (Bbl/day) 0 200a 0 0 147.7b 28c
% Other Disposal Method NA 99.5% 99.8% 9%a Respondent noted this method as “commingle with crude oil”b Respondents noted this method as “re-injected for enhanced recovery” and “evaporation ponds”c Respondents noted this method as “evaporation pit (lined)” and “treated/evaporated”d Respondent noted this method as “steam vent to atmosphere”

APPENDIX F
GAS PROCESSING PLANTS; PRODUCED WATER AND ASSOCIATED WASTES
57
Table F.2. Gas Plants: Disposal of Glycol Wastes by Method and Region – Reported Data
Alaska CaliforniaEastern
U.S. Mid-WestNew
Mexico Rockies SoutheastSpent Glycol/ Glycol Compounds (Bbls/yr) 0 20 108 0 0 437Volume Disposed by Method (Barrels/yr): Dispose by Injection 0 0 28 0 0 61.64 Land spread Onsite 0 0 0 0 0 0 Road spread Onsite 0 0 0 0 0 0 E&P Waste Facility 0 0 5 0 0 0 Industry or Municipal Landfill 0 0 0 0 0 0 Recycle or Reuse 0 0 39 0 0 375 Incinerate 0 0 36 0 0 Evaporate from pits 0 0 0 0 0 0.36 Other method 0 20a 0 0 0 0Percentage Disposed by Method:% Injection 26% 0% 14%% Land Spread Onsite% by Road Spread Onsite% Commercial Disposal Facility 5%% Landfill% Recycle/ Reuse 36% 86%% Incinerate 33%% Evaporate from Pits 0.08%% Other 100%a Respondent listed method as “commercial disposal contractor”b Respondent listed method as “mix with crude oil being sold”

APPENDIX F
GAS PROCESSING PLANTS; PRODUCED WATER AND ASSOCIATED WASTES
58
Table F.3. Gas Plants: Disposal of Used Filters/Filter Media by Method and Region – Reported Data
Alaska CaliforniaEastern
U.S. Mid-WestNew
Mexico Rockies SoutheastSpent Used Filters/Filter Media (Bbls/yr) 0.04 24.96 0.35 0.25 25.66 259.65Volume Disposed by Method (Barrels/yr): Dispose by Injection 0 0 0 0 0 0 Land spread Onsite 0 0 0 0 0 0 Road spread Onsite 0 0 0 0 0 0 E&P Waste Facility 0 0.19 0 0.10 0.14 7.62 Industry or Municipal Landfill 0 0.00 0.35 0.15 25.53 252.03 Recycle or Reuse Incinerate 0.04 Evaporate from pits 0 0 0 0 0 0 Other method 0 24.77a 0 0 0 0Percentage Disposed by Method:% Injection% Land Spread Onsite% by Road Spread Onsite% Commercial Disposal Facility 1% 38% 1% 3%% Landfill 100% 61% 99% 97%% Recycle/ Reuse 0% 0%% Incinerate 100%% Evaporate from Pits% Other 99%a Respondent listed method as “commercial disposal contractor”b Respondents listed method as “waste to energy plant” and “burial with permit.”

APPENDIX F
GAS PROCESSING PLANTS; PRODUCED WATER AND ASSOCIATED WASTES
59
Table F.4. Gas Plants: Disposal of Scrubber Liquids/Sludge by Method and Region – Reported Data
Alaska CaliforniaEastern
U.S. Mid-WestNew
Mexico Rockies SoutheastScrubber Liquids and Sludge (Bbls/yr) 0 200 57 0 20 40Volume Disposed by Method (Barrels/yr): Dispose by Injection 0 0 7 0 0 0 Landspread Onsite 0 0 0 0 0 0 Roadspread Onsite 0 0 0 0 0 0 E&P Waste Facility 0 0 50 0 20 40 Industry or Municipal Landfill 0 0 0 0 0 0 Recycle or Reuse 0 0 0 0 0 0 Incinerate 0 0 0 0 0 0 Evaporate from pits 0 0 0 0 0 0 Other method 0 200a 0 0 0 0Percentage Disposed by Method:% Injection 12%% Land Spread Onsite% by Road Spread Onsite% Commercial Disposal Facility 88% 100% 100%% Landfill% Recycle/ Reuse% Incinerate% Evaporate from Pits% Other 100%a Respondent listed method as “commercial disposal contractor”

APPENDIX F
GAS PROCESSING PLANTS; PRODUCED WATER AND ASSOCIATED WASTES
60
Table F.5. Gas Plants: Disposal of Other Dehydration/Sweetening Wastes by Method and Region – Reported Data
Alaska CaliforniaEastern
U.S. Mid-WestNew
Mexico Rockies SoutheastOther Dehydration/Sweetening Wastes (Bbls/yr) 0 0 0 195 1,117 1,203Volume Disposed by Method (Barrels/yr): Dispose by Injection 0 0 0 0 0 0 Land spread Onsite 0 0 0 0 207 0 Road spread Onsite 0 0 0 0 0 0 E&P Waste Facility 0 0 0 0 25 58 Industry or Municipal Landfill 0 0 0 195 841 50 Recycle or Reuse 0 0 0 0 0 0 Incinerate 0 0 0 0 44 0 Evaporate from pits 0 0 0 0 0 1095 Other method 0 0 0 0 0 0Percentage Disposed by Method:% Injection% Land Spread Onsite 19%% by Road Spread Onsite% Commercial Disposal Facility 2% 5%% Landfill 100% 75% 4%% Recycle/ Reuse% Incinerate 4%% Evaporate from Pits 91%% Othera Respondent listed method as “onsite burial with permit of mole sieve, charcoal”

APPENDIX F
GAS PROCESSING PLANTS; PRODUCED WATER AND ASSOCIATED WASTES
61
Table F.6. Gas Processing Plant Wastes – Reported Data
Region
ReportedGas
Throughput(MMcfd)
Spent Glycol/Glycol
Compounds(bbls./yr.)
Used Filters/Filter Media(bbls./yr.)
ScrubberLiquids &
Sludge(bbls./yr.)
All OtherDehydration/Sweetening
Wastes(bbls./yr.)
Total ReportedVolume of GasPlant Wastes
(bbls./yr.)Alaska 7,938 0 0.04 0 0 0.04California 298.38 20 24.96 200 0 244.96Eastern U.S. 992.4 108 0.35 57 0 165.35Mid-West 108 0 0.25 0 195 195.25New Mexico 1,109 0 25.66 20 1,117 1,162.66Rockies 2,699 437 259.65 40 1,203 1,939.65Southeast 6,159 102 69.82 31,775 4,442 36,388.82Texas 2,689.8 3 192.35 3,150 957 4,302.35Total 21,994 670 573.08 35,242 7,914 44,399.08
Table F.7. Gas Processing Plants; Reported Volume ofWastes Disposed by Method
Waste Disposal Method
Percentage of GasPlant Wastes
Disposed by Method
Reported Volume ofWastes Disposed byMethod (barrels/day)
Disposal by Injection 76 % 33,717Commercial E&P WasteDisposal Facility 9 % 4,102
Land Spread Onsite 6% 2,854Industrial or Municipal Landfill 4 % 1,606Evaporate from Pits 2.5 % 1,095Recycle or Reuse 1 % 587Incinerate 0.3 % 113Road Spread Onsite 0.01 % 5Other 1 % 320Total 100 % 44,399“Other” methods include: co-mingle w/ oil product, waste disposal contractor,onsite burial w/ permit, incineration in “waste-to energy” plant
APPENDIX G
SURVEY METHODOLOGY
62
G.1. Survey Forms
Two forms were developed for API’s 1995 survey: API Survey of Onshore and Coastal Exploration andProduction Operations for 1995 and API Survey of Natural Gas Processing Plants for 1995. The onshoreoperations survey form is included in Appendix H and the gas processing plant survey form is included inAppendix I. The survey form was originally intended to collect data only on waste volumes and wastemanagement practices. However, following a beta test of the survey forms but prior to distribution of the survey,a need arose to collect data on equipment that produces air emissions at E&P sites. This resulted in theaddition of several pages of questions to the survey form. Although this data collection effort was needed, itincreased the length and complexity of the survey form and may have reduced the rate of response to thesurvey. Although the survey forms were beta tested, in analyzing the results it was apparent that the wording ofsome questions was unclear to the respondents. API and its contractor made follow-up phone calls to surveyrespondents to clarify responses as needed.
A separate version of the onshore E&P operations survey was developed for operators in theAppalachian states. The Appalachian version of the 1995 survey form did not collect data on tankbatteries/central facilities (question 10). The Appalachian version of the 1995 survey form also askedrespondents to specify volumes of drilling waste generated because this data was not collected for theAppalachian states in API’s 1985 survey. The 1995 survey form developed for states outside the Appalachianregion did not ask operators to report drilling waste volumes. This data was collected in the 1985 survey andthe relationship between footage drilled (by depth category) and drilling waste volume was not believed to havechanged substantially between 1985 and 1995.
G.2. Design of Survey Sample
The survey was conducted using a representative statistical sample of industry operations. Two surveysamples were designed for the 1995 Onshore and Coastal E&P Operations Survey. The first sample wasdesigned to characterize E&P industry facilities and wastes for the entire U.S. excluding the Appalachianstates. The second sample was designed to characterize the Appalachian states, Kentucky, New York, Ohio,Pennsylvania, Tennessee, Virginia, and West Virginia. It was necessary to separate out Appalachia becausethe population frame used to draw the samples did not contain data for those states. The following sectiondescribes the survey sample design for both the E&P operations survey and the gas processing plant survey.
G.2.1. 1995 E&P Operations Survey excluding Appalachia
The survey questionnaire was designed to focus on all the facilities operated by an E&P companywithin a single field. A selected E&P company was only asked to complete one survey form per selected field.The participating companies were selected as follows.
The United States can be divided into 50 geological basins. Because geological basins cross stateboundaries, a single state can contain parts of several basins. This results in 71 unique onshore basin/statecombinations. If the Appalachian states are excluded, the number of basin/state combinations with oil or naturalgas production is 59. The E&P companies operating in each of the 59 basin/state combination were classifiedas either large or small companies. If a publicly traded company’s 1994 combined oil and gas productionexceeded 20 million barrels of oil equivalent (BOE), the company was designated as ‘large’. This methodyielded a group of thirty-one large companies, with the remaining companies considered ‘small’. Stratificationby company size ensured that a cross-section of the types and sizes of oil and gas operators were included inthe sample. The fifty-nine basin/state combinations were grouped into, high, medium, or low producing areas,based on the 1994 production of oil and gas. The production range of these three categories is shown in TableG.1 below. The total 1994 production in the basin/state combinations is summarized in Table G.5.

APPENDIX G
SURVEY METHODOLOGY
63
Table G.1. Operations Survey Sample Design - Basin/State Categories
Basin/StateCategories
1994 Production
(barrels of oil equivalent)
Number ofBasin/State
Combinations inCategory
High Producing >100 Million BOE 12
Medium Producing 10 Million – 100 Million BOE 28
Low Producing <10 Million BOE 19
Participating companies were selected for the survey sample from databases maintained by PetroleumInformation (PI) Corporation using the selection method termed “probability proportional to size withreplacement”. For a given basin/state/company size combination, a company’s probability of being included inthe sample was proportional to its 1994 production in that basin/state combination. For example, if company Ahad twice as much production as company B, company A was twice as likely to be selected as company B. Foreach selected company in a basin/state location, one of the company’s fields was selected with probabilityproportional to the production from that field. The selected company was then asked to respond withinformation for all its leases in that field. Previous beta test experience indicated that small operating companieswere less likely to respond to the survey questionnaire. To account for possible non-response by smallcompanies, the sample size for these companies was increased by a factor of two. Under this samplingmethodology, a company could receive survey forms for a field in more than one basin/state, but only one fieldin each basin/state. The final composition of the sample in each basin/state category is shown in Table G.2below.
Table G.2. Operations Survey Sample Design - No. Of Large and Small Companies in Sample byBasin/State Category
Basin/StateCategories
Large Companiesin Sample
Small Companiesin Sample
Number ofBasin/States
Total SampleSize
High Producing 3 6 12 96Medium Producing 2 4 28 156
Low Producing 1 2 19 44Total = 296
Three large and six small companies were selected from each basin/state category in a high producingarea. Two large and four small companies were selected from each basin/state category in a mediumproducing area. One large and two small companies were selected from each category in a low producingarea. The final sample size contained 296 survey forms. A total of 131 operators responded to the survey,approximately 44 percent of the fields sampled. Sixty-eight percent of large companies responded and 33percent of small/independent operators responded. Table G.6 tabulates the respondent coverage by state andby basin/state combination.
G.2.2. 1995 E&P Operations Survey – Appalachian States
The PI database that served as a sampling frame for the 1995 Onshore and Coastal E&P Operationssurvey did not contain production information for the Appalachian states, Kentucky, New York, Ohio,

APPENDIX G
SURVEY METHODOLOGY
64
Pennsylvania, Tennessee, Virginia, and West Virginia. For these states, API contacted the Oil and GasAssociations of each state and asked for a list of member companies. API sent survey forms to a selection ofthe member companies and asked the companies to complete the forms for any two of their fields in thedesignated state. Companies in Appalachia were chosen for their likelihood of response, rather than based ona statistical sampling. Participating companies were asked to select one large field and one medium/small fieldin the assigned state. Thirty-three responses were received from seven states. Table G.3 below lists thenumber of respondents for each state.
Table G.3. Appalachian State Respondents
State Respondents
Kentucky 8New York 3Ohio 4Pennsylvania 5Tennessee 0Virginia 4West Virginia 9Appalachia Total 33
G.2.3. 1995 Natural Gas Processing Plant Survey
For sampling purposes, the United States was divided into eight regions shown in Table G.4. Thesampling frame used for the gas plants waste management survey was obtained from the July 1, 1996, Oil andGas Journal Gas Processing Survey. The original Oil and Gas Journal 1996 survey list contains 623 gas plantsoperating in the United States in 1995. Twenty-four plants listed had missing capacity information and wereremoved from the population frame for the wastes survey. This left a total of 599 gas plants in the population.
A stratified random sample design was used, with an individual gas plant facility being the primarysampling unit. One hundred two gas plants were to be included in the nationwide survey. The country was firstdivided into 8 regions. Each region was divided into three strata, small, medium, and large, by gas plantcapacity and all “large” gas plants were included in the sample. Some regions had zero facilities in some of thestrata. For example, Alaska had only three facilities in the region and all three were in the “large” stratum. Afterincluding all the “large” plants and all the Alaska plants, eighty-three “non-large” plants (facilities not classified inthe large stratum) remained to be randomly selected.
Proportional allocation was used to determine the sample sizes (total sample size for the small andmedium strata) for each region. Proportional allocation was also used to distribute the non-certainty samplebetween the strata within each region. Table G.7 lists the population, sample, and respondent number of gasplants by region and stratum (gas plant capacity and gas throughput).

APPENDIX G
SURVEY METHODOLOGY
65
Table G.4. Gas Plants Survey - Regions and Sample Size
Region State PopulationSize
SampleSize
Respondents
Alaska Alaska 3 3 3California California 25 4 3
Eastern U.S.Alabama, Florida, Kentucky,Michigan, Ohio, Pennsylvania,West Virginia
47 10 7
Mid-West Arkansas, Kansas, Oklahoma 92 14 3New Mexico New Mexico 27 6 5
Rockies Colorado, Montana, North Dakota,Utah, Wyoming 104 11 7
Southeast Louisiana, Mississippi 68 27 15Texas Texas 233 27 15Total 599 102 85
G.3. Survey Data Analysis
The 1995 E&P operations survey and gas plants survey collected data on a range of facilities and theiroperational practices. This report evaluates only the survey questions pertaining to waste volumes and wastemanagement practices:
• numbers of production pits and non-pressurized tanks,• produced water volumes and produced water management,• drilling practices, drilling waste volumes and waste management,• associated production waste volumes and waste management, and• gas processing plant dehydration waste volumes and waste management.
Although survey samples were designed on a basin/state basis for the E&P operations survey, thesurvey responses are aggregated, reported and extrapolated by state. The objective of the analysis presentedhere is to provide reported data and data extrapolations that can be meaningfully compared with other oil andgas data that are typically reported by state. Table G.8 shows the number of responses by state for the E&Poperations survey. The response rate for the onshore operations survey was 44 percent (131 responses werereceived from a sample size of 296). Thirty-three additional responses were received from seven Appalachiansstates. For the 32 states included in the survey sample design, the number of responses ultimately received foreach state range from zero to 22, with an average of five responses per state. The gas processing plant data isreported and extrapolated by the regions defined in the survey sample design. The responses received for thegas plant regions are shown in Table G.4 and range from three to fifteen responses per region.
G.3.1. Survey Data Extrapolation
For most questions, a ratio estimation method is used to extrapolate the reported data for a given stateto an estimated total for that state. Different extrapolation methods were applied to the data received for theE&P operations survey in an attempt to find a method that produced state by state estimates that werereasonable when compared to known data.16 However, because most states are represented by a small
16 For example, large states with a greater number of respondents, such as California and Texas, had enough responses for some
questions that regression analysis could be used. The survey responses were examined on a respondent-by-respondent basis forindividual survey questions to determine whether any trend or relevant clustering occurred. For example, did responses tend tocluster by oil production vs. gas production, large operator vs. small operator? Individual responses were also examined to

APPENDIX G
SURVEY METHODOLOGY
66
number of responses, straightforward ratio estimation produced the most consistent and reasonable estimatedvalues. Reported data from the operations survey are extrapolated on production, estimated number ofproduction facilities, or number of wells, as appropriate to the survey question under consideration. Similarly,reported data from the gas plants survey are extrapolated either on gas throughput or on number of gas plants,as appropriate.
All of the responses received for a state were aggregated. Depending upon the survey question underconsideration, the individual survey responses were designated as predominately representing gas productionor predominately representing oil production. The total responses received for the state were used to generatea single extrapolation factor for the state such as number of tank batteries per oil production facility or volume ofcompletion fluids generated per well completion. The extrapolation factor was then applied to state data suchas number of well completions or volume of gas production, in order to generate a total estimated surveyresponse for the state. Depending upon the nature of the survey question, “zero” responses received fromsurvey responses were either incorporated into the state extrapolation factor or omitted. For example, for somequestions related to facilities, “zero” responses are treated as questionable data and are omitted. Consider theexample below:
State “A”Response 1 10 wells 2 tank batteriesResponse 2 100 wells 0 tank batteriesResponse 3 37 wells 10 tank batteries
It is unlikely that a field with 100 wells has no tank batteries, so “Response 2” is consideredquestionable data and is omitted from the state extrapolation factor:
Extrapolation Factor for State “A” = 10 wells + 37 wells =2 tank batteries + 10 batteries
4 wellstank battery
For most questions related to volumes of produced water or waste, the “zero” responses are appropriatelytreated as valid data and are incorporated into the state extrapolation factor. The example shown belowillustrates the case in which a volume of workover waste is generated intermittently depending upon fieldoperations. In this example, “zero” responses represent valid data that should be incorporated into the stateextrapolation factor.
State “A”Response 1 10 oil wells 20 barrels wasteResponse 2 100 oil wells 280 barrels waste
Response 3 37 oil wells 0 barrels waste
Extrapolation Factor for State “A” = 20 bbls. + 280 bbls. + 0 bbls. =10 wells + 100 wells + 37 wells
2.04 bbls. wasteoil well
For some of the survey questions evaluated in this report, a statewide value for wastes or facilities isestimated for states that have no reported data. Either these states were not sampled (Oregon, Missouri), orthe states were sampled but no response was received (Nevada, South Dakota). Also, in a few instances forboth the operations survey and the gas plants survey, the survey response received appears to be an “outlier”,or in some way is a non-representative respondent. In these cases, either a value is estimated for the stateusing a “national” extrapolation factor based upon the total survey response or an extrapolation factor or surveyresponse from a similar neighboring state is applied. For example, an extrapolation factor based upon gas
(..continued)determine the most reasonable way to treat “zero” responses and outliers. Depending upon the type of question, a zero responsewas treated as valid response, or was considered an “unlikely” response and omitted.

APPENDIX G
SURVEY METHODOLOGY
67
production in West Virginia might be applied to gas production in Virginia, or an extrapolation factor for anassociated waste volume reported for Montana might also be applied to North Dakota. It was apparent that thewording of some survey questions was unclear to respondents. This contributed to a poor response rate onsome questions, and to results that were difficult to interpret. Follow-up calls were made to respondents by APIand its contractors to clarify responses where needed. Also, for some questions such as produced watervolumes, the results extrapolated from the survey responses are supplemented by estimates from othersources.
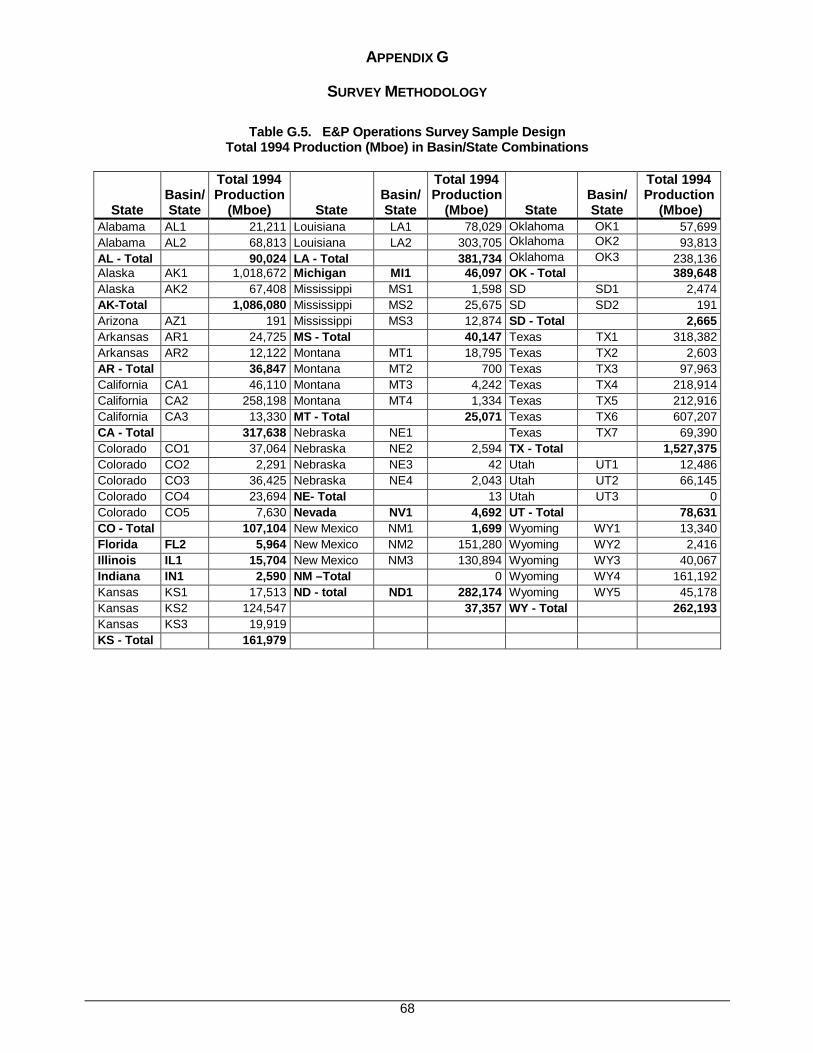
APPENDIX G
SURVEY METHODOLOGY
68
Table G.5. E&P Operations Survey Sample DesignTotal 1994 Production (Mboe) in Basin/State Combinations
StateBasin/State
Total 1994Production
(Mboe) StateBasin/State
Total 1994Production
(Mboe) StateBasin/State
Total 1994Production
(Mboe)Alabama AL1 21,211 Louisiana LA1 78,029 Oklahoma OK1 57,699Alabama AL2 68,813 Louisiana LA2 303,705 Oklahoma OK2 93,813AL - Total 90,024 LA - Total 381,734 Oklahoma OK3 238,136Alaska AK1 1,018,672 Michigan MI1 46,097 OK - Total 389,648Alaska AK2 67,408 Mississippi MS1 1,598 SD SD1 2,474AK-Total 1,086,080 Mississippi MS2 25,675 SD SD2 191Arizona AZ1 191 Mississippi MS3 12,874 SD - Total 2,665Arkansas AR1 24,725 MS - Total 40,147 Texas TX1 318,382Arkansas AR2 12,122 Montana MT1 18,795 Texas TX2 2,603AR - Total 36,847 Montana MT2 700 Texas TX3 97,963California CA1 46,110 Montana MT3 4,242 Texas TX4 218,914California CA2 258,198 Montana MT4 1,334 Texas TX5 212,916California CA3 13,330 MT - Total 25,071 Texas TX6 607,207CA - Total 317,638 Nebraska NE1 Texas TX7 69,390Colorado CO1 37,064 Nebraska NE2 2,594 TX - Total 1,527,375Colorado CO2 2,291 Nebraska NE3 42 Utah UT1 12,486Colorado CO3 36,425 Nebraska NE4 2,043 Utah UT2 66,145Colorado CO4 23,694 NE- Total 13 Utah UT3 0Colorado CO5 7,630 Nevada NV1 4,692 UT - Total 78,631CO - Total 107,104 New Mexico NM1 1,699 Wyoming WY1 13,340Florida FL2 5,964 New Mexico NM2 151,280 Wyoming WY2 2,416Illinois IL1 15,704 New Mexico NM3 130,894 Wyoming WY3 40,067Indiana IN1 2,590 NM –Total 0 Wyoming WY4 161,192Kansas KS1 17,513 ND - total ND1 282,174 Wyoming WY5 45,178Kansas KS2 124,547 37,357 WY - Total 262,193Kansas KS3 19,919KS - Total 161,979

APPENDIX G
SURVEY METHODOLOGY
69
Table G.6. E&P Operations Survey Design – Number of Survey Respondentsby State, Company Size, and by Basin/State Combination
Large Companies Small Companies Total Companies
StateBasin/State
Basin/State
CategorySample
Size ResponsesSample
Size ResponsesSample
Size ResponsesAlabama AL1 M 2 1 4 2 6 3Alabama AL2 M 1 1 3 2 4 3AL - Total 3 2 7 4 10 6Alaska AK1 H 2 1 1 0 3 1Alaska AK2 M 2 2 1 0 3 2AK-Total 4 3 2 0 6 3Arizona AZ1 L 0 -- 2 0 2 0Arkansas AR1 M 2 1 4 2 6 3Arkansas AR2 M 2 1 4 1 6 2AR - Total 4 2 8 3 12 5California CA1 M 2 0 4 3 6 3California CA2 H 2 3 4 3 6 6California CA3 M 2 0 4 2 6 2CA - Total 6 3 12 8 18 11Colorado CO1 M 2 1 4 1 6 2Colorado CO2 L 1 1 2 0 3 1Colorado CO3 M 2 2 4 1 6 3Colorado CO4 M 1 1 4 0 5 1Colorado CO5 L 1 1 2 1 3 2CO - Total 7 6 16 3 23 9Florida FL1 L 0 -- 2 0 2 0Florida FL2 L 1 1 1 0 2 1Illinois IL1 M 2 1 4 1 6 2Indiana IN1 M 1 0 2 0 3 0Kansas KS1 M 1 1 4 2 5 3Kansas KS2 H 3 3 6 4 9 7Kansas KS3 M 2 1 5 3 7 4KS - Total 6 5 15 9 21 14Louisiana LA1 M 2 2 4 2 6 4Louisiana LA2 H 3 3 6 2 9 5LA - Total 5 5 10 4 15 9Michigan MI1 M 2 2 3 1 5 3Mississippi MS1 L 0 -- 2 0 2 0Mississippi MS2 M 1 1 4 0 5 1Mississippi MS3 M 2 1 3 0 5 1MS - Total 3 2 9 0 12 2Montana MT1 M 2 1 4 3 6 4Montana MT2 L 1 0 2 2 3 2Montana MT3 L 1 0 2 1 3 1Montana MT4 L 1 1 2 2 3 3MT - Total 5 2 10 8 15 10Nebraska NE1 L 1 0 2 1 3 1Nebraska NE2 L 0 -- 2 0 2 0Nebraska NE3 L 1 1 1 0 2 1Nebraska NE4 L 0 -- 1 0 1 0NE- Total 2 1 6 1 8 2

APPENDIX G
SURVEY METHODOLOGY
70
Large Companies Small Companies Total Companies
StateBasin/State
Basin/State
CategorySample
Size ResponsesSample
Size ResponsesSample
Size ResponsesNevada NV1 L 1 0 1 0 2 0New Mexico NM1 H 3 3 4 0 7 3New Mexico NM2 H 3 2 6 2 9 4New Mexico NM3 -- 0 -- 0 -- 0 --NM – Total 6 5 10 2 16 7North Dakota ND1 M 2 0 4 1 6 1Oklahoma OK1 M 2 2 4 0 6 2Oklahoma OK2 M 2 2 4 3 6 5Oklahoma OK3 H 3 1 6 0 9 1OK - Total 7 5 14 3 21 8SouthDakota
SD1 L 1 0 2 0 3 0SouthDakota
SD2 L 0 -- 2 0 2 0SD - Total 1 0 4 0 5 0Texas TX1 H 3 3 6 2 9 5Texas TX2 L 0 -- 1 1 1 1Texas TX3 M 2 0 4 2 6 2Texas TX4 H 3 1 6 2 9 3Texas TX5 H 3 2 6 3 9 5Texas TX6 H 3 3 6 1 9 4Texas TX7 M 2 1 4 1 6 2TX - Total 16 10 33 12 49 22Utah UT1 M 1 1 3 0 4 1Utah UT2 M 2 1 3 2 5 3Utah UT3 -- -- -- -- -- -- --UT - Total 3 2 6 2 9 4Wyoming WY1 M 2 2 4 1 6 3Wyoming WY2 L 1 1 1 0 2 1Wyoming WY3 M 2 2 4 2 6 4Wyoming WY4 H 2 2 6 1 8 3Wyoming WY5 M 2 1 4 0 6 1WY - Total 9 8 19 4 28 12U. S. Total 96 65 200 66 296 131Appalachian Responses: KY = 8, NY = 3, OH = 4, PA = 5, TN = 0, VA = 4, WV = 9

APPENDIX G
SURVEY METHODOLOGY
71
Table G.7. Gas Plants Survey Sample Design – Range in Gas Plant Capacityand Throughput (mmcfd) for Survey Sample Strata
StrataRegion Small Medium Large Total
AlaskaStratum Size, MMcfd per plant N/A N/A < 8200Population Size 0 0 3Sample Size 0 0 3No. of Responses 0 0 3Gas Capacity, MMcfd 0 0 8,975Gas Throughput, MMcfd 0 0 8,637California
Stratum Size, MMcfd per plant < 160 > 160 N/A
Population Size 23 2 0 25Sample Size 2 2 0 4No. of Responses 1 2 0 3Gas Capacity, MMcfd 718 320 0 1,038Gas Throughput, MMcfd 379 300 0 679Eastern U. S.
Stratum Size, MMcfd per plant < 500 > 500 N/A
Population Size 46 1 0 47Sample Size 9 1 0 10No. of Responses 6 1 0 7Gas Capacity, MMcfd 5,132 1,000 0 6,132Gas Throughput, MMcfd 1,934 71 0 2,005Mid West
Stratum Size, MMcfd per plant < 180 > 180 and < 480 > 480
Population Size 82 7 3 92Sample Size 7 4 3 14No. of Responses 2 1 0 3Gas Capacity, MMcfd 3,773 2,012 2,600 8,385Gas Throughput, MMcfd 2,579 1,285 2,030 5,894New Mexico
Stratum Size, MMcfd per plant < 80 > 80 and < 220 > 220
Population Size 19 6 2 27Sample Size 2 2 2 6No. of Responses 2 1 2 5Gas Capacity, MMcfd 784 894 1,094 2,772Gas Throughput, MMcfd 585 679 858 2,122RockiesStratum Size, MMcfd per plant < 120 > 120 and < 350 > 350Population Size 91 10 3 104Sample Size 4 4 3 11No. of Responses 0 4 3 7

APPENDIX G
SURVEY METHODOLOGY
72
StrataRegion Small Medium Large Total
Gas Capacity, MMcfd 2,125 2,255 1,965 6,345Gas Throughput, MMcfd 1,253 1,649 1,482 4,384SoutheastStratum Size, MMcfd per plant < 300 > 300 and < 950 > 950Population Size 51 13 4 68Sample Size 10 13 4 27No. of Responses 4 9 2 15Gas Capacity, MMcfd 3,757 9,345 5,650 18,752Gas Throughput, MMcfd 2,855 5,224 4,785 12,864TexasStratum Size, MMcfd per plant < 140 > 140 and < 375 > 375Population Size 208 21 4 233Sample Size 15 8 4 27No. of Responses 9 3 3 15Gas Capacity, MMcfd per 8,354 4,580 3,300 16,234Gas Throughput, MMcfd 5,873 3,415 2,214 11,502
Population Size (All) 520 60 19 599Total Sample Size 49 34 19 102Total Respondents 24 21 13 58

APPENDIX G
SURVEY METHODOLOGY
73
Table G.8. Survey Response by State
StateTotal
Responses
No. of Oil and GasFields Represented
by Respondents
Responsesrepresenting
predominately OILproduction
Responsesrepresenting
predominately GASproduction
AK 3 3 2 1AL 6 6 2 4AR 5 5 1 4AZ 0CA 11 10 9 2CO 9 7 4 5FL 1 1 1 0IL 2 2 2 0IN 0KS 14 11 7 7LA 9 9 2 7MI 3 3 1 2MS 2 2 2 0MO 0MT 10 10 9 1ND 1 1 1 0NE 2 2 2 0NM 7 6 1 6NV 0OK 8 8 2 6OR 0SD 0TX 22 21 13 9UT 4 4 2 2WY 12 12 8 4
Sub-Total 131 123 71 60Appalachian
States:KY 8 6 4 4NY 3 3 1 2OH 4 4 2 2PA 5 5 0 5TN 0VA 4 2 1 3WV 9 9 2 7
AppalachianTotal:
33 29 10 23
TOTAL 164 152 81 83

74
APPENDIX H
SURVEY FORM - API SURVEY OF ONSHORE AND COASTAL EXPLORATION AND PRODUCTIONOPERATIONS FOR 1995

1
Please respond by ____________
API SURVEY OF ONSHORE AND COASTALEXPLORATION AND PRODUCTION OPERATIONS
FOR 1995
SURVEY FORM
Name of Field
County/Parish __________ State
ALL SURVEY RESPONSES WILL BE HELD CONFIDENTIAL.Only aggregated results from the survey will be made publicly
available. For API internal use, company names and field names willbe replaced by codes to maintain confidentiality.

1
We hope that you will look at completing the survey not as an additional costor inconvenience, but as an investment in the well-being of our industry.
Carl Giardini, ChairmanAPI General Committee on Exploration and Production
Estimated Time Required
Before sending out this survey, we asked several companies to complete the survey as atest both of its clarity and the length of time involved in its completion. The small companiesparticipating reported spending between 30 minutes and 2 hours on completion of the survey. Larger companies reported spending up to 8 hours (spread over a week) to complete the surveyform, due primarily to the need to coordinate with many different individuals throughout thecompany to gather the information. We hope that you will find this burden sufficiently light tocomplete this vitally important survey.
Please remember that the survey focuses on operations in a single field, not for yourcompany as a whole. Several of the questions focus only on large pieces of equipment (e.g.,heater treaters or boilers with > 10 million Btu/hour capacity) because they are possible targets offuture regulatory activity. Many field operations will not have these large pieces of equipment —thus, those questions can be quickly answered; reducing the effort involved in responding to thesurvey.
Benefits to Completing the Survey
The primary benefit to you will be knowing that API and other industry organizations havean accurate characterization of industry operations that they can provide to regulators, legislators,and the general public to educate them about our industry. This will help to allow futurerequirements to be based on current conditions, and may result in compliance cost savings onfuture regulations that better reflect the real risks associated with industry activities.
In addition, the questions related to equipment that may produce air emissions are anattempt to avoid a mandatory data collection request from EPA that could be far more time-consuming than this survey.
Your response is crucial to our survey design (which has attempted to minimize theburden on companies). Given these benefits, and the importance of this effort, we hope that youwill help and complete the survey form. It really is an investment in the well-being of our industry.

Page 1
API SURVEY OF ONSHORE AND COASTAL EXPLORATION AND PRODUCTION OPERATIONSFOR 1995
Name of Field
County/Parish State
Please complete this survey to cover all of your operated leases/units in the field noted above. If the field crossescounty or parish boundaries, please provide data for the entire field, not just the portion in the county listed above. Please provide data for calendar year 1995. Do not include information about the leases within the field that you donot operate. Do not include data on gas plants located in the field. If you did not operate leases in this field during1995, please complete questions 1-2 below, check here and return this form to the address on the backpage.
Instructions are enclosed that provide additional explanation about the completion of each question.
1. Operator/Company Name
2. Contact Person Phone #
3. Number of months of 1995 you operated in this field:
FIELD/LEASE INFORMATION
4. Number of individual leases or units you operate in field
5. Number of active wells you operate in field by type (end of 1995):
OilWells
GasWells
Disposal(Injection)
Wells
EnhancedRecovery
(Injection) Wells
SourceWaterWells
Number of active wells atyear end 1995
6. Your gross daily production volumes from this field for 1994 and 1995:
Natural GasOil
Bbls/dayFrom OilWells*
1,000 scf/day
From GasWells*
1,000 scf/day
CondensateBbls/day
ProducedWater
Bbls/day1994 production volume
1995 production volume
Please report gross daily production volumes from all operated wells in the field. Please use the unitsnoted in each column. * If you do not have a breakdown on gas from oil wells vs. gas from gas wells available, please put totalgas production in gas wells column and label as both oil and gas wells.
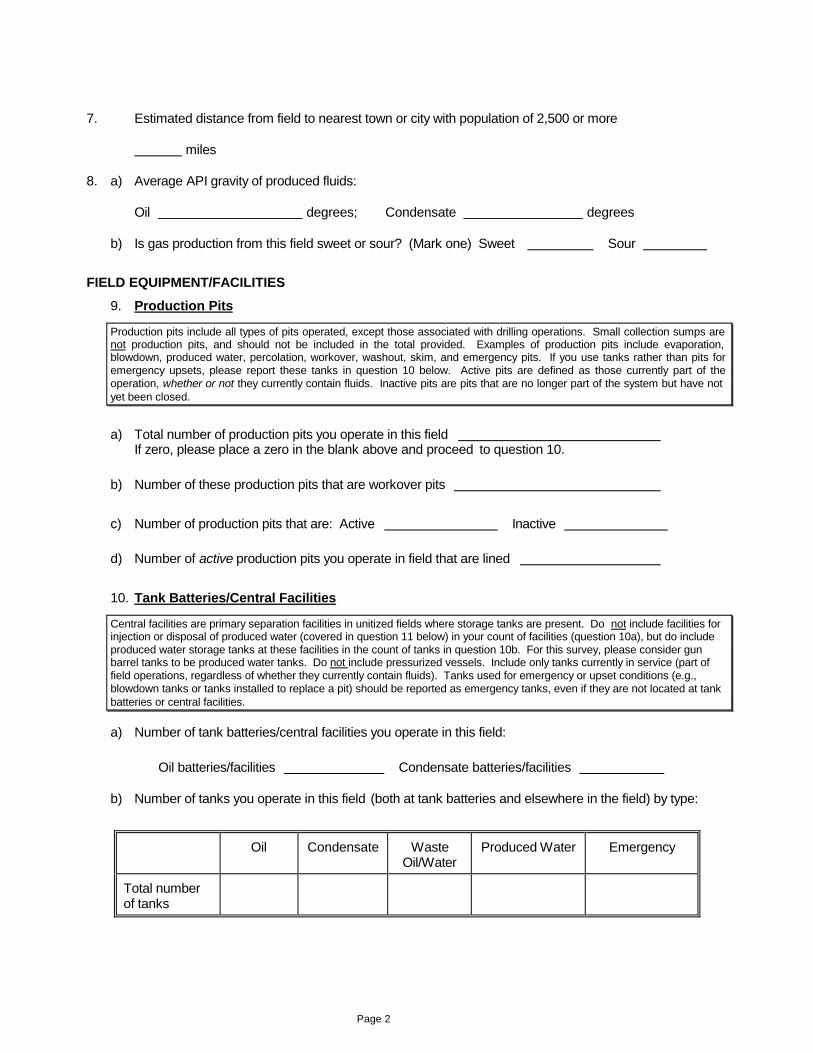
Page 2
7. Estimated distance from field to nearest town or city with population of 2,500 or more
miles
8. a) Average API gravity of produced fluids:
Oil degrees; Condensate degrees
b) Is gas production from this field sweet or sour? (Mark one) Sweet Sour
FIELD EQUIPMENT/FACILITIES
9. Production Pits
Production pits include all types of pits operated, except those associated with drilling operations. Small collection sumps arenot production pits, and should not be included in the total provided. Examples of production pits include evaporation,blowdown, produced water, percolation, workover, washout, skim, and emergency pits. If you use tanks rather than pits foremergency upsets, please report these tanks in question 10 below. Active pits are defined as those currently part of theoperation, whether or not they currently contain fluids. Inactive pits are pits that are no longer part of the system but have notyet been closed.
a) Total number of production pits you operate in this field If zero, please place a zero in the blank above and proceed to question 10.
b) Number of these production pits that are workover pits
c) Number of production pits that are: Active Inactive
d) Number of active production pits you operate in field that are lined
10. Tank Batteries/Central Facilities
Central facilities are primary separation facilities in unitized fields where storage tanks are present. Do not include facilities forinjection or disposal of produced water (covered in question 11 below) in your count of facilities (question 10a), but do includeproduced water storage tanks at these facilities in the count of tanks in question 10b. For this survey, please consider gunbarrel tanks to be produced water tanks. Do not include pressurized vessels. Include only tanks currently in service (part offield operations, regardless of whether they currently contain fluids). Tanks used for emergency or upset conditions (e.g.,blowdown tanks or tanks installed to replace a pit) should be reported as emergency tanks, even if they are not located at tankbatteries or central facilities.
a) Number of tank batteries/central facilities you operate in this field:
Oil batteries/facilities Condensate batteries/facilities
b) Number of tanks you operate in this field (both at tank batteries and elsewhere in the field) by type:
Oil Condensate WasteOil/Water
Produced Water Emergency
Total numberof tanks

Page 3
c) Percentage of oil and condensate tanks that route vapors directly to a flare %
d) Percentage of oil and condensate tanks with a floating roof %
e) Percentage of oil and condensate tanks with a vapor recovery unit installed %
f) Of oil and condensate tanks with a vapor recovery unit, percentage by vapor destination:
Percentage
Incineration (flare)
Sales (as product)
Return to process
Other (specify)
Total 100%
g) Average operating pressure of high pressure separator psig
h) Average operating pressure of low pressure separator psig
i) Is gas from the low pressure separator vented? Yes No
11. Produced Water Injection/Disposal Facilities
Produced water injection/disposal facilities include one or more wells injecting water for disposal or enhanced recovery, alongwith the associated treatment equipment. Storage tanks located at these facilities should be reported in question 10 above.
a) Number of facilities operated and water volumes injected in this field:If zero, place a zero in the table below and proceed to question 12.
EnhancedRecovery/Injection
Produced WaterDisposal
Number of facilities operated in field
Volume of water injected (barrels/day)
b) Source of produced water disposed (disposal facilities only):
Percentage
From company operations in this field
From company operations in other fields
From other companies in this field
From other companies in other fields
TOTAL 100%

Page 4
12. Gas Dehydration Units
a) Total number of gas dehydration units you operate in field by dehydration method (do not includedehydration units located at a gas plant):If zero, place a zero in the table below and proceed to question 13.
Triethyleneglycol (TEG)
Ethyleneglycol (EG)
Diethyleneglycol(DEG)
Dry beddesiccant or
molecular sieve
Other
Number of dehydration units
Note: Remaining parts of this question address TEG units only. If zero, proceed to question 13.
b) Number of triethylene glycol (TEG) dehydration units you operate in field by size:
Number of TEG Units Design Capacity and Actual Throughput Ranges
≤ 1 million scf/d
1.01–3 million scf/d
3.01–10 million scf/d
> 10 million scf/d
Number of units with DesignCapacity in range
Number of units with ActualThroughput1 in range1 Annual average operating throughput for year 1995.
c) Percentage of TEG dehydration units with both flash tanks (fuel economizers) and condensers
%
d) Percentage of TEG dehydration units with a flash tank, but no condenser %
e) Percentage of TEG dehydration units with a condenser, but no flash tank %
f) Percentage of TEG units with a condenser which:
Incinerates the offgas in a unit burner %
Flares the offgas %
g) Percentage of TEG units that route emissions to a flare without prior condensation %
h) Number of glycol reboiler fireboxes with maximum rated heat input capacity ≥ 10 million btu/hour

Page 5
13. Field Gas Compressor Drivers
Field gas compressors are driven by engines or turbines, and are used to compress gas to prepare it for pipelinetransportation, to inject CO2 or natural gas to enhance oil and gas recovery, or to boost gas pressure to use in gas liftoperations. Include only those compressor drivers of 150 Hp or larger (continuous design-rated Hp) operated by you. Include electric motors that are used to drive compressors. Do not include any compressors that are part ofpipeline/transmission operations. Do not include compressors located at gas plants.Size and physical location of field compressor drivers may affect whether they are covered by certain air regulations in thefuture. Two locations are of interest:• Productionsite – a contiguous graded pad, gravel pad, foundation, platform, or other location upon which any
combination of compressor(s), separator(s), pumps(s), storage tank(s), heater treater(s), and/or boiler(s) are physicallyaffixed and comprise a field facility to process the produced fluids for sale and/or injection/discharge.
• Compressor site – a contiguous graded pad, gravel pad, foundation, platform, or other location upon which one or morecompressors are physically affixed that is not located within a productionsite.
a) Total number of field gas compressor drivers (engines and turbines) larger than 150 continuous
design-rated Hp If zero, place a zero in the blank above and proceed to question 14.
b) Percentage and total horsepower of compressor drivers (engines and turbines) 150 Hp or larger byengine manufacturer:
Engine Manufacturer Waukesha Cooper-Bessemer
Clark IngersollRand
Ajax Other
% of compressor drivers
Total Horsepower
c) Number, type, size and fuel source for compressor drivers (engines) at productionsites:
Number of engines/motorsHorsepower(continuous
design-rating)
EngineType
Electricpoweredmotors
Rich1 burnengines
% rich burnw/ catalyticcontrols2
Lean3 burnengines
Clean4 burnengines
150-300 Hp 2-Stroke
4-Stroke
301-500 Hp 2-Stroke
4-Stroke
501-750 Hp 2-Stroke
4-Stroke
751-1,000 Hp 2-Stroke
4-Stroke
>1,000 Hp 2-Stroke
4-Stroke
Fuel Source5 electric1
Rich burn engines produce less than 4% oxygen in their exhaust. The manufacturer's original recommendedoperating air-fuel ratio divided by the stoichiometric air/fuel ratio is less than or equal to 1:1. Most 4-strokeengines installed prior to 1982 are rich burn engines.
2Include the percentage of your rich burn engines that have had catalytic controls installed.
3A lean burn engine produces greater than 4% oxygen in its exhaust. All 2-stroke engines are lean burn, alongwith some 4-stroke engines.
4Clean burn engines are engines (typically 4-stroke) that have had the cylinder heads, combustion chamber, orother parts modified so that the engine is a low NOx emitter without catalytic controls .
5Natural gas, diesel, gasoline, propane, or other (please specify).

Page 6
d) Number of compressor sites in the field with one compressor sites
e) Number of compressor sites with more than one compressor sites
f) Number, type, and fuel source for compressor drivers (engines) at compressor sites:
Number of engines/motorsHorsepower(continuous
design-rating)
EngineType
Electricpoweredmotors
Rich1 burnengines
% rich burnw/ catalyticcontrols2
Lean3 burnengines
Clean4 burnengines
150-300 Hp 2-Stroke
4-Stroke
301-500 Hp 2-Stroke
4-Stroke
501-750 Hp 2-Stroke
4-Stroke
751-1,000 Hp 2-Stroke
4-Stroke
>1,000 Hp 2-Stroke
4-Stroke
Fuel Source5 electric1
Rich burn engines produce less than 4% oxygen in their exhaust. The manufacturer's original recommendedoperating air-fuel ratio divided by the stoichiometric air/fuel ratio is less than or equal to 1:1. Most 4-strokeengines installed prior to 1982 are rich burn engines.
2Include the percentage of your rich burn engines that have had catalytic controls installed.
3A lean burn engine produces greater than 4% oxygen in its exhaust. All 2-stroke engines are lean burn, alongwith some 4-stroke engines.
4Clean burn engines are engines (typically 4-stroke) that have had the cylinder heads, combustion chamber, orother parts modified so that the engine is a low NOx emitter without catalytic controls .
5Natural gas, diesel, gasoline, propane, or other (please specify).
g) Number, size, location, and fuel source of turbines to drive compressors:
Location
Turbine Size Plant Site Compressor Site
≤ 1,000 Hp
1,001-5,000 Hp
5,001-15,000 Hp
15,001-25,000 Hp
> 25,000 Hp
Fuel Source1
1Natural gas, diesel, gasoline, propane, or other (please specify).
h) Estimated average BTU content of natural gas used for fuel BTU/scf

Page 7
14. Field Internal Combustion Engines
Please include all types of stationary field internal combustion engines, including drivers for pumping units, pumps, generators,and other equipment not included in question 13 above. Do not include engines on mobile sources (trucks, etc.)
a) Number of stationary internal combustion engines of 150 horsepower or more (exclud ing compressordrivers) you operate in this field by size:If zero, place zeros in the table below and proceed to question 15.
Number of enginesHorsepower
ratingEngineType Rich1 burn
engines
% rich burn w/catalyticcontrols2
Lean3 burnengines
Clean4 burnengines
150-300 Hp 2-Stroke
4-Stroke
301-500 Hp 2-Stroke
4-Stroke
501-750 Hp 2-Stroke
4-Stroke
751-1,000 Hp 2-Stroke
4-Stroke
>1,000 Hp 2-Stroke
4-Stroke
Fuel Source5
1Rich burn engines produce less than 4% oxygen in their exhaust. The manufacturer's original recommendedoperating air-fuel ratio divided by the stoichiometric air/fuel ratio is less than or equal to 1:1. Most 4-stroke enginesinstalled prior to 1982 are rich burn engines.
2Include the percentage of your rich burn engines that have had catalytic controls installed.
3A lean burn engine produces greater than 4% oxygen in its exhaust. All 2-stroke engines are lean burn, along withsome 4-stroke engines.
4Clean burn engines are engines (typically 4-stroke) that have had the cylinder heads, combustion chamber, orother parts modified so that the engine is a low NOx emitter without catalytic controls .
5Natural gas, diesel, gasoline, propane, or other (please specify).
b) Percentage and total horsepower of stationary internal combustion engines of 150 horsepower or more(excluding compressor drivers) by manufacturer:
EngineManufacturer
Waukesha GeneralElectric
DetroitDiesel
Caterpillar Ajax Other
% of engines
Total Horsepower

Page 8
15. Field Heater Treaters and Boilers/Steam Generators
This question covers only units with a maximum rated heat input capacity of 10 million Btu/hour or more. Do not includeglycol reboilers, which were covered in question 12 above. Do not include heaters or boilers located at gas plants.Size and physical location of heater treaters and boilers/steam generators may affect whether they are covered by certainair regulations in the future. Two locations are of interest:• Productionsite – a contiguous graded pad, gravel pad, foundation, platform, or other location upon which any
combination of separator(s), pumps(s), storage tank(s), compressor(s), heater treater(s), and/or boiler(s) are physicallyaffixed and comprises a field facility to process the produced fluids for sale and/or injection/discharge.
• Heater/Steam Generator/Boiler site – a contiguous graded pad, gravel pad, foundation, platform, or other location uponwhich heater treater(s) and/or boiler/steam generator(s) are physically affixed that is not located within a productionsite.
a) Total number of heater treaters and boilers/steam generators with maximum heat input capacity of 10million Btu/hour or more operated in the field:If zero, place a zero in the table and proc eed to question 16.
Capacity ≥ 10 million Btu/hour
Heater Treaters Boilers/SteamGenerators
Number of units
b) List the number of heater treaters and boiler/steam generators with capacity of ≥ 10 million Btu/hour, bysize and location, using a separate line of the table for each size unit:
Productionsites Heater/Boiler Sites
Unit Capacity Heater Treaters Boilers/Steam Gen. Heater Treaters Boilers/Steam Gen.
c) Fuel used for heater treaters and boilers/steam generators:
Natural gas Diesel Propane Other (please specify) Total
Percentage of BTUsgenerated using
100%

Page 9
d) Percentage of heater treaters and boilers/steam generators with emission controls by type:
Control Heaters using control (%) Boilers using control (%)
No controls installed
SO2 scrubber1
Low NOx burner2
Selective catalytic reduction (SCR) 3
Selective non-catalytic reduction (SNCR)4
Flue gas recirculation5
Other (please specify)
Total 100% 100%1
SO2 scrubbers are generally “wet scrubbers” that bring the SO2-laden flue gases into contact with a liquid thatselectively reacts with the SO 2.
2Low NOx burners generally incorporate the principles of delayed fuel-air mixing, oxygen-deficient zones for initialcombustion, lower flame turbulence, and lower flame temperatures.
3SCR involves the use of ammonia and catalysts at a temperature of around 700 oF to reduce NOx to H20 and N2.
4SNCR involves the injection of ammonia at a temperature of around 1,750 oF, which reacts with NO to form H20 and N2
..
5Recycling a portion of the flue gases back into the combustion zone can reduce both the flame temperature and theoxygen concentration, thus lowering NOx emissions.
e) Based on currently installed control equipment, estimated control efficiency for variou s pollutantsfrom heater treaters and boilers/steam generators:
Pollutant SO2 NOx CO VOCs PM-10
Heater control efficiency (%)
Boiler control efficiency (%)
16. Gas Sweetening Units
Gas sweetening units remove hydrogen sulfide (H2S) and/or carbon dioxide (CO2) from natural gas by a variety of processes,including amine, Sulfinol, caustics, and iron sponge. Do not include gas sweetening units located at gas plants in the field.
a) Total number of gas sweetening units you operate in this fiel d
17. Pneumatic Devices
a) Percentage of pneumatic devices for control valve operation by type:
Instrument Air InstrumentGas*
Other Total
Percentage by type 100%* Use of natural gas to control the valve.
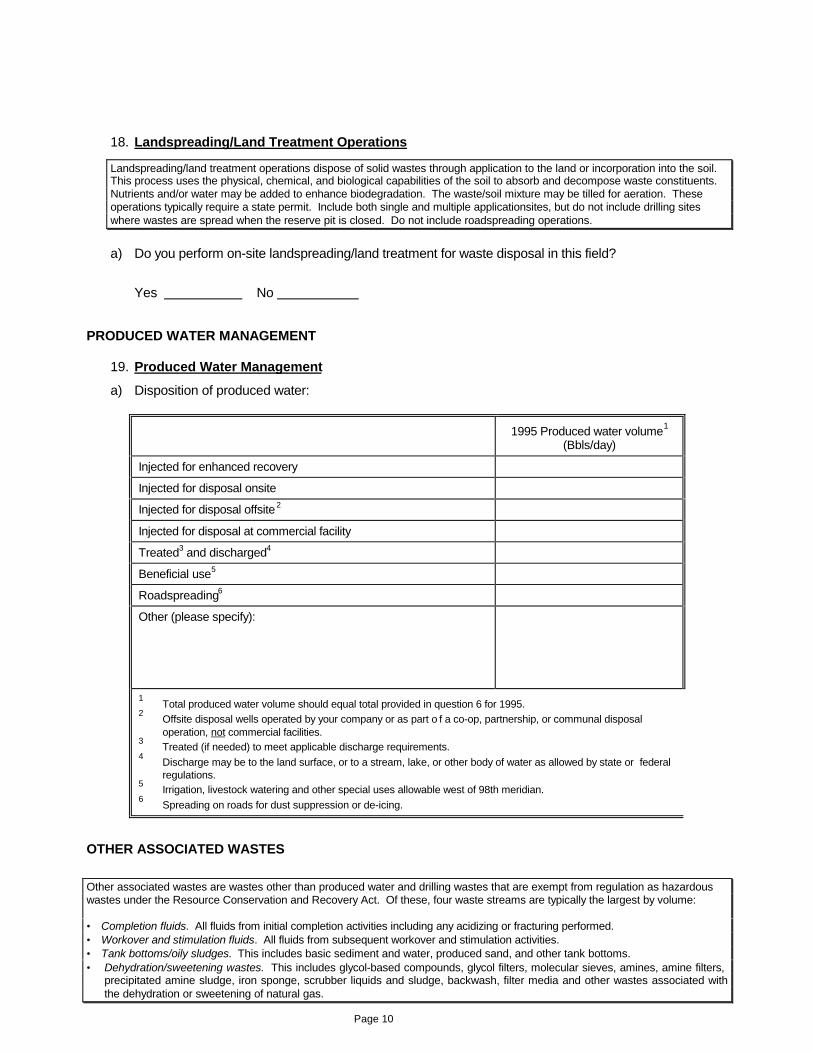
Page 10
18. Landspreading/Land Treatment Operations
Landspreading/land treatment operations dispose of solid wastes through application to the land or incorporation into the soil. This process uses the physical, chemical, and biological capabilities of the soil to absorb and decompose waste constituents. Nutrients and/or water may be added to enhance biodegradation. The waste/soil mixture may be tilled for aeration. Theseoperations typically require a state permit. Include both single and multiple applicationsites, but do not include drilling siteswhere wastes are spread when the reserve pit is closed. Do not include roadspreading operations.
a) Do you perform on-site landspreading/land treatment for waste disposal in this field?
Yes No
PRODUCED WATER MANAGEMENT
19. Produced Water Management
a) Disposition of produced water:
1995 Produced water volume1
(Bbls/day)
Injected for enhanced recovery
Injected for disposal onsite
Injected for disposal offsite2
Injected for disposal at commercial facility
Treated3 and discharged4
Beneficial use5
Roadspreading6
Other (please specify):
1Total produced water volume should equal total provided in question 6 for 1995.
2Offsite disposal wells operated by your company or as part o f a co-op, partnership, or communal disposaloperation, not commercial facilities.
3Treated (if needed) to meet applicable discharge requirements.
4Discharge may be to the land surface, or to a stream, lake, or other body of water as allowed by state or federalregulations.
5Irrigation, livestock watering and other special uses allowable west of 98th meridian.
6Spreading on roads for dust suppression or de-icing.
OTHER ASSOCIATED WASTES
Other associated wastes are wastes other than produced water and drilling wastes that are exempt from regulation as hazardouswastes under the Resource Conservation and Recovery Act. Of these, four waste streams are typically the largest by volume:
• Completion fluids. All fluids from initial completion activities including any acidizing or fracturing performed.• Workover and stimulation fluids. All fluids from subsequent workover and stimulation activities.• Tank bottoms/oily sludges. This includes basic sediment and water, produced sand, and other tank bottoms.• Dehydration/sweetening wastes. This includes glycol-based compounds, glycol filters, molecular sieves, amines, amine filters,
precipitated amine sludge, iron sponge, scrubber liquids and sludge, backwash, filter media and other wastes associated withthe dehydration or sweetening of natural gas.

Page 11
20. Other Associated Waste Volume
a) Volume of selected associated waste streams managed from operations in this field during 1995:
Waste stream Units Estimated volume
Completion fluids1 Barrels/Year
Workover and stimulation fluids Barrels/Year
Tank bottoms/oily sludges2 Barrels/Year
Dehydration/sweetening wastes Barrels/Year1 If your company does not differentiate completion activities from other workover and stimulation
activities, please estimate based on the number of wells completed during 1995.2 If you did not clean out any tanks, and therefore manage any tank bottom wastes, during 1995, enter
zero as the volume, even though tank bottoms did accumulate (which will be cleaned out andmanaged in a subsequent year).
21. Other Associated Waste Disposal
a) Disposal of other associated waste streams by method:
Please fill in the percentage of each waste stream disposed by each method listed at left. The percentages in eachcolumn should add to 100%.
Tank bottoms/oilysludges
Completionfluids
Workover/stimulation
fluids
Dehydration/sweetening
wastes
Disposal by injection
Landspreading within the field
Landspreading outside the field1
Roadspreading within the field
Roadspreading outside the field1
Commercial NOW2 disposal
Industrial or municipal landfill
Crude oil reclamation
Recycling/beneficial reuse
Incinerated
Evaporated from pits or tanks
Other (specify):
TOTAL 100% 100% 100% 100%1 Activities conducted directly by your company at another location, not through use of a commercial disposal location or
contractor.2 Non-hazardous oilfield waste commercial disposal contractor.

Page 12
DRILLING ACTIVITIES
If you did not perform any drilling in this field during 1995, check here and return the completed survey to the address onthe back page.
22. New Wells Drilled
a) Number and depth of new wells you drilled in field in 1995:
Wells drilled1 Zone 12 Zone 22 Zone 32 Zone 42
Number drilled for oil or gas3,4
Number of these that are dual completions4
Number drilled for injection or disposal
Number drilled for source water
Average well depth in zone5
1 Include all wells finished drilling in 1995, regardless of when they were spudded or completed .2 Since multiple pay zones may exist within the field, please use as many columns as needed to describe your
drilling in this field. If a single pay zone, use only the first column. Source water wells and disposal wells wouldtypically be from/to a separate zone from oil and gas production .
3 Include all wells drilled for the purpose of finding oil or gas, including dry holes.4 Use 0.5 wells in each applicable zone to represent dual completions.5 For horizontal wells, consider measured hole depth.
b) Percentage of new wells drilled by technique:
Mud Rotary Drilling Air, Gas, or
Reserve Pits Closed System(Tanks)
Cable ToolDrilling
PneumaticDrilling
Total
Percentage of newwells using
100%
c) Percentage of your reserve pits that were lined (clay or synthetic) %
d) Percentage of drilling waste by base drilling fluid:
Fresh-waterbase1
Salt-waterbase
Oil-base Synthetic-base
Total
Percentage of waste 100%1 Mud made with fresh water would be classified as fresh water base even if the fluid later became“contaminated” with chlorides or other solids.

Page 13
23. Drilling Waste Disposal
a) Disposal of drilling wastes by technique:
Drilling Waste Disposal Method Percentage of TotalDrilling Waste
LIQUID PORTION OF DRILLING WASTE
Liquids extracted and disposed via injection (Class II well)
Liquids extracted and disposed down well annulus between surface pipe and productioncasing
Liquids extracted, treated, and discharged
Liquids extracted and used for roadspreading
Liquids evaporated from solids on-site or off-site
Liquids removed from pit and landspread on-site
Liquids removed from pit and landspread off-site 1
Liquids reused/recycled for drilling other wells
Other (specify):
SOLID PORTION OF DRILLING WASTE
Backfilled/buried in reserve pit or trench following evaporation or extraction of liquids 4
Removed from pit and landspread on-site4
Removed from pit and landspread off-site 1
Removed from pit and disposed at a commercial NOW 2 facility
Removed from pit and disposed at industrial or municipal landfill
Removed from pit and reused/recycled 3
Other (specify):
TOTAL 100%1 Activities conducted by your company at another location, not use of a commercial disposal sit e.2 Nonhazardous oilfield waste commercial disposal contractor.3 Used for landfill cover, road bed construction, dike stabilization, or plugging and abandoning wells, etc.4 Includes practice of removing a section of pit wall, allowing pit contents to fl ow into a trench or onto the
ground, then treating material like other burial or landspreading operations.

Thank you for your assistance with this important survey.
The information provided will help educate policy-makers about currentpractices within the oil and gas industry.
Please return the completed survey form to:
Amita GopinathStatistical Services DivisionAmerican Petroleum Institute1220 L Street N.W.Washington, DC 20005
For questions about completing the survey, please call (703) 934-3675 and leave adetailed message. Someone knowledgeable in the subject area of your question willreturn your call as soon as possible.

91
APPENDIX I
SURVEY FORM - API SURVEY OF NATURAL GAS PROCESSING PLANTS FOR 1995
1
Please respond by _____________
API SURVEY OF NATURAL GAS PROCESSINGPLANTS FOR 1995
SURVEY FORM
Plant/Location
ALL SURVEY RESPONSES WILL BE HELD CONFIDENTIAL.Only aggregated results from the survey will be made publicly
available. For API internal use, company names and plant names willbe replaced by codes to maintain confidentiality.

1
We hope that you will look at completing the survey not as an additional costor inconvenience, but as an investment in the well-being of our industry.
Carl Giardini, ChairmanAPI General Committee on Exploration and Production
Estimated Time Required
Based on input from companies asked to review the survey form, we estimate thatcompletion of the survey will require 2-4 hours for smaller plants. For larger plants, or largercompanies, where coordination among more individuals may be required, the total timeinvestment may be larger. We hope that you will find this burden sufficiently light to complete thisvitally important survey.
Benefits to Completing the Survey
The primary benefit to you will be knowing that API and other industry organizations havean accurate characterization of industry operations that they can provide to regulators, legislators,and the general public to educate them about our industry. This will help to allow futurerequirements to be based on current conditions, and may result in compliance cost savings onfuture regulations that better reflect the real risks associated with industry activities.
In addition, the questions related to equipment that may produce air emissions are anattempt to avoid a mandatory data collection request from EPA that could be far more time-consuming than this survey.
Your response is crucial to our survey design (which has attempted to minimize theburden on companies). Given these benefits, and the importance of this effort, we hope that youwill help and complete the survey form. It really is an investment in the well-being of our industry.

Page 1
API SURVEY OF NATURAL GAS PROCESSING PLANTSFOR 1995
Plant/Location
Please complete this survey to cover operations at the natural gas processing plant listed above. Please provide datafor calendar year 1995.
Instructions are enclosed that provide additional explanation about the completion of each question.
1. Operator/Company Name
2. Contact Person Phone #
3. Number of months of 1995 you operated this plant:
PLANT INFORMATION
4. Plant size, throughput data:
Units 1995 Data
Processing Capacity Million scf/day
Gas Throughput Million scf/day
Total Liquids Recovered Thousand gallons/day
Total Sulfur Recovered Metric tons/year
5. Estimated distance from plant to nearest town or city with population of 2,500 or more
miles
6. a) Is the plant currently subject to PSD (prevention of significant deterioration) requirements?
Yes _________ No __________
b) If so, which criteria pollutant(s) (SO 2, NOx, CO, VOCs, etc.) has caused plant to be subject to PSDrequirements?
7. Percentage of gas processed at this plant by source (onshore fields/offshore fields):
Onshore % Offshore %

Page 2
PLANT EQUIPMENT/FACILITIES
8. Pits
Include all types of pits operated at the plant, except small collection sumps. Examples of pits include evaporation,blowdown, produced water, percolation, washout, skim, and emergency pits. If you use tanks rather than pits foremergency upsets, please report these tanks in question 9 below. Active pits are defined as those currently part ofthe operation, whether or not they currently contain fluids. Inactive pits are pits that are no longer part of the systembut have not yet been closed.
a) Total number of pits you operate at this plant If zero, please place a zero in the blank above and proceed to question 9.
b) Number of pits that are: Active Inactive
c) Number of active pits you operate at the plant that are lined
9. Tanks
Please include all tanks used for storage of produced water, condensate, or liquid products, and tanks used foremergency conditions. Do not include pressurized vessels. Include only tanks currently in service (part of plantoperations, regardless of whether they currently contain fluids). Tanks used for emergency or upset conditions (e.g.,blowdown tanks or tanks installed to replace a pit) should be reported as emergency tanks.
a) Number of tanks you operate at this plant by type:
Produced Water Condensate Liquid Products Emergency
Total numberof tanks
b) Percentage of condensate and product tanks that route vapors directly to a flare %
c) Percentage of condensate and product tanks with floating roofs %
d) Percentage of condensate and product tanks with a vapor recovery unit installed %
e) Of crude and product tanks with a vapor recovery unit, percentage by vapor destination:
Percentage
Incineration (flare)
Sales (as product)
Return to process
Other (specify)
Total 100%

Page 3
10. Produced Water Disposal Wells
a) Number of disposal wells operated by this plant If zero, place a zero in the table below and proceed to question 11.
b) Volume of water injected to these wells (barrels/day)
11. Gas Sweetening Units
Gas sweetening units remove hydrogen sulfide (H2S) and/or carbon dioxide (CO2) from natural gas by a variety ofprocesses, including amine, Sulfinol, caustics, and iron sponge.
a) Total number of gas sweetening units you operate in this plant
b) Total volume of gas sweetened (daily average) Million scf/day
12. Gas Dehydration Units
a) Total number of gas dehydration units you operate at plant by dehydration method:If zero, place a zero in the table below and proceed to question 13.
Triethyleneglycol (TEG)
Ethyleneglycol (EG)
Diethyleneglycol(DEG)
Dry beddesiccant or
molecular sieve
Other
Number of dehydration units
Gas volume dehydrated bymethod (million scf/d)
Note: Remaining parts of this question address TEG and EG units only. If zero, proceed to question 13. If zero TEG units, proceed to subpart h for questions on EG units.
Triethylene glycol (TEG) units
b) Number of triethylene glycol (TEG) dehydration units you operate at plant by size:
Design Capacity and Actual Throughput Ranges
Number of TEG Units ≤ 3 million scf/d
3.01–10 million scf/d
10.01–50 million scf/d
> 50 million scf/d
Number of units with DesignCapacity in range
Number of units with ActualThroughput1 in range1 Annual average operating throughput for year 1995.

Page 4
c) Percentage of TEG dehydration units with both flash tanks (fuel economizers) and condensers
%
d) Percentage of TEG dehydration units with a flash tank, but no condenser %
e) Percentage of TEG dehydration units with a condenser, but no flash tank %
f) Percentage of TEG units with a condenser which:
Incinerates the offgas in a unit burner %
Flares the offgas %
g) Percentage of TEG units that route emissions to a flare without prior condensation %
Ethylene glycol (EG) units
h) Number of ethylene glycol (EG) dehydration units you operate at plant by size:
Design Capacity and Actual Throughput Ranges
Number of EG Units ≤ 10 million scf/d
10.01–100 million scf/d
100.01–500 million scf/d
> 500 million scf/d
Number of units with DesignCapacity in range
Number of units with ActualThroughput1 in range1 Annual average operating throughput for year 1995.
i) Percentage of EG dehydration units with condensers %
j) For EG units with condensers, percentage by vapor destination:
Percentage
Incineration (flare)
Return to process
Use as fuel
Vented to atmosphere
Other (please specify)
Total 100%

Page 5
Both triethylene glycol (TEG) and ethylene glycol (EG) units
k) Heat or fuel source for glycol reboiler, both TEG and EG units (percentage by source):
Wasteheat
Steam Hot Oil Natural gas Propane Other (specify) Total
TEG units% by fuel 100%
EG units% by fuel 100%
l) Size of firebox for glycol reboilers (TEG and EG units - number):
Firebox capacity Number of TEG units Number of EG units
< 10 Million Btu/hour
10-25 Million Btu/hour
>25 Million Btu/hour
m) Are emission controls installed on the glycol reboiler firebox? Yes No

Page 6
13. Gas Compressor Drivers
Gas compressors driven by engines or turbines compress the gas for processing or to prepare it for pipelinetransportation. Include only those engines 150 Hp or larger (continuous design-rated) operated by you. Includeany electric-powered motors that are used to drive compressors. Do not include any compressors that are part ofpipeline/transmission operations or field operations.Size and physical location of field compressor drivers may affect whether they are covered by certain airregulations in the future. Two locations are of interest:• Plant site – one or more compressors physically located within the plant.• Compressor site – one or more compressors located on a single pad or platform, operated and maintained by
the plant, but located away from the plant site.
a) Total number of gas compressor drivers (engines and turbines) larger than 150 continuous design-rated Hp operated by the plant (both plant and compressor sites). If zero, place a zero in the blankand proceed to question 14.
compressor drivers
b) Percentage and total horsepower of compressor drivers (engines and turbines) 150 Hp or larger byengine manufacturer:
Engine Manufacturer Waukesha Cooper-Bessemer
Clark IngersollRand
Ajax Other
% of compressor drivers
Total horsepower
c) Number, type, and fuel source for compressor drivers (engines) at plant sites:
Number of engines/motorsHorsepower(continuous
design-rating)
EngineType
Electricpoweredmotors
Rich1 burnengines
% rich burnw/ catalyticcontrols2
Lean3 burnengines
Clean4 burnengines
150-300 Hp 2-Stroke
4-Stroke
301-500 Hp 2-Stroke
4-Stroke
501-750 Hp 2-Stroke
4-Stroke
751-1,000 Hp 2-Stroke
4-Stroke
>1,000 Hp 2-Stroke
4-Stroke
Fuel Source5 electric1
Rich burn engines produce less than 4% oxygen in their exhaust. The manufacturer's original recommendedoperating air-fuel ratio divided by the stoichiometric air/fuel ratio is less than or equal to 1.1. Most 4-stroke enginesinstalled prior to 1982 are rich burn engines.
2Include the percentage of your rich burn engines that have had catalytic controls installed.
3A lean burn engine produces greater than 4% oxygen in its exhaust. All 2-stroke engines are lean burn, along withsome 4-stroke engines.
4Clean burn engines are engines (typically 4-stroke) that have had the cylinder heads, combustion chamber, orother parts modified so that the engine is a low NOx emitter without catalytic controls.
5Natural gas, diesel, gasoline, propane, or other (please specify).

Page 7
d) Number of compressor sites with one compressor sites
e) Number of compressor sites with more than one compressor sites
f) Number, type, and fuel source for compressor drivers (engines) at compressor sites:
Number of engines/motorsHorsepower(continuous
design-rating)
EngineType
Electricpoweredmotors
Rich1 burnengines
% rich burnw/ catalyticcontrols2
Lean3 burnengines
Clean4
burnengines
150-300 Hp 2-Stroke
4-Stroke
301-500 Hp 2-Stroke
4-Stroke
501-750 Hp 2-Stroke
4-Stroke
751-1,000 Hp 2-Stroke
4-Stroke
>1,000 Hp 2-Stroke
4-Stroke
Fuel Source5 electric
For footnotes, see table above.
g) Number, size, location, and fuel source of turbines to drive compressors:
Location
Turbine Size Plant Site Compressor Site
< 1,000 Hp
1,000-5,000 Hp
5,001-15,000 Hp
15,001-25,000 Hp
> 25,000 Hp
Fuel Source 1
1 Natural gas, diesel, gasoline, propane, or other (please specify).
h) Estimated average BTU content of natural gas used for fuel BTU/scf

Page 8
14. Internal Combustion Engines and Turbines
Please include all types of stationary internal combustion engines and turbines, including drivers for pumps,generators, and other equipment not included in question 13 above. Do not include engines on mobile sources(trucks, etc.)
a) Number of stationary internal combustion engines of 150 horsepower or larger (excludingcompressor drivers) you operate in this plant by size:
Number of enginesHorsepower(continuous
design-rating)
EngineType Rich1 burn
engines
% rich burnw/ catalyticcontrols2
Lean3 burnengines
Clean4 burnengines
150-300 Hp 2-Stroke
4-Stroke
301-500 Hp 2-Stroke
4-Stroke
501-750 Hp 2-Stroke
4-Stroke
751-1,000 Hp 2-Stroke
4-Stroke
>1,000 Hp 2-Stroke
4-Stroke
Fuel Source5
1Rich burn engines produce less than 4% oxygen in their exhaust. The manufacturer's originalrecommended operating air-fuel ratio divided by the stoichiometric air/fuel ratio is less than or equal to 1.1. Most 4-stroke engines installed prior to 1982 are rich burn engines.
2Include the percentage of your rich burn engines that have had catalytic controls installed.
3A lean burn engine produces greater than 4% oxygen in its exhaust. All 2-stroke engines are lean burn,along with some 4-stroke engines.
4Clean burn engines are engines (typically 4-stroke) that have had the cylinder heads, combustionchamber, or other parts modified so that the engine is a low NOx emitter without catalytic controls.
5Natural gas, diesel, gasoline, propane, or other (please specify).
b) Percentage and total horsepower of engines and turbines (excluding compressor drivers) 150 Hp orlarger by engine manufacturer:
Engine Manufacturer Waukesha Cooper-Bessemer
Clark IngersollRand
Ajax Other
% of compressor drivers
Total horsepower

Page 9
c) Number, size, and fuel source of turbines (excluding compressor drivers):
Turbine Size Number of Turbines
< 1,000 Hp
1,000-5,000 Hp
5,001-15,000 Hp
15,001-25,000 Hp
> 25,000 Hp
Fuel Source1
1 Natural gas, diesel, gasoline, propane, or other (please specify).
15. Heaters and Boilers
a) Total number of heaters with maximum rated heat input capacity of 10 million Btu/hour or moreoperated at the plant:If zero, place a zero in the table and proceed to question 15b.
Heater capacity Number of Heaters
10-25 million Btu/hour
26-50 million Btu/hour
51-75 million Btu/hour
76-100 million Btu/hour
> 100 million Btu/hour
b) Total number of boilers (other than glycol reboilers) with maximum rated heat input capacit y of 10million Btu/hour or more operated at the plant:If zero, place a zero in the table and proceed to question 16.
Boiler capacity Number of Boilers
10-50 million Btu/hour
51-100 million Btu/hour
101-150 million Btu/hour
> 150 million Btu/hour
c) Fuel used for heaters and boilers:
Natural gas Diesel Propane Other (please specify) Total
Percentage of BTUsgenerated using
100%

Page 10
d) Percentage of heaters and boilers with controls:
Control Heaters using control (%) Boilers using control (%)
No controls installed
SO2 scrubber1
Low NOx burner2
Selective catalytic reduction (SCR) 3
Selective non-catalytic reduction (SNCR)4
Flue gas recirculation5
Other (please specify)*
Total 100% 100%1
SO2 scrubbers are generally “wet scrubbers” that bring the SO2-laden flue gases into contact with a liquid thatselectively reacts with the SO 2.
2Low NOx burners generally incorporate the principles of delayed fuel-air mixing, oxygen-deficient zones for initialcombustion, lower flame turbulence, and lower flame temperatures.
3SCR involves the use of ammonia and catalysts at a temperature of around 700 οF to reduce NOx to H20 and N2.
4SNCR involves the injection of ammonia at a temperature of around 1,750 oF, which reacts with NO to form H20 and N2
.
5Recycling a portion of the flue gases back into the combustion zone can reduce both the flame temperature and theoxygen concentration, thus lowering NOx emissions.
e) Based on currently installed control equipment, estimated control efficiency for various pollutantsfrom heaters and boilers:
Pollutant SO2 NOx CO VOCs PM-10
Heater control efficiency (%)
Boiler control efficiency (%)
16. Pneumatic Devices
a) Percentage of pneumatic devices for control valve operation by type:
Instrument Air Instrument Gas* Other Total
Percentage by type 100%* Use of natural gas to control the valve.
17. Emissions Inventory
If one is readily available, please enclose a copy of the emissions inventory for this plant.
This information will be treated as confidential. Availability of emission inventories may provide additionaldata/insights to assist in response to future rulemakings, since they provide more data than it is feasibleto request as part of this survey.
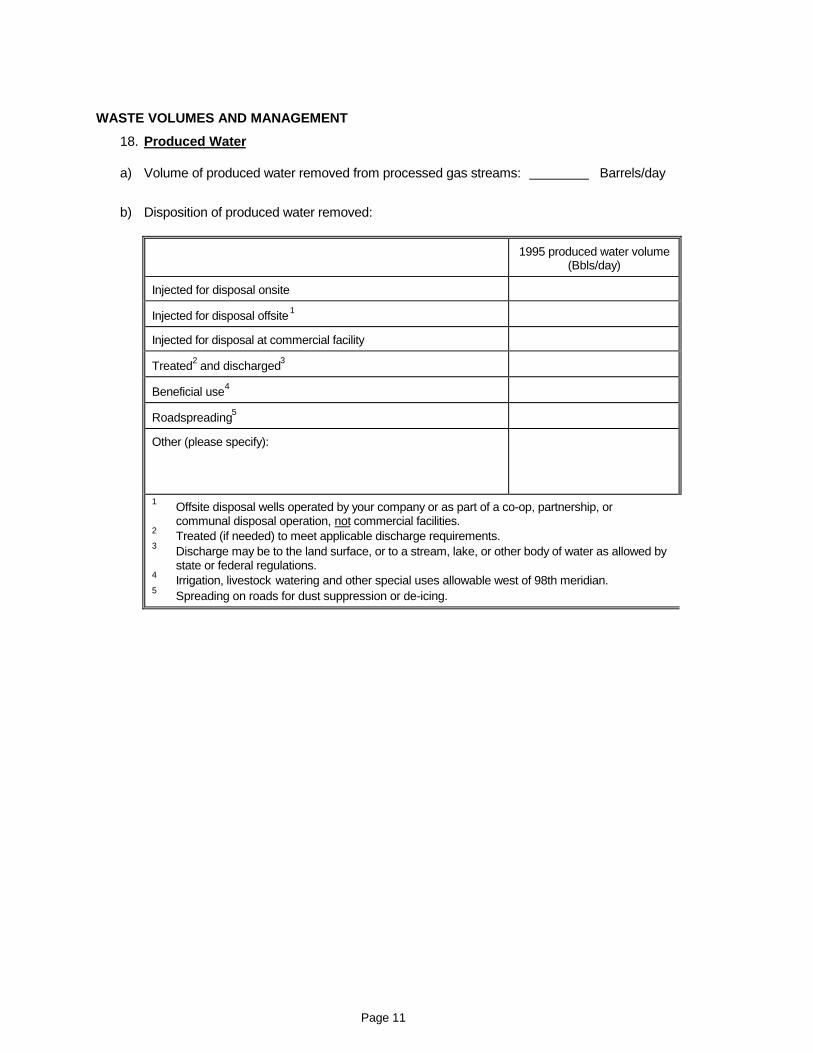
Page 11
WASTE VOLUMES AND MANAGEMENT
18. Produced Water
a) Volume of produced water removed from processed gas streams: Barrels/day
b) Disposition of produced water removed:
1995 produced water volume(Bbls/day)
Injected for disposal onsite
Injected for disposal offsite1
Injected for disposal at commercial facility
Treated2 and discharged3
Beneficial use4
Roadspreading5
Other (please specify):
1 Offsite disposal wells operated by your company or as part of a co-op, partnership, orcommunal disposal operation, not commercial facilities.
2 Treated (if needed) to meet applicable discharge requirements.3 Discharge may be to the land surface, or to a stream, lake, or other body of water as allowed by
state or federal regulations.4 Irrigation, livestock watering and other special uses allowable west of 98th meridian.5 Spreading on roads for dust suppression or de-icing.

Page 12
19. Dehydration/Sweetening Wastes
Dehydration and sweetening wastes are typically exempt from regulation as hazardous wastes under the ResourceConservation and Recovery Act. Exempted wastes include: glycol-based compounds, glycol filters, molecularsieves, amines, amine filters, precipitated amine sludge, iron sponge, scrubber liquids and sludge, backwash, filtermedia, and other wastes associated with the dehydration or sweetening of natural gas.
a) Volume of selected dehydration/sweetening waste streams managed during 1995:
Waste stream1 Units Estimated volume
Spent glycol/glycol compounds Barrels/Year
Used filters/filter media Pounds/Year
Scrubber liquids and sludge Barrels/Year
All other dehydration/sweetening wastes Barrels/Year1 Please provide a breakdown where possible. If separate estimates for each waste stream are not
feasible, please provide estimated total waste volume in the category for “all other dehydration/sweetening wastes,” and write “included below” in the column for volume of the other waste streams.
20. Dehydration/Sweetening Waste Disposal
a) Disposal of dehydration/sweetening waste streams by method:
Please fill in the percentage of each waste stream disposed by each method listed at left. The percentages ineach column should add to 100%.
Spent glycol/glycol
compounds
Usedfilters/filter
media
Scrubberliquids and
sludge
All otherdehydration/
sweetening wastes
Disposal by injection
Landspreading onsite
Roadspreading onsite
Commercial NOW1 disposal
Industrial or municipal landfill
Recycling/beneficial reuse
Incinerated
Evaporated from pits or tanks
Other (specify):
TOTAL 100% 100% 100% 100%1 Non-hazardous oilfield waste commercial disposal contractor.

Thank you for your assistance with this important survey.
The information provided will help educate policy-makers about currentpractices within the oil and gas industry.
Please return the completed survey form to:
Amita GopinathStatistical Services DivisionAmerican Petroleum Institute1220 L Street N.W.Washington, DC 20005
Please include a copy of your emissions inventory for this plant, if available.
For questions about completing the survey, please call (703) 934-3675 and leavea detailed message. Someone knowledgeable in the subject area of your questionwill return your call as soon as possible.