Embed Size (px)
DESCRIPTION
EALAW Conference 29 th March 2011 Newport Minority Ethnic Achievement: Myth or Miracle? What do the statistics for Wales tell us about Race Equality in schools? Dr. Jonathan Brentnall. 1. Big Picture. Context. Inform work with individuals. In the stats – every child matters. - PowerPoint PPT Presentation
Citation preview

EALAW Conference29th March 2011
Newport
Minority Ethnic Achievement: Myth or Miracle?
What do the statistics for Wales tell us about Race Equality in schools?
Dr. Jonathan Brentnall
1. Big PictureContext
Inform work with individuals
In the stats – every child matters
At a social level – every child matters
Statistics influence expectations – use them carefully
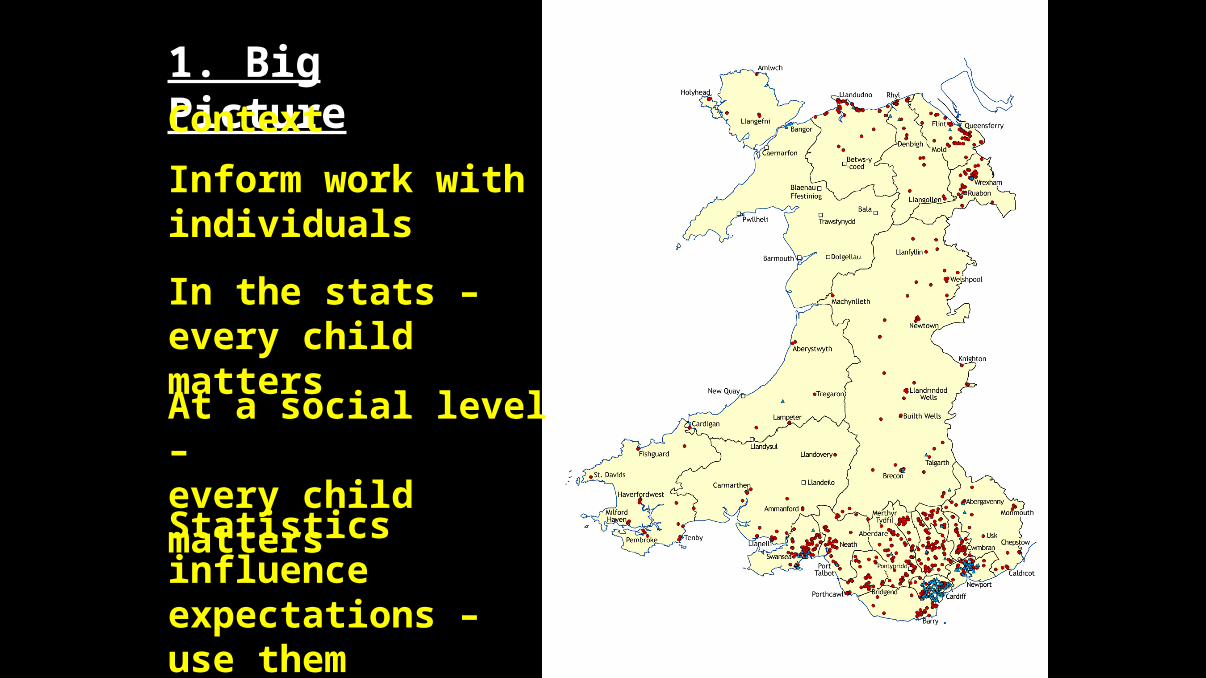
2. Potential v Attainment
Grouped attainment statistics are NOT a measurement of POTENTIAL (group or individual)
Only tell you what pupils ATTAINED measured against a particular level at a certain time – not what they’re CAPABLE of
3. Achievement v Attainment
A child may ACHIEVE much but NOT ATTAIN a set target level
A child may make great progress but still not ATTAIN the level of their peers
4. Assessments contain bias
Socially constructed
Culturally framed
Biased towards those who share a similar social and cultural framework of experience
Certain kinds of knowledge, understanding and skills are valued more than others
Built-in disadvantage for some
5. Working within the system
Curriculum & testing need to be addressed at a political, policy level
Some room for professional discretion
Tacit acceptance of working within the statutory framework
Ultimately – children & people are judged by their level of success in the education system – as it is
6. Racial/ethnic differences or inequalities?
Gender pay gap = Unequal Pay
Underlying principle – men and women are equal
All equal – equal entitlements – equal opportunities – equal access – equal outcomes
Different educational/assessment outcomes impact on …
further & higher education uptake, career options, earnings, social mobility, quality of life …
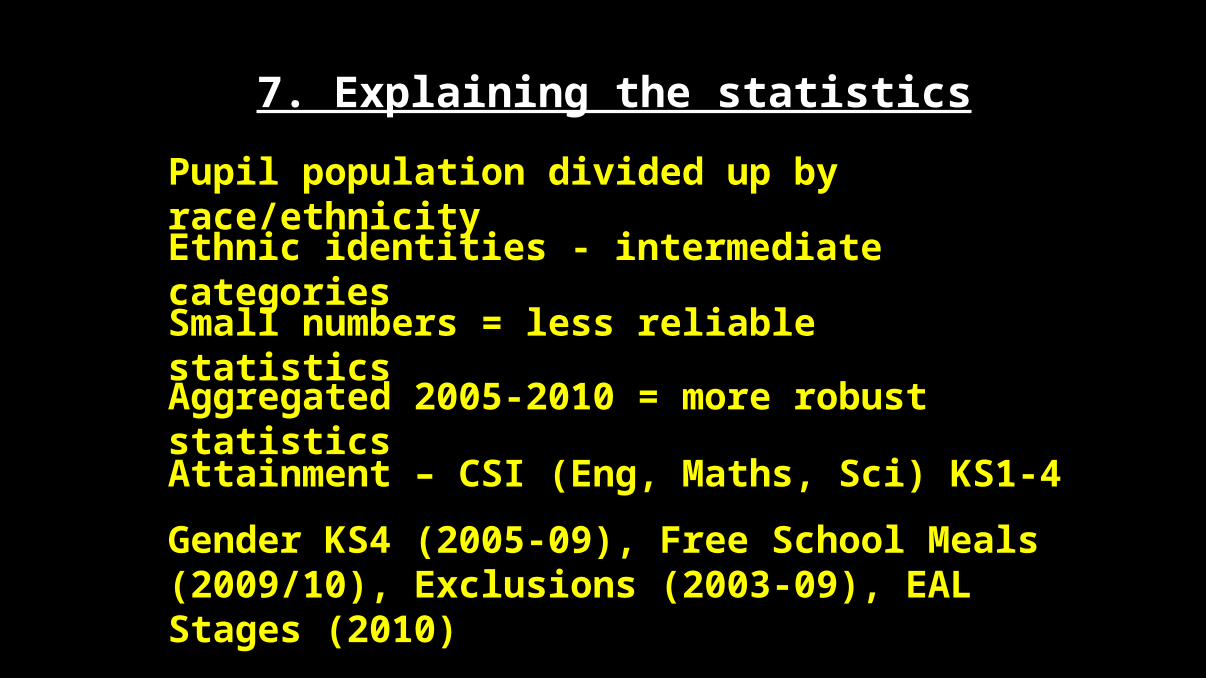
7. Explaining the statistics
Pupil population divided up by race/ethnicity
Ethnic identities - intermediate categories
Small numbers = less reliable statistics
Aggregated 2005-2010 = more robust statistics
Attainment – CSI (Eng, Maths, Sci) KS1-4
Gender KS4 (2005-09), Free School Meals (2009/10), Exclusions (2003-09), EAL Stages (2010)
€ €
€
€
€
€
€€
€ €
€ € €
€
€ €
€ €
€
€
€ €
€
€ € € €
€ €
€ €
€
€€€
€
€€
€€
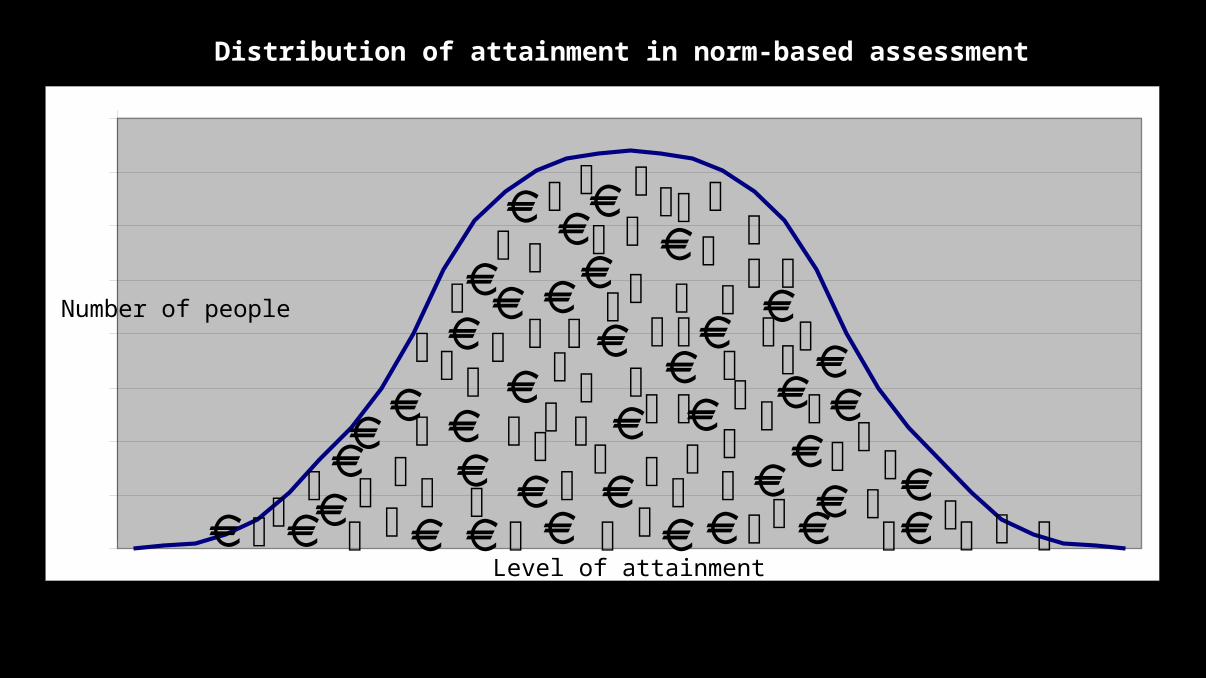
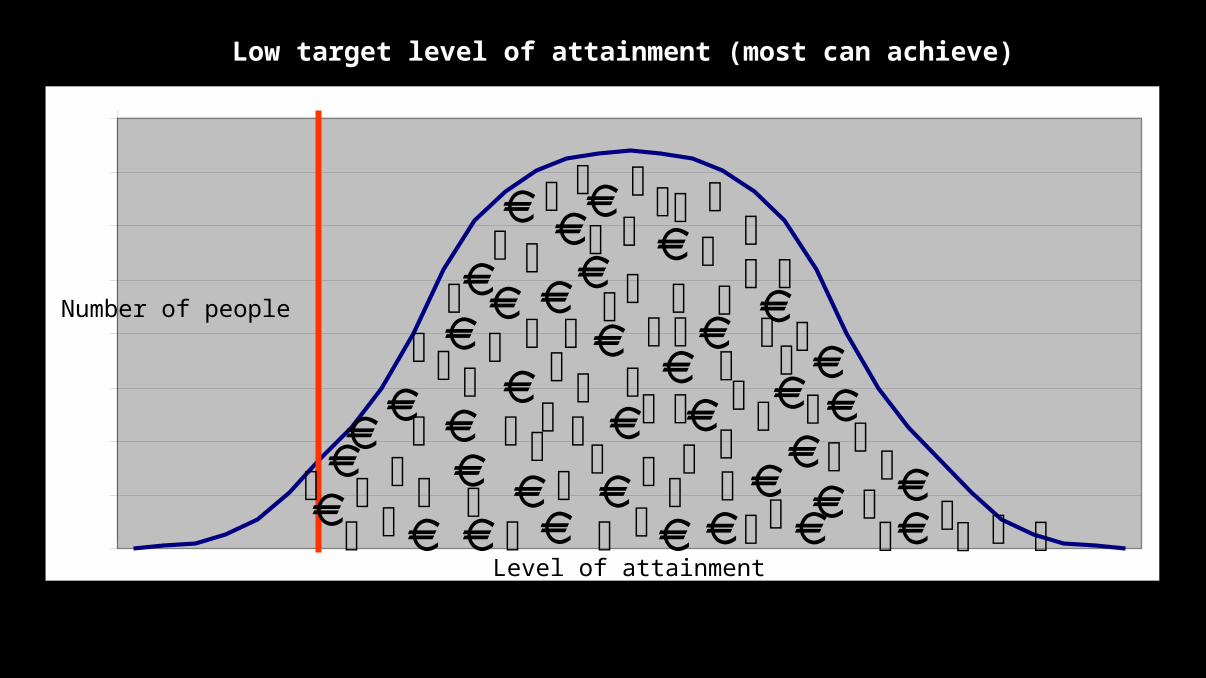
Distribution of attainment in norm-based assessment
Level of attainment
Number of people
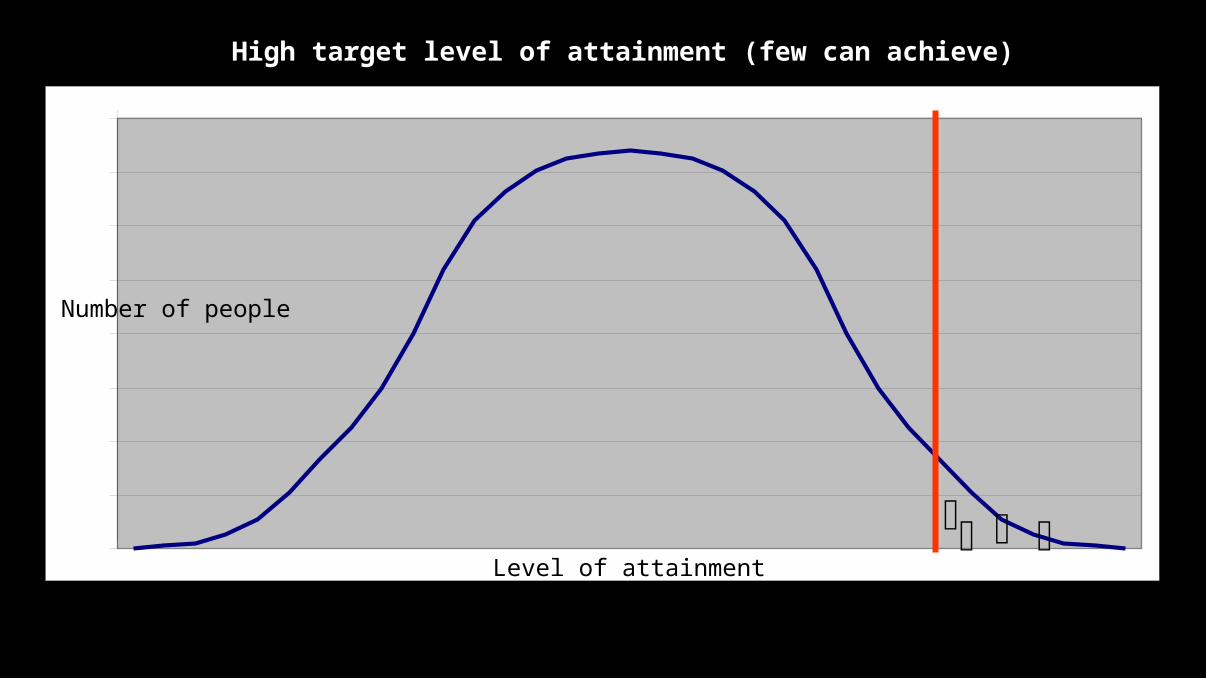
High target level of attainment (few can achieve)
Level of attainment
Number of people
€
€
€
€
€ €
€ €
€
€
€
€
€
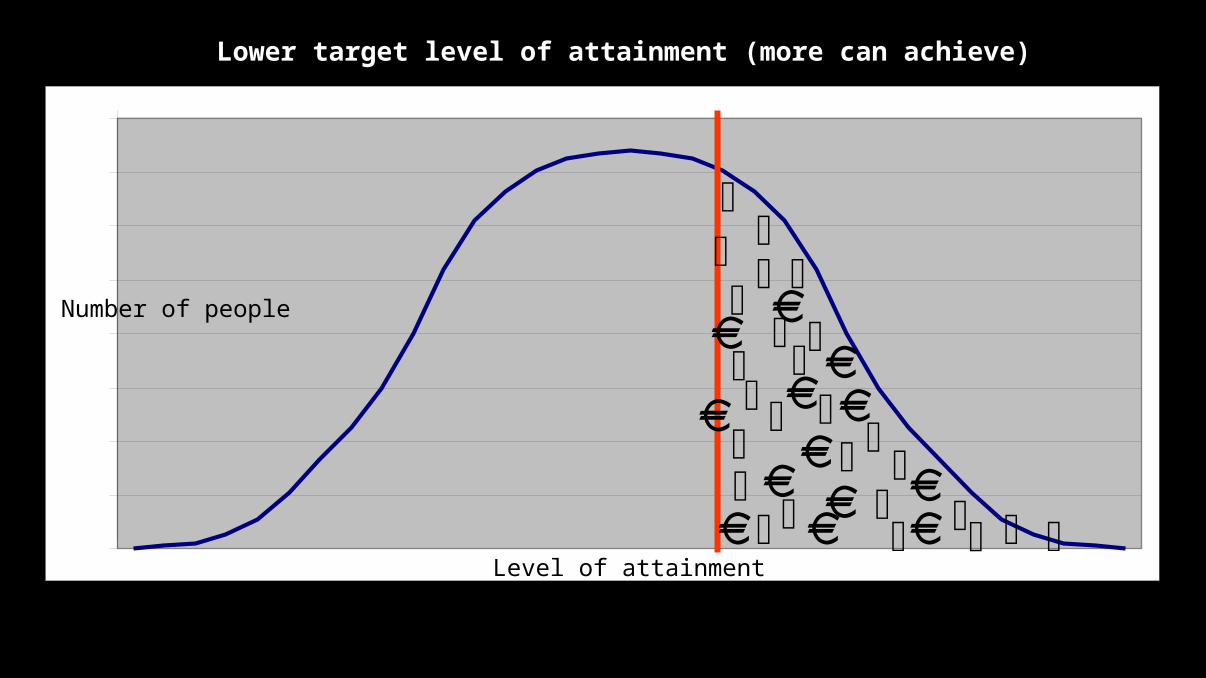
Lower target level of attainment (more can achieve)
Level of attainment
Number of people
€ € €
€
€
€
€€
€ €
€
€ €
€
€
€ €
€ € € €
€€€
€
€
€
€
€
€ €
€ €
€
€
€
€
€
Low target level of attainment (most can achieve)
Level of attainment
Number of people
€€€
€
€
€
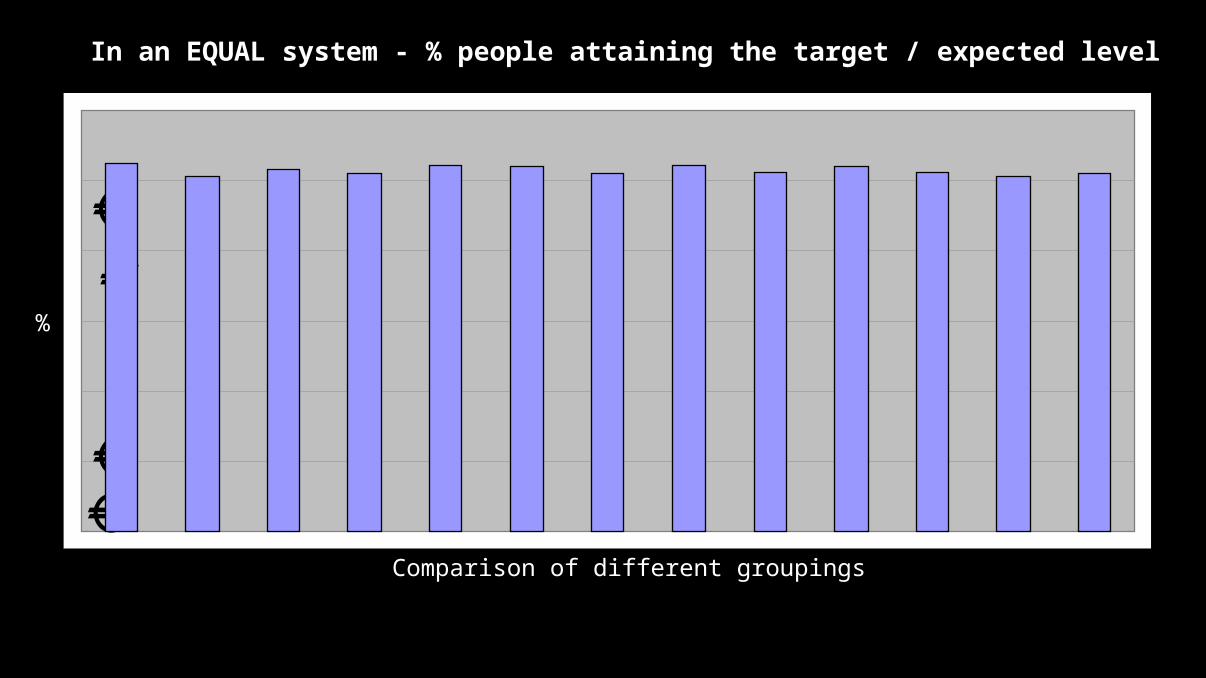
In an EQUAL system - % people attaining the target / expected level
Comparison of different groupings
%
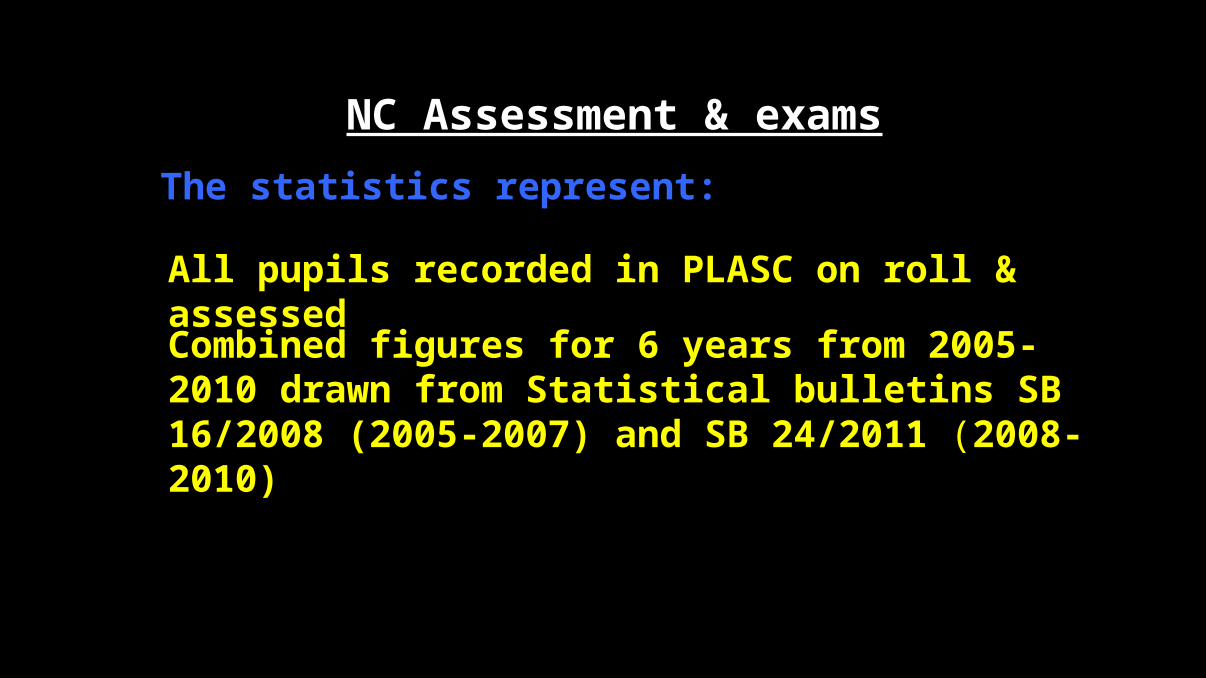
NC Assessment & exams
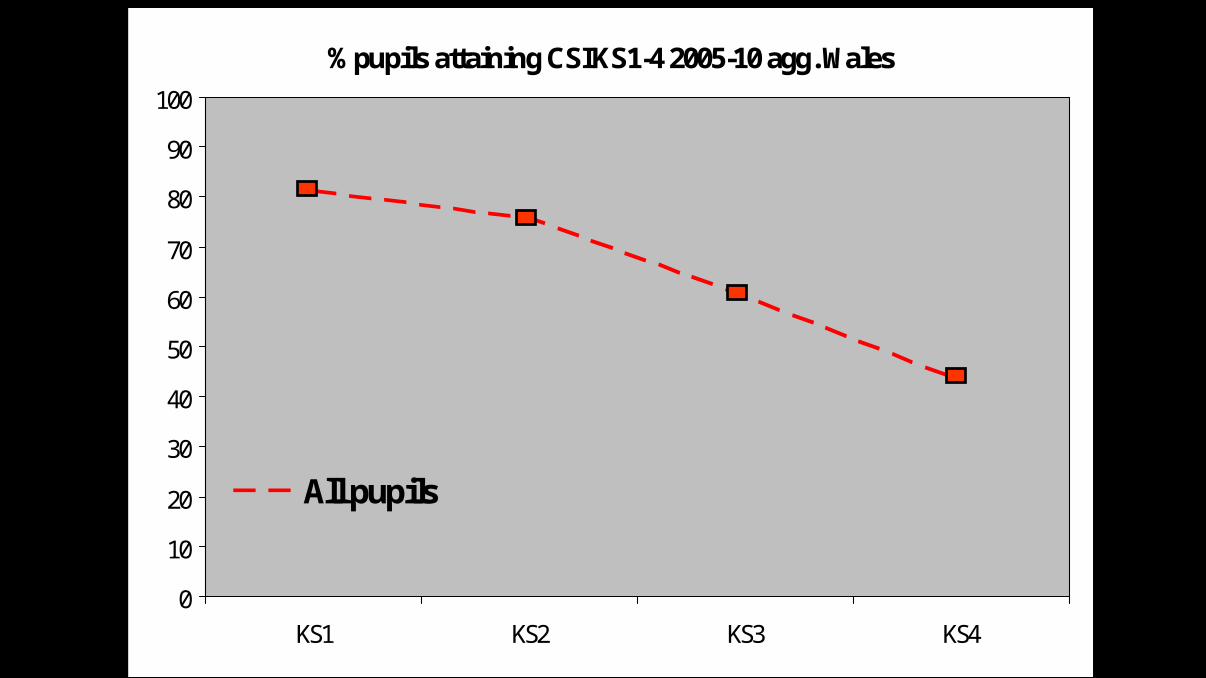
The statistics represent:
All pupils recorded in PLASC on roll & assessed
Combined figures for 6 years from 2005-2010 drawn from Statistical bulletins SB 16/2008 (2005-2007) and SB 24/2011 (2008-2010)
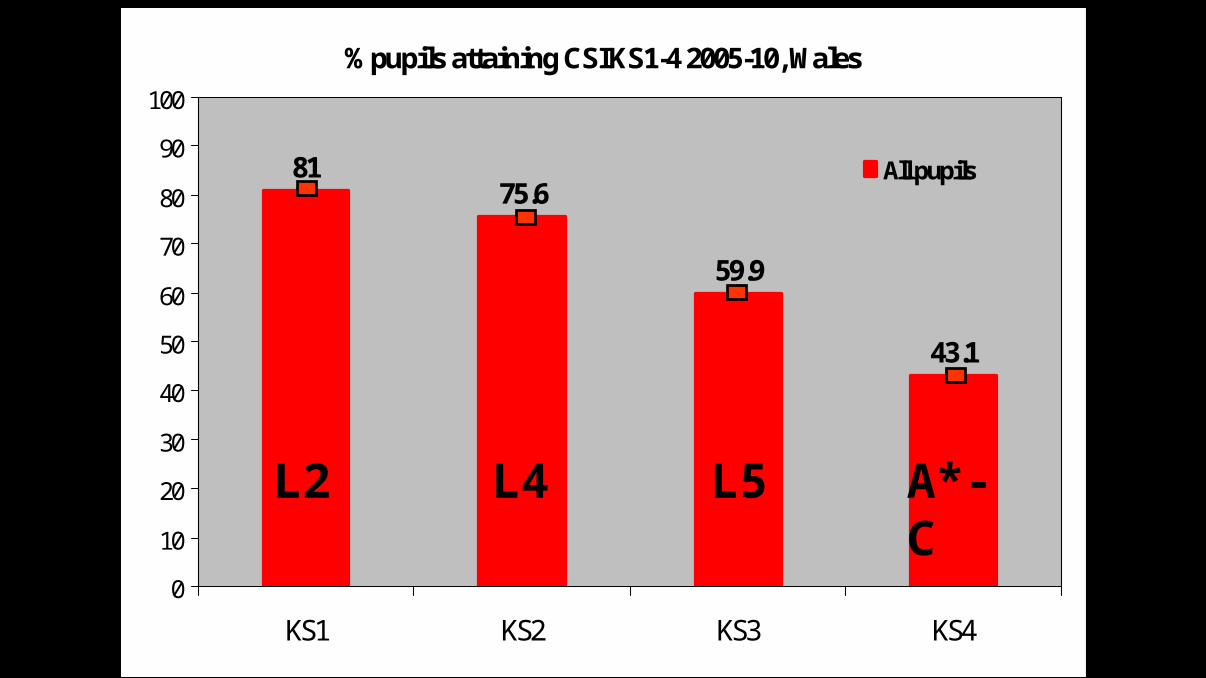
% pupils attaining CSI KS1-4 2005-10, Wales
8175.6
59.9
43.1
0
10
20
30
40
50
60
70
80
90
100
KS1 KS2 KS3 KS4
All pupils
L2 L4 L5 A*-C
% pupils attaining CSI KS1-4 2005-10 agg. Wales
0
10
20
30
40
50
60
70
80
90
100
KS1 KS2 KS3 KS4
All pupils
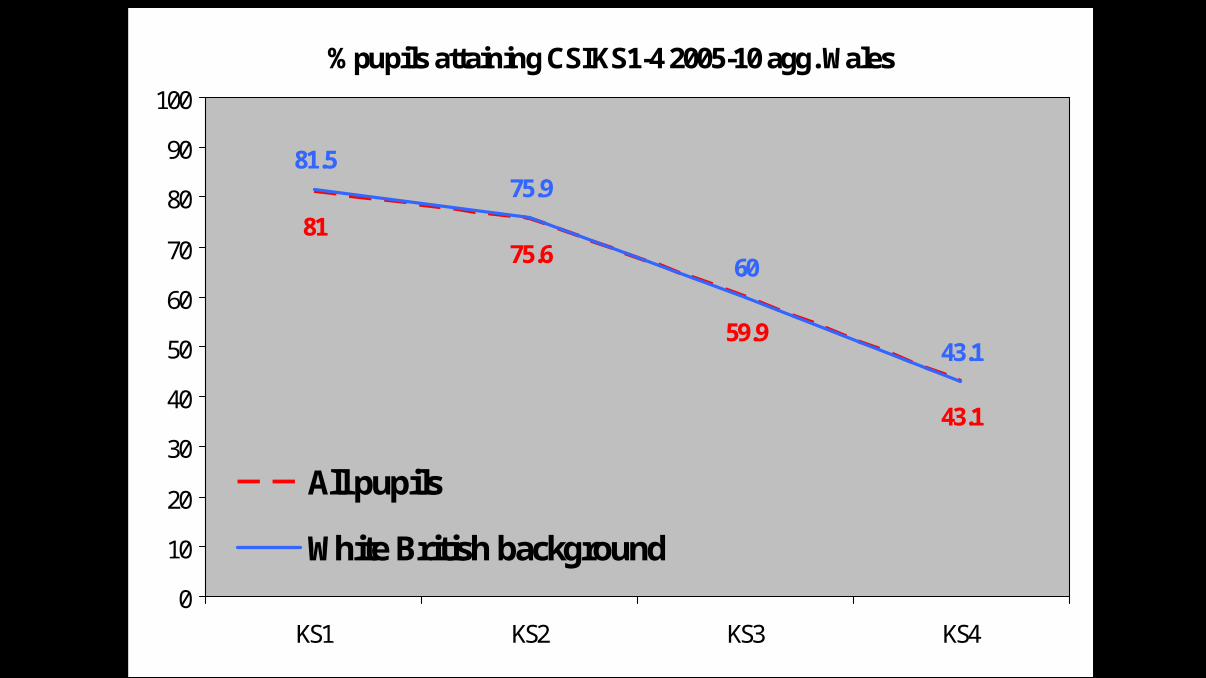
% pupils attaining CSI KS1-4 2005-10 agg. Wales
8175.6
59.9
43.1
81.575.9
60
43.1
0
10
20
30
40
50
60
70
80
90
100
KS1 KS2 KS3 KS4
All pupils
White British background
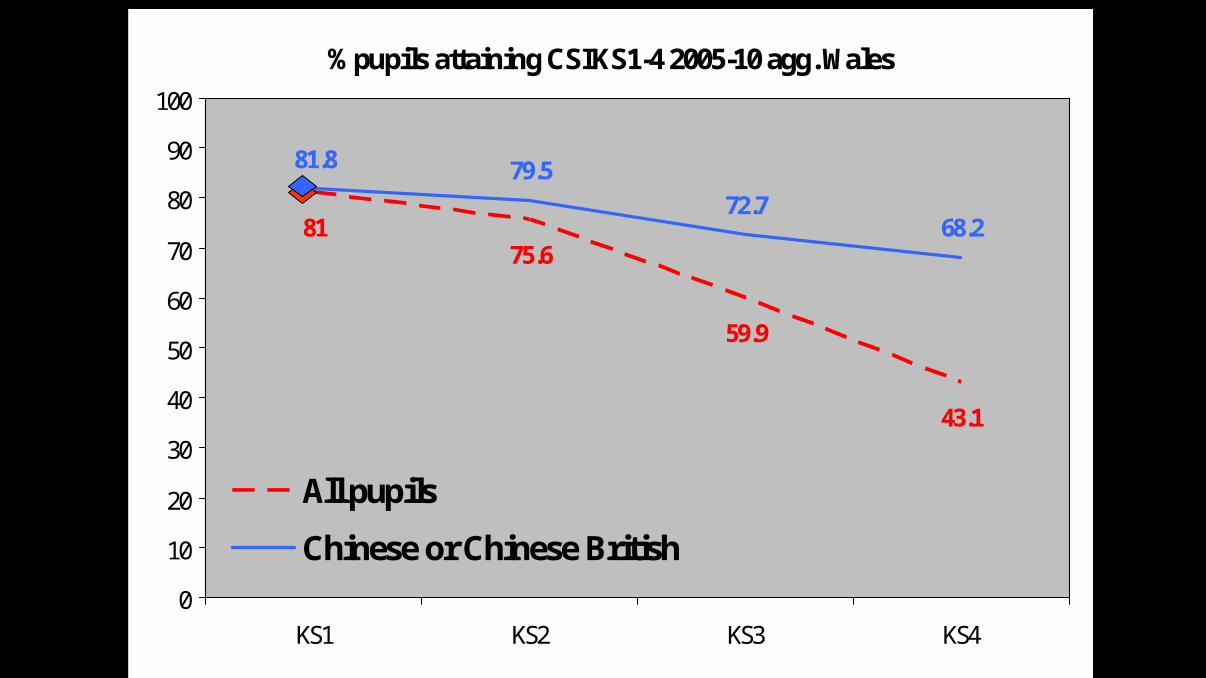
% pupils attaining CSI KS1-4 2005-10 agg. Wales
8175.6
59.9
43.1
81.8 79.5
72.768.2
0
10
20
30
40
50
60
70
80
90
100
KS1 KS2 KS3 KS4
All pupils
Chinese or Chinese British
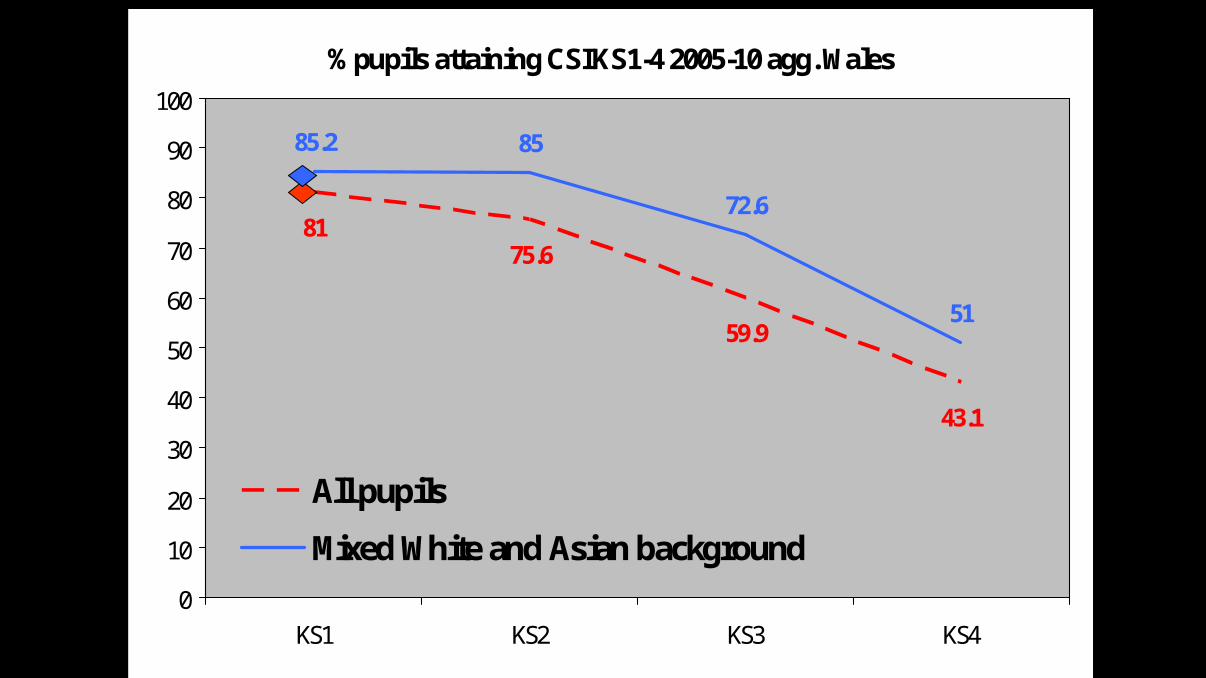
% pupils attaining CSI KS1-4 2005-10 agg. Wales
8175.6
59.9
43.1
85.2 85
72.6
51
0
10
20
30
40
50
60
70
80
90
100
KS1 KS2 KS3 KS4
All pupils
Mixed White and Asian background
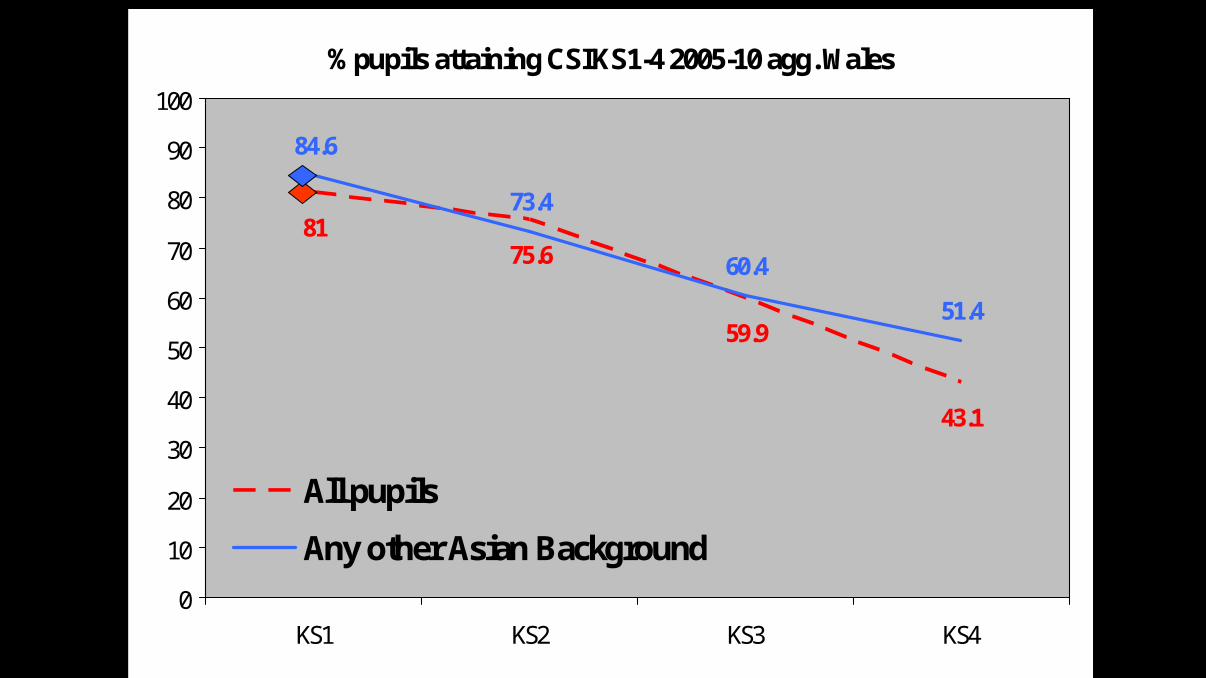
% pupils attaining CSI KS1-4 2005-10 agg. Wales
8175.6
59.9
43.1
84.6
73.4
60.4
51.4
0
10
20
30
40
50
60
70
80
90
100
KS1 KS2 KS3 KS4
All pupils
Any other Asian Background
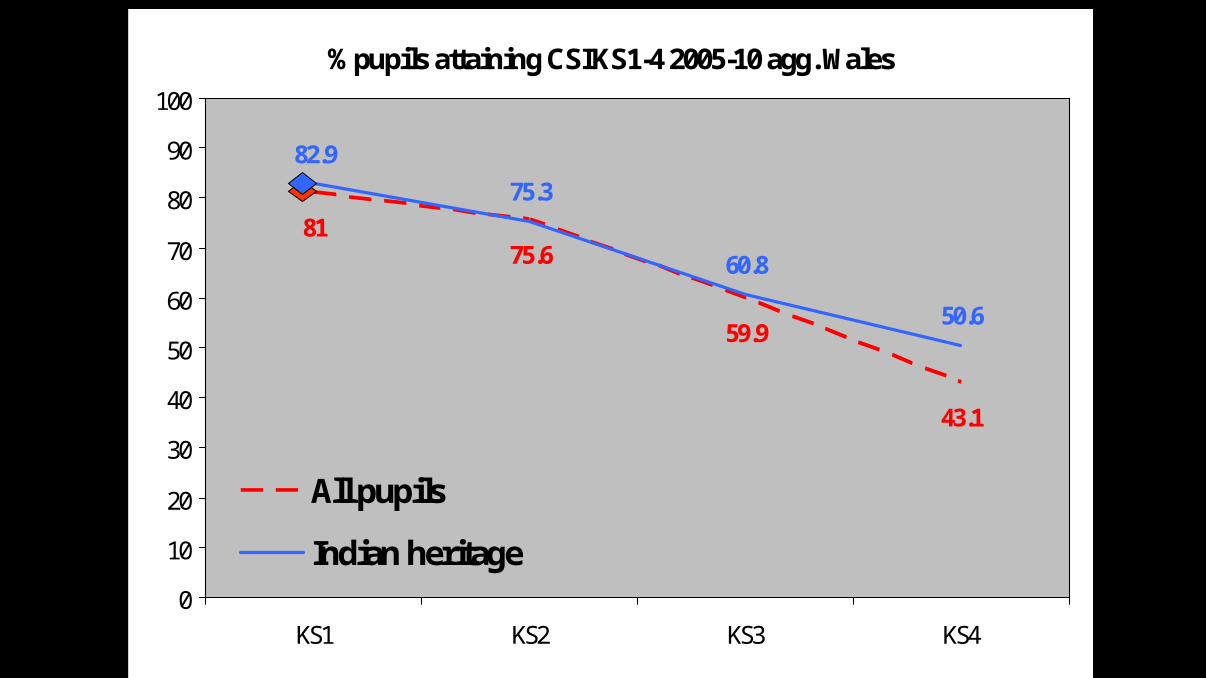
% pupils attaining CSI KS1-4 2005-10 agg. Wales
8175.6
59.9
43.1
82.9
75.3
60.8
50.6
0
10
20
30
40
50
60
70
80
90
100
KS1 KS2 KS3 KS4
All pupils
Indian heritage
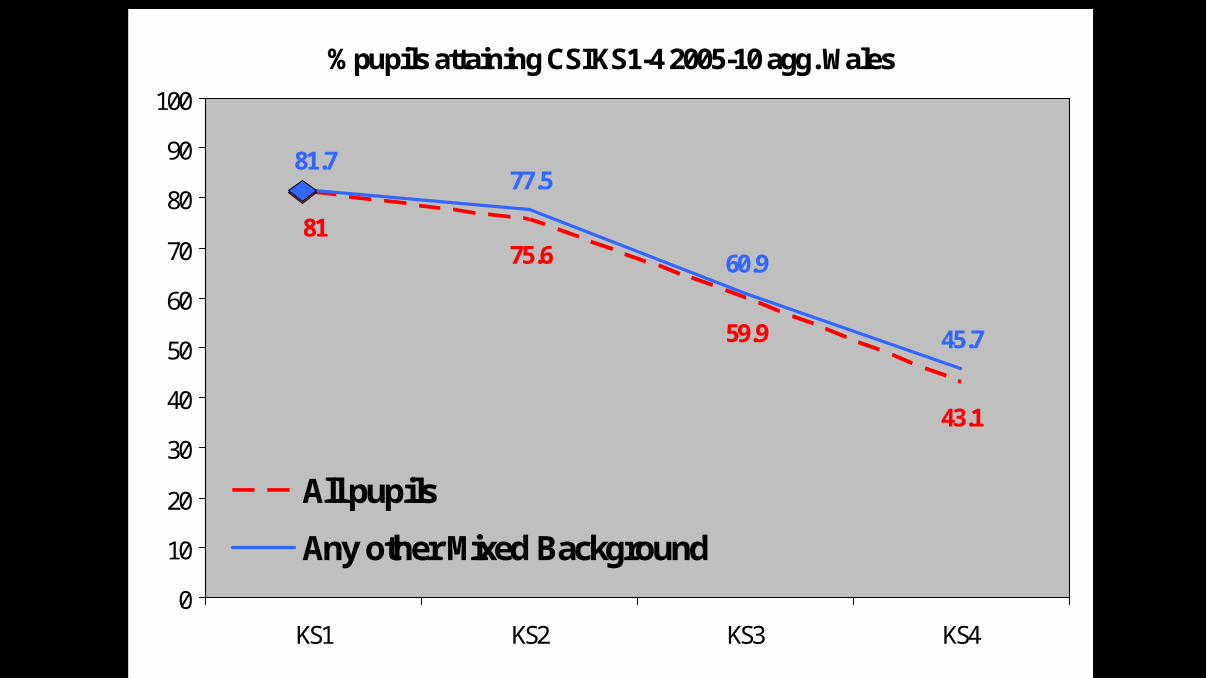
% pupils attaining CSI KS1-4 2005-10 agg. Wales
8175.6
59.9
43.1
81.777.5
60.9
45.7
0
10
20
30
40
50
60
70
80
90
100
KS1 KS2 KS3 KS4
All pupils
Any other Mixed Background
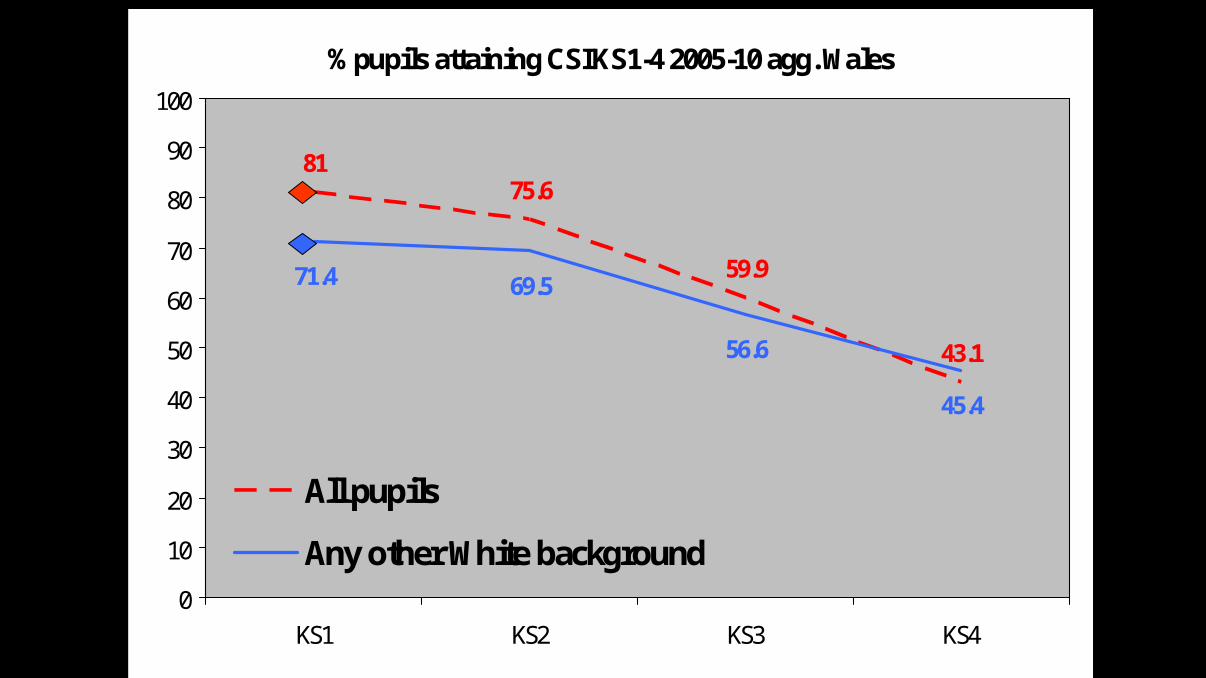
% pupils attaining CSI KS1-4 2005-10 agg. Wales
8175.6
59.9
43.1
71.4 69.5
56.6
45.4
0
10
20
30
40
50
60
70
80
90
100
KS1 KS2 KS3 KS4
All pupils
Any other White background
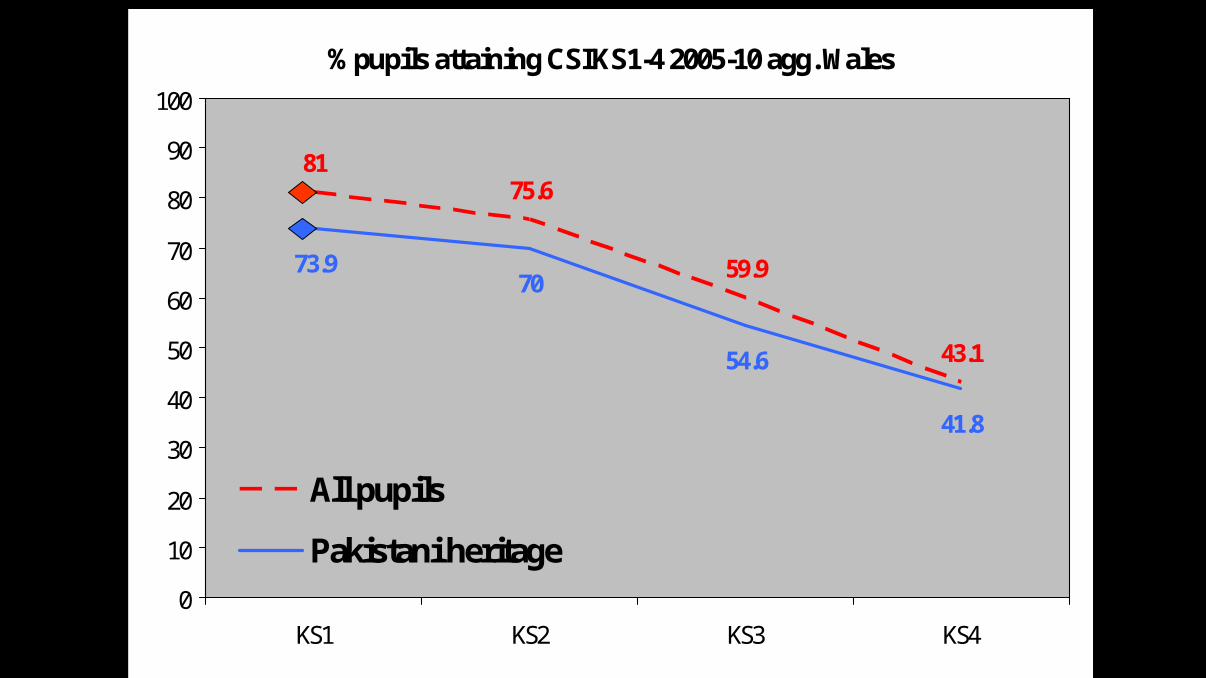
% pupils attaining CSI KS1-4 2005-10 agg. Wales
8175.6
59.9
43.1
73.970
54.6
41.8
0
10
20
30
40
50
60
70
80
90
100
KS1 KS2 KS3 KS4
All pupils
Pakistani heritage
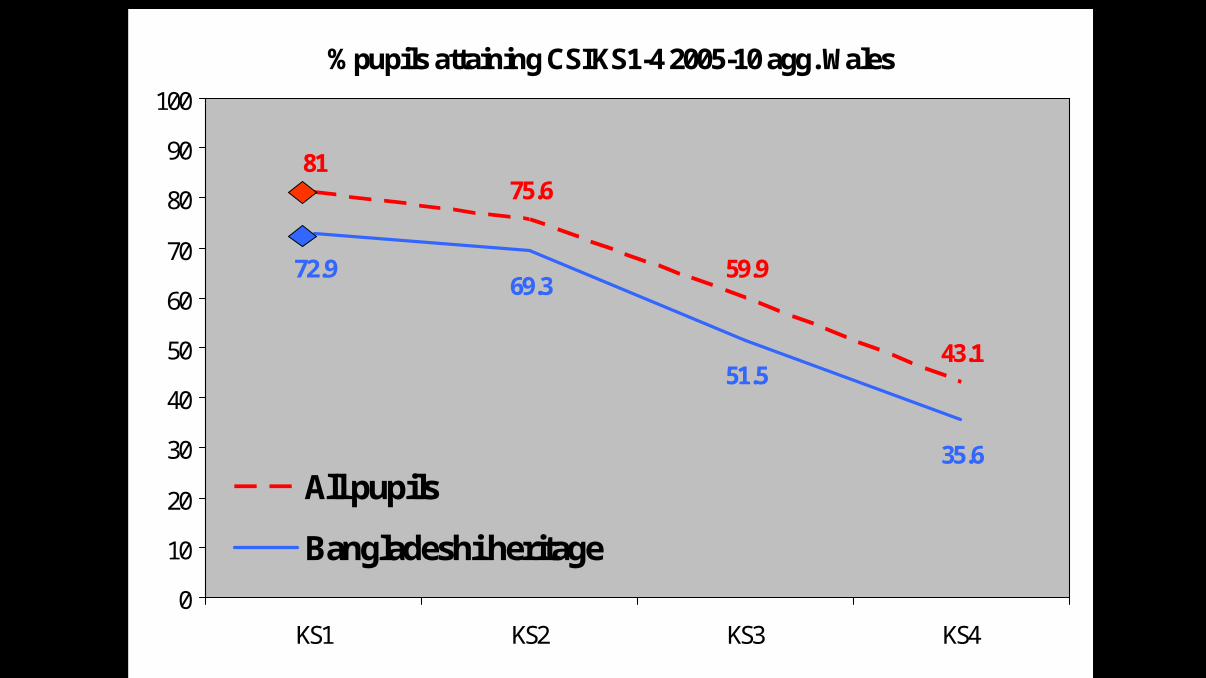
% pupils attaining CSI KS1-4 2005-10 agg. Wales
8175.6
59.9
43.1
72.969.3
51.5
35.6
0
10
20
30
40
50
60
70
80
90
100
KS1 KS2 KS3 KS4
All pupils
Bangladeshi heritage
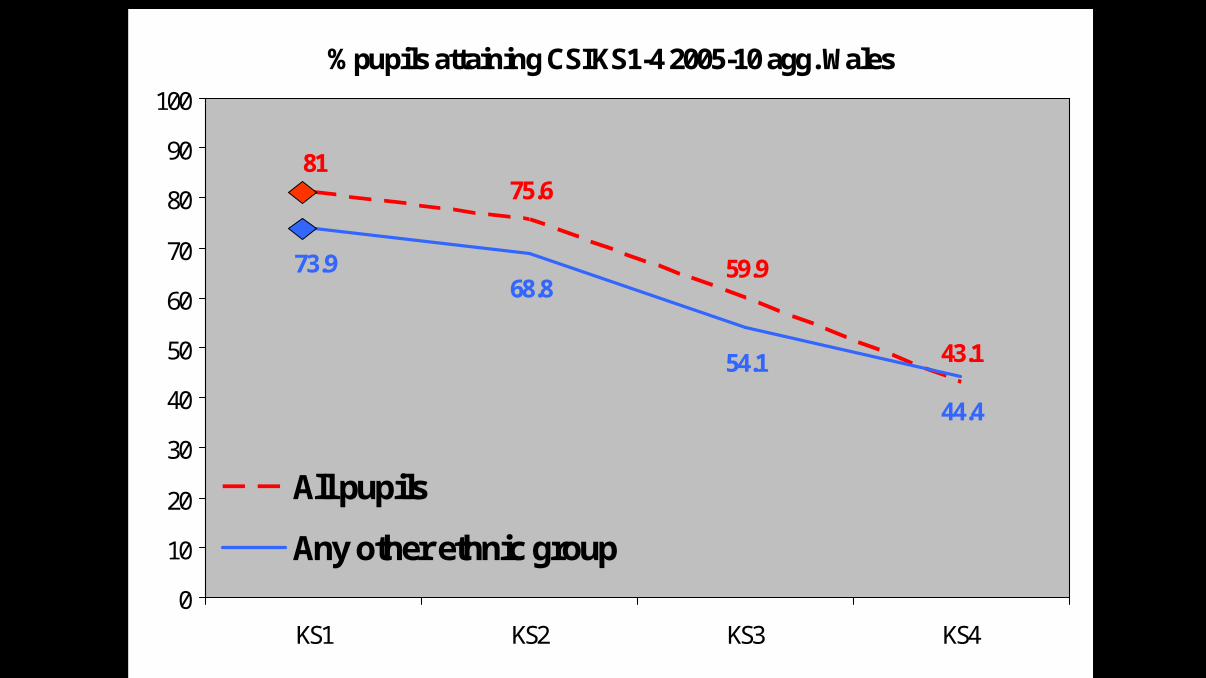
% pupils attaining CSI KS1-4 2005-10 agg. Wales
8175.6
59.9
43.1
73.968.8
54.1
44.4
0
10
20
30
40
50
60
70
80
90
100
KS1 KS2 KS3 KS4
All pupils
Any other ethnic group
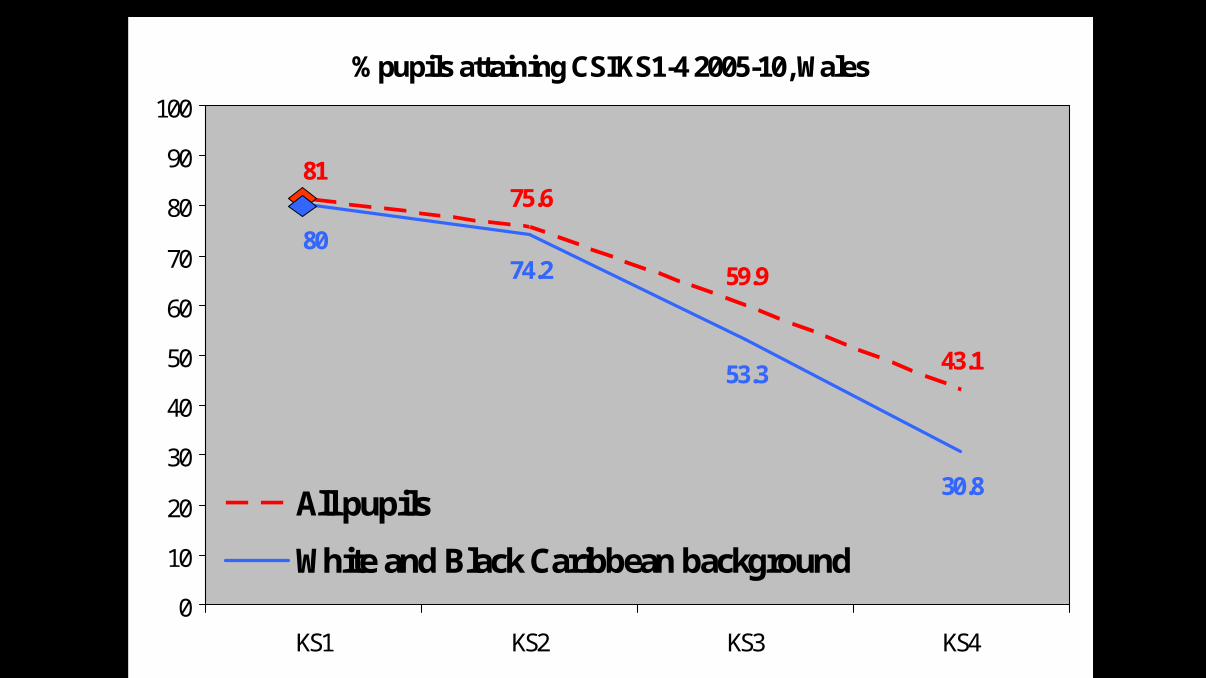
% pupils attaining CSI KS1-4 2005-10, Wales
8175.6
59.9
43.1
8074.2
53.3
30.8
0
10
20
30
40
50
60
70
80
90
100
KS1 KS2 KS3 KS4
All pupils
White and Black Caribbean background
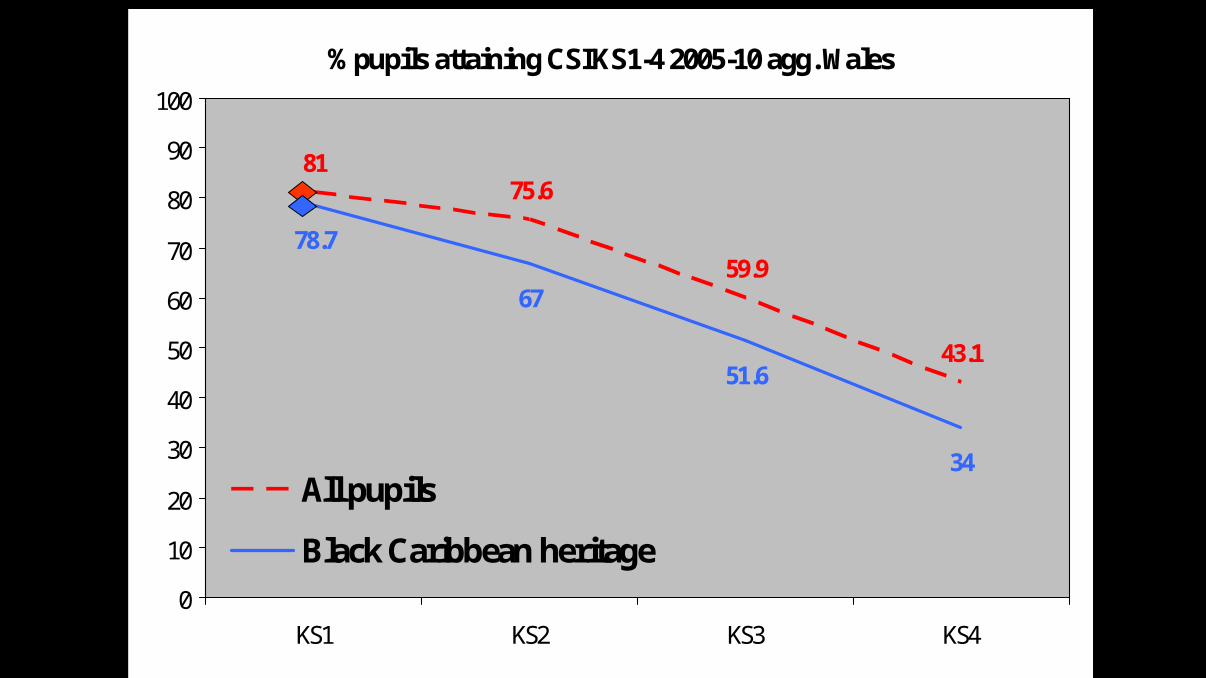
% pupils attaining CSI KS1-4 2005-10 agg. Wales
8175.6
59.9
43.1
78.7
67
51.6
34
0
10
20
30
40
50
60
70
80
90
100
KS1 KS2 KS3 KS4
All pupils
Black Caribbean heritage
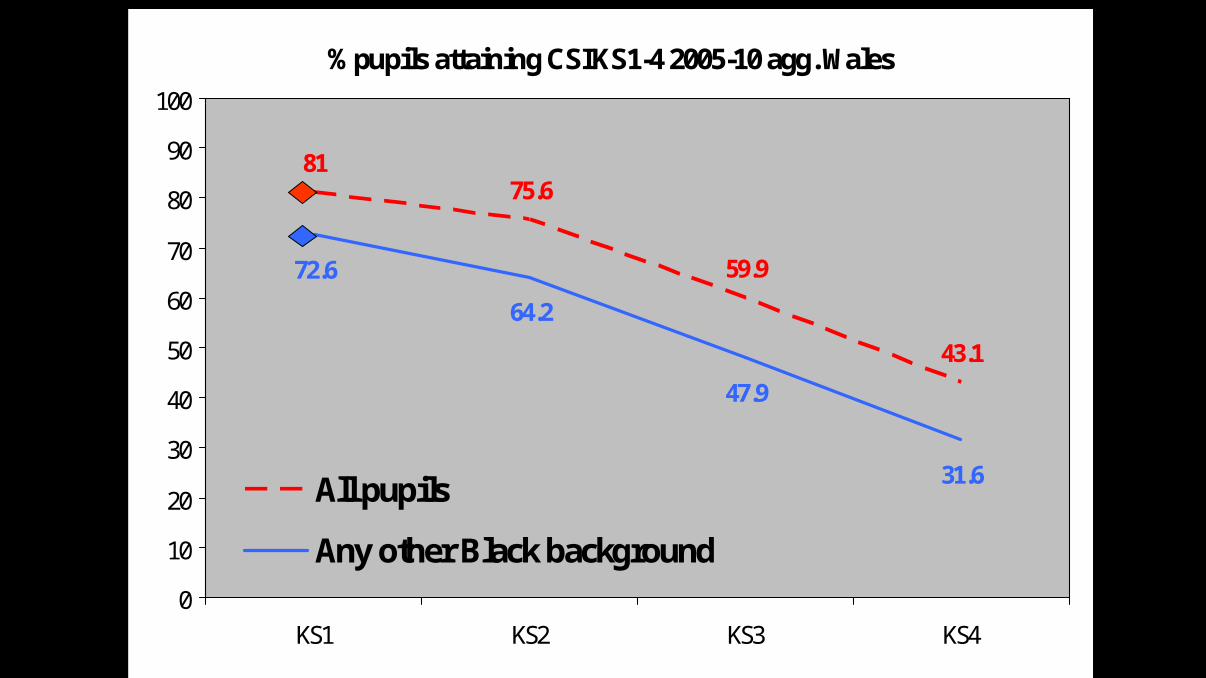
% pupils attaining CSI KS1-4 2005-10 agg. Wales
8175.6
59.9
43.1
72.6
64.2
47.9
31.6
0
10
20
30
40
50
60
70
80
90
100
KS1 KS2 KS3 KS4
All pupils
Any other Black background
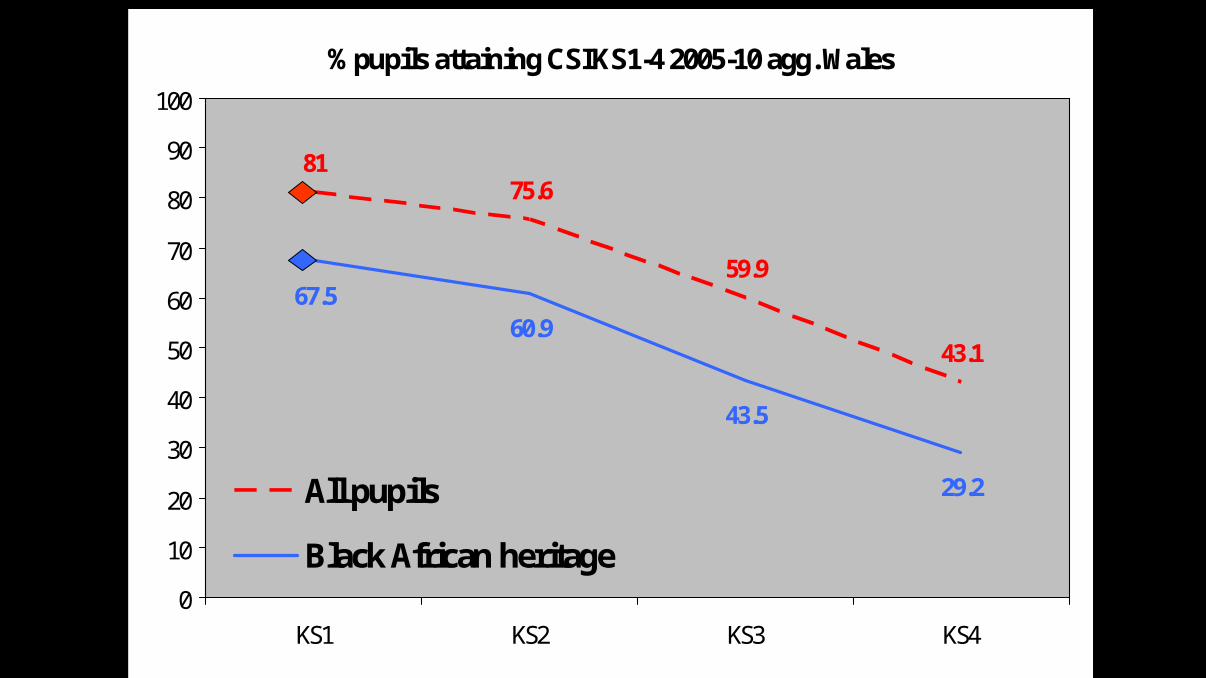
% pupils attaining CSI KS1-4 2005-10 agg. Wales
8175.6
59.9
43.1
67.560.9
43.5
29.2
0
10
20
30
40
50
60
70
80
90
100
KS1 KS2 KS3 KS4
All pupils
Black African heritage
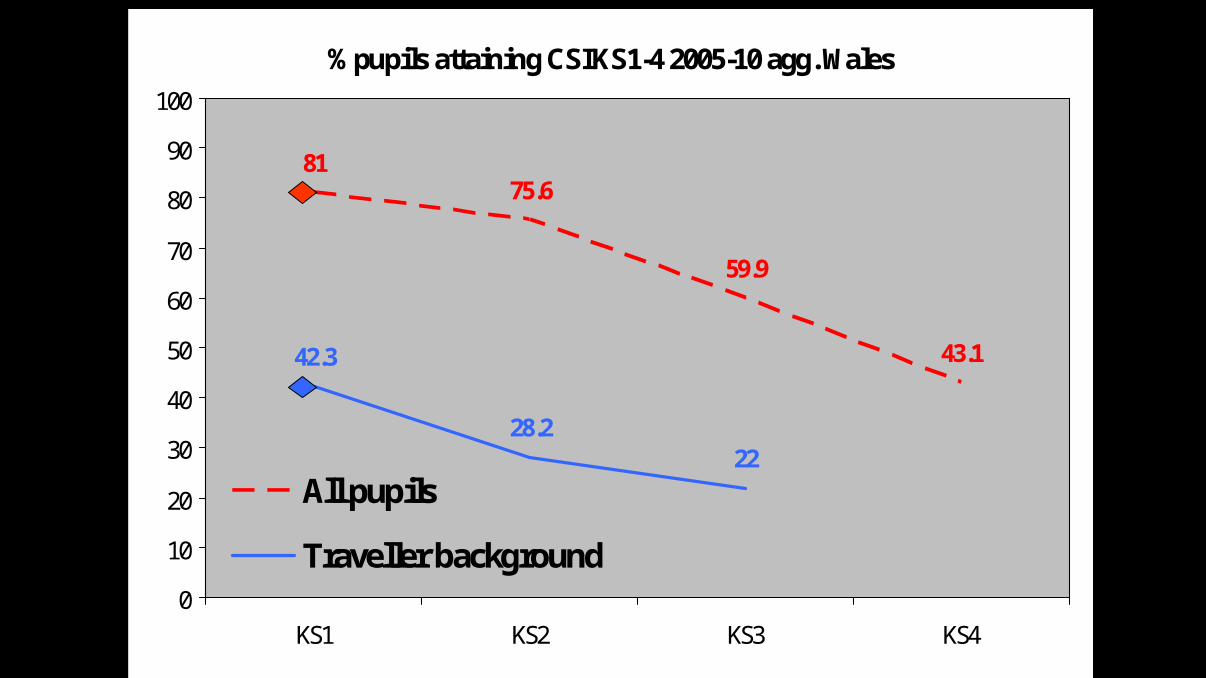
% pupils attaining CSI KS1-4 2005-10 agg. Wales
8175.6
59.9
43.142.3
28.222
0
10
20
30
40
50
60
70
80
90
100
KS1 KS2 KS3 KS4
All pupils
Traveller background
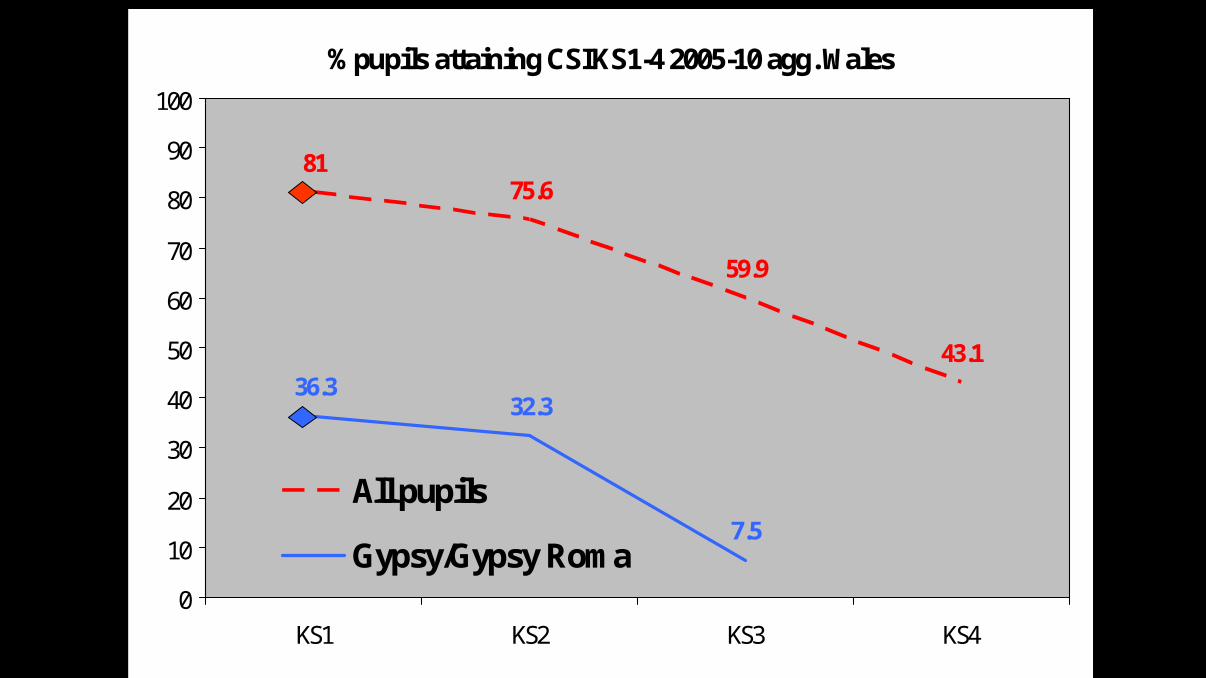
% pupils attaining CSI KS1-4 2005-10 agg. Wales
8175.6
59.9
43.136.3
32.3
7.5
0
10
20
30
40
50
60
70
80
90
100
KS1 KS2 KS3 KS4
All pupils
Gypsy/Gypsy Roma
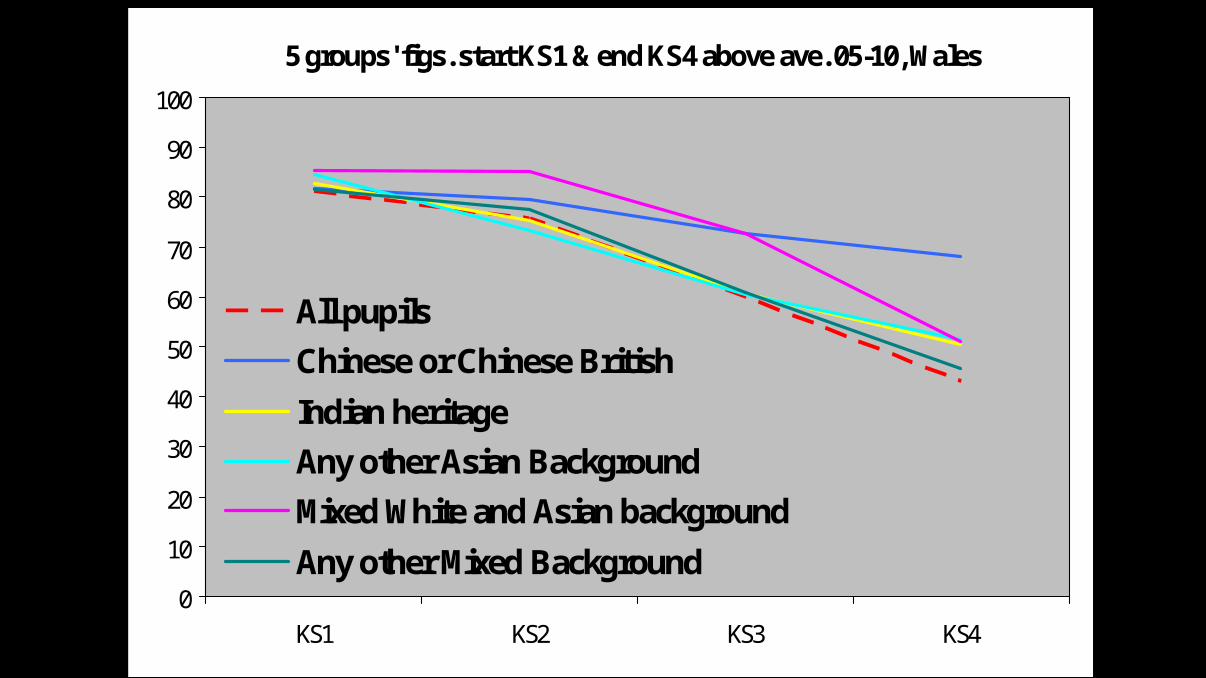
5 groups' figs. start KS1 & end KS4 above ave. 05-10, Wales
0
10
20
30
40
50
60
70
80
90
100
KS1 KS2 KS3 KS4
All pupils
Chinese or Chinese British
Indian heritage
Any other Asian Background
Mixed White and Asian background
Any other Mixed Background
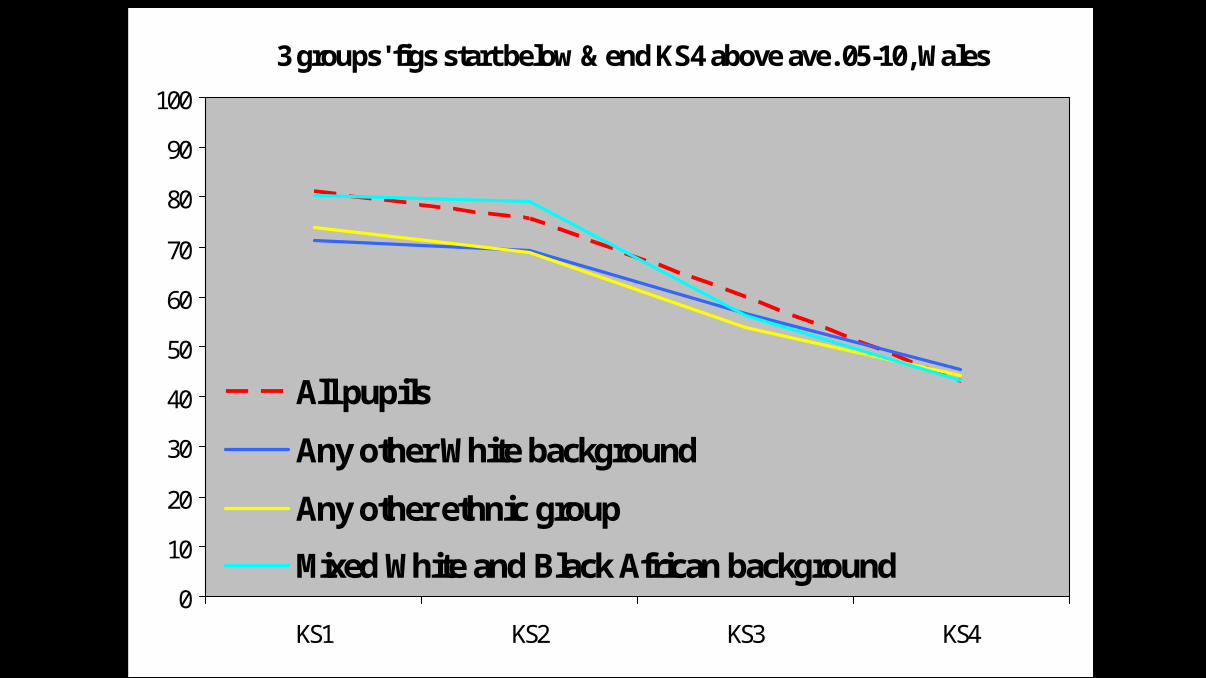
3 groups' figs start below & end KS4 above ave. 05-10, Wales
0
10
20
30
40
50
60
70
80
90
100
KS1 KS2 KS3 KS4
All pupils
Any other White background
Any other ethnic group
Mixed White and Black African background
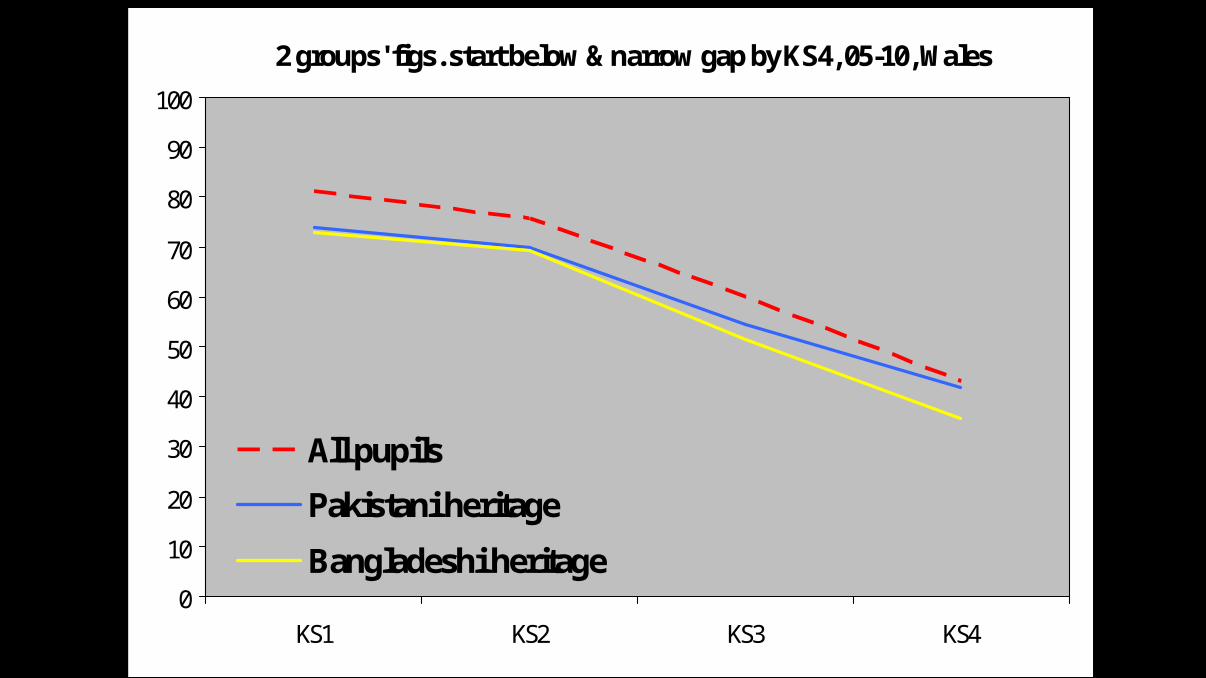
2 groups' figs. start below & narrow gap by KS4, 05-10, Wales
0
10
20
30
40
50
60
70
80
90
100
KS1 KS2 KS3 KS4
All pupils
Pakistani heritage
Bangladeshi heritage
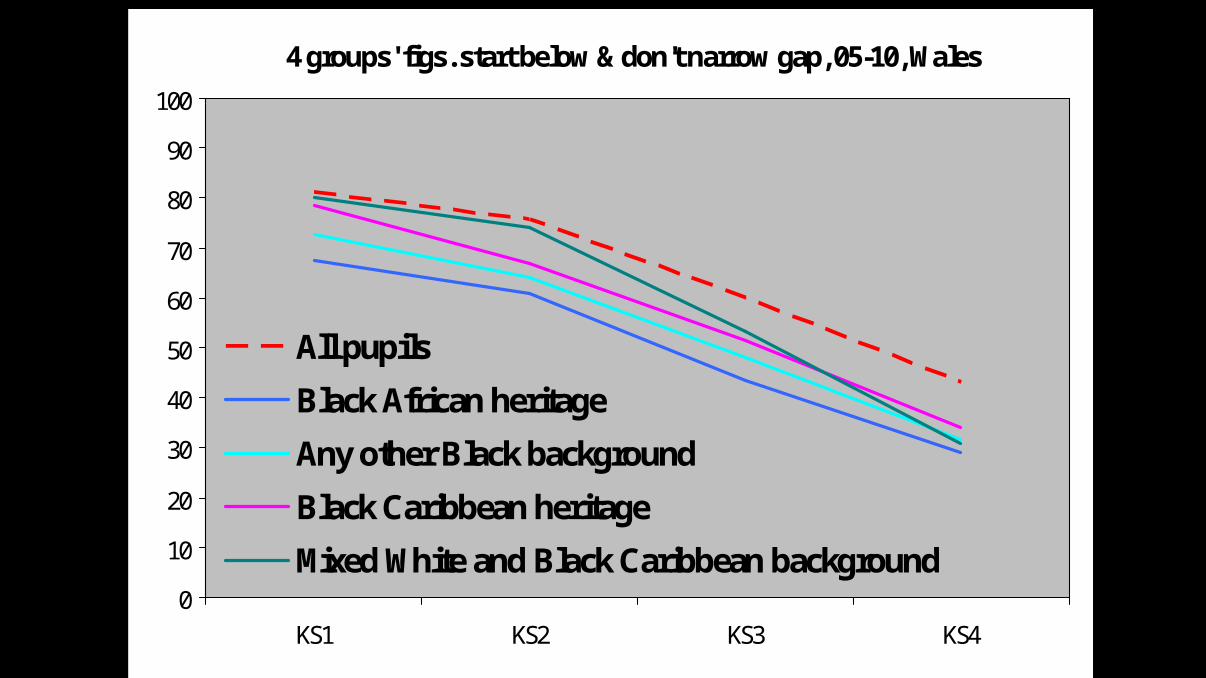
4 groups' figs. start below & don't narrow gap, 05-10, Wales
0
10
20
30
40
50
60
70
80
90
100
KS1 KS2 KS3 KS4
All pupils
Black African heritage
Any other Black background
Black Caribbean heritage
Mixed White and Black Caribbean background
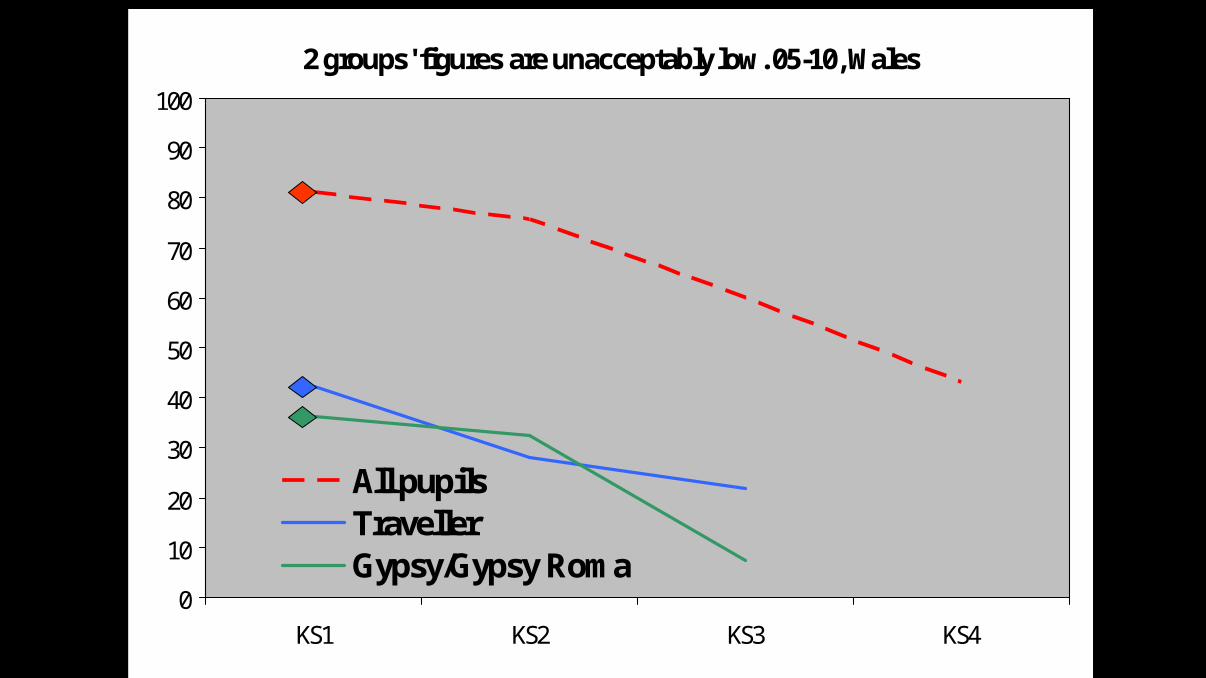
2 groups' figures are unacceptably low. 05-10, Wales
0
10
20
30
40
50
60
70
80
90
100
KS1 KS2 KS3 KS4
All pupilsTravellerGypsy/Gypsy Roma
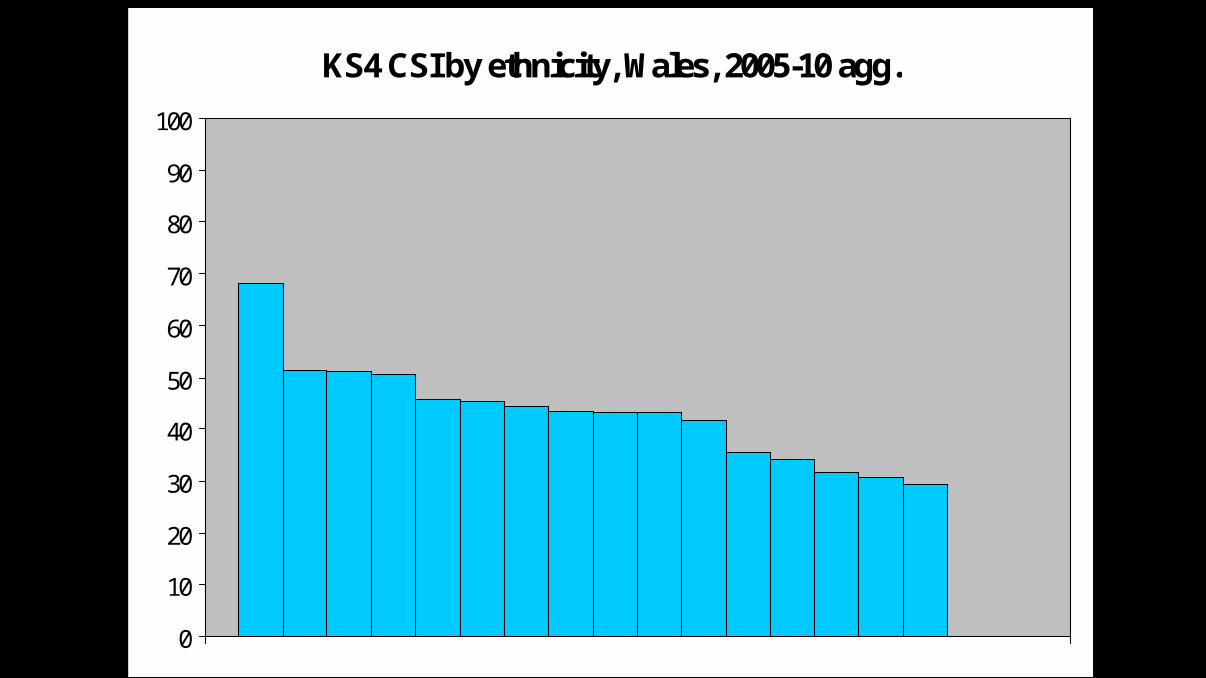
KS4 CSI by ethnicity, Wales, 2005-10 agg.
0
10
20
30
40
50
60
70
80
90
100
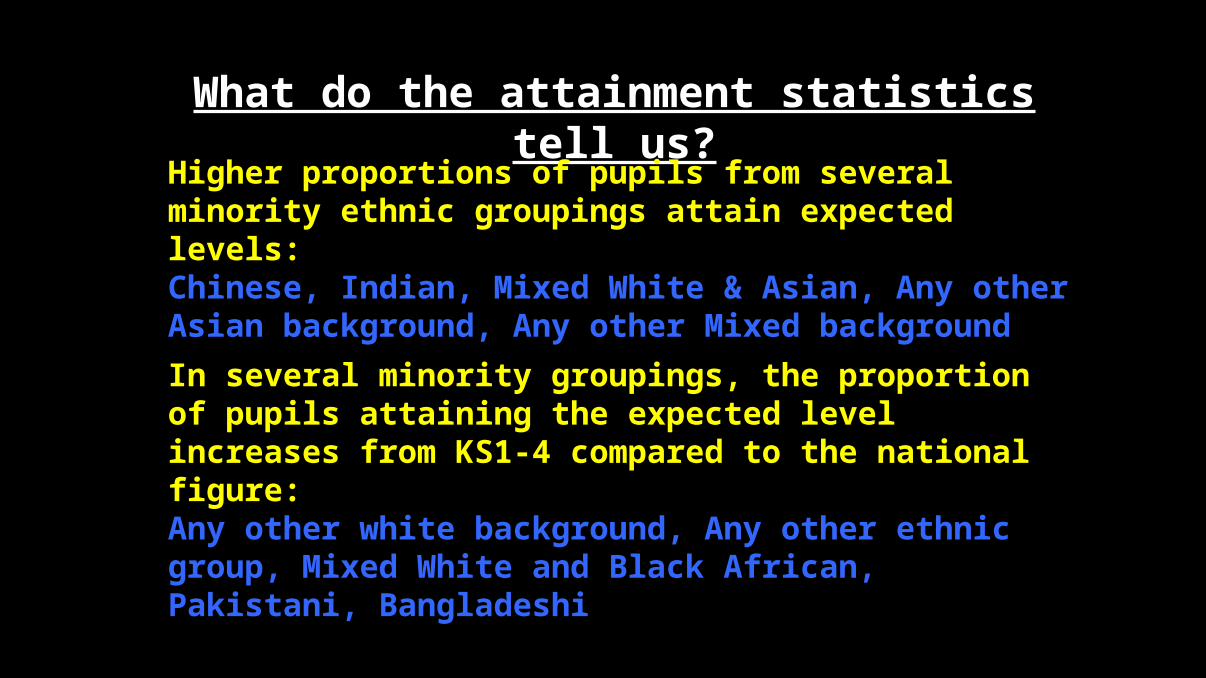
What do the attainment statistics tell us?
Higher proportions of pupils from several minority ethnic groupings attain expected levels:Chinese, Indian, Mixed White & Asian, Any other Asian background, Any other Mixed background
In several minority groupings, the proportion of pupils attaining the expected level increases from KS1-4 compared to the national figure: Any other white background, Any other ethnic group, Mixed White and Black African, Pakistani, Bangladeshi
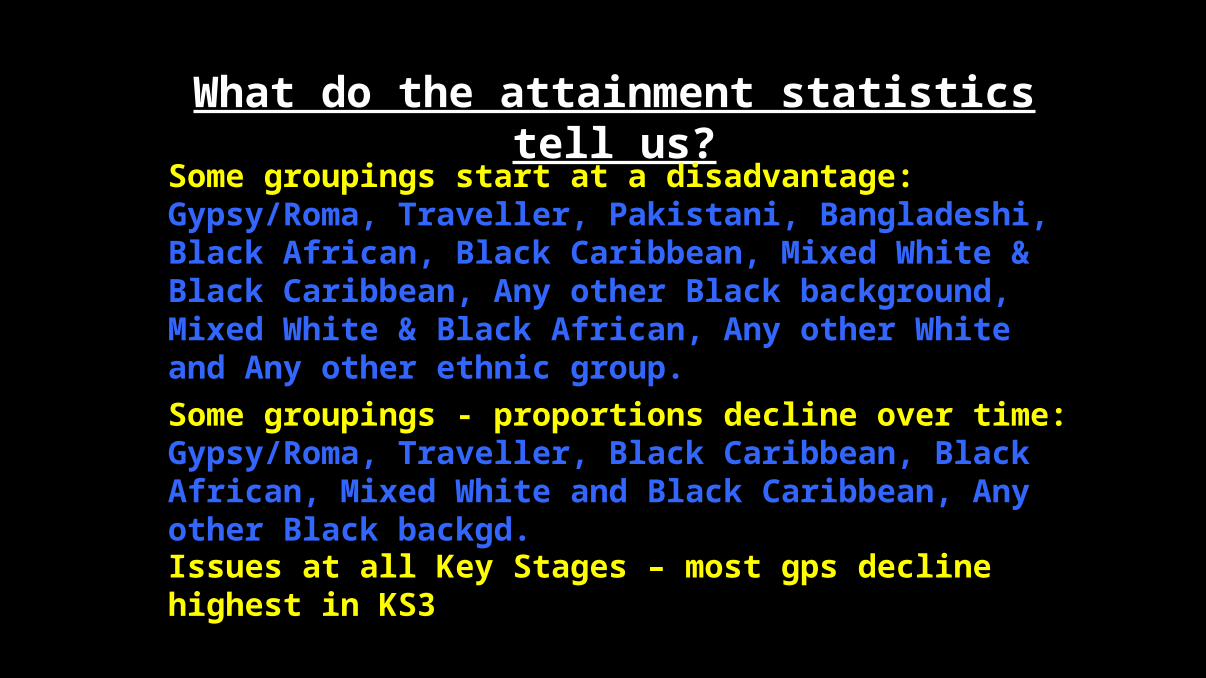
What do the attainment statistics tell us?
Some groupings start at a disadvantage: Gypsy/Roma, Traveller, Pakistani, Bangladeshi, Black African, Black Caribbean, Mixed White & Black Caribbean, Any other Black background, Mixed White & Black African, Any other White and Any other ethnic group.
Some groupings - proportions decline over time:Gypsy/Roma, Traveller, Black Caribbean, Black African, Mixed White and Black Caribbean, Any other Black backgd.
Issues at all Key Stages – most gps decline highest in KS3
Gender & Attainment
Are there any differences between boys’ and girls’ attainments?
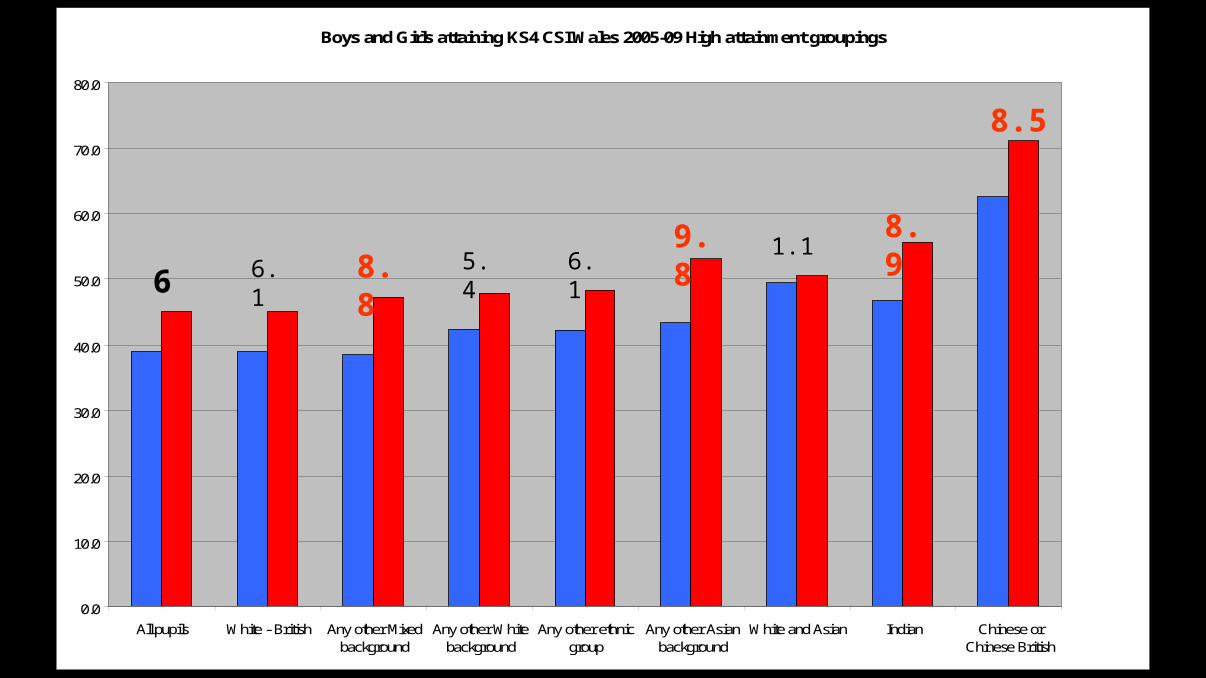
Boys and Girls attaining KS4 CSI Wales 2005-09 High attainment groupings
0.0
10.0
20.0
30.0
40.0
50.0
60.0
70.0
80.0
All pupils White - British Any other Mixedbackground
Any other Whitebackground
Any other ethnicgroup
Any other Asianbackground
White and Asian Indian Chinese orChinese British
6.1
8.5
8.8 5.4 6.11.1
8.9
6
9.8
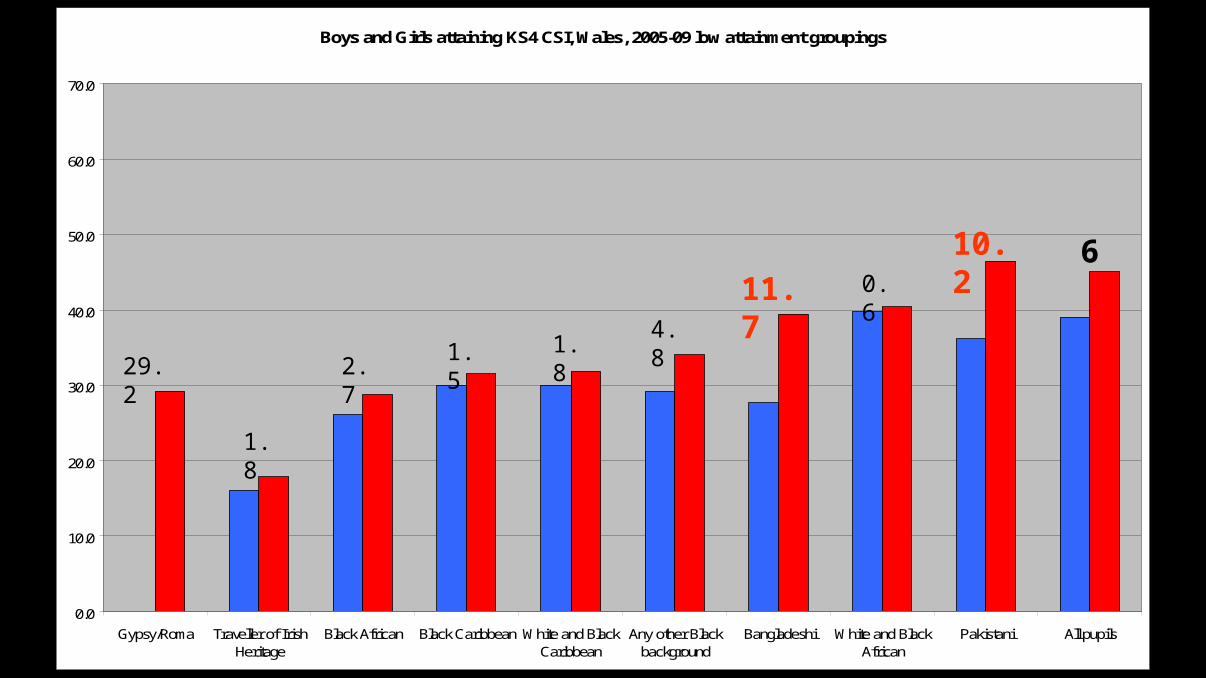
Boys and Girls attaining KS4 CSI, Wales, 2005-09 low attainment groupings
0.0
10.0
20.0
30.0
40.0
50.0
60.0
70.0
Gypsy/Roma Traveller of IrishHeritage
Black African Black Caribbean White and BlackCaribbean
Any other Blackbackground
Bangladeshi White and BlackAfrican
Pakistani All pupils
1.8
29.2 2.71.5 1.8
11.7 0.6
10.2 6
4.8
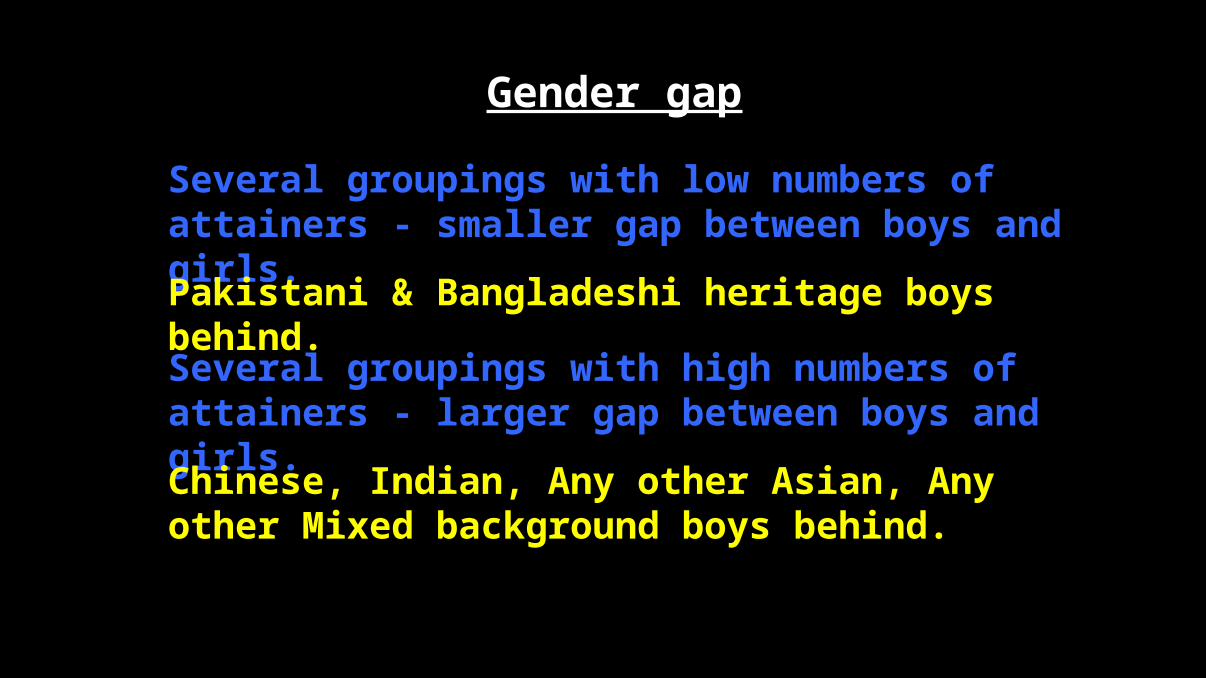
Gender gap
Several groupings with low numbers of attainers - smaller gap between boys and girls.
Several groupings with high numbers of attainers - larger gap between boys and girls.
Pakistani & Bangladeshi heritage boys behind.
Chinese, Indian, Any other Asian, Any other Mixed background boys behind.
EAL Stage
How significant is EAL proficiency?
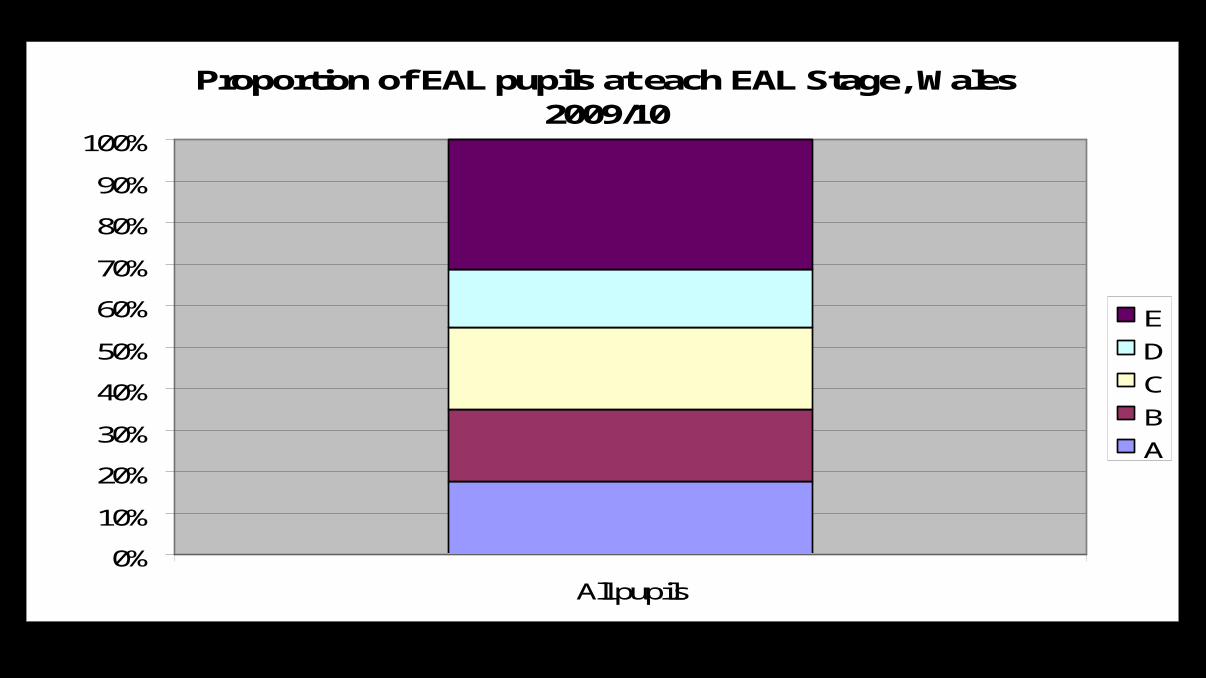
Proportion of EAL pupils at each EAL Stage, Wales 2009/10
0%
10%
20%
30%
40%
50%
60%
70%
80%
90%
100%
All pupils
E
D
C
B
A
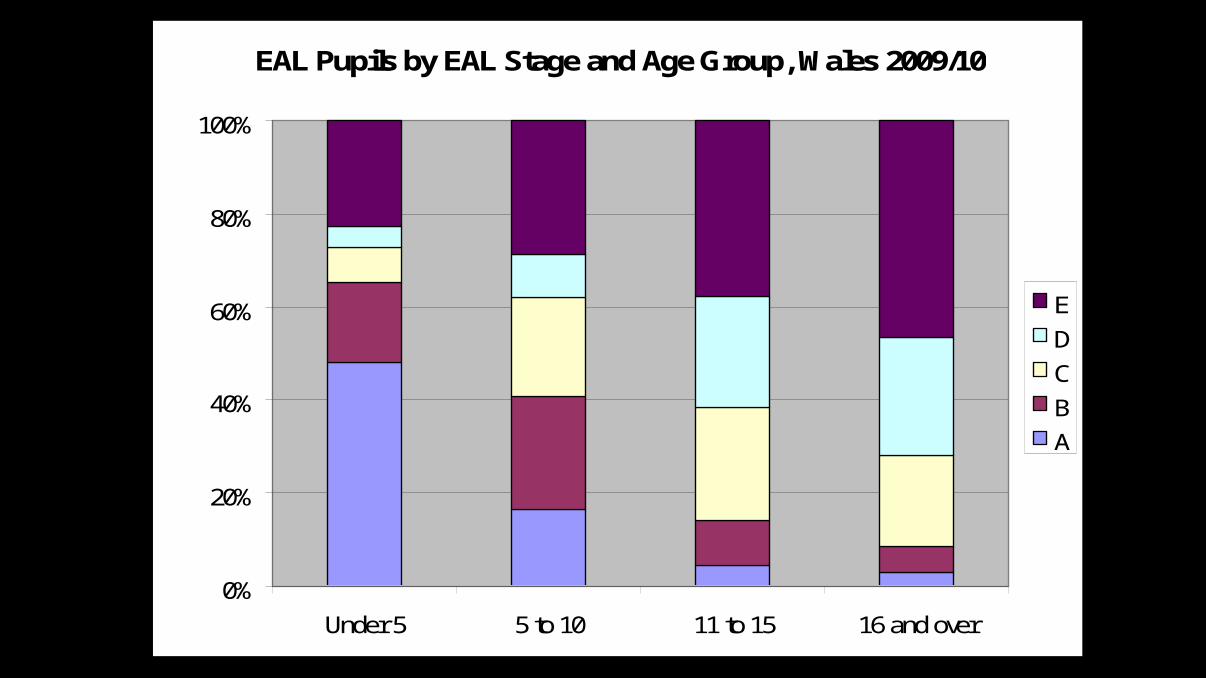
EAL Pupils by EAL Stage and Age Group, Wales 2009/10
0%
20%
40%
60%
80%
100%
Under 5 5 to 10 11 to 15 16 and over
E
D
C
B
A
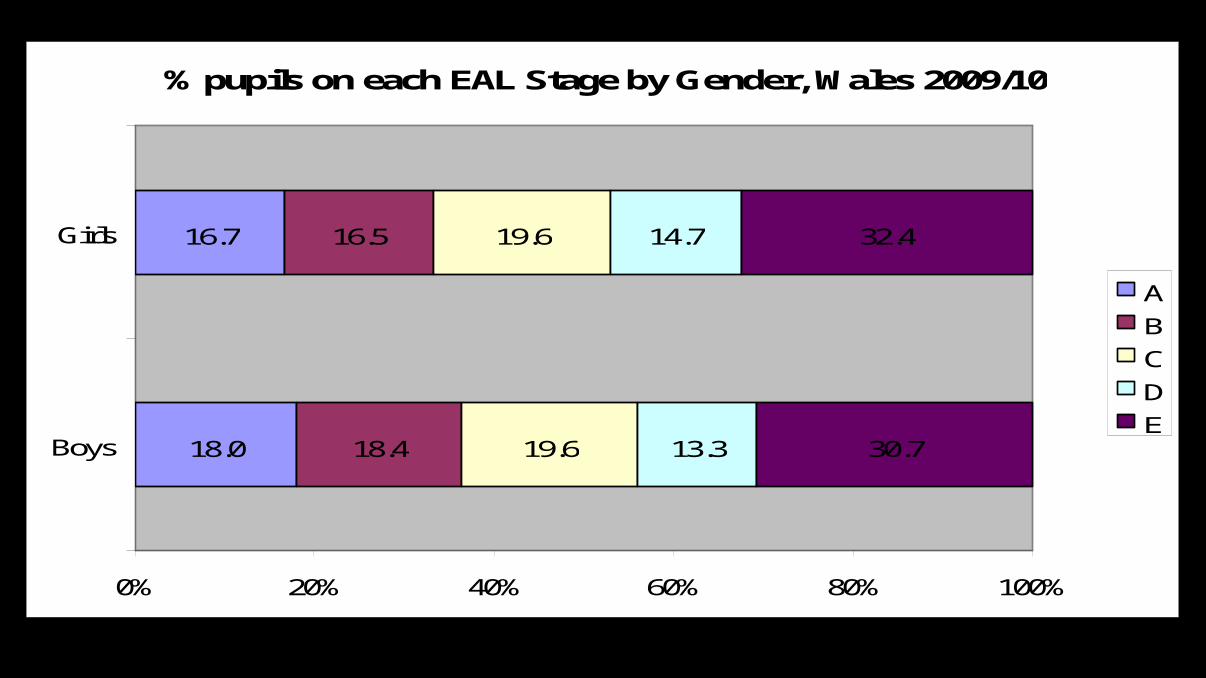
% pupils on each EAL Stage by Gender, Wales 2009/10
18.0
16.7
18.4
16.5
19.6
19.6
13.3
14.7
30.7
32.4
0% 20% 40% 60% 80% 100%
Boys
Girls
A
B
C
D
E
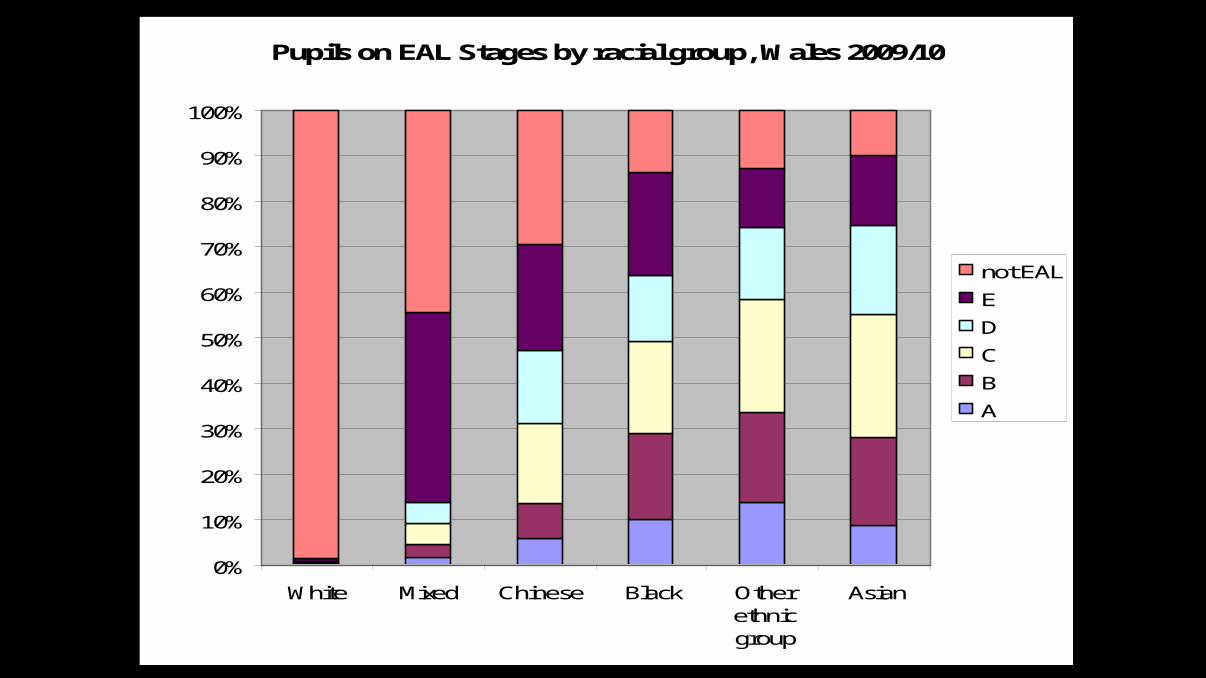
Pupils on EAL Stages by racial group, Wales 2009/10
0%
10%
20%
30%
40%
50%
60%
70%
80%
90%
100%
White Mixed Chinese Black Otherethnicgroup
Asian
not EAL
E
D
C
B
A
FSM eligibility
How significant is socio-economic background?
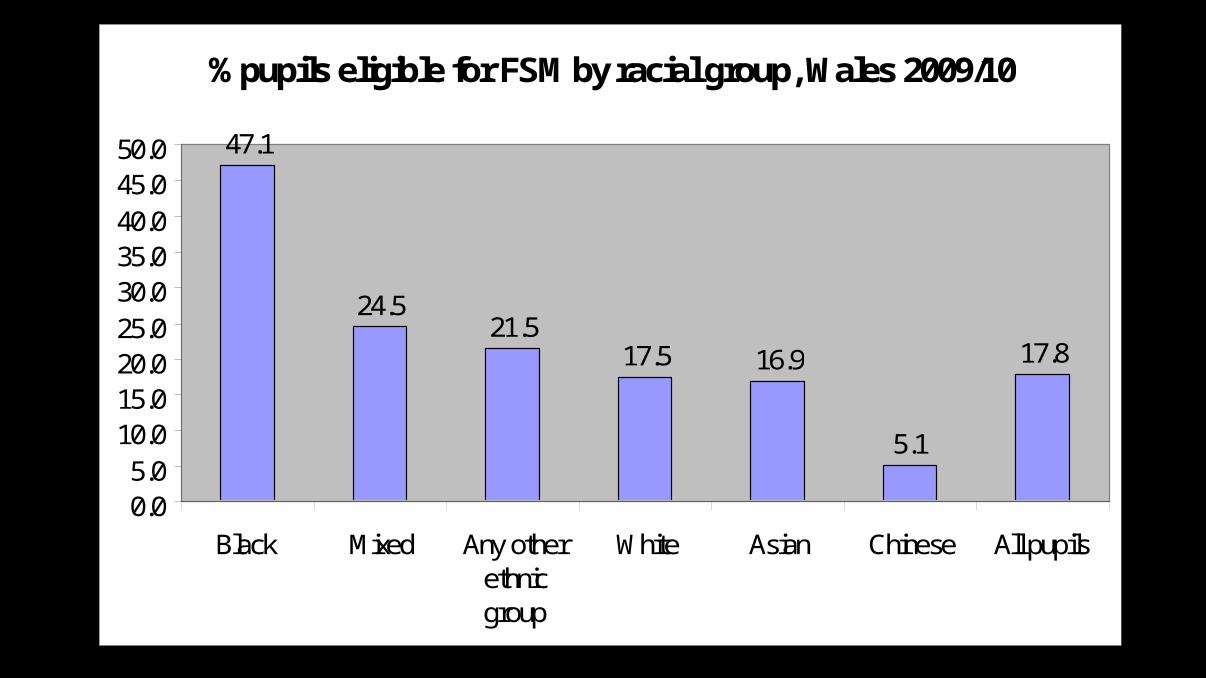
% pupils eligible for FSM by racial group, Wales 2009/10
47.1
24.521.5
17.5 16.9
5.1
17.8
0.05.0
10.015.020.025.030.035.040.045.050.0
Black Mixed Any otherethnicgroup
White Asian Chinese All pupils
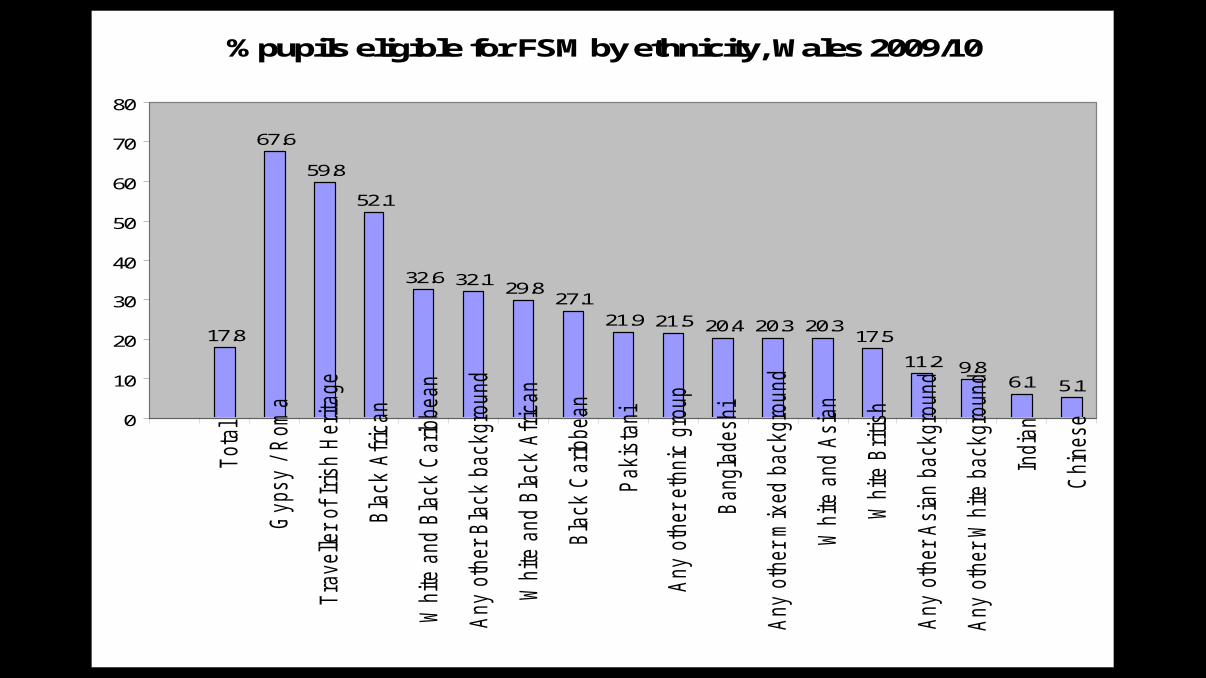
% pupils eligible for FSM by ethnicity, Wales 2009/10
17.8
67.6
59.8
52.1
32.6 32.129.8
27.121.9 21.5 20.4 20.3 20.3
17.5
11.2 9.86.1 5.1
0
10
20
30
40
50
60
70
80
Tota
l
G
ypsy / R
om
a
Tra
veller of Iris
h H
erita
ge
Bla
ck A
fric
an
W
hite a
nd B
lack C
aribbean
Any o
ther Bla
ck b
ackgro
und
W
hite a
nd B
lack A
fric
an
Bla
ck C
aribbean
Pakis
tani
Any o
ther eth
nic
gro
up
Bangla
deshi
Any o
ther m
ixed b
ackgro
und
W
hite a
nd A
sia
n
W
hite B
ritish
Any o
ther Asia
n b
ackgro
und
Any o
ther W
hite b
ackgro
und
In
dia
n
Chin
ese
Exclusions
Do exclusion rates tell us anything about race equality in schools in Wales?
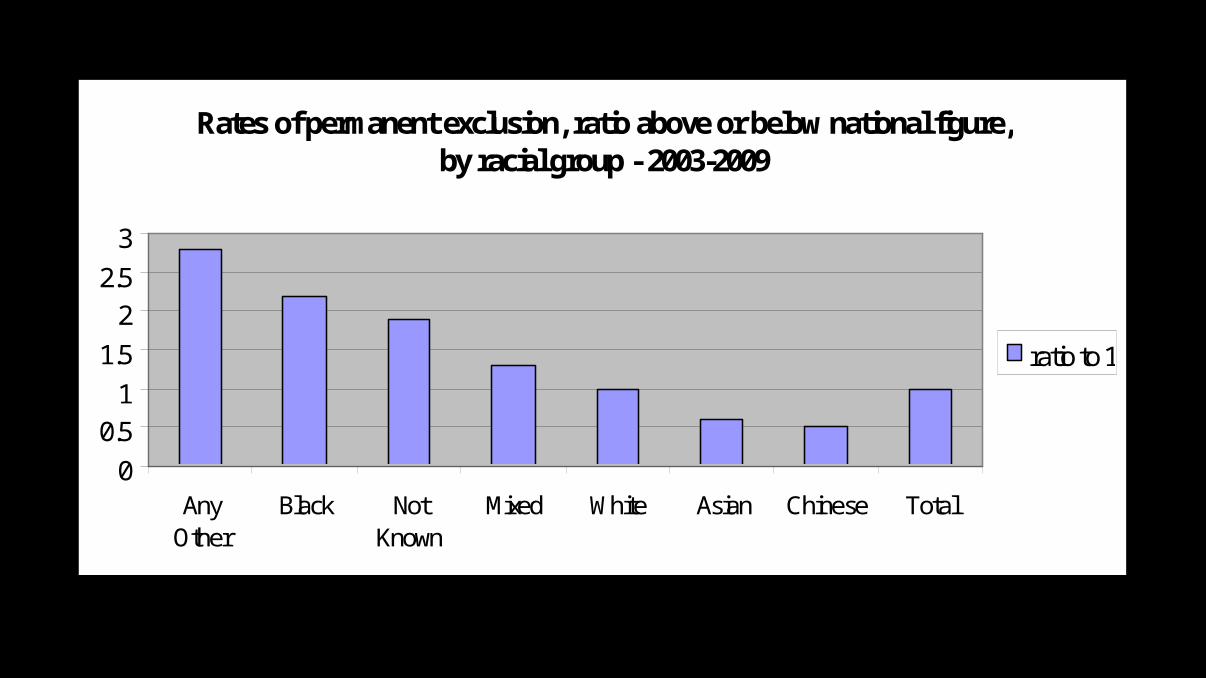
Rates of permanent exclusion, ratio above or below national figure, by racial group - 2003-2009
0
0.5
1
1.5
2
2.5
3
AnyOther
Black NotKnown
Mixed White Asian Chinese Total
ratio to 1
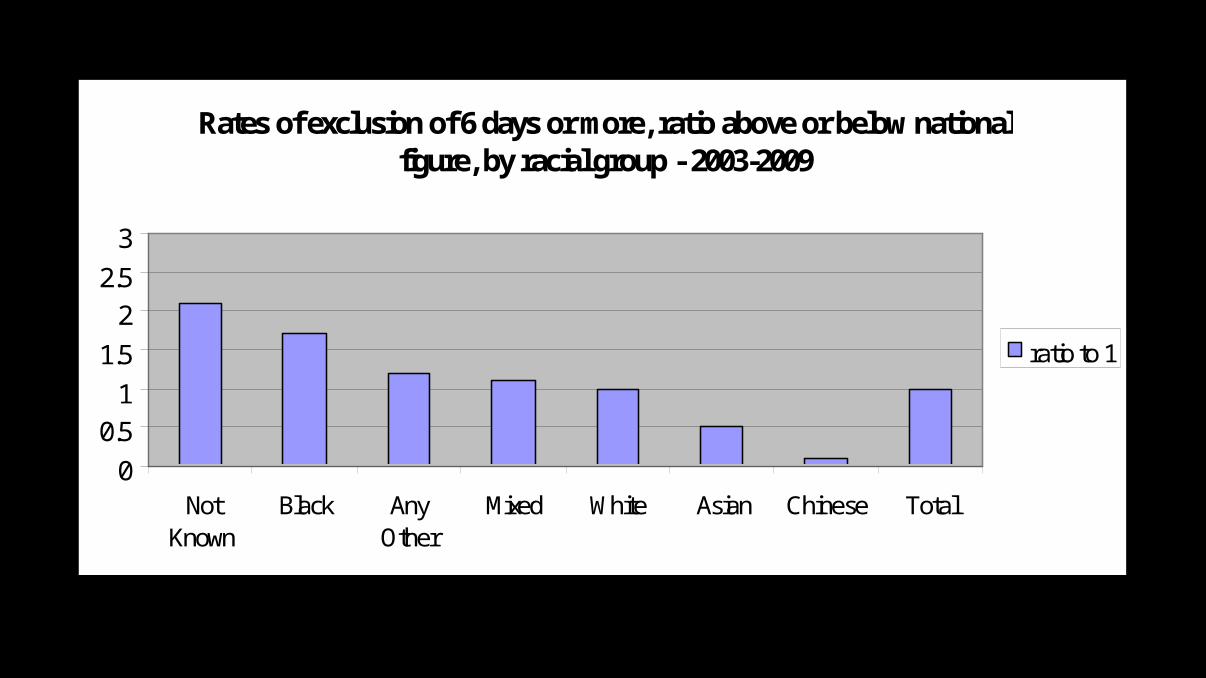
Rates of exclusion of 6 days or more, ratio above or below national figure, by racial group - 2003-2009
0
0.5
1
1.5
2
2.5
3
NotKnown
Black AnyOther
Mixed White Asian Chinese Total
ratio to 1

Rates of exclusion of 5 days or fewer, ratio above or below national figure, by racial group - 2003-2009
0
0.5
1
1.5
2
2.5
3
NotKnown
Black AnyOther
Mixed White Asian Chinese Total
ratio to 1
Conclusions
Equal educational outcomes are not a reality for pupils of all ethnic backgrounds in Wales.
Some of the inequalities are unacceptable.
Girls & boys attainment differs between groups.
In some groupings pupils make very good progress.
Conclusions
A disproportionate number of pupils from several minority ethnic groupings experience socio-economic disadvantage.
Pupils from certain ethnic backgrounds experience a disproportionate number of exclusions.
EAL proficiency appears significant for some but not all attainment patterns
What can we do?
Identify the reasons for low attainment: the factors contributing to low achievement
Identify the best practice strategies for tackling the negative factors and supporting achievement
Define what needs to be done to improve current policy and practice
Focus Groups
Travellers & Gypsy/Roma
Mixed White and Black Caribbean & Mixed White and Black African
Black African
Black Caribbean
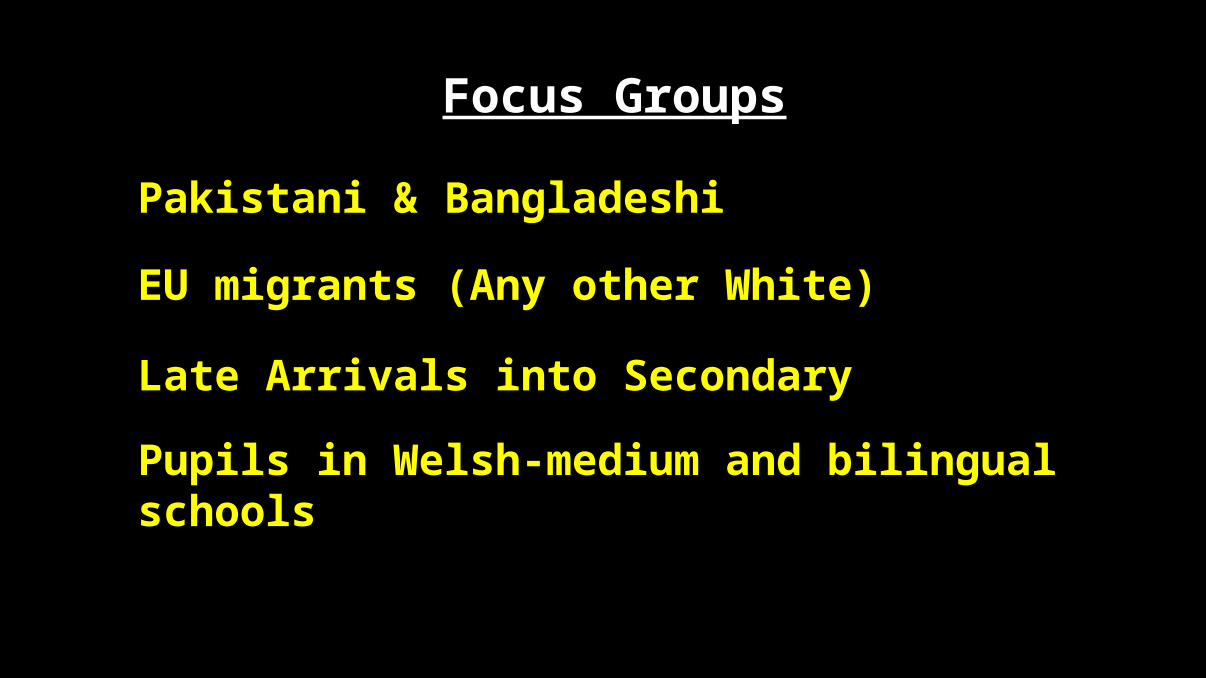
Focus Groups
Late Arrivals into Secondary
Pupils in Welsh-medium and bilingual schools
EU migrants (Any other White)
Pakistani & Bangladeshi
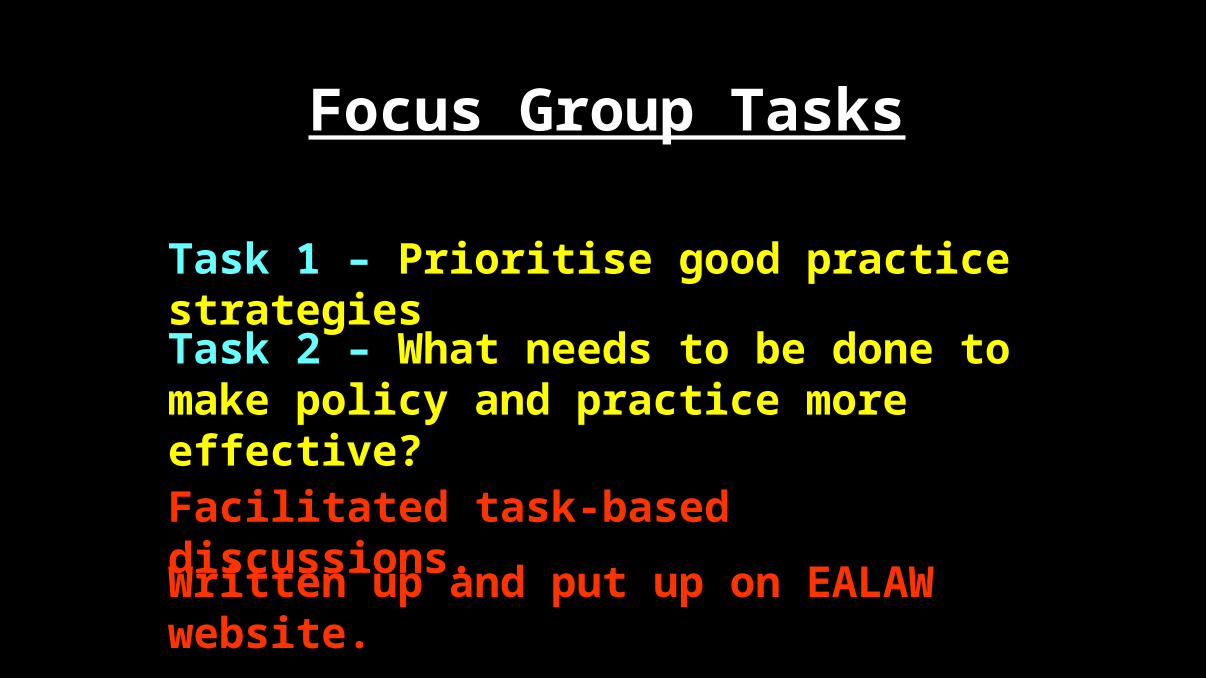
Focus Group Tasks
Task 1 – Prioritise good practice strategies
Task 2 – What needs to be done to make policy and practice more effective?
Facilitated task-based discussions.
Written up and put up on EALAW website.

End