Embed Size (px)
Citation preview

AU/ACSC/DEA/228/96-04
EAGLE PLUS
AIR SUPERIORITY INTO THE 21ST CENTURY
A Research Paper
Presented To
The Directorate of Research
Air Command and Staff College
In Partial Fulfillment of the Graduation Requirements of ACSC
by
Maj Matthew T. BlackMaj Dennis E. DaleyMaj Kevin C. SmithMaj James K. Tatum
April 1996

ii
Disclaimer
The views expressed in this academic research paper are those of the authors and do
not reflect the official policy or position of the US Government or the Department of
Defense.

iii
Contents
Page
DISCLAIMER ................................................................................................................ ii
LIST OF ILLUSTRATIONS.......................................................................................... vi
LIST OF TABLES....................................................................................................... viii
PREFACE....................................................................................................................... x
ABSTRACT.................................................................................................................. xii
INTRODUCTION .......................................................................................................... 1
EAGLE READINESS: THE GOOD .............................................................................. 5Introduction................................................................................................................ 5Literature Search ........................................................................................................ 6
Operations Tempo and the Operations and Maintenance Budget............................. 8Obsolescence and the Eroding Industrial Defense Base......................................... 11The Logistic Repair and Supply Cycle .................................................................. 14
Methodology for Readiness....................................................................................... 18Data Collection Method ....................................................................................... 18Statistical Trend Analysis ..................................................................................... 18Regression Model Analysis................................................................................... 19Assumptions......................................................................................................... 19
Statistical Readiness Analysis.................................................................................... 20Aging Aircraft Syndrome: Is it a Readiness Factor? ............................................. 20Spare Parts And The Supply Cycle: How Bad Is It? ............................................ 25RSD Funding: The Root Of The FMC Problem................................................... 26SSD Funding: Big Dollars For Little Parts........................................................... 30O&M Funding: Money for Daily Operations........................................................ 31
Readiness Analysis Using Modeling Techniques........................................................ 33Regression Analysis: FMC Variable Relationships ............................................... 34Regression Analysis: Forecasting FMC................................................................ 36
Recommendations..................................................................................................... 40Recommendation One .......................................................................................... 40Recommendation Two ......................................................................................... 40Recommendation Three........................................................................................ 41

iv
Recommendation Four ......................................................................................... 41Conclusion................................................................................................................ 41
FORCE STRUCTURE: THE BAD .............................................................................. 46Introduction.............................................................................................................. 46Literature Search: Force Structure ........................................................................... 47
F-15C Service Life Limit...................................................................................... 48The Multirole-Gap in Tactical Fighters ................................................................. 48Potential Adversaries: Peer Competitors.............................................................. 51Potential Adversaries: Niche States ..................................................................... 54Tough Choices: All a Matter of Money ............................................................... 55RMA and Force Structure .................................................................................... 57
Force Structure Methodology ................................................................................... 59Data Collection Methods...................................................................................... 60Analysis Procedures ............................................................................................. 60Assumptions......................................................................................................... 60
Force Structure Analysis ........................................................................................... 61Historical Baseline: Gulf War Air Superiority Mission ......................................... 62A North Korea-Iran War: A Two-MRC Force Structure Analysis........................ 64
Recommendations..................................................................................................... 70Recommendation One .......................................................................................... 70Recommendation Two ......................................................................................... 70Recommendation Three........................................................................................ 71Recommendation Four ......................................................................................... 71
Conclusion................................................................................................................ 72
MODERNIZATION: THE UGLY ............................................................................... 77Introduction.............................................................................................................. 77Literature Search ...................................................................................................... 78
Modernization Budgets ........................................................................................ 78Reliability Centered Maintenance: Invest not Inspect ........................................... 81Eagle Generation: Systems Upgrade Program...................................................... 83Long-Term Modernization: The F-22 .................................................................. 84
Modernization Methodology..................................................................................... 88Data Collected ..................................................................................................... 88Analysis Process................................................................................................... 89Analysis Assumptions........................................................................................... 90
Analysis: Near-Term and Long-Term Modernization................................................ 90F-22: Do We Really Need It? .............................................................................. 90F-15C Modernization: What Needs Upgraded? ................................................... 91Surveys ................................................................................................................ 97
Recommendation for Modernization ......................................................................... 99Recommendation One .......................................................................................... 99Recommendation Two ......................................................................................... 99Recommendation Three...................................................................................... 100Recommendation Four ....................................................................................... 101

v
Conclusions ............................................................................................................ 101
CONCLUSION........................................................................................................... 106
APPENDIX A: DATABASES .................................................................................... 110
APPENDIX B: REGRESSION MODEL .................................................................... 113
APPENDIX C: REGRESSION ANALYSIS DATA.................................................... 115
APPENDIX D: F-15 SERVICE LIFE ......................................................................... 119
APPENDIX E: TWO MRC SORTIE CALCULATION .............................................. 121
APPENDIX F: SURVEY QUESTIONNAIRES.......................................................... 123
BIBLIOGRAPHY....................................................................................................... 126

vi
Illustrations
Page
Figure 2-1. F-15C vs. F-16C FMC Rates ......................................................................... 7
Figure 2-2. Budget Fund Makeup .................................................................................... 9
Figure 2-3. Avionic Maintenance Pipeline Times............................................................ 17
Figure 2-4. Age of F-15C Fleet Since 1987.................................................................... 21
Figure 2-5. 1995 FMC Rates: Old vs. New.................................................................... 22
Figure 2-6. F-16 FMC Rates 1990-1995 ........................................................................ 23
Figure 2-7. 1990-1995 F-15C Breakrates....................................................................... 24
Figure 2-8. F-15C TNMCS Rate 1990-1995.................................................................. 25
Figure 2-9. WR-ALC/LF RSD Repair Requirement ....................................................... 26
Figure 2-10. WR-ALC/LF DO41 Requirement (RSD Buy)............................................ 27
Figure 2-11. F-15C Cannibalization Rate (1990-1995)................................................... 28
Figure 2-12. F100-PW-100 and -220 UER Rate ............................................................ 29
Figure 2-13. RSD Repair Funding, F-100 Engines ......................................................... 30
Figure 2-14. WR-ALC/LF DO62 Requirement (SSD).................................................... 31
Figure 2-15. FMC Forecast (Worst Case) ...................................................................... 37
Figure 2-16. FMC Forecast (Best Case)......................................................................... 38
Figure 2-17. FMC Forecast (Most Likely Case) ............................................................. 39
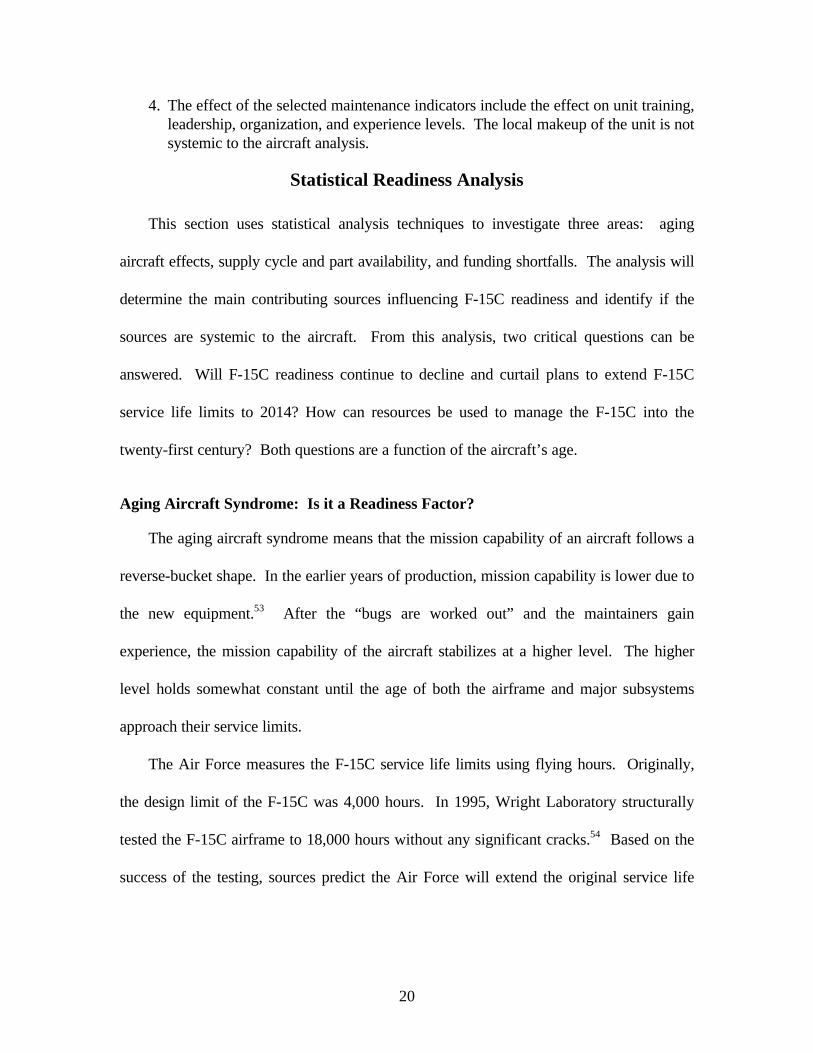
Figure 3-1. Declining Defense Dollars............................................................................ 56
Figure 4-1. Modernization Funding................................................................................ 79

vii
Figure 4-2. DOD Procurement Program ........................................................................ 80
Figure 4-3. Histogram of Code Threes........................................................................... 93
Figure 4-4. F-15C CND Rate....................................................................................... 100
Figure C-1. Regression Analysis Prediction Curve Versus Actual................................. 118
Figure D-1. 8,000 Hour Service Life............................................................................ 119
Figure D-2. 10,000 Hour Service Life.......................................................................... 119
Figure D-3. 12,000 Hour Service Life.......................................................................... 120

viii
Tables
Page
Table 2-1. F-15C Industrial Base Problems.................................................................... 11
Table 2-2. DOD and Commercial Ordering and Shipping Times..................................... 16
Table 2-3. RSD Buy and Repair..................................................................................... 27
Table 3-1. Comparison of Air Superiority Fighters......................................................... 52
Table 3-2. Iranian Air Order of Battle ............................................................................ 64
Table 3-3. North Korean Air Order of Battle ................................................................. 65
Table 3-4. USAF Sortie Production Calculations ........................................................... 68
Table 4-1. F-22 Program Cost ....................................................................................... 84
Table 4-2. F-15C and Russian Interceptor Comparison .................................................. 86
Table 4-3. F-15C Subsystem Breakrate.......................................................................... 92
Table 4-4. F-15C Depot Level Repairs .......................................................................... 94
Table 4-5. PW-100-100/220 Comparison....................................................................... 96
Table A-1. F-15C Database ......................................................................................... 110
Table A-2. F-16C Database (Block 30s) ...................................................................... 111
Table A-3. F-16C Database (Block 40s) ...................................................................... 111
Table A-4. F-16C Database (Block 50s) ...................................................................... 111
Table A-5. TICARRS Data.......................................................................................... 112
Table B-1. ISP Program Data ...................................................................................... 113
Table B-2. Regression Analysis: Correlation Between Regression Coefficients............ 113

ix
Table B-3. Regression Model Input Database .............................................................. 114
Table C-1. F-Test Data................................................................................................ 115
Table C-2. Regression Analysis.................................................................................... 116
Table C-3. Prediction Equation.................................................................................... 117

x
Preface
The F-15C is the world’s finest air superiority fighter. This aircraft provided coalition
forces overwhelming air superiority during the Gulf War. However, in today’s climate of
reduced funding and military downsizing, a hard-look is required to determine the F-15C’s
mission effectiveness into the twenty-first century. These problems must be solved.
Maintaining air superiority during the next conflict is critical for the United States Armed
Forces and the F-15C will be on center stage in the air-to-air arena.
We would like to thank Lt Col Rita Springer, our research advisor, for assisting us in
identifying the proper methodology and analysis procedures. She was unselfish with her
many contributions to our project.
We give special thanks to the F-15 System Program Office (SPO) at Warner-Robins
Air Logistic Center. Their F-15C maintenance and funding data provided the core of our
readiness chapter. The database generated by Mr. Jeff Hill served as the foundation of our
statistical analysis. Special thanks go out to Mrs. Betsy Mullis, LFLL branch chief, and to
Mr. Jerry Vaughn, LFLV branch chief, for their individual contributions on logistics
issues. Capt Arnold Lee was a focal point for our secondary structures investigations.
Also, Mr. Ben Hollingsworth, F-15 SPO financial analyst, provided outstanding advice
and data for our investigation into funding shortfalls.
In addition, we must recognize several contractors for their contribution to the
research project. Ms. Lynn Grile, reliability analyst for Dynamic Research Corporation,

xi
collected F-15C and F-16 maintenance data for maintenance statistical comparison. Mr.
Rick Foster, a McDonnell Douglas structural engineer, provided excellent support for our
airframe and structures studies.
Col Ron Hassan, Air Combat Commander chief of staff, provided the necessary
guidance for the implementation of this study. Col Hassan identified the research
parameters and provided the initial vision that started our long research journey. We
appreciate his help in making this research project possible.
This study was much more than a course requirement for Air Command and Staff
College (ACSC). Three of our four team members served in F-15C squadrons prior to
their ACSC assignment. They witnessed the effects of aging aircraft and funding shortfalls
on the young men and women who maintain and operate the F-15C Eagle. We felt an
obligation to these very dedicated NCOs and airmen. We dedicate this research project to
those many professionals who “keep ‘em flying.”

xii
AU/ACSC/DEA/228/96-04
Abstract
The objective of this study was to determine if the F-15C could sustain the air
superiority mission into the twenty-first century. Research focused on the three pillars of
military capabilities as outlined in Air Force Manual 1-1. It analyzed F-15C short-term
readiness factors, the F-15C force structure applied to a two Major Regional Conflict
(MRC) scenario, and the need for F-15C subsystem upgrades.
This study resulted in three conclusions. First, F-15C readiness is adequate, but
funding shortfalls and poor subsystem reliability has decreased the fully-mission-capable
rate. Although the funding shortfalls were reversed, poor reliability in the radar,
propulsion, and structure subsystems continue. Second, the current force structure of 300
operational F-15Cs is adequate for a two—MRC scenario. The involvement of a peer
competitor, such as Russia or China, overextends the current F-15C force structure.
Third, the F-15C can fly to 2010 or beyond if the radar, engine, and structure subsystems
are modernized.
The F-15C and F-22 will play an important air superiority role into the twenty-first
century if two courses of action are initiated. First, the recent decline in maintenance
indicators must be reversed through a robust subsystem modernization program. Second,
the F-22 must be procured to overcome the recent adversary advances in fighter
technologies. Although growing budget constraints will make these courses of action
difficult, they must be undertaken if the US is to maintain its air superiority edge.

1
Chapter 1
Introduction
Anyone who has to fight, even with the most modern weapons, against anenemy in complete command of the air, fights like a savage againstmodern European forces. With the same handicaps and with the samechance of success.
—Field Marshall Erwin Rommel
The maintenance officer shoved his hands deep into his pockets as he leaned forward
against the gusting north wind. The journey from the flightline to the hangar seemed
exceptionally long this arctic morning. The crew chief had just informed him aircraft 9078
was non-mission–capable (NMC) because of a bad heat exchanger. No replacement part
was available in the supply system. They were down to eight good F-15Cs and needed to
fly an ‘eight-turn-eight’ on Monday. If he could only get his six jets back from the Turkey
deployment—life would be so much easier. It was not the lack of parts or the lack of
aircraft that really concerned the maintenance officer. It was the look on the crew chief’s
face that bothered him the most. They both understood that cannibalizing a heat
exchanger meant another weekend in the hangar for the young crew chief—his third in the
last month.
This short tale depicts a microcosm of today’s F-15C units. A shortage of parts,
increased breakrates, quality-of-life concerns, high operations tempo and reduced force
structures all occur daily at F-15 bases worldwide. Not all F-15 bases possess gusting

2
north winds, but they do have the persistent problems of meeting daily flying schedules
with aging aircraft.
This paper investigates the F-15C and its air superiority mission into the twenty-first
century. The Department of Defense (DOD) defines military capability as “the ability to
achieve a specific wartime objective”. It regards military capability as being comprised of
four components or pillars. The four pillars are readiness, sustainment, force structure,
and modernization.1
Air Force Manual 1-1 defines the four pillars of military capabilities.2 Readiness is
the ability to accomplish mission objectives. Sustainment is the ability to sustain combat
operation for a desired period of time. Force structure refers to the unit composition.
Finally, modernization is associated with the aircraft’s technological sophistication.3
This research paper is organized into three chapters addressing readiness, force
structure, and modernization. Following the decisive victory in the 1991 Persian Gulf
War, the reader may question the need for an analysis. Did the US not acquire air
superiority within hours? Did the F-15C not amass a kill ratio of 34 to 0? Was the US
not the envy of the military world as its F-15C units averaged 2.5 sorties per day with over
5,700 sorties?4
The answer is “yes” to all of the above. However, military planning is a dynamic
endeavor. The French Maginot Line serves as a tribute to military leaders who do not
comprehend the importance of changing doctrines. Since the Gulf War, the Air Force
structure has downsized from 38.5 fighter wings to 20 fighter wings, 13 of which are
active duty.5 Current decisions will impact the Air Force well into the twenty-first
century. The US must not plan for the last war.

3
The end of the Cold War resulted in a less defined threat. However, will the Russian
threat remain dormant? The Communist Party gained a large block of congressional seats
in recent elections. Reports from Moscow are replete with nationalist leaders calling for a
return to the Soviet Union. Likewise, China continues to send mixed signals. Will China
continue to grow economically using its increased economic resources to modernize its
military? Recent developments between China and Taiwan illustrate the United States’s
friend-or-foe dilemma with China.
Uncertainties are not confined to the threats of potential adversaries. At the heart of
military planning is how employment of exploding technologies will impact force
structure. Is the world entering a revolution in military affairs (RMA) in which large force
structures will give way to sophisticated technologies? Also, the proliferation of high
technology in emerging nations could seriously compound US military planning. Thomas
A. Keaney points out in the Gulf War Air Power Survey Summary Report that the mating
of stealth and precision weapons was the beginning of the next RMA.6 US doctrine must
respond to this dynamic environment.
Without a doubt, decisions on these issues will affect the United States’s role as a
world power well into the next century. At the root of US military strategy is one
principle that will never, be in question: the absolute necessity for American forces to
command the airspace. This paper explores US air-to-air readiness, force structure, and
modernization as it enters the twenty-first century.

4
Notes
1 AFM 1-1, Basic Aerospace Doctrine of the United States Air Force, vol. 2(Washington, D.C.: GPO, 1992), 292.
2 Ibid.3 Ibid.4 Gulf War Air Power Survey, vol. 5, A Statistical Compendium and Chronology,
(Washington, D.C.: GPO, 1993), 276–77.5 “The US Air Force in Facts and Figures,” Air Force Magazine 78, no. 5 (May
1995): 53.6 Thomas A. Keaney and Eliot A. Cohen, Gulf War Air Power Survey Summary
Report (Washington: GPO, 1993), 168.

5
Chapter 2
Eagle Readiness: The Good
Near-term readiness refers to the ability of US forces to perform theirassigned tasks right now, if called upon to do so. This type of readinessrequires constant attention and to a larger extent, robust operation, andmaintenance planning.
—Secretary of Defense William Perry
Introduction
Of the three pillars in military planning, modernization and force structure share a
long-range perspective, while readiness maintains a near-term focus. Dr William Perry
defines readiness as the ability to mobilize, execute, and sustain forces when requested.1
This chapter examines the readiness issues of the Air Force’s front-line fighter, the F-15C,
and its air superiority mission.
The American public neglected the US military both financially and emotionally
following Vietnam. The term “hollow force” was coined to characterize the readiness
posture of the US military. The hollow forces were plagued with 60 percent mission
capable rates, technician training shortfalls, and a lack of spare parts. The hollow force
failed the Perry test: it couldn’t mobilize, execute, or sustain.
Today, several conditions indicate the US may be heading towards another hollow
force as we make tough decisions to reduce the military budgets. Since 1992, the F-15C

6
fully-mission-capable (FMC) rate has dropped from 83 percent to 76.8 percent2 (See fig.
2-1). Likewise, the F-15C break rate has increased to 18 percent during the same three-
year period.3 Noted lecturer, Franklin C. Spinney stated, “This is the same decision-
making strategy that created the cost-spiral and hollow military of the 1970s.”4 The
effects of a hollow air force in the twenty-first century will be serious.
This chapter analyzes the readiness posture of the F-15C aircraft. Following a review
of the literature on readiness, there is an analysis of the primary factors affecting readiness.
This chapter concludes with recommendations that enhance F-15C employability into the
next century.
Literature Search
The current state of F-15C readiness is a qualified good—a good with trouble on the
horizon, a good compared to a bad force structure and an ugly modernization. F-15C
equipped units can mobilize, engage the enemy, and achieve air superiority. However,
declining FMC rates, increased breakrates, and increased cannibalization rates are warning
indicators of low readiness. The question is: How bad is it, and what can the US do to
avert another hollow force?
Although Mission Capability (MC) rates have decreased slightly, FMC rates have
decreased dramatically in the past three years (See fig. 2-1).

7
70
75
80
85
90
95
100
CY90 CY91 CY92 CY93 CY94 CY95
F-16C (Block 30/40)
F-15C
F-15C vs. F-16C FMC RATES
Source: Lynn Grile, Reliability Analyst, Dynamic ResearchCorporation, 1990-95 F-15C and F-16 maintenancestatistics, 12 Dec 1995.
Figure 2-1. F-15C vs. F-16C FMC Rates
Note the significant decrease in the F-15C and F-16 FMC rates over a period of five years.
These indicators within the fighter community point to possible readiness problems (See
appendix A).
Key military leaders agree—readiness is an issue. General John Nowak, Deputy Chief
of Staff of Logistics, Headquarters, United States Air Force (USAF), identified spare-part
shortages as a readiness problem. Gen Nowak states:
In addition, the readiness spare package fill levels will remain lower thandesired and cannibalization rates will probably drift over the next few years. . . [units] report a decline in readiness spares on hand to fly initial warsurge.5
Col Looney, former wing commander of the 33TFW, appeared before Congress in April,
1994, and supported Gen Nowak’s views on readiness. Col Looney reported having to
lower the combat capability rating in two of his three fighter squadrons because of a
shortage of engine modules.6
The growing controversy over unit readiness in 1994 prompted then Secretary of
Defense, Les Aspin, to create a blue-ribbon panel headed by retired Army General

8
Edward Meyer. General Meyer’s panel reported that although readiness levels were
generally acceptable, there were hollow-force indicators. Gen Meyer stated, “There are
sufficient identifiers and we had better pay attention to them.”7 The panel voiced two
primary concerns: first, a growing number of aircraft maintenance indicators to include
serious F100 engine backlogs in the depots; second, the increased operations tempo due to
the support of humanitarian contingencies.8
Senator John McCain (R-Arizona), a highly decorated Naval aviator, assessed the
situation in a December 1994 Senate Armed Services Committee hearing.
I believe we are now seeing the beginning of a new hollow force . . . they[armed services] are maintaining current readiness at the expense of future,long-term readiness. The services are spending their dollars to keepequipment operating in the high-tempo environment of expandingnontraditional missions, rather than developing and buying modernequipment.9
Read between the lines. Nontraditional missions and long-term readiness? Senator
McCain stated the 1994 defense strategy was to fund near-term readiness in nontraditional
missions at the expense of upgrading force structure. Simply put, Somalia for spare parts
and Haiti for training sorties. But, what is the effect of such a strategy on daily
operations?
Operations Tempo and the Operations and Maintenance Budget
Operations tempo is a key factor in the readiness equation. Evidence supports
Senator McCain’s comments that readiness has suffered because the focus has shifted
away from traditional military missions. Since the end of the Cold War, the US has
provided forces for several major contingencies. For example, the US completed three
times the sorties in Southern Watch as it did in the Gulf War; and flew an additional

9
18,000 sorties in Bosnia. This increased operations tempo affected the force directly and
indirectly.
Secretary of Defense Perry’s annual report specifically addresses the effect recent
contingency operations have had on military Operations and Maintenance (O&M) budgets
and near-term readiness. The report identifies a total of $2.6 billion earmarked for
contingencies in 1994.10 Obviously, the unplanned loss of $2.6 billion in O&M funding
impacts daily operations. President Clinton earmarked an additional $25 billion for
replacement costs over the next six years, but over half of the $25 billion will not be
available until after 2000.11 This has severely strained both training and maintenance
operations.
The readiness of the Air Force and, more specifically, the F-15C aircraft, are directly
affected by the operations tempo of recent years. The O&M budget funds the repair and
procurement of vital parts that comprise the F-15C subsystems (See fig. 2-2).
60
30
10
0
20
40
60
80
100
O&M PROD R&D
FUNDING
PERCENT
BUDGET FUND MAKEUP
Source: Ben Hollingsworth, Financial Manager, WR-ALC/LFCF, memorandum forrecord, 13 Dec 1995.
Figure 2-2. Budget Fund Makeup

10
An interview with Ben Hollingsworth, financial manager in the F-15C Program Office at
Warner-Robins Air Force Base (AFB), highlights the importance of the O&M budget in
daily flying operations. Hollingsworth identified three important O&M funding elements
of the F-15C repair cycle. First, Repairable Support Division (RSD) finances repair of
depot level systems and modules. Second, RSD procurement dollars finance acquisition
of spare parts. Third, System Support Division (SSD) is used for consumable piece-
parts.12 These three funds are the foundation of the depot level repair and parts support
system.
Currently, Hollingsworth feels all three are funded adequately. However, the funding
from 1992 to 1994 was inadequate. During these years the combined shortfall for RSD
funding was almost 60 percent.13 The major shortfalls were in RSD repair accounts and
SSD accounts. This information supports Senator McCain’s statement that funding was
transferred from the support accounts to the contingency accounts.
Since 1994, DOD leaders have personally led the charge for better O&M funds
management. Secretary Widnall stated, “Stability in our O&M budget is key to
maintaining Air Force readiness, and that stability depends on timely funding for
contingency operations.”14 Likewise, General Shalikashvili emphasized the importance of
O&M funding. He stated that although the force structure has been downsized, overall
O&M funding is up 5.6 percent in the 1996 budget.
General Shalikashvili mentioned a similar relationship in the repair process where
aircraft force structure has been reduced about 35 percent, but depot repair funding has
increased by 20 percent.15 By 1995, the O&M budget was funded 117.1 percent.16 This

11
increase is sufficient to overcome the 19.9 percent reduction in 1994. However, as the
F-15C ages more O&M funds are required to fix the aircraft. 17
Obsolescence and the Eroding Industrial Defense Base
Obsolescence is a major source of readiness degradation. Jerry Gibbs, a recognized
industry expert on obsolescence, defines it as the lack of the industrial base to supply the
Air Force with sufficient replacement parts.18 How bad is it? In 1987 there were 201
F-15C part shortfalls, in 1994 there were 2,683.19
Avionics subsystems are the main source of obsolescence.20 Only four industrial
plants remain open for avionics and flight controls. The dramatic drop in manufacturing
capability for the five subsystems will have a severe impact on the readiness of the F-15C.
Jerry Gibbs predicted that by 2001 almost 50 percent of F-15C radar systems will be
obsolete.21 (See table 2-1).
Table 2-1. F-15C Industrial Base Problems
Subsystems Revenue DecreasePlants
Remaining1. Avionics -20.0 % 42. Navigation/Guidance -45.3 % 133. Fuselage (Airframe) -38.0 % 84. Propulsion -8.1 % 65. Flight Controls -2.6 % 4
Source: Briefing, WR-ALC/LFE, subject: Avionics Obsolete Parts, 4 Dec 1995.
The problem is widespread. The main cause is the subcontractor supporting the
prime contractors. A RAND study surveyed 181 companies and discovered alarming
indicators of economic turmoil.22 The study revealed fewer than 300 subcontractors
supporting eight major defense programs. With 194 subcontractors supporting the largest

12
contractor, only 68 subcontractors remain to support the other seven programs.23 There is
a serious shortage of subcontractors.
Migration of microelectronics subcontractors from the defense sector is the primary
reason for the shortage. John Kanz, of the University of Calgary, estimates the
distribution of microelectronics firms is 65 percent focused on the personal computer
market, 12 percent on the automobile industry, and only two percent on DOD.24 This is in
direct contrast to the 1980s when the defense industry dominated the microelectronics
business. Lamar Williamson, Chief of Engineering Division at Warner-Robins Air
Logistics Center (WR-ALC), stated that “subcontractors producing software and
integrated circuits are particularly vulnerable to rapid technology change.”25 Integrated
circuits have a life cycle of six years, while the F-15C’s average age is approaching 15
years. It is extremely difficult to compute long-term maintenance strategies if the
technology is obsolete in six years.
Williamson identified three trends in the electronics industrial base. First, an inverse
relationship exists between extending aircraft service limits and the decreasing life of the
modern electronic and computer products.26 As defense budgets get smaller, existing
aircraft are extended beyond their original service limits to maintain force structures.
Conversely, the life of the electronic product is getting shorter due to technology growths.
These opposing forces are a root cause of obsolescence.
Second, the highly specialized and regulated DOD market does not provide the
market base for companies to survive. With sharp drops in force structure, the number of
weapon systems has decreased dramatically.27 Companies cannot survive on such small
market shares.
13
Finally, during the Cold War era, the Defense Department dominated the industrial
market. Since the end of the Cold War, the free market system has replaced Defense
Department contracts. The market economy is now the force in the electronics industry,
not large, government subsidized contracts.28 Rick Cassidy, Vice President of General
Motors, Military-Space Division, recently supported this when he stated, “Microcircuit
sources haven’t gone away—they have reallocated their resources to what market
demands. There are more manufacturers today than in 1980.”29 If the shift in the defense
industry is affecting readiness in 1994 with 15 year old F-15Cs, how can the Air Force
manage these problems in 2010 with much older aircraft? The Air Force appears to be
aggressively working the problem.
Interviews with Jerry Vaughn, Avionics Manager from WR-ALC, indicate the F-15
System Program Office has a plan. Although not economical, Vaughn prefers a one-time
buy which ensures supply throughout the life of the system.30 He also suggests clones and
reengineered parts manufactured as substitutes for original components. Finally, Vaughn
identifies sunset manufacturers as a new type of vendor. Sunset manufacturers produce
obsolete parts original manufacturers have discarded. These contractors have emerged
due to the increased obsolescence problem.
As a stop-gap solution to the obsolescence problem, the depot has signed a support
contract with Unohali Corporation. This firm provides electronic parts obsolescence
management. Jerry Gibbs, a manager for Unohali, says his company conducts surveys of
suppliers for F-15C avionics components.31 The surveys forecast potential part shortages,
alerting the depot to future shortfalls.32 Companies emerging as obsolescence managers to
fill specialized markets illustrate the obsolescence problem.

14
As the rate of technology accelerates, the problem of obsolescence will require
greater management attention. However, innovative approaches such as those
demonstrated by Vaughn and Gibbs reduce the effects of the obsolescence problem. Yet,
innovative approaches are not limited to obsolescence.
The Logistic Repair and Supply Cycle
The logistic repair and supply cycle is a critical feature in the investigation of F-15C
readiness. The most advanced fighters are useless if they do not possess the logistic
system to sustain their operations. History is full of examples of powerful armies who
were vanquished for the lack of sustained logistics support: Napoleon in Russia, Field
Marshall Rommel in North Africa, and Field Marshall Paulus in Russia.
Today’s F-15Cs share a similar dependency on logistics. Unfortunately, the current
system is inefficient and desperately requires a facelift. A recent RAND report indicates
the current DOD logistic system has “relied on a mass-logistics paradigm.” 33
The bulk logistic moving system used today can be traced back to the grandiose
logistic buildups of WWII campaigns such as the Normandy invasion.34 General Yates,
past commander of Air Force Material Command, stated:
We used to say, extra inventory, extra aircraft and we’ll be safe. We can’tafford that any longer. We’ve got to take some risk and focus on just-in-time inventory rather than just-in-case inventory.35
However, the current logistics system is still geared for large bulk shipments to halt a
Soviet advance through the Fulda Gap.36 Although effective in historical military
contingencies, it is not efficient with modern technologies. A 1994 RAND study showed
average parts-on-order time of 30 days, with some exceeding 100 days.37

15
The Air Force is trying innovative approaches to solve these problems.38 There are two
major programs to improve readiness: the realignment of the configuration management
from WR-ALC to the Defense Logistics Agency (DLA) and Lean Logistics.
The transfer of configuration management from the depot to DLA created some initial
problems. The DLA organization was accustomed to bulk procurements. DLA did not
understand the importance of individual parts and their effect on the mission status of
individual F-15Cs.39 The transfer of responsibility to DLA created a dual management
system that obscured the unity of command concept with the depot personnel backing up
the DLA ordering process.40 A RAND study determined “DLA’s use of fill rates to metric
customer satisfaction resulted in DLA managers gaming the system by stressing high
volume, low dollar items in place of high dollar, low volume, like aircraft parts” (Emphasis
added).41 Fortunately, DLA confirms the process is improving as management transfer
matures.42 The results are not as favorable with Lean Logistics.
The Lean Logistics program is a reengineering distribution process like those
completed successfully in the commercial transportation industry. It is based on three
fundamental concepts: development of commercial-like point-to-point transportation
systems; reductions in repair cycle times associated with the two-level maintenance
concept; and dramatic reductions in inventories of supplies and equipment using just-in-
time logistics.43
A 1994 RAND study determined “The commercial industry recognized great
improvements in process measurements and most importantly customer satisfaction
through reorganization”.44 Another RAND study compared DOD and commercial
ordering and shipping times45 (See table 2-2).

16
Table 2-2. DOD and Commercial Ordering and Shipping Times
Process DOD Commercial Commercial1. Distribution 26 Days 1 Day (Motorola) 3 Day (Boeing)
2. Repair (Electronic) 8-35 Days 1 Day (Compaq) 10 Days (Boeing)
3. Repair (Mechanical) 40-144 Days 3 Days (Cummins) 14 Days (Boeing)
Source: Kenneth Girardini, et al., “Improving DOD Logistics,” RAND Report (SantaMonica, CA: RAND Corporation, 1995), vi.
A strong case can be made for change in the military transportation and repair system.
Preliminary data supports point-to-point transportation innovations. However, the results
are mixed for the two-level maintenance portion of Lean Logistics.
The RAND Corporation conducted an evaluation of the two-level maintenance
system. The study indicated savings in the two-level maintenance system were greatest
when managers concentrated efforts on reducing transportation and base processing times.
The two-level concepts saved $96.9 million. Savings resulted from reducing transporta-
tion time using commercial express delivery service and shortened base processing times.46
Although the programs are still developing, the two-level avionics program looks very
promising. Secretary Widnall wrote in a recent article that the avionics repair pipeline
times have been reduced by 66 percent (See fig. 2-3).47

17
0
5
10
15
20
25
1985 1990 1995
AVIONIC MAINTENANCE PIPELINE TIMES
DAYS
Source: Sheila E. Widnall, “Widnall Assesses the Force,” Air ForceMagazine 78, no. 4 (Apr 1995): 33.
Figure 2-3. Avionic Maintenance Pipeline Times
However, reported savings should be viewed with caution. Air Mobility Command
(AMC) and Air Combat Command (ACC) tests confirm preliminary field data which show
significant savings in the avionics two-level.48 Yet, serious doubts exist in the propulsion
two-level program. Long delays in the repair cycle have seriously affected readiness at
several F-15C bases. Unofficially, depot officials confirmed the two-level program for
engines will stop in the near future.49
While the readiness posture is favorable for the near-term, several indicators are
troubling. The remainder of this chapter will analyze near-term readiness and evaluate
current readiness indicators. The analysis suggests the US may be in the embryonic stages
of a hollow force.

18
Methodology for Readiness
Data Collection Method
The authors collected historical maintenance data from three sources. First,
WR-ALC provided an F-15C database that possessed the maintenance statistics from
1990 to 1995 for all F-15C aircraft. Mr. Jeff Hill, data manager at WR-ALC, collected
data from the Tactical Interim Cams and Remis Reporting System (TICARRS)
maintenance database.50 Second, Dynamics Research Corporation (DRC) prepared a
similar database for approximately 300 F-15Cs assigned to operational units.51 The DRC
database also provided F-16 data on all Block 30/40/50 aircraft. In addition, the Air Force
Logistics Management Agency provided quarterly maintenance reports from the three
major commands. This data was similar to DRC and TICARRS, but specific to the
individual major commands.
In addition to maintenance data, WR-ALC provided a thorough budget history of the
F-15C’s RSD buy, RSD repair, and SSD accounts. The funding data was used in
conjunction with the maintenance data to identify any correlation between the two funds.
The raw data was used to develop graphs tailored to this specific investigation.
Statistical Trend Analysis
The statistical analysis process conditioned the maintenance data. Trend analysis
identified the key factors influencing the FMC rate, the overall best indicator of readiness.
This study centered around the sharp decline in FMC rates since 1992. Three potential
causes were analyzed: aging of the aircraft, spare parts availability, and operations tempo
related to O&M funding.

19
This study investigates the aging aircraft theory using three methods. First, data from
older F-15C aircraft units was compared with newer units. Second, statistics comparing
aging between the F-15 and the F-16 were analyzed. Finally, the F-15C breakrate
indicators were studied for possible trends.
Regression Model Analysis
The analysis used data from both WR-ALC and DRC in the Interactive Statistical
Program (ISP) to perform multiple regression analysis.52 This method used FMC as the
dependent variable and the factors identified in the statistical analysis as independent
variables. The model was first verified for accuracy using standard practices with both a p
test and a t test.
The regression analysis yielded two products that were used for further analysis.
First, a regression coefficient table was used to determine the interrelationships between
the variables in both magnitude and direction. Second, a prediction equation was
generated and verified. Then, it was compared to the actual FMC trend and an evaluation
was conducted to determine possible effects of various fluctuations in the independent
variables. The results of three hypothetical scenarios (best case, worst case, most-likely
case) were then graphed and analyzed.
Assumptions
1. The Mission Capable MC rate is a function of the subjectivity of the unit reporting.The FMC rate represents a more accurate test of readiness then the MC rate.
2. The lag between increased RSD funding and actual field improvements is twoyears. Due to the lead time in contractual and production times, the effects of theincreased funding lags behind the allocation dates.
3. The transfer of O&M funds during the 1992 to 1994 contingency operations wastaken from accounts which affect base or depot level operations.
20
4. The effect of the selected maintenance indicators include the effect on unit training,leadership, organization, and experience levels. The local makeup of the unit is notsystemic to the aircraft analysis.
Statistical Readiness Analysis
This section uses statistical analysis techniques to investigate three areas: aging
aircraft effects, supply cycle and part availability, and funding shortfalls. The analysis will
determine the main contributing sources influencing F-15C readiness and identify if the
sources are systemic to the aircraft. From this analysis, two critical questions can be
answered. Will F-15C readiness continue to decline and curtail plans to extend F-15C
service life limits to 2014? How can resources be used to manage the F-15C into the
twenty-first century? Both questions are a function of the aircraft’s age.
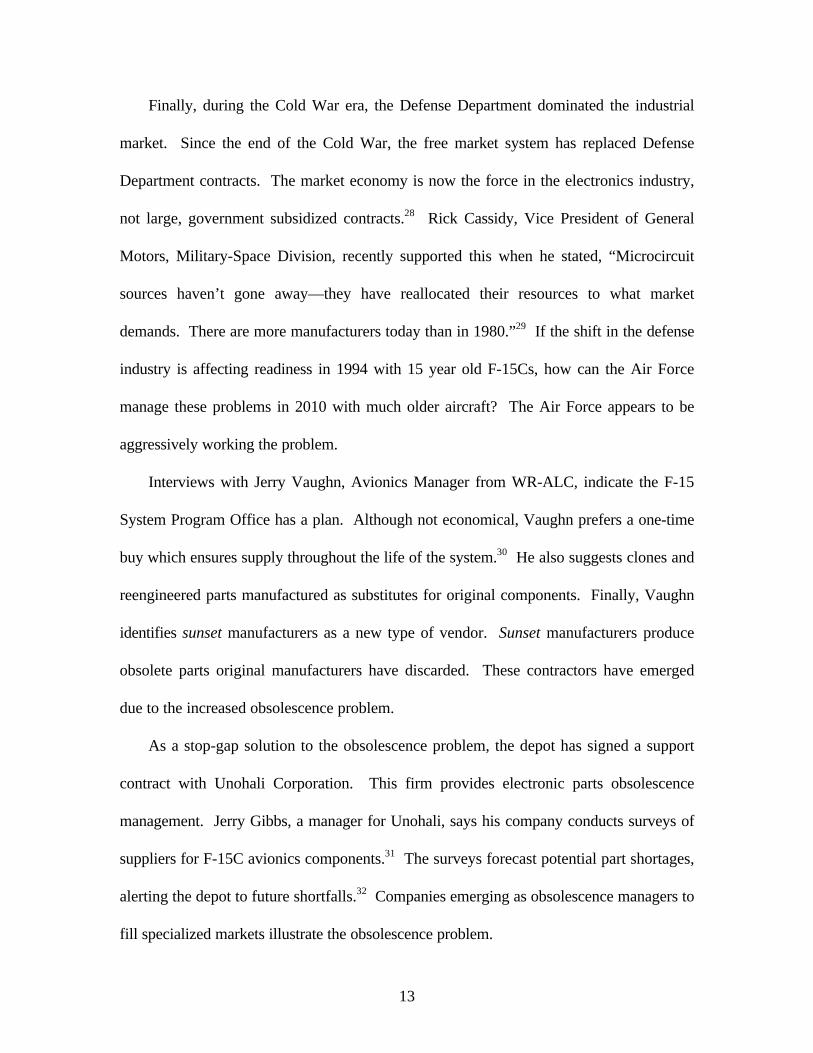
Aging Aircraft Syndrome: Is it a Readiness Factor?
The aging aircraft syndrome means that the mission capability of an aircraft follows a
reverse-bucket shape. In the earlier years of production, mission capability is lower due to
the new equipment.53 After the “bugs are worked out” and the maintainers gain
experience, the mission capability of the aircraft stabilizes at a higher level. The higher
level holds somewhat constant until the age of both the airframe and major subsystems
approach their service limits.
The Air Force measures the F-15C service life limits using flying hours. Originally,
the design limit of the F-15C was 4,000 hours. In 1995, Wright Laboratory structurally
tested the F-15C airframe to 18,000 hours without any significant cracks.54 Based on the
success of the testing, sources predict the Air Force will extend the original service life

21
from 4,000 hours to at least 8,000 hours.55 With today’s average fleet age of 3,400 hours,
an increase to 8,000 hours would extend the F-15C to at least 2014.56
In 1996, 32 percent of the F-15Cs are 9 to 12 years old; 51 percent are 12 to 15 years
old; and 17 percent are aged between 15 and 18 years.57 The oldest F-15Cs were
produced in 1978, the newest in 1986. An extension of the F-15C to 2014 will result in
36 year old airframes (See appendix D). As can be seen, how well the airframe ages is an
important readiness factor (See fig. 2-4).
0
5
10
15
20
25
30
35
86 90 95 00 05 10
F-15C
All Fighters
AGE OF F-15C FLEET SINCE 1987(overlayed with All US Fighter's Age 1986-1999)
YEARS
Source: Lynn Grile, Reliability Analyst, Dynamic Research Corporation, 1990-95 F-15Cand F-16 maintenance statistics, 12 Dec 1995.
Figure 2-4. Age of F-15C Fleet Since 1987
With production of the F-15C stopping in 1986, each year projects a linear aging
fleet. Hence, by 2010 the fleet will be approximately 30 years old. What compounds the
aging problem is that the F-15C is just part of an entire tactical fighter force that is also
aging. The overall tactical fighter fleet follows a similar trend. Today, the average age of
all fighters is 12 years. The average age of these fighters will be 18 years by 2010. At this
point, nearly 10 percent of the tactical fighter force will exceed their designed retirement

22
age.58 The simultaneous aging of both the F-15C and F-16 could lead to serious
problems. The tactical force is already stressing the parts and maintenance cycle due to
aging. Any attempt to replace the F-15C and F-16 simultaneously would also create a
serious draw on limited acquisition funding. Does an aging F-15C fleet have an impact on
readiness? Four different F-15C bases where analyzed (See fig. 2-5).
60
65
70
75
80
85
KADENA ELMENDORF LAKENHEATH EGLIN
1978 1979
19861983
FMC RATES
1995 FMC RATES: OLD vs. NEW
Source: “The CBO’s Air Force,” Air Force Magazine 78, no. 3 (Mar 1995): 30.
Figure 2-5. 1995 FMC Rates: Old vs. New
The relationship is directly reverse what we would expect. Kadena and Elmendorf,
the two oldest F-15C units, possess the highest annual FMC rates for 1995. On the other
hand, Lakenheath has the newest models with only a 75.6 FMC rate. Likewise, Eglin has
1983 models and possesses a 76.9 FMC rate.
It appears the FMC statistics do not support the aging airframe theory. However,
other factors are at work. For example, the Lakenheath and Eglin squadrons maintained a
high operations tempo in 1993 and 1994 with extended deployments while Kadena and
Elmendorf stayed home.59 Also, both Eglin and Lakenheath possess the F100-PW-220
engine, while Elmendorf and Kadena possess the F100-PW-100 engine. Although the -100

23
has a higher unscheduled maintenance rate than the -220, the -220 engine has had severe
parts shortages in the last two years.60 Hence, the data does not support aging as a major
contributor to a decline in mission capability.
Although this paper addresses the F-15C as the primary air-to-air fighter, a contrast
analysis of the F-16 provides an additional perspective into the aircraft aging process (See
fig. 2-6).
70
75
80
85
90
95
100
CY90 CY91 CY92 CY93 CY94 CY95
PERCENT
Block 50s
Block 40s
Block 30s
F-16 FMC RATES 1990-1995(Block 30/40/50s)
Source: Lynn Grile, Reliability Analyst, Dynamic Research Corporation, 1990-95F-15C and F-16 maintenance statistics, 12 Dec 1995.
Figure 2-6. F-16 FMC Rates 1990-1995
There are two very important observations. First, there is a correlation with aging. As
aircraft get older they decline in reliability. Both the Block 30s and the Block 40s decline
at a parallel rate. Second, and more importantly, the trends follow a similar pattern to the
F-15Cs. Three different weapon systems, yet FMC rates in all three drop dramatically
from 1992 to 1995. From an aging aircraft perspective this should not happen. Even the
new Block 50s have dropped almost 10 percent, from 93.6 percent in 1993 to 84.9

24
percent in 1995. Factors other than aging are influencing the mission capabilities of both
the F-16 and F-15.
Another key trend that disproves the aging aircraft theory is the breakrate trend of the
F-15C. Breakrate measures the number of code three system reports following each
sortie. A code three report identifies a major system failure which renders that aircraft as
NMC (See fig. 2-7).
0
5
10
15
20
25
90 91 92 93 94 95
1990-1995 F-15C BREAKRATES
P
E
R
C
E
N
T
Source: Lynn Grile, Reliability Analyst, Dynamic Research Corporation, 1990-95F-15C and F-16 maintenance statistics, 12 Dec 1995.
Figure 2-7. 1990-1995 F-15C Breakrates
The breakrate does not indicate a systemic increase in code threes. The trend is positive.
But, the trend is relatively flat from 1992 forward. Local preventive maintenance
programs and a robust subsystem modernization program can manage the breakrate
problem. The breakrate data is directly linked to aircraft aging. Close scrutiny of this
indicator will flag long-term aging problems.
In summary, the analysis does not support a theory that the F-15 is aging beyond
normal levels. Aging aircraft require additional maintenance and sustainment efforts. The

25
system is not age-limited if the proper maintenance upgrades are accomplished. Based on
analysis from both F-15Cs and F-16s, other factors have accelerated the deterioration of
the mission capability rates.61 One of these factors is funding of spare parts.
Spare Parts And The Supply Cycle: How Bad Is It?
The analysis examined three parameters relating to the parts problem: total non-
mission capable supply (TNMCS) rates; cannibalization rates; and repair cycle times. The
TNMCS rate represents a history of supply requisitions (See fig. 2-8).
4
6
8
10
12
14
90/2
90/4
91/2
91/4
92/2
92/4
93/2
93/4
94/2
94/4
95/2
95/4
F-15C TNMCS RATE 1990-1995
RATE
Source: Lynn Grile, Reliability Analyst, Dynamic Research Corporation,1990-95 F-15C and F-16 maintenance statistics, 12 Dec 1995.
Figure 2-8. F-15C TNMCS Rate 1990-1995
This trend depicts trouble on the horizon. Again, like FMC rates, 1992 to 1994 were
pivotal years. The dramatic increase in TNMCS from 7.9 percent in 1991 to 10.8 percent
in 1993 explains a similar decline in FMC rate during the same period.
The analysis revealed a key factor that influenced the increased TNMCS rates: a
large mismatch between required and actual depot funding from 1992 to 1994.62 Funding
was reduced below required levels in four major funding categories:

26
1. RSD Funds for Parts Procurement.2. RSD Funds for Depot Level Repairs.3. SSD Funds for Expendable.4. O&M Funds for Daily Operations.
The universal drop in all funding categories coupled with an increased operations tempo is
at the very root of the parts shortages from 1992 through 1995. A review of each funding
source provides an excellent case for placing the readiness concerns of 1996 on the
funding limitations of 1992 to 1994—not aging aircraft or two-level maintenance.
RSD Funding: The Root Of The FMC Problem
RSD funding provides the required funds for depot repairs and for new or overhauled
components.63 There was a shortfall in these funds from 1992 to 1994 (See fig. 2-9 and
fig. 2-10).
0
10
20
30
40
50
60
FY92 FY93 FY94 FY95 FY96 FY97 FY98
OBLIGATION AUTH
REQUIREMENT
WR-ALC/LFRSD REPAIR REQMNT ($M)
M
I
L
L
I
O
N
$
Source: Ben Hollingsworth, Financial Manager, WR-ALC/LFCF, memorandum forrecord, 13 Dec 1995.
Figure 2-9. WR-ALC/LF RSD Repair Requirement

27
0
10
20
30
40
50
60
70
80
90
FY91 FY92 FY93 FY94 FY95 FY96 FY97
OBLIGATION AUTH
REQUIREMENT
WR-ALC/LFDO41 REQUIREMENT (RSD BUY) ($M)
M
I
L
L
I
O
N
$
Source: Ben Hollingsworth, Financial Manager, WR-ALC/LFCF, memorandum forrecord, 13 Dec 1995.
Figure 2-10. WR-ALC/LF DO41 Requirement (RSD Buy)
This shortfall resulted in the inability to replace deficient line replaceable units (LRU) or
shop repairable units (SRU) (See table 2-3).
Table 2-3. RSD Buy and Repair
Fund Type FY92 FY93 FY94 FY95 FY96RSD Buy % -57.9 -57.1 -33.8 0.0 0.0
RSD Repair % -29.1 -3.3 -11.9 0.0 0.0
Source: Ben Hollingsworth, Financial Manager, WR-ALC/LFCF, memorandum forrecord, 13 Dec 1995.
Drastic shortfalls severely affected the ability to repair bad components and the ability
to buy new components: especially, the RSD buy shortfalls. Fifty-seven percent shortfalls
in FY 1992 and FY 1993 placed the LRU/SRU supply inventory into serious disarray.
Consequently, the supply system was unable to meet the LRU and SRU demands at the
base level. This forced maintainers to use cannibalization techniques to keep the F-15C
flying.

28
Cannibalization is the maintenance action of removing a good part from one aircraft
to fix another aircraft. Maintainers consider cannibalization actions as a last resort
because they double the workload. It is an inefficient maintenance action that is
completed when the supply system cannot provide the parts required. Sixty percent
shortfalls in RSD new-buy funding in FY 1992 to 1994 planted the seeds of the increased
workload. A review of past cannibalization rates illustrate how the RSD and SSD
shortfalls affected F-15C maintenance units. Using the trend-rate line, cannibalization
rates increased by almost 50 percent from 1990 to 1995. The increase in cannibalization
rates in the last five years indicates an increased maintenance tempo to solve spare part
shortfalls (See fig. 2-11). The F-15C engine is one of the subsystems most often
cannibalized.
0
5
10
15
20
90/2
90/4
91/2
91/4
92/2
92/4
93/2
93/4
94/2
94/4
95/2
95/4
F-15C CANN RATE (1990-1995)
P
E
R
C
E
N
T
Source: Jeff Hill, TICARRS Database Manager, WR-ALC/LF, 1990-95 F-15Cmaintenance statistics, 6 Dec 1995.
Figure 2-11. F-15C Cannibalization Rate (1990-1995)
Two engine models propel the F-15C: the F100-PW-100 in the aircraft produced
before 1983, and the F100-PW-220 in aircraft produced after 1983. Three observations

29
were discovered during the engine RSD funding analysis: first, the older -100s have a
much higher breakrate than the -220s; second, although the -220 has higher reliability, it
has a shortfall of RSD funded modules; and last, both engines possess very high scheduled
fan inspection requirements.64
The -100 engine has a 60 percent higher unscheduled engine removal (UER) rate than
the much more reliable -22065 (See fig. 2-12).
0
1
2
3
4
5
86 87 88 89 90 91 92 93 94 95 96
F100-PW-100 & F100-PW-220
U
E
R
/
1
0
0
0
E
F
H
F-100-PW-100
F-100-PW-220
Source: Fred Mullis, Pratt & Whitney Customer Service Rep, P&W SA-ALC, USAFEF100 Overview: Mar 94-Mar 95 (DO42), 12 Dec 1995.
Figure 2-12. F100-PW-100 and -220 UER Rate
While the -220 enjoys a much lower UER rate, it also suffers from a serious shortage
of modular parts due to RSD shortfalls and RSD repair funding at the depot level from FY
1993 to FY 1994 (See fig. 2-13).

30
50
100
150
200
250
FY92 FY93 FY94 FY95 FY96 FY97 FY98
RSD REPAIR FUNDINGF-100 ENGINES
M
I
L
L
I
O
N
$
Source: Debbie Delano, F100 Turbine Manager, SA-ALC/LP, telephone interview withauthor, 25 Mar 1996.
Figure 2-13. RSD Repair Funding, F-100 Engines
As in WR-ALC aircraft funding, the San Antonio Air Logistics Center (SA-ALC)
engine funding had similar shortfalls of nine percent in FY 1993 and 21 percent in FY
1994. Like airframe funding, the engine funding was raised to 100 percent starting in
1994, but units still suffered from the lag between funding and production.66
SSD Funding: Big Dollars For Little Parts
Likewise, the SSD funding saw dramatic funding cuts during the same period. SSD
funds purchase what maintainers refer to as piece-parts. These are small parts that are
attached to RSD components. Although far less expensive than RSD components, they
are still vital to the mission capability of the F-15C. For example, an F-15C costs $35
million. However, it isn’t FMC unless the multi-purpose color display (MPCD) has the
$6.10 attachment on the control panel. Currently, MPCDs are in critically short supply

31
because of SSD piece-part funded attachments on the panel.67 The SSD and RSD
shortfalls are similar (See fig. 2-14).
0
10
20
30
40
50
60
FY91 FY92 FY93 FY94 FY95 FY96 FY97 FY98
OBLIGATION AUTH
REQUIREMENT
WR-ALC/LFDO62 REQUIREMENT (SSD) ($M)
M
I
L
L
I
O
N
$
Source: Ben Hollingsworth, Financial Manager, WR-ALC/LFCF, telephone interviewwith author.
Figure 2-14. WR-ALC/LF DO62 Requirement (SSD)
SSD shortfalls were 60 percent from FY 1992 through FY 1994. Although SSD and
RSD were funded 100 percent in FY 1995 and FY 1996, the problem will continue for at
least another 24 months.68 This is due to the long lead time from funding authorization to
actually placing the part in the supply bin. Hopefully, continued 100 percent funding of
RSD and SSD will replenish the LRU inventories.
O&M Funding: Money for Daily Operations
O&M funding follows the same pattern as RSD and SSD funding. The O&M budget
was reduced 25 percent in FY 1992 and FY 1993. Granted, a 25 percent reduction may
appear reasonable with the force structure drawdowns of FY 1992 to FY 1994. However,
the 25 percent reduction in O&M funding in FY 1992 to FY 1993 did not correspond to a

32
reduction in F-15C operations tempo. In fact, the F-15C operations tempo actually
increased by 8.7 percent.
Two major events occurred simultaneously that directly influenced O&M funding.
First, the USAF supported the Kurds in Northern Iraq and the Shiites in Southern Iraq
following the 1991 Gulf War. The F-15C was used to support these two unplanned
contingencies. Second, the drawdown reduced squadron primary assigned aircraft (PAA)
from 24 to 18 per squadron. In essence, the two major events of 1992—continued
deployments in the Gulf and defense force structure reductions—acted independently to
increase the operations tempo. General Fogleman best summarized the O&M budget
controversy when he addressed troops in the Gulf:
We are not funded for contingencies and crisis: It becomes critical . . . thatCongress provide US supplemental dollars or a hollow force looms on thehorizon.69
O&M funding was further degraded by DOD budget allocation decisions. From FY
1990 to FY 1995 DOD continually increased allocated O&M funding from conventional
unit flying programs to nontraditional defense funding authorizations such as
environmental cleanups, drug interdiction, peacekeeping, economic base conversions and
noncombatant medical research.70 The government spent $3.1 billion in FY 1990 on non-
defense missions and $13.3 billion in FY 1995. This steady transfer of funds further
strains an already limited O&M budget.
There are several key factors that are the primary forces generating declines in the
readiness indicators. Most notably, across-the-board reductions in RSD buy funds, RSD
repair funds, SSD funds, and O&M funds. Yes, aging aircraft is a significant factor,

33
however, the primary factor is the RSD and SSD funding shortfalls and the subsequent
shortage of depot level repairs.
Readiness Analysis Using Modeling Techniques
The second method of analysis applied multiple regression techniques on the four
factors that were identified as possible influences on F-15C readiness. By inputting
historical data into a multiple regression model, the study investigated the decline in FMC
from 1990 to 1995.
Why a multiple regression analysis? In Practical Business Statistics, Paul Siegal
identified three reasons justifying multiple regression analysis:71
1. Analyze a complex relationship consisting of many independent variables.2. Forecast or predict future trends.3. Process control by identifying internal and external trends.
This study analyzed the independent variables influencing the F-15C FMC rate and
investigated the relationships between those variables. Also, the regression analysis
provided a prediction equation that can assist the logistics managers with factors affecting
future FMC rates. The analysis discovered several key relationships between internal and
external relationships. The model analysis compliments many of the points developed in
the previous section’s analysis of maintenance statistics.
The Interactive Statistical Program (ISP) related the selected dependent variable
(FMC) with six independent variables: TNMCM, TNMCS, breakrate, could-not-duplicate
(CND), SSD shortfalls, and O&M funds. The data represented the period from 1990 to
1995 organized in a matrix of 23 statistical observations (See table B-3).

34
Three tests determined the statistical significance of the variables: the f-test for
overall model significance; the t-test for individual model significance; and the p-test for
individual variable significance.72 All results fell within normally accepted statistical
ranges. The ISP identified the regression model as very highly significant—the highest
category which equates to a 99 percent confidence level (See appendix C-2).
Regression Analysis: FMC Variable Relationships
The model provided coefficients from the regression analysis which illustrate the
interrelationships of the model coefficients and their respective variables (See appendix B).
The range of coefficient was between +1 and -1. The stronger the relationship between
variables, the closer to an absolute value of 1.73 The closer values are to 0, the weaker the
relationship between the two variables. Not surprisingly, very strong relationships exists
between the TNMCM, breakrates, and FMC rates.
Likewise, moderately strong relationships exist between SSD, TNMCM and CND
rates. Recall that SSD funding supports all consumable piece-parts. The more
maintenance work, the higher the consumption of SSD funded bolts, washers, rings, etc.
In fact, the SSD maintenance relationship would be higher than .470 if consumables were
not purchased in high volume, resulting in a time-lag between usage and order.
The regression coefficient between O&M and TNMCM was + .405. Increased O&M
funding means more repair dollars at the base level. However, the primary function of
O&M dollars is to support the annual flying program.74 Therefore, increased O&M
funding increases the rate of flying which in turn increases the breakrates and TNMCM.
This example points out the advantage of multiple regression because more than one

35
variable is used in the analysis. Increased O&M funding improves the support process at
the base level; but, it also increases operations tempo.
The regression coefficients analysis provided several results which initially appeared
reversed. For example, the TNMCS and FMC had a +.196 relationship—low in
magnitude, and wrong in direction. The increase of NMC supply time should decrease,
not increase the FMC rate. The positive relationship can be explained by analyzing the
strong negative relationship between TNMCS and TNMCM of -.626. Maintainers
attempt to minimize TNMCM at all cost, including breaking another F-15C to get the part
for a scheduled aircraft. Hence, the real world relationships between TNMCS and
TNMCM explain the results of the regression between TNMCS and FMC. Because the
FMC rate is more directly a result of maintenance, the relationship between supply and
FMC is overshadowed and places the supply rates in direction of the FMC rate.
Supporting this thesis is a -.375 inverse relationship between breakrate and supply.
TNMCS affects FMC negatively, but the strong inverse relationship with the other
maintenance metrics provides a statistically correct, but real-world anomaly between
TNMCS and FMC.
Similarly, the coefficient table yielded a -.374 correlation between O&M and FMC.
How could increases in O&M cause decreases in FMC rates? Obviously, the overall
analysis must consider other variables. Increased flying hours drive up maintenance as
O&M funding grows. These increases have strong adverse relationships with FMC which
supersede the positive relationship between O&M spending and FMC rates. Bottom line:
increased O&M dollars do buy more parts, but also buy more flying, which breaks more

36
aircraft. The -.375 regression coefficient proves O&M has a stronger relationship with
flying than with fixing.
The complex relationship between the many variables affecting FMC rate, and
subsequent readiness, illustrates the difficulty for the maintenance planner. All these
variables should be considered whether planning long-term preventative maintenance
programs or deciding where to spend scarce dollars. The process is complex. Regression
analysis is a valuable tool to assist in that decision-making process.
This section illustrated the advantages of regression analysis in decision-making. The
limited scope of this study cannot provide the detailed regression analysis required for a
complete analysis of the readiness controversy. However, this section revealed the
benefits of regression analysis for the maintenance planner. For example, there were
significant shortfalls from 1992 to 1994 in RSD actual and required funding that resulted
in reduced FMC rates. Regression analysis could have identified the relationships between
the different levels of shortfalls and the FMC rate. A thorough staff study, well versed in
regression analysis tools, could provide an excellent view of the results of such drastic
reductions.
Regression Analysis: Forecasting FMC
The regression analysis provided the coefficient constants to develop a prediction
equation.75 This equation started with the standard form:
Y=a+b1x1b2x2+...+bpxp.
Using the coefficients provided from the regression analysis the following prediction
equation was developed:76 (See appendix C).
FMC=107.7-1.3(TNMCM)-.6(TNMCS)-.2(BRK)-.3(CND)-2.0(SSD)-.1(O&M)

37
This prediction equation is a valuable tool to determine effects of changes in the
independent variables. For example, future levels of funding can be inserted to predict the
effects on FMC. Figures 2-15, 2-16, and 2-17 provide three FMC scenarios: best case,
worst case, and most likely case. The results illustrate the benefits of a prediction
equation. In addition to forecasting possible FMC curves, the prediction method also
serves as an excellent vehicle to analyze the sensitivity of the FMC curve to corresponding
changes from inserted variables (See appendix C).
FMC FORECAST (Worst Case)
72
74
76
78
80
82
84
1990 1991 1992 1993 1994 1995 1996 1997 1998 1999 2000
Source: ISP version 4.6, Lincoln Systems Corporation, Westford, MA.
Figure 2-15. FMC Forecast (Worst Case)
The worst case scenario led to increases in breakrates from 17 percent to 19 percent
from 1996 to 2000; SSD funding reductions by 66 percent; increases in TNMCM from 13
to 15 percent; and TNMCS increases from 10 to 12 percent. All values were based within
the range of previous parameters adding to the realism of the scenario. The slight FMC
increase from 1996 to 1997 illustrates the importance of the breakrate input. The FMC
rate did not decrease until the breakrate increased to 17 percent in 1998. The worst case
scenario depicts breakrate as the most important factor to improve the FMC rate. Slight

38
improvements in subsystem upgrades would achieve the two or three percentage points
required to drive the FMC curve upward. (See appendix C).
FMC FORECAST (Best Case)
72
74
76
78
80
82
84
1990 1991 1992 1993 1994 1995 1996 1997 1998 1999 2000
Source: ISP version 4.6, Lincoln Systems Corporation, Westford, MA.
Figure 2-16. FMC Forecast (Best Case)
The best case scenario results from realistic increases in almost all values. The
unrealistic portion of this scenario is not in the magnitude of the improvements, but in its
breadth. It is highly unlikely the Air Force could fund programs to improve all areas. Key
input values include a breakrate reduction from 17.9 percent to 9.0 percent and reduction
of supply rates from 10.5 to 7.0 percent. These are realistic numbers based on past
performance, but it is unlikely funds will be available to improve all of them. The best
case inputs only increase the FMC rate to 84 percent, slightly above the standard MC
value of 83 percent. This is profound because even the best case improves the FMC rate
to just above standard values. (See appendix C).

39
FMC FORECAST (Most Likely Case)
72
74
76
78
80
82
84
1990 1991 1992 1993 1994 1995 1996 1997 1998 1999 2000
Source: ISP version 4.6, Lincoln Systems Corporation, Westford, MA.
Figure 2-17. FMC Forecast (Most Likely Case)
The most likely case resulted from more conservative inputs in both magnitude and
breadth. In the most likely case, breakrates were only decreased by 2.9 percent, supply
rates by 1.5 percent, and total maintenance time by 1.4 percent. With no surprise, these
small improvements only resulted in marginal effects on FMC. This reveals that unless the
F-15C is upgraded in key subsystems such as radar, engines or secondary structures, low
FMC rates will be the norm (See appendix C).
The three scenarios illustrate the sensitivity of the FMC curve to several key
parameters, most notable breakrates. The analysis depicts the importance of regression
modeling in long-term maintenance planning. In the modernization chapter, subsystem
upgrades will be evaluated that can actually improve the breakrates to achieve the desired
improvements in FMC projections.
Regression analysis provides a valuable tool to evaluate trends from past histories to
predict future effects of various budget and force decisions. Specifically, the analysis
provided an evaluation of the FMC rate, the most prominent readiness concern for the

40
F-15C. Analysis of the regression model yielded several important observations. The
FMC rate is a function of many complex interrelationships. As expected, maintenance
actions reflected in TNMCM and breakrates had a strong affect on the FMC process.
However, the regression analysis provided insights into more complex, less noticeable
maintenance factors. SSD, O&M and RSD were identified as key players in the process,
both with FMC and with each other.
In addition, the regression analysis produced a prediction equation that forecasts
FMC rates based upon variations in a set of measured variables. Although more detailed
regression analysis is required for real-world decision-making, the prediction equation
provides approximations that support the case for regression analysis as an additional tool
in the maintenance planner toolbox.
Recommendations
Recommendation One
A model should be developed relating readiness to the three types of funding (RSD,
SSD, and O&M). The regression analysis model developed in this section demonstrated
the basic principles. The key to long-term planning is an accurate forecast of the
relationship between RSD and SSD funding, O&M funding, and readiness.
Recommendation Two
Streamline the logistics system. The current system is efficient for large bulk
shipments but inefficient in moving small quantities point-to-point. The improvements in
transportation in the commercial industry must be explored for further transition to the Air

41
Force logistic system. Granted, the two-level engine concept appears unsuccessful; but,
the avionics initiative appears to be working. Significant gains can be achieved.
Recommendation Three
Create an obsolescence review board to investigate the growing obsolescence
problem. Obsolescence is currently at the embryonic stage and it must be closely
observed. It could expand beyond manageable levels. Similar problems existed in the
aircraft industry in the interwar years and the Morrow Board created government
sponsored research programs to keep the aircraft industry viable.77 A panel of national
experts on logistics, acquisition and the industrial base should formulate a national long-
range strategy with emphasis on the microelectronics industry.
Recommendation Four
Closely monitor the indicators related to the aging aircraft syndrome. Currently, the
situation is manageable. However, if the F-15C is extended out to 2014, indicators must
be observed for major increases in system failures. Closely associated with this concern is
system upgrade programs that are discussed in chapter four on modernization. The
breakrate is the best indicator to monitor the aging aircraft syndrome.
Conclusion
The ability to achieve air-to-air superiority early in a campaign is at the very heart of
airpower doctrine. This chapter reviewed the first of three pillars of defense assess-
ments—readiness. A thorough literature search was conducted, followed by two analysis
methods that investigated the near-term readiness posture of the F-15C.

42
The analysis concentrated on three recurring factors identified in the literature search:
aging aircraft, supply cycle and spare parts, and funding shortfalls. Analysis of logistical
statistic histories from 1990 to 1995 determined the primary culprit of today’s readiness.
Near-term readiness problems for both the airframe and its engine were caused by
dramatic reduction in four funding categories from FY 1992 to FY 1994. Most significant
were the 60 percent reductions in RSD-buy funding in FY 1992 and FY 1993, 61.5
percent reductions in SSD funding in FY 1992 and a 25 percent reduction in O&M
funding in FY 1993. Although budget officials have increased funding levels to 100
percent, the severe F-15C parts shortages created by the funding shortfalls will take
several years to overcome.
In addition, other factors have influenced the readiness of the F-15C fleet. Increased
operations tempo coupled with a decline in supporting O&M funding was a significant
contribution. Likewise, obsolescence from an eroding industrial base has made certain
microelectronics parts unsupportable.
Despite several negative indicators, the outlook for F-15C readiness is good. The
budget has already been corrected to 100 percent authorization levels in all four
categories. Also, the systemic factors which are not controllable, such as major structural
problems, are not evident. However, there are hollow-force clouds on the horizon.
Fortunately, senior leaders in the Air Force have made a strong commitment in funding to
offset the approaching storm. The trick will be to balance the defense budgets with a long
overdue modernization program that will ensure long-term readiness into the twenty-first
century.

43
Notes
1 William J. Perry, Annual Report to the President and the Congress (Washington:GPO: 1995), 37.
2 Lynn Grile, Reliability Analyst, Dynamic Research Corporation, “1990-95 F-15Cand F-16 maintenance statistics,” 12 December 1995.
3 Ibid.4 Briefing, Franklin C. Spinney, subject: Anatomy of Decline, 1994.5 House, National Defense Authorization Act for Fiscal Year 1995: Hearings before
the Subcommittee on Military Readiness of the Committee on National Security, 103dCong., 1st sess. (Washington, D.C.: GPO, 1994), 376.
6 Ibid., 569.7 John Tirpak, “Hollow Pockets,” Air Force Magazine 77, no. 12 (December 1994):
52.8 Ibid.9 Peter Grier, “Snapshots of a Force on the Move,” Air Force Magazine 78, no. 6
(June 1995): 61.10 Perry, 641-42.11 Robert S. Dudney, “Aerospace World,” Air Force Magazine 78, no. 1 (January
1995): 13.12 Ben Hollingsworth, Financial Manager, WR-ALC/LFCF, telephone interview with
author.13 Ibid.14 Sheila E. Widnall, “Widnall Assesses the Force,” Air Force Magazine 78, no. 4
(April 1995): 33.15 House, Department of Defense Appropriations for 1995: Hearings before the
Subcommittee on the Department of Defense of the Committee on Appropriations, 103dCong., 2d sess. (Washington, D.C.: GPO, 1994), 26.
16 Ibid., 27.17 Hollingsworth, telephone interview.18 Maj K. Mills, ACC/LGF15, memorandum to Col Belisle, ACC/LGF, 22 August
1995.19 Briefing, WR-ALC/LFE, subject: Avionics Obsolete Parts, 4 December 1995.20 Ibid.21 Jerry Gibbs, Program Manager, Unohali Corp., telephone interview with author, 18
December 1995.22 Eric L. Gentsch and Donna J. S. Peterson, A Method for Industrial Base Analysis:
An Aerospace Case Study (Bethesda, MD.: Logistics Management Institute, 1994), 8.23 Ibid., 3.24 Briefing, Avionics.25 Ibid.

44
Notes
26 Maj K. Mills, ACC/LGF15, memorandum to Col Bjoring, ACC/LGF, 12 May1995.
27 Perry, 94.28 Lt Col Ted Bolds, “Maintaining the Defense Industrial Base” (Air War College
Paper, 2 May 1994).29 Briefing, WR-ALC, subject: Obsolete Parts, Diminishing Manufacturing Sources,
Vanishing Vendors, n.d.30 Jerry Vaughn, Avionics Manager, WR-ALC, telephone interview with author, 4
March 1996.31 Briefing, WR-ALC/LFE, subject: F-15 Display Subsystem Trade Study, 15 August
1995.32 Gibbs, telephone interview.33 Kenneth Girardini, et al., Improving DOD Logistics, RAND Report DB-148-
CRMAF (Santa Monica, CA: RAND Corporation, 1995), vi.34 Rick Eden, et al., Reinventing the DOD Logistics System to Support Military
Operations in Post-Cold War Era, RAND Report (Santa Monica, CA.: RANDCorporation, 1994), 700.
35 John Tirpak, “Washington Watch: The Risk of a ‘Hollow Future,’” Air ForceMagazine 78, no. 5 (May 1995): 19.
36 Eden, 98.37 I. K. Cohen, R. A. Pyles, and R. A. Eden, Lean Logistics: A More Responsive,
Robust, and Affordable System, RAND Report DRR-630-AF (Santa Monica, CA: RANDCorporation, 1994), 99.
38 Eden, 99.39 Chief Dyer, ACC/LGF15, telephone interview with author, 4 December 1995.40 Ibid.41 Eden, 703.42 Lt Col Andy Busch, DLA logistics officer, telephone interview with author, 11 Mar
1996.43 Cohen, 99.44 Eden, 102.45 Girardini, 26.46 John B. Abell and L. L Shulman, Evaluations of Alternative Maintenance
Structures, RAND Report R-4205-AF (Santa Monica, CA: RAND Corporation, 1994),43.
47 Widnall, 33.48 Ibid.49 Debbie Delano, F100 Turbine Manager, SA-ALC/LP, telephone interview with
author, 25 March 1996.

45
Notes
50 Jeff Hill, TICARRS Database Manager, WR-ALC/LF, 1990-95 F-15C maintenancestatistics, 6 December 1995.
51 Grile.52 ISP version 4.6, Lincoln Systems Corporation, Westford, MA.53 F. Stanley Nowlan and F. Howard Heap, Reliability Centered Maintenance (Los
Altos, CA.: Dolby Access Press, 1978), 46-47.54 Mills, memorandum to Col Belisle.55 Ibid.56 Briefing, ACC/LGF15, subject: F-15 Modernization, 17 October 1994.57 “The US Air Force in Facts and Figures,” Air Force Magazine 78, no. 5 (May
1995): 54.58 “The CBO’s Air Force,” Air Force Magazine 78, no. 3 (Mar 1995): 30.59 Peter Grier, “Snapshot of a Force on the Move,” Air Force Magazine 78, no. 6
(June 1995): 61.60 Briefing, ASC/LP, subject: F100 Engine Status, 17 January 1995.61 Grile.62 Hollingsworth, telephone interview.63 Ben Hollingsworth, WR-ALC/LFCF, memorandum for record, subject: RSD/SSD
Funding, 13 December 1995.64 Fred Mullis, Pratt & Whitney Customer Service Rep, P&W SA-ALC, USAFE
F100 Overview: Mar 94-Mar 95 (DO42), 12 December 1995.65 Ibid.66 “US Air Force in Facts and Figures,” 41.67 Betsy Mullis, Chief, Integrated Logistics Branch, WR-ALC, interview with author,
31 October 1995.68 Hollingsworth, memorandum for record.69 Suzann Chapman, “Aerospace World,” Air Force Magazine 78, no. 3 (March
1995): 11.70 Pat Towell, “GOP Faces a Clash of Priorities with its Bid to Boost Readiness,”
Defense & Foreign Policy, 14 January 1995: 168.71 Andrew F. Siegel, Practical Business Statistics (Burr Ridge, IL.: Irwin, 1994), 163.72 Ibid., 475.73 Ibid., 501.74 Hollingsworth, telephone interview.75 Siegel, 478.76 Siegal, 480.77 I. B. Holley, The United States Army in World War II, Special Studies, Buying
Aircraft: Matériel Procurement for the Army Air Forces, (Washington: Office of theChief of Military History, 1964), 46-47, 89.

46
Chapter 3
Force Structure: The Bad
Even if the force were well funded, it would be inadequate to the taskdefined by the 1993 bottom-up-review of defense needs—the ability to wintwo nearly simultaneous regional wars.
—Floyd D. Spence (R-SC)
Introduction
Critical decisions. The preceding chapter analyzed the US short-term readiness
posture. This chapter investigates the current F-15C structure and its ability to fight and
win in two major regional conflicts (two-MRC). Are there enough F-15Cs to control the
airspace? Is the two-MRC strategy outlined in the—bottom-up-review (BUR) still a
viable strategy? John A. Tirpak, senior editor of Air Force Magazine, contends the two-
MRC strategy is dead and US leaders have already decided to provide funds for only one-
MRC.1
How much is enough? The decision is both critical and complex. The ramifications
are enormous for the US and its role as a major power going into the next century. Too
small of a force structure would be catastrophic. The Gulf War serves as a testimony to
the United States’s dependence on airpower. It is noteworthy that the last time the US
lost a major land battle was also the last time it entered into a large land engagement
without air superiority—1943 Kasserine Pass, Tunisia.2

47
The 1993 BUR developed the blueprint for the current force structure based on a
two-MRC. The BUR based its findings on the assumption the US could become involved
in two 1991 Gulf War size conflicts nearly simultaneously. Consequently, the BUR
determined the Air Force should maintain a force of 20 tactical fighter wings.3 In
addition, the BUR recommended 20 percent of all tactical fighters be air superiority
fighters.
The force structure debate rages around other controversial topics. The proliferation
of advanced fighter technologies available on the open market is a critical force structure
issue. Also, the USAF may be entering a revolution in military affairs (RMA) era. If so,
can the ability to maintain air superiority be based on a 1970s stove-piped force structure
model?
This is a difficult situation, but the decisions made are vital to US national security.
As the US enters the twenty-first century, senior leaders will have to determine force
structure issues that will shape the armed forces. This chapter investigates those issues
and concludes with four recommendations.
Literature Search: Force Structure
How much is enough? Today’s force structure consists of 20 tactical fighter wings of
which only 13 are still active duty.4 This compares to 38.5 fighter wings in 1985.5 The
air-to-air force consists of 4.1 wings (3.5 wings active duty). Supporting the air-to-air
mission is the multiroled F-16 that shares both air-to-air and air-to-ground missions.6 The
actual F-15C force consists of 412 aircraft.

48
Five general force-structure topics were investigated during the literature search: the
service life of the F-15C Eagle, the growing multirole gap in the tactical fighter force, both
peer and emerging threats, fiscal constraints, and the effects of the RMA on force
structure.
F-15C Service Life Limit
With an average usage of 270 aircraft flight hours per year, the F-15C fleet is
approaching its service-design-life limit of 4,000 flight hours.7 Following successful
airframe structural testing, the F-15C will be extended to an 8,000-hour service life limit
(See appendix D). Service-life limit is critical in the F-15 force structure equation.
Therefore, an 8,000-hour service limit provides current levels of F-15Cs through 2010.
Likewise, a 10,000-hour service limit would provide F-15Cs to 2020, while a 12,000-hour
service life extends the F-15Cs to the year 2030.8
Losing the F-15Cs because of service-life limitations dramatically degrades the air-to-
air mission despite the planned purchase of 442 F-22s. With the multirole F-16
approaching the service-life limits of its airframe around 2003, the extension of the F-15C
service life becomes even more critical.
The Multirole-Gap in Tactical Fighters
The Air Force must meet the BUR requirements for multiroled fighters. As directed
in the 1993 BUR, 40 percent of the fighter force must consist of multirole fighters.9 But,
the service-life limit of 200 F-16A/B models was reduced because of structural concerns in
the F-16’s airframe.10 Forecasts indicated the first F-16s will reach their reduced service-
life limits in the year 2003. In essence, even with the fully funded procurement of 442

49
F-22s, there will be a multirole-gap early in the twenty-first century unless additional
F-16s are purchased.11
Maj Gen David J. McCloud, Headquarters USAF Director of Operations, explained
the multirole shortfalls to the Senate Armed Services committee in May, 1995, when he
stated:
The Air Force will come up short about 1.5 to 1.6 wings of combat codedairplanes in the first decade of the twenty-first century unless there’s acourse change. We calculated a need for another twenty F-15Es andapproximately 120 F-16s to avoid eating into the fighter force after 2000.12
ACC has seriously considered a new role for the F-15C as a multirole fighter to
alleviate the F-16 shortfall. Changing the F-15C to a multirole fighter, responsible for
both air-to-air and air-to-ground missions, is very controversial. Granted, re-tasking the
F-15C to the multirole mission solves the shortfall, but not without consequence.
Retasking the F-15C as a multirole fighter creates several problems. Pilots would
have to learn both air-to-air and air-to-ground missions. The training required to give the
pilots minimal proficiency in the air-to-ground mission would detract from their existing
air-to-air mission. From the pilot’s perspective, the unique skills required in the air-to-air
mission demand constant training.
The adverse effect of training and flying multirole missions is not limited to pilots.
F-15C maintenance is already strained with 20 percent breakrates, aging aircraft
subsystems, and an inadequate supply system. When air-to-air aircraft munition
configurations are mixed with air-to-ground munition configurations, the additional man-
hours required from crew chiefs, weapons-loading and specialist flights, create additional
problems. The additional man-hours to reconfigure each aircraft would be significant,

50
especially considering the existing workload already placed on aircraft maintenance
personnel.
In addition, the effects of multiroling on the aircraft’s airframe must be considered.
When configuring the aircraft for air-to-ground missions, the gross takeoff-weight is
significantly increased.13 This would affect the mean-time-between-failure (MTBF) rates
of the brakes, tires, and landing gears. Also, by flying an air-to-ground mission, the F-15C
would fly with increased weights that may increase the structural wear on the airframe.
Air-to-ground missions force the flight envelope down to a low-altitude regime from
the higher altitudes of the air-to-air mission. The airframe would encounter increased
aerodynamic turbulence associated with low altitudes. Turbulence could increase the
structural wear and tear on the flight control structures.14 Many pilots feel similar low
altitude turbulence caused the structural problems on the F-16A/Bs that resulted in a
reduced service life.15
Air Force Manual 1-1 addresses the aircraft multirole tasking. AFM 1-1 states, “The
need to preserve the flexibility and versatility of aerospace forces does not mean all
equipment must be designed to do everything” (Emphasis added). AFM 1-1 identifies a
compromise-in-design syndrome as a serious drawback to multiroling. It states that the
aircraft’s performance is reduced with each additional multirole design feature.16 For
example, the additional structural components required for the air-to-ground mission adds
weight to the airframe which is a major design concern for the air-to-air aircraft designer.
The multirole gap in the US tactical fighter force is a problem that must be addressed.
Based on the guidelines from the 1993 BUR, the multirole mission and the air-to-air
mission are key ingredients in the two-MRC force structure. A review of the growing

51
capabilities of potential adversaries reveals the two-MRC strategy based on 20 fighter
wings cannot afford any gaps.
Potential Adversaries: Peer Competitors.
Force structures cannot be determined without a review of potential adversaries. This
literature search was limited in scope due to security limitations. This section reviews two
categories of adversaries: peer competitors and emerging regional threats. Russia and
China are examples of potential peer adversaries while Iran, Iraq, and North Korea are
examples of regional threats.
Recently, Russia has experienced dramatic economic and political changes. One
author stated that the Russian Air Force is currently in a low state of readiness. During
the recent Chechnya offensive, Russian pilots received fewer flying training hours and their
maintenance support was poor. Spare aircraft parts availability was fifty percent below
normal resulting in a very low mission-capable status.17 Although there are serious
problems within the Russian Air Force, they are still a potential threat.
The Russian air superiority mission is centered around the Su-27 aircraft. Although
their army and navy curtailed most of their modernization programs, the Russian Air Force
continues to receive advanced fighters.18 Currently, two major modernization programs
are underway: an Su-27 upgrade called the Su-35 and an F-22 type fighter called the MiG
1.42. The Su-27 is the counterpart to the F-15C and is Russia’s front-line, all weather,
air-superiority fighter. Since the Su-27 first flew in 1977, it has been upgraded seven
times.19 The current P series includes the Su-27 LL-PS with thrust vectoring nozzles on
its engines. Although the F-15C and Su-27P series are similar in many categories, the

52
upgraded Su-35 possesses significant advantages with its 14 air-to-air missiles and phased
array radar (See table 3-1).
Table 3-1. Comparison of Air Superiority Fighters
TYPE QUANTITYFIRST
FLIGHTMISSILESSTORES
THRUSTTO
WEIGHTMAX
SPEED RADAR
F-15C 412 1972 8 AAM 1.64 MACH2.2
APG-63DOPPLER
SU-27 350 1977 10 AAM 1.60 MACH2.35
PHASEDARRAY
SU-35 11 1985 14 AAM 1.65 MACH2.35
PHASEDARRAY
Source: Jane’s All The World’s Aircraft 1995-96, ed. Paul Jackson, (Jane’s InformationGroup, 1995).
The Su-35 phased array radar is superior to the APG-63 Doppler radar in both
detection range and tracking capabilities. Additionally, the Su-35 propulsion system
increases the aircraft’s maneuverability with thrust vectoring nozzles.20
The Russians are designing a next-generation MiG-29 called the MiG-1.42. While
still highly classified, it is expected to have twin tails and a blended body design similar to
the F-22. It also has special surface materials and shading to enhance its stealth
characteristics.21 It is designed specifically to counter the F-22. This Russian multirole
aircraft is not expected to enter service until after 2000. These fighters can be configured
to carry the AA-11 Archer Infra-Red (IR)-guided missile; arguably the best missile in the
world. It is also capable of carrying the AA-12 Adder active radar-guided missile; a
missile equivalent to the US built AMRAAM.22
With Russia possessing state-of-the-art missiles and a first-rate fighter, the past policy
of defeating the Russian quantitative advantage with F-15 qualitative advantage is no

53
longer valid. The Su-35 series will be fielded before the end of the century. As stated
earlier, the Su-35 is superior to the F-15C in several key areas and the Su-27 is
qualitatively and quantitatively equal to the F-15C. 23
The Chinese Air Force is modernizing their air-to-air capability with the Russian
Su-27. China received 26 Su-27s in 1991 and 24 in 1995 under special license
manufacturing agreements.24 The Chinese plan to use the licensing agreements to
modernize their forces and to develop an organic Su-27 production capability. Current
intelligence estimates predict China will field its first organically produced Su-27 (Chinese
F-10) by 2005.25 As the Chinese industrial base expands, their ability to develop a self-
sufficient modern fighter base will also grow.26
However, today the Chinese have several significant deficiencies in their air-to-air
capability. Although they have a very large force structure consisting of 5,224 fighters,
only 124 are considered advanced modern systems.27 Due to a rudimentary logistics
system, their fighter units only generate one training sortie every four or five days. This
equates to 110 annual flying hours per pilot compared to 250 to 300 annual hours for
USAF pilots.28 The Chinese Air Force is mainly composed of obsolete aircraft maintained
with a decaying logistics system.
Nonetheless, China is a rapidly growing economic power that desires to have
superpower status and could evolve into a formidable military power.29 James Lilley,
former ambassador to Beijing, believes China aims to modernize its forces and begin
expanding its influence into the South China Sea in what some refer to as creeping
regionalism.30 If not in this century, then certainly early in the next century, the US will
need the wherewithal to defeat a modernized Chinese Air Force.

54
Potential Adversaries: Niche States
In addition to peer competition, other developing nations may prove to be adversaries
of the US. In his book Future Wars, Colonel Jeffrey Barnett terms these developing
nations as niche states.31 Similarly, as developing nations expand, many will enter what
Dr. Magyar identifies as nationally expansive stages.32 The explosion of emerging states
with expanding gross domestic products will complicate an already complex global
military strategy.
As these niche states grow economically, their ability to buy aircraft from more
developed states may result in a capability to influence neighboring nations. These niche
states could purchase gray-threats—aircraft built by friendly countries and exported to the
niche states. The gray-threats offer a definite challenge to the F-15C.33
For example, the newest French fighter to enter the export market is the Dassault
Aviation Rafale scheduled for production in 2001. Designed as a multirole fighter, it has a
stealthy design and a radar cross-section at least 10 times smaller than current French
fighters. It has advanced flight controls and a state of the art radar system that makes it a
formidable threat to the F-15C. France is marketing this fighter throughout the Persian
Gulf and Southeast Asia regions.34 Undoubtedly, this will be a weapon-of-choice for
many developing niche states desiring to dramatically improve their air superiority
capabilities.
As the US plans for its force structure into the twenty-first century, it must consider
both niche states and peer competitors. The days of developing force structures based on
a single, well-defined peer competitor disappeared with the fall of the Berlin Wall. The
proliferation of high technology to niche states makes long-term force structure planning

55
very difficult. Unfortunately, US force structure planning and budgeting must account for
the complete range of adversaries—regardless of cost.
Tough Choices: All a Matter of Money
There are two reasons why planning is difficult. First, the difficulty in forecasting US
force structure stems from the lack of a clearly defined threat. The current military
situation has been extremely dynamic since the end of the Cold War. General Shalikashvili
recently wrote, “The combination of slower modernization rates and a rapidly changing
threat environment makes long-range planning more difficult and more important.”35
Second, the US Congress is reviewing the federal budget in search of potential
savings. A bill was recently introduced into legislation that would require the budget to be
balanced within seven years. American opinion polls indicate taxpayers will not support
major increases in defense spending. A recent CNN poll showed the American public is
opposed to increased defense spending as part of the Republican Party’s 10 point
“Contract With America”. The largest negative rating among the 10 points in the contract
was the defense spending increase proposed by the Republican Congress.36
56
0
2
4
6
8
10
12
14
1960 1970 1980 1990 1995 2000
ENTITLEMENTS
DEFENSE
DECLINING DEFENSE DOLLARS
%
OF
GDP
Source: A ir Force Magazine, May, 1995, P.46
Figure 3-1. Declining Defense Dollars
Entitlement spending has increased at the expense of defense spending (See fig. 3-1).
Granted, the force structure has been reduced, but maintaining a ready and modernized
force on 2.9 percent of Gross Domestic Product (GDP) is difficult. The current 3.8
percent GDP represents a 60 percent decrease since 1960.
The 1997 budget allocates $38.9 billion for weapons procurement. This is the lowest
amount since WWII. In the past, the principle opponent of defense hawks was domestic
doves. Today, deficit hawks are looking for ways to cut military spending.37 Simply
stated, US military force structure will not get additional funding.
Force planning is complicated by a readiness-versus-modernization competition. In
recent years, readiness increased at the expense of force structure and modernization.
Although the defense budget has declined by 34 percent in the last 10 years, the short-
term readiness has increased in the O&M budget since 1994. In 1996, 37.4 percent of the
defense budget is allocated to O&M for short-term readiness, 27.9 percent for military
personnel, and only 18 percent for system procurement. Emphasis needs to shift from

57
near-term readiness to long-term readiness. This is reflected in a recent article in the
National Review:
While many defense experts argue that the administration [Clinton] hasmaintained the near-term readiness of US forces, they are concerned thatthis is being accomplished at the expense of long-term readiness, bydipping into funds earmarked for modernization and re-capitalization.38
There does appear to be a gradual shift towards modernization. This is reflected in
the 1997 budget. Procurement will increase from 18 percent in 1996 to 31 percent in
1997. O&M readiness funding will decrease from 37 percent in 1996 to 23 percent in
1997.39 However, this shift will be at the expense of force structure. Lt Gen George
Muellner, a senior Air Force acquisition officer, recently stated, “I think most of the
indications are right now that you are probably going to see some decline in force
structure because of the need to re-capitalize and reinvest in other areas.”40 The current
trend of reducing force structure to fund modernization could also be a result of a
technology explosion in what may be termed a revolution in military affairs (RMA).
RMA and Force Structure
Technology has dramatically impacted today’s force structure planning. There was a
dramatic reduction in force structures with the advent of the precision guided munitions
(PGM). For example, in WWII 108 B-17s dropped 648,100 bombs on one power-
generation station with a 96 percent probability of striking the plant. Today, the same
probabilities can be achieved with a single aircraft and two PGMs.41 Col John Warden, an
air campaign planner, stated, “The combination of stealth and PGMs on the same platform
has greatly reduced force packages resulting in our ability to make up large deficiencies in
numbers.”42 In addition, the stealth-PGM combination has enabled air planners to move

58
from serial attack to parallel attack. Serial attack was used during WWII. This means
bombing the same target until it is destroyed and then moving to the next target. Parallel
attack is a tactic where bombers attack multiple targets simultaneously. By attacking in
parallel, the rate-of-effect is greatly accelerated. This new tactic greatly reduces the force
structure required to accomplish air campaign objectives.43 The best example of force
structure reduction was cited by Col Deptula in his recent article “Firing for Effect:
Change in the Nature of Warfare.” In a Libyan-type raid, he contended 36 airman flying
six B-2s and six support aircraft could accomplish the same mission that previously
required two carrier battle groups, 12,000 people, 20 ships and 132 aircraft.44
Air-to-air warfare has not undergone an RMA similar to air-to-ground warfare with
the stealth-PGM combination. The F-22 will be stealthy, but will only employ the mid-
range AIM-120 air-to-air missile. A new technology level will be achieved when the
stealth F-22 fighter is integrated with a long-range air-to-air missile (greater than 150 mile
range) with possible tracking inputs from other sources. The effect would be dramatic. A
handful of stealth fighters could gain complete air superiority almost instantaneously. The
result would be a modern day Battle of Crece. Here, 10,000 French soldiers were killed
with negligible losses to the English using new longbows that extended their arrow’s reach
beyond the reach of the French crossbows.45
Interestingly, the Russians are working diligently in this area. Since 1985 they have
fielded three long-range air-to-air missiles.46 The AA-9 Amos was fielded in 1985 and has
a range of about 100 kilometers (km). The AA-10 Alamo fielded in 1990 has a range of
40 to 110 km. Additionally, the Russians have just tested the R-33 that has a 150-km
range and possibly a 400-km range when a booster rocket is attached.47 Conversely, the

59
longest range US missile is the Phoenix (built in 1974) with a maximum range of 60 to 70
miles.48
The challenge will be to integrate the developing microcircuitry in today’s missiles
with alternate off-aircraft acquisition platforms such as E-3s, satellites or Unmanned
Aerial Vehicles. A datalink system could downlink the Global Positioning Satellite
coordinates to a 150 to 200 km missile that will be launched from a standoff aircraft.
Once the missile is in close proximity to the target, it could transfer to a more
conventional tracking mode; truly, a twenty-first century long-bow reincarnation. Forty
percent of all US air kills in the Gulf War were beyond visual range. This is an indication
the US is approaching the next level of air warfare.49 The stealth fighter, integrated with a
long-range air-to-air missile, will drastically reduce future force structures. A handful of
stealth-long-bows could wreak havoc on enemy forces.
But, is the force structure really set? Can the US really begin to modernize its air-to-
air aircraft? Some contend the two-MRC strategy cannot be met with the current 20
fighter-wing force. The answer to these questions is not in the available literature and the
controversy is being decided as this paper is being written.
Force Structure Methodology
Does the US have enough F-15Cs in its force structure to meet the two-MRC
strategy? This paper will analyze a hypothetical two-MRC scenario with North Korea and
Iran. The study was restricted to an air-to-air war exclusive of land and sea engagements.

60
Data Collection Methods
The data was collected from three primary sources. The maintenance and logistics
data was collected from Keaney’s Gulf War Air Power Survey, Vol. 3, Logistics and
Support. The sortie production and operational data was collected from Gulf War Air
Power Survey, Vol. 5, A Statistical Compendium and Chronology. Jane’s All the World
Aircraft provided the force structure data for the North Korean and Iranian Air Forces.
Although the sources provided a wealth of generic information, data conditioning was
required. For example, overall mission capable rates and sortie production rates were
available in Volume 3, but not represented by air war phases (See appendix E).
Analysis Procedures
The analysis was based on a two-MRC model developed from actual data collected
from the 1991 Persian Gulf War. Sortie production, maintenance statistics, and force
structures were used as a baseline for the two-MRC scenario. Using the Gulf War data as
a guideline, sortie and maintenance plans were developed within the confines of current
operational and logistical parameters. This ensured realistic sorties and models were used.
Assumptions
The two-MRC analysis was based on the following assumptions:
1. Most importantly, both conflicts are fought against regional emerging states.Major powers such as China or Russia were not involved militarily.
2. All calculations and analysis are based on near-term force structures. Forcestructures were obtained from current available literature. Break-throughtechnologies or planned modernization programs are not included.
3. Weapons of mass destruction are not used.4. Coalition support in both theaters is equal to the level the Royal Saudi Air Force
(RSAF) provided in the 1991 Gulf War; roughly 34 percent of Defensive Counter-Air (DCA) and Combat Air Patrol (CAP) missions. In the Iranian MRC, RSAF

61
will provide similar F-15C support. In the Korean MRC, the Republic of Korea(ROK) will provide equivalent support with 96 F-4s.
5. All analysis was based strictly on air-to-air missions. Ground attacks, airlift,sealift, and basing issues were not considered in the analysis.
6. All maintenance statistics used are attainable. Selected numbers were based oncurrent maintenance standards. In the Gulf War all maintenance statistics were metor exceeded.
These assumptions, coupled with extensive reference to the Gulf War data base,
ensured the analysis was based on realistic inputs. Consequently, a detailed analysis of
current F-15C force structure in a two-MRC is now possible.
Force Structure Analysis
This force structure analysis evaluated the US military’s ability to fight a two-MRC:
one of today’s most important strategic issues. Due to economic pressures, planners must
cut force structure without affecting readiness. Today, with technology greatly
accelerating the tempo and effects of modern air combat, the US cannot afford errors in
defense sizing. Without air superiority, the modern airpower doctrine is in doubt. General
Fogleman is concerned the American public has lost sight of the importance of air
superiority. He recently stated:
The nation as a whole has lost sight of how valuable air superiority is. Forsome reason, there are large numbers of people who think air superiority isa God-given right of Americans. [That’s] absolutely not true.50
Historically, Americans have enjoyed the benefits of total air superiority. This feeling
was magnified in the 1991 Gulf War when the US gained air superiority on the first night
of the war. However, the lessons from Desert Storm must be reviewed with caution. The
Desert Storm air campaign is only relevant in an MRC against regional powers.

62
Historical Baseline: Gulf War Air Superiority Mission
Can 300 F-15Cs achieve air-to-air superiority on two fronts in North Korea and Iran
nearly simultaneously? Number of sorties, ratio of DCA to CAP missions, coalition sortie
productions, and other data from the Gulf War will serve as a starting point for analyzing
the two-MRC scenario.
When Iraqi forces crossed the border into Kuwait in August of 1990, the Iraqi Air
Force consisted of 831 combatant fixed wing aircraft of which 350 were air-to-air fighters.
For point defense, the Iraqis used MiG-25 air interceptors, older but highly maneuverable
MiG-21s, multirole MiG-23s, modern MiG-29s, and French Mirage F-1s.51 Their
extensive air defense system, consisting of anti-aircraft guns and missiles, was seven times
denser than that presented over Hanoi in the Vietnam War. Although a formidable
regional airpower, they certainly were not a match for the USAF.52
The coalition forces led by the USAF formulated an awesome force. It consisted of
96 USAF F-15Cs; 110 F-14s; and 69 RSAF F-15Cs.53 The USAF F-15Cs flew 4097
DCA missions and 461 CAP missions; this was sixty-six percent of the total air defense
mission. The RSAF also contributed greatly with 2088 total F-15C sorties.54
The results were impressive. Air superiority was achieved on 17 January, the first
night of the war. General Schwarzkopf declared total air supremacy on 27 January, 10
days after the air war started.55 Coalition forces destroyed 33 fixed wing aircraft including
two MiG-25s and five MiG-29s.56 As a tribute to technology advances, over 40 percent
of all kills were from beyond visual range.
However, the decisive victory by USAF and RSAF F-15Cs must be viewed critically.
Very few of the Iraqi aircraft flew during the war. On the first three days of the war, the

63
Iraqis only flew 221 air defense sorties even though their country was under massive
attack. Fourteen of the 33 kills occurred in the first three days.57 In essence, the Iraqi Air
Force realized it was suicidal to defend their skies against coalition air forces. This was a
preplanned strategy by Saddam Hussein. In a speech prior to the air war, he told the Iraq
National Assembly, “We will not use our Air Force, we will keep it. Two years hence our
air force will still be in a position to pound Bani-Sadr and his collaborators.”58
There are two lessons-learned that can be transported to the two-MRC analysis.
First, extensive air defenses do not curtail high altitude air defense missions. None of the
USAF F-15Cs were lost to ground defense, and none of the 27 US aircraft lost were flying
air defense missions.59 Second, trends can be developed from the sortie production
analysis of the Gulf War.60
1. USAF F-15Cs flew 4558 missions for a 50 sortie per aircraft average.2. Almost 90 percent of the air-to-air missions were DCA.3. An average of 138 sorties were flown during the first three days of the war. The
USAF averaged 98 sorties per day after air supremacy was declared.4. During the ground war, albeit only four days in duration, the F-15Cs flew 126
sorties per day.5. The average FMC rate during the air war was substantially higher than the prewar
FMC rate of 80.7 percent. Calculating data obtained from the Gulf War AirPower Survey yields an FMC rate of 93.6 percent from 17 January to 28February.61
Each conflict is unique. However, it’s not unrealistic to compare selective data from
the Gulf War to a two-MRC analysis between North Korea and Iran. Similar patterns can
serve as a foundation for analysis. Would MRCs conducted nearly simultaneously against
two regional powers such as North Korea and Iran achieve air supremacy within 10 days?
In a word—yes. The operation and maintenance data from the Gulf War will be used as
guidelines to prove this hypothesis.

64
A North Korea-Iran War: A Two-MRC Force Structure Analysis
Although many factors contribute to a MRC, only air-to-air factors were considered.
Key issues such as land forces, naval forces and airlift support were ignored. However,
the analysis of an Iranian-North Korean MRC was an excellent method to evaluate the
current Air Force structures from strictly an air superiority perspective.
Iran is initiating a major modernization program; however, a small defense budget
limits their near-term force structure.62 Their 115 primary air-defense fighters consist of
MiG-21s, MiG-31s, and F-14s. In addition, 58 multirole MiG-29s are used in the air-
defense role. Due to limited flying hours, the Iranian pilots are not as well trained as their
Iraqi counter-parts. Also, a severe parts shortage exists due to Western embargoes, which
affects their training sorties. Consequently, the Iranians are in the transition from their
western aircraft to Russian and Chinese models (See table 3-2).
Table 3-2. Iranian Air Order of Battle
AIRCRAFT QTY IN-SERVICE MFTR MISSION1. F-7 (MiG-21) 70 65 China Air Defense2. Mirage F-1 24 12 France Multirole3. F-4 D/E 50 40 US Multirole4. F-14A 20 15 US Air Defense5. MiG-29 58 18 (Ordered) Russia Multirole6. F-5 75 60 US Multirole7. Shenyang F-6 40 20 China Multirole8. MiG-31 25 25 (Ordered) Russia Air DefenseTOTAL 362 230Source: Jane’s Sentinel: The Gulf States 1994, (Alexandria, VA. Jane’s InformationGroup, 1994), 10-11.
With Chinese assistance in 1994, Iran integrated a command and control (C2) surface-
to-air missile system that greatly improved their air defense system. But, Iranian air
defenses fall well short of what Iraq possessed in January of 1991.63

65
Assuming the RSAF provides a force comparable to its Gulf War effort, the US will
achieve air supremacy within 10 days.64 Attrition losses are estimated to be near zero. In
fact, the 96 F-15Cs used in the Gulf War could be reduced in number if more F-15Cs are
needed in the Korean theater. In essence, a similar force of 69 RSAF and 96 US F-15Cs
would be sufficient to achieve air supremacy against a weak Iranian Air Force.
On the other hand, gaining air superiority and supremacy on the Korean peninsula is
more difficult. Although the North Korean Air Force (NKAF) has problems similar to
Iran, they do have a better fighting spirit. The North Korean air order of battle consists of
an obsolete air force based on Russian designs of the 1950s and 1960s (See table 3-3).
Table 3-3. North Korean Air Order of Battle
AIRCRAFT QUANTITY MANUFACTURER MISSIONMiG-29 14 Russia MultiroleMiG -23 46 Russia MultiroleMiG -21 120 Russia Air DefenseJ-5 (MiG -17) 80 China Air DefenseJ-6 (MiG -19) 60 China Air DefenseJ-7 (MiG -21) 40 China MultiroleJ-5 (MiG -17) 160 China AttackJ-6 (MiG -19) 120 China AttackTOTAL 640 3 Russian/5 Chinese 3 Air DefenseSource: Asia-Pacific Defense Reporter: 1995 Annual Report, (Peter Isaacson Publishing,1995), 128.
Although larger than the Iranian Air Force, the NKAF is smaller than the 1991 Iraqi
Air Force. In addition, the number of modern aircraft is lower than both the Iranian and
Iraqi Air Force. With a declining GDP, a modernization of the NKAF is remote. On the
surface, it appears air superiority should be gained the same as it was in the 1991 Gulf
War: almost immediate air superiority and 10 days for air supremacy.

66
Three factors would greatly increase the North Korean resistance compared to Iran or
Iraq. First, it is generally perceived that the Korean pilots provide a much greater fighting
spirit. Based on their performance in the Korean War (1950-1953) and their
aggressiveness in the subsequent Cold War years, few pilots will eject at the first signs of
radar lock-on as did the Iraqi pilots in the Gulf War. In a US News & World Report article
entitled, “The Most Dangerous Place to Be,” Joseph Galloway writes that pilots will fly
their 160 J-5s and 1200 J-6s configured in attack modes on suicidal offensive-counter-air
(OCA) missions against US and ROK airfields in the early hours of the war.65
Disregarding all other factors, the fighting spirit of the North Korean pilots, however
poorly trained, will account for some F-15C attrition.
Second, although the Koreans cannot offer a formidable air-to-air defense, they
would employ an asymmetrical strategy against coalition Air Forces. Their 100,000 elite
special operations forces (SOF) units would disrupt operations at all major allied
airfields.66 Highly trained and fanatical in devotion, thousands of SOF in wood-framed
AN-2 Colts will fly southward deep behind allied lines. They will disrupt US and ROK
Air Forces while still on the ground; most likely in conjunction with the suicidal J-5 and J-
6 airfield attacks.
Finally, Korea would use their advanced Scud-B/C intratheater missiles. Although
Iraq had little success in the Gulf War, the North Koreans Scud-B/C missiles have better
range and excellent accuracy.67 Recent Pentagon reports indicate only 50 percent of the
Scud attacks could actually be defended against.68 Several strikes at either Osan Air Base
(AB) or Kunsan AB would have devastating effects. Lamberth, a noted defense
technology expert, stated recently, “A single 500 pound bomb delivered through the roof

67
of an F-15, F-16, or F-18 avionics intermediate shop could very well put the entire wing
out of the war.”69
Assuming allied forces can offset the expected attacks on the airfields, are there
enough F-15C aircraft available after allocating 100 F-15Cs to the Iranian MRC? Recall
that the operational F-15C force structure is approximately 300 aircraft assigned to
operational units. Assuming 100 are allocated to the Gulf, and 100 are kept in attrition
reserve, only 100 F-15Cs remain for Korea.
As in the Gulf War, the coalition would makeup the shortfall. In the Gulf War the
RSAF provided 34 percent of the air-defense sorties.70 Although the ROK Air Force
maintains 48 F-16s and 96 F-4s, only the F-4s are assigned strictly the air-to-air mission.
Therefore, the 96 ROK F-4s would contribute the same effort as did the RSAF in the Gulf
War.
Other aircraft are available if needed. The multiroled F-16s could support the air-to-
air mission, but most likely all available F-16s will support the air-to-ground mission
against North Korean armor and mechanized infantry divisions. Finally, older USAF
reserve F-15 A/B models could support part of the air-to-air role, if required.
Assuming coalition support in both theaters, the force structure is sufficient to
provide 100 F-15Cs to an Iranian MRC and 100 F-15Cs to a Korean MRC while
maintaining 100 aircraft attrition force. In conjunction with the 96 ROK F-4s, a sortie
production equal to the 1991 Gulf War of 6,646 F-15C (combined USAF and RSAF)
sorties could be flown.
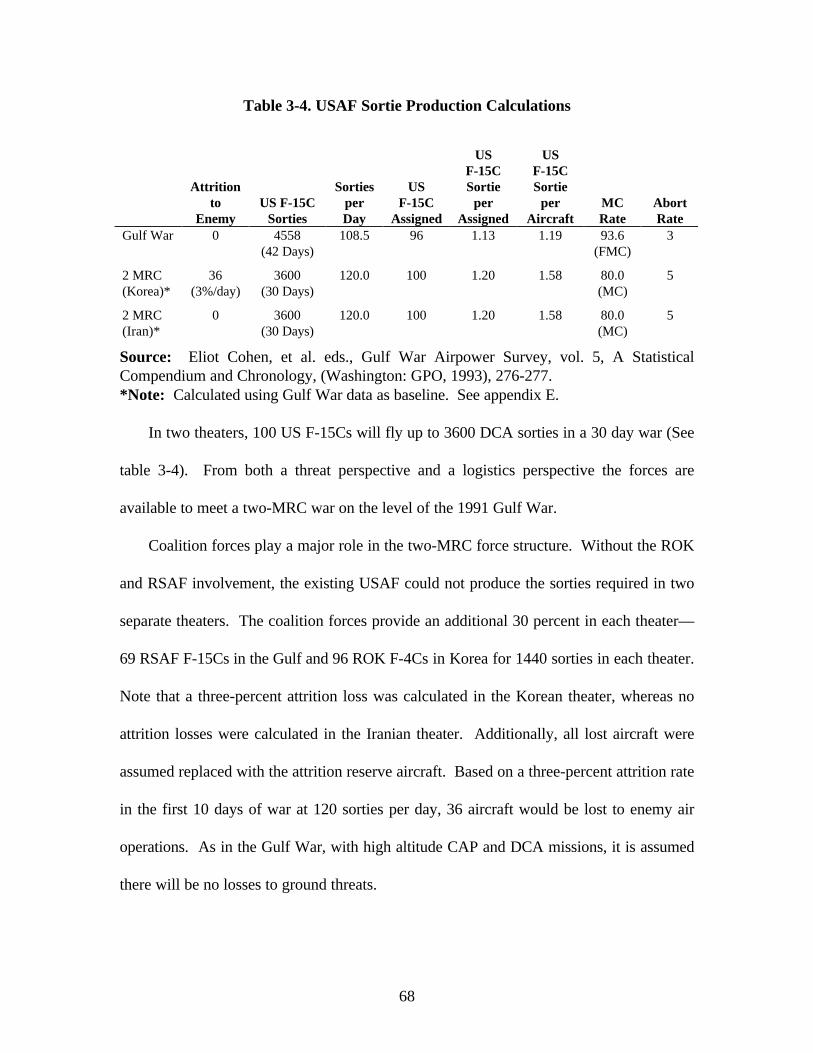
68
Table 3-4. USAF Sortie Production Calculations
Attritionto
EnemyUS F-15C
Sorties
SortiesperDay
USF-15C
Assigned
USF-15CSortie
perAssigned
USF-15CSortie
perAircraft
MCRate
AbortRate
Gulf War 0 4558(42 Days)
108.5 96 1.13 1.19 93.6(FMC)
3
2 MRC(Korea)*
36(3%/day)
3600(30 Days)
120.0 100 1.20 1.58 80.0(MC)
5
2 MRC(Iran)*
0 3600(30 Days)
120.0 100 1.20 1.58 80.0(MC)
5
Source: Eliot Cohen, et al. eds., Gulf War Airpower Survey, vol. 5, A StatisticalCompendium and Chronology, (Washington: GPO, 1993), 276-277.*Note: Calculated using Gulf War data as baseline. See appendix E.
In two theaters, 100 US F-15Cs will fly up to 3600 DCA sorties in a 30 day war (See
table 3-4). From both a threat perspective and a logistics perspective the forces are
available to meet a two-MRC war on the level of the 1991 Gulf War.
Coalition forces play a major role in the two-MRC force structure. Without the ROK
and RSAF involvement, the existing USAF could not produce the sorties required in two
separate theaters. The coalition forces provide an additional 30 percent in each theater—
69 RSAF F-15Cs in the Gulf and 96 ROK F-4Cs in Korea for 1440 sorties in each theater.
Note that a three-percent attrition loss was calculated in the Korean theater, whereas no
attrition losses were calculated in the Iranian theater. Additionally, all lost aircraft were
assumed replaced with the attrition reserve aircraft. Based on a three-percent attrition rate
in the first 10 days of war at 120 sorties per day, 36 aircraft would be lost to enemy air
operations. As in the Gulf War, with high altitude CAP and DCA missions, it is assumed
there will be no losses to ground threats.

69
Logistically, the analysis assumed a conservative 80 percent MC rate in theaters. This
compared to an actual 93.6 percent FMC rate during the Gulf War.71 Although the 1990
FMC rates were lower, wartime conditions often change both reporting procedures and
maintenance intensity levels. An 80 percent MC rate is very close to the real-world 1995
MC rate of 80.4.72 A standard five percent abort rate for daily operations is assumed
without spare aircraft available. Again, it is unlikely no spare aircraft would be available,
but a worst-case scenario is being used.
Analysis of two-MRC scenario supports the 1993 BUR force structure based on
conflicts in two geographically separated theaters with North Korea and Iran. Using 1991
Gulf War as a baseline, 300 F-15C aircraft can achieve air superiority and air supremacy in
a theoretical two-MRC scenario. Although achieving air-to-air superiority with North
Korea would be more challenging than the Gulf War, it still could be achieved in 10 days
or less. This is assuming their anticipated attacks on allied airfields do not affect the sortie
production.
Is this a comprehensive endorsement for the two-MRC strategy as outlined in the
BUR? Absolutely not. In fact, even with the obsolete air forces of Iran and North Korea,
a two-theater campaign required a 34 percent coalition involvement. Without coalition
support the two-MRC strategy is not supportable.
Major powers were not factored into the model. However, they can have a
significant impact. For example, if China were to enter the Korean War, they would
immediately add 5,224 out-dated aircraft to the theater and 124 front-line fighters.73 The
100 F-15Cs in theater would not be enough to cover the increased enemy strength. With
100 other F-15Cs allocated to the Iranian Theater and 100 required for attrition reserve,

70
F-15As or F-16s are needed. But, the analysis was centered on using only F-15Cs as the
primary air superiority fighter. Hence, the current F-15C fleet is adequate for only two-
MRCs comprised of regional states. The introduction of a single near-peer competitor,
like China, overextends the 300 F-15Cs. Bottomline: capabilities of the MRC players are
the determining factor in the scenario, not the number of MRCs.
Recommendations
This chapter conducted a force structure analysis of a theoretical two-MRC war.
From the literature search and subsequent analysis, four key proposals are presented.
Recommendation One
Purchase all 442 F-22s on schedule. The available F-15C fleet of 300 operational
aircraft is adequate for a two-MRC only when the participants are niche states like North
Korea or Iran. As these states develop, many will purchase advance fighters, such as
Russian MiG-29s and the French Rafale 2000s. This will affect the ability of 300 F-15Cs
to achieve quick and decisive air superiority.
Recommendation Two
Sell F-15Cs to the Republic of Korea. Provide technical and possible financial
assistance through foreign military sales (FMS) to upgrade the 96 ROK F-4Cs to at least
two squadrons of F-15Cs. In addition, FMS orders would assist the industrial base
problem outlined in Chapter Two.
The outstanding contributions of the RSAF and their 69 F-15Cs in Desert Storm
illustrate the enormous benefits from well-trained and well-equipped allies. Analysis
indicates similar efforts would be provided in the theoretical two-MRC scenario. USAF

71
force structure of 300 operational F-15Cs is not sufficient unless the ROK and RSAF
contribute approximately 30 percent to the air superiority mission.
Recommendation Three
Create a single point-of-contact consisting of technical, doctrine and organizational
experts to exploit the emerging revolution in standoff air-to-air warfare. Modern air
forces are entering a revolutionary period. Air Force technologies and doctrines should
explore the combination of the F-22 stealthiness with revolutions in long range air-to-air
missiles. To apply the standoff technology, the doctrine must integrate alternate target
acquisition platforms, high-speed data links, and long range missile designs.
Recommendation Four
Invest in a theater missile defense system that can counter the growing theater missile
threat. Recent Pentagon reports of a projected 50 percent success rate with the current
Patriot system is unacceptable in a Korean campaign—base operation on the peninsula
would cease, thus reducing the existing force structure effectiveness. 74
Base defense will define the future air campaign. The US and its coalition partners
rule the skies in both man and machine, but future enemies will attack the USAF bases as
key centers of gravity. Unable to confront the allies directly in air-to-air engagements,
they will attempt to neutralize allied airpower through asymmetrical attacks with advanced
missiles and elite SOF. US force structure is sufficient only if it is able to operate
unmolested from bases on the peninsula.

72
Conclusion
The US military is indeed at a critical junction. Both the literature search and the
analysis revealed critical issues to be addressed if the USAF is to maintain air superiority.
However, the proper quantity and type of force structure are limited by economic,
technical and political constraints.
The literature search confirmed four areas affecting force structure. First, the US
needs to extend the F-15C service life to 8000 flight hours. Second, there are increasing
threats by both peer competitors developing advanced aircraft systems and niche and
emerging states purchasing advanced fighters from the gray-threat market. Although the
current F-15C fleet is adequate for the near-term, there is a growing vulnerability as
advanced technologies are transferred to the niche and emerging states. Third, a shortage
of F-16 aircraft in the multirole mission early in the next century will directly affect the
F-15C force structure. Reroling the F-15C to an F-16 multirole mission will not be
without degradation to the F-15C’s primary mission—air-to-air superiority. Finally, the
opportunity exists to exploit technology, doctrine, and organization for an RMA
integrating stealth and standoff missiles in the air superiority mission.
The analysis of existing force structure in a two-MRC determined the existing fleet of
F-15Cs can perform the mission. But, the analysis of a theoretical two-MRC with nearly
simultaneous conflicts in Iran and North Korea was based on several important
assumptions. These assumptions are critical in both theory and reality. Most importantly,
the ability of the existing force structure to be successful depends on coalition support,
similar to that received from the RSAF in the Gulf War. Also, the analysis indicates a
successful two-MRC should be limited to emerging or niche states. Either Chinese or

73
Russian involvement exceeds the current F-15C force structure. For this reason, the F-22
is critical for complete air superiority against all threats.
In closing, based on the most likely scenario of a two-MRC with regional powers, the
US could clearly obtain air superiority in the near-term. However, this analysis verified
there are valid concerns for the US air-to-air force structure. For long-term dominance of
the air superiority mission the F-22 is a requirement. The F-15C will play an important
supporting role, not a primary one.
Notes
1 John A. Tirpak, “Washington Watch: The Risk of ‘Hollow Future,’” Air ForceMagazine 78, no. 5 (May 1995): 15.
2 David Syrett, “Northwest Africa 1942-1943,” in Benjamin Franklin Cooling, ed.,Case Studies in the Achievement of Air Superiority, (Washington, D.C.: Center for AirForce History, 1994), 239.
3 William J. Perry, Annual Report to the President and the Congress, (Washington,D.C.: GPO, 1995), 28.
4 Ibid., 199.5 Gary C. McMahon, “Air Force Logistics Doctrine: Where is it?” Air War College
Thesis, Maxwell AFB, AL, 1985), 23.6 Perry, 199.7 Briefing, McDonnell Douglas Aircraft Co., subject: F-15 Secondary Power System,
21 July 1995, 3.8 Ibid., 11.9 “The CBO’s Air Force,” Air Force Magazine 78, no. 3 (March 1995): 31.10 Ibid., 30.11 Ibid.12 Tirpak, 16.13 Ibid., 10.14 Rick Foster, Structural Engineer, McDonnell Douglas Aircraft Co., telephone
interview with author, 15 February 1996.15 Lt Col Herb Foret, F-16 Pilot, interview with author, 18 March 1996.16 AFM 1-1, Basic Aerospace Doctrine of the United States Air Force, vol. 2
(Washington, D.C.: GPO, 1992), 253.17 David A. Fulghum, “Chechnya Cripples Russian Aviation,” Aviation Week & Space
Technology 143, no. 6 (August 1995): 20-21.

74
Notes
18 John A. Tirpak, “Who Needs the F-22?” Air Force Magazine 78, no. 4 (April1995): 29.
19 Jane’s All The World’s Aircraft 1995-96, ed. Paul Jackson (Alexandria, VA: Jane’sInformation Group, 1995), 374.
20 Ibid., 379.21 John D. Morrocco, “‘Silver Bullet’ Option eyed for F-22, SSF,” Aviation Week &
Space Technology 138, no 22 (May 1993): 21-22.22 Jane’s Air Launched Weapons 1994, ed. Duncan Lennox, (Alexandria, VA: Jane’s
Information Group, 1994).23 Jane’s Aircraft, 379.24 Ibid.25 David A. Fulghum, “China Pursuing Two-Fighter Plan,” Aviation Week & Space
Technology 143, no. 3 (March 1995): 44.26 Arthur Waldron, “Dragon Growling,” National Review 7, no. 14 (July 1995): 44-
45.27 Stewart M. Powell, “The China Problem Ahead,” Air Force Magazine 78, no. 10
(October 1995): 60.28 Ibid., 62.29 Ibid.30 Waldron, 44-45.31 Jeffery R. Barnett, Future War: An Assessment of Aerospace Campaigns in 2010
(Maxwell AFB, AL.: Air University Press, 1996), 71.32 Karl P. Magyar, “Conflict in the Post-Containment Era,” War and Conflict
Coursebook (Maxwell AFB, AL.: Air Command and Staff College, 1995), 16-25.33 Mark Lorell, et al., “The Gray Threat,” Air Force Magazine 79, no. 2 (February
1996): 64-65.34 Craig Covalt, “Rafale Tests Focus on Weapons, Exports,” Aviation Week & Space
Technology 142, no. 24 (June 1995): 66-67.35 Sheila E. Widnall, “Widnall Assess the Force,” Air Force Magazine 78, no. 4 (April
1995): 34.36 Patrick Pexton, “What Americans Favor—And Why,” Air Force Times 56, no. 7
(18 September 1995): 19.37 Benjamin S. Lambeth, The Winning of Air Supremacy in Operation Desert Storm,
RAND Report P-7837 (Santa Monica, CA.: RAND Corporation, 1993), 35.38 Andrew Krepinevich, “Train Wreck Coming,” National Review 47, no. 13 (July
1995): 42.39 Steven Watkins, “Proposed Weapons Spending Dips,” Air Force Times, 18 March
1996: 34.40 Steven Watkins, “General Warns of New Drawdown,” Air Force Times, 18
September 1995: 21

75
Notes
41 Anthony D. Alley, “Forecasting Military Technological Needs,” in Dr. Karl P.Magyar et al., eds., Challenge and Response: Anticipating US Military Security Concerns(Maxwell AFB, AL.: Air University Press, 1994): 211.
42 Col John A. Warden III, “Air Theory for the Twenty-first Century,” in Dr. Karl P.Magyar et al., eds., Challenge and Response: Anticipating US Military Security Concerns(Maxwell AFB, AL.: Air University Press, 1994): 329.
43 Ibid., 328.44 Col David A Deptula, Firing for Effect: Change in the Nature of Warfare,
(Arlington, VA.: Aerospace Education Foundation, 1995): 18.45 Bernard Brodie and Fawn Brodie, From Crossbow to H-Bomb, (Bloomington, IN:
Indiana University Press, 1973): 38-39.46 Jane’s Weapons, 25.47 Ibid.48 Ibid.49 Thomas A. Keaney and Eliot A. Cohen, Gulf War Airpower Survey Summary
Report (Washington: GPO, 1993), 245.50 John A. Tirpak, “Fogleman Begins His Mission,” Air Force Magazine 78, no. 3
(March 1995): 26.51 Richard P. Hallion, Storm Over Iraq: Air Power and the Gulf War (Washington:
Smithsonian Institution Press, 1992), 146.52 Ibid., 167.53 Keaney, 197.54 Ibid.55 Hallion, 57.56 Keaney, 58-59.57 Ibid.58 Ibid.59 Ibid., 61.60 Gulf War Air Power Survey, vol. 5, A Statistical Compendium and Chronology,
(Washington: GPO, 1993), 276-277.61 Ibid., 584.62 “Republic of Iraq,” Jane’s Sentinel: The Gulf States 1994 (Alexandria, VA.:
Jane’s Information Group, 1994), 10-11.63 Hallion, 167.64 Gulf War Air Power Survey, vol. 5, 243.65 Joseph L Galloway and Bruce B. Auster, “The Most Dangerous Place to Be,” US
News & World Report, 20 June 1994: 54.66 Ibid., 41.67 Ibid., 105-108.

76
Notes
68 David A. Fulghum, “Pentagon Divided Over Defeating Scuds,” Aviation Week &Space Technology 140, no. 25 (June 1994): 23.
69 Benjamin S. Lambeth, “Desert Storm and Its Meaning: The View from Moscow,”RAND Report R-4164-AF (Santa Monica, CA.: RAND Corporation, 1992), 35.
70 Keaney, 197.71 Ibid.72 Lynn Grile, Reliability Analyst, Dynamic Research Corporation, 12 December
1995.73 Stewart M. Powell, “The China Problem Ahead,” Air Force Magazine 78, no. 10
(October 95): 61.74 Fulghum, “Pentagon,” 23.

77
Chapter 4
Modernization: The Ugly
Our modernization accounts are continually being raided to pay for otherprograms within DOD . . . we must stand up to these pressures. Havingmade the force-structure cuts to fund modernization, we must now standup to the budgetary challenges to keep those modernization accountsintact.
—Secretary of the Air Force, Sheila E. Widnall
Introduction
The third pillar of military capabilities is modernization. Modernization is the
upgrading of existing systems and the procurement of new systems to ensure long-term
readiness. While force structure and readiness are near-term mission indicators,
modernization provides the critical long-term roadmap. With diminishing budgets,
modernization has moved to the forefront of the debate on future Air Force capabilities.
Modernization planning is extremely difficult. Budget constraints have created an
environment critical of any increase in defense spending. With several years of lean
defense budgets, there has been keen competition for scarce funds among the three
pillars—modernization, readiness and force structure. General Loh, former commander of
ACC, confirmed the linkage between readiness and modernization in a recent article. He
states, “While technically a modernization issue, failing to buy enough equipment to do a
required job becomes a readiness issue. We must continue to insist on a balance among

78
readiness, force structure and modernization. It’s not today and some modernization
programs are suffering.” 1
In the readiness analysis, a trend was identified that emphasized readiness at the
expense of modernization. Consequently, the savings realized from the 1992 to 1994
force structure reductions were not transferred to modernization as originally planned; but
used instead for near-term readiness and contingencies.
The literature search and subsequent analysis answered two questions. First, what
strategy of subsystem upgrades would enable the F-15C to meet its air superiority
obligations into the twenty-first century? Second, is it necessary to buy the F-22 as
planned?
The modernization issue is critical to maintain a technological edge over potential
adversaries into the twenty-first century. General Fogleman summarized the importance
of the modernization debate when he stated, “If the Air Force doesn’t modernize it may be
in jeopardy of not being relevant in the next century.”2 The analysis will provide insights
into how best to accomplish air superiority modernization.
Literature Search
Modernization Budgets
Why modernize? John A. Tirpak, senior editor for Air Force Magazine, states that
“modernization is not an option but a necessity.” 3 He points out that the modernization
issue is highlighted by its affect on other force issues. For example, Tirpak explains the
lack of modernization of high demand assets such as the U-2, F-15Es, and RC-135s are
areas of particular concern. With fewer aircraft available for worldwide contingencies, the

79
effect on both the maintainers and aircraft is intensified. A similar argument can be made
as the result of the Air Force decision to reduce the F-15C force structure.
Although near-term readiness has been heavily funded, modernization has experienced
record shortfalls. In 1994 the Air Force requested $201 million for F-15 modernization,
but only received $77.6 million.4 There is evidence planners stressed near-term readiness
in lieu of modernization. Krepinevich, a noted defense authority, wrote that “the Clinton
administration grossly mismatched long-term modernization needs for current short-term
readiness dollars.”5 The dividends of the force reduction were not applied to moderniza-
tion as originally planned. This resulted in the lowest procurement budget since WWII
(See fig. 4-1).6
0
45
90
135
180
FY7
5
FY8
0
FY8
5
FY9
0
FY9
5
FY9
9
RDT&E
Procurement
MODERNIZATION FUNDINGConstant 95 $ Billions
Source: House, Department of Defense Appropriations for 1995: Hearings before theSubcommittee of the Committee on Appropriations, 103d Cong., 2d sess., 1994, 175.
Figure 4-1. Modernization Funding
However, there are indications a shift towards increased modernization funding is
occurring. Remarks by Secretary of Defense Perry show a renewed emphasis on
modernization. “We need to continue to buy some next generation weapons. This is our

80
commitment to the next generation of Americans.”7 General Fogleman stated in a 1995
interview, “We have to get on with [modernization] because the drawdown is essentially
over now. So we will now have to start getting that modernization ramping up again.”8
The recently released 1997 budget supports General Fogleman’s statements. After six
years of declining procurement funding, the Air Force will realize a 40 percent increase in
modernization through the year 2001 (See fig. 4-2). This funding situation is going to
have a direct impact on the F-22 acquisition and F-15C modernization programs.
0
10
20
30
40
50
60
70
80
90
90 91 92 93 94 95 96 97 98 99 00 01
DoD Procurement Program($ in Billions)
FY 90-97
Real Decline = 60%
FY 97-01
Real Increase 40%
Source: Report of the Defense Science Board Task Force on Aircraft Assessment, Officeof the Under Secretary of Defense for Acquisition, (Washington, D.C.: GPO, 1993), 2.
Figure 4-2. DOD Procurement Program
Because of the fragile funding environment, the Air Force must analyze its priorities.
Will there be enough money to buy the required number of F-22s? Will it be necessary to
extend the life of the F-15C and possibly rerole it to other missions? Obviously, the
budget debate is crucial to the much needed fighter aircraft modernization program.
Finally, the current modernization dilemma is an example of the interrelationship that
exists between readiness, force structure and modernization. If budget limitations prevent

81
additional modernization funding, then more force reductions can be expected. The
savings from additional force reductions could be earmarked for much needed recapitaliza-
tion. However, additional force structure reductions would make the two-MRC strategy
unsupportable, regardless of the threat.
The needed air superiority modernization program consist of two parts: a subsystem
upgrade of the F-15C and procurement of the F-22. The upgrades consist of replacing
existing subsystems with new components that improve the reliability and maintainability
of the current F-15C. F-22 procurement, although very costly, modernizes and increases
force structure.
Reliability Centered Maintenance: Invest not Inspect
Standard military and civilian maintenance procedures use inspection programs as a
tool for maintenance management. Although inspections supplement a maintenance
program, inspections do not overcome design deficiencies or component service-life
limitations. Prior to complex aircraft systems, managers advocated preventative
maintenance and inspection programs as methods to control failures.
The Air Transportation Association (ATA) sponsored a study that indicated age
limitations and inspection intervals were ineffective in preventing failures.9 Nowlan and
Heap wrote:
A maintenance policy based exclusively on some max operating age wouldno matter what the age limit, have little or no effect on the failure rate.Searching studies based on actuarial analysis of failure data suggested thatthe traditional hard-time policies were, apart from the expense, ineffectivein controlling failure rates.10
This is important to the current F-15C maintenance programs. The Air Force has
followed conventional wisdom by using inspection intervals as a method to ensure safety

82
in aging systems. The short-term solution foregoes component replacement with a
reduced inspection interval. Without funding for retrofits, the inspections provide a stop-
gap method of maintaining readiness. An alternative is the reliability-centered-
maintenance (RCM) program. RCM is a method of long-term component improvement.
System upgrades form the foundation of RCM. In their book, Reliability-Centered
Maintenance, Nowlan and Heap suggest modernizing components within a subsystem.
The maintenance manager can then reduce rates of failure dramatically.11 In addition, the
new component would have modifications that could increase resistance to failure.
The recent third stage disk problem in the F-100 engine supports using RCM methods
in place of the traditional inspection methods. Prior to 1993, the third stage disk required
an inspection every 1500 engine cycles.12 After a series of mishaps, the inspection interval
was reduced as low as 175 cycles.13 As the cycle interval dropped from 1500 cycles to
less than 300 cycles, the failures were not eliminated. However, the increased inspection
workload degraded F-15C readiness. The standard inspection interval method was
ineffective. According to Nowlan and Heap, inspection intervals do not eliminate systemic
design failures. Poor designing of the third stage disk created high cycle fatigue
problems.14 The best recourse was to replace, not inspect the component.
By replacing the third stage disk on specially developed speed-lines, the Air Force
was able to retrofit new fan disks in minimal time.15 The replacement of the disk followed
RCM concepts. It allowed an increase in the inspection interval to 1000 cycles (almost
two year intervals) and reduced mishaps. Unfortunately, the fan disk inspection had been
on-going for four years. The RCM approach would have saved money and labor if it had
been implemented from the outset.

83
Funding is the critical factor of a maintenance plan. The third stage disk problems
surfaced in 1993 when the effects of the RSD parts shortfall were at their zenith. Without
RSD funds to replace the third stage disk, the alternative was stopgap inspections that
were both costly and ineffective. However, replacing the disk rather than shortening the
inspection interval would have been economical and effective in the long run.
There is evidence of a shift towards an RCM component improvement program. The
F-16 avionics modification program completed in 1992 was an excellent example of RCM.
By upgrading the F-16 avionics systems, the workload was reduced 57 percent.16
Additionally, the F-15C is scheduled for a radar upgrade in 1998. The APG-63V1 will
replace one of the largest F-15C maintenance problems. This upgrade is an example of
using the RCM maintenance philosophy: reducing reliability problems with component
retrofits instead of inefficient inspection programs.
Eagle Generation: Systems Upgrade Program
The Eagle Generation program is an Air Force modernization strategy for the F-15C
based on RCM principles. In a 1995 briefing, representatives from McDonnell Douglas
identified the Eagle Generation objective as, “a roadmap ensuring F-15 operational
effectiveness and sustainability past the year 2020.”17
Eagle Generation evaluated a series of initiatives for system upgrades and identified
six systems to be placed on the fighter configuration plan.18
1. APG 63V1 Fire Control Radar.2. Joint Tactical Information Distribution System.3. -220E engine upgrade.4. Secondary power systems.5. Improved Heads-Up-Display.6. Advanced close-in air-to-air missile AIM-9X.

84
The Eagle Generation initiative illustrates the type of RCM strategies that can carry the
F-15C into the twenty-first century. 19
Long-Term Modernization: The F-22
While the Eagle Generation system upgrades do much to improve the near-term
readiness of the F-15C, the F-22 is the long-term solution to modernization. General
Ralston, vice chairman of the Joint Chiefs of Staff asserts:
The F-22 advanced fighter is absolutely fundamental and remains the topAir Force modernization program . . . the airplane will provide airsuperiority for US forces for the first half of the twenty-first century.20
General Ralstons’ statements are reinforced by Secretary Widnall when she wrote in Air
Force Magazine, “The initial battle for air superiority may well determine the course of the
next MRC . . . this is why the F-22 is our top modernization objective.”21 Secretary
Widnall bases her support for the F-22 on her belief the F-15C has lost its technological
edge and is at parity with other modern fighters. Also, Widnall cites a growing F-15C
vulnerability to improved surface-to-air missiles in a modern air campaign.22
With such strong support from key Air Force leaders, should be any doubt 442 F-22s
will be procured? There is one very important shortfall in this logic—money. At a time
when Congress is dominated by a budget reduction movement, a total program cost of
$71.6 billion arouses many critics23 (See table 4-1).
Table 4-1. F-22 Program Cost
Type Cost Base-Year The End YearProduction $38.7 Billion $52.5 BillionTotal Program $58.8 Billion $71.6 BillionUnit Fly-Away $71.6 Million $98.7 MillionSource: John A. Tirpak, “Perspectives in Air Warfare,” Air Force Magazine 79, no. 4(Apr 1996): 24-25.

85
The program is expensive. Although the F-22 possesses far superior capabilities over any
fighter in the world, the per unit cost is almost double that of the F-C. Not surprising,
some have contended that an enhanced F-15C with F-22 technologies could provide the
needed aircraft at far less cost.
General Loh advocated this concept when he stated, “If the F-22 gets off schedule or
over cost, the existing F-15 with F-22 technologies could serve as a competitive
alternative.”24 Similarly, a 1994 General Accounting Office (GAO) study reported,
“Foreign threats are not mature enough to justify the F-15C replacement”.25 The report
called for a delay in first unit Initial Operating Capability from 2003 to 2010.26 The
GAO’s call to delay the F-22 supports the 1993 prediction by the Defense Science Board
that the F-22 could become “budget-driven rather than event-driven.”27
General McPeak, former Air Force chief of staff stated, “The services could save an
awful lot of money by canceling an entire system program.”28 In a peacetime
environment, defense dollars are scarce, especially when the country is in a deficit
reduction mode. As one senior Pentagon official stated, “There is no wiggle room in the
budget. There are only hard choices left, do I still want to do an F-22 . . . there aren’t any
easy choices. The easy choices are gone.”29
If it is so costly, then why modernize? There are three important reasons: force
structure improvements; acquisition concerns; and threat considerations. First, 442 F-22s
increase the air superiority force structure quantitatively. Indirectly, they also provide
much needed relief for the multirole mission.
In the acquisition arena, many analysts are concerned about F-22 delays. Large
weapon systems are phased sequentially to eliminate paying several large expenditures

86
simultaneously. The current F-22 production schedule is phased from 1998 to 2008. This
places it between the C-17 and the JSF.30 Any delays in the current F-22 production
schedule would overlap it with the JSF and compound modernization funding problems.31
Finally, and most importantly, the F-15C technological advantage is eroding. The
qualitative advantage once held by the F-15C has been equaled by the Su-27 and will be
superseded by the new Russian Multirole Fighter Interceptor (MRI-42) and the Su-35
(See table 4-2).
Table 4-2. F-15C and Russian Interceptor Comparison
AIRCRAFT STEALTH THRUST SUPERCRUISEFIRST
FLIGHTF-15C No 24,000 lbs No 1972SU-27 No 27,557 lbs No 1977SU-35 Low 38,865 lbs No 1985
MRI-42 Mod Unknown Yes 2005-2010F-22 High 35,000 lbs Yes 1990
Source: Jane’s All The World’s Aircraft 1995-96, ed. Paul Jackson, (Jane’s InformationGroup, 1995).
Although all three are comparable, the Su-35 (the upgraded version of the Su-27)
possesses advantages in armament, thrust-to-weight, and radar. General Loh contends the
Su-27 alone can outperform the F-15C at both long and short ranges. In long-range
encounters, General Loh states that with the stronger radar the Su-27 “can launch a
missile before the F-15C does . . . so, from a purely kinematic standpoint, the Russian
fighters outperform the F-15C in the beyond-visual-range fight.”32 The Russians are
aggressively pursuing long-range air-to-air missiles in excess of 100 kilometers.33 These
missiles coupled with the long-range, phased-array radar, could dominate the BVR arena.
Unfortunately, the within-visual-range arena is not much better. General Loh feels
the AA-11 Archer infrared missile “is better than the best American [infra-red] missile.”34

87
General Loh cites the AA-11 off-boresight capabilities, i.e., the ability for the Archer to
lock-on without being pointed in the direction of the target, as being superior to American
IR missiles. Hopefully, the developmental AIM-9X will close the Russian missile gap.
Although, the Russians have at least equaled the F-15C technologically, the F-22
possesses three capabilities that would reassert US supremacy. First, the F-22 can
supercruise (cruise at supersonic conditions without using afterburners). This alone serves
as a force-multiplier through increased range, faster time-to-target, and a lower IR
signature. Moreover, the advanced avionics in the F-22 improve its offensive and
defensive capabilities. Finally, the stealthy design of the F-22 enables it to remain invisible
to the powerful radars of the Su-27 and Su-35. This overcomes their biggest advantage,
their ability to sense-and-shoot before the F-15C.35 Also, the stealth factor would help
eliminate the surface-to-air missile threat.36
However, the F-22 can reassert US superiority only if it is acquired in significant
numbers. The Russians studied the USAF’s performance in the Gulf War and concluded
that stealth and other technologies only make a difference when available in significant
numbers.37 Although expensive, the number of F-22s must not be reduced any lower.
The original production plan called for 72 aircraft per year, which was reduced to the
current 48 aircraft per year.38 Lockheed has scheduled production facilities for only 24
per year, anticipating further cuts in the F-22 buy. The total buy provides four wings of
F-22s (two wings per MRC).39 Less than four will further diminish the US ability to fight
a peer competitor in a two—MRC. The F-22, purchased in sufficient numbers, would
enhance the US ability to support a two-MRC against even peer competitors.

88
There is almost universal support for the F-22 among senior leaders. Upgrades to the
F-15C will make it a legitimate part of the air-to-air mission well into the twenty-first
century. However, enemy fighters are rapidly gaining parity; if not superiority. The F-22
is desperately needed to maintain a technological edge. Secretary Perry wrote in his 1995
annual review:
Many foreign fighters are now at parity with the F-15C. The F-15C isvulnerable to surface-to-air missiles and it may not win the air battlebeyond the next decade.40
Unfortunately, significant budget pressures, not threat concerns, may dominate the
debate over the F-22 procurement. Budget concerns are valid, but the US doctrine
depends on air-to-air superiority. Air Force Manual 1-1 states, “aerospace control . . . the
first priority of all aerospace forces.”41 Given budgetary constraints, the challenge is to
allocate scarce resources to both F-22 procurement and F-15C modernization.
Modernization Methodology
The literature search investigated the near-term F-15C upgrades and the long-term
F-22 procurement. The F-22 procurement issue was thoroughly discussed in both the
force structure and modernization literature reviews. Therefore, the modernization
analysis investigated only the F-15C near-term modernization. The analysis used two
methods: statistical analysis determined the best approach to F-15C upgrades; and a field
survey that measured F-15C and F-16 maintenance workloads.
Data Collected
The data came from four sources. WR-ALC depot provided a database of key
maintenance indicators that provided subsystem breakrates for the F-15C. Similar data

89
was collected from DRC for the F-16s. Maintainability statistics for the F-15C came from
a reliability and maintainability test done at Edwards Air Force Base. The maintainability
data from the study provided the maintenance-man-hours (MMH) statistics used in the
analysis. In addition, the SA-ALC provided engine reliability data.
Analysis Process
The analysis focused on system modification programs for the F-15C and consisted of
two phases: a statistical analysis to identify high maintenance subsystems and a cost-
benefit analysis on selected subsystems.
The statistical analysis used both reliability and maintainability statistics. The reliability
statistics included subsystem breakrate percentage and number of code threes. Both were
organized from highest to lowest and then graphed into a histogram. The combination of
breakrate and code three’s pointed to the subsystem with the highest number of
maintenance actions.
Maintainability was measured using Maintenance Man-Hours per Flight Hour
(MMH/FH) metric found in the reliability and maintainability test done at Edwards AFB.
Each subsystem was matched with its MMH/FH indicators. The MMH/FH indicators
were inserted into the reliability table to provide a method to evaluate maintainability. The
engines, radar, and airframe structures were identified through the analysis as the
subsystems requiring an upgrade. Finally, a cost-benefit analysis was performed on these
three subsystems. The analysis combined the retrofit cost with breakrate, maintenance-
man-hours, and MTBF improvements.

90
Analysis Assumptions
1. There is a direct correlation between breakrate and FMC rates.2. There is a reliability correlation between F100-PW-220 engines and retrofitted
F100-PW-220E engines. The -220E engines are -100 engines that have beenupgraded with -220 components. The -220 engine data was used to justify anupgrade from -220 engines to -220E engines.
3. Inflation rates remain reasonably constant. Long-range modernization funding isbased on then-year dollars assuming three percent inflation rates.
4. There will be no major changes in current subsystem reliability rates relative toother subsystems as the aircraft ages.
5. RSD funding levels will continue at current rates of nearly 100 percent. The RSDfunding directly affects parts availability. This indirectly affects reliability rates.
Analysis: Near-Term and Long-Term Modernization
This chapter was researched at a very opportunistic time. Following the defense
drawdown, savings from force-structure cuts were channeled into readiness accounts.
Now, the Air Force is on the eve of a refocus back to modernization. For the first time
since the drawdown, procurement funds will increase.42 Gen Fogleman stated:
We made the decision to cut modernization back so far in order to fundreadiness. I don’t say that was a bad decision. I just say that tradeoff, andif you made it, then the next place you spend more money is not necessarilyon readiness. It’s probably on modernization.43
The current strategy for recapitalization of the tactical fighter fleet is two-pronged.
The long-term plan involves the F-22 procurement and the near-term plan addresses
funding to extend the life of the F-15C through the year 2014.
F-22: Do We Really Need It?
No additional analysis is required. The literature reported extensively on the F-22
debate. Bottom line: the F-22 is expensive, but is a critical national requirement. The
research cited many excellent reasons for an F-22 buy of no less than 442 aircraft. Dr.
Perry stated the best justification for the F-22 when he identified the parity between the

91
F-15C and other modern fighters.44 If the US is to gain air superiority quickly and
decisively, then we must possess the technology edge. The current modernization plan
places the F-22 at the top of the priority list. When asked by Congress for his aircraft
funding priorities, General Fogleman replied, “the F-22 fighter, C-17 transport, the F-15E
fighter and the F-16 fighter—in that order.”45
The question is not if, but how many F-22s will the US buy? Again the literature
review indicated 442 was adequate: building 72 aircraft per month is too expensive, 24
aircraft per month is too low, and 48 aircraft per month is just right.46
F-15C Modernization: What Needs Upgraded?
Not if, but how? The F-15C must operate to at least 2014, even with a full buy of 442
F-22s. The force structure for a two—MRC dictates the extended life of the F-15C into
the twenty-first century. With few dollars available for a complete overhaul of aging
subsystems, where should the money be spent to best effect the extended life of the
F-15C?
Although the literature search provided volumes of information on the F-22 versus
F-15C debate, little has been written on a strategy for extending the life of the F-15C.
This study addresses the issue using statistical analysis. Statistical analysis was done to
determine the subsystems that provide the greatest reliability improvement. In chapter
two, the readiness analysis determined FMC rates were most influenced by system
breakrates and parts availability. This analysis will address the methods to improve
breakrates. In other words, what subsystems would most decrease the rising breakrates?
Breakrate is defined as the number of code three maintenance discrepancies per
sorties flown. Code three’s are pilot-reported discrepancies identifying a particular

92
subsystem as NMC. The highest ten F-15C subsystem breakrates for 1995 are illustrated
in table 4-3.
Table 4-3. F-15C Subsystem Breakrate
Subsystem WOC MMH/FHReportedCode 3s
Breakrate(percent)
Percent ofBreaks
1. Engines 23 1.50 1261 3.0 16.0 2. Radar 74 1.24 1035 2.5 13.2 3. Airframe 11 1.29 657 1.6 8.4 4. Fuel 46 .62 584 1.4 7.4 5. ECS 41 .26 563 1.3 7.2 6. IFF/Navg 71 .31 538 1.3 6.8 7. Land Gear 13 .43 522 1.2 6.6 8. ECM 76 .15 343 .8 4.4 9. Autopilot 52 .11 328 .8 4.210. UHF/Comm 63 .20 321 .8 4.1Subtotal of Ten NA NA NA 14.7 78.3FY 95 Totals NA NA NA 18.7 100.0
Source: Jeff Hill, TICARRS Database Manager, WR-ALC/LF, 1990-95 F-15C Mainte-nance Statistics, 6 Dec 1995.
Two trends are very relevant to the analysis. First, the highest four subsystem
breakrates make up 45.5 percent of the total 1995 average breakrate. Likewise, the
highest four subsystems make up 45.0 percent of the number of breaks (not rate). These
trends are very important because upgrade initiatives should target subsystems that are the
greatest sources of code threes. Improving high breakrate contributors will provide the
best return on an investment (See fig. 4-3).

93
0
4
8
12
16
ENG
INES
RAD
AR AF
FUEL
ESC IFF
L/G
ECM
AUTO UH
F
Histogram of Code Threes
Percentage
Source: Jeff Hill, WR-ALC/Ticarr, 6 Dec 1995.
Figure 4-3. Histogram of Code Threes
In 1995 radar and engines alone accounted for 29.2 percent of the code threes.
Almost one—third of all code three breaks can be attributed to only two subsystems from
a total of 24 identified in the depot breakrate summary. RCM principles call for subsystem
upgrades in at least theses two areas.
The analysis also investigated the subsystem upgrades from a maintainability
perspective. Whereas reliability evaluated the number of subsystem failures, maintainabil-
ity investigates the effort required to repair the maintenance failure. An F-15 reliability
and maintainability evaluation completed at the Air Force Flight Test Center, Edwards
AFB, was used as the source of maintainability data.47 The study compared reliability and
maintenance tests between the F-15E and the F-15C. Maintainability was measured using
average MMH/FH (See table 4-3).
The maintainability trends followed very similar patterns to reliability trends. Within
the top five, radar and airframe MMH/FH are the only numbers reversed from the

94
descending rank order in column three. Even then, the difference between radar and
airframe was only .05. This can be attributed to RCM theory that relates both reliability
and maintainability to the number of components that comprise a system.48 Simply put,
systems that are more complex break more often and are also more difficult to repair.
The most likely candidates for modernization are the three subsystems with the highest
breakrates: engines, radar, and airframe structures. Currently, funding has been identified
for the radar. In 1998, the Air Force will begin an APG-63 radar retrofit to all F-15Cs
with a completion date of 2003. The program will cost $2 million per aircraft with a total
program cost of almost $1 billion.49 The current F-15C radar mean-time-between-
maintenance (MTBM) of 30.6 hours should be dramatically reduced.50
The rudder is also scheduled for retrofit. Although the main airframe successfully
passed the structures test to over 18,000 hours, the secondary structures are failing at an
ever increasing rate.51 Consequently, the Air Force has initiated a retrofit of some of the
F-15C’s secondary structures: rudder, horizontal stabilators, vertical stabilators, flaps and
speed brakes. Many of these surfaces contain composite honeycomb structures which
have had durability problems.52 Table 4-4 depicts the increased depot level repairs on
secondary structures.
Table 4-4. F-15C Depot Level Repairs
Structure 1988 1992 1995Rudders 38 510 576
Horiz Stab 131 298 301Ailerons 11 166 174
Flaps 44 88 124Speed Brake 48 94 102
Source: WR-ALC, subject: F-15 Flight Control Replacement Program, 29Feb 1994.

95
The significant increases in depot level repairs reveal the maintainers’ concern with
secondary structures. The sharp rise in secondary structures repairs is elevated because of
the high MMH required to repair them.53
A roadmap for all secondary structures has been adopted by WR-ALC. Starting in
1997, WR-ALC will replace the rudders for $21.02 million.54 Authorizations for other
secondary structures are not firm. Unfortunately, funding is in serious jeopardy.
The modernization of the F-15C engines is a paradox. On one hand, poor engine
maintenance statistics justify their immediate upgrade. Engine code threes makeup 16
percent of all code three discrepancies.55 On the other hand, engines are the most
expensive subsystem to upgrade. The unit cost on a rebuilt F100-PW-100 converted to an
F100-PW-220E is $1.5 million. A new F100-PW-220 engine costs over $3 million. If
funding becomes available, the plan calls for approximately two squadrons a year (90
engines) for a conversion to the much more reliable -220E.56 However, with a total cost
of $603 million, available funding may preclude the engine conversion.57
Although costly, there is strong justification in funding a $603 million upgrade. The
upgrade would greatly reduce the unscheduled maintenance. The analysis revealed the
engine as the highest contributor to F-15C breakrates, making up 16 percent of all code
threes. A program that could reduce the largest maintenance factor on the F-15C
provides a great readiness boost.
A comparative analysis indicates substantial gains are possible by modifying existing
F100-PW-100 engines to F100-PW-220E engines. Table 4-5 illustrates the historic
advantage -220E engines maintain over -100 engines in unscheduled engine removals
(UER).

96
Table 4-5. PW-100-100/220 Comparison
-100 -220 PercentUER/1000 EFH 2.62 1.05 59.9
MTBM/EFH 69.2 95.8 27.8LRU/1000 EFH 4.61 3.02 34.5
Source: Fred Mullis, Pratt & Whitney Customer Service Rep, P&W SA-ALC, USAFE F100 Overview: Mar 1994–Mar 1995 (D042), 12 Dec 1995.
The -220 has a 59.9 percent improvement in UERs and a 27.8 percent improvement in
MTBM. Also, the -100 LRUs are replaced at a 34.5 percent higher rate than -220 LRUs.
These numbers strongly justify the cost of engine upgrades to a -220E. In fact, depot
officials briefed recently that a -220E engine conversion would save $2.4 billion in life
cycle costs for the F-15C.58 One unit reported, after conversion to -220s, that during a
three-month period they reduced their MMH by 1099 man-hours (that’s 45.8 man-days)
on engine removals and installations.59
However, the -220E program has a serious shortfall. It is severely short of retrofit
modules due to the lean RSD budgets in 1992 to 1994. These problems should be
alleviated with recent funding increases. Conversely, the poor reliability rate of the older -
100 engine will not diminish. If -220E engines are not funded, the reliability will only
degrade further as the -100 engine ages.
In closing, there are strong justifications for upgrading all three of the subsystems with
the highest breakrate. However, the likelihood of funding a $1 billion radar upgrade, a
$700 million engine upgrade, and a $700 million airframe structures program is extremely
unlikely. Although, the $2.4 billion upgrades appear more realistic when compared to the
F-22 cost of $71.6 billion.60

97
The initial analysis indicated engines and not radar systems should get the top priority
in funding. This is based on a higher engine breakrate, safety issues, and a lower program
cost. Further investigation revealed the obsolescence problem in the F-15C radar is
projected to increase dramatically. Hence, the funding of the radar upgrade defeats two
problems simultaneously—obsolescent parts and low reliability. Experts feel the
obsolescence problem will render the F-15C unsupportable if the system is not corrected.61
Therefore, the decision to fund the radar upgrade ahead of the engine upgrade is justified.
Most likely, funding for F-15C upgrades on all three recommended subsystems will not be
available. Unfortunately, field maintainers were hoping for all three subsytem upgrades as
a relief for their maintenance workload.
Surveys
Modernization is a people issue. Often weapon system modernization is associated
with only aircraft. However, modernization is related to reliability and maintainability
which directly affects the people who maintain the aircraft. For this reason, maintenance
personnel were surveyed from F-15C and F-16 bases to determine any differences in
maintenance workload.
Thirteen fighter squadrons were surveyed with over 400 responses (See appendix F).
Three questions were subjective in an attempt to determine the maintainer’s morale. The
other two questions determined actual hours worked over specified time periods.
Question one was used to determine the maintenance workload. Both F-15C and
F-16 maintainers felt their workloads were excessive. However, 75 percent of the F-15C
maintainers were unhappy with their workloads compared to 61 percent of the F-16
maintainers.

98
Questions two and three were designed to determine actual hours worked in an
attempt to remove subjectivity from the survey responses. Again, the F-15C maintainers
are working longer hours. Fifty-six percent of them are working up to six 12 hour shifts
per month. Compare this to only 44 percent of the F-16 maintainers working that long.
However, only 15 percent of the F-15 maintainers reported not working any weekend
shifts, while 24 percent of the F-16 maintainers worked no weekend shifts. These actual
figures show the F-15C maintainers are working longer hours and more days to maintain
their aircraft.
The final two questions determined the morale of the troops. The F-15C maintainers
are definitely more upset, with 92 percent reporting that long hours negatively affect their
attitude towards their job. The F-16 maintainers were at 63 percent. Eighty-one percent
of the F-15C maintainers reported their morale is affected by their workload. The F-16
numbers are again lower, with a 64 percent rate. These numbers reveal a substantial
difference in the way the two groups view their jobs.
These surveys indicate long work hours are required to maintain the F-15C. Long
work hours are having a significant impact upon the morale of the troops. F-15C
maintainers are almost unanimous in reporting that their attitude toward their job is being
negatively affected by the long workdays. While excellent supervision can help with the
morale of the troops, the grind of working long hours with little relief will eventually wear
down even the most motivated troops. The long-term solution is a robust modernization
program as outlined in Eagle Generation.
99
Recommendation for Modernization
The current modernization dilemma provides no easy decisions. Compounding the
problem is uncertainty of who and what are threats in the next century. Regardless, the
decisions must be made because the current F-15Cs are losing the technological edge to
enemy threats.
Recommendation One
Fund the F-22 aircraft. Do not delay the current initial-operating-capability date of
2005. Do not reduce the number of aircraft below 442. The threats from potential peer
competitors, with Russian Su-35 and MRI-42 aircraft, provide a definite challenge to US
air superiority. Also, emerging niche states using gray-threats purchased on the open
market will provide a serious challenge to the F-15Cs.
Recommendation Two
Be careful of funding the F-22 with broad force reductions. The total F-22 program
cost is $71.6 billion (then-year dollars)—expensive, especially so in a period when the
American public demands a balanced budget.62 One likely source for needed program
resources is force reductions; however, if mismanaged this option puts our personnel
readiness in jeopardy.
Personnel cuts in 1992 to 1994 used Voluntary Separation Incentive (VSI) programs
to reduce personnel force structure. Although admirable, the effects of that program
negatively impacted readiness. Large portions of the enlisted force who separated were at
the E-5 and E-6 levels, the backbone of intermediate and flightline maintenance. The loss
of experienced working-level maintainers seriously affected maintenance units.

100
0.0
2.0
4.0
6.0
8.0
10.0
12.0
14.0
90/2
90/4
91/2
91/4
92/2
92/4
93/2
93/4
94/2
94/4
95/2
95/4
CND %
SMOOTH
P
e
r
c
e
n
t
a
g
e
F-15C CND Rate
Source: Dynamic Research Corp, Lynn Grile, 1995.
Figure 4-4. F-15C CND Rate
The CND rate is an indicator of experience levels. Experienced technicians are able
to identify maintenance anomalies much better than inexperienced technicians. The
analysis attributed the 1993 to 1995 increase in CND rates to the VSI program and its
effect on the backbone of the maintenance force, the staff sergeants and technical
sergeants. Although further analysis is beyond the scope of this study, future decisions to
cut personnel must be tailored to minimize their impact on the quality and experience
levels of our maintenance personnel.
Recommendation Three
Fund F-15C radar, engine, and structures upgrades. The total upgrade of all three is
less than $3 billion dollars; but, the improvements will enable the F-15C to fly well into the
twenty-first century. The F-15C is currently holding a breakrate of just under 18
percent.63 If the engines, radar, and structure subsystems are not retrofitted, what will the
breakrates be in 2010 when systems are over 30 years old? RCM asserts that replacing

101
low reliability components is a savings in the long term. The analysis supports this
philosophy.
Recommendation Four
Relate the F-15C upgrades to quality-of-life issues. DOD policies since 1992 have
placed a high premium on readiness and more specifically quality-of-life issues. General
Fogleman contends this has happened at “the expense of modernization”.64 But, aren’t
numerous 12-hour workdays a quality-of-life issue? Senior leaders should be applauded
for such noteworthy policies as improving base housing and dormitory facilities—our
troops deserve it. However, a $3 billion investment in F-15C upgrades is a quality-of-life
issue. The field surveys depicted an F-15C workforce that is under great stress. This
paper recommends F-15C system upgrades be marketed not only as aircraft improvement
programs, but also as quality-of-life improvements. One survey participant wrote at the
bottom of the sheet: “Would someone tell those guys in Washington that a new dorm
room isn’t any good unless I have time away from the flightline to enjoy it?”
Conclusions
These are tough choices. However, the decisions are critical if the US is to achieve
air superiority into the twenty-first century. Senior leaders must make some difficult
decisions based on conflicting budgetary, political, and defense constraints.
Modernization of the air superiority force is at the center of this debate.
This study determined modernization is one of the most important defense issues as
we enter the twenty-first century. Although the previous chapters on readiness and force
structure were important, modernization is the lynchpin for the future defense posture.

102
The analysis identified three issues that are at the forefront of the modernization
debate. First, recent Russian advances with the Su-27, Su-35, and planned MRI-42
multirole fighter have challenged the technological advantage once dominated by the
F-15C. There is only one viable solution to the growing threat—F-22s.
Second, the statistical analysis revealed the F-15C’s declining reliability indicators
result primarily from only three subsystems: radar, engines, and secondary structures. A
complete retrofit of all three subsystems could be done for less than $3 billion. Compared
to the cost of other defense programs, the investment is not large and it would pay great
dividends in readiness and force structures.
Finally, modernization is not just an aircraft issue, it is also a people issue. The field
surveys indicate stress among the maintainers. F-15C maintainers appear to be under
more stress than F-16 personnel. The literature search revealed the decision was made to
transfer savings away from modernization in favor of readiness issues. This study
concludes modernization of the existing F-15Cs would greatly improve readiness and the
quality-of-life or our maintainers.
Can US forces achieve air-to-air superiority quickly and decisively into the twenty-
first century? Only with modernized air superiority fighters. In the near-term,
modernization should consist of a retrofitting the F-15C radar, engine and structure
subsystems. In the long-term, modernization should consist of procuring 442 F-22
fighters as currently scheduled. Dominance of the airspace depends on it.

103
Notes
1 John A. Tirpak, “Washington Watch: The Risk of a ‘Hollow Future,’” Air ForceMagazine 78, no. 5 (May 1995): 15
2 Ibid., 15.3 Ibid., 15.4 House, Department of Defense Appropriations for 1995: Hearings before the
Subcommittee on the Department of Defense of the Committee on Appropriations, 103dCong., 2d sess. (Washington, D.C.: GPO, 1994): 175.
5 Andrew Krepinevich, “Train Wreck Coming,” National Review 47, no. 14 (July1995), 46.
6 House, 30.7 House, 4.8 Robert S. Dudney, “The Zero-Warplane Budget,” Air Force Magazine 78, no. 4
(April 1995): 53.9 F. Howard Heap and F. Stanley Nowlan, Reliability Centered Maintenance, (Los
Altos, CA.: Dolby Access Press, 1978), 3.10 Ibid., 4.11 Ibid., 75.12 HQ ACC/SEF Report, “F100-PW-100 Engine Survey Results,” 6 May 1994.13 Martin Burisend, Fan Program Manager, SA-ALC, telephone interview with
author, 28 Mar 1996.14 Briefing, SA-ALC/LR, subject: High Cycle Fatigue Initiative, October 95.15 Burisend.16 Peter Grier, “Hidden Trends in Readiness Rates,” Air Force Magazine 76, no. 1
(January 1993): 52-54.17 Briefing, McDonnell Douglas Aircraft Co., subject: Eagle Generation Roadmap
Brief, 15 March 1995.18 Ibid.19 Bob Rutter, Eagle Vision Manager, McDonnell Douglas Aircraft Co., telephone
interview with author, 29 February 1996.20 John A. Tirpak, “Perspectives in Air Warfare,” Air Force Magazine 79, no. 4
(April 1996): 24-25.21 Sheila E. Widnall, “Widnall Assesses The Force,” Air Force Magazine 78, no. 4
(April 1995): 34.22 Ibid., 38.23 John A. Tirpak, “Who Needs the F-22,” Air Force Magazine 78, no. 4 (April
1995): 28.24 Bill Sweetman, “USAF Modernization Faces Budget Hurdles,” Interavia/Aero-
space World 50 (June 1995): 69.25 “Washington Outlook,” Aviation Week & Space Technology 140, no. 1 (January
1994): 33.

104
Notes
26 Ibid.27 Report of the Defense Science Board Task Force on Aircraft Assessment, Office of
the Under Secretary of Defense for Acquisition (Washington, D.C.: GPO, 1993), 2.28 Sweetman, 70.29 Vago Muradian, “Wiggle Room is Gone,” Air Force Times , 21 February 1994: 19.30 Ibid.31 William L. Stanley, “Assessing the Affordability of Fighter Aircraft Force
Modernization,” New Challenges for Defense Spending, ed. Paul K. Davis, (SantaMonica, CA.: RAND Corporation, 1990), 566.
32 Tirpak, “F-22,” 29.33 Jane’s Air Launched Weapons, ed. Duncan Lennox, (June 1995): 25.34 Tirpak, “F-22,” 29.35 Ibid.36 William J. Perry, Annual Report to the President and the Congress (Washington,
D.C.: GPO, 1995), 299.37 Benjamin S. Lambeth, Learning From the Persian Gulf War, RAND Report P-
7850 (Santa Monica, CA.: RAND Corporation, 1993), 11.38 Sweetman, 76.39 Tirpak, “F-22,” 27.40 Perry, 299.41 AFM 1-1, Basic Aerospace Doctrine of the United States Air Force, Vol. 2
(Washington, DC: GPO, 1992), 103.42 John A. Tirpak, “Washington Watch: The Risk of a ‘Hollow Future,’” Air Force
Magazine 78, no. 5 (May 1995): 15.43 Dudney, 53.44 Perry, 229.45 John A. Tirpak, “The Risk of a Hollow Force”, Air Force Magazine 78, no. 5 (May
1995): 26.46 Sweetman, 69.47 Carl Ford, F-15E Reliability and Maintainability Evaluation Final Report, AFFTC
Report TR-89-4F (Edwards AFB, CA.:AFFTC).48 F. Howard Heap and F. Stanley Nowlan, Reliability Centered Maintenance (Los
Altos, CA.: Dolby Access Press, 1978), 102.49 Briefing, McDonnell Douglas Aircraft Co., subject: Eagle Vision, September 1994.50 Ford.51 Rick Foster, Structural Engineer, McDonnell Douglas Aircraft Co., telephone
interview with author, 15 February 1996.52 Briefing, WR-ALC, subject: F-15 Flight Control Replacement Program, 29
February 1994.53 Ibid.

105
Notes
54 Ibid.55 Jeff Hill, TICARRS Database Manager, WR-ALC/LF, 1990-95 F-15C maintenance
statistics, 6 December 1995.56 Briefing, subject: FY98 - 03 Propulsion POM Initiatives, October 1995.57 Martin Burisend, Fan Program Manager, SA-ALC, telephone interview with
author, 28 March 1996.58 Briefing, SA-ALC/LR, subject: High Cycle Fatigue Initiative, October 1995.59 Col Robert R. Jones, HQ ACC/SEF, “F100-PW-100 Engine Survey Results,” 6
May 1994.60 Tirpak, “F-22,” 28.61 Briefing, WR-ALC, subject: Avionics Obsolete Parts, 1995.62 Tirpak, “F-22,” 28.63 Hill.64 Dudney, 53.

106
Chapter 5
Conclusion
The United States Air Force is at a critical point for equipping the air superiority
force. Strategically, the global situation is unstable with unconventional threats, emerging
states, emerging regional powers and fluctuating budget conditions. But, these dynamic
conditions are represented in a single question which is rooted in US airpower doctrine:
How does the USAF equip the force needed to achieve air superiority quickly and
decisively against any foreign threat into the twenty-first century?
This study examined the role of air superiority by conducting an analysis of the
F-15C, presently the primary air superiority fighter in the USAF. The analysis evaluated
the F-15C using the three pillars of military capability identified in Air Force Manual 1-1:
readiness, force structure, and modernization.
This analysis concluded the F-15C currently has a good readiness capability. F-15C
units could meet and accomplish their mission from strictly a readiness perspective. But,
there are disturbing maintenance indicators which raise some readiness concerns. Since
1992 the fully-mission-capable rate has consistently declined from 83 percent to a recent
low of 76.8 percent. Two significant contributing factors are effecting the downward
spiraling fully-mission-capable rates. First, a drastic reduction in RSD funding from 1992
to 1994 that funded budgets 60 percent below required levels. The effect on depot level

107
parts was dramatic. Although funding was increased to 100 percent of required levels in
1995, the production lag will continue at least another year. Fortunately senior leaders
recognized the problem and full funding was restored.
Second, the breakrate measuring the number of nonmission-capable reports sortie
contributed to the declining fully-mission-capable rate. In the last three years, the
breakrate hovered around 18 percent. This is substantially higher than the 14 percent
levels seen five years ago. This analysis identified the aging-aircraft syndrome as a source
of the 18 percent breakrate. Increased unscheduled maintenance failures with F-15C
engine components was another contributing factor. However, the study concluded there
were no systemic reliability problems that would render the F-15C unready.
This study determined the F-15C force structure, the second pillar of military
capabilities, was adequate for a two-MRC with only regional powers. To evaluate the
F-15C force structure, a hypothetical model of a two-MRC war against Iran and North
Korea was developed. This model was based on operational and logistical data from the
Gulf War. The US could meet the two-MRC strategy only if two conditions are present:
coalition airpower contributions of approximately 35 percent; and, the MRC threats are
limited to niche states and not peer, or even near-peer competitors.
The emerging stealth and precision weapons are propelling the US into a Revolution
in Military Affairs. Although air-to-air doctrine is lagging behind the precision—strike
theory of air-to-ground, the US must persist in developing long-range standoff air-to-air
weapons to compete in the emerging RMA. Lessons from the Gulf War reveal stealth and
precision weapons reduce force size significantly. The F-22 stealth capabilities, coupled

108
with a long-rang air-to-air missile, provide the technologies to reach a new level of
airpower.
The F-15C cannot meet the air superiority mission for the twenty-first century
without the introduction of the F-22 into the force. Both peer and niche states are
developing or purchasing advanced fighters that will erode the technological advantage the
F-15C has maintained in the last 18 years. In fact, the F-15C’s primary role will be to
supplement the F-22 as the primary air superiority fighter.
Finally, this study examined the required modernization for air superiority into the
twenty-first century. The modernization analysis was organized into two distinct efforts:
a near-term analysis for upgrading F-15C subsystems for reliability improvements; and, a
long-term evaluation of modernization for the overall air superiority mission.
The near-term analysis consisted of statistical analysis methods. By evaluating 24
F-15C subsystems, the study determined that engines, structures and radar systems
possess the poorest reliability and maintainability statistics. The three subsystems were
then evaluated in a cost-benefit analysis.
Several key observations were noted. The APG-63 radar, F100-PW-100 engines, and
structure upgrades are mandatory. The USAF cannot expect to fly the F-15C to 2014, or
beyond, without replacing these subsystems. The total cost of the three retrofits would be
under $3 billion. The upgrades would dramatically reduce the current 18 percent
breakrate and extend the F-15C service life well beyond 2014.
Additionally, modernization is a people issue. The recent emphasis on quality-of-life
issues are admirable, but quality-of-life is more than a new dormitory. Planners have
neglected F-15C modernization at the expense of the troops. If people are a vital

109
resource, then we must provide them reliable equipment: an upgraded APG-63V1 radar;
a retrofitted F100-PW-220E engine; and new secondary structures. If the USAF does
not modernize, readiness will be affected: its people are already losing ground to an 18
percent breakrate. Without subsystem upgrading, the aging process will increase the
breakrate beyond the ability to maintain the F-15C.
However, the real concern is long-term modernization. The growing proliferation of
advanced fighter technology to both peer and niche states has seriously eroded the
F-15C’s technological edge. The F-22 is the long-term solution to air superiority.
Although it offers many performance advantages, the F-22 provides one advantage that
places it above all competitors: outstanding stealth characteristics. The analysis con-
cluded the F-22 is the single system that can simultaneously enhance readiness and force
structure. General Fogleman was prophetic: the F-22 is truly a national program, not just
an Air Force program.
The decisions are difficult. Many variables must be calculated into the final equation.
However, air superiority is a cornerstone of US doctrine and there are two solutions to
maintain it into the twenty-first century: $3 billion for F-15C upgrades and $71.6 billion
for the F-22.

110
Appendix A
Databases
Table A-1. F-15C Database
QTR FMC TNMCM TNMCS BRK % CANN % BCS % CND %90/2 76.6 10.5 10.1 14.6 17.6 17.0 11.290/3 83.1 10.5 8.9 12.5 16.9 16.7 10.290/4 82.2 11.6 7.2 10.7 14.2 19.8 11.691/1 80.4 12.6 8.0 9.7 7.5 14.2 11.391/2 81.1 12.1 7.0 17.9 8.0 16.0 11.091/3 81.5 11.5 8.0 15.4 13.7 16.6 9.591/4 81.9 11.7 8.5 16.4 14.6 15.6 9.992/1 82.7 10.9 9.3 19.7 18.5 14.5 10.092/2 80.6 12.3 9.3 15.7 12.6 15.4 9.692/3 80.2 12.9 9.7 14.0 9.5 16.9 8.892/4 78.7 14.0 9.3 16.2 13.9 17.8 7.593/1 79.1 13.1 10.9 14.1 15.5 16.0 7.393/2 79.8 12.2 9.6 16.9 14.3 15.9 8.793/3 82.9 10.2 8.3 17.0 6.4 19.4 8.493/4 81.5 10.9 8.3 17.6 3.3 14.5 5.894/1 81.6 10.8 8.5 21.5 15.2 15.2 8.694/2 75.6 14.4 10.3 18.5 18.1 17.2 10.394/3 74.8 14.7 12.4 15.7 14.2 17.4 10.994/4 76.7 13.2 12.0 17.3 17.4 13.8 12.495/1 79.4 11.2 10.4 17.8 17.9 13.1 11.495/2 77.7 12.2 10.4 17.9 16.6 14.4 10.995/3 75.6 13.3 10.2 17.5 14.7 12.7 13.195/4 75.2 13.4 10.5 17.9 15.1 12.6 13.7
Source: Lynn Grile, Reliability Analyst, Dynamic Research Corporation, 1990-95F-15C and maintenance statistics, 12 Dec 1995.

111
Table A-2. F-16C Database (Block 30s)
FMC Rate NMCM Rate NMCS RateCY 90 87.8% 5.0% 5.0%CY 91 84.6% 6.2% 5.4%CY 92 76.3% 9.4% 6.3%CY 93 77.0% 10.2% 5.4%CY 94 71.4% 14.1% 5.3%CY 95 70.4% 12.9% 4.6%
Source: Lynn Grile, Reliability Analyst, DynamicResearch Corporation, 1990-95 F-16 maintenancestatistics, 12 Dec 1995.
Table A-3. F-16C Database (Block 40s)
FMC Rate NMCM Rate NMCS RateCY 90 92.0% 2.7% 4.4%CY 91 91.0% 3.3% 4.1%CY 92 90.5% 4.1% 4.1%CY 93 86.7% 5.5% 4.6%CY 94 79.7% 8.3% 5.7%CY 95 78.5% 8.3% 5.6%
Source: Lynn Grile, Reliability Analyst, DynamicResearch Corporation, 1990-95 F-16 maintenancestatistics, 12 Dec 1995.
Table A-4. F-16C Database (Block 50s)
FMC Rate NMCM Rate NMCS RateCY 90 ** ** **CY 91 ** ** **CY 92 87.6% 4.5% 6.8%CY 93 93.6% 3.0% 2.8%CY 94 87.9% 4.7% 5.7%CY 95 84.9% 6.1% 5.8%
Source: Lynn Grile, Reliability Analyst, DynamicResearch Corporation, 1990-95 F-16 maintenancestatistics, 12 Dec 1995.

112
Table A-5. TICARRS Data
QTR FMC TNMCM TNMCS BRK % CANN % BCS % CND %90/2 76.6 10.5 10.1 14.6 17.6 17.0 11.290/3 83.1 10.5 8.9 12.5 16.9 16.7 10.290/4 82.2 11.6 7.2 10.7 14.2 19.8 11.691/1 80.4 12.6 8.0 9.7 7.5 14.2 11.391/2 81.1 12.1 7.0 17.9 8.0 16.0 11.091/3 81.5 11.5 8.0 15.4 13.7 16.6 9.591/4 81.9 11.7 8.5 16.4 14.6 15.6 9.992/1 82.7 10.9 9.3 19.7 18.5 14.5 10.092/2 80.6 12.3 9.3 15.7 12.6 15.4 9.692/3 80.2 12.9 9.7 14.0 9.5 16.9 8.892/4 78.7 14.0 9.3 16.2 13.9 17.8 7.593/1 79.1 13.1 10.9 14.1 15.5 16.0 7.393/2 79.8 12.2 9.6 16.9 14.3 15.9 8.793/3 82.9 10.2 8.3 17.0 6.4 19.4 8.493/4 81.5 10.9 8.3 17.6 3.3 14.5 5.894/1 81.6 10.8 8.5 21.5 15.2 15.2 8.694/2 75.6 14.4 10.3 18.5 18.1 17.2 10.394/3 74.8 14.7 12.4 15.7 14.2 17.4 10.994/4 76.7 13.2 12.0 17.3 17.4 13.8 12.495/1 79.4 11.2 10.4 17.8 17.9 13.1 11.495/2 77.7 12.2 10.4 17.9 16.6 14.4 10.995/3 75.6 13.3 10.2 17.5 14.7 12.7 13.195/4 75.2 13.4 10.5 17.9 15.1 12.6 13.7
Source: Jeff Hill, TICARRS Database Manager, WR-ALC/LF, 1990-95 F-15Cmaintenance statistics, 6 Dec 1995.

113
Appendix B
Regression Model
Table B-1. ISP Program Data
Variable Coefficient Standard Error T-Test Significant P-Valuea 107.6817 3.315312 32.480 Y .000TNMCM -1.255047 .2830776 -4.434 Y .000TNMCS -.6484008 .2448562 -2.648 Y .018BRK -.1914386 .1020022 -1.877 N .079CND -.3039332 .1607829 1.890 N .077SSD -1.989197 1.176025 -1.691 N .110O&M -.150731 .07030765 -2.144 Y .048Source: ISP version 4.6, Lincoln Systems Corporation, Westford, MA.
The critical t-value for d.f. = 16 and alpha = .0500 is 2.11991.
Std dev of reg = 1.15899, R = .929, R-Sqrd = .863, Adj R-Sqrd = .811F-test = 16.773, p-value = .0000, F value from table (alpha = .05) = 2.74Observations = 23.0 Degrees of freedom for numerator = 6, for denominator = 16
Table B-2. Regression Analysis: Correlation Between Regression Coefficients
Coeff Constant TNMCM TNMCS BRK CND SSD O&MConstant 1.000 -.709 .196 .603 .110 -.336 -.374TNMCM -.709 1.000 .626 .325 -.251 .470 .405TNMCS .196 -.626 1.000 -.375 -.007 -.335 -.236BRK -.603 .325 .375 1.000 -.005 .261 .298CND -.110 -.251 -.007 -.005 1.000 -.504 .020SSD -.336 .470 -.335 .261 -.504 1.000 .225O&M -.374 .405 -.236 .298 .020 .225 1.000
Source: ISP version 4.6, Lincoln Systems Corporation, Westford, MA.

114
Table B-3. Regression Model Input Database
FMC TNMCM TNMCS BRK CND SSD O&M Y90/2 76.6 10.5 10.1 14.6 11.2 1 -0.9 79.9022690/3 83.1 10.5 8.9 12.5 10.2 1 -0.9 81.386390/4 82.2 11.6 7.2 10.7 11.6 1 -0.9 81.0271191/1 80.4 12.6 8 9.7 11.3 0.34 -4.2 81.3462591/2 81.1 12.1 7 17.9 11 0.34 -4.2 81.1435591/3 81.5 11.5 8 15.4 9.5 0.34 -4.2 82.1826891/4 81.9 11.7 8.5 16.4 9.9 0.34 -4.2 81.2944592/1 82.7 10.9 9.3 19.7 10 0.61 -11 81.6055292/2 82.2 12.3 9.3 15.7 9.6 0.61 -11 80.7357892/3 80.2 12.9 9.7 14 8.8 0.61 -11 80.2919892/4 78.7 14 9.3 16.2 7.5 0.61 -11 79.1447493/1 79.1 13.1 10.9 14.1 7.3 0.42 1.4 78.2085393/2 79.8 12.2 9.6 16.9 8.7 0.42 1.4 79.2194693/3 82.9 10.2 8.3 17 8.4 0.42 1.4 82.6445193/4 81.5 10.9 8.3 17.6 5.8 0.42 1.4 82.4413494/1 81.6 10.8 8.5 21.5 8.6 0.4 -4.1 81.7083594/2 75.6 14.4 10.3 18.5 10.3 0.4 -4.1 76.0806994/3 74.8 14.7 12.4 15.7 10.9 0.4 -4.1 74.696294/4 76.7 13.2 12 17.3 12.4 0.4 -4.1 76.0759395/1 79.4 11.2 10.4 17.8 11.4 1 -5.5 78.8491895/2 77.7 12.2 10.4 17.9 10.9 1 -5.5 77.7269695/3 75.6 13.3 10.2 17.5 13.1 1 -5.5 75.8840195/4 75.2 13.4 10.5 17.9 13.7 1 -5.5 75.30505
Source: ISP version 4.6, Lincoln Systems Corporation, Westford, MA.

115
Appendix C
Regression Analysis Data
C.1 F-Test (Determine Model Statistical Significance).
1. From Data Output, R2 = .863.2. Entering R2 table of critical values for 23 observations and six independent
variables, critical value = .718.3. Perform F-Test is R2 > critical value. If so very highly significant within .1%.
863 > .718 = Yes, very highly significant.
C.2 Outputted values exceeding critical values of 2.074 are determined with 95%significant as a single variable. See table 9.1.1 from Practical Business Statistics.
n=23DOF=2295% = Confidence LevelCritical Value = 2.074
Table C-1. F-Test Data
TNMCM |-4.434| 2.074 YesTNMCS |-2.648| 2.074 YesBRK |-1.877| 2.074 NoCND |-1.890| 2.074 NoSSD |-1.691| 2.074 NoO&M |-2.144| 2.074 Yes
Source: ISP version 4.6, Lincoln Systems Corporation, Westford, MA.

116
Table C-2. Regression Analysis
Variable Coefficient T-Test.050
Significance P-Valuea 107.6817 32.480 Y .000TNMCM -1.255047 -4.434 Y .000TNMCS -.6484008 2.648 Y .018BRK -.1914386 -1.877 N .079CND -.3039332 -1.890 N .077SSD -1.989197 -1.691 N .110O&M -.150731 -2.144 Y .048
Source: ISP version 4.6, Lincoln Systems Corporation, Westford, MA.Dependent Variable: FMC
Std dev of reg = 1.15899, R = .929, R-Sqrd = .863, Adj R-Sqrd = .811F-test = 16.773, p-value = .0000, F value from table (alpha = .05) = 2.74Observations = 23 Degrees of freedom for numerator = 6, for denominator = 16
Using this data, these three models validations were completed:
1. The F-test was completed and provide the overall model significance as within.1%, in the “very highly significant” category.
2. Likewise, the t-test was completed and provided as output in column 4. The threeindependent variables TNMCM, TNMCS and O&M were determined individuallysignificant (see appendix 8.2). Note that although breakrate and CND were belowcritical value of 2.074, they were relatively close. This lends to the high overallmodel rating from the F-Test.
3. The last column provides the values for the P-value test. Any value below .05 isconsidered within conventional range of 5 percent variability with a 95 percentconfidence level. Although, some individuals feel 10 percent (< .1) is readilyacceptable.
Overall, the regression model easily conforms within acceptable confidence levels.
For the three variables that were not significant, they represent condition of multi-
colinearity because of similar values measurement. Now an analysis of relationships
between the six variables and the resultant FMC Rate can be completed.

117
C.4 Prediction Equation.
From the regression analysis, the following coefficients with corresponding standard
errors for each coefficient:
Table C-3. Prediction Equation
Variable Coefficient Standard Errora 107.6817 3.315312TNMCM -1.255047 .2830776TNMCS -.6484008 .2448562BRK -.1914386 .1020022CND -.3039332 .1607829SSD -1.989197 1.176025O&M -.150731 .07030765
Source: ISP version 4.6, Lincoln Systems Corporation, Westford, MA.
Using the standard regression equation (981-B):
Y = a+b1x1+b2x2+ . . . +bpxp
Forming the following prediction or regression equation for the model of FMC as a
function of TNMCM, TNMCS, BRK, CND, SSD and O&M.
FMC = 107.7 - 1.3 (TNMCM) - .6 (TNMCS) - .2 (BRK) - .3 (CND) - 2.0 (SSD) - .1 (O&M)
This equation will predict FMC Rate based on data from 1990-1995 within above
specified standards of error.

118
The following plots illustrate the close approximations between actual and prediction
curves.
70
72
74
76
78
8082
84
90/2
90/4
91/2
91/4
92/2
92/4
93/2
93/4
94/2
94/4
95/2
95/4
FMC
YRegression Analysis Prediction Curve Versus Actual
Source: ISP version 4.6, Lincoln Systems Corporation, Westford, MA.
Figure C-1. Regression Analysis Prediction Curve Versus Actual

119
Appendix D
F-15 Service Life
0
100
200
300
400
500
1990
2005
2020
2035
8,000 Hour Service Life
C
A
E
Source: Rick Foster and Ron Mellere, Aerospace Digest 41, no. 3 (Summer 1994).
Figure D-1. 8,000 Hour Service Life
0
100
200
300
400
500
1990
2005
2020
2035
10,000 Hour Service Life
C
A
E
Source: Rick Foster and Ron Mellere, Aerospace Digest 41, no. 3 (Summer 1994).
Figure D-2. 10,000 Hour Service Life

120
0
100
200
300
400
500
1990
2005
2020
2035
12,000 Hour Service Life
Source: Rick Foster and Ron Mellere, Aerospace Digest 41, no. 3 (Summer 1994).
Figure D-3. 12,000 Hour Service Life

121
Appendix E
Two MRC Sortie Calculation
Aircraft required to meet 30 day sorties based on average of 120 OCA and CAP
sorties per day. The 120 sorties per day is worst case. In the Gulf War, USAF F-15Cs
flew 66 percent of OCA and CAP missions averaging 138 sorties per day for the first three
days of the war; 98 sorties per day after air supremacy was declared on 27 January; 98
sorties per day over the 42 day air war (17 Jan–28 Feb). The calculations were based on
the following assumptions:
Calculate number aircraft to meet 120 sorties per day for 30 days:
Assume:
1. Assume 80.0 percent MC rate. In Gulf, FMC rates rose to 93.6 percent average. For1995 peacetime, MC rate was 80.4.
2. Assume adequate parts availability.3. Assume adequate base defense and availability. Should evacuation of air bases on
Korean peninsula be necessary, operations would carry on from bases at Kadena andMisawa AB, Japan. This would affect sortie duration length and subsequent numberof aircraft required.
4. Assume worst-case air loss attrition of two percent for first 10 days of war. In Gulf,zero percent attrition rate was achieved by F-15Cs.
5. Assume five-percent abort rate (standard). In Gulf, abort rate was much lower.6. Assume a three-percent attrition loss to enemy air operations for first 10 days of war.
All lost aircraft replaced with attrition aircraft.

122
7. Korea/Iran calculations (Data Assumed):a. available F-15C less NMC and aborts:
100 F-15C in theater (not including attrition fill).80 assumed MC rate80 available A/C per day for launch-4 daily abort loss based on 5 percent abort rate76 aircraft launch
b. Average sorties per flying:120/76 = 1.58 sorties per flyer per day
c. Total sorties in 30 day period:30 days × 120 sorties = 3600 total sorties (30 days)
d. Total loss aircraft at 3 percent attrition for first 10 days of war:120 sorties/day × 30 days × .03 = 35 A/C
8. 1991 Gulf War calculations.a. Available F-15C less NMC and aborts:
100 F-15C in theater.93 FMC rate93 aircraft available-2 less abort A/C of 2 percent91 aircraft available
b. Average sortie per flyer:108/91 = 1.19
c. Total sorties 42 day period: 4558 USAF OCA/CAPNot calculated, obtained GWAPS pg. 197.
d. Total attrition due to enemy operations: 0 percentNot calculated, obtained GWAPS pg. 197.

123
Appendix F
Survey Questionnaires

124
F-15 Questionnaire
On Maintaining My Weapon System
The following 5 questions deal with the maintenance workload for F-15 maintainers (E-6and below). The results of this survey will be summarized in an Air Command and StaffCollege research paper.
Note: At no time will individual maintainers, their squadrons, or their wings be identifiedindividually. The results will be summarized by weapon system only, e.g., F-16 workloadsvs. F-15 workloads.
(Circle the best response):
1. The F-15 maintenance workload is excessive requiring many long duty days andweekend duty.
Strongly Disagree Undecided Agree StronglyDisagree Agree
2. In the past four weeks I’ve worked ___ 12-hour shift workdays.
(None) (1-3) (4-6) (7-9) (10-12) (13 or more)
3. In the past eight weeks I’ve worked ___ weekends.
(None) (1-2) (3-4) (5-6) (7-8)
4. The length of my workdays affect my attitude toward my job.
Strongly Disagree Undecided Agree StronglyDisagree Agree
5. The morale of my unit is negatively affected by the F-15 maintenance workload.
Strongly Disagree Undecided Agree StronglyDisagree Agree

125
F-16 Questionnaire
On Maintaining My Weapon System
The following 5 questions deal with the maintenance workload for F-16 maintainers (E-6and below). The results of this survey will be summarized in an Air Command and StaffCollege research paper.
Note: At no time will individual maintainers, their squadrons, or their wings be identifiedindividually. The results will be summarized by weapon system only, e.g., F-16 workloadsvs. F-15 workloads.
(Circle the best response):
1. The F-16 maintenance workload is excessive requiring many long duty days andweekend duty.
Strongly Disagree Undecided Agree StronglyDisagree Agree
2. In the past four weeks I’ve worked ___ 12-hour shift workdays.
(None) (1-3) (4-6) (7-9) (10-12) (13 or more)
3. In the past eight weeks I’ve worked ___ weekends.
(None) (1-2) (3-4) (5-6) (7-8)
4. The length of my workdays affect my attitude toward my job.
Strongly Disagree Undecided Agree StronglyDisagree Agree
5. The morale of my unit is negatively affected by the F16 maintenance workload.
Strongly Disagree Undecided Agree StronglyDisagree Agree

126
Bibliography
Abell, John B. and H. L. Shulman. Evaluations of Alternative Maintenance Structures,RAND Report R-4205-AF. Santa Monica, CA: RAND Corporation, 1992.
AFM 1-1, Basic Aerospace Doctrine of the United States Air Force, vol. 2. Washington,D.C.: GPO, 1992.
Alley, Anthony D. “Forecasting Military Technological Needs,” in Dr. Karl P. Magyar etal., eds., Challenge and Response: Anticipating US Military Security Concerns.Maxwell AFB, AL.: Air University Press, 1994.
Barnett, Jeffery R. Future War: An Assessment of Aerospace Campaigns in 2010.Maxwell AFB, AL.: Air University Press, 1996.
Bolds, Lt Col Ted. “Maintaining the Defense Industrial Base.” Air War College Paper, 2May 1994.
Brodie, Bernard, and Fawn Brodie. From Crossbow to H-Bomb. Bloomington, IN.:Indiana University Press, 1973.
“The CBO’s Air Force.” Air Force Magazine 78, no. 3 (March 1995): 28-33.Chapman, Suzann. “Aerospace World.” Air Force Magazine 78, no. 3 (March 1995):
11-20.Cohen, I. K., R. A. Pyles, and R. A. Eden. Lean Logistics: A More Responsive, Robust,
and Affordable System, RAND Report DRR-630-AF. Santa Monica, CA.: RANDCorporation, 1994.
Covalt, Craig. “Rafale Tests Focus on Weapons, Exports.” Aviation Week & SpaceTechnology 142, no. 24 (June 1995): 66-67.
Deptula, Col David A. Firing for Effect: Change in the Nature of Warfare. Arlington,VA.: Aerospace Education Foundation, 1995.
Dudney, Robert S. “Aerospace World.” Air Force Magazine 78, no. 1 (January 1995):12-21.
Dudney, Robert S. “The Zero-Warplane Budget.” Air Force Magazine 78, no. 4 (April1995): 52-54.
Eden, Rick, et al. Reinventing the DOD Logistics System to Support Military Operationsin Post-Cold War Era, RAND Report. Santa Monica, CA.: RAND Corporation,1994.
Ford, Carl. F-15E Reliability and Maintainability Evaluation Final Report, AFFTCReport TR-89-4F. Edwards AFB, CA.: AFFTC, 1989.
Fulghum, David A. “Chechnya Cripples Russian Aviation.” Aviation Week & SpaceTechnology 143, no. 6 (August 1995): 20-21.
Fulghum, David A. “China Pursuing Two-Fighter Plan.” Aviation Week & SpaceTechnology 143, no. 3 (March 1995): 44.

127
Fulghum, David A. “Congress Blocks Aim-9X, Triggers Six-Month Delay.” AviationWeek & Space Technology 140, no. 14 (April 1994): 28.
Fulghum, David A. “Pentagon Divided Over Defeating Scuds.” Aviation Week & SpaceTechnology 140, no. 25 (June 1994): 23.
Galloway, Joseph L., and Bruce B. Auster. “The Most Dangerous Place to Be.” USNews & World Report, 20 June 1994: 54.
Gentsch, Eric L., and Donna J. S. Peterson. A Method for Industrial Base Analysis: AnAerospace Case Study. Bethesda, MD: Logistics Management Institute, 1994.
Girardini, Kenneth, et al. Improving DOD Logistics, RAND Report DB-148-CRMAF.Santa Monica, CA.: RAND Corporation, 1995.
Grier Peter. “Hidden Trends in Readiness Rates.” Air Force Magazine 76 no. 1 (January1993): 52-55.
Grier, Peter. “Snapshots of a Force on the Move.” Air Force Magazine 78, no. 6 (June1995): 58-62.
Grile, Lynn, Reliability Analyst. “1990-95 F-15C and F-16 maintenance statistics.”Dynamic Research Corporation, 12 December 1995.
Gulf War Air Power Survey, vol. 5, A Statistical Compendium and Chronology.Washington, D.C.: GPO, 1993.
Hallion, Richard P. Storm Over Iraq: Air Power and the Gulf War. Washington, D.C.:Smithsonian Institution Press, 1992.
Heap, F. Howard and F. Stanley Nowlan. Reliability Centered Maintenance. Los Altos,CA.: Dolby Access Press, 1978.
Hill, Jeff, TICARRS Database Manager. “1990-95 F-15C maintenance statistics.” WR-ALC/LF, 6 December 1995.
Holley, I. B. The United States Army in World War II, Special Studies, Buying Aircraft:Matériel Procurement for the Army Air Forces. Washington, D.C.: Office of theChief of Military History, 1964.
Hollingsworth, Ben. memorandum for record, subject: RSD/SSD Funding. WR-ALC/LFCF, 13 December 1995.
House. Department of Defense Appropriations for 1995: Hearings before theSubcommittee on the Department of Defense of the Committee on Appropriations,103d Cong., 2d sess. Washington, D.C.: GPO, 1994.
House. National Defense Authorization Act for Fiscal Year 1995: Hearings before theSubcommittee on Military Readiness of the Committee on National Security, 103dCong., 1st sess. Washington, D.C.: GPO, 1994.
ISP version 4.6, Lincoln Systems Corporation, Westford, MA.Jane’s Air Launched Weapons 1994. Ed. Duncan Lennox. Alexandria, VA: Jane’s
Information Group, 1994.Jane’s All The World’s Aircraft 1995-96. Ed. Paul Jackson. Alexandria, VA: Jane’s
Information Group, 1995.Jones, Col Robert R., “F100-PW-100 Engine Survey Results.” HQ ACC/SEF, 6 May
1994.Keaney, Thomas A., and Eliot A. Cohen. Gulf War Air Power Survey Summary Report.
Washington, D.C.: GPO, 1993.

128
Krepinevich, Andrew. “Train Wreck Coming.” National Review 47, no. 14 (July 1995):42-46.
Lambeth, Benjamin S. Desert Storm and Its Meaning: The View from Moscow, RANDReport R-4164-AF. Santa Monica, CA.: RAND Corporation, 1992.
Lambeth, Benjamin S. Learning From the Persian Gulf War, RAND Report P-7850.Santa Monica, CA.: RAND Corporation, 1993.
Lambeth, Benjamin S. The Winning of Air Supremacy in Operation Desert Storm, RANDReport P-7837. Santa Monica, CA.: RAND Corporation, 1993.
Lorell, Mark, et al. “The Gray Threat.” Air Force Magazine 79, no. 2 (February 1996):64-65.
Magyar, Karl P. “Conflict in the Post-Containment Era.” War and Conflict Coursebook,Maxwell AFB, AL.: Air Command and Staff College, 1995, 16-25.
McMahon, Gary C. “Air Force Logistics Doctrine: Where is it?” Air War College Thesis,Maxwell AFB, AL, 1985.
Mills, Maj K., ACC/LGF15. memorandum to Col Belisle, ACC/LGF. 22 August 1995.Mills, Maj K., ACC/LGF15. memorandum to Col Bjoring, ACC/LGF. 12 May 1995.Morrocco, John D. “‘Silver Bullet’ Option eyed for F-22, SSF.” Aviation Week & Space
Technology 138, no 22 (May 1993): 21-22.Mullis, Fred, Pratt & Whitney Customer Service Rep, P&W SA-ALC. “USAFE F100
Overview: March 1994-March 1995 (DO42),” 12 December 1995.Muradian, Vago. “Wiggle Room is Gone.” Air Force Times 54, no. 29 (21 February
1994): 19.Nowlan, F. Stanley, and F. Howard Heap. Reliability Centered Maintenance. Los Altos,
CA.: Dolby Access Press, 1978.Perry, William J. Annual Report to the President and the Congress. Washington, D.C.:
GPO, 1995.Pexton, Patrick. “What Americans Favor—And Why.” Air Force Times, 18 September
1995: 19.Powell, Stewart M. “The China Problem Ahead,” Air Force Magazine 78, no. 10
(October 1995): 60-63.Report of the Defense Science Board Task Force on Aircraft Assessment. Office of the
Under Secretary of Defense for Acquisition. Washington, D.C.: GPO, 1993.“Republic of Iraq,” Jane’s Sentinel: The Gulf States 1994. Alexandria, VA: Jane’s
Information Group, 1994: 10-11.Siegel, Andrew F. Practical Business Statistics. Burr Ridge, IL.: Irwin, 1994.Stanley William L. “Assessing the Affordability of Fighter Aircraft Force Modernization.”
New Challenges for Defense Spending. Ed. Paul K. Davis. Santa Monica, CA:RAND Corporation, 1990.
Sweetman, Bill. “USAF Modernization Faces Budget Hurdles.” Interavia/AerospaceWorld 50 (June 1995): 69.
Syrett, David. “Northwest Africa 1942-1943,” in Benjamin Franklin Cooling, ed., CaseStudies in the Achievement of Air Superiority. Washington, D.C.: Center for AirForce History, 1994.
Tirpak John A. “Who Needs the F-22.” Air Force Magazine 78, no. 4 (April 1995): 24-29.

129
Tirpak, John A. “Fogleman Begins His Mission.” Air Force Magazine 78, no. 3 (March1995): 22-26.
Tirpak, John A. “Perspectives on Air Warfare.” Air Force Magazine 79, no. 4 (April1996): 24-28.
Tirpak, John A. “Washington Watch: The Risk of a ‘Hollow Future.’” Air ForceMagazine 78, no. 5 (May 1995): 15-19.
Tirpak, John. “Hollow Pockets.” Air Force Magazine 77, no. 12 (December 1994): 52-56.
Towell, Pat. “GOP Faces a Clash of Priorities with its Bid to Boost Readiness.” Defense& Foreign Policy, 14 January 1995: 168.
“The US Air Force in Facts and Figures.” Air Force Magazine 78, no. 5 (May 1995): 35-55.
Waldron, Arthur. “Dragon Growling.” National Review 7, no. 14 (July 1995): 44-45.Warden, Col John A., III. “Air Theory for the Twenty-first Century,” in Dr. Karl P.
Magyar et al., eds., Challenge and Response: Anticipating US Military SecurityConcerns. Maxwell AFB, AL.: Air University Press, 1994, 311-332.
“Washington Outlook.” Aviation Week & Space Technology 140, no. 1 (Jan 1994): 33.Watkins, Steven. “General Warns of New Drawdown.” Air Force Times, 18 September
1995: 3.Watkins, Steven. “Proposed Weapons Spending Dips.” Air Force Times, 18 March
1996: 34.Widnall, Sheila E. “Widnall Assesses the Force.” Air Force Magazine 78, no. 4 (April
1995): 30-36.