Embed Size (px)
Citation preview

\
COMMISSION OF THE EUROPEAN COMMUNITIES
Brussels, l 0.10.1999 COM(l999) 568 final
28th FINANCIAL REPORT
on
THE EUROPEAN AGRICULTURAL GUIDANCE AND GUARANTEE FUND
E.A.G.G.F.
GUARANTEE SECTION
- 1998 financial year -
(presented by the Commission)
T •.
)
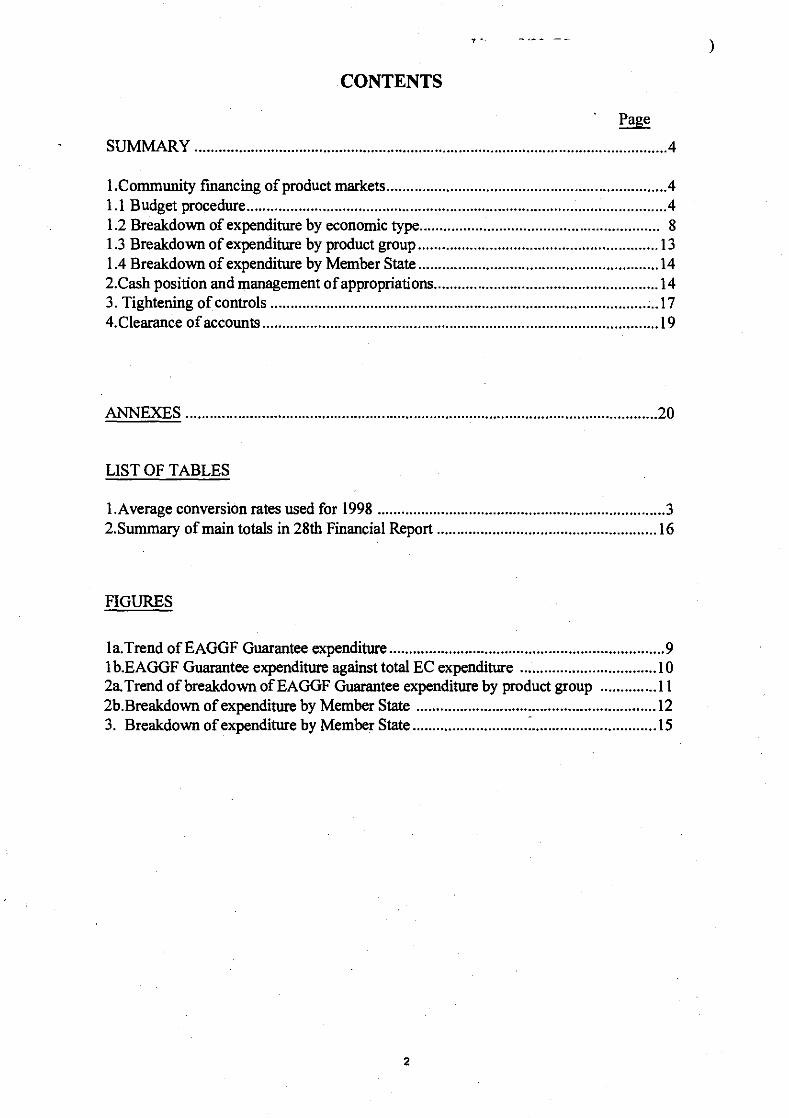
CONTENTS
Page
SUMMARY ...................................................................................................................... 4
!.Community financing of product markets .................................................................... -.4 1.1 Budget procedure ......................................................................................................... 4 1.2 Breakdown of expenditure by economic type............................................................ 8 1.3 Breakdown of expenditure by product group ............................................................ 13 1.4 Breakdown of expenditure by Member State ............................................................ 14 2.Cash position and management of appropriations ........................................................ l4 3. Tightening of controls ................................................................................................. 1 7 4.Clearance of accounts ................................................................................................... 19
ANNEXES ...................................................................................................................... 20
LIST OF TABLES
l.Average conversion rates used for 1998 ........................................................................ 3 2.Surnmary of main totals in 28th Financial Report ....................................................... 16
FIGURES
la.Trend ofEAGGF Guarantee expenditure ..................................................................... 9 1 b.EAGGF Guarantee expenditure against total EC expenditure .................................. 1 0 2a Trend of breakdown ofEAGGF Guarantee expenditure by product group .............. 11 2b.Breakdown of expenditure by Member State ............................................................ 12 3. Breakdown of expenditure by Member State ............................. : ............................... 15
2

Table 1
AVERAGE CONVERSION RATES USED FOR 1998 ·
(cf. Annex 16)
EUROPEAN COMMUNITY BUDGET RATE FOR I ECUI
B 40.6921 BEf2
DK 7.51455 DKK
D 1.97222 DEM
EL 318.421 GRD
E 167.119ESP
F 6.60734 FRF
IRL 0.780321 IEP
I I 940.73 ITL
L 40.7173 LUF'
NL 2.22195 NLG
A 13.85007 ATS
p 201.68806 PTE
FIN 5.96448 FIM
s 8.69599 SEK
UK 0.673264 GBP
I The ecu is the unit of account used in the Community's budget for all revenue and expenditure, whether agricultural or not. Conversion of ecus into national currencies is generally at market rates, known as "budget rates".
2
To operate smoothly the common agricultural policy requires some stability in exchange rates between national currencies. Therefore, in order to lessen the impact on agricultural prices of exchange rate movements, agricultural prices set in ecus are converted into national currency not at the real ecu exchange rates but at special rates called "green rates". Hence amounts calculated in ecus under the agricultural Regulations are expressed in "ECU (A)". However, for budget charging of the financial results of applying the agricultural regulations national currencies are converted into ecus not at the green rates but at the market or budget rates, and the amount to be entered is expressed in "ECU (B)".
Although the monthly budget rates for the Belgian and Luxembourg francs are identical, the average rate differs since it is weighted for monthly expenditure in the currency.
3
•

SUMMARY
28TH FINANCIAL REPORT
EAGGF
GUARANTEE SECTION
1. COMMUNITY FINANCING OF PRODUCT MARKETS
1.1 Budget procedure
1.1.1 Preliminary draft budget (P DB)
The Commission adopted the PDB on 30 April 1997. For the EAGGF Guarantee Section the appropriations sought were ECU 40 987 million, ECU 2 276 million less than the agricultural guideline of ECU 43 263 million.
This amount took into account the financial implications of a number of measures proposed by the Commission but not yet decided on by the Council:
1. reduced aids per hectare for crops (- ECU 1 300 million)
2. reform of the fruit and vegetable organisation
3. prices ( -ECU 16 million) and related measures (- ECU 63 million)
4. introduction of a maximum guaranteed area for fibre flax (- ECU 24 million)
5. production reform measures for apples,. pears and nectarines (+ ECU 93 million)
6. the special bee keeping aid(+ ECU 12 million).
On estimates a relatively cautious' approach was taken:
4
..
,, .,
a) expenditure on BSE crisis measures (ECU 1.3 billion);
b) the financial impact of the Council's conclusions of 21 Oclober 1994 were on milk quotas (ECU 260 million) ;
c) a provision of ECU 340 million for the forthcoming clearance of the 1994 accounts;
d) a relatively favourable exchange rate of USD I = ECU 0.85 based on the monetary situation on 21 March 1997.
1.1.2 Letter of amendment
The tum of events after adoption of the PDB warranted adoption of Letter of Amendment No I on 29 October 1997. Favourable changes in the immediate agricultural situation permitted a reduction in anticipated expenditure of ECU I 027 million from the PDB but on the other hand legislative decisions required additional expenditure ofECU I 408 million.
(I) The savings were mainly in three sectors:
- Beef/veal(- ECU 557 million) Significant market improvement
- Arable crops(- ECU 337 million) Savings anticipated on refunds - 1997 production slightly lower than initial forecasts
- Sheepmeat (- ECU 251 million) Rise in average price on Community market
(2) Additional expenditure:
- Arable crops (+ECU I 354 million) The Council, supported by the EP, did not reduce direct aid as proposed by the Commission
- Agricultural price package decision(+ ECU 54 milliori) lbis increased appropriation requirements for 1998 by comparison with the Commission's proposal used for the PDB.
1998 requirements therefore worked out at ECU 41 368 million(+ ECU 381 million on the PDB). In order to stick to the approach adopted in the draft budget the Commission made an across-the-board reduction of ECU 381 million. Total appropriations thus determined were unchanged on the PDB and amounted to ECU 40 987 million (including those entered in the B0-40 "reserve").
5
•

It was in line with the orientation resulting from the Council-Parliament concertation of July 1997 that the Commission proposed entry of ECU 200 million in Chapter B0-40. This amount represented part of the potential saving resulting from the favourable ECUIUSD exchange rate trend and corresponded to the margin set by the budgetary discipline rules.
1.1.3 Budget
The appropriations adopted by Parliament on 18 December amounted for the EAGGF Guarantee Section to ECU 40 437 million. 1998 appropriations were therefore ECU 2 826 million lower than the guideline ofECU 43 263 million.
Following the concertation at the end of November 1997 the budgetary authority made an additional reduction in EAGGF Guarantee Section appropriations of ECU 550 million. The reason was a need for a rigorous approach to the entire Union budget. The cuts were:
- ECU I 00 million for beef purchases - ECU 50 million for swine fever - ECU 100 million for agrirnonetary compensation; and
a linear reduction of ECU 300 million covering all EAGGF Guarantee Section budget headings. This reduced total appropriations to ECU 40 43 7 million, less than the 1997 budget ofECU 40 805 million.
1.1.4 Budget outturn
The outturn for EAGGF Guarantee Section appropriations for 1998 was ECU 38 748 million, i.e. 96.3% of the appropriations entered under heading B 1 of the budget. Expenditure (taking into account the transfer of appropriations to the monetary reserve) was ECU 1 411 million below budget appropriatio!W.
If the transfer of ECU 78 million to the monetary reserve (transfer No 35/98) is not included, underconsumption amounts to ECU 1 689 million less than the initial appropriations including the ECU 200 million entered in Chapter B0-40 Provisions.
As specified above the initial appropriations granted to the EAGGF Guarantee Section for 1998 amounted to ECU 40 437 million including the appropriations entered in the B0-40 reserve.
3 This amount is underconsumption as determined using the budget dollar parity. ,
6
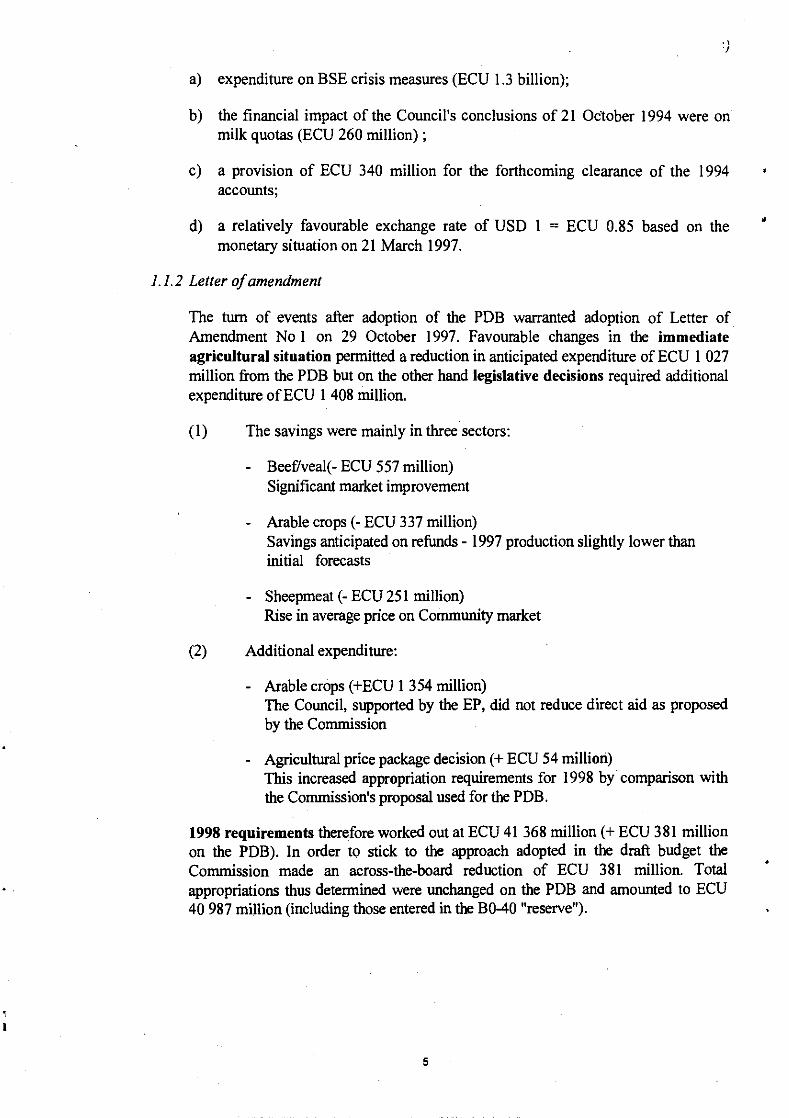
Total expenditure amounted to ECU 38 748.1 million, i.e. 96.3% of the appropriations entered in the budget (99.1% in 1997). It was 4.1% lower than the ECU 40 423.0 million in 1997.
At the end of the financial year ECU I 689 million remained unutilised, amounting to 4% of appropriations entered. lb.is balance reduces to ECU I 411 million on deduction of the chapter B0-40 appropriations and a transfer of ECU 78 million to the monetary reserve.
1.1.5 Chapter-to-chapter transfers within subsection B 1
In 1998 there were two sets of chapter-to-chapter transfers within the EAGGF Guarantee Section. The first (No 28/98) was proposed to the budgetary authority after the summer. It was needed in order to boost Chapters: B!-10 Arable crops (+ ECU 550 million). BI-ll Sugar(+ ECU 130 million). Bl-22 Sheepmeat and goatmeat (+ ECU 100 million) B!-30 Non-Annex II products(+ ECU 30 million) The appropriations in question amounted to ECU 810 million, i.e. 2% of EAGGF Guarantee Section appropriations. The second transfer (No 58/98) was proposed to the budgetary authority in December 1998 in the light of the expenditure outturn over the financial year. The amount involved was ECU 424 million to bo0st the appropriations of the following chapters in particular: B 1-10 Arable crops ( + ECU 300 million) BI-37 Clearance of accounts (+56 million) Bl-22 Sheepmeat and goatmeat (+ ECU 28 million). Requirements for additional appropriations in the other sectors were less substantial and explainable chiefly by linear reductions made during the budget procedure.
1.1. 6 Supplementary and amending budget
The financial rules allow a proposal to be made to the budgetary authority for changes to the original budget· by means of a supplementary and amending budget (SAB ). lb.is possibility was used in 1998 and in letter of amendment No 2 to preliminary draft supplementary and amending budget No 1/98 the Commission proposed to the budgetary authority a reduction in EAGGF Guarantee Section appropriations of ECU 400 million in order to reinforce other parts of the budget. After discussions with the budgetary authority this amount was in the end raised to ECU 500 million in the SAB.
It was also decided by joint agreement between the three Institutions (Parliament, Council and Commission) that the SAB should be used to finance aid to Russia using EAGGF Guarantee Section appropriations. A new heading was created (B1-315 Food aid for Russia) provided with ECU 400 million from various items of heading I.
7
•

) ..
1.1. 7 Request for non-automatic carryover of appropriations to 1999 financial year
At the beginning of the 1999 calendar year the Commission proposed to the budget authority a non-automatic carryover of € 400 million of 1998 appropriations.
By SAB No 1/98 this amount was entered under the new Bl-315 heading, as mentioned above to finance food aid to Russia. The Council regulation on the programme for the supply of agricultural products to the Russian Federation was not adopted until 17 December, too late to allow commitment of the authorised appropriations before 31 December.
1.1. 8 The share of the EAGGF Guarantee Section expenditure in the general European Union budget for 1998 (ECU 79 244.6 million) was 48.9% (see Figures lA and 1 B), not much different from that in preceding years and confirming a slow fall over time of the share of agricultural expenditure in the general budget.
1.2 Breakdown of expenditure by economic type
Of total 1998 expenditure of ECU 38 748.1 million export refunds accounted for ECU 4 826.4 million (12.5%) and intervention for ECU 33 921.8 million (87.5%) (details in Annex 5). In the previous year (1997 budget), of a total of ECU 40 423.0 million export refunds absorbed ECU 5 883.9 million (14.6%) and intervention ECU 34 539.1 million (85.4%).
1.2.1 Refunds (Annex 5)
The fall in refund expenditure noted for a number of years continued.
1.2.2 Intervention (Annex 6)
Intervention as referred to in Article 3(1) of Regulation (EEC) No 729/70, accounting for spending of ECU 33 921.8 million in 1998, embraces not only storage aid (ECU 2 008.4 million in 1998, i.e. 5.2% of total intervention expenditure) and withdrawals (ECU 462.1 million, i.e. 1.2%) but also and above all compensatory aid (ECU 31 310.8 million, i.e. 92.3%), plus guidance premiums (ECU 172.0 million, i.e. 0.4%) (see Annex 6).
1.2.2.1 Compensatory aid remains the most important form of intervention (Annex 7).
It takes in aid granted for production (per hectare aid, male bovine and suckler cow premiums, all introduced or raised under CAP reform), processing, marketing and set-aside, plus income aid.
8

GRAPH 1A
TREND OF EAGGF GUARANTEE SECTION EXPENDITURE I 50000
45000 ..1
40000
35000
i
iii_ ~ ....... ._ ... -
:::l 30000 0 UJ 25000 Q ::;:
20000
. . . . . . ........... GUIDELINE
-EXPENDITURE wrniiN GUIDELINI.
15000 • • • • •TOTAL EXPENDITURE EAGGF -G (I)
10000
5000
0 . 1989 1990 1991 1992 1993 1994 1995 1996 1997 1998
(1) Since 1993 all expenditure has been financed within the guideline. This does not include expenditure from non-automatic carryovers.
9

GRAPH 18
[TREND-OF EAGGF GUARANTEESiCTION EXPENDITURE~ RELATiON TO TOTAL-EC -EXPENDITURE
100000 I .,,.~,. • . _~w~ ... ~ . .....,.., . .ol\·-? -4 f .c-'!.! [...-... ·-· ~.-~.·- - ! .... ' · ~- ,..~~~1-J:rNi ~-~.,_4·.:,. . t _ ... _ . _ .. ....,.._;, .... .. .J -~·'="· - 'il~~ -- _ _ ,tn,._ r_ ... ;~ _- -A ,.,L,._ _ _.}'_, r,..... -. l.Z' . ..- - ~--. :~ , ....... ~·-- ·••...., , . . -.• I
90000
80000
70000
60000
50000
40000
30000
20000
10000
0
1989 1990 1991 1992 1993 1994
[i TOTAL-E~-~~~TURE • EAGGy~uARANT-~-E EXPE_No ..... {'
J~rt'
wi ... IW\~
-----t 1- •'-') k- ~
C...l t .... ~,.,..,
10
1995 1996 1997 1998
D ~/~ -j

GRAPH2A
BREAKDOWN OF EAGGF GUARANTEE SECTION EXPENDITURE BY PRODUCT GROUP (ECU million for 1998 financial year)
Other measures: Other products : 1789,3
2598,6
Sheepmeat and goatmeat: 1534,6
eeet: 5160,6
Tocacco:: 870,3 Olive oil: 2266,7 Sugar. 1776,6
Fruit and vegetables: 1509,5 r-=T::::OT;AL:-:-: E:::C:::U~3:::8:::74~8~m~il:,-lio_n..,
11
Arable crops: 17g45,2
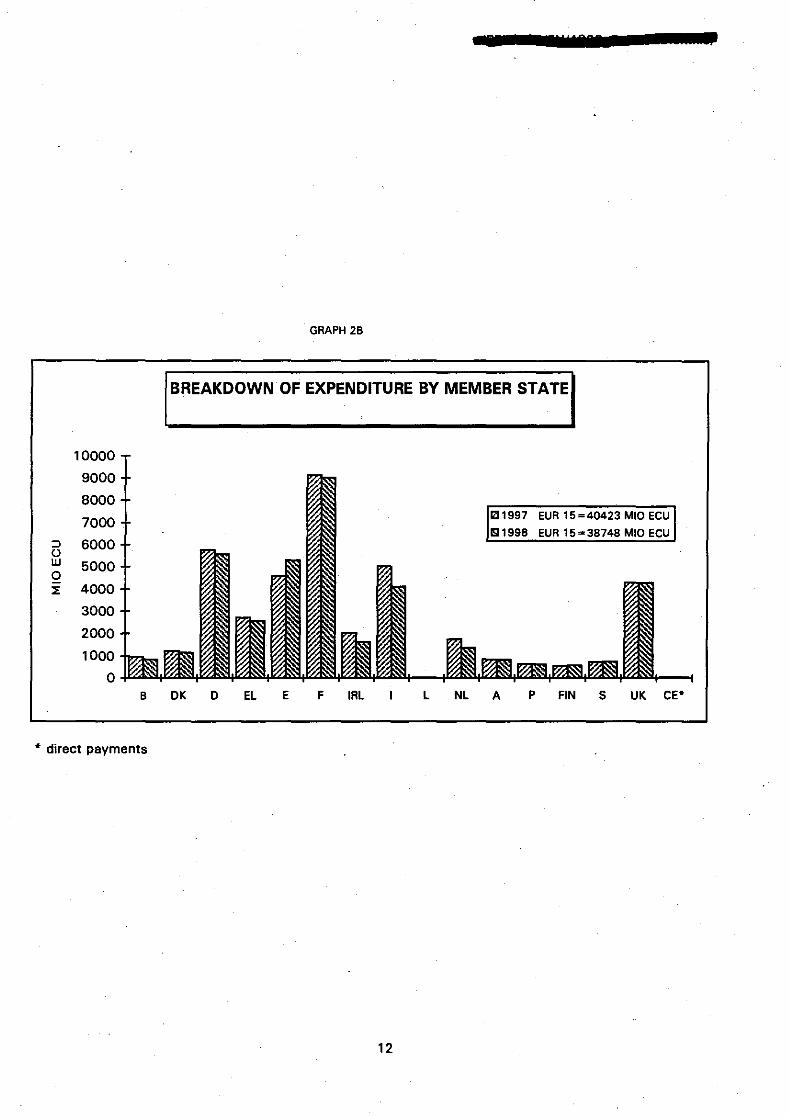
GRAPH 2B
BREAKDOWN OF EXPENDITURE BY MEMBER STATE
10000
9000
8000
7000 IZI1997 EUR 15 =40423 MIO ECU
EI199B EUR 15 = 3B74B MIO ECU ::::> 6000 u w 5000 0 ~ 4000
3000
2000
1000
0 B OK D EL E F IRL L NL A p FIN s UK ce•
• direct payments
12

1.2.2.2 Storage expenditure (Annex 6) was ECU 2 008.4 million, i.e. 5.9% of total intervention spending (1993: 22.3%, 1994: 4.4%, 1995: 1.3%, 1996: 4.3%, 1997 4.6%) because of higher cereal production than anticipated and also reduced cereal exports owing to a deteriorating world market. This resulted in one of the highest quantities taken into intervention storage in a marketing year. This form of intervention covers both private and public storage costs (breakdown of expenditure in Annex lOa).
Of the total of ECU 2 008.4 million private storage expenditure accounted for ECU 501.3 million and public storage expenditure for ECU 1507.0 million.
Private storage aid is paid mainly in the sugar sector (ECU 349.5 million) but costs in this sector are covered by storage levies on sugar manufacturers (see Annex 13). Sugar is followed by milk products (ECU 95.7 million) and viticulture products/alcohol (ECU 54.9 million).
1.2.2.3 Withdrawal and related operations (ECU 462 million) concern only a few sectors: viticulture products (distillation) (ECU 313 million), fruit and vegetables (ECU 138 million) and fishery products (ECU 11 million). Their share of intervention spending was 1.2%, down from 1. 7% in 1997.
1.2.2.4 Guidance premiums (ECU 172 million) given only in the tobacco (ECU 84 million), fruit and vegetable (ECU 67.3 million), viticulture product (ECU 15.1 million) and milk product (ECU 5.5 million) sectors amounted to 0.4% of intervention expenditure, against 2.0% in 1997.
1.3 Breakdown of expenditure by product group (Annexes 4 and 21 b)
Arable crops, grouping what were formerly four chapters of expenditure (cereals, oilseeds, protein crops, land set-aside), accounted for 45.5% of spending (42.2% in 1997), followed by beef/veal at 13.1% (15.9% in 1997) and milk products at 6.6% (7.5% in 1997). Figure 2 gives the share of other sectors in the breakdown.
13

1.4 Breakdown of expenditure by Member State (Figure 3)
With ECU 9 007 million, i.e. more than 23% of spending, France remains the principal recipient of EAGGF Guarantee Section payments, followed far behind by Germany (ECU 5 553 million), Spain (ECU 5 294 million), the United Kingdom (ECU 4 314 million) and Italy (ECU 4 129 million).
In their fourth year following accession (third full financial year) Austria accounted for ECU 843 million (ECU 859 million in 1997), Finland ECU 576 million (ECU 568 million in 1997) and Sweden ECU 770 million (ECU 745 million in 1997).
Annex 2b breaks down expenditure by chapter and Member State (summarising Annex 2) and Annex 2la shows the trend since 1983 (amounts and shares).
2. CASH POSITION AND MANAGEMENT OF APPROPRIATIONS
2.1 The 1998 budget, adopted on 18 December 1997, provided appropriations of ECU 40 937 million for the EAGGF Guarantee Section, including ECU 200 million entered in Chapter B0-40 Provisions and ECU 500 million entered as monetary reserve.
The supplementary and amending budget adopted on 14 December 1998
- reduced appropriations by ECU 500 million - assigned ECU 400 million of appropriations from other lines of heading 1 to a
new article in order to fmance from the 1998 budget an operation to supply agricultural products free to Russia. The basis for this is Council Regulation (EC) No 2802/98 of 17 December 1998. Its adoption came too late to allow commitment of the authorised appropriations before 31 December 1998 and a non-automatic carryover of ECU 400 million was approved by the budgetary authority.
14

OK 3%
8
ecil'7 0%
(1) Direct payments
GRAPH 3 BREAKDOWN OF EXPENDITURE BY MEMBER STATE
EL 7%
L 4% 0%
15
I 11%
F 23%

2.2 The situation as regards appropriations was as follows:
(ECU million)
1998 budget Non· Automatic canyovers Total appropriations automatic from 1997
appropriations canyovers fium 1997
A
Initial budget/ 40237.0 0.0 81.4 40318.4 canyovers(')
SAB -500.0 0.0 0.0 -500.0
Transfer monetary ·18.0 . ·18.0 reserve
Available 39659.0 0.0 81.4 39740.4 appropriations/ canyovers
B.
Commitments 38 748.1 0.0 38 825.6
Payments 38 732.5 0.0 11.5 38 810.0
Automatic carryovers to 1999 15.6 0.0 0.0 15.6
c. Non-automatic 400.0 0.0 0.0 400.0 canyovers to 1999
D.
Appropriations lapsing
510.9 0.0 3.97 514.87
(') Initial appropriations of ECU 40 937 million reduced by ECU 200 million entered in Chapter B0-40 and ECU 500 million as monetary reserve.
2.3 The Commission adopted 13 decisions granting advances in 1998, 12 of normal type and an additional one to adjust advances granted to total spending for the year.
2.4 Under Article 13 of Council Decision 94/79/EC on budgetary discipline authorising the Commission to reduce or provisionally suspend monthly advances to Member States if declarations of expenditure or information submitted by them do not enable it to establish that commitment of funds is in line with Community rules, the Commission reduced advances by around ECU 36.1 million. Corrections were made for the following reasons:
16

--..-----) • non-application ofthe integrated system rules for per hectare aid and cattle, sheep
and goat premiums(- ECU 21.9 million)
• expenditure made beyond regulatory ceilings and cut-off dates (- ECU 13.9 million)
• refund of additional milk levy amounts for 1994/95, 1995/96 and 1996/97 already collected by the EAGGF on the occasion of reductions in advances in previous years(+ ECU 3.1 million)
• other corrections of - ECU 2.9 million: incorrect application of Regulation 1765/92 (overstepping of maize base rate), various accounting errors.
3. TIGHTENING OF CONTROLS
Since 1995 the Unit for Coordination of Fraud Prevention -(UCLAF) has been responsible for anti-fraud investigation in the field. The EAGGF has therefore concentrated on tightening controls in the following areas.
Reform of the CAP in 1992 made it necessary to establish a suitable integrated administration · and control system (lACS) using modem techniques such as computerisation and remote sensing.
In 1998 some meetings of the EAGGF Conunittee were devoted to setting up the system. The lACS expert group also met several times to assess progress, examine difficulties encountered in the introduction of the system and respond to questions of interpretation of the rules.
Except for Greece and Scotland, where there have been serious difficulties and delays, all Member States have a system in operation. Those of Finland, Ireland and Belgium still require improvement.
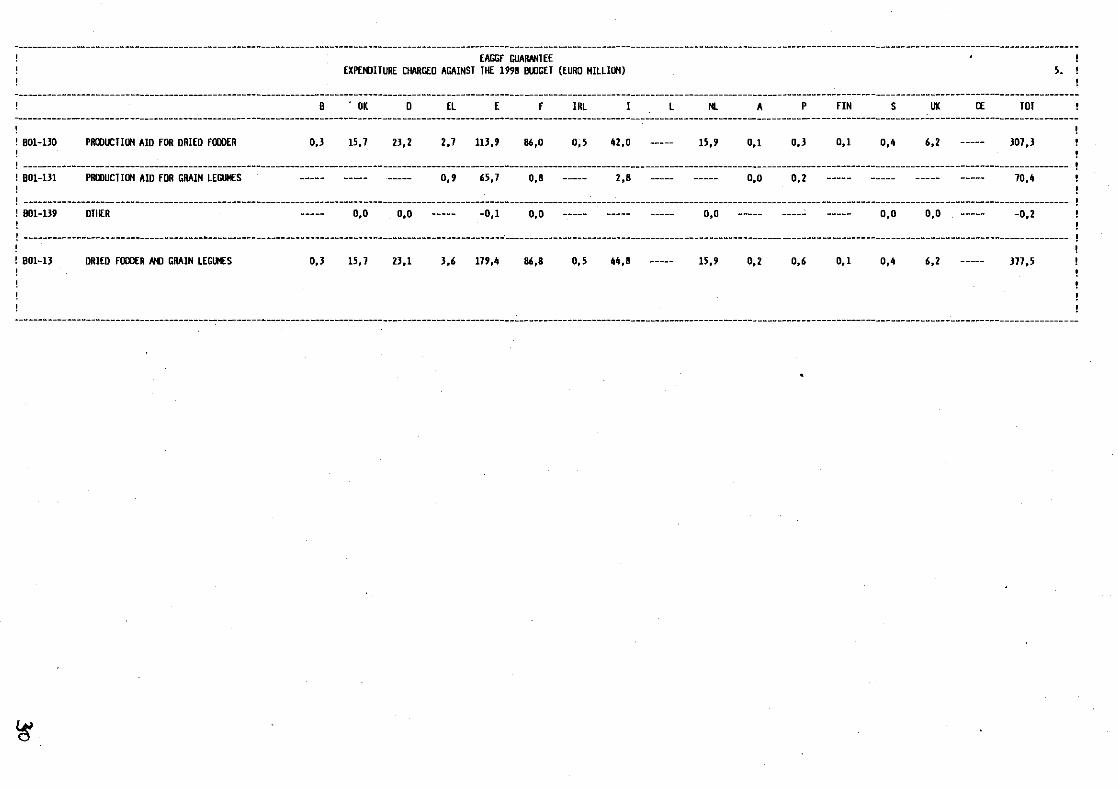
The effectiveness ofiACS has warranted its extension to include rice and grain legumes. Other aid schemes have also been linked to it: hops, agri-environrnental measures, cotton and dried fodder.
Olive oil inspection agencies have been set up in the main producer Member States: Italy, Greece, Spain and Portugal. Their work in the 1997/98 marketing year was carried out in line with the progranunes of activity and forward estimates approved but Member States did not adequately follow up the agencies' proposals on penalties.
The Conununity part-fmancing introduced by Regulation (EEC) No 307/91 fmished at . the end of the 1995 budget year for the first 12 Member States and two years later for the
three new ones. The Commission considered that continued financial support was required and Council Regulation (EC) No 723/97 of 22 April 1997 permits a financial contribution for five years from 1997 to Member States' action programmes.
17

The second year of application confirmed the importance assigned by Member States to the introduction of new control systems. Only Denmark and Portugal did not present programmes. Most programmes concern the identification and registration of cattle required under Regulation (EC) No 820/97 and eligible expenditure for 1998 was ECU 60 million, the available appropriation of ECU 15 million thus yielding an average partfinancing rate of 25%.
The remote sensing sys.tem gradually developed since 1990 operates to a common specification in all Member States participating in lACS (all Member States except Luxembourg and Sweden used it in 1998).
It allows correct declarations to be picked out so that inspection on the spot can be directed to the others. The areas and contents of the agricultural parcels declared by farmers are validated by means of interpretation of satellite images or aerial photographs (depending on local conditions) obtained at various times of the year.
In total 19 contracts were signed by Member States following a call for tenders closing on 15 January 1998. Finland, Portugal and in particular Italy decided to step up their use of the method substantially.
DG VI has signed price agreements with the satellite image suppliers, purchased· the necessary images and lent them to the contractors for the duration of their work. The zones to be checked were chosen in secret by DG VI and the Member States between October 1997 and January 1998, i.e. before the choice of contractors.
In 1998, for all Member States taken together except Italy, "photo-interpretation" allowed 74% of declarations to be accepted, with rejections at 24% and inconclusive results at 2%. For Italy it was possible to accept only 400/o, a fairly surprising figure perhaps explicable by declaration errors resulting from the antiquity of the Italian land register.
From 1999 50% part-financing of costs no longer applies. The Commission will pay only for the images, purchase of which will remain centralised. It will however continue to provide technical support to the Member States including the common specification. Accordingly under an agreement between DG VI and the JRC technical support was transferred to the JRC at Ispra from the beginning of 1999. Despite the end of partfinancing all Member States except Luxembourg will use the method in 1999. The call for tenders, closing on 15 January, concerned six Member States only, eight having concluded contracts for at least two years, providing an assurance of stability.
18

4. CLEARANCE OF ACCOUNTS
In 1998 the Commission adopted two decisions on clearance of EAGGF Guarantee Section accounts: Decision 98/358/EC of 6 May on clearance of the 1994 accounts and Decision 98/324/EC of 29 April on clearance of those for 1997, the latter under the new accounts clearance rules.
Other work in 1998 included:
-. finalising the 1995 clearance procedure including drafting of the sununary report (Doc VI/6462/98)
- discussions with all Member States on the outcome of the inspection visits for the financial years covered by Article 5(2)(c) of Regulation (EEC) W 729170
participation in the work of Parliament's Committee on Budgetary Control m connection with discharge of the 1996 and 1997 budgets
the Court of Auditors' opinion on the clearance decision for 1994
the Court of Auditors' statement of assurance on expenditure in 1997
preparation and carrying out of inspection visits for the purposes of clearance of the accounts of the 1997 and 1998 financial years or 24 months preceding official transmission of the Jetter of observations
contributions in connection with reform of the market organisations in olive oil and tobacco and with Agenda 2000
participation in briefing of the countries wishing to accede (SAP ARD and preaccession screening)
active participation in the Conciliation Body's investigation of Member States' appeals in connection with the clearance of accounts for 1993, 1994 and 1995.
*** A working document detailing the EAGGF Guarantee Section's activities in the 1998 financial year is available in French, English and German.
19
•
ANNEXES
20

ANNEXES
Table of contents
1. Summary of implementation for 1998 ...................................................................... 25
2. Expenditure charged against 1998 budget ...................•....................................... 26-59
2b. EAGGF Guarantee Section expenditure, by chapter and Member State, charged against 1998 budget ................................................................................................... 60
3. Trend of EAGGF Guarantee Section expenditure by sector ................................ 61-63
4. Trend of EAGGF Guarantee Section expenditure by sector in percentage terms ( 1994-98) ................................................................................................................... 64
5. Breakdown of EAGGF Guarantee Section expenditure by sector and economic category in 1998 ................................................................................................... 65-66
6. Breakdown of intervention expenditure by chapter and economic category in 1998 67
7. Breakdown of compensatory aid by chapter and economic category in 1998 .......... 68
7.a Promotion measures by product in 1998 ................................................................... 69
8. Breakdown of EAGGF Guarantee Section expenditure by economic measure ........ 70
9. Trend of expenditure by sector and ~conomic category ( 1994-98) ........................... 71
9.1 Quantitative trend of public intervention stocks .................................................. 72-7 4
9.2 Quantitative trend of public intervention stocks ....................................................... 75
9.3 Quantitative trend of public intervention stocks ............................................ 76
9.4 Quantitative trend of public intervention stocks ............................................ 77
9.5 Quantitative trend of public intervention stocks ....................................................... 78
1 O.a. Breakdown of intervention expenditure on storage in 1998 ..................................... 80
lO.b. Quantity and value of products held in public storage by intervention agencies ...... 81
•
21

11. Overall cost of Guarantee Section as a percentage of GDP ...................................... 82
12. Equalisation of storage costs for sugar ...................................................................... 83
13. Revenue in the sugar sector in 1998 .......................................................................... 84
14. Self-financing arrangements in the sugar sector 1995/96 to 1997/98 ....................... 85
15 .a. Arable crops - applications for aid per hectare ( 1998/99) ......................................... 86
15.b. Aid for arable crops 1998/99 (without reduction) ..................................................... 87
15.c. Set-aside for arable crops (before reduction) ............................................................ 88
16. Exchange rates in 1998 ............................................................................................. 89
17.a. and b. Advance payments to Member States for 1998 ........................................... 90-91
18. and 19. Amounts withheld from production and consumption aids (olive oil, fibre flax, grape juice, tobacco) and their utilisation .................................................... 92-93
20. Clearance of 1995 accounts: financial results .......................................................... 94
2l.a. Trend ofEAGGF Guarantee Section expenditure by Member State ........................ 95
2l.b. Trend ofEAGGF Guarantee Section expenditure by chapter ................................... 96
21.c. Trend in structure ofEAGGF Guarantee Section expenditure .................................. 97
22. Chapter 82-5 1 - Completion of the internal market, controls and other operations in the agricultural sector ............................................................................................. 98
23. Basic rules governing the EAGGF Guarantee Section ....................................... 99-1 02
22

1.
NOTE TO THE READER
The budget nomenclature is changed each year to take account of developments in the common agricultural policy and its financing. Thus in 1994 some expenditure was not booked in the same chapter as in 1993:
Cereals
·Rice
Olive oil
Oilseeds
Protein crops
Dried fodder
Pulses
Set-aside
1993
Chap. 10-Cereals and rice
Chap. 10-Cereals and rice
Chap. 12-Oils and fats
Chap. 12-Oils and fats
Chap. 13-Protein crops
Chap. 13-Protein crops
Chap. IS-Fruit and vegetables
Chap. 40-Set-aside
1994
Chap.IO-Arable crops
Chap. 18-Other crop products
Chap.l2-Olive oil
Chap. 10-Arable crops
Chap. 10-Arable crops
Chap. 13 Dried fodder and pulses
Chap. 13-Dried fodder and pulses
Chap. 10-Arable crops
The result was a change in the way expenditure is grouped in the following summary tables (Annexes 3, 4, 8 and 25b).
In order to ensure that comparisons with past data are not distorted, i.e. to avoid cases where there is a large difference in the amount of expenditure from one year to the next in a given sector simply as a result of a change of grouping, the following principle is followed:
- the most recent nomenclature is used (1998 in this report), - the aggregates for previous years are recalculated in accordance with this
nomenclature.
23
•

lbis means, however, that some subtotals in this report differ from those found in reports published in previous years.
For example, 1990 expenditure under Chapter 10 (Cereals and rice)"amounted to ECU 3 884.6 million (Annex 3 to the Twenty-lbird Financial Report, page 145). lbis is "real" expenditure - in the accounting sense of the term - in accordance with the nomenclature applicable in 1990, which grouped expenditure in a different way from the current nomenclature.
To make comparisons possible, 1990 expenditure under Chapter 10 (Arable crops) when recalculated comes to ECU 7 834.5 million in this Report (Annex 3).
lbis figure was obtained as follows:
1990 expenditure under old Chapter I 0 (Cereals and rice)
1990 expenditure on rice + 1990 expenditure on oilseeds + 1990 expenditure on protein crops
1990 expenditure on dried fodder + 1990 expenditure on set-aside
New total for 1990 expenditure under Chapter 10 (Arable crops)
3884.6
85.1 +3477.0 + 834.8
298.0 + 21.2
7 834.5
No important changes have been made to the budget nomenclature for 1998. The changes are mainly intended to improve budget transparency.
To that end and in order to show clearly the charging of amounts recovered, penalties and interest collected, securities impounded and amounts withheld by the Member States for Community budget contributions to court expenses incurred with a view to recovering amounts unduly paid, a suitable structure now exists within each chapter in question.
2. Totals or subtotals of expenditure in the following tables sometimes differ by ECU 0.1 million from the amount obtained arithmetically by adding the lines or columns. lbis difference is due to rounding up and down. The totals are generally expressed in ECU million while the calculations are done using amountS in ecus.
24

ANNEX 1
SUMMARY OF IMPLEMENTATION FOR 1998
1998 Appropriations ECU
APPROPRIATIONS
COMMITMENT PAYMENT ' 1. Original appropriations
Subsection B 1 40.937.000.000,00 40.937.000.000,00 2. Monetary reserve (80-60) ·578.000.000,00 ·578.000.000:00 3. Provisions (80-40) -200.000.000,00 -200.000.000.0C 4. Supplementary and Amending Budget (SABI -500.000.000,00 -500.000.000.00
6. Appropriations available for 1998 39.659.000.000,00 39.659.000.000.0 ECU
IMPLEMENTATION
1 . Commitments - for expenditure incurred by Member States 38.707.753.204.09 -_for direct payments 40.326.300,84 Total commitments 38.748.079.504,93
2. Sums charged as payments - for expenditure incurrad by Member States 38.707.753.204,09 - for direct payments 24.777.720,50
Total charged 38.732.530.924,59 3. Appropriations to ba carried over automatically
- for expenditure incurred by Member Statas 0,00
- for direct payments 15.548.580.34 Total automatic carryovers 15.548.580,34
4. Appropriations to be carried out non automatically 400.000.000,00 5. Laosed aoorooriations 510.920.495.07
Appropriations carried over automatically from 1997
- for expenditure incurred by Member States
~~~~~~~::::::::::::::::::::::::::::::::::::::~~~~~~~as .. p.ay•m•e·n~l·s---------------------=~-=----~ - for expenditure incurred by Mamber States
- for direct payments - for diract payments Total chergad
(Appropriations committed in 1 997 but not allocated) 2. Lapsed carryovers - for expenditure incurred by Member States - for direct payments
25

~EX 2 --------------------------------------------------------------------------------------------------------------------------------------------------------------------------------------------------------------------------
EAGGF GUARNHEE EXPENDITURE CHARGED AGAINST THE 1998 BUDGET (EURO MiLLION) 1. !
--------------------------------------------------------------------------------------------------------------------------------------------------------------------------------------------------------------------------
80!-1000
BD!-1001
801-1002
! 801-1003
REFUNDS ON CIHIJN WHEAT GRAIN AND FLOUR
REFUNDS ON BARLEY GRAIN AND KALT
REFUNDS ON OURUH IM:AT AND ON DURUH IM:AT FLOUR, GROATS AND HEAL
REFUNDS ON OTHER CEREALS
B
11,1
17,0
4,6
OK .0
2,8 18,7
6,0 18,0
0,0
3,0 14,5
EL E F IRL
0,6 4,6 117,2
2,0 67,7 0,8
o,o 0,1 0,4
0,4 0,4 11,8 0,1
L NL A p FIN s UK CE TDT
16,6 7,1 0,6 0,1 0,7 4,1 9,6 193,8
0,0 2,6 0,6 0,1 10,9 4,7 19,4 149,7
0,1 0,6
11\,1 9,0 0,1 0, 5 9,7 '15,6 0,9 85,3
! ---------------------------------------------------------~------------------------------------------------------~-----------------------------------------------------------------------------------------------------! 801-100 REFLN>S 00 CEREALS 32,6 11,8 51,2 1,1 7,2 197,0 0,9 30,8 ----- 18,6 1,9 0,6 21,3 24,4 29,9 ----- 429,4
----------------------------------------------------------------------------------------------------------------------------------------------------------------------------------------------------------------------801-1011
B01-1012
BD1-IOIJ
BOI-1014
BOI-1019
801-101
801-102!
801-1022
B01-ID29
TECHNICAL COSTS OF Pl.lll!C STORAGE
FINANCIAL COSTS OF PUBLIC STORAGE
OTHER PUBLIC STORAGE COSTS
DEPRECIATION OF CEREAL STOCKS
OTHER 1NTERVENTION STORAGE
INTERVENTION STORAGE OF CEREALS
COMPENSATORY PAYMENTS NID PREMIUMS FOR POTATO STARCH
PRODUCTION REFUNDS FOR STARCH (ART.7 R. 1166/92)
OTHER INTERVENTION
0,1 3,8 71,6
. 0,2 0,1 18,4
-0,5 2, 9 34,3
6,7 23,2 389,0
7,1 30,5 513,3
15,9 74,8
0,9 1,9 7,4
----- 4,3 30,3 1,1 0,8
----- 0,6 4,0 0,3 0,1
----- -3,5 1,1 2,4 -3,6
----- 57,0 239,6 1,5 2,4
58,3 28!,6 5,3 -0,3
0,0 32,4
0,1 2,3 1_6,2 0,1 3,4
0,0 ----- 3,9 ----- 2,1 6,7 11,5 ----- 136,8
0,0 ----- 0,6 ----- 0,4 0,5 2,4 ----- 28,3
----- ----- 3,0 -0,7 -0,5 2,9 0,9 ----- 45,2
0,3 ----- 20,8 ----- 12,5 27,9 92,7 ----- 873,7
0,3 28,4 -0,7 14,6 38,0 107,5 1.083,9
62,5 6,1 5,9 6,7 204,4
6,9 3,1 0,3 2,6 1,5 2,9 49,5
26,0 26,0
----------------------------------------------------------------------------------------------------------------------------------------------------------------------------------------------------------------------BDI-102 INTERVENTION, OTHER THAN STORAGE, OF
CEREALS 0,9 17,7 82,3 0,1 2,3 48,6 0,1 3,4 69,3 9,3 26,3 8,5 8,2 2,9 219,9
! ----------------------------------------------------------------------------------------------------------------------------------------------------------------------------------------------------------------------! BOI-1010 AIO FOR PRODUCERS Of MAIZE (BASE AREA 29,8 ----- 56,2 0,0 21,8 41,9 1,9 188,8 ----- 60,2 ----- 31,6 ----- ----- 4,3 ----- 442,4
FOR MAIZE)
! B0!-1011 AIO fOR PRODUCERS OF CEREALS NOT SUBJECT TO THE BASE AREA FOR MAIZE
48,3 81,2 398,4 212,0 174,1 463,0 34,5 291,9 4,7 32,8 101,3 21,4 63,6 61,9 81,2 2.010,2
--------------------------------------------------------------------------------------------------------------------------------------------------------------------------------------------------------------------------~

...,::> ~
~-
--------------------------------------------------------------------------------------------------------------------------------------------------------------------------------------------------------------------------EAGGF GUAIWHEE
EXPENDITURE CHARGED AGAINST THE 1998 BUDGET (EURO HILLION) z. !
--------------------------------------------------------------------------------------------------------------------------------------------------------------------------------------------------------------------------B OK 0 El E f IRL l Nl A p fiN s UK CE TOT
-----------------------------------------------------------------------------------~-------------------------------------------------------------------------------------------------------~------------------------------
! 801-1042 AIO FOR PRODUCERS Of SOYA BEANS, COLZA 0,0 ----- 2,2 0,5 7,2 2,6 0,1 3,5 0,0 0,0 2,6 0,9 0,3 0,3 0,0 ----- 20,2 SEED AND SlllflOWER SEED
! 801-1043 AID FOR PRODUCERS Of PEAS, BEANS, FIELD 0,0 ----- 1,4 0,3 1,2 1,9 0,1 5,5 o,o 0,4 4,0 0,2 0,1 0,4 0,0 ----- 15,4 . ! BEANS AND SWEET LUPINS
! ! 801-1044 AIO FOR PROOUCERS Of NON-TEXTILE flAX 0,0 ----- 0,1 ----- 0,1 0,0 o,o 0,0 ----- 0,0 0,0 0,0 0,0 0,1 0,0 ----- 0,3
SEED ! ----------------------------------------------------------------------------------------------------------------------------------------------------------------------------------------------------------------------! 801-104 PER HECTARE AID FOR ARABLE CROPS 78,1 81,2 458,3 212,7 204,.3 509,4 36,5 489,6 4,B 93,4 108,0 60,1 64,0 62,6 85,5 ----- 2.548,6
(SHALL PRODUCERS) ! -------------------------------------------;--------------------------------------------------------------------------------------~-----------------------------------------------------------------------------------! 801-1050 AID FOR PRODUCERS Of HAIZE (BASE AREA 3,7 ----- 121,2 ----- 114,7 190,0 1,1 303,1 ----- 2,9 ----- 25,1 ----- ----- B,3 ----- 770,3
FOR HAllE)
BOI-1051 AID FOR PROOUCERS Of CEREALS NOT SlllJECT 51,4 401,6 1.836,2 16,2 627,7 2.556,4 63,8 153,8 3,4 30,0 159,7 39,4 IOB,5 257,0 1.179,4 ----- 7.484,5 TO TIE BASE AREA FOR HAllE
BOI-1052 AIO FOR PRODUCERS Of SOYA BEANS, Clli.ZA 2,4 45,3 430,6 B,9 270,6 859,2 3,1 390,8 0,9 0,3 36,9 14,9 16,1 21,5 246,5 ----- 2.348,3 SEED AND SlllFLOWER SEED
BOI-1053 AID FOR PRODUCERS Of PEAS, BEANS, fiELD 1,4 38,2 77,7 0,1 15,6 327,5 2,3 3,8 0,1 0,6 16,0 0,3 1,3 12,4 105,1 ----- 602,3 BEANS AND SWEET LUPINS
BOl-1054 AIO FOR PROOUCERS Of NON-TEXTILE flAX 0,0 2,3 51,2 ----- 6,8 3,0 1,9 0,0 0,0 0,0 1,4 I, 7 0,7 4,9 55,0 ----- 128,9 SEED
B01-1055 SUPPLEMENTARY AIO FOR IJORLM WHEAT ----- ----- ----- 221,4 199,8 72,4 ----- 512,5 ----- ----- 0,7 9,4 ----- ----- ----- ----- 1.016,2 (ART.! AND 4 R.l765/92)
-------------------------------~-------------------------------------------------------------------------------------------------------------------------------------------------------------------------------------- ! BOI-105 PER HECTARE AIO FOR ARABLE CROPS (LARGE- 59,0 4B7,3 2.516,9 246,7 1.235,3 4.00B,4 72,2 1.364,0 4,5 33,B 214,B 90,9 126,7 295,B 1.594,4 ----- 12.350,5 '
SCALE PROOUCERS) AND AID fOR IJORUH WHEAT ----------------------------------------------------------------------------------------------------------------------------------------------------------------------------------------------------------------------BOl-1060 SEI-ASIOE RELATED TO PER !£ClARE AIO 5,1 57,7 308,4 2,0 175,1 372,0 15,7 54,2 0,3 2,B 25,6 5,5 29,4 61,8 135,7 1.251,3
BOl-1062 FIVE-YEAR SET-ASIDE 0,2 0,9 0,0 0,1 9,6 0,6 0,0 11,4
! ----------------------------------------------------------------------------------------------------------------------------------------------------------------------------------------------------------------------! 801-106 SET-ASIOE 5,1 57,7 308,6 2,0 176,1 372,0 15,8 63,8 0,3 3,4 25,6 5,5 29,4 61,8 135,7 ----- 1.262,6
! ----------------------------------------------------------------------------------------------------------------------------------------------------------------------------------------------------------------------801-109 OTHER 0,0 -1,4 -2,9 -0,2 -1,8 -0,5 ----- 0,0 0,0 -0,2 -0,1 0,0 -0,2 -0,1 -2,3 ----- -9·,8
----------------------------------------------------------------------------------------------------------------------------------------------------------------------------------------------------------------------BOI-10 ARABLE CROPS 182,8 684,9 3.927,7 462,4 1.681,6 5.416,5 130,8 1.951,2 9,B 218,4 JB7,B 182,7 264,3 490,8 1.953,6 ----- 17.945,2
~-----------------------------------.--------------------------------------------------------------------------------------------------------------------------------------------~---------~---------------------------

--~--~--------------------------------------------------------------------------------------------------------------------------------------------------------------------------------------------------------------------EAGGF GUARANTEE
EXPENDITURE CHARGED AGAINST THE 1998 BUDGET (EURO MILLION) 3.
8 DK 0 El E F IRL l Nl A p FIN s UK CE TOT
801-110 Rt:FUNDS ON SUGAR AND ISOGLUCOSE 185,4 51,8 157,8 15,2 27,6 463,1 8,0 139,5 33,7 16,4 13,3 8,9 10,2 m,4 1.265,5
----------------------------------------------------------------------------------------------------------------------------------------------------------------------------------------------------------------------801-lllO Rt:IH8URSEHENT OF STORAGE COSTS 28,9 12,1 74,4 7,7 20,7 86,4 5,1 44,0 ----- 18,7 10,5 0,9 3,3 8,5 28,3 ----- 349,5
801-l111 PUBLIC STORAGE
801-l112 REFUNDS ON SUGAR USED IN THE CHEMICAl 3,8 9,5 26,4 0,2 20,4 10,4 1,3 2,4 ----- 12,2 3,8 0,2 1,3 0,4 12,4 ----- 104,8 l.NOUSTRY
801-11U MEASURES TO AID THE DISPOSAL OF RAW ----- ---- ----- ----- ----- 12,8 ----- ----- ----- ----- ----- ----- ----- ----- ----- ----- 12,8 SUGAR
801-1119 OTHER INTERVENTION FOR SUGAR ---- ----- ----- ----- 6,2 6,7 ----- ----- ----- ----- ----- 0,7 ----- ----- 33,0 ----- 46,6
-------------------------------------------------------------------------------------------------------------------------------------------------------------------------------------------------------------------801-lll INTERVENTION· FOR SUGAR 32,6 21,6 100,8 7,9 47,3 116,3 6,4 46,4 30,9 14,4 1,9 4,6 8,9 13,6 5H,7
--------------------------------------------------------------------~-----------------------------------------------------------------------------------------------------------------------------------~------------801-119 OTHER 0,0 . -1,5 o,o -0,1 -0,9 0,0 0,0 0,0 0,0 0,0 0,0 -0,1 -2,5
------------------------------------------------------------------------------------------------------------------------------~------------~-------------------------------------------------------------------------
801-11 SUGAR 218,1 13,3 257,1 23,1 74,9 578,6 14,4 185,9 64,6 30,7 15,2 13,6 19,1 208,0 1.716,6
--------------------------------------------------------------------------------------------------------------------------------------------------------------------------------------------------------------------------
~

~ -------------------------------------------------------------------------------------------------------------------------------------------------------------------------------------------------------------------------
EAGGF GUARNHEE EXPENDITURE CHARGED AGAINST THE 1998 BUDGET (EURD MILLION) 4.
--------------------------------------------------------------------------------------------------------------------------------------------------------------------------------------------------------------------------
! 801-120
801-1210
801-1211
801-121
801-1220
801-122
801-1230
801-1231
801-1232
801-1233
801-1239
REFUNDS ON OLIVE OIL
PRODUCTION AID
SCHEMES RELATED TO PRODUCTION
PRODUCTION AID AND SCHEMES RELATED TO PRODUCTION OF lli.IYE OIL
CONSUMPTION AID
CONSUMPTION AID AND SCHEHES RELATED TO CONSUMPTION OF OLIVE OIL
TECHNICAL COSTS OF PUBLIC STORAGE
FINANCIAL COSTS OF PUBLIC STORAGE
OTHER PUBliC STORAGE COSTS
DEPRECIATION OF STOCKS
OTHER STORAGE HEASURES
8
0,0
0,1
D,1
-----
-----
-----
-----
-----
OK D EL E
0,0 0,0 1,0 5,8
528,4 966,4
8,5 11,2
536,9 977,6
0,2 6,8 67,9
0,2 6,8 67,9
----- ----- 0,4 3,0
----- ----- 0,1 0,2
----- ----- 0,2 D,D
----- ----- 0,9 24,9
----- ----- ----- 0,9
F IRL L Nl A p FIN s UK CE TOT
0,2 16,0 O,D 1,9 0,0 0,0 D,D 24,9
3,1 453,7 42,0 1.993,5
0,1 31,6 0,4 1,0 52,9
3,3 485,3 42,4 1,0 2.046,5
5,6 47,4 0,0 6,8 o,o 1, I 136,0
5,6 47,4 0,0 6,8 D,O 1,1 136,0
----- ----- 0,9 4,3
----- ----- 0,1 0,4
----- ----- -11,7 -4,5
----- ----- 0,1 25,9
----- ----- o,o 0,9
----------------------------------------------------------------------------------------------------------------------------------------------------------------------------------------------------------------------801-123 STORAGE MEASURES FOR OLIVE OIL 1,6 29,0 -3,5 27,0
----------------------------------------------------------------------------------------------------------------------------------------------------------------------------------------------------------------------801-124 OTHER INTERVENTION FOR OLIVE OIL 0,1 0,5 12,2 1,1 18,2 1,7 33,8
-----------------------------------------------------------------------~----------------------------------------------------------------------------------------------------------------------------------------------801-129 OTHER D,O -0,1 -0,5 -0,2 -0,5 0,0 -0,1 0,0 -1,5
----------------------------------------------------------------------------------------------------------------------------------------------------------------------------------------------------------------------801-12 OLIVE OIL 0,2 0,1 0,2 546,7 1.092,0 10,0 562,7 0,0 52,6 0,0 0,0 1,1 1,0 2.266, 7
--------------------------------------------------------------------------------------------------------------------------------------------------------------------------------------------------------------------------
rE
EAGGF GIJARNHEE EXPENDIIURE DlARGED AGAINST THE 1998 BUDGET (EURD MILLION) 5 •
8 . OK D EL E F IRL I L HL A p FIN s Ill CE 101
801-1JO PRODUCTION AID FOR DRIED FODDER O,J 15,7 23,2 2,7 11J,9 86,0 0,5 42,0 15,9 0,1 O,J 0,1 0,4 6,2 J07,J
801-ll1 PRODUCTION AID FOR GRAIN LEGUMES 0,9 65,7 0,8 2,8 o,o 0,2 70,4
801-ll9 OTHER 0,0 0,0 -0,1 0,0 o,o 0,0 0,0 -0,2
------------~-----------------------~------------------------------------------------------------~-------------------------------------------------------------------------------------------------------------------
801-ll DRIED FOOOER AND GRAIN LEGUMES O,J 15,7 23,1 J,6 179,4 86,8 0,5 44,8 15,9 0,2 0,6 0,1 0,4 6,2 J77,5
~

<.r' _..
--------------------------------------------------------------------------------------------------------------------------------------------------------------------------------------------------------------------------EAGGF GUARANTEE
EXPENDITURE CHARGED AGAINST THE 1998 BUDGET (EURO MILLION) 6.
--------------------------------------------------------------------------------------------------------------------------------------------------------------------------------------------------------------------------B DK D EL E F IRL L NL A p FIN s UK CE TOT
--------------------------------------------------------------------------------------------------------------------------------------------------------------------------------------------------------------------------
B01-1400 PRODUCTION AIO FOR FIBRE FLAX 8,8 O,D 0,4 32,7 32,1 O,D 3,6 0,2 0,8 0,3 0,0 13,3 92,1
BD1-1402 PRODUCTION AID FOR HEMP 2,0 2, <} 1,9 0,0 0,0 0,9 0,7 D,O 2,0 u.s
BD1-1409 OTHER INTERVENTION
-------------------------------------·--------------------------------------------------------------------------------------------------------------------------------------------------------------------------------BOI-140 FIBRE FLAX AND HEMP 8,8 O,D 2,4 35,6 40,0 0,0 0,0 0,0 4,5 0,9 0,8 0,3 D,D 1S,Z 108,5
----------------------------------------------------------------------------------------------------------------------------------------------------------------------------------------------------------------------BOl-141 AID FOR COTTON 580,3 180,7 761,0
! 801-142 SILKI«JRMS 0,1 D,D D,O o,i. -0,3'
BDl-149 OTHER D,D 0,0 0,0 0,0
B01-14 FIBRE PLANTS AND SILKWORMS 8,8 O,D 2,4 580,4 216,2 40,0 o,o 0,1 0,0 4,5 0,9 0,8 0,3 0,0 1S,Z 869,8
~

--------------------------------------------------------------------------------------------------------------------------------------------------------------------------------------------------------------------------. EAGGf GUARNHEE
EXPENDITURE CHARGED AGAINST THE 1998 BUDGET (EURD HILLION) 1. !
--------------------------------------------------------------------------------------------------------------------------------------------------------------------------------------------------------------------------B OK D EL E F IRL L NL A p FIN s UK CE TOT
-------------------------------------------~-----------------------------------------------------------------------------------------------------------------------------------------------~------------------------------
! 801-1500 EXPORT REFOOS o.s 0,8 o,o 1&,1 13,6 I,J 7,1 2,0 0,1 0,0 0,0 0,0 40,8
! 801-1S01 COMPENSATION FOR WITitlAAWALS AND BUYING 0,9 0,7 18,3 S4,S 37,8 0,0 21,4 D,J 1,8 2,7 138,3 IN
' 801-1502 OPERATIONAL FOO FOR PRODUCER 18,9 0,2 8,9 0,2 S1,0 S7,6 4S,8 44,2 0,0 1,0 11,2 239,0 ORGANIZATIONS
! 801-1S04 SPECIFIC HEASURES FOR HAZELNUT 2,7 0,5 3,2 PRODUCERS
! ! 801-1SOS HEASURES TO IHPRDVE PRODUCTION 0,5 J,l 13,5 11,0 21,2 0,0 4,1 2,8 0,7 2,4 0,0 0,2 1,2 67,3
! B01-1S07 NUTS 0,0 108,8 1,2 O,J 110,3
' BOI-1508 BNWlAS 105,1 ~.1 8,1 207,9 •! !
BOI-1509 OTHER INTERVENTION 0,1 5,9 0,5 27,4 33,9
---------------------------------------------------------------------------------------------~------------------------------------------------------------------------------------------------------------------------ ! B01-1SD FRESH FRUIT NfJ VEGETABLES 20,8 0,2 13,4 S4,0 3S3,2 241,6 0,0 78,4 ----- 49,4 0,8 12,6 0,1 1,2 1S,1 ----- 840,7
BOI-151D EXPORT REFOOS ----- 0,0 2,0 1,4 2,7 1,5 0,0 1,6 1,4 0,1 0,2 0,6 11,S
BOI-1511 PRODUCTION AID FOR PROCESSED TOMATO S4,4 43,8 14,0 ----- 178,6 37,S J28,J PRODUCTS
BOI-1512 PRODUCTION AID FOR FRUIT-BASED PRODUCTS 0,1 16,1 2S,3 31,1 ----- 13,7 0,0 0,0 D,J 86,7
BOI-15JJ PRODUCTION AID AND INTERVENTION FOR 111,7 2,8 0,0 114,S PROCESSED DRIED GRAPE PRODUCTS
, BOI-1514 PROOUCTION AID FOR TINNED PINEAPPLE 6,1 6,1
BDI-1515 COHPENSA liON TO ENCOURAGE PROCESSING OF 13,7 60,4 0,1 ----- 37,0 1,9 0,1 113,2 CITRUS FRUITS
BOI-1516 PRODUCTION AID FOR PROCESSED ----- O,J O,J RASPBERRIES
BDI-1511 SPECIFIC HEASURES J,J J,J
--------------------------------------------------------------------------------------------------------------------------------------------------------------------------------------------------------------------------~

--------------------------------------------------------------------------------------------------------------------------------------------------------------------------------------------------------------------------EAGGF GUARmTEE
EXPENDITURE CHARGED AGAINST THE 1998 BUDGET (EURO MilliON) 8.
B OX 0 El E F !Rl l Nl A p FIN s UK CE TOT
! 801-1519 OTHER INTERVENTION
! ----------------------------------------------------------------------------------------------------------------------------------------------------------------------------------------------------------------------! 801-151 PROCESSED FRUIT AND VEGETABlES o,o Z,1 197,3 138,} 52,8 0,0 ZJ6,9 1,5 0,0 39,8 o,z 1,1 670,0
BOl-159 OTHER 0,0 0,0 -0,1 -0,1 -0,2 -0,7 0,0 0,0 0,0 o,o -1,2
! 801-15 FRUIT AND VEGETABlES 20,8 o,z 15,4 m,z 491,5 294,2 0,0 314,5 50,8 0,8 52,5 0,1 1,4 16,1 1.509,5
e

--------------------------------------------------------------------------------------------------------------------------------------------------------------------------------------------------------------------------EAGGF GUAIWUEE
EXPENDITURE CHARGED AGAINST THE 1998 BUDGET (EURO MILLION) 9.
--------------------------------------------------------------------------------------------------------------------------------------------------------------------------------------------------------------------------B OK 0 EL E F IRL L NL A p FIN s ux C[ TOT
-------------------------------------------------------------------------------------------------------------------------------------------------------------------------------------------------------------------------
801-160 REFUNDS ON PRODUCTS OF THE VINE-GROWING SECT Oil
0,0 0,0 0,1 0,1 22,0 5,4 6,3 0,2 o,3 6,8 0,1 41,2
----------------------------------------------------------------------------------------------------------------------------------------------------------------------------------------------------------------------801-1610
BOl-1611
801-1612
BOl-161
801-1620
801-1621
BOl-1622
BOl-1623
BOl-162
801-163
BOl-l~
801-169
INTERVENTION STO~ OF WINE AND GRAPE HUST(R. 822/87)
DISTILLATION OF WINE (R. 822/87)
COMPULSORY DISTILLATION OF THE BY-PRODUCTS OF WINE-MAKING (ART .35 822/87)
INTERVENTION FOR. PRODUCTS OF THE VINE-GROWING SECTOR(R.3290/94)
TECHNICAL COSTS
FINANCIAL COSTS
OTHER COSTS
DEPRECIATION Of STOCKS
TAXING OYER OF ALCOHOL FROM COMPULSORY DISTILLATION (ARTS.37 & 40 OF R.822/87)
AID FOR THE USE OF MUST
PERMANENT ABAIIXJIIIENT PREMIUMS IN RESPECT OF AREAS UNDER VINES
OTHER
----- . -----
----- -----
----- -----
o,o
----- 3,1 11,8 10,8
0,3 5,0 120,9 26,2
----- 0,2 20,6 26,2
0,3 8,4 159,2 63,2
0,5 0,6
0,0 0,0
-0,1 7,5 9,3
0,8 37,0 59,2
0,8 45,0 69,2
0,1 2,3 11,4 46,5
0,3 0,0 0,8 12,2
o,o 0,0 -0,2 -0,8
----- 21,0 ----- ----- 0,0 2,3 ----- ----- ----- ----- 54,9
----- 87,2 ----- ----- ----- 7,4 ----- ----- ----- ----- 247,0
----- 16,4 ----- ----- ----- 2,5 ----- ----- ----- ----- 65,8
124,6 0,0 12,1 367,8
1,7 2,8
0,0 0,1
1,0 0,8 18,6
21,3 4,6 122,9
24,1 5,4 144,4
69,0 0,1 2,6 0,8 132,6
1,8 0,1 15,1
0,0 0,0 -0,1 0,0 -1,2
--------------------------------------------------------------------------------------------------------------------------------------------------------------------------------------------------------~------------
BOl-16 PRODUCTS OF THE VINE-GROWING SECTOR 0,0 o,o 0,7 11,5 238,2 195,7 225,7 0,1 0,2 0,3 26,7 0,1 0,8 700,0
--------------------------------------------------------------------------------------------------------------------------------------------------------------------------------------------------------------------------
\.}) ....c"

... -.:;\
----------------------------------------------------------------------------------------------------------------------------------------------------------------------------------------------------------------------EAGGf GUARNHEE
EXPENDITURE CHARGED AGAINST THE 1998 BUDGET (EURO MilliON) 10.
--------------------------------------------------------------------------------------------------------------------------------------------------------------------------------------------------------------------------B OK 0 El E f !Rl l Nl A p fiN s UK CE TOT
-------------------------------------------------------------------------------------------------------------------------------------------------------------------------------------------~------------------------------
! 801-171 PREMIUMS fOR TOBACCO J,J 29,5 J65,9 107,4 60,9 219,6 0,7 19,9 871,2
! B01-17J CONVERSION PREMIUM 0,0 0,0
----------------------------------------------------------------------------------------------------------------------------------------------------------------------------------------------------------------------801-171
801-179
801-17
~
COHHUNITY fUNO fOR RESEARCH AND INfORMATION
OTHER
TOBACCO
-0,1
J,2
. 0,0 -0,1 0,0
29,5 J65,8 107,11
4,1 4,1
-5,1 0,4 -0,1 -5,0
79,8 260,0 0,7 19,8 4,1 870,J
EAGGF GUAIWUEE EXPENDITURE CHARGED AGAINST THE 1998 BUDGET (EURO HILLION) 11.
6 OK 0 EL E F IRL L NL A p FIN s UK CE TOT
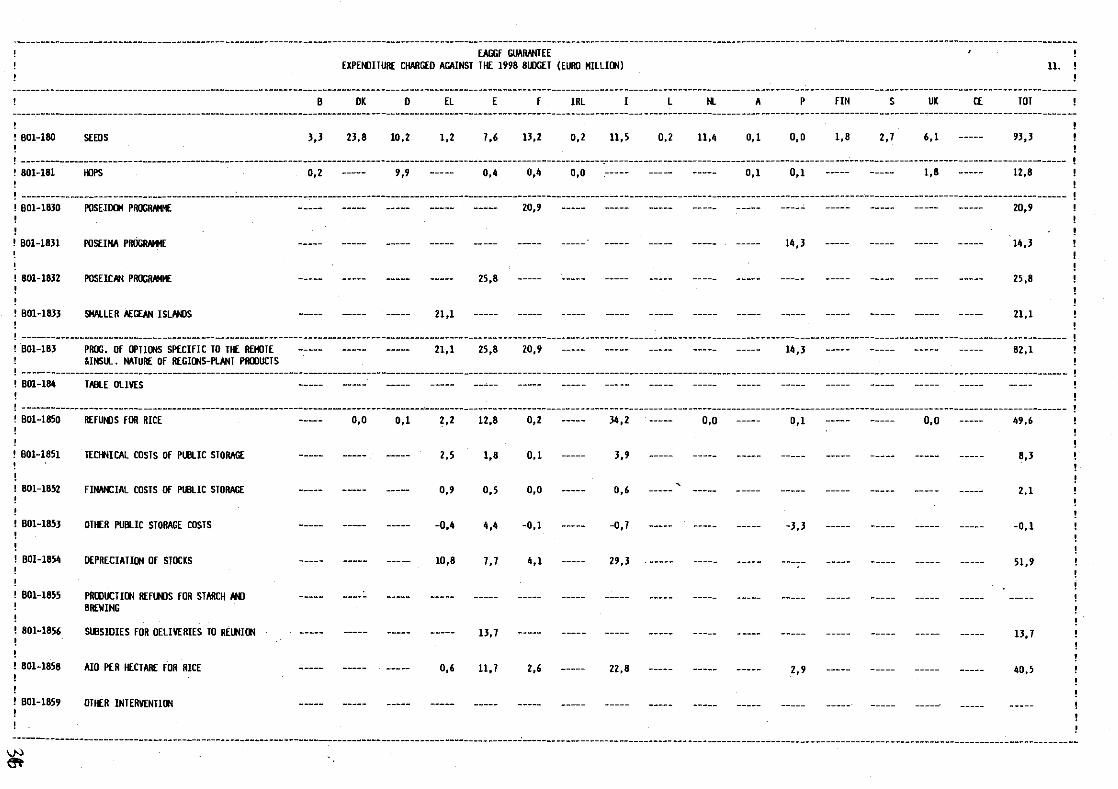
601-180 SEEOS 3,3 23,8 10,2 1,2 7,6 13,2 0,2 11,5 0,2 11,4 0,1 0,0 1,8 2,7 6,1 93,3
-----------------------------------------------------------------------------------------------------------------------~---------------------------------------------------------------------------------------------! 801-181
601-1B30
601-1831
B01-1B32
601-1B33
601-1B3
OOPS
PllSEIDOt PROGRNIME
POSEIHA PROGRNttE
PIJSEIC~ PROGRN41£
SHALLER AEGE~ ISLN-IJS
PROG. Of OPIIOOS SPECIFIC TO THE REICHE l!NSUI.. NATURE OF REGIONS-Pl~T PROOUCTS
0,2 9,9
21,1
21,1
0,4 0,4 0,0 0,1 0,1 1,B 12,8
20,9 20,9
14,3 14,3
25,8 25,8
21,1
25,8 20,9 14,3 82,1
----------------------------------------------------------------------------------------------------------------------------------------------------------------------------------------------------------------------601-184 TABLE OLIVES
' 601-1B50 REFUNDS FOR RICE 0,0 0,1 2,2 12,8 0,2 34,2 0,0 0,1 0,0 49,6
601-1851 TECHNICAL COSTS OF PUBLIC STORAGE 2,5 1,B 0,1 3,9 B,3
B01-1B52 FINI\NCIAL COSTS Of PUBLIC STORAGE 0,9 0,5 0,0 0,6 2,1
601-1B53 OTHER PUBLIC STORAGE COSTS -0,4 4,4 -0,1 -0,7 -3,3 -0,1
601-1B54 DEPRECIATION OF STOCKS 10,8 7,7 4,1 29,3 51,9
601-1855 PRODUCTION REFUNDS FOR STARCH AND BREWING
B01-1856 SUBSIDIES FOR DELIVERIES TO REUNION 13,7 13.7
B01-1858 AID PER HECTARE FOR RICE 0,6 11,7 2,6 22,8 2,9 40,5
601-1B59 OTHER INTERVENTION
-·-----------------------------------------------------------------------------------------------------------------------------------------------------------------------------------------------------------------------~

....... •
·-----·-------------------------------------------------------------------------------------------------------------------------------------------------------------------------------------------------------------------EHilif GUARNUEE
EXPEtiJITURE CHARGED AGAINST II£ !998 BlllGET (EURO MILliON) 12.
·-------------------------------------------------------------------------------------------------------------------------------------------------------------------------------------------------------------------------B OK 0 EL E F IRL I L NL A p FIN s UK CE TOT
B0!-185 RICE 0,0 0,1 16,7 52,6 6,9 90,1 0,0 -0,3 0,0 166,1
801-189 OTHER 0,0 0,0 0,0 -0,1 -0,1 0,0 0,0 -0,3
801-18 OTHER PLANT SECTORS OR PIIOOUCTS 3,4 23,8 20,3 38,9 86,4 41,3 0,2 101,5 0,2 11,4 0,2 14,1 1,8 2,7 1,9 354,0
====================================================================================================================================================================================================================== BOl-l 437,7 191,9 4.276,5 2.283,6 4.167,6 6.742,9 146,0 3.646,4 10,1 365,8 421,7 364,8 280,1 514,6 2.209,0 5,2 26.669,6
---------------------------~---------------------------------------------------------------------------------------------------------------------------------------------------------------------------------------------
z
EAGGF GUARNUEE EXPENDITURE CHARGED AGAINST THE 1998 BUDGET (EURO MILLION) 13. !
B OK D EL E F IRL 1 L NL A p FIN s UK CE TDT
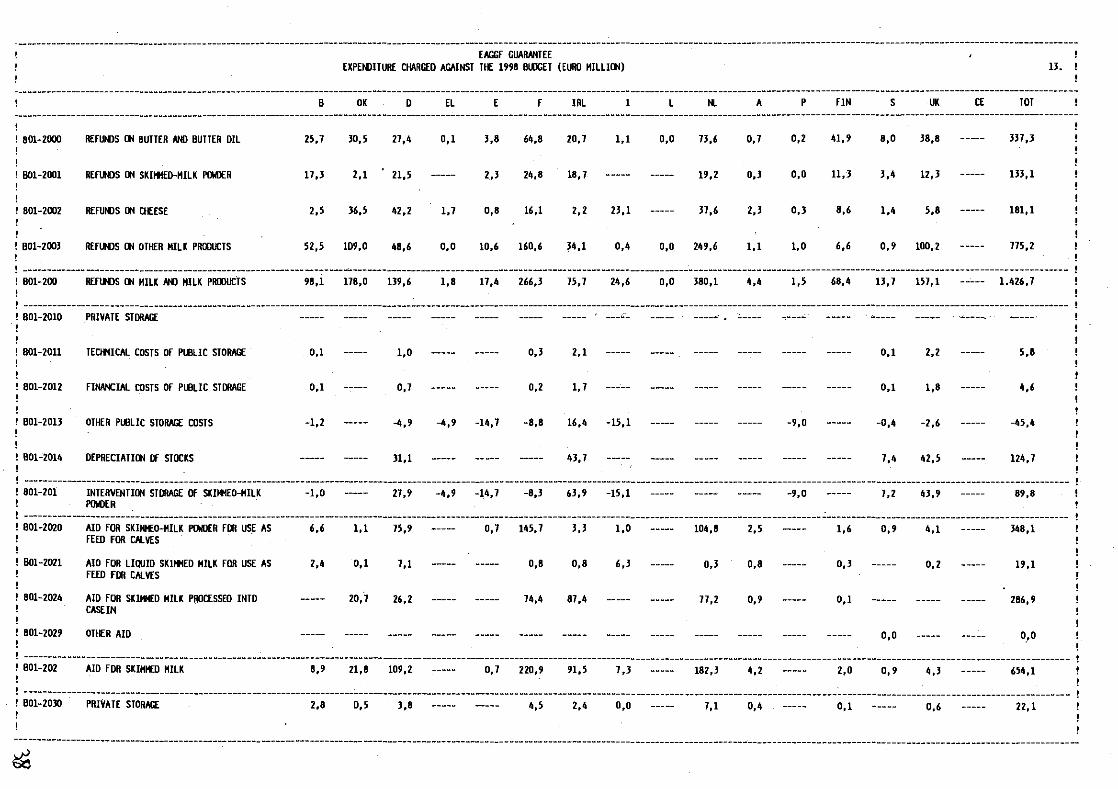
! 801-2000 REFUNDS ON BUTTER AND BUTTER DIL 25,7 30,5 27,4 0,1 J,8 64,8 20,7 1,1 0,0 73,6 0,7 0,2 41,9 8,0 38,8 ----- 337,3
! 801-2001 REFUNDS ON SKIHHED-HILK POWDER 17,3 2,1 21,5 ----- 2,J 24,8 18,7 ----- ----- 19,2 0,3 0,0 11,3 J,4 12,3 ----- 133,1
! 801-2002 REFUNDS ON CHEESE 2,5 36,5 42,2 1,7 0,8 16,1 2,2 23,1 ----- 31,6 2,J 0,3 8,6 1,4 5,8 ----- 181,1
B01-200J REFUNDS ON OTHER MILK PRODUCTS 52,5 109,0 48,6 o,o 10,6 160,6 34,1 0,4 0,0 2119,6 1,1 1,0 6,6 0,9 100,2 ----- 775,2
-------------------------------------------------------------------~--------------------------------------------------------------------------------------------------------------------------------------------------801-200 REfUNDS ON MILK AND HILK PRODUCTS 98,1 178,0 139,6 1,8 11,11 266,J 75,7 24,6 0,0 380,1 4,4 1,5 68,4 13,7 157,1 ----- 1.426,7
! ---------------------------------------------------------------------------------------------------------------------------------------------------------------------------------------------------------------------- ! ! 801-2010
! 801-2011
801-2012
BOl-2013
801-2014
801-201
801-2020
! ! 801-2021
! ! 801-2024
! ! 801-2029
PRIVATE STORAGE
TECHNICAL COSTS OF PUBLIC STORAGE
FINANCIAL COSTS OF PUBLIC STORAGE
OTHER POOLIC STORAGE COSTS
DEPRECIATION Df STOCKS
INTERVENTION STORAGE Df SKIHHEO-MILK POI«JER
1\ID FOR SKIMHEO-HILK P!MJER FDR USE AS FEED FOR CAL YES
AID FOR LIQUID SKIHHED MILK FDR USE AS FEED FDR CAL YES
AID FOR SKIMMED MILK PROCESSED INTO CASEIN
OTHER AID
0,1
0,1
-1,2
-1,0
6,6
2,4
-----
-----
1,0 O,J
0,7 0,2
-4,9 -4,9 -111,7 -8,8
31,1
27,9 -4,9 -14,7 -8,3
1,1 75,9 ----- 0,7 145,7
0,1 7,1 ----- ----- 0,8
20,7 26,2 ----- ----- 74,4
----- ----- ----- ----- -----
----.5· . ----- ----- -----
2,1 0,1 2,2 ----- 5,8
1,7 0,1 1,8 ----- 4,6
16,4 -15,1 -9,0 -0,4 -2,6 ----- -45,4
43,7 7,4 42,5 ----- 124,7
63,9 -15,1 -9,0 7,2 43,9 89,8
J,J 1,0 ----- 104,8 2,5 ----- 1,6 0,9 4,1 ----- 348,1
0,8 6,J ----- O,J 0,8 ----- O,J ----- 0,2 ----- 19,1
87,4 ----- ----- 77,2 0,9 ----- 0,1 ----- ----- ----- 286,9
----- ----- ----- ----- ----- ----- ----- 0,0 ----- ----- 0_.0
! ----------------------------------------------------------------------------------------------------------------------------------------------------------------------------------------------------------------------! 801-202 AID FDR SKIMMED HILK 8,9 21,8 109,2 ----- 0,7 220,9 91,5 7,3 ----- 182,J 4,2 ----- 2,0 0,9 4,J ----- 654,1
! ----------------------------------------------------------------------------------------------------------------------------------------------------------------------------------------------------------------------! 801-2030 PRIVATE STORAGE 2,8 0,5 3,8 ----- ----- 4,5 2,4 0,0 ----- 7,1 0,4 ----- 0,1 ----- 0,6 ----- 22,1
--------------------------------------------------------------------------------------------------------------------------------------------------------------------------------------------------------------------------~
--·
--------------------------------------------------------------------------------------------------------------------------------------------------------------------------------------------------------------------------EI\GGF WARNlTEE
EXPENDITURE CHARGED AGAINST THE 1998 BUDGET (EURO HILLION) 14.
-----------------------------·--------------------------------------------------------------------------------------------------------------------------------------------------------------------------------------------B DK D EL E f IRL L NL A p FIN s UK CE TOT
--------------------------------------------------------------------------------------------------------------------------------------------------------------------------------------------------------------------------
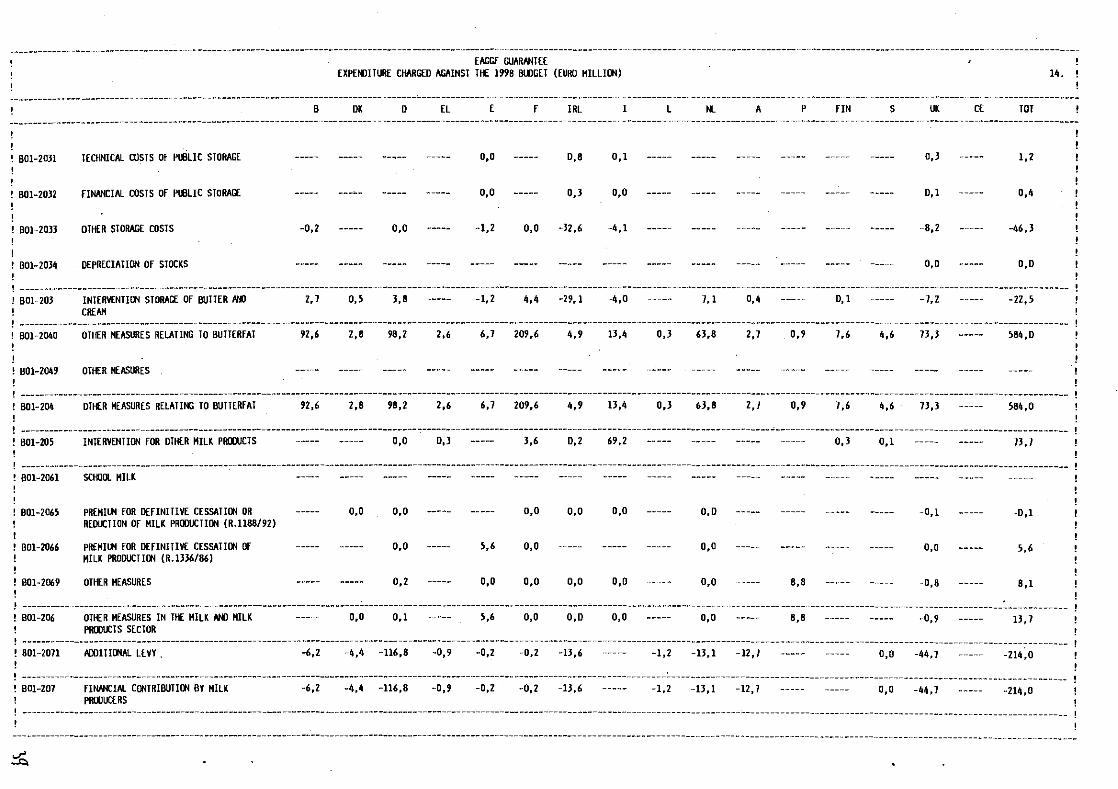
B01-20Jl TECHNICAL COSTS Of PUBLIC STORAGE o,o 0,8 0,1 0,3 1,2
B01-2032 FINNlCIAL COSTS Of PUBLIC STORAGE 0,0 0,3 0,0 0,1 0,4
B01-2033 OTHER STORAGE COSTS -0,2 0,0 -1,2 0,0 -32,6 -4,1 -8,2 -46,3
B01-2034 DEPRECIATION Of STOCKS 0,0 O,D
----------------------------------------------------------------------------------------------------------------------------------------------------------------------------------------------------------------------B01-203 INTERVENTION STORAGE OF BUTTER AND
CREAM 2, 7 0,5 3,8 -1,2 4,4 -29,1 -4,0 7,1 0,4 0,1 -7,2 -22,S
----------------------------------------------------------------------------------------------------------------------------------------------------------------------------------------------------------------------801-2040 OTHER MEASURES RELATING TO BUTTERFAT 92,6 2,8 98,2 2,6 6,7 209,6 4,9 13,4 0,3 63,8 2,7 0,9 7,6 4,6 13,3 584,0
B01-2049 OTHER HEASURES
B01-204 OTHER MEASURES RELATING TO BUTTERFAT 92,6 2,8 98,2 2,6 6,7 209,6 4,9 13,4 0,3 63,8 2,7 0,9 7,6 4,6 13,3 584,0
----------------------------------------------------------------------------------~-----------------------------------------------------------------------~-----------------------------------------------------------' 801-205 INTERVENTION FOR OTHER MILK PRODUCTS 0,0 0,3 3,6 0,2 69,2 0,3 0,1 73,7
----------------------------------------------------------------------------------------------------------------------------------------------------------------------------------------------------------------------B01-2061 SCHOOL MILK
B01-2065 PREM!UH FOR DEFINITIVE CESSATION OR ----- 0,0 0,0 ----- ----- 0,0 0,0 0,0 0,0 -0,1 -0,1 REDUCTION OF MILK PRODUCTION (R.1188/92)
BOl-2066 PREMIUH FOR DEFINITIVE CESSATION OF ----- ----- 0,0 ----- 5,6 0,0 0,0 0,0 5,6 MILK PRODUCTION (R.1336/86)
B01-2069 OTHER MEASURES ----- ----- 0,2 ----- o,o 0,0 0,0 0,0 0,0 8,8 -0,8 8,1
--------------------------------------------------------------------------------------------------------------------------------------------------------------------------------------------------------------------B01-206 OTHER MEASURES IN THE MILK NlD MILK
PRODIX:TS SECTOR 0,0 0,1 5,6 0,0 0,0 0,0 0,0 8,8 -0,9 13,7
----------------------------------------------------------------------------------------------------------------------------------------------------------------------------------------------------------------------801-2071 ADDlTIONAL LEVY . -6,2 -4,4 -116,8 -0,9 -0,2 -0,2 -13,6 -1,2 -ll,1 -12,7 0,0 -44,7 -214,0
----------------------------------------------------------------------------------------------------------------------------------------------------------------------------------------------------------------------B01-207 FINNlCIAL CONTRIBUTION BY MILK
PRODUCERS -6,2 -4,4 -116,8 -0,9 -0,2 -0,2 -13,6 -1,2 -13,1 -12,1 0,0 -44,7 -214,0
----------------------------------------------------------------------------------------------------------------------------------------------------------------------------------------------------------------------
--------------------------------------------------------------------------------------------------------------------------------------------------------------------------------------------------------------------------
~
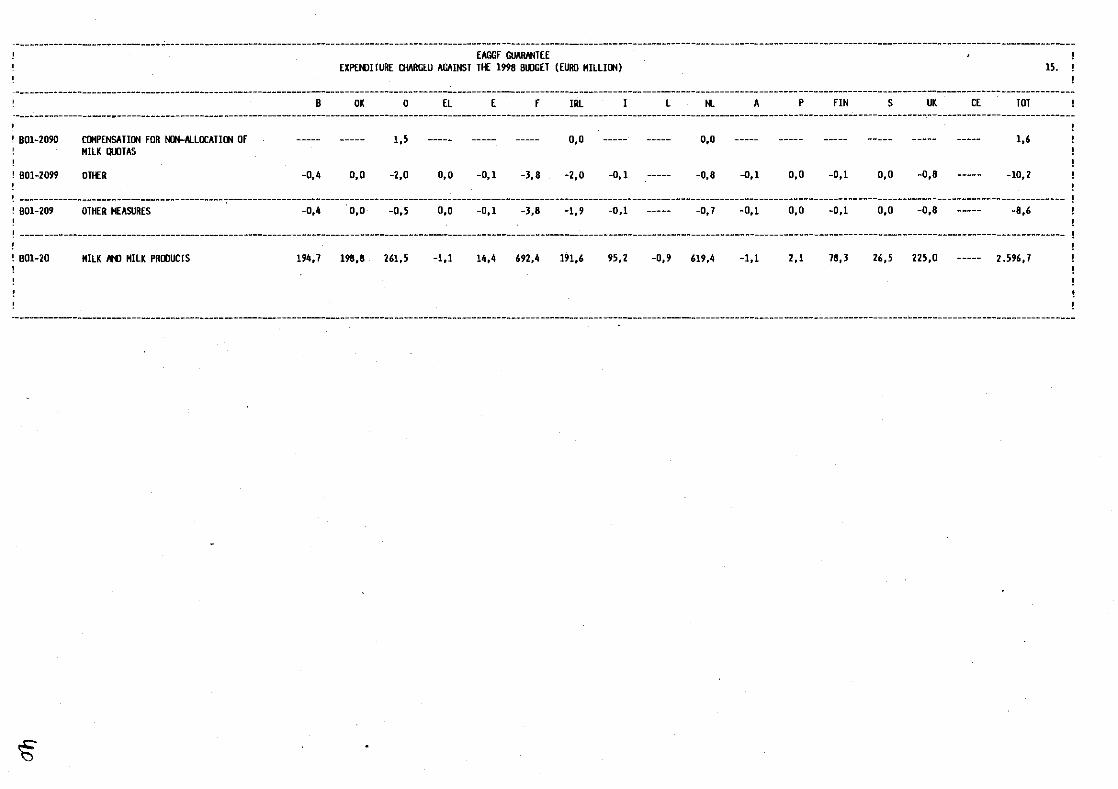
! BOJ-2090
! 801-2099
! 801-209
801-20
~
COMPENSATION fOR NON-ALLOCATION Of MILK QUJTAS
OTI£R
OTHER MEASURES
MILK AND MILK PRODUCTS
B
-0,4
-0,4
194,7
EAGGf GUARNHEE EXPENDITURE CHARGEU AGAINST Tl£ 1998 BUDGET (EURO MILLION)
OK 0 EL E f IRL
1,5 0,0
0,0 -2,0 o,o -0,1 -3,8 -2,0 -0,1
. o,o -0,5 0,0 -0,1 -3,8 -1,9 -0,1
198,8 261,5 -1,1 14,4 692,4 191,6 95,2
15.
L NL A p fiN s UK CE TOT
o,o 1,6
-0,8 -0,1 0,0 -0,1 0,0 -0,8 -10,2
-0,7 -0,1 0,0 -0,1 0,0 -0,8 -8,6
-0,9 619,4 -1,1 2,1 78,3 26,5 225,0 2.596,7

EI\GGf GUARNITEE EXPENDITURE C~RGEO AGAINST THE 1998 BUDGET (EURO MILLION) 16. !
8 DK D EL E f IRL L Nl A p FIN s UK CE TOT
' 801-210 REFUNDS ON BEEF/VEAL 32,4 29,0 168,1 0,3 19,0 96,6 275,2 55,7 0,1 80,1 11,5 0,4 2,0 0, 7 -2,5 714,5
----------------------------------------------------------------------------------------------------------------------------------------------------------------------------------------------------------------------I 801-2110 PRIVATE STORAGE ----- o,o ----- ----- ----- ----- ----- ----- ----- ---- ----- ----- ----- ----- ----- ----- 0,0
~ 801-2111 TECHNICAL COSTS Df PUBLIC STORI\GE 0,4 I, 7 36,7 ----- 8,2 19,6 22,0 4,8 ----- 0,4 2,7 0,3 0,0 0,0 30,4 ----- 127,4
! 801-2112 FINANCIAL COSTS IJ' PUBLIC STDRI\GE 0,1 0,2 4,5 ----- 0,9 2,1 2,8 0,8 ----- 0,0 0,3 0,0 0,0 0,0 3,8 ----- 15,4
! 801-2113 OTHER PUBLIC STORAGE COSTS -2,3 -5,8 -6,0 -11,4 -17,9 -22,7 -16,9 -14,8 ----- -0,6 -1,2 -2,2 -0,5 -0,2 -19,1 ----- -121,7
! 801-2114 DEPRECIATION Of STOCKS 0,1 1,4 22,1 ----- 2,3 7,4 37,3 6,7 ----- 0,1 1,1 0,0 0,0 0,0 45,8 ----- 124,4
! ----------------------------------------------------------------------------------------------------------------------------------------------------------------------------------------------------------------------801-211 INTERVENTION STORAGE IJ' BEEF /VEAL -1,8 -2,5 57,2 -11,4 -6,5 6,3 45,2 -2,5 ----- 0,0 2,9 -1,8 -0,5 -0,1 60,9 ---- 145,4
----------------------------------------------------------------------------------------------------------------------------------------------------------------------------------------------------------------------801-2120 SUCKLER COW PREMIUMS 55,8 16,6 80,0 19,6 196,9 534,2 191,5 86,6 2,0 9,3 37,4 39,6 4,1 21,9 293,5 ----- 1.589,1
! 801-2121 AD01710NAL PREMIUMS FDR SUCKLER COWS 9,3 ----- ----- ----- 29,0 1,7 ----- 8,1 ----- ---- 0,1 6,1 ----- ----- 9,2 ----- 63,11
! 801-2122 SPECIAL PREMIUMS 31,5 27,5 216,3 18,9 78,8 258,5 214,1 55,2 2,7 11,3 37,2 20,0 25,3 33,4 310,0 ----- 1.340,8
I 801-2123 OESEASONALIZATION PREMIUMS ----- ----- 1,3 ----- ----- ----- ll,4 ___ .,.._ ----- ----- ----- ----- ----- 0,4 10,0 ----- 45,1
801-2124 PREMIUMS FDR FATTENING YOUNG HALE ----- ----- ----- ----- ----- 11,2 0,8 ----- ----- ----- ----- 4,0 ----- ----- 7tt,1 ----- 96,0 CALVES
801-2125 EXTENSIFICATION PREMIUMS 6,4 2, 7 40,7 10,5 92,6 21tt,lt 100,6 19,8 1,3 ----- 15,5 13,5 7,8 11,5 163,1 ----- 706,tt
B01-2126 EXCEPTIONAL SUPPORT MEASURES ----- ----- 0,0 ----- ----- ----- ----- ----- ----- ----- ----- ----- ----- ----- 243,4 ----- 243,4
BOI-2127 COHPULSIJRY SLAUGHTER PROCJWH: ----- ----- ----- ----- ----- 2,1 4,4 ----- ----- ----- ----- ----- ----- ----- 35,8 ----- 42.3
801-2128 PREMIUM FOR THE EARLY SLAUGHTER OF 10,8 0,2 11,1 0,1 0,2 29,8 ----- 19,7 0,0 34,1 6,6 1,6 0,3 1,6 0,0 ----- 116,1 CALVES
. 801-2129 OTHER INTERVENTION ----- ----- 0,5 ----- ----- ----- 0,0 -0,2 ----- ----- ----- ----- ----- ----- 0,5 ----- 0,8
--------------------------------------------------------------------------------------------------------------------------------------------------------------------------------------------------------------------------_c >
EAGGF GUAIWITEE EXPENDITURE CHARGEO AGAINST THE 1998 BUDGET (IURO MILLION) 11.
-~-------~----------------------------------------------------------------------------------------------------------------------------------------------------------------------------------------------------------------
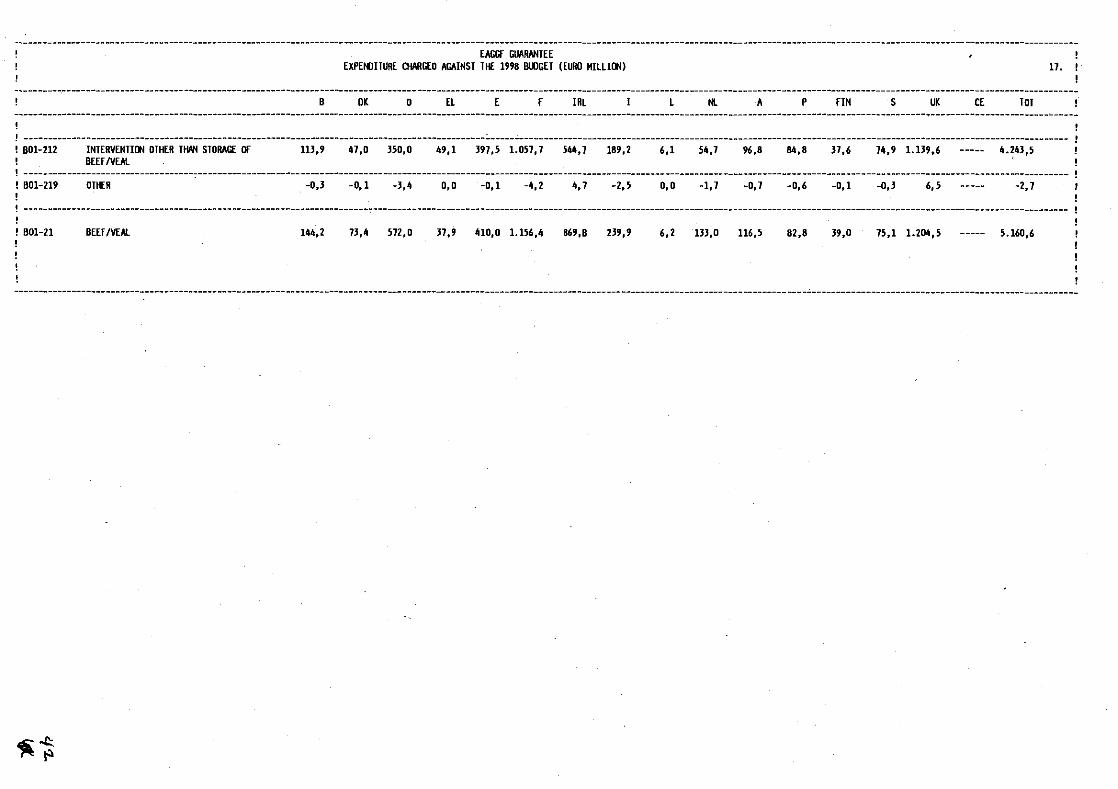
B01-212
BOI-Z19
B01-21
~~
INTERVENTION OTHER THAN STORAGE Of BEEF/VEAL
OTHER
BEEF/VEAL
B
113,9
-0,3
14.ta,2
OK 0
47,0 J50,0
-0,1 -.J,.la
73,4 572,0
EL E f IRL
.la9,1 397,5 1.057,7 544,7
0,0 -0,1 -.la,2 4,7
31,9 410,0 1.1S6,4 869,B
L NL A p FIN s UK CE TOT
189,2 6,1 54,7 96,8 84,8 37,6 74,9 1.139,6 4.~43,5
-2,S 0,0 -1,7 -0,7 -0,6 -0,1 -0,3 6,5 -2,7
239,9 6,2 lll,O 116,5 82,8 39,0 75,1 1.2011,5 5.160,6

--------------------------------------------------------------------------------------------------------------------------------------------------------------------------------------------------------------------------EAGGF llJAIWHEE
EXPENJITURE CHARGED AGAINST THE 1998 BUDGET (EURO HILLIDN) 18.
--------------------------------------------------------------------------------------------------------------------------------------------------------------------------------------------------------------------------
801-221 INTERVENTION IN THE fDRH Of STORAGE Of SHEEPHEAT AND GDATHEAT
8 OK D EL E f 1RL L NL A p fiN s UK CE 101
0,1 0,1 0,2
----------------------------~-----------------------------------------------------------------------------------------------------------------------------------------------------------------------------------------801-2220
801-2221
I 801-222
801-229
801-22
..c' v
EWE AND GOAT PREHIUHS
FIXED fLAT-RATE EWE AND GOAT PREHIUH IN LESS-FAVOURED AND MOUNTAIN AREAS
INTERVENTION OTHER THAN STORAGE Of SHEEPHEAT .AND GOATHEAT
OTHER MEASURES
SHEEPHEAT AND GOAIHEAT
0,9 1,2
0,1
1,0 1, 2
0,0
1,0 1,2
28,6 117,4 108,8 117,0
7,0 1\0,2 110,0 39,2
15,7 157,6 418,8 15&,2
0,0 0,0 -0,1 0,0
15,6 157,& 1618,7 .156,2
81,2 98,5 0,1 9,9 1,8 17,4 1,2 2,4 162,5 1.111,0
26,1 29,6 0,0 0,7 0,1 14,1 0,& 0,7 95,5 161,9
109,} 128,1 0,1 10,1 1,9 51,5 1, 7 1,1 458,0 1.534,9
o,o 0,0 0,0 -0,4 -0,6
109,1 128,1 0,1 10,7 1,9 51,5 1,8 3,1 45 7. 7 1.514,&

EAGGF GUARANTEE EXPENDITURE CHARGED AGAINST THE 1998 BUDGET (EURO MILLION) 19.
B DK D EL E F IRL L NL A p FIN s UK CE TDT -~-----------------------------------------------------------------------------------------------------------------------------------------------------------------------------------------~------------------------------
B01-2l0 REFUNDS ON PIGHEAT 16,5 22,1 ~.a 0,2 8,0 lt,J. a·,l 8,9 .2,-11 l,~ 1,5 0,8 0,6 1,2 11t,S
801-Zll IKTERYENTIDN FOR PIGHEAT
B01-2l2 EXCEPTIONAL MARKET SUPPORT IEASURES 0,0 J,1 4-11,0 116,8 16),8
801-239 OTHER -0,1 o,o -0,2 -0,1 -0,-1 0,0 0,0 0,0 0,0 -0,1 0,0 0,0 -0,6
B01-2l PIGHEAT 16,4 22,1 1,1 0,2 51,9 ~.2 0,1 8,9 119,1 l,~ 1,~ 0,8 0,6 1,2 237,7
~
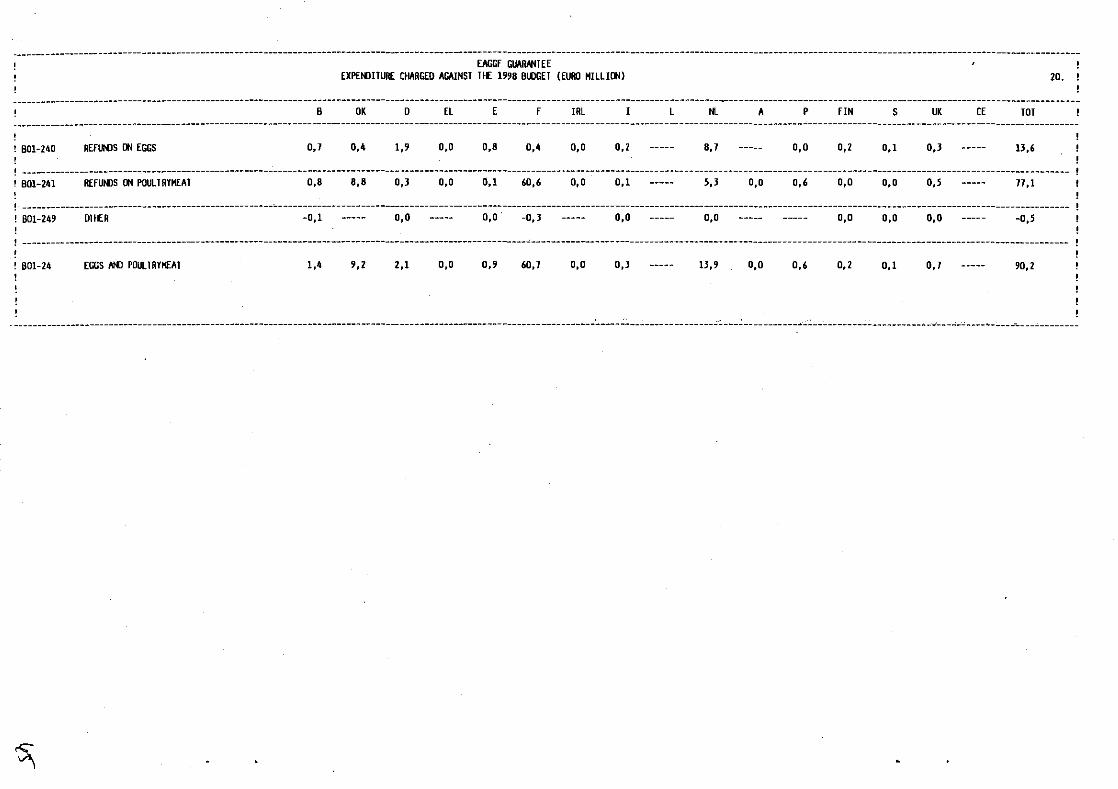
EAGGF GUARNII EE EXPENDITURE CHARGED A~INST THE 1998 BUDGET (EURO Hlll!ON) 20.
--------------------------------------------------------------------------------------------------------------------------------------------------------------------------------------------------------------------------B OK D El E f IRL l Nl A p FIN s UK CE TOT
--------------------------------------------------------------------------------------------------------------------------------------------------------------------------------------------------------------------------
! 801-240 REflJt()S ON EGGS 0,7 0,4 1,9 0,0 0,8 0,4 o,o 0,2 8,7 0,0 0,2 0,1 0,3 13,6
! 801-241 REFUNDS ON PDULTRYHEAT 0,8 8,8 0,3 0,0 0,1 60,6 o,o 0,1 5,3 0,0 0,6 o,o 0,0 0,5 17,1
801-249 OTHER -0,1 0,0 o,o. -O,J 0,0 o,o o,o o,o 0,0 -0,5
--------------------------------------------------------------------------------------------------------~-------------------------------------------------------------------------------------------------------------
BDl-24 EGGS AND PDULIRYHEAT 1,4 9,2 2,1 0,0 0,9 60,1 0,0 0,3 13,9 0,0 0,6 0,2 0,1 0,7 90,2
. ________________________________________________________________________________________________________________________ ,_ ____ .:;;_ _________________ _;-:. ___ :: ___________ .. -..:...: ________________________ .,.. ___ ,..;_:..: ____ .. _____ .,. ___ ..;. _______ _
~

·---------------------------------------------------------------------------~----------------------------------------------------7----------------------------------------------------------------------------------------EI\CGF GUAIWITEE
EXPEIIJITURE CHARGED AGAINST Tit: 1998 6WGET (EURD HILLIDN) 21.
·-------------------------------------------------------------------------------------------------------------------------------------------------------------------------------------------------------------------------6 DK D EL E f IRL L NL A p FIN s UK CE TOT
---------------------------------------------------------------------------------------------------------------------~---------------------------------------------------------------------~-----------------------------
601-2510
! 601-2511
! 601-2512
• B01-251J
601-251
601-253
! BOI -254
601-259
601-25
~
POSE!~
POSEIHA
POSE! CAN
SIW.LER AEGEAN ISLANDS
PROGRAMME Df IJ'TIDNS SPECifiC TD REIIITE& INSULAR AREAS-LIVESTOCK PRDDUCTS·CHAPTER
MEASURES TO CONTROL EPIZOOTIC DISEASES
SPECIFIC AIO'FDR BEE-KEEPING
Ollt:R
OTHER ANIMAL PRODUCT AID MEASURES
0,1 0,2
0,1 0,2
9,8 9,8
16,0 16,0
66,9 66,9
1,1 1,1
1,1 66,9 9,8 16,0 93,7
0,1 0,1
0,4 o,o 0,1 0,'4 1,3
1,2 66,9 ,9,8 0,4 16,0 0,0 0,1 0,4 95,1

----------------------------------------------------------------------------------------------------------~---------------------------------------------------------------------------------------------------------------EAGGF GUAIWlT EE
EXPENDITURE CHARGED AGAINST THE 1998 BUDGET (EURO Hl1LION) 22.
--------------------------------------------------------------------------------------------------------------------------------------------------------------------------------------------------------------------------
801-261
BOl-2620
BDl-2621
INTERVENTION FOR FISHERY PROOUCTS
AID FOR CEPHALOPOD PR!XJUCERS PERHIV£NTLY BASED IN THE CANARY ISLANDS
AOOITIONAL MARKETING COSTS
B OK
0,1 1,8
0 EL E F
0,0 0,1 0,2 3,1
2,2
2,9 4,1
IRL L NL A p FIN s UK CE TOT
1,6 0,1 0,9 0,4 2,7_ 10,9
2,2
1,6 8,6
-------------------------------------------------------------------~--------------------------------------------------------------------------------------------------------------------------------------------------801-262
801-269
PROGRAMME OF OPTIONS SPECIFIC TO REMOTE& INSULAR AREAS - FISHERY PRODUCTS
OTHER MEASURES -0,3
5,0 4,1 1,6 10,7
0,0 -0,1 -0,5
---------------~------------------------------------------------------------------------------------------------------------------------------------------------------------------------------------------------------
801-26 EUROPEAN FISHERIES GUAIWlTEE FUND 0,1 1,8 -0,3 0,1 5,2 7,0 1,6 0,1 2,5 0,4 2,7 21,2
~~=~~====;~~====~~~;;:::;;;~========;;::=====;========~==~========:;;;;:~~====~==~~~~=====~=;============~~~~~=~======~======~=~~=========~~~~===~=========;~==:;;~================~=====~~====~=====~================
801-2 357,8 306,5 878,7 195,8 968,0 2.086,8 1.172,3 472,4 5,3 896,2 121,1 156,8 120,1 106,0 1.892,2 9.736,0
-------------------------------------------------------------------------------------------------------------------------------------------------------------------------------------------------------------------------
~
""""

------------------------------------------------------------------------------------------------------~-------------------------------------------------------------------------------------------------------------------
B01-300
801-3010
801-3011
801-3012
! 801-3013
801-3014
801-3019
REFUNDS ON CEREALS EXPORTED IN THE FORN OF CERTAIN SPIRITUOUS BEVERAGES
CEREALS AND RICE
SUGAR AND ISOG\.UCOSE
SKIHHEO HILK AND OTHER MILK PRWUCTS
BUTlER
EGGS
OTHER AGRICULTURAL PRODUCTS
B .
1,1
14,7
15,3
15,0
1,0
-----
EMiGF GUARNHEE EXPENDITURE CHARGED AGAINST THE 1998 BUDGET (EURO HILLION)
OK 0 EL E F !Ill
0,2
1,7 8,5 0,3 1,6 10,3 0,5 4,1
16,5 58,3 4,5 17,3 16,8 5,6 9,2
8,7 28,7 0,6 2,1 22,7 32,8 7,0
4,6 22,3 0,1 0,2 4,8 7,6 2,5
0,9 1,5 0,0 0,4 0,8 o,o 1,0
---- o,o ----- 0,0 0,0 -0,2 0,5
23. !
L NL A p FIN s UK CE JOT
11,4 11,6
----- 16,0 4,1 0,1 1,1 2,3 4,9 ----- 56,6
----- 25,2 10,2 0,8 7,6 5,7 33,1 ----- 225,4
----- 34,2 3,1 0,1 3,0 3,5 10,8 ----- 172,4
----- H,1 1,2 0,2 1,5 0,9 6,3 ----- 82,5
----- 1,6 o,o 0,0 0,1 0,3 0,0 ----- 7,6
----- ----- ----- ----- ---- ----- -0,3 ----- -0,1
----------------------------------------------------------------------------------------------------------------------------------------------------------------------------------------------------------------------! 801-301 REFUNDS ON CERTAIN GOOJS OBTAINED BY 47,2 32,4 119,2 5,5 21,5 55,5 46,4 24,2 ----- 92,0 18,6 1,2 13,3 12,7 54,8 ----- 544·,4
PROCESSING AGRICULTURAL PRODUCTS ! -----------------------------------------------------------------------------------------------------------------------~----------------------------------------------------------------------------------------------! 801-309 OTHER -0,1 0,1 -1,4 0,0 o,o -0,2 -0,3 -0,2 ----- -0,4 o,o 0,0 0,0 o,o -0,5 ----- -3,0
! ---------------------------------------------------------------------------------------------------------------------------------------------------------------------------------------------------------------------
! 801-30 REFUNDS ON CERTAIN GOOJS OBTAINED BY PROCESSING AGRICULTURAL PRODUCTS
47;1 32,5 117,8 5,5 21,5 55,3 46,3 24,0 91,6 18,6 1,2 13,3 12,7 65,8 553,1
--------------------------------------------------------------------------------------------------------------------------------------------------------------------------------------------------------------------------
,.co =<:>

--------------------------------------------------------------------------------------------------------------------------------------------------------------------------------------------------------------------------EAGGF GUARANTEE
EXPENDITURE CHARGED AGAINST THE 1998 BUDGET (EURD MILLION) 24.
----------------------------------------------------------------~---------------------------------------------------------------------------------------------------------------------------------------------------------B ox D EL E F IRL L Nl. A p FIN s UK CE TOT
--------------------------------------------------------------------------------------------------------------------------------------------------------------------------------------------------------------------------
I 801-JlO DISTRIBUTION OF AGRICULTURAL PRODUCTS TO DEPRIVED PERSONS IN THE CDI'IUUIY
3,4 0,4 18,7 42,4 32,0 1,4 52,2 0,0 16,2 I, 9 11,1 186,2
! -----------------------------~----------------------------------------------------------------------------------------------------------------------------------------------------------------------------------------! 801-3110
BDI-Jlll
BOI-3112
BOI-Jll3
BOI-3114
BOI-3119
BDI-Jll
BDI-312
BOI-31l
BOI-314
BOI-315
BDI-m
REFUNDS IN CONNECTION WITH FOOD AID (CEREALS)
REFUNDS IN CONNECTION WITH FOOD AID (RICE)
REFUNDS IN CONNECTION WITH FOOD AID (SUGAR)
REFUNDS IN CONNECTION WITH FOOD AID (MILK POWDER)
REFUNDS IN CONNECTION WITH FOOD AID (BUTTER OIL)
OTHER REFUNDS
REFUNDS IN CONNECTION WITH FOOD AID
SCHOOL MILK
lllNSLMPIIDN AID FOR BUTTER AND FOR THOSE RECEIVING SOCIAL ASSISTANCE
FREE DISTRIBUTION Of FRUITS AND VEGETABLES
FOOD AID ACTION FOR RUSSIA
OTHER
0,7 0,8 o,o ----- -----
----- ----- ----- ----- 6,1
I ,3 ----- 0,3 ----- -----
I,J ----- 1,4 ----- ----
3,3 0,8 1,8 6,1
2,7 3,0 22,5 0,0 5,8
·o,o 0,0 0,4 3,2
0,0 0,0 0,0 -0,1
4,6 ----- 1,4 ----- 0,1 ----- ----- ----- ----- 0,9 ----- 8,5
----- ----- 15,1 ----- ----- ----- ----- ----- ----- ----- ----- 21,1
----- ----- ----- ----- 0,7 ----- ----- ----- ----- ----- ----- 2,3
0,3 ----- ----- ----- ----- ---- ----- ----- ----- ----- ----- 3,0
4,8 16,5 0,8 0,9 35,0
29,6 1,6 4,2 0,1 2,6 1,6 2,1 4,3 9, 7 15,1 104,9
4,0 4,0
0,8 0,1 4,4
0,0 O,D -0,1 0,0 -0,6 -0,9
----------------------------------------------------------------------~-----------------------------------------------------------------------------------------------------------------------------------------------
BOI-31 FOOD AID 9,4 4,2 24,2 19,1 57,4 67,2 7,0 12,9 0,1 3,4 1,6 18,3 6,2 9,7 H,1 JH,7
--------------------------------------------------------------------------------------------------------------------------------------------------------------------------------------------------------------------------
c;;

801-JJO
801-JJl
801-JJl
801-JJJ
B01-JJ4
001-m
801-JJ9
!£FUNDS IN CONNECTION WITH C!HtltliTY fOOl AID (C£REAI.S)
REFUNDS IN CDNNECTION WITH OOIHJtiiY fOOO A!O (RICE)
REFUNDS IN CONNECTION WITH COMMUNITY FOOl AID (SUGAR)
OTHER
REFUNDS IN CDNNECTION WITH COMMUNITY fOOl AID (MILK POOER)
REFUNDS IN CONNECTION WITH COMMUNITY fOOl AID (BUTIERDIL)
OTHER
8
EAGGF GUARANTEE EXPENDITURE CHARGED AGAINST THE 1998 BUDGET (EURD HILLIDN)
OK D EL E F IRL
25.
L NL A p FIN s UK C£ TOT
----------------------------------------------------------------------------------------------------------------------------------------------------------------------------------------------------------------------801-JJ REFUNDS IN CONNECTION WITH COMMUNITY
fOOl AID
--------------------------------------------------------------------------------------------------------------------------------------------------------------------------------------------------------------------------
':;;

! 801-340
BOl-34
~
INTEREST PAYMENTS TO H.S.,AFIER CHANGES IN HEIIIJO Of FINANC.EAGGF GUAR.EXPENO.
INI.PAIO HEHB.SJAI.AS RESULT OF REFORH METHOD USED FINAN.EXP.EAGGF GUARANI.SEC.
•
B
EAGGf GUARANI EE EXPENDITURE CHARGED AGAINST THE 1998 BUDGET (EURO HILLIDN)
ox D EL E F IRL
26.
I L NL A p FIN s ux CE IDI

t -· -·-·-·- -·-·-·-·-·-·
<
§ ~ ~
'i! ~
ii! ::; => !;;
~-~~ -"' ~
~;! ~~ ~.
~~
h ~
~--~ ~ ~
~ < 0 ~
"' ~ ;I; u 0
lli! => -52 w ~ 0
K ~
"'

--------------------------------------------------------------------------------------------------------------------------------------------------------------------------------------------------------------------------
801-3600
801-3601
801-360
801-36
D
MONITORING ANO PREVENTATIVE MEASURES PAYMENTS BY THE MEMBER STATES
MONITORING ANO PREVENTATIVE MEASURES DIRECT PAYMENT BY THE EUROPEAN UNION
MONITORING ANO PREVENTATIVE MEASURES CONCERNING EAGEF GUARANTEE SECTION
MONITORING ANO PREVENTATIVE MEASURES CONCERNING EAGGF GUARANTEE SECTION
•
B
0,5
0,5
0,5
EAGEF GUARANTEE EXPENDITURE CHARGED AGAINST THE 1998 BUDGET (EURO HILLION)
OK 0 El E f IRL
1,6 1,3 2,6 2,2 0,8 2,9
1,6 1,3 2,6 2,2 0,8 2,9
1,6 1,3 2,6 2,2 0,8 2,9
28.
l Nl A p FIN s UK CE TOT
0,1 0,6 0,6 0,2 0,1 1,5 14,9
25,5 25,5
0,1 0,6 0,6 0,2 0,1 1,5 25,5 40,4
0,1 0,6 0,6 0,2 0,1 1,5 25,5 40,4

EoiGGf GIJARNHEE EXPENDITURE CHARGED AGAINST THE 1998 BUDGET (EURO MILLION) 29.
B OK 0 EL E f 1RL L tL A p flN s UK CE TOT
801-370 CLEARANCE Of PREVIOUS YEARS' ACCOUNTS -10,2 -1,5 -21,8 -14,9 -146,3 -102,0 4,6 -270,1 -0,1 -4,5 -1,5 -86,3 -654,8
----------------------------~-----------------------------------------------------------------------------------------------------------------------------------------------------------------------------------------
801-JJ CLEARANCE Of PREVIOUS YEARS' ACCOLIHS -10,2 -1,5 -21,8 -14,9 -146,3 -102,0 4,6 -270,1 -0,3 -4,5 -1,5 -86,3 -654,8
~ ...£'

! 801-3800
601-3801
601-380
601-38
PROHOT10N MEASURES - PAYMENTS BY THE HEI'BER STATES
PROMOTION MEASURES - DIRECT PAYMENTS BY THE EUROPEAN UNION
DIRECT PAYMENTS
PROMOTION HEASURES
8
1,3
1,3
1,3
EAGGF GUARANTEE EXPENDITURE CHARGED A~INST THE 1998 BUDGET (EURO HILLION)
OK 0 El E f IRL
0,4 5,6 0,3 5,3 6,8 0,1 3,3
0,4 5,6 0,3 5,3 6,8 0,1 3,3
. 0,4 5,6 0,3 5,3 6,8 0,1 3,3
30.
l Nl A p fiN s UK CE TOT
0,1 5,6 1,3 0,1 0,3 0,4 4,3 35,4
9,6 9,6
0,1 5,6 1,3 0,1 0,3 0,4 4,3 9,6 45,0
0,1 5,6 1,3 0,1 0,3 0,4 4,3 9,6 45,0
--------------------------------------------------------------------------------------------------------------------------------------------------------------------------------------------------------------------------
~ ..

------------------" - il
~ " " " " 15 "!. .. _
"' :: .. _
- ;!. .. ~ " ~ - ~ " ~ - ' - " .. " :: " " ~ " N
'-' " ~-" " ~ " " " " " ~ .. - ~ " C> ~ ..: 0 ..: " .. -" N ' N " ~ - - " -" " " " ~ ~ .. ":. " " ~-~ ~ " N N " ~ " ::
" " ~ :5 " " ~-~. " " -" " ~ " 0 il N
o" 0 " .; -< C> 0 C> -0 0 0 ..;
N
~ C> C> ~ z 0 0 ' ... " ~ " " :: " ~ " -" Q " " ' " " " " " ~ ~ " N
~ ... " .. " ~ - - " .. ' ' " -~ " ' ~ " i! ~ ~
:: ~ " .. iil ~ .,: .,: " .; " ~ ~ ~ " ~ ~ " ::
~- " ~~ ~ " 0 " ~ -~ :: u 0 o" " .,: :: N
!i .. " ~~ ' " ~ ' " ~- ' ~ - - ' .. !h ' ' 0 0 .,: ' ~- ' ' ' ~
' ' - ' ~ ' z ' ~ ' ~ ' ~ ' ~ .... < ' ' -" ' ~ ' ~ ' = ' l!! ' " - - N ' '-' ' 0 c" ' ~
I!;! ' ' ' N
' -=> ' - ' - ' !i! ' ~ ~ 0 C> ' :: ~ ' 0 .... 0 ..: ~ ' K ' ~ ~ ' ' ' ' ' ' "' " " C> -' o" o" c" .. -' ' ~
' ' ' ' ' ' ' ' ' ' ' ' ' ' : ' ' ' : ' ' ' ' ' ' ' ' ' ' ' ' ' ' ' ' ' ' ' ' ' ' ' ' " ' ' :c ' ' ~ ' ' ' ' ~ ~
' ' = = ' ' :: => ' ' ~ ' ' ~
' ' ~ !I! ' ' ' ' = = ' : ' ' :;; ~ !I! ' ' : ' ' ~ - 15 ' ' < C> ' ' ' ' ' ' ' ' ' ' ' ' ~ ' ' g ~ ' ' ~
' ' ~ ~ ~ ~
' ' ' ' ' ' ' ' - - - -' ' C> C> C> 0 <;b ! ' "' "' "' "' -· ' -· -· -· -· -· -· -· -· -· -· -· -· -·

~-'-11
--------------------------------------------------------------------------------------------------------------------------------------------------------------------------------------------------------------------------EAGGF GUAIWHEE
EXPENDITURE CHARGEO AGAINST THE 1998 BUDGET (EURO HILLION) 32.
--------------------------------------------------------------------------------------------------------------------------------------------------------------------------------------------------------------------------B OK 0 EL E F IRL I L NL A p FIN s UK CE TOT
--------------------------------------------------------------------------------------------------------------------------------------------------------------------------------------------------------------------------
! 801-400 INCOIE AIO 0,0 0,2 0,0 0,4 0,0 0,6
----------------------------------------------------------------------------------------------------------------------------------------------------------------------------------------------------------------------
801-40 INCOIE AIO 0,0 0,2 0,0 0,4 0,0 0,6
====================================================================================================================================================================================================================== BOl-4 0,0 0,2 0,0 0,4 0,0 0,6
--------------------------------------------------------------------------------------------------------------------------------------------------------------------------------------------------------------------------
./') ~

EAGGF GIJARNUEE EXPENHIURE CHARGED AGAINST TIE 1998 BIDGET (EURO HILLIOO) JJ.
8 OK 0 EL E F IRL L NL A p FIN s UK CE TOT
---------------------------------------------------------------------------------------------------------------------------------------------------------·---------------------------------~-----------------~------------
801-500 ACCOHPANnNG IEASURES (FDRHER SYSTEH) 2,1 1S,9 1,2 1,2 B,J 0,0 0,0 0,7 1,1 J0,6
----------------------------------------------------------------------------------------------------------------------------------------------------------------------------------------------------------------------801-5010 EARLY RETIREIENT 5,1 1,6 ----- 10,6 20,1 72,1 62,5 0,8 ----- ----- ----- 5,4 10,7 ----- ----- ----- 208,9
801-5011 ENVIRDNHENT 2,4 8,1 258,J 6,1 54,9 70,5 121,2 120,8 2,1 12,7 m,J 65,6 118,8 101,7 46,1 ----- 1.282,9
·. 801-S012 AFFORESTATION 0,2 J,O 12,1 '13,1 142,6 4,J 10,6 61,9 ----- 1,J 4,4 25,9 6,0 0,0 19,6 ----- 127,5
801-501 ACCOHPANYING HEASURES (NEll SYSIEH) 7,7 12,1 270,6 50,0 211,6 146,9 214,4 185,5 2,1 14,0 217,7 96,9 155,6 101,7 65,9 1.819,J
----------------------------------------------------------------~-----------------------------------------------------------------------------------------------------------------------------------------------------801-509 OTtER -2,1 -0,1 :-0,5 -0,1 0,0 0,0 0,0 0,0 -0,1 -2,9
801-50 ACCDHPANYIIIG HEASURES 7,7 12,7 270,6 65,9 217,5 147,6 215,5 191,1 2,1 14,1 217,7 97,6 155,6 101,7 66,9 1.847,0
====================~=======~===========~=~========================================================~================~~===============~================~========================================~=======~====~========= 801-5 7,1 12,7 270,6 65,9 211,5 147,6 215,5 191,7 2,1 14,1 2l7,7 97,6 155,6 101,7 66,9 1.847,0
~

--·
--------------------------------------------------------------------------------------------------------------------------------------------------------------------------------------------------------------------------EAGGF GUARANTEE
EXPENDITURE CHARGED AGAINST THE 1998 BUDGET (EURD MILLION) 34.
8 DK 0 EL E F IRL L NL A p FIN s UK CE TOT
801-600 MONETARY RESERVE
801-60 MONETARY RESERVE
====================================================================================================================================================================================================================== 801-6
===================================================================================================================~====~~===~=~=~~=~~~~~~~~~~~=~~=~~~~~~~=~=~~~~==~~~~=~======~~~===~=============~========~~~=~~~=~=
801 851,3 1.154,0 5.553,0 2.556,8 5.293,5 9.007,2 1.632,6 '4.129~2 17,4 1.372, T 842,5 6H;o· 575,7 170,1 4.314~2 . 40,} 38.748,1
-------------------------~--------------------------------------------------------------------------------------------------------------------------------------------------------------------------------------------
TOTAL 851,3 1.154,0 5.553,0 2.556,8 5.293,5 9.007,2 1.632,6 4.129,2 17,4 1.372, 7 842,5 637,4 515,7 170,1 4.314,2 40,3 38.748,1
.--Q

ANNEX 2b
EAGGF GUARANTEE SECTION EXPENDITURE BY CHAPTER ANQ 8\' MEMBER SIAJE CHARGED AGAINST THE 1998 BUOGEJ ECU million
8 DK D EL E F IRL I L NL A p FIN s UK EC TOTAL
] 0 AIIAILE CROPI 182,8 684,9 3.927,7 462,4 1.681,6 5.416,5 130,8 1.951,2 . 9,8 218,4 387,8 182,7 264,3 490,8 1.953,6 0,0 17.945,3
11 SUGAR 218,1 73,3 257,1 23,1 74,9 678,6 14,4 185,9 0,0 64,6 30,7 15,2 13,6 19,1 208,0. 0,0 1.776,6
12 OLIY£01t. 0,2 0,1 0,2 546,7 1.092,0 10,0 0,0 582,7 0,0 0,0 0,0 52,6 0,0 0,0 1' 1 1,0 2.266,6
13 DRIED FODDER 0,3 15,7 23,1 3,6 179,4 86,8 0,5 44,8 0,0 15,9 0,2 0,6 0,1 0,4 6,2 0,0 377,6
]4 fllfiE PlANTS AND SUtWORMS 8,8 0,0 2,4 580,4 216,2 40,0 0,0 0,1 0,0 4,5 0,9 0,8 0,3 0,0 15,2 0,0 869,6
]5 ffiUIT AND YEGET AILES 20,8 0,2 15,4 251,2 491,5 294,2 0,0 314,5 0,0 50,8 0,8 62,5 0,1 1,4 16,1 0,0 1.509,5
]6 MODUCTS OF THE VWE.QROWING SECTOil 0,0 0,0 0,7 11 ,6 238,2 195,7 0,0 225,7 0,1 0,2 0,3 26,7 0,0 0,1 0,8 0,0 700,0
17 TOBA«< 3,2 0,0 29,6 366,8 107,4 79,8 0,0 260,0 0,0 0,0 0,7 19,8 0,0 0,0 0,0 4,1 870,3
]8 OTHER PlMT SECTORS Oft f'ROOUCTS 3.4 23,8 20,3 38,9 86,4 41,3 0,2 101,5 0,2 11.4 0,2 14,1 1,8 2,7 7,9 0,0 354,1
TOTAI.T1Tt.E1 437,7 797 9 4.276,6 2.283,6 4.167,6 6.742,9 146,0 3.646,4 10,1 366,8 421,7 364,8 280,1 514,6 2.209,0 5,2 26.669,6
20 Ml.lt AND M .. k I'ROOUCTI 194,7 . 198,8 281,6 -1 '1 14,4 692,4 191,6 95,2 ·0,9 619,4 ·1 '1 2,1 78;3 26,5 225,0 0,0 2.596,8
21 IIEEFNEAL 144,2 73,4 672,0 37,9 410,0 1.166,4 869,8 239,9 6,2 133,0 116,6 82,8 39,0 75,1 1.204,6 0,0 6.160,7
22 ltiEEI'IoEATANDGOAntiEAT 1,0 1,2 35,6 157,6 418,7 156,2 109,3 128,1 0,1 10,7 1,9 51,5 1,8 3,1 457,7 0,0 1.534,5
23 I'IGMIEAT 16,4 22,1 7,7 0,2 61,9 4,2 0,1 8,9 0,0 119,1 3,4 1,4 0,8 0,6 1,2 0,0 238,0
24 EGGS ANDI'OULnmiEAT 1,4 9,2 2,1 0,0 0,9 60,7 0,0 0,3 0,0 13,9 0,0 0,6 0,2 0,1 0,7 0,0 90,1
25 OTHER ANIMAL PRODUCT AID MIEASI.HIU 0,0 0,1 0,2 1,2 66,9 9,8 0,0 0,0 0,0 0,0 0,4 16,0 0,0 0,1 0,4 0,0 95,1
26 FlSHEIIY f'ROOUCTI 0,1 1,8 ·0,3 0,1 5,2 7,0 1,8 0,0 0,0 0,1 0,0 2,5 0,0 0,4 2,7 0,0 21,2
TOTAL nnE Z 357,8 306,6 878,7 196 8 968,0 2.088,8 1.172.3 472,4 6,3 896,2 121 '1 156,8 120,1 106,0 1.892,2 0,0 9.736,0
30 ~I PRODUCTS 47,1 32,6 117,8 5,5 21,6 55,3 46,3 24,0 0,0 91,6 18,6 1,2 13,3 12,7 65,8 0,0 553,2
3 1 fOOD ND IIEfUNDS 9,4 4,2 24,2 19,1 57,4 67,2 7,0 72,9 0,1 3,4 1,6 18,3 6,2 9,7 33,1 0,0 333,8
3 6 MONITOIIMJ AND I'REVSITION 0,5 0,0 1,6 1,3 2,6 2,2 0,8 2,9 0,1 0,6 0,6 0,0 0,2 0,1 1,5 25,5 40,5
37 ClEARANCE OF PREVIOUS YEAJI'S ACCOUJf1"S -10,2 ·1,5 -21,8 -14,9 ·146,3 ·102,0 4,6 -270,1 -0,3 -4,5 0,0 -1,5 0,0 0,0 -86,3 0,0 -654,8
38 PIIOMOTJOM MEASUfiD 1,3 0,4 6,6 0,3 5,3 8,8 0,2 3,3 0,1 5,6 1,3 0,2 0,3 0,4 4,3 9,6 45,0
39 OTfiEfl MEASURES 0,0 1,4 -0,1 0,0 -0,1 0,0 39,9 -16,3 0,0 0,0 0,0 0,0 0,0 24,9 127,7 0,0 177,4
TOTAL nTI.£3 48,1 37,0 1 7,2 11 -59,6 29,5 ,8 -163,2 ·0,1 96,7 22,1 18,2 19,9 47,8 146,0 35,2 494,8
40 -=oNE AID 0,0 0,0 0,0 0,2 0,0 0,4 0,0 0,0 0,0 0,0 0,0 0,0 0,0 0,0 0,0 0,0 0,6
50 ACCOWAICYIWG MfASUIIES 7,7 12,7 270,6 66,9 217,6 147,6 216,6 193,7 2,1 14,1 277,7 97,6 155,6 101,7 66,9 0,0 1.846,9
TOTAL EAOGf GUARAiftU IECTIOll 851,3 1.164,0 6.663,0 2.566,8 6.293,6 9.007,2 1.632,6 4.129,2 17,4 1.372,7 842,5 637,4 575,7 770,1 4.314,2 40,3 38.748,0 EXPENDITURE CHAAGEO AGAINST AI'PfiOI'fiiA liONS CAIUUED OVER 0,0 0,0 0,0 0,0 0,0 0,0 0,0 0,0 0,0 0,0 0,0 0,0 0,0 0,0 0,0 0,0 0,0 TOTAL, INCL. API'IIOf'RIA'hONI CNU11E0 0YE11 861,3 1.154,0 5.563,0 2.556,8 5.293,6 9.007,2 1.832,8 4.129,2 17,4 1.372,7 842,5 637,4 575,7 770,1 4.314,2 40,3 38.748,0
60
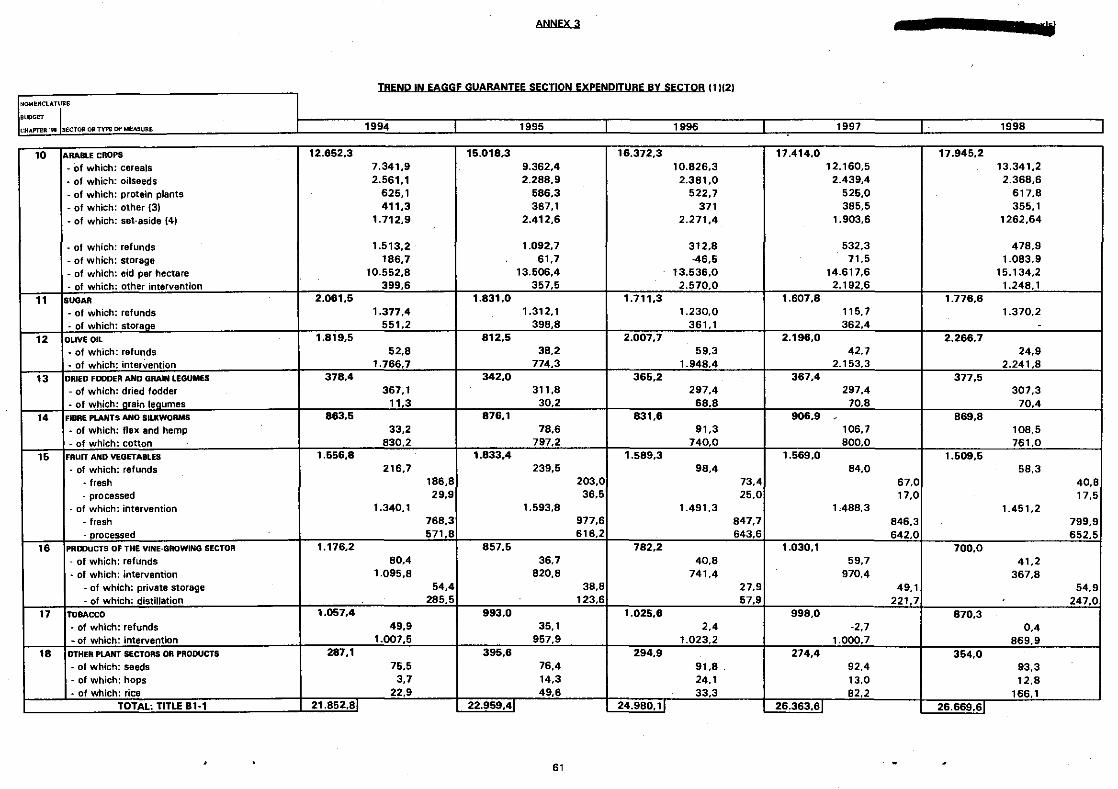
ANNEX 3
lll•nr I!Z ...... 0 I 000 - ... -I ..... ~ ..... TRENn IN E.At:lr:I:E r.:II.AR.ANTEE !I:.Et":TION EYDENniTIIRE RV f:EI'"Tna (1)(2)
NOMENCLATURE
BUDGET J CHAPTER "9t SECTOil Oil TYP£ OF MEASURE 1994 I 1995 1996 I 1997 1998
10 ARABlE CROPS 12.652,3 15.018,3 16.372,3 17.414.0 17.945,2 - Of which: cereals 7.341,9 9.362,4 10.826,3 12.160,5 13.341,2 - of which: oilseeds 2.561,1 2.288,9 2.381,0 2.439,4 2.368,6 I of which: protein plants 625,1 586,3 522,7 525,0 617,8 - of which: other (3) 411,3 367,1 371 385,5 355,1 - of which: set-aside (41 1.712,9 2.412,6 2.271,4 1.903,6 1262,64
I of which: refunds 1.513,2 1.092,7 312,8 532,3 478,9 - of which: storage 186,7 61,7 -46,5 71,5 1.083.9 - of which: eid per hectare 10.552,8 13.506,4 13.536,0 14.617,6 15.134,2 I of which: other intervention 399,6 357,5 2.570,0 2.192,6 1.248,1
11 SUGAR 2.061.5 1.831,0 1.711,3 1.607,8 1.776,6 - of which: refunds 1.377,4 1.312,1 1.230,0 115,7 1.370,2 I of which: storage 551,2 398,8 361,1 362.4 -
12 OLIVE OIL 1.819.5 812,5 2.007,7 2.196.0 2.266,7 - of which: refunds 52,8 38,2 59,3 42.7 24,9 - of which: interVention 1.766,7 774,3 1.948.4 2.153,3 2.241,8
13 ORIEO FDDDER AND GRAIN LEGUMES 378.4 342,0 365,2 367,4 377,5 - of which: dried fodder 367,1 311,8 297,4 297,4 307,3 - of which: grain legumes 11,3 30,2 68,8 70.8 70,4
14 FIBRE PLANTS ANO SILKWORMS 863,5 876,1 831,6 906,9 . 869,8 - of which: flax and hemp 33,2 78,6 91,3 106,7 108,5 - of which: cotton 830,2 797,2 740,0 800.0 761,0
15 FRUIT AND VEGETABLES 1.556,8 1.833,4 1.589.3 1.569,0 1.509,5 I of which: refunds 216,7 239,5 98,4 84,0 58,3
- fresh 186,8 203,0 73,4 67.0 40,8 -processed 29,9 36,5 25,0 17,0 17,5
- of which: intervention 1.340,1 1.593,8 1.491,3 1.488,3 1.451,2 - fresh 768,3 977,6 847,7 846,3 799,9 - orocessed 571,8 616,2 643,6 642.0 652,5
16 PRDDUCTS OF THE VINE-GROWING SECTOR 1.176.2 857.5 782,2 1.030,1 700,0 - of which: refunds 80,4 36,7 40,8 59,7 41,2 - of which: intervention 1.095,8 820,8 741,4 970,4 367,8
- of which: private storage 54,4 38,8 27.9 49,1 54,9 I of which: distillation 285.5 123,6 57,9 221,7 247,0
17 TOBACCO 1.057,4 993.0 1.025,6 998,0 870.3 - of which: refunds 49,9 35,1 2,4 -2,7 0,4 -of whH:h: intervention 1.007,5 957,9 1.023,2 1.000,7 869.9
18 OTHER PLANT SECTORS OR PRODUCTS 287,1 395,6 294,9 274,4 354,0 I of which: seeds 75,5 76,4 91,8 . 92,4 93,3 - of which: hops 3,7 14,3 24,1 13,0 12,8 - of which: rice 22,9 49,6 33,3 82.2 166,1 i
TOTAL: TITLE 81-1 21.852,8 22.959,4 24.980,11 26.363.6T 26.669,61
61

ANNEX 3
TREND IN EAGGF GUARANTEE SECTION EXpENDIJURE BY SECTOR (1)(2) (Contd.)
NOMI!NCt.ATURI! .,,., I iCHAI'TI!R ~ SI!CTOI: 0Jt TYP£ OF NI!A.SUite 1994 I 1995 I 1996 I 1997 I 1998 _j
20 MILK AND MILK PRODUCTS 4.248,8 4.028,7 3.682,0 3.101,2 2.698,7 ~Refunds 1.926,8 2.267,1 1.605,2 1.753.3 1.426,7
• Intervention, of which: 2.322,0 1.761,6 1.976,8 1.347,9 1.170,0
• aid for skimmed lililk 779,2 791,3 749,5 674,5 654,1
• storage of skimmed milk 69,4 -89,0 154.7 29,7 89,8
• storage Of butter 67,6 -40,5. 54,4 21,6 ·22,5
• disposal of butter 669,4 628,5 635,5 606,5 584.0 • financial contribution by milk producers -2,0 -89.4 ·193,7 -546,9 -214,0
• expansion of the market 188,4 127,9 129.0 123,3 8,1
21 BEEF NEAL 3.466.6 4.021.1 6.687,0 6.580.4 5.160,6
·Refunds 1.708,4 1.761,0 1.559,4 1.498,9 774,5
• Intervention, of which: 1.758,2 2.260,1 5.127,6 5.081,5 4.386.1 • public and private storage -209,0 -215,5 620,5 749,6 145,4 • suckler cow premium 882,0 1.046,7 1.512,9 1.521,8 1 .589, 1
• special preinium 656,6 1.407,2 1.238,5 1.340,8
• BSE measures . 957,1 1.022,3 679,1 402,5 22 SHEEPMEAT AND GOATMEAT 1.279,8 1.780,9 1.321,2 1.424,9 1.534.6
·Refunds . . . -0.1 .
• Intervention 1.279,8 1.780,9 1.321,2 1.425,0 1.534.6 23 PIOMEAT 416,3 143.3 124.2 478,8 237,7
·Refunds 259,1 118,2 101,4 72,2 74,5 - Intervention 157,2 25,1 22,8 0,2 . • ExceDtional market suooort measures . 407,0 163.8
24 EGGS AND POUL TRYMEAT 239,6 200.5 138,7 78,7 90,2 ·Refunds 239,6 200,5 138,7 79,5 90.7
-Eggs 26,0 28,6 12,2 8,7 13,6 • Poultrymeat 213,6 171.9 127,0 70,8 77,1
25 OTHER ANIMAL PRODUCT AID MEASURES 117,3 114,7 116,1 94,4 95,1 26 FISHERY PRODUCTS 35.5 39,4 34.1 33,5 21.2
·Refunds 0,0 . . . . • Intervention 35,5 39,4 34.1 33,5 21,2
TOTAL: TITLE 81·2 9.803,91 10.328,6 12.003,31 11.791,9 9.736.01
30 REAJNDS ON CERTAIN GOODS OBTAINED 631,4 574,3 491.1 565.9 553,1 BY PROCESSING AGRICULTURAL
PRODUCTS
31 FOOD AID 0,2 (9) 0,0 0,0 0,0 333,7 32 MONETARY COMPENSATORY . 4,5 0,7 o.o 0,0 0,0
AMOUNTS AND AGRIMONETARY Ato 181 ---·----
62
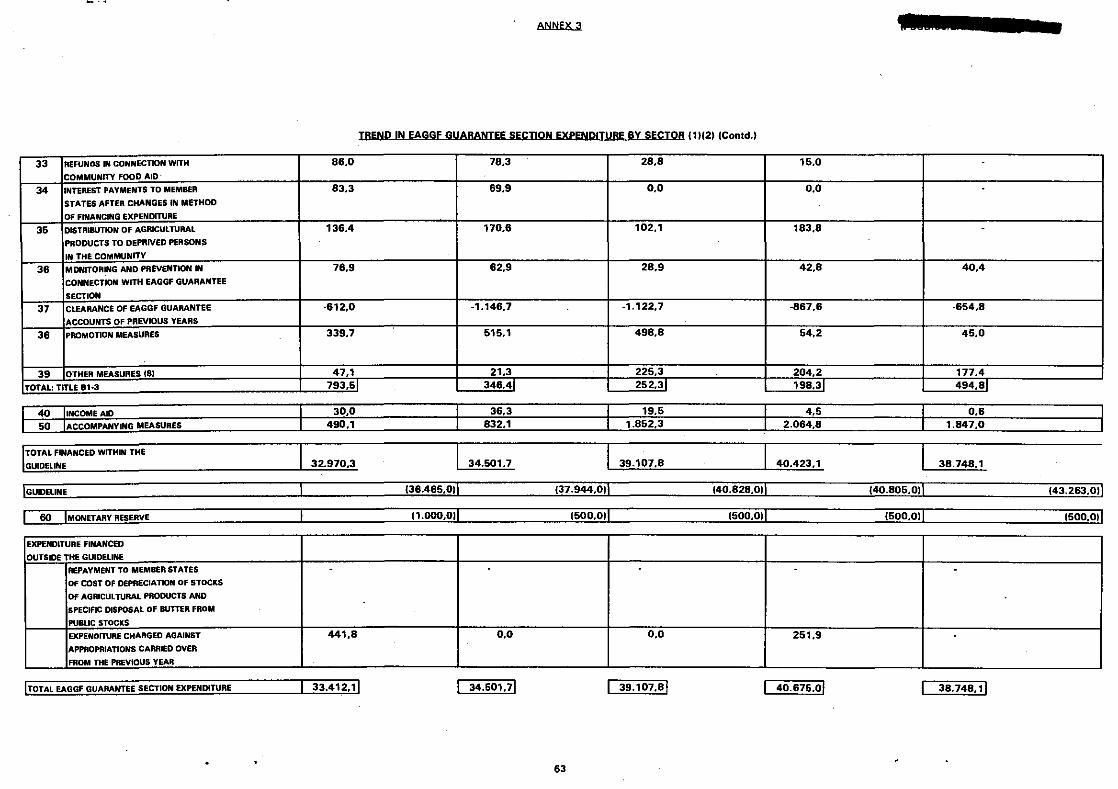
33 REFUNDS IN CONNECTION WITH
COMMUNITY FOOD AID
34 INTEREST PAYMENTS TO MEMBER
STATES AFTER CHANGES IN METHOD
Of FINANCING EXPENDITURE
35 DISTRIBUTK)N Of AGRICULTURAL
PRODUCTS TO DEPRIVED PERSONS
IN THE COMMUNITY
36 MONITORING AND PREVENTK)N IN
CONNECTION WITH EAGGF GUARANTEE
SECTION
37 CLEARANCE Of EAGGF GUARANTEE
ACCOUNTS OF PREVIOUS YEARS
36 PROMOTION MEASURES
39 OTHER MEASURES 181
TOTAL: TITLE 81·3
40 !INCOME AID
50 !ACCOMPANYING MEASURES
TOTAL FINANCED WITHIN THE
GUIDELINE
86,0
83,3
136.4
76.9
-612,0
339,7
47,1 793,5
30,0 490,1
32.970,3
ANNEX 3
TREND IN EAGGF GUARANTEE SECTION EXPENDITURE BY SECTOR (1H2t (Contd.t
78.3 28,8 15.0
69,9 0,0 0,0
170.6 102,1 183,8 -
.
62,9 28,9 42,8 40,4
-1.146,7 -1.122,7 -867,6 -654,8
515.1 498,8 54,2 45,0
21,3 225,3 204,2 177.4 346.4 252,31 198,31 494,81
36,3 19.5 4.5 0,6 832,1 1.852,3 2.064,8 1.847,0
34.501,7 39.107,8 40.423,1 38.748.1
lou,o•u•• 1 136.465.oll 137.94•U>ir- (4o.il2a.oil 140.8o5.oll 143.2&J.ol)
I an 1 .. 1> ................ ., .. ., .... ., I ,,_nnnntl I I I I - 1----···---· .......... I ----1 15oo.o11 15oo.o11 15oo.o11 . -- 15oo.o1l
EXPENDITURE FINANCED
OUTSIDE THE GUIDELINE
REPAYMENT TO MEMBER STATES - - - - -Of COST OF DEPRECIATION OF STOCKS
OF AGRICULTURAL PRODUCTS AND
SPECIFIC DISPOSAL Of BUTTER FROM
PUBLIC STOCKS
EXPENDITURE CHAAGEO AGAINST 441,8 o.o 0,0 251,9 APPROPRIATIONS CARRIED OVER
FROM THE PREVIOUS YEAR -----
(TOTAL EAGGF GUARANTEE SECTION EXPENDITURE -J-33:412, 1 J I 34.5o1,7l I 39.W?;ij] I 4o.m:o] I 3ii.748Jl
63

ANNEX 4: TREND IN EAGGF GUARANTEE SECTION EXPENDITURE BY SECTOR AND IN PERCENTAGE TERMS (1994-19981 (1)(2)
SECTOR OR TYPE OF MEASURE 1994 13) 1995 I 1996 J 1997131 I 1998 ECUm % ECUm % ECUm % ECUm % ECUm %
16.017,3 42.1% 16.372.3 40,7% 17.414,0 42,2% 17.946,2 46,6% 9.362.4 26,3% 10.826,3 26,9% 12.160,5 29,5% 13.341,2 33,9%
IARAILECROPS 12.662,3 37,7% -cereals 7.341,9 21,9% -oilseeds 2.561,1 7,6% 2.288,9 6.4% 2.381,0 5,9% 2.439,4 5,9% . 2.368,6 6,0% -protein plants 625,1 1,9% 686,3 1,6% 522;7 1,3% 252,0 0,6% 617,8 1,6% -others 411,3 1,2% 367,1 1,0% 371,0 0,9% 385,5 0,9% 355,1 0,9% -set-asidel41 1.712.9 5.1% 2.412,6 6,6% 2.271,4 5,6% 1.903 6 4,6% 1.262 6 3,2%
SUGAR
OLIVEDIL
DRIED FODDER
FIBRE PlANTS ,
OTHER PLANT SECTORS
SU8TOTA_!;,,_TITLE 1:
rtGMEAT
EGOS AND I
OTHER ANI
FISHERY
IILK
L TITLE II: NON-ANNEX • PRODUCT!
FOOD AtDCel
DEPREC.,>O:;F,:Bco;" :::0"'-D REFUNOB
ACCOMPANYING MEASURES
SUBTOTAI,!ITLE n1
CDIS~AL
CLEARANCE OF PREVIOUS YEARS'
TOTAL EAGGF GUAit
6,1% 1.831,0 6,1% 1.711,3 4.3% 1.607.8 3,9% 1.776.6 4.6% 1. 812,6 2,3% 2.007,7 6,0% 2.196,0 6,3% 2.266,7 6,8%
~10,.. 1 0 170 342,0 1,0% 366,2 0,9% 367,4 0,9% 377,6 1,0% 863,6 2,6% 878.1 2.6% 831,6 2,1% 906,9 2.2% 869.8 2.2%
1.666.8 4,6% 1.833.4 6,1% 1.689,3 4.0% 1.669.0 3.8% 1.609.6 3.8% 1.178.2 3,6% 867,6 2,4% 782,2 1.9% 1.030,1 2.6% 700,0 1.8~
1.0&7.4 3,1% 993,0 2,8% 1.025,6 2.6% 998.0 2,4% 870,3 2, 287,1 0.9% 396.6 1,1% 294,9 0.7% 274,4 0.7% 364.0 1'),9
22.968,4 64,4% 24.960,1 62.1% 26.363.6 63,8% 26.669,6 6 4.248,8 12.7% 4.028.7 11,3% 3.682,0 8.9% 3.101.2 7.6% 2.696.7 3.466,6 10.3% 4.021.1 11,3% 6.687,0 16.6% 6.680,4 16.9% 5.160.6 1 1.279,8 3.8% 1.780.9 6.0% 1.321,2 3.3% 1.424,9 3.6% 1.534.8 -·-
416,3 1.2% 143,3 0,4% 124,2 0,3% 478,8 1.2% 237,, n -1% 239,6 0.7% 200.6 0.6% 138,7 0.3% 78,7 0,2% 90, 117,3 0,3% 114.7 0.3% 116,1 0 3% 94,4 0.2% 96,1 o. 36.6 0,1% 39,4 0,1% 34.1 0,1% 33,6 0.1% 21,2 o.
9.803,9 29,2% 10.328,6 29.0% 12.003.4 29.8% 11.791,9 28.8% 9.736,0 24. 4 GaL 674,3 1,8% 491,1 1,2% 666,9 1,4% 653,1 'I_A
0,7 0,0% 0,0 0.0% 0,0 0,0% 333,7 0,8 0,0 0,0% 0,0 0,0% 0,0 0,0% 0,0 O,OA.I
78.3 0.2% 28,8 0.1% 16,0 0,0% 0,0 0,0%1 69.9 0,2% 0,0 0.0% o.o 0,0% 0,0 0,0%_]
U_ •~n a n cat. 102,1 0,3% 183,8 0,4% n n n ft(l{.)
339, 1.0%
30,0 0,1% 490.1 1,6%
1.926,7 6.8%
-~12,0
...!.!.._ ~
36, 832.
._-1146
28,91 0,1%1 42,81 0,1%1 4 498, 225,3[ 0,6% 204,2 0,5% 1T 19.6 0,0% 4,6 0,0%
1 .852,~ 4,6% 2.064,8 5,0% 1.847 ~1% 3.135,2 7,8% "JGD.,
·1 122, 39.107,
100,0% I -867,6 40.423,1
·I
__!!,
0,0 4,7 7,2
99,6%1
(1) Expenditure is based on the Member States' claims under advance paymems arrangements and charged against each year in accordance with Article 100 of the Financial Regulation. (21 Expenditure charged from 16 October to 1 5 October of the following year. 131 Not including expenditure using appropriations carried over from the previous year. 141 The expenditure for set-aside has been included in Chapter 10 •arable crops" since 1994; it was previously included in Chapter 40 "set-aside". (51 From 1996, agrimonetary aid is Included in Chapter 39. (6) from 1998, Chapter 31 concerns solely food aid.
64

.
1998 Budget Chapter nomenclature Article
HeadinQ
Arable crops B1-10
Sugar B1-11
Olive oil B1-12
Dried fodder and grain legumes B1-13
Fibre plants and silkworms B1-14
Fruit and vegetables B1-15
Wine B1-16
Tobacco B1-17
Other sectors B1-18
Milk and milk products B1-20
Beef/veal B1-21
Sheeomeat and QOatmeat B1-22
Pig meat B1-23
EQQS and poultrvmeat B1-24
Other animal product aid measures B1-25
Fishery products B1-26
ANNEXS
BREAKDOWN OF EXPENDITURE, BY SECTOR AND ECONOMIC CATEGORY,
IN 1998 (1)
TOTAL (3) Export refunds
ECU million % ECU million
17.945 2 463% 4294
1.776 6 46% 1 265,5
2.266 7 5,8% 24,9
3775 1 0% 0,0
8698 2,2% 00
1.509 5 39% 58,3
700 0 1,8% 41,2
8703 22% 00
354,0 09% 49,6
2.596,7 6,7% 1 426,7
5.160 6 13 3% 774,5 ! 1.534 6 4,0% 0,0
2377 0,6% 74,5
902 02% 90,7
951 0,2% 0,0
~1,~ 0,1% 0,0
65
(3) Intervention (3) (2)
% ECU million %
89% 17 515,8 51,6%
262% 511 1 1 5%
0,5% 2 241,8 66%
0,0% 377 5 11%
00% 8698 26%
1,2% 1 451,2 4,3%
0,9% 658,8 19%
00% 8703 2,6%
1,0% 304,4 09%
29,6% 1 170,0 3,4%
16,0% 4 386,1 12 9%
0,0% 1 534,6 45%
1 5% 163,:;! 05%
1,9% -0,5 0,0%
0,0% 95,1 03%
0,0% 21.2 0.1%1

1998 Budget Chapter
ANNEX 5 (Contd.)
BREAKDOWN OF EXPENDITURE, BY SECTOR AND ECONOMIC CATEGORY,
IN 1998 111
TOTAL (3) Export nomenclature Article refunds
Heading ECU million %
Non-Annex II products 81-30 553 1 14%
Food aid 81-31 3337 09%
Refunds iri connection with Comm. food aid 81-33 00 00%
Reimbursement of interest 81-34 00 00%
Free distribution 81-35 00 00%
Monitoring and prevention 81-36 404 01%
Clearance of previous vears' accounts 81-37 -654 8 -17%
Promotion measures 81-38 450 01%
Other measures 81-39 1774 05%
Income aid 81-40 06 00%
Accompanvina measures 81-50 1.847 0 4,8%
Total EAGGF Guarantee B1 38.748,1 100,0%
(1) Expenditure charged against the 1998 budget. (2) The breakdown of intervention by economic category is shown in Annex 6. (3) The refunds percentage in each sector is calculated in relation to the refunds total;
the intervention percentage in each sector is calculated in relation to the intervention total; and the percentage of expenditure for each sector is calculated in relation to totcil expenditure.
66
ECU million
556,1 .-
350
OLO
00
0,0
0,0
0,0
00
00
00
00
4 826,4
(3) Intervention (3) (2)
% ECU million %
11 5% -2 9 00%
07% 298,7 09%
00% 0,0 00%
00% 0,0 00%
0,0% 0,0 00%
0,0% 404 01%
0,0% -654,8 -1 9%
00% 45 0 01%
00% 177,4 05%
0,0% 06 00%
0,0% 1 847,0 54%
100,0% 33 921,8 100,0%

I I
"'' Bud&ct SECTOR OR TYPE DF MEASURE
c"""' 10 ARABLE CROPS
11 SUGAR
12 OLIVE DIL
13 DRIED FODD£R AND GRAIN LEGUMES
14 FIBR£ PLANTS AND SILKWORMS
15 FRUIT AND VEGETABLES
16 PRODUCTS DF THE VINE-GROWING SECTOR
17 TOBACCO
18 OTHER SECTORS
20 MILK AND MILK PRODUCTS
21 BEEF NEAL
22 SHEEPMEAT AND GOATMEAT
23 PIGMEAT
24 EGGS AND POULTRY MEAT
25 OTHER ANIMAL PRODUCT AID MEASURES
26 FISHERY PRODUCTS
30 NON-ANNEX II
33 FOOD AID
34 REIMBURSEMENT OF INTEREST
35 FREE DISTRIBUTION
36 MONITORING AND PREVENTION
37 CLEARANCE OF PREVIOUS YEARS" ACCOUNTS
38 PROMOTION MEASURES
39 OTHER MEASURES
40 INCOME AID
50 ACCOMPANYING MEASURES
SUBTOTAL
{ 11 Expenditure charged against 1998 budget.
ANNEX 6 BREAKDOWN OF INTERVENTION EXPENDITURE, BY CHAPTER AND ECONOMIC CATEGORY,
IN 1998 111
TOTAL WITHDRAWALS COMPENSATORY AID 121
INTERVENTION STORAGE AND SIMILAR TOTAL I OFWHICH: -~ OF WHICH:
EXPENDITURE OPERATIONS CLASSIC REFORM
17.515,8 1.083,9 0,0 16.441,6 291,3 16.150.4 511,1 349,5 0,0 164,1 164,1 0,0
2.241,8 27,0 0,0 2.163,3 2.163,3 0,0 377,5 0,0 . 0,0 377,7 377,7 0,0 869,8 0,0 0,0 869,8 869,8 0,0
1.451,2 o.o 138,3 851,5 851,5 0,0 658,8 199,3 312,9 131,9 131,9 0,0 870,3 0,0 0,0 787,2 787,2 0,0 304,4 62,2 0,0 242,5 242,5 0,0
1.170,0 140,9 0,0 1.238,1 1.238,1 0,0 4.386,1 145,4 0,0 4.253,4 508,5 3.744,9 1.534,6 0,2 0,0 1.535,0 1.535,0 0,0
163,2 0,0 0,0 0,0 0,0 0,0 -0,5 0,0 0,0 0,0 0,0 0,0
95,1 0,0 0,0 93,7 93,7 0,0 21,2 0,0 10,9 10,8 10,8 0,0 -2.9 0,0 0,0 0,1 0,1 0,0
298,7 0,0 0,0 299,6 299,6 0,0 0,0 0,0 0,0 0,0 0,0 0,0 0,0 0,0 0,0 0,0 0,0 o.o
40,4 0,0 0,0 0,0 0,0 0,0 -654,8 0,0 0,0 0,0 0,0 0,0
45,0 0,0 0,0 0,0 0,0 0,0 177,4 0,0 0,0 0,0 0,0 0,0
0,6 0,0 0,0 0,6 0,6 0,0 1.847,0 0,0 0,0 1.849,9 0,0 1.849,9
33.921,8 2.008,4 462,1 31.310,8 9.565,7 21.745,2 100,0% 5,9% 1,4% 92,3% 28,2% 64,1%
(2) The breakdown of expenditure on intervention-in the form of price compensating aid is shown in Annex 7.
67
ECU million GUIDANCE OTHER
PREMIUMS
0,0 -9,8 0,0 -2,5 0,0 51,5 0,0 -0,2 0,0 0,0
67,3 394,1 15,1 -0,4 84,0 -0,9
0,0 -0,3 5,5 -214,5 0,0 -12,7 0,0 -0,6 0,0 163,2 0,0 -0,5 0,0 1,4 0,0 -0,5 0,0 -3.0 0,0 -0,9 0,0 0,0 0,0 0,0 0,0 40,4 0,0 -654,8 0,0 45,0 0,0 177,4 0,0 0,0 0,0 -2,9
171,9 -31,5 0,5% -0,1%
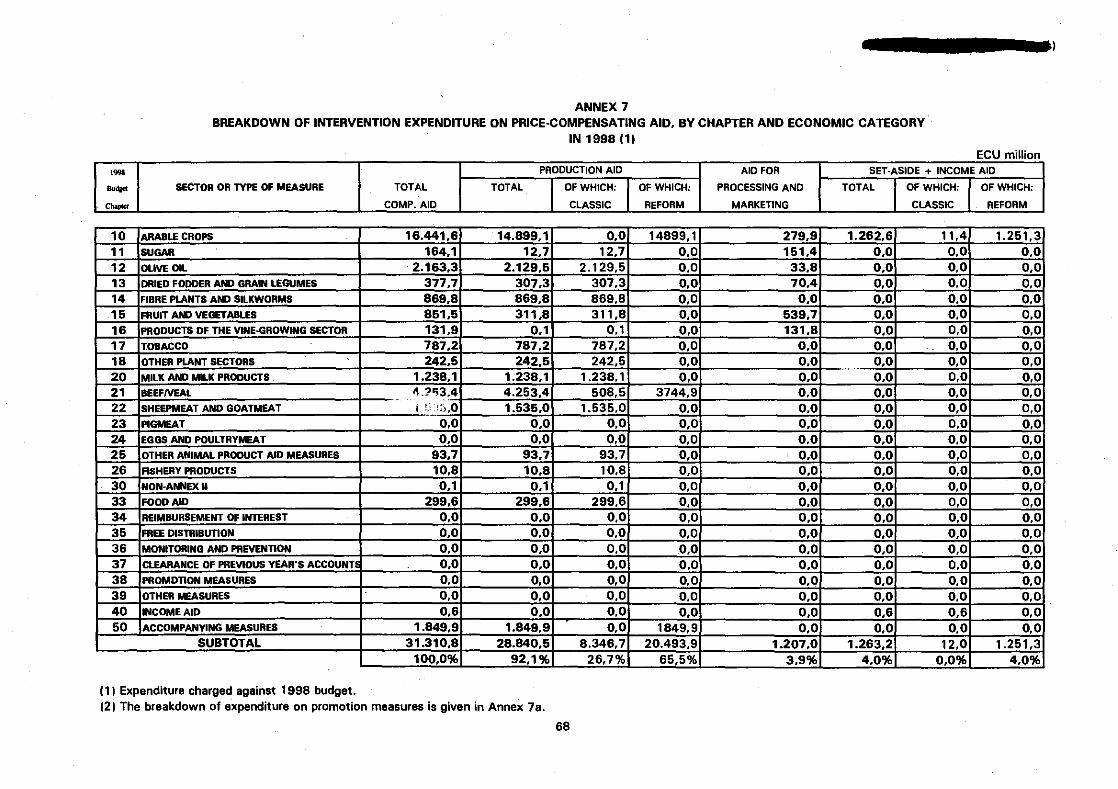
--~
ANNEX 7 BREAKDOWN OF INTERVENTION EXPENDITURE ON PRICE-COMPENSATING AID. BY CHAPTER AND ECONOMIC CATEGORY
IN 1998 11) ECU million
, ... PRODUCTION AID AID FOR SET-ASIDE + INCOME AID ..... SECTOR OR TYPE OF MEASURE TOTAL TOTAL I OF WHICH: I OF WHICH: PROCESSING AND TOTAL I OF WHICH: I OF WHICH:
""'"' -- - COMP. AID CLASSIC REFORM MARKETING CLASSIC REFORM
10 ARABLE CROPS 16.441,6 14.899,1 0,0 14899,1 279,9 1.262,6 11.4 1.251,3 11 SUGAR 164,1 12,7 12,7 0,0 151.4 0,0 0,0 0,0 12 OLIVE OIL 2.163,3 2.129,6 2.129,5 0,0 33,8 0,0 0,0 0,0 13 CRIED FODDER AND GRAIN LEGUMES 377,7 307,3 307,3 0,0 70,4 0,0 0,0 0,0 14 FIBRE PLANTS AND SILKWORMS 869,8 869,8 869,8 0,0 0,0 o.o 0,0 0,0 15 FRUIT AND VEGETABLES 851,5 311,8 311,8 0,0 539,7 0,0 0,0 0,0 16 PRODUCTS OF THE VINE-GROWING SECTOR 131,9 0,1 (J,1 0,0 131,8 0,0 0,0 0,0 17 T.OBACCO 787,2 787,2 787,2 0,0 a.o o.o 0,0 0,0 18 OTHER PLANT SECTORS 242.5 242,6 242,5 0,0 o.o 0,0 0,0 0,0 20 MILK AND MILK PRODUCTS 1.238,1 1.238,1 1.238,1 0,0 o.o o.o 0,0 0,0 21 BEEF NEAL -1.1~3.4 4.253,4 508,5 3744,9 o.o o.o 0,0 0,0 22 SHEEPMEAT AND GOATMEAT i ' :_~;:},0 1.535,0 1.535,0 0,0 o.o 0,0 0,0 0,0 23 PIGMEAT o.o 0,0 0,0 0,0 0,0 o.o 0,0 0,0 24 EGGS AND POULTRYMEAT 0,0 0,0 0,0 0,0 o.o 0,0 0,0 0,0 25 OTHER ANIMAL PRODUCT AID MEASURES 93,7 93,7 93,7 0,0 o.o o.o 0,0 0,0 26 FISHERY PRODUCTS 10,8 10,8 10,8 0,0 0,0 o.o 0,0 0,0 30 NON-ANNEX II 0,1 0,1 0,1 0,0 0,0 0,0 0,0 0,0 33 FOOD AID 299,6 299,6 299,6 0,0 o.o 0,0 0,0 0,0 34 REIMBURSEMENT OF INTEREST 0,0 o.o 0,0 0,0 0,0 o.o 0,0 0,0 35 FREE DISTRIBUTION 0,0 0,0 0,0 0,0 0,0 o.o 0,0 0,0 36 MONITORING AND PREVENTION 0,0 0,0 0,0 0,0 0,0 0,0 0,0 0,0 37 CLEARANCE OF PREVIOUS YEAR'S ACCOUNT! 0,0 0,0 0,0 0,0 0,0 0,0 0,0 0,0 38 PROMOTION MEASURES 0,0 0,0 0,0 0,0 0,0 0,0 0,0 0,0 39 OTHER MEASURES 0,0 0,0 0,0 0,0 0,0 0,0 0,0 0,0 40 INCOME AID 0,6 0,0 0,0 0,0 0,0 0,6 0,6 0,0 50 ACCOMPANYING MEASURES 1.849,9 1.849,9 0,0 1849,9 0,0 0,0 0,0 0,0
SUBTOTAL 31.310,8 28.840,5 8.346,7 20.493,9 1.207,0 1.263,2 12,0 1.251,3 100,0% 92,1% 26,7% 65,5% 3.9% 4,0% 0,0% 4,0% -
11) Expenditure charged against 1998 budget. 12) The breakdown of expenditure on promotion measures is given in Annex 7a.
68
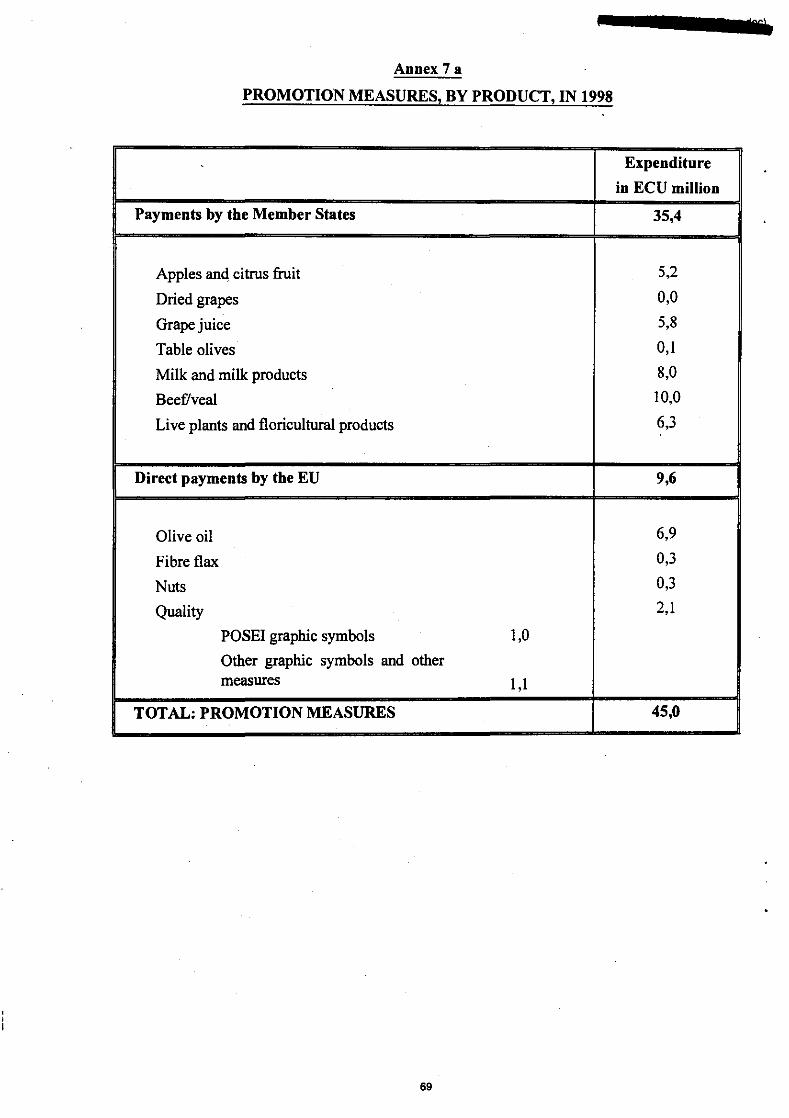
Annex 7 a
PROMOTION MEASURES, BY PRODUCT, IN 1998
Expenditure
in ECU million
Payments by the Member States 35,4
Apples and citrus fruit 5,2
Dried grapes 0,0
Grape juice 5,8
Table olives 0,1
Milk and milk products 8,0
Beefi'veal 10,0
Live plants and floricultural products 6,3
Direct payments by the EU 9,6
Olive oil 6,9
Fibre flax 0,3
Nuts 0,3
Quality 2,1
POSE! graphic symbols 1,0
Other graphic symbols and other measures 1,1
TOTAL: PROMOTION MEASURES 45,0 .
69

""'""'-'
161i81U2W!!I:l!l Qf: t:8DiiE !iJ.IAH811Ut: lli!;;IIQl!llii!U~Iiffi21I!.!Hii III l:i<j;!l~!;lll!lli< Mt:8§!.!81i
1998- ECU miiWon AIO TO (1) MARKET SUPPORT OTHER
PRODUCERS 1998 Chapter Expenditure
Budget Nomenclature Article Export ....... Incentives Marketing and Consumption Miscellaneous Withdrawals and , ... Head ... T01el ....... processing aid ·~ Mke operations -
Arable aoos 81-10 17.945 2 161618 4294 10839 00 2799 ~· 0,0 00 1793.2 -9,8
·- BH1 1.7786 DO 12855 3495 80 1514 00 128 00 1 779,1 -2,5
Olive oi 81-12 2.2fl8.7 19935 24 270 00 33,8 1360 0,0 00 2217 51,5
Dfiad fodde• end""""""""""" 81-13 3775 307.3 00 00 00 70,4 0,0 0,0 0,0 70,4 -02
Fibre Pants and silkworms 81-14 86a8 8698 00 00 0.0 0,0 00 0,0 0,0 M 00
Fruit and BH5 1.5095 3117 583 00 67 3 5397 00 0,0 1383 8037 3941
Wine 81-18 7000 00 41 1993 151 131,8 0,0 0,0 3129 700,3 -0,4
Tobacco 81-17 8703 787,2 00 00 840 00 00 00 0,0 840 -0,9
.,__,_, 81-18 3548 1486 498 8Z2 00 M 0,0 85,8 00 2017 -~
MlkandmilkDIOducts 81-20 2.5967 00 14267 1409 55 00 12381 0,0 00 2 811.2 -21-t5
8aafll<ul 81-21 5.1606 42534 7745 1454 00 00 00 00 00 919,8 -12 7
Sh ............ _ 81-22 1.5346 15348 00 02 00 00 ' 0,0 0,0 00 0,2 -06
!'Jgmea1 81-23 2377 DO 745 00 0,0 00 0,0 0,0 .00 745 163,2
Eggs and POUilrvmeat 81-24 902 DO 907 80 0,0 00 0,0 00 00 907 -0,5
Other animal product aid measures 81-25 951 08 80 00 00 0,0 00 937 00 937 14
F - 81-26 212 80 0,0 00 00 00 0,0 10,7 10,9 21,6 -0 5
Non-Mnex H products 81-30 5531 00 5581 00 00 00 0,0 0,0 0,0 556,1 • 3 0
Food~ 81-31 333 7 00 350 00 0,0 0,0 108,9 1907 00 3346 -0,9
Reimbursement of lnteres1 81-34 00 00 00 op 00 00 0,0 0,0 0,0 0,0 00
Monitorina and DraVention 81-36 404 00 DO 00 00 0,0 00 0,0 0,0 0,0 404
Cleo"""" .. .... B'accoun1S 91-37 -8548 00 8,0 0,0 00 00 0,0 0,0 00 0,0 -654 B
Promotion measures 81-36 450 00 DO 00 0,0 0,0 0,0 00 0,0 00 45.0
Other measures 81-39 1774 00 DO 00 00 0,0 00 0,0 0,0 0,0 177 4
1ncomeaid 81-40 08 06 00 00 00 0,0 00 0,0 0,0 0,0 00
"'"""""' 91-50 1.8470 18498 8~ 00 0,0 00 00 0,0 00 0,0 • 2 9
T Dial EAGGF Guanm1ee Section 81 38.748,1 28 218,7 4826,3 2008,4 172,0 1207,0 1483,0 403,8 462,1 10 562,6 -31,2
100,00% 72.82% 12,4Mio 5,18% 0,44'MI 3.11% 3,83'ltl 1,04% 1,19% 27.26'MI -0,08%
" - --- ----·· --
(I) M..., produtllon aid but also includ" I«M lranlival and pn:alling -'d ...,.... tlley .. pilld dim:tly to the pnlducars. Since this bNikdoWn Is biMCI on the aid reciP*I!. I«M .ubtol1lt (._ 9- for lncentlviS) dlll'er fn:JrrlltloN In AnneKeS 6 lnd 7.
70

ANNEX 9
TREND IN EXPENDITURE BY SECTOR AND THE ECONOMIC NATURE OF THE MEASURE !1994-1998)
SECTOR OR TYPE OF MEASURE 1994 1995 1996 1997 1998
ECUmillion % ECUmillion % ECUmillion % ECU million %(2) ECUmillion
Total expenditure 32.208,7 too,o•;. 34.007,9 lOO,Oo/o 37.659,7 100,0% 40.423,0 Joo,o•;. 38.748,1
Refunds 8.160,5 25,3% 7.802,2 22,9% 5.705,0 15,1% 5.883,9 14,6% 4.826,3
Intervention 24.048,2 74,7o/o 26.205,7 77,1% 31.954,7 84,9% ' 34.519, I 85,4% 33.921,8
Arable crops Jl.702,1 39,4°/o 15.054,8 44,3o/o 16.385,4 4J,s•;. 17.414,0 ·43,1% 17.945,2
Refunds (I) 1.571,6 19,3% 1.129,3 14,5% 320,2 5,6% 532,3 9,0% 429,4
Intervention 11.130,5 46,3% 13.925,5 53,1% 16.065,2 50,3% 16.881,7 48,9% 17.515,8
Sugar . 2.044,4 6,3% 1.817,9 5,3% 1.698,8 4,5o/o 1.607,8 4,o•;. 1.776,6
Refunds (I) 1.378,1 16,9% 1.314,0 16,8% 1.231,6 21,6% 1.115,7 19,0% 1.265,5
Intervention 666,3 2,8% 503,9 1,9% 467,2 1,5% 492,2 1,4% 511, I
Olive oil 1.811,7 5,6°/o 806,0 2,4°!. 2.002,0 5,3% 2.196,0 5,4'Yo 2.266,7
Refunds 52,8 0,6% 38,2 0,5% 59,3 I ,00/o 42,7 0,7% 24,9
Intervention 1.758,9 7,3% 767,8 2,9% 1.942,7 6,1% 2.153,4 6,2% 2.241,8
Milk products 4.240,7 13,2% 4.030,1 1J,9•!o 3.585,0 9,5%. 3.101,2 7,7'/o 2.596,7
Refunds (I) 1.949,2 23,9% 2.290,2 29,4% 1.615,8 28,3% I. 753,3 29,8% 1.426,7
Intervention 2.291,5 9,5% 1.739,9 6,6o/o 1.969,2 6,2% 1.347,9 3,9% 1.170,0
Beef/veal 3.466,5 10,8% 4.017,6 1 J,80fo 6.691,4 17,8%. 6.580,4 ]6,3% 5.160,6
Refunds 1.708,4 20,9% 1.761,0 . 22,6% 1.559,4 27,3% 1.498,9 25,5% 774,5
Intervention I. 758, I 7,3% 2.256,6 8,6% 5.132,0 16,1% 5.081,5 14,7% 4.386,1
Other products or headings 7.943,3 24,7o/o 8.281,5 24,4°!. 7.297,1 19,4°/o 9.523,6 23,6o/o 9.002,3
Refunds (I) 1.500,4 18,4% 1.269,5 16,3% 918,7 16,1% 941.0 16,0% 905,3
Intervention 6.442,9 26,8% 7.012,0 26,8% 6.378,4 20,0% 8.582,4 24,8% 8.097,0 ----
(I) Including refunds in connection with food aid operations (Chapter B1.33) up to and including 1996. With effect from 1997, the refunds are included in "Other products or headings".
(2) The percentage ofrefunds for each sector is calculated in relation to the total refunds and the percentage of intervention for each sector is calculated in relation to total intervention.
71
··--
%
100,0%
12,5%
87,5%
46,3%
8,9%
51,6%
4,6%
26,2%
1,5%
5,8%
0,5%
6,6%
6,7°/o
29,6%
3,4%
13,3o/o
16,0%
12,9%
2J,2%i
18,8%
23,9%

---
1.000 I 1 .000 t 1 .000 I
~ ~ "' "' ~
"' w -"' 0 0 "' ~ 0> ClO 0 ~
U1 U1 U1 0 0 0 8 8 0 0 0 0 0 0 0 0 0 0 0 0 0 0 0 0 0 0 0 -1 0 0 0 8 0 OCT.
I 'TD ::0 0 0 0 0 OCT.
+ m OCT -+
+ z
NOV. : r.;>· NOV 0
+ 'l . Ill ~ ' ' z NOV. -- .. - ... ·-.- -- ~- .... : m ' ' :a ' ' ?< ' '
' ' m 0 m - DEC. DEC ! > !I! ~ c X . -- ;, -- .. ; ... '- ~-- -.- i ID - c )> DEC. ID ID : I "' ID :, 3: z "' :::! ID
~ JAN, --:- ...... c JAIJ r . . .. , ~
~ ID
? :0: :::! "' JAN. - - . ~ ..... -:. - - - . {. -- .. ; c: z z ~
: :a m z
~ m FEB ..... c: m FEB r -·-------: G) en m FEB ..... ~ . . . . . ~ ?< r 3: ?< 0 z >< m - :~ :::: 0 z II?< ID -....
MARCH ID MARCH r···· 3: "' ID :J: -1 MARCH .... ID
3: - ---········· < . \ s .... m ID
+ 0
ID
+ ::0 .... APR APR r -'------:-·- z <
+ APR ..........
:::: m m z ?< m :J: -1 MAY --.---- ?< MAY m 0
m MAY . . . . . ~ --.-.: - ?j ?< ID -~: z ID ID - "' JUNE ID JUHE _:_··-J-. en ID JUNE ··----: "' -1 ID
·,_ : 0 "' 0 JULY ... JUL i ··•····
""l .... : .. ,
" en AUG . .j.tj( ' .... ........ ; I I AUG. ill ··It·· .· ....... ; I I AIJi, ~· . · · J sw 1.0··' ; ............ ····' I I SEP. 0 Iii: ·· .... ....... I I SEP J · : ··

1 .000 t. 1 .000 t. ~ "' w ~ U1 0>
1 .000 t. ~ ~ "' "' w 0 0 0 0 0 0 0 0 U1 0 U1 0 U1 OCT •-+ "' ~ 0> (X) 0 0 0 0 0 0 --l 0 0 0 0 0 0 0 0 0 0 0 ::0 0 0 0 0 0 OCT ---- -t-- --t-----+---1 m
llfJV Ill . . ' . . ' I I OCT. ijt I I I I z ,_-- --r ----------------•-y• ··-;
0
NOV HO\J z DEC. ill · - - ~ - - - - - - :_ - - - - - _:_ - - - - - -: I I 0
I+ DEC •• ,,L c
DEC )> JAil ill ... -- ~ - - - - -: - - - - - _,_ - - - - - ~ - - - . - ~ I I ·z
m --l )> ?< JAN JAI·I =i
rn + iii z + · FEB z "'
liJ en m "' FEB. FEB []] "' z >< m ... .... II~ MARCH ? ?< z :... "' MARCH MARCH --l
"' m N
"' m
"' ::0 -APR X ... "' "' APR < "' APR
? ? - m "' z U~r "' ::! .... MM 1.1~1 m 0 m
+ X ?< z JUII[ JUliE JUIIl en m "' --l "' "' "' ?< .... 0 .... JUL·1· JULY
+ () JIJL I
+ "' "' "' en CD AUG. AUG m AU[, m ?< ?< SEP . ...,. - ...
I 11~ 1 :,u· "' sw "' CD


:;: 0 0 0
ANNEX9.2
TREND IN QUANTITIES IN INTERVENTION STOCKS
iouvE OILI
100 T ···· · · i
80 + I I 60 -t-
40~1-·~~----~····-··-.·~~~.-~~f.~--
!-+-ex. 1996 -o-ex. 1997 --ex. 1998 i
75

0!
lj(]
1.000 hi.
_._NNWW Ulgu.ou.gu.
o8o888o8 +
+l IICJV •·
~I (
ANNEX9.4
TREND IN QUANTITIES IN INTERVENTION STOCKS
250 T ········· · ·
200 l. .. ... . '
- 150 L ........... . 0 0
~ 100 + : 50 .;._
.~ ~
z '-" ~
!MILK POWDER!
~ I ~ ··.:(
(i:' Q_
"' ~ ~-
4
"' 1----EX. 1996 -o- EX. 1997 -+-EX. 1998 I
z ~
I "' "' u Q_ ~ ~ 4
"' 1----EX. 1996 -D-EX. 1997 -+-EX. 19981
77
-
~
c
~ '"

1.000 t. 1 .000 t. 1 .000 t.
~- ~ "' "' ~ "' "' -1> U1 0 U1 0 U1 -.-NNWW..J:%1. 0 0 0 0 0 0 0 0 0 0 UIOtnOUlOUIO
0 0 0 0 0 OCT. ---1 000000000 OCT 1•-t-1;1 I ' I : OCT -+ I - t ·-1 t---i -1
: : ;o
+ IIOV '. m
+ f . c
••
-----, z NOV I .. m
+ N1)V
0 llO m 0 m
DEC ........ z ?< DEC ..... z X m DEC m X 0 c ID c ID llO ID JAil. )> ID JAN. ' ... i. "' ID JAil z "' m ID -1 m ? c "' llO
l> ? .., m =i
FEB . : ... : ... m ? m z FEB .... z llO FEB .., m z m m 0 0 rn m X 0 ?< z m l> ><
II~ l> MARCH ...... , ... I· m ?< z ..... MARCH : ..... :Jl ~··· c I.IARCH :Jl ...
"' 0 ID 0 z "' ID ID ID l> .... llO ID l> -1 .... m ID Ill m .... APR , ...... Ill
t APR. ,, m .... .UF·F: Ill ~ ;::; t m ..,
t m m p m MAY ........... ,, .. z m MAY I ~ c: ?< M.~-~ -1 ?< m
~-···· < ?< 6
ID l> ID ..... : .. z JUliE
,... ID JUliE JUliE · ID m co ID rn co ID z co -1 -1 ····~·
- 0 JUU + ill: i Jt: ' JULY ·I :· ... JIJl.r (')
"' rn
AUG.+ ··1 ! :UGt\!r·
~.I)(;
SEP .i .... : ... - : __ ~EP · ··· ··· · ·· iEP
---------· -------··- ··---. . -- ---- - -- ---- - ------ ------

ANNEX 9.5 !2/21
TREND IN QUANTITIES IN INTERVENTION STOCKS
jMEAT: TOTAL IN CARCASE EQUIVALENT'
800 T ···· ·
il :~~ t:t:::::U ~u ~ • i ret=i
~ 20~ t UU.uuu~ • • U~~U -::: 7 • • ,_,
~ "' ~ c c to I
&: ~
= •c ~ -
~ ~
~
~ 2 - "i" -"
1-+-EX. 1996 -o-EX. 1997 --EX. 1998!
79

ANNfX 10a
BAfAKDOWN Of INTfRYfNDON FXpfNDITI!Rf IN IHf fORM Of STOAAGf COSTS
(19981
PUBLIC STORAGE
PRODUCT TOTAL TOTAL TOTAL Difference
PRIVATE PUBliC Technical Financial between buying STORAGE STORAGE STORAGE costs costs in price and
seiling price a- b + c • c • d+e+f+ d • I
CEREALS 1.083.94 0,00 1.083,94 131,78 28,27 45,24 BREADMAKINO COMMON WHEAT 118.06 118,06 19,25 3,51 5,02 FODDER WHEAT 0,00 0,00 0,00 0,00 0,00 DURUNWHEAT 0,00 0,00 0,00 0,00 0,00 BARLEY 686,21 686,21 78,40 15.62 23,29 m 228.9!5 228,95 31.57 .... 13.36 MAllE IIIII' llllirl:(ia.:l. _, 47.47 47.47 7.34 1,06 2.92 SOJ.OHUM 3,26 3,26 0,22 0,03 0,64 TRJTJCALE 0,00 0,00 0,00 0,00 0,00
RICE 62.21 0,00 62,21 6,35 2,10 -- l0.13)
6UOAR ...... 349,48 0,00
OLIVE OIL 27,01 0,91 26.09 4,27 0,43 (4.531
OILSEEDS 0,00 0,00 o.oo
Flllftf FLAX AND HEMP 0,00 0,00 0,00
FRUIT AND VEGETABLES O.o4 0,04 0,00
VINE-GROWING SECTOR PRODUCTS/ALCOHOL 199.29 54.92 144,37 2.82 0,07 18.60
TOBACCO 10,131 0,00 10.131 0.01 0,00 (0,141
MILK PRODUCTS 140,87 815,73 45,14 7,04 5,04 191,641 SKIMMED MILK 89,76 0,00 69.76 5.85 4.61 (45,361
IBUlTER AND CREAM 122.661 22.08 144,821 1,19 0,42 146.281 CHEESE 73,66 73,66 0,00 0,00 0,00 0,00
BEEFIYEAL 14&,38 (0.00) 146.38 127.37 15.38 (121, 721
SHEEPMEAT AND OOATMEAT 0,20 0.20 0,00
PIGMEAT 0,00 0,00 0,00
FISHERY PRODUCTS 0,00 0,00 0,00
TOTAL 2.008.27 601,27 1.507.00 266.63 61.30 1154.331
IH Sugar aterage costs ara covered by charging storage levies to augar manufacturers. 121 ECU 0.021 millien storage and ECU 0,016 million for compensatory aid to cover tosses on sales of goods in private sterage. (31 The amounts of the depreciation break dawn es follows: public a•caho! !Art 391 Mived etrphg! !An 35136 I
Losses on sales ECU -0.14 million ECU 18,74 million Depreciation ECU -1,28 million ECU 124,16 million
80
IECU million)
DEPRECIATIONS Total Depreciation Additional
depreciation on purchase depreciation
• h +I h I
873.66 276,37 597.29 90.27 0,00 90.27
0,00 0,00 0,00 10.001 0,00 10.001
668,90 192,13 376,77 176,98 66.15 109,82
36,15 16,91 19,24 2,36 1.18 1,18 o.oo 0,00 0,00
51,89 25,18 26,71
11)
25,92 25,92 0,00
12)
122.88 107,87 15.00 131
0,00 0,00 0,00
124,70 95,07 29.64 124.66 95,04 29,62
0,04 0,02 0,02 o.oo 0,00 0,00
124,35 62.83 61,52
1.323,40 593.24 730,16

ANNEX 1Qb
QUANTITY AND VALUE OF PRODUCTS IN pUBLIC STORAGE (Including additional depreciation at the end of the year}
••--••••-•••OJo_rv,rHVLJeii.XIl5J
(1} Regulation (EEC) No 2776/88 provides that 2nd category expenditure to be daimed for a given year is to be calculated on the basis of the operations carried o"ut during the period from October of one year to September of the next year. (2) The value expressed in ecus has been obtained by applying to the canyover value in national OJrrency the budgetary rates valid for the conversion of expenditure in September. (3) Quantity in "carcase equivalenr•.
61
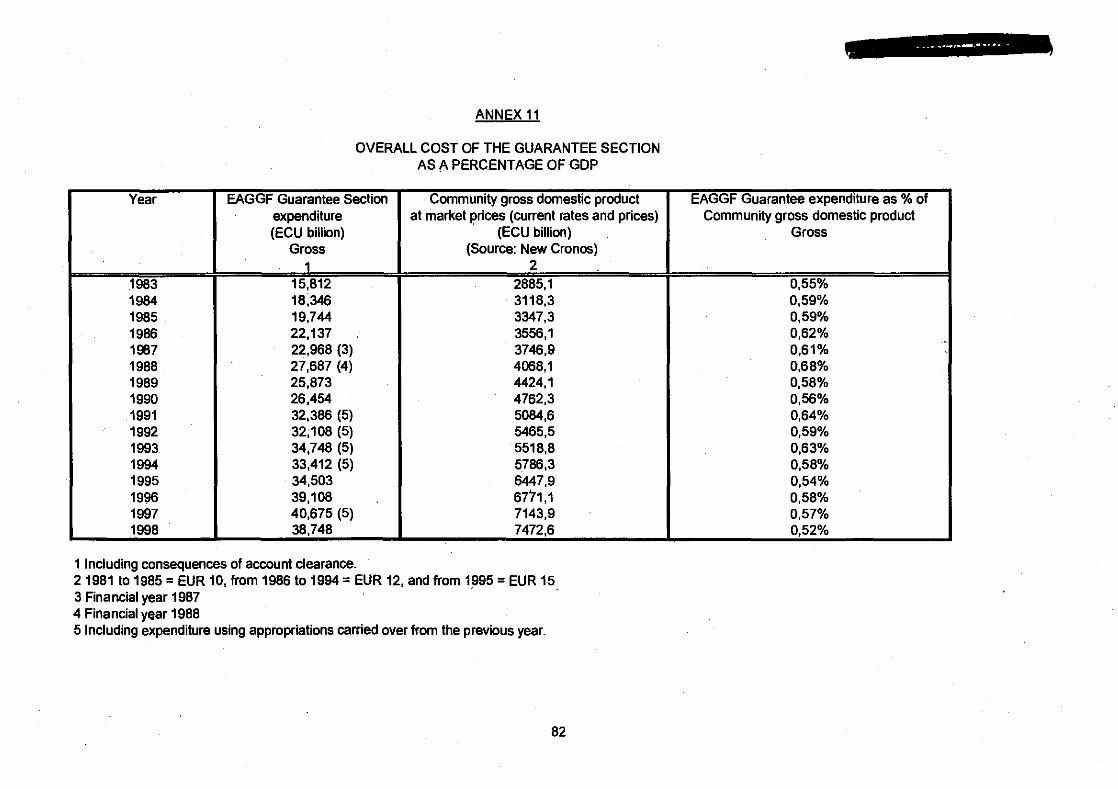
Year
.1983 1984 1985 1986 1987 1988 1989 1990 1991 1992 1993 1994 1995 1996 1997
L___ 1998 --
ANNEX 11
OVERALL COST OF THE GUARANTEE SECTION AS A PERCENTAGE OF GOP
EAGGF Guarantee Section Community gross domestic product expenditure at market !)rices (current rates and prices) (ECU billion) (ECU billion)
Gross (Source: New Cronos) 1 2
15,812 2885,1 18,346 3118,3 19,744 3347,3 22,137 3556,1 22,968 (3) 3746,9 27,687 (4) 4068,1 25,873 4424,1 26,454 4762,3 32,386 (5) 5084,6 32,108 (5) 5465,5 34,748 (5) 5518,8 33,412 (5) 5786,3 34,503 6447,9 39,108 67'71 '1 40,675 (5) 7143,9 38,748 7472,6
1 Including consequences of account clearance. 2 1981 to 1985 = EUR 10, from 1986 to 1994 = EUR 12, and from 1995 = EUR 15_ 3 Financial year 1987 4 Financial year 1988 5 Including expenditure using appropriations carried over from the previous year.
82
- --- ~·-··-. -· ·--
EAGGF Guarantee expenditure as % of Community gross domestic product
Gross
. I
0,55% 0,59% 0,59% 0,62% 0,61% 0,68%
!
0,58% 0,56% 0,64% 0,59% 0,63% 0,58% 0,54% 0,58% 0,57% 0,52%

Sugar year Total levies (ECUA)
·.
1968/69 64.844.437,00
1969/70 65.226.052,11
191onl 69.029.052,44
1971nl 97.151.231,54
1972n3 91.067.000,23
1913n4 101.755.638,48
1974/75 104.267.684,38
1975/76 109.434.959,31
1976/77 201.167.705,31
1977178 233.088.196,54
1978179 248.919.064,38
1979/80 239.233.167,49
1980/81 326.426.745,59
1981/82 407.407.510,45
1982/83 478.721.551,25
1983/84 448.951.270,25
1984/85 482.847.710,50
1985/86 476.418.365,75
1986/87 499.294.692,00
1987/88 515 128.980,00
1988/89 446.395.404,00
1989/90 369.741.405,00
199<1'91 326.924.630,00
1991192 327.981.152,50
1992193 363.584.997,50
1993/94 422259.001,50
Cumulative balance after application of correction coefficient: 1,207509
1994/95 498.156.026,44
1995/96 503.148.690,62
1996/97 351.569.004,45
1997/98 287.754.914,00
(a) %of31Uluallevies. (b) %of cumulative annual levies.
ANNEX 12 EQUALISATION OF STORAGE COSTS FOR SUGAR
(COMMUNITY SUGAR)
Total reimbursements Annual balance (ECU A)
Absolute % (ECU A) (a)
63.916.054,19 + 928.382,8 I + 1,43 69.848.500,70 -4.622.448,59 -7,09
65.111.106,99 +3.917.945,45 + 5,68 92.680.1 8~23 +4.471.043,31 +4,60 90.747.372,33 + 319.627,90 +0,35
92.645.695,20 + 9.109.943,28 +8,95
97.929.484,41 +6.338.199,97 +6,08 160.690.227,31 - 51.255.268,00 -46,84
184.974.131,36 + 16.192.974,01 +8,05
230.545.532,13 + 2.542.664,41 + 1,09 239.524 266,97 +9.394.797,41 + 3,77
251.107.813,79 - 11.874.646,30 -4,96
316.364.823,82 + 10.061.921,77 +3,08 432.958.350,12 -25.550.839,67 -6,27
540.741.184,20 - 62.ot9.632,95 -12,96
465.584.257,59 - 16.632.987,34 - 3,70
407.810.922,63 + 75.036.787,87 + 15,54 435.699.775,44 +40.718.590,31 +8,55
486.190.964,26 + 13.103.727,74 +2,62
414.782.452,98 +100.346.527,02 +19,48 387.536.408,70 + 58.858.995,30 + 13,19
349.139.582,88 + 20.601.822,12 + 5,57
401.522.684,68 -74.598.054,68 - 22,82
428.564.113,44 -100.583.020,94 - 30,87
441.556.864,32 -77.971.866,82 -21,45
443.272.115,52 -21.013.114,02 -4,98
399.102.189,12 + 99.053.837,32 + 19,88
358.534.045,35 + 144.614.645,27 + 28,74
357.676.770,78 -6.107.766,33 - I, 74
346.223.687,08 -58.468.713,08 + 20,32
83
Asat31.1.1998
Cumulative balance Duration of storage (months)
Absolute % (ECU A) (b)
+ 928.382,8 I + 1,43 5,63
-3.694.065,78 - 2,84 6,13
+ 223.879,67 + 0,11 5,38
+ 4.694.922,98 + 1,58 5,94
+ 5.014.550,88 + 1,29 5,81
+ 14.124.494,16 + 2,89 4,80
+ 20.462.694,13 + 3,45 4,64
-30.792.513,87 - 4,38 6,24
- 14.599.599,86 - 1,62 5,99
-12056.935,45 - 1,06 5,84
- 2.662.138,04 - 0,19 6,35
- 14.536.784,34 • 0,89 6,17 -4 474 862,57 - 0,23 6,09
- 30.025.702,24 - 1,27 6,50 -92.045.335,19 - 3,24 7,62
-108.678.322,53 - 3,31 1,13
- 33.641.534,66 - 0,89 6,11
+ 7.077.055,65 + 0,17 7,33
+20.180.783,39 + 0,43 7,35
+120.527.310,41 + 2,29 6,57 +179.386.305,71 + 3,14 6,20 +199.988. 127,83 + 3,29 5,90
+ 125.390.073,15 + 1,96 5,90 + 24 807.052,21 + 0,37 6,28 -53.164814,61 - 0,75 5,84 -74.177.928,63 - 0,99 7,07 -89.570.516,42
+ 9.483.320,90 +0,10 6,04
+ 154_097.966,17 + 1,53 5,13
+ 147.990.199,84 + 1,42 6,06
+ 89.521.426,76 + 0,84 6,33

Annex 13
REVENUE FROM LEVIES IN THE SUGAR SECTOR
1998
(As at 31.1.1999)
BUDGETARY AMOUNT IN ECU (B) HEADING TITLE
110 Sugar production levies (1) 777.328.450
112 Jsoglucose production levies(') 6.411.990
115 Inulin syrup production levy (') 2.775.264
116 Additional levy (') (- 54.154) -
Ill Sugar storage levies 283.284.764
113 Amounts charged on production of C sugar, inulin syrup C 42.940 and C isoglucose which is not exported.
114 Amounts charged on substituted C sugar and C isog1ucose 288.091
TOTAL REVENUE: BUDGET CHAPTER II 1.070.077.345
(') Basic production levies and B levies pursuant to Article 28 of Council Regulation (EEC) No 1785/81
(') Additional levy to ensure, pursuant to Article 28(a) of Regulation (EEC) No 1785/81, that producers fully cover the costs of disposing of the Community's surplus production of sugar, isoglucose and inulin syrup
84

ANNEX 14 SELF-FINANCING ARRANGEMENTS IN THE SUGAR SECTOR (1)(2)(3)
IN 1995/1996, 1996/1997 AND 1997/98 (EU 15)
MARKETING YEAR
1995/96 1996/97
Tonnes Tonnes
A. EXPENDITURE BORNE BY COMMUNITY PRODUCERS
OF SUGAR AND ISOGLUCOSE
I. Production of A and B sugar, A and B isoglucose and A and B inulin syrup 14.558.869,3 14.642.379,7
2. Quantity of sugar, isoglucose and inulin syrup disposed of for consumption 12.685.776,6 12.974.074,3
inside the Community
3. Surplus borne by Community producers (1-2) 1.873.092, 7 1.668.305,4
ECU (A )It ECU (A )It
4. Average Joss per tonne 433,70 430,18
ECU (A) ECU(A)
5. Overall loss for marketing year borne by Community producers (3x4) 812.360.304 717.671.617
Cumulative adjustment resulting from the correction of lines (1-4) -120.786.798 + 35.551.465
6. Total overall loss 691.573.506 753.223.082
ECU (A) ECU(A)
B. LEVIES COLLECTED
7. Basic production levy 181.782.808 182.843.189
8. B levies 509.790.698 570.379.893
9. Additional levy 0 0
10. Total levies 691.573.506 753.223.082
(I) Application of Articles 28 and 28(•) of Council Regulation (EEC) 1785181. (2) All the quantities are txpmsed as white sugar(Al8ar). cbym1tter(i5oglucosc) or dry maacr equivalent sugarlisoglucose (inulin 5)1Up).
1997/98
Tonnes
14.859.737,3
13.070.890,8
I. 788.846,5
ECU (A )It
427,42
ECU(A)
764.588 771
+ 20.916.226
785.504.997
ECU(A)
185.585.054
599.919.943
0
785.504.997
(l) Situation as a1 the fixins. ill October 1998, of the amounts of the levies £or the 1997198 marketing year (Commission Regulation (EC) No lllVJB). (4) Including ECU 1.521.220 (ECU 1.259.800multiplicdbyacom:ction £actoro£1,207S09)from the quot1 urangemems for 1986/1987 to 199011991 and ECU 62.797.887 from lbe quota anangements £or 1991/1992 to 1994/1995.
85
Aggregate 1995/96-1997/98
Tonnes
44.060.986,3
38.730.741,7
5.330.244,6
ECU (A)/t
-ECU (A)
2.294.620.692
-64.319.107 (4)
2.230.301.585
ECU (A)
550.211.051
1.680.090.534
0
2.230.301.585

ANNEX 1S. ARABLE CROPS • APPLtcATIONS FOR AID PER HECTARE 1888199 (Provisional before reduction)
OK D •• ES FR , ... IT lUX NL s p SF v u EU·1
Number of •pplcadoM ecceptM
Generlll scheme 3.722 33.615 131.306 10.819 n.d. 199.186 4.658 136.237 488 2.965 32.559 n.d. 33.455 27.821 39.050 655.458 8,3% 54,7% 38.2% 3,7% n.d. 42.7% 28,3% 20.1% 24,9% 8,0% 30,2% n.d. 44,7% 48,1% 41,8% 28,7%
SimpliHed scheme 34.591 28.927 210.684 278.847 n.d. 197.125 11.788 518.550 1.485 48.851 75.414 n.d. 41.377 29.672 22.213 1.493.304 78,8% 43,8% 61,3" 96,3" n.d. 42,3" 71.7% 78,1% 76,1% 84,0% 89,8% n.d. 55,3% 51,6% 23,8% 65,3%
Fodder enly 8.703 919 1.428 n.d. •. d 70.014 n.d. 25.851 0 n.d. n.d. n.d. n.d. 175 32.114 137.002 14,9% 1,5" ..... n.d. 15,0% 3,8,. 0,0% n.d. 0,3% 34,4% 8,0%
TOIOI 45.D16 81.461 343.416 289.288 n.d. 486.304 18.448 878.438 1951 49.818 107.973 ·~- 74.832 57.468 93.377 2.285.764 100% 100" 100% 100% n.d. 100% 100% 100% 100" 100% 100" n.d. 100% 100% 100% 100%
[AfN COV.ed by •Pplcallonl IMII U
~enerlll scheme 193.032 1.770.369 8.557.901 148.425 7.882.868 .12.036.803 230.322 2.599.642 19.849 102.478 772.835 447.000 947.242 1.317.928 4.248.439 41.074.631 45,0" 87,5% 85,3% 11.4" 85,7% 87,8% 71,7% 51,8% 51,3% 25,8% 67,9% 57,8% 89,4% 83,4% 95,0% 79,7%
Simplilied scheme 235.929 252.250 1.475.381 1.154.870 1.284.118 1.854.637 81.027 2.417.547 18.669 295.244 384.795 329.429 417.467 262.231 222.180 18.475.452 s5·,0CK. 12,6" 14,7% 88,8% 14,3% 12,1% 28,3% 48,2% 48,7% 74,2" 32,1% 42,4% 30,6% 18,6% 6,0% 20,3%1
' Ire tal 428.961 2.022.819 10.033.262 1.303.095 8.968.782 13.681.140 321.348 5.017.189 38.318 387.722 1.137.830 776.429 1.384.709 1.580.159 4.470.619 51.549.983
100% 100" 100% 100% 100 .. 100% 100% 100" 100% 100% 100% 100% 100% 100% 100% 100~J Av.-.ge aru for wNch .W Is
I •ppllecl per hoking lhlll 111
Gensrlll acheme 52 53 85 14 n.d. 80 49 19 40 35 24 n.d. 28 48 109 "'I SimpWfied schema 7 • 7 4 n.d. 8 8 5 13 8 5 n.d. 10 9 10 7,
etal , 33 29 5 n.d. 35 20 • 20 • , n.d. 18 28 73 241 111 ; Not including for.QI. not reC8iving •iii.
••

ANNEX 15b .... AID FOR ARABLE CROPS (WITHOUT REDUCTION)
]998/99
1. ts~l\li.UVW I 'I vr J\1\.C.l-\0) L..VI'IL..Oru'lou • vvv '"''
EUR 15 B DK D GR E F 1RL I L NL OS p SF sv UK otal base area 53542 479 2018 10156 1492 9220 13526 346 5801 43 437 1203 1035 1591 1737 4461
of which: maize base area 3303 97 0 540 0 403 614 0 1200 0 208 0 205 0 0 34
ornge area 749 51 18 220 7 !6 207 12 23 3 II 7 37 13 4 12
otal area concerned 52299 480 2041 10253 l3to 8983 13898 333 5040 41 409 1144 813 1378 1584 4591
of which: maize base area 2997 J3J 0 !58 0 438 646 5 1139 0 219 0 228 0 0 3
Small producers. of which: 10475 236 252 1475 It 55 1284 1655 91 2418 !9 295 365 329 4!7 262 22
- cereals and silage 10251 236 248 1459 1150 1230 1639 90 2333 !9 294 341 319 414 259 21
. of which maize (base aUa) 1261 97 0 172 0 71 116 3 442 0 197 0 146 0 0 !6
• oilseeds 109 0 I 10 3 47 10 0 18 0 0 8 7 2 I I
• protein plants 112 0 3 6 2 7 6 0 67 0 I 15 2 I 2 2
• non-textile flax 4 0 0 0 0 0 0 0 0 0 0 0 I 0 0 I
fLarge-scale producers, of which: 41075 193 1770 8558 148 7683 12037 230 2600 20 102 773 447 947 1318 4248
-set-aside 4315 12 154 814 13 1378 Q40 19 171 I 7 71 79 155 199 304
totai area shown 36759 181 1617 7744 136 6305 11097 211 2429 18 96 701 368 793 1119 3945
of which: oilseeds -area sown 5548 5 106 888 31 1045 1851 6 844 2 I 85 56 62 5I 514
fwhich: tein r~lant!:
-area sown 1365 3 104 220 0 65 631 ' 26 0 I 45 3 4 46 211
f which: non-textile; flax -area sown 310 0 5 110 0 34 7 4 0 0 0 4 24 2 16 102
£which: cereals and si\ ' -area sown 29537 173 1401 6525 105 5161 8608 197 1558 16 94 567 284 724 1006 3117
. of which maize (base area) 1921 14 0 313 0 348 472 2 643 0 10 0 n 0 0 " • other cereals 27616 159 1401 6212 105 4813 8136 196 915 16 84 567 207 724 1006 3075
mum wheat (traditional producer regions) 2990 604 616 215 1531 25
Durum wheat (non-traditional producer regions) 97 80 17
obi area 52299 480 2041 10253 1310 8983 13898 333 5040 41 409 ll44 813 1378 1584 4591
Forage area 751 51 21 220 7 16 207 12 23 3 II 7 37 13 4 12
et-aside 4315 12 154 814 13 1378 940 19 171 I 7 71 79 !55 199 304
IAnassown 4n34 417 1869 9219 1290 7589 12751 302 4846 37 391 1066 697 1210 1382 416
cenab •nd sll•se 39787 409 1649 7984 1255 6391 10247 288 3891 34 389 908 603 1139 1265 3335
ollseeds 5651 5 108 898 33 1092 1860 6 863 2 I 94 63 65 52 515
protein pl•nb 1477 3 107 226 3 72 637 4 93 0 I 60 5 5 " 213
non-teJ.tile OaJ. 313 0 6 Ill 0 34 7 ' 0 0 0 4 25 2 17 103
!Difference compared with base area -1243 I " .. -181 -137 l7l -11 -761 -I -11 -59 -111 -ltl -153 m Bast area as indicated In Replatlons (EC) 1098/94 and 1763196
87

" •
•
•
. E
• ~
~ ~! ~
1 I
l lh
~-•
.
s lii . ~
"· ;; ~
•

ANNEX16
Exchange rates in 1998
1) Conversion of monthly expenditure into ecus - Budget rate
Expenditure Rate on: OJ: B OK D EL E F IRL I LUX NL A p FIN s UK
November 97 10.12.97 -C 376 197 40,7436 7,52265 1,97513 310,513 166,808 6,61072 0,760094 1.933,13 40,7436 2,22555 13,89850 201,657 5,951 8,630 0,672370
December97 9.1.98 -C 6 198 40,7024 7,51416 1,97330 311,780 167,278 6,60565 0,794061 1.939,32 40,7024 2,22372 13,88200 201,766 5,976 8,679 0,671202
anuary 98 10.2.98 - c 46 /98 40,6963 7,51480 1,97172 312,079 167,152 6,61039 0,787207 1.948,54 40,6963 2,22259 13,87430 201,886 5,980 8,854 0,670772
February 98 10.3.98 - c 75 /98 40,7844 7,53567 1,97710 312,338 167,546 6,62922 0,797448 1.945,52 40,7844 2,22840 13,90880 202,194 6,003 8,654 0,660300
"""rch 98 .9.4.98 -C 114 /98 40,8637 7,55361 1,98063 343,996 168,194 6,63927 0,785989 1.955,73 40,8637 2,23084 13,93460 202,900 6,014 8,592 0,650242
11Pril98 8.5.98 - c 144 198 40,6096 7,50201 1,96853 342,817 167,212 6,60100 0,782573 1.941,52 40,6096 2,21821 13,85150 201,671 5,982 8,462 0,676678
~ay98 10.6.98 - c 179 198 40,6300 7,50207 1,96952 334,327 167,169 6,60482 0,781584 1.940,71 40,6300 2,22009 13,85900 201,590 5,986 8,747 0,675455
~une 98 10.7.98 -C 217 /98 40,7188 7,52277 1,97459 327,976 167,512 6,61925 0,784506 1.946,10 40,7188 2,22574 13,89220 201,987 6,001 8,758 0,665055
~uly 98 10.8.98 -C 252 /98 40,5929 7,49901 1,96849 326,413 167,070 6,59999 0,783247 1.942,02 40,5929 2,21986 13,85060 201,403 5,985 8,942 0,677908
August98 10.9.98 -C 282 198 40,4913 7,48004 1,96276 336,804 166,679 6,58175 0,783714 1.937,86 40,4913 2,21528 13,81080 201,186 5,974 9,159 0,689065
September 98 9.10.98 -C 311 198 40,3792 7,44267 1,95731 339,207 166,401 6,56182 0,782335 1.937,70 40,3792 2,20715 13,77060 200,771 5,959 9,547 0,701799
October 98 10.11.98 -C 343 /98 40,3933 7,44400 1,95818 330,632 166,502 6,56581 0,787159 1.936,97 40,3933 2,20774 13,77670 200,769 5,956 9,235 0,700240
,verage Total expenditure in NC 1rate = 40,6921 7,51455 1,97222 318,421 167,119 6,60734 0,780321 1.940,73 40,7173 2,22195 13,85007 201,68806 5,96448 8,69599 0,673264
iinECU Total expenditure in ECU
From the 1994 financial year, the rate to be used for converting expenditure incurred (in national currency) by the Member States in month "n" is that for the 10th day of month "n+1" or the first preceding day for which a general quotation is available.
89

ANNEX 17a ADVANCE PAYMENTS TO MEMBER STATES (1998)
in national current}'_
Date of B OK D EL E F IRL I decision BEF DKK OEM GRD ESP FRF IEP ITL
18/12197 10.157.000.000,00 4.254.700.000,00 6.097.700.000,00 247.300.000.000,00 249.100.000.000,00 30.650.000.000,00 299.800.000,00 1.327.000.000.000,0! 30/01198 3.293.820.000,00 949.000.000,00 518.675.053,00 219.350.000.000,00 218.582.500.000,00 2.523.375.000,00 90.200.000,00 3.165.865.823.807,00 27/02198 3.118.000.000,00 312.000.000,00 245.700.000,00 . 37.000.000.000,00 17.840.000.000,00 1.927.000.000,00 31.400.000,00 107.500.000.000,00 27/03198 1.861.000.000,00 513.900.000,00 336.300.000,00 41.750.000.000,00 35.460.000.000,00 4. 733.000.000,00 129.750.000,00 242.800.000.000,()( 4/05198 4.460.000.000,00 542.300.000,00 866.300.000,00 27.680.000.000,00 76.260.000.000,00 2.116.000.000,00 95.450.000,00 823.800.000.000,00
27/05198 2.152.000.000,00 504.500.000,00 430.700.000,00 42.280.000.000,00 30.950.000.000,00 2.540.000.000,00 65.200.000,00 299.200.000.000,00 30106198 1.528.000.000,00 271.800.000,00 424.300.000,00 30.690.000.000,00 36.000.000.000,00 2.457.000.000,00 118.050.000,00 519.000.000.000,0! 29/07198 2.139.000.000,00 188.900.000,00 324.300.000,00 48.390.000.000,00 39.910.000.000,00 1.766.000.000,00 204.900.000,00 501.1 00.000.000,0( 31108198 1.948.000.000,00 245.100.000,00 237.500.000,00 63.070.000.000,00 60.950.000.000,00 3.988.000.000,00 70.850.000,00 79.000.000.000,()( 30/09198 1.203.000.000,00 184.900.000,00 343.100.000,00 33.610.000.000,00 45.760.000.000 00 2.919.000.000,00 46.000.000,00 232.100.000.000,~ 30/10198 1.571.000.000,00 407.300.000,00 501.100.000,00 15.190.000.000,00 61.150.000.000,00 1. 721.000.000,00 54.450.000,00 577.200.000.000,00 1/12198 1.203.000.000,00 297.700.000,00 826.100.000,00 7.830.000.000,00 12.670.000.000.00 2.173.000.000,00 67.800.000,00 136.800.000.000,
21/12198 -10.578.196,00 13.671,38 47.679,04 2.657.584,00 6.131.151,00 482.775,37 75.423,88 2.289.950.636,00
TOTAL N.C. 34.641.241.804,00 8.672.113.671 ,38 10.951.822.732,04 814.142.657.584,00 884.638.631.151,00 59.513.857.775,37 1.273.925.423,88 8.013.655.774.443,0! .
TOTAL ECU 851.301.453,70 1.154.098.643,93 5.553.032.861,89 2.558.812.074,59 5.293.484. 736,50 9.007.228.561 '12 1.632.569.099,22 4.129.266.967,6€
90

ANNEX 17b ADVANCE PAYMENTS TO MEMBER STATES (1998)
Date of L _ NL A p FIN s decision LUF NLG ATS PTE FIM SEK
18112197 378.430.000,00 557.600.000,00 5.061.000.000,00 34.867.000.000,00 1.347.800.000,00 3.512. 700.000,00 30101/98 16.297.675,00 401.100.885,00 264.000.000,00 24.622.000.000,00 158.537.500,00 773.627.000,00 27102198 55.490.000,00 254.500.000,00 123.000.000,00 2.644.000.000,00 102.600.000,00 104.300.000,00 27103198 6.420.000,00 208.000.000,00 144.000.000,00 10.684.000.000,00 88.300.000,00 169.200.000,00 4/05198 1.330.000,00 247.400.000,00 442.000.000,00 9.573.000.000,00 112.500.000,00 598.400.000,00
27105198 112.390.000,00 250.300.000,00 176.000.000,00 7.653.000.000,00 125.200.000,00 550.000.000,00 30106/98 2.200.000,00 205.200.000,00 747.000.000,00 770.000.000,00 171.400.000,00 64.000.000,00 29/07198 156.990.000,00 218.200.000,00 129.000.000,00 5.262.000.000,00 125.200.000,00 151.200.000,00 31108198 -6.640.000,00 246.400.000,00 175.000.000,00 8.185.000.000,00 91.800.000,00 87.600.000,00 30109198 -19.540.000,00 172.700.000,00 355.000.000,00 11.781.000.000,00 93.300.000,00 199.600.000,00 30110198 -460.000,00 160.500.000,00 123.000.000,00 7.905.000.000,00 595.100.000,00 241.400.000,00 1112198 7.530.000,00 108.200.000,00 3.930.000.000,00 3.771.000.000,00 420.800.000,00 244.600.000,00
21112198 4.672,00 32.279,63 212.295,33 644.006.394,00 1.157.812,16 50.748,18
Exchange difference
TOTAL N.C. 710.442.347,00 3.050.133.164,63 11.669.212.295,33 128.561.006.394,00 3.433.695.312,16 6.696.677.748,18
TOTAL ECU 17.448.149,28 1.372.727.573,98 842.538.591,91 637.428.983,38 575.690.071,44 770.088.152,76
-----------------
Exchange differences arise from the fact that advances paid for a given month do not tally perfedly WJlh expenditure committed during that month (advances are rounded off and retroactive corrections are made).
..--~-~--~~~~~,_.,,.~·..-rrnrr
in national currency
UK TOTAL EU GBP (ECU)
668.400.000,00 14.333.647.532,05 706.635.889,18 6.098.648.901 '70
96.650.000,00 1.165.461.752,44 107.250.000,00 1.984.082.379,72 246.500.000,00 2.570.348.645,83 224.100.000,00 1.853.037.909,91 137.550.000,00 1. 776.678.156,24 203.400.000,00 1.894.335.152,66 93.800.000,00 1.822.303.485,06
124.800.000,00 1.605.794.113,72 162.550.000,00 1.878.509.435,25 130.100.000,00 1. 715.315.201,94
2.833.991,41 9.641.829,36
-51.291,79
2.904.569.880,59 38.707.753.204,09
4.314.088.794,52 38.707.753.204,09
The differences between the two amounts are converted into.ecus at the rate for the following month, and the resuhing gaps in ecus are booked as exchange differences.
91

Year
1979-89 1990 1991 1992.
1993 1994 1995 1996 1997 1998
TOTAL
ANNEX 18
AMOUNTS WITHHELD FROM PRODUCTION AND CONSUMPTION AID IN THE OLIVE OIL SECTOR
AND THEIR UTILISATION
Schemes related to Schemes related to Schemes related to olive oil consumption olive' · .-. Jction olive oil production
(Art.ll! 6- R136/66/EECl (Art.5 § 2 and 4 - R 136/66/EECI (Art.5 § 4 - R 136/66/EECl
)nformation and Establishment of Improvement of promotion schemes olive oil register quality of olive oil
WITHHELD UTILISATION WITHHELD UTILISATION WITHHELD UTILISATION
90.159.767 33.091.147 103.803.744 138.447.509 25.759.471 4.135.329 19.037.203 4.175.724 15.020.682 20.587.986 10.669.627 4.606.092 29.568.121 16.912.766 28.332.536 7.075.170 20.400.643 10.611.885 12.748.691 22.383.755 21.525.722 16.398.218 16.762.313 6.847.826
5.508.731 10.737.872 30.449.625 1.615.337 21.656.549 13.561.940 3.379.197 971.577 26.721.127 7.791.346 16.675.444 12.726.103
832.232 5.357.717 13.395.901 6.507.479 8.231.691 9.806.276 -15.006 18.501.750 44.654.264 7.608.617 25.421.949 10.151.954
-3.081 16.908.240 50.100.227 12.557.362 28.520.409 12.683.452 6 . .900.551 49.092.881 29.679.620 27.946.759 22.207.814
161.215.854 135.941.098 383.096.709 248.268.643 202.044.854 107.338.671
From 1979 to 1992 inclustve, the figures for utilisation are recorded in natianal currency and converted inta acus (8) at the average rate. From 1993, the figurea far utilisation are AGREX data in ecus IBi.
92
Schemes related to olive oil production
(Art.20 quinquies§ 1 - R 136/66/EEC)
Contribution to costs of recognised organisations and associations
WITHHELD UTILISATION
42.112.874 11.017.873 8.944.126 7.239.877
16.386.319 8.083.706 12.172.319 3.713.933 15.177.990 7.217.778 11.612.627 4.368.469 5.450.303 11.210.908
13.628.790 7.179.4341 15.083.256 10.327.976 14.777.869 12.973.8771
155.346.473 83.333.8311

ANNEX 19
AMOUNTS WITHHELD FROM PRODUCTION AND CONSUMPTION AID IN THE FIBRE FLAX GRAPE JUICE AND TOBACCO SECTORS
AND THEIR UTILISATION
Specific schemes concerning Schemes related to the consumption of Financing of the fund for tobacco research Year fibre flax grape juice and Information
tAn. 2 - R 1 308/70/EECI An. 46! 4 An. 13 Art. 1 R 822/87/EEC Council Reg. R 2427/93/EC
Information and and An. 4! 4 2075/92 promotion schemes R 3461/85/EEC
WITHHElD UTiliSATION WITHHElD UTiliSATION WITHHElD UTiliSATION
1979-1989 14.583.877,00 11.914.740,00 18.546.538,00 11.509.286,00 - -1990 3.941.124,00 1.649.911,00 6. 523.-170,00 4. 174.999,00 - -1991 2.284.027,03 1.627.180,00 7.260.665,64 6.296.229,00 - -1992 2.239. 724,00 4.995.386.41 6.493. 724,00 4.741 .. 154,00 - -1993 - 2.594.027,00 1.809.589,54 8.890.122,00 4.841.138,00 298.324.46 0,00 1994 1.553.220,60 548.114,56 9.330.600.44 5. 737.896,00 4.825.461,86 0,00 1995 4.645.082,26 3.060.809,38 9.125.257,84 7.443.324,04 8.542.938.43 4.875,001 1996 5.413.411,72 2.072.699,05 7.743.833,30 5.258.169,83 9.437.062,73 2.216.999,37: 1997 6.181.496,37 1.862.875,19 6.769.318,79 6.132.627,98 9.391.269,54 4.500.527,00 1998 0,00 314.676,16 8.491.505,16 5.805.259.40 7.900.362,71 4.128.293,19
TOTAL 43.435.989,98 29.855.981,29 89.174.735,17 61.940.083,25 40.395.419,73 10.850.694,56 -- ---
93

ANNEX 20
Cl fARANCf Of IHf 1994 ACCOUNTS• FINANCIAL AESIJLI$
EAGGF Guarantee Section expenditure B D DK El E F IRL I l Nl Os p su sv UK EC TOTAl
1996 financial year
1. Expen"'ure recoanised . . al Expenditure declared by 1he Member State under this 1.662,08 5.329,89 1.389,11 2.346,26 4.788.34 8.351,76 1.468.67 4.258,10 13,82 1.843,24 82.36 683,62 59.15 75,89 3.373,17 35.625,64
clearance rocedure
W Expandit~re declared under the preceding clearance 1,10 318,99 29.24 43.39 614,09 468,08 4,25 231,93 0,33 0,27 0,00 34,99 0,00 0.00 127,96 1.875,61
DfOcedure but excfuded from that dearance Drocedura ,, Expenditure declared but excluded from ttU clearance ·1.12 -132.47 ·30.18 -38.44 -244,20 ·441,38 -0,81 -233,77 -0,36 -0,36 0,00 ·18,98 0,00 0,00 -119,41 ·1.262.47 Dmcedure '
.. ··
dl Expenditure declared and already cevered by a o.oo o.oo o.oo o.oo 0,00 0,00 0,00 0,00 0,00 0,00 0,00 0,00 0,00 0,00 0,00 o.oo clearance decision ., Expenditure declared and covered by this clearance 1.562,06 5.517,42 1.388,18 2.350.20 6.168.22 8.378,46 1.472.31 4.256.28 13,59 1.843,15 62,38 699,63 59,15 75,69 3.381,71 36.236.?7 orocedure la+b,+c+dl
fl Emf nditure disallowed ·066 .... -0 23 ·38 73 -149 86 ·98 77 ·6 39 -47 75 000 ·18 95 0 00 -14 97 000 0.00 -46 66 -428 79
__m_ Total expenditure recognised le+fl 1.661 40 6.511 58 1.387 86 2.311 47 5.008 36 8.279 69 1.465 92 4.208 51 13 59 1.924 20 82 36 684 96 59,15 75 89 3.335 05 35.809 99 2. Expenditure charaed
a) Exoenclture charoed in resoect of this .financial ve8f 1.560 85 6.328 13 1.389 10 2.342 07 4.777 80 6.351 78 1.486 14 4.237 37 13 62 1.843 96 82 39 691 01 59 11 76,45 3.364 06 35.563 84 bl Expenditure charged in respect of the preceding 1,10 319,99 29.24 43,38 614,09 488,08 4,25 231,93 0,33 0,27 o.oo 34,99 0,00 o.oo 127,96 1.875,61
financial year but exduded from that dearance prOcedure ,, Expenditure charged in respect of this financial year ·1,12 ·132,47 ·30,16 ·39.44 ·244.20 -441.38 ·0,81 -233,77 -0,36 ·0,36 o.oo ·18,98 0,00 0,00 ·119,41 ·1.262,47 but excluded from this clearance orocedure
dl Expenditure cher91Kf in respect of this financial year 0,00 • 0,00 0,00 o.oo o.oo o.oo 0.00 0,00 0,00 o.oo o.oo 0,00 0,00 0.00 o.oo 0.00 but atread covered by a dearance decision
el Ex nditura charQed in respect of subsequent financial vear 000 000 000 000 000 000 000 0.00 000 000 0,00 000 000 ·0 56 0.00 ·066 fl Total expenditure charged and covered by this 1.660,83 6.616,88 1.388,17 2.346,01 6.147,69 8.378,48 1.469,58 4.235,53 13,59 1.843,87 92.39 707.02 59.11 75,89 3.372.61 36.196.42
clearance Dfocedure ls+b+c+d+el ' 3. Expendlttn cttaro.d to er to be paid ta the Member -0,57 4,08 0,21 34,54 139,32 98,80 3,66 27.02 0,00 19,67 0,03 22,15 -0,04 0,00 37,55 386,4Ji
~s as • rasuh of the cktalranca IH'OC8dunl2f-1al ' '
EURO million
ICsnversion rate on 11/1119991
94

8
OK
D
EL
E
F
IRL
l
Nl
ANNEX 21a)
TREND IN EAGGF GUARANTEE SECTION EXPENDITURE BY MEMBER STATE
EUR10 1983 I 1984
608,0 3,9%
874,3 4,3%
3.054,8 19,4%
1.007,6 6,4%
684.8 3,7%
877.8 4,8%
3.318.0 18,1%
961.2 6,2%
1985
913,7 4,6%
822.2 4,2%
3.803,0 18,3%
1.192.5 6,0%
1986
978,4 4,4%
1.063,2 4,8%
4.400,8 19,9%
1.386,9 6,3%
271.4 1,2%
1987 1988
821,31 721.4 3,6% 2,7%
1.057,41 1.210.8 4,6% 4,6%
3.992, 7 4.903.9 17.4% 18,6%
1.340,61 1.318.4 5,8% 5,0%
601.7 1.867,8 2,6% 7,1%
EUR12 1989 I 199o
~ 2,3%
1.000,6 4,1%
3~ 15,4%
1.636,9 6,7%
858,8 3.4%
1.098,8 4,4%
3.928,5 15,7%
1.941,6 7.7%
1.853,81 2.015.3 7.6%1 8,0%
3.539,81 3.662.01 4.615,21 6.440,3 6.667,1 8.191.51 4.613,5 6.028.7 22.4%1 19,5%1 23,4%1 24,6% 24,6%
617,81 684,31 1.161.71 1.212,9 964,9 3,9%1 4,6%1 6,9%1 5,5% 4.2%
2.889,31 3.933,81 3.483,9 18,3%1 21,5%1 17,6%
4.3 0,0%
1.:!!!.& 10,8%
3.61 4,8 0,0% 0,0%
1.959,4 10,7%
3.067,81 3.899,7 13.9%1 17,0%
2.01 1.6 0,0% 0,0%
2.276.6 2.727.8 10,3% 11,9%
23,5%1 18,9%
1.080,31 1.085,8 4,1%1 4,4%
4.346,91 4.489,8 16,5%1 18,4%
3,01 1,8 0,0% 0,0%
3.831,6 3.496.2 14,5% 14,3%
20,1%
1.643,1 6,2%
3.983,4 15,9%
___g 0,0%
2.643.3 10,5%
1991111 I 1992111 I1993111121I199411112M 1995121
1.466.9 4,6%
1.~ 3,8%
4.:.!!_L! 15,8%
2.210.6 7,0%
1.365,5 4,4%
1.161,3 3,7%
4.673,8 14,6%
2.230,6 7,1%
1.298,7 3,7%
1.334.7 3,6%
4.976.2 14,3%
2.t!!.& 7,8%
1.170,4 3,5%
.1!l.M 3,8%
6.179,9 15,5%
~ 8,1%
1.622,1 4,7%
1.389,4 4,0%
5.380,0 15,6%
2.438,8 7,1%
3.294.91 3.558,41 4.175.71 4.408,31 4.562.3 10.4%1 11.4%1 12,0%1 13,2%1 13,'2%
6.324,3 20,0%
1.628.6 5,2%
6.346,9 16,9%
__M 0,0%
2.'!!U, 7,8%
6.843,81 8.184,8 21,9%1 23,6%
1.349,41 1.649.9 4,3%1 4.7%
6.134,4 16,4%
1,1 0,0%
2.176,8 7,0%
4.766.4 13,7%
~ 0,0%
2.E!J_ 6,7%
8.001,2 23,9%
1.480,0 4,4%
3.460,6 10,4%
12,1 0,0%
L!.!.!& 5,7%
8.376.6 24,3%
1.417,5 4,1%
3.364,3 9,8%
14.0 0,0%
1.929.7 5,6%
ECU million and % EUR15
1996121 ]1997111121
~ 2,9%
1.~ 3,5%
~ 15,5%
2.816.8 7,2%
4.046,9 10,3%
9.557.6 24,4%
1.699.6 4,3%
4.219.9 10,8%
19,7 0,1%
1.535,4 3,9%
972,8 2.4%
1.236.3 3,0%
6.714,8 14,2%
2.729.8 6,7%
4.694.1 11,3%
9.141.7 22,5%
2.034,2 5,0%
6.121,4 12,6%
22.6 0,1%
1.766.7 4,3%
1998121
851,3 2.2%
1.164,0 3,0%
6.653,0 14,3%
2.656,8 6.6%
6.293,5 13,7%
9.007,2 23,2%
1.632.6 4,2%
4.129,2 10,7%
17.4 0,0%
1.Eb..Z 3,5%
]A I I I I I I -- I I -- I I ---= .. I I I o~~~l 1 .23~~~1 ~~~~I ~~~~I p ~
0,1% 146,7 0,6%
166.7 0,6%
11M 0,7%
213.4 0,9%
314,8 1,0%
422.2 1,3%
478,1 1,4%
708.4 2,1%
706.7 2,0%
645.4 1,7%
654,9 1,6%
~ 1,6%
]FIN I I I ___ l__ I . ·1··· I I I 61,9] 647.5] 568.3] 575,7] ~--,--,-_:.:_:_r==I==-__]_ __ _l==--ll __ _ll_--=-==rJ --~ o.2%I 1,7%1 1,4%1 1.5%1
Is I I I 1- _..L_ 1 I I ------r- I 16.11 622.21 745,2] 71o.1l I I L I I I I I I I I __ I I . o.2%] 1,6%] 1,8%] 2.o%l
UK
COMI31
TOTAL
1.692.6 10,7%
0,6 0,0%
-2~ 11,6%
5,7 0,0%
1.908,0 9,7%
6,4 0,0%
t1) Including expenditure on carryovers.
1.983,0 9,0%
6,0 0,0%
1.!£4 7,6%
2,0 0,0%
1.990,1 7,5%
·1.222.2 -4,6%
t211nduding set-aside, income aid and fisheries in charge of the Guarantee from 1 993. (31 Direct payments.
1.733,8 7,1%
12.6 0,1%
1.793,8 7,2%
16,5 0,1%
95
2.252.0 7,1%
69.2 0,2%
2.312,6 7,4%
145,9 0,5%
2.737,9 7,9%
96,4 0,3%
2.939.0 8,8%
139.0 0,4%
2.954.0 8,6%
125.2 0,4%
3.468,2 8,9%
67,0 0,2%
4.401.2 10,8%
63,6 0,2%
40.675,0 100,0%
4~ 11.1%
40.3 0,_1%
38.747,9 100,0%

ANNEX 21bl mEND IN EAGGF GUAftANTEE SECTION EXPENDITURE BY CHAPTER
I 0 ARABLE CROPS
11 SUGAR
12 DUVEOJL
lJ ORJED roDDER
14 FIBRE PLANTS AND SILKWORMS
15 f'RUIT ANDVECI:TAILES
16 WINE PRODUCTS
17 TOBACCO
11 KEFNEA.L
22 IHEEPMI:A.T AND GOATMEAT
23 PIGMEAT
24 EGCIANDPOULTRVM£AT
15 OTHEll ANIMAL PRODUCTS
26 FJSHEIUU
31 FOODAID
31 MCAIANDAGRIMONETARYAJD
J3 fOODAIDREI'lJM)I
34 ltiiMIURHMENT OF INTEREST 6,0
35 f'REI DIITRIBUTION
J6 MONITORIN'G AND PREVENTION
37 CLEAll4.N(%0F ACCOUNTS
J8 PROMOTIONAL MEASURU
39 OTHER MEAStiRU
96

ANNEX21c
TREND IN THE STRUCTURE OF EAGGF GUARANTEE SECTION EXPENDITURE
!REFUNDS I 10.159,31 29,4%1 8.160,51 24,8%1 7.8o2,21 22,6%1 5705,01 . -14.61';)-- 5.883,91 14,6%1 4.826,31 12,5%1
CONVENTIONAL MARKET SUPPORT (I) 21.186,7 61,3% 12.124,0 36,8% 10.515,8 30,5% 11.834,4 30,3% 13.096,0 32,4% 12.208,1 31,5%
AID UNDER THE REFORM (2) 2.866,2 8,3% 11.924,2 36,2% 15.689,9 45,5% 20.120,7 51,4% 19.813,8 49,0% 19.895,3 51,3%
TOTAL: INTERVENTION 24.052,9 69,5% 24.048,2 72,9% 26.205,7 76,0o/o 31.954,7 81,7% 32.909,8 81,4% 32.103,4 82,9%
!ACCOMPANYING MEASURES _..1 221,zl. 0,6o/!.l 490,.!1 ~._?ro 832,1 2,4~- 1853,Ql 4,7ill 2.066,81 5,1~ 1.847,Ql 4,8%1
IOTHER(J) I 156,51 o,5%l 271,61 o,8%1 -337.31 -I,O"/;c---4o5,ol -1,0"/ol -437.31 -1,1%1 -28,61 -O,I%1
ITOTALEAGGFGUAIUNTEE(4) r 34.590,41 - loo,0%1 32.970,41 100,0%1 34.502,71 100,0%1 39.107,81 IOO,il''lol - 40.423,01 . - 100,0%1 --38.748,11 ioo]%1
(I) This heading includes "classical" expenditure on storage, set-aside, incentives, processing and marketing aid, aid'to producers and income aid. (2) The heading includes expenditure on "compensatory" production aid introduced under the CAP reform adopted in 1992. (3) This heading covers various Chapters such as monitoring and prevention and the clearance of accounts (which concerns recovery and is booked as nevative expenditure)
(4) Not including expenditure from non-automatic carryovers of appropriations from previous year.
97
.. ,.

ANNEX22
CHAPTER 82·51 • COMPLEnON OF THE INTERNAL MARKET, CONTROLS AND OTHER OPERATIONS IN THE AGRICULTURAL SECTOR
1998 I 2 3 4
ce 1998 initial appropriations 1998 appropriations after transfers 1998 expenditure % 1998
Number Hesding cp 3/l
82 5100 Animal disease eradication ce 65,000 50,000 50,000 100,0% cp 48,000 42,300 42,298 100,0%
82 5101 Other measures in the veterinary field ce 6,SOO 2,900 2,856 98,S%
CD 4,500 3,500 3,500 100,0%
825102 Plant bealth measures ce 1,000 0,600 0,489 81,5%
CD 1,000 0,600 0,483 80,5%
82 5104 Office for Veterinary and Plant ce 0,000 0,000 0,000 0,000
Insoection and Control CD 0,000 0,000 0,000 0,000
82 5105 Measures for the most remote regions ce 2,300 2,000 2,000 100,0%
ctJ 2,300 2,300 2,191 0,000
82 5106 Funds for emergency ce s.ooo 51,350 50,190 0,000
veterinarv measures ctJ s.ooo 41,000 41,000 0,000
825110 Checks on the application of the ce 22,000 12,500 12,497 100,0% rules in a2riculture cp 20,000 12,100 12,099 100,0%
825120 Farm Accountancy Data Network ce 8,800 8,800 8,521 96,8% cp 7,200 7,200 7,200 100,0%
82 5130 Statistical surveys ce 3,800 3,150 3,140 99,7% cp 3,800 3,150 2,697 85,6%
82 5150 Forestry ce 16,000 16,000 15,983 99,9%
CD 15,000 15,000 14,996 100,0%
82 5170 Plant and animal genetic resources ce 2,500 2,500 0,057 2,3%
CD 2,000 2,000 0,057 2,9% 82 5121 SUrveys on the structure of ce 7,500 8,150 8,147 100,0%
aericu1tura1 ho1di02S CD 7,000 7,650 7,6SO 100,0% 82 5122 EnhaJicing public awareness ce S,500 s.soo 4,437 80,7%
of the CAP CD 5,500 4,SOO 3,402 7S,6% 82 5118 Wool ~ Research programme . ce 0,000 0,000 0,000
cp 0,000 0,000 0,000
TOTAL ce 145,900 163,450 158,317 96,9%
cp lll,300 141,300 137,573 97,4%
108,5%
113,4% 3/1
98
ANNEX23
BASIC RULES GOVERNING THE EAGGF GUARANTEE SECTION
General/System of advances
1. Council Regulation (EEC) No 729170 of 21 April 1970 on the financing of the common agricultural policy (OJ L 94, p. 13).
2. Council Regulation (EEC) No 1883178 of 2 August 1978 laying down general rules for the financing of interventions by the European Agricultural Guidance and Guarantee Fund, Guarantee Section (OJ L 216, p. 1).
3. Commission Regulation (EC) No 296/96 of 16 February 1996 on data to be forwarded by the Member States and the monthly booking of expenditure financed under the Guarantee Section of the Agricultural Guidance and Guarantee Fund (EAGGF) and repealing Regulation (EEC) No 2776/88 (OJ L 39, p. 5).
Amended by Commission Regulation (EC) No 2236/98 of 16 October 1998 in order to take account of introduction of the euro (OJ L 281, p. 9).
4. Council Decision 94/729/EC of 31 October 1994 on budgetary discipline (OJ L 293, p. 14).
Clearance of accounts
1. Council Regulation (EEC) No 4045/89 of 21 December 1989 on scrutiny by Member States of transactions forming part of the system of financing by the Guarantee Section of the European Agricultural Guidance and Guarantee Fund and repealing Directive 77/435/EEC (OJ L 388, p. 18).
2. Council Regulation (EEC) No 3508/92 of 27 November 1982 establishing an integrated administration and control system for certain Community aid schemes (OJ L 355, p. 1 ).
3. Commission Regulation (EC) No 1663/95 of 7 July 1995 laying down detailed rules for the iipplication of Council Regulation (EEC) No 729170 regarding the procedure for the clearance of the accounts of the EAGGF Guarantee Section (OJ L 158, p. 6).
Amended by Commission Regulation (EC) No 896/97 of 20 May 1997 in order to prevent expenditure reduced or suspended from being financed prematurely or temporarily in consequence of Article 7 (OJ L 128, p. 8).
99

Public storage
1. Commission Regulation (EEC) No 411/88 of 12 February 1988 on tbe method and tbe rate of interest to be used for calculating tbe costs of finam;ing intervention measures comprising buying-in, storage and disposal (OJ L 40,
. p. 25).
2. Commission Regulation (EEC) No 1643/89 of 12 June 1989 defining tbe standard amounts to be used for financing material operations arising from tbe public storage of agricultural products (OJ L 162, p. 12).
3. Council Regulation (EEC) No 3492/90 of 27 November 1990 laying down tbe factors to be taken into consideration in tbe annual accounts for tbe financing of intervention measures in tbe form of public storage by tbe European Agricultural Guidance. and Guarantee Fund, Guarantee Section (OJ L 337, p. 3).
4. Commission Regulation (EEC) No 3597/90 of 12 December 1990 on tbe accounting rules for intervention measures involving tbe buying-in, storage and sale of agricultural products by intervention agencies (OJ L 350, p. 43).
Amended by Commission Regulation (EC) No 1392/97 of 18 July 1997 in order to increase tbe value at which reimbursement is made in the public storage accounts to tbe EAGGF for missing quantities and quantities not meeting tbe conditions laid down for storage, in cases where tbe market price is substantially higher than tbe intervention price or intervention buying-in price (OJ L 190, p. 22).
5. Commission Regulation (EEC) No 147/91 of 22 January 1991 defining and fixing tbe tolerances for quantity losses of agricultural products in public intervention storage (OJ L 17, p. 9).
6. Commission Regulation (EC) No 3149/92 of 29 October 1992 laying down detailed rules for tbe supply of food from intervention stocks for tbe benefit of tbe most deprived persons in tbe Community (OJ L 313, p. 50).
7. Commission Regulation (EC) No 2148/96 of8 November 1996laying.down rules for evaluating and monitoring public intervention stocks of agricultural products (OJ L 288, p. 6).
Adjustments to tbe rules in 1998
In 1998 tbe rules governing tbe EAGGF Guarantee Section or relating to tbe common agricultural policy and having a major impact on tbe EAGGF Guarantee Section underwent various changes and were tbe subject of some important measures affecting day-to-day management, as follows:
100

Commission Regulation (EC) No 1205/98 of 10 June 1998 setting the amount of the payment on account onhe cost of disposal of certain distillation products for 1999 (OJ L 166, p. 34)
Sets the payment on account for the cost of disposal of alcohol from distillation of wine under Articles 35 and 36 of Regulation (EEC) No 822/87. Allows for depreciation in the same way as is done for alcohol from distillation under Article 39 of that Regulation.
Commission Regulation (EC) No 1206/98 of 10 June 1998 fixing depreciation percentages to be applied when agricultural products are bought in, for the 1999 financial year (OJ L 166, p. 35)
Sets for the 1999 accounting year the coefficients for the systematic depreciation applied when agricultural products are bought into public intervention and the coefficients to be applied by intervention agencies to the monthly purchase values of products, so that they can establish the depreciation amounts.
Commission Regulation (EC) No 1890/98 of 3 September 1998 amending Regulation (EC) No 1780/97 laying down detailed rules for the application of Council Regulation (EC) No 723/97 . on implementation of Member States' action programmes on control ofEAGGF Guarantee Section expenditure (OJ L 245, p. 28)
' Amends the rules for applying Council Regulation (EC) No 723/97 as regards the procedure and deadlines for payment to Member States of the Community contribution. The provision made in Regulation (EC) No 723/97 for a single annual payment including the balance for the previous year and the advance for the following year had proved difficult to apply in practice nor did it take account of the appropriations authorised for the following year by the budgetary authority. The improved provisions stipulate that the advances to be paid to Member States are to be deducted not from the unused amounts of the previous year but from those of the year before that. In addition the maximum Community financial contribution may not be set before the appropriations are authorised by the budgetary authority.
Commission Regulation (EC) No 2413/98 of 9 November 1998 on the rate of interest to be used for calculating the costs of financing intervention measures comprising buying in, storage and disposal (OJ L 299, p. 6)
Sets interest rates for the 1999 accounting year as required by Articles 3 and 4(1) of Commission Regulation (EEC) No 411/88.
101
l
Commission Decisions 98/101/EC of23 January 1998 (OJ L 23, p. 36), 98/203/EC of 3 March 1998 (OJ L 77, p. 53) and 98/525/EC of 5 August 1998 (OJ L 233, p~ 35) amending Decision 971660/EC adopting the plan allocating to the Member States resources to be charged to the 1998 budget year for the supply of food from intervention stocks for the benefit of the most deprived persons in the Community
The plans for supplying foodstuffs from intervention stocks to the neediest within the Community are often modified during the year. 1bat for 1998, approved on 2 October 1997, was adjusted no less than three times.
Commission Decision 98/657/EC of 12 November 1998 adopting the plan allocating to the Member States resources to be charged to the 1999 budget year for the supply of food from intervention stocks for the benefit of the most deprived persons in the Community (OJ L 313, p. 25)
Article 2 of Commission Regulation (EEC) No 3149/92 requires that for the purposes of the programme for supplying food from intervention stocks to the neediest elements of the population the Commission is to adopt a plan for each year to be financed from the available resources. The Decision contains the 1999 plan.
102

ISSN 0254-1475
COM(1999) 568 final
DOCUMENTS
EN 03 17 09 01
Catalogue number: CB-C0-99-559-EN-C
Office for Official Publications of the European Communities
L-2985 Luxembourg
' , . •
I
•


![[ger] EINKAUFSPREISE LANDWIRTSCHAFTLICHER …aei.pitt.edu/72633/1/1981.4.pdf · 2016. 2. 24. · einkaufspreise landwirtschaftlicher betriebsmittel purchase prices of the means of](https://img.pdfslide.us/doc/110x75/610304198a55581477076cc7/ger-einkaufspreise-landwirtschaftlicher-aeipittedu72633119814pdf-2016.jpg)


![[aei.pitt.edu] - Welcome to Archive of European …aei.pitt.edu/7517/1/HEIRS_3rd_colloquium_proceedings.pdfMs Huber is now a training officer at the think-tank CASIN in Geneva, teaching](https://img.pdfslide.us/doc/110x75/5adafbdb7f8b9a137f8e387e/aeipittedu-welcome-to-archive-of-european-aeipittedu75171heirs3rdcolloquium.jpg)