Embed Size (px)
Citation preview
Dallas Independent School District
EVALUATION OF THE REASONING MIND MATHEMATICS PROGRAM
2011-12
EA12-514-2
DEPARTMENT OF EVALUATION AND ACCOUNTABILITY
Mr. Mike Miles Superintendent of Schools

Nancy Directo
EVA
App
Kihneman, Por – Program
ALUATION
proved Report
Ph.D. Evaluation
Dallas Indepe
Mr
Superinte
N OF THE R
EA
Robert J
t of the Depar
DaJ
endent Schoo
. Mike Miles
endent of Sch
REASONIN
2011-12
A12-514-2
J. Costello Ph
rtment of Eva
Cecilia Execu Evalua
allas, Texas July 2012
ol District
hools
NG MIND P
h.D.
aluation and A
a Oakeley, Phutive Directoration and Acc
PROGRAM
Accountability
h.D.
countability
y

i
Table of Contents
Page
ABSTRACT………………………………………………………………………………………… 1
PROGRAM DESCRIPTION………………………………………………………………………. 3
PURPOSE AND SCOPE OF THE EVALUATION……………………………………………… 3
MAJOR EVALUATION QUESTIONS AND RESULTS………………………………………… 3
2.1 What were the demographic characteristics of grade two students in the Reasoning Mind program?.............................................................................………………………
3
Methodology…………………………………………………………………………..………. 3
Results………………………………………………………………………………….……… 3
2.2 What were the demographic characteristics and credential of grade two mathematics teachers?...........................................................................................……………….…
4
Methodology………………………………………………………………………………….. 4
Results……………………………………………………………………………………….… 4
2.3 What was the level of implementation of the Reasoning Mind program and Teacher Training?........………
5
Methodology………………………………………………………………………………..… 5
Results………………………………………………………………………………..……..… 5
2.4 What was the level of performance of Reasoning Mind students on the ITBS?……… 9
Methodology………………………………………………………………………………..… 9
Results……………………………………………………………………………………..…. 9
SUMMARY AND RECOMMENDATIONS………………………………………………….….. 20
APPENDIX………………………………………………….……………………………………..
21
ii
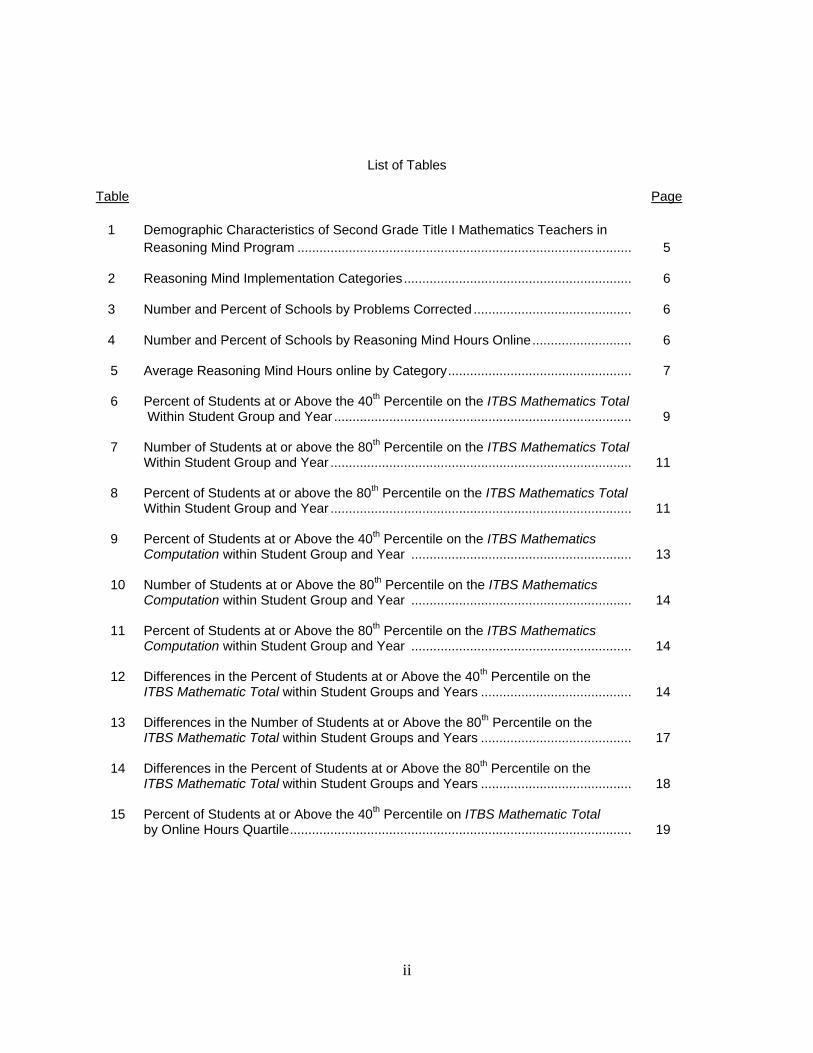
List of Tables
Table Page
1 Demographic Characteristics of Second Grade Title I Mathematics Teachers in Reasoning Mind Program ........................................................................................... 5
2 Reasoning Mind Implementation Categories .............................................................. 6
3 Number and Percent of Schools by Problems Corrected ........................................... 6
4 Number and Percent of Schools by Reasoning Mind Hours Online ........................... 6 5 Average Reasoning Mind Hours online by Category .................................................. 7 6 Percent of Students at or Above the 40th Percentile on the ITBS Mathematics Total Within Student Group and Year ................................................................................. 9 7 Number of Students at or above the 80th Percentile on the ITBS Mathematics Total Within Student Group and Year .................................................................................. 11 8 Percent of Students at or above the 80th Percentile on the ITBS Mathematics Total Within Student Group and Year .................................................................................. 11 9 Percent of Students at or Above the 40th Percentile on the ITBS Mathematics Computation within Student Group and Year ............................................................ 13 10 Number of Students at or Above the 80th Percentile on the ITBS Mathematics Computation within Student Group and Year ............................................................ 14 11 Percent of Students at or Above the 80th Percentile on the ITBS Mathematics Computation within Student Group and Year ............................................................ 14 12 Differences in the Percent of Students at or Above the 40th Percentile on the ITBS Mathematic Total within Student Groups and Years ......................................... 14 13 Differences in the Number of Students at or Above the 80th Percentile on the ITBS Mathematic Total within Student Groups and Years ......................................... 17 14 Differences in the Percent of Students at or Above the 80th Percentile on the ITBS Mathematic Total within Student Groups and Years ......................................... 18 15 Percent of Students at or Above the 40th Percentile on ITBS Mathematic Total by Online Hours Quartile ............................................................................................. 19
iii
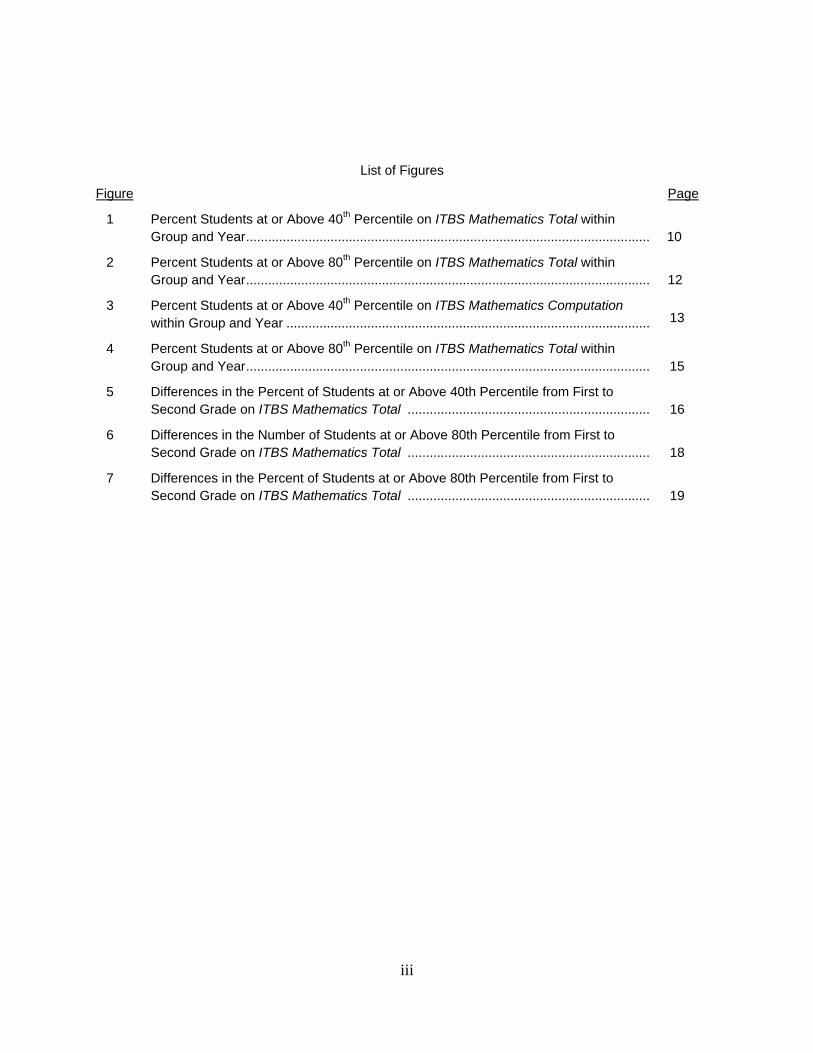
List of Figures
Figure Page
1 Percent Students at or Above 40th Percentile on ITBS Mathematics Total within Group and Year .............................................................................................................. 10
2 Percent Students at or Above 80th Percentile on ITBS Mathematics Total within Group and Year .............................................................................................................. 12
3 Percent Students at or Above 40th Percentile on ITBS Mathematics Computation within Group and Year ................................................................................................... 13
4 Percent Students at or Above 80th Percentile on ITBS Mathematics Total within Group and Year .............................................................................................................. 15
5 Differences in the Percent of Students at or Above 40th Percentile from First to Second Grade on ITBS Mathematics Total .................................................................. 16
6 Differences in the Number of Students at or Above 80th Percentile from First to Second Grade on ITBS Mathematics Total .................................................................. 18
7 Differences in the Percent of Students at or Above 80th Percentile from First to Second Grade on ITBS Mathematics Total .................................................................. 19
1
FINAL REPORT
EVALUATION OF THE REASONING MIND PROGRAM 2011-12
Project Evaluator: Robert J. Costello Ph.D.
ABSTRACT
Approximately 13,400 students in 149 Title I schools received instruction in the Reasoning Mind mathematics supplementary program at the second grade level in the Dallas ISD for the school year 2011-12. Data provided by Reasoning Mind shows that the average number of hours online for Dallas ISD students for the year was 30.5 hours. Data further indicates that students received 13.4 hours online in semester one and 17.1 hours online in semester two. The range of online instruction was from 0.0 hours to 168.9 hours. Only seven schools had more than 50 hours of instruction. Based on six six-weeks sessions for a total of 36 weeks in a school year the students received approximately 50 minutes of instruction per week. Hours varied per school due to implementation problems in the first semester and to principal’s decisions on how to implement the program. Results of the ITBS Mathematics Total by year shows that for district 2nd grade overall 58 percent of the students scored at or above the 40th percentile an increase of 1.2 percentage points over the previous year; however, the 2011 results showed an increase of 2.2 percentage points over the 2010 results. Although increases were reported for all student groups, with the exception of African American students, the increases were less than those reported for 2010 to 2011 (prior to 2nd grade implementation of RM). The goal for increasing the percent of students reaching the 80th percentile by 10 percentage points was not met by either. In general, Reasoning Mind did not achieve their stated goals of increasing mathematics achievement for second grade Dallas ISD students.
PROGRAM DESCRIPTION
Reasoning Mind (RM) is a Texas-based nonprofit organization that has developed an adaptive,
online mathematics curriculum for grades 2-6. In an RM classroom, every child sits at a computer and
works online in the RM system and learns mathematical concepts while solving problems at his or her
own pace. The system creates an individual path of learning tailored to each child’s needs based on its
assessment of that student’s strengths and weaknesses. Students log in to the program online and are
guided through grade-appropriate lessons and corresponding problems at their own pace. All problems
are ranked and tailored in difficulty level based on a student’s correct answers on past problems.
Students can request “hints” for problems, and regardless of right or wrong answers, are provided a
“Genie Solution” for the most thorough method for computing every problem. While students receive
individualized instruction online, the teacher is free to give children one-on-one support and attention.
2
Teachers use computers to monitor all students in the classroom and immediately see what questions
students are getting right or wrong on each topic. Students having difficulty on lessons receive one-on-
one interventions or small-group tutorials. As a result, the entire learning experience is structured to suit
individual student needs. The RM program is designed to supplement traditional mathematics instruction
in grades 2-4 and as a core mathematics curriculum in grades 5-6.
The rationale for inclusion of the Reasoning Mind program into the Dallas ISD second grade
classrooms was that during the time period from 2007-08 to 2009-10 second grade students have not
done well on the ITBS Mathematics Total. African American second grade students decreased from 53.0
percent of students at or above the 40th percentile to 47.4 percent (in 2010-11 the percentage was 50.6)
and Special Education second grade students decreased from 28.2 percent at or above the 40th
percentile to 21.8 percent in 2009-2010 (in 2010-11 the percentage was 24.8). There appeared to be a
need for supplemental mathematics material for second grade students as well as a need to train
teachers and supporting staff in the use of supplemental materials.
District-wide, the total number of African American kindergarten through second grade students
at or above the 80th percentile on the ITBS Mathematics Total decreased each year, from 2,107 in
2007-2008 to 1,726 in 2009-2010 ( in 2010-11 there were 1,933 students).
Program Goals. Second grade results on the ITBS Mathematics Total will be five percentage
points higher than those of the 2009-2010 results for students at or above the 40th percentile. The
number of second grade students on the ITBS Mathematics Total at or above the 80th percentile, in each
sub-population will increase by at least ten percentage points higher than the number of students in
2009-2010.
Second grade results on the ITBS Mathematics Computation will be five percentage points higher
than those of the 2009-2010 results for students at or above the 40th percentile. Although these expected
outcomes were obtained from the Title I workscope for the Reasoning Mind program it is believed that
comparisons should also be made between the 2011-12 outcomes and the 2010-11 results rather than
the 2009-10 results. Also it is assumed that since comparisons were made with the number of students
on the ITBS Mathematics Total at or above the 80th percentile that similar comparisons should be made
for students on the ITBS Mathematics Computation at or above the 80th percentile. One has to question
3
why goals were set for comparisons with two year old data rather than last year’s data. Given that district
ITBS scores for second grade students have been increasing since 2009 it would seem that Reasoning
Mind would be getting credit for increasing scores in 2010 when the program was not in Dallas ISD
second grade at the time.
PURPOSE AND SCOPE OF THE EVALUATION
The purpose of the evaluation was to determine the level of program effectiveness in
accomplishing the goals of the Reasoning Mind mathematics program. Mathematics achievement for
grade two was measured by the Iowa Tests of Basic Skills (ITBS) using both the mathematics total and
the mathematics computation subtests. In addition, the evaluation discusses the staff training received by
second grade teachers to implement the program and the implementation schedule.
MAJOR EVALUATION QUESTIONS AND RESULTS
2.1 What were the demographic characteristics of grade two students
in the Reasoning Mind program?
Methodology
The district’s student database was utilized to extract enrollment, demographic, and achievement
data. Current year enrollment data were extracted from the Dallas ISD student database on
November 1, 2011. Information on implementation, school schedules and student participants were
obtained from the Reasoning Mind coordinators. RM has students in several schools at the third and
fourth grades which were not included since this evaluation was for Title I funded projects, which in this
case were second grade students only.
Results
A total of 13,419 students were enrolled in second grade at 149 Title I schools; four elementary
schools chose not to implement Reasoning Mind (George Dealey, Gabe Allen, Harry Stone and Stevens
Park). Approximately 23 percent of the RM students were African American, 70 percent were Hispanic
and the remaining 7 percent were classified as Others. Fifty-two percent (52%) were males, while 48
percent were females. Fifty-one percent (51%) were limited English proficient (LEP) or English Language
4
Learners (ELL), eight percent were Special Education students and two percent were LEP Special
Education students. Economically disadvantaged students made up 90 percent of the second grade RM
population.
2.2 What were the demographic characteristics and credential status
of grade two mathematics teachers?
Methodology
Demographic and credential data were extracted from the Dallas ISD personnel and course file
databases on November 5, 2011. Job codes and course designations were used to identify elementary
mathematics teachers. Demographic information included gender, ethnicity, highest degree completed,
number of years of teaching experience in the Dallas ISD and type of certification.
Results
A total of 377 teachers were identified as the teacher of record for mathematics at grade 2 for
students at the 149 Title I schools. Of these teachers 82 percent were female and 18 percent were male.
In addition, 32 percent were African Americans, 40 percent were Hispanics, 26 percent were White and
2 percent were Others. Of the second grade mathematics teachers 65 percent had bachelor’s degrees,
30 percent had Master’s degrees, 1 percent had Doctorate’s and 5 percent had missing information
(Table 1). Thirty-nine percent (39%) of the teachers had five or less years of teaching experience in the
district. However, 13 percent had 21 or more years of district teaching experience. The median number
of years of experience in the district was eight years for second grade mathematics teachers. In addition,
three percent of the second grade mathematics teachers held alternative certifications.
5
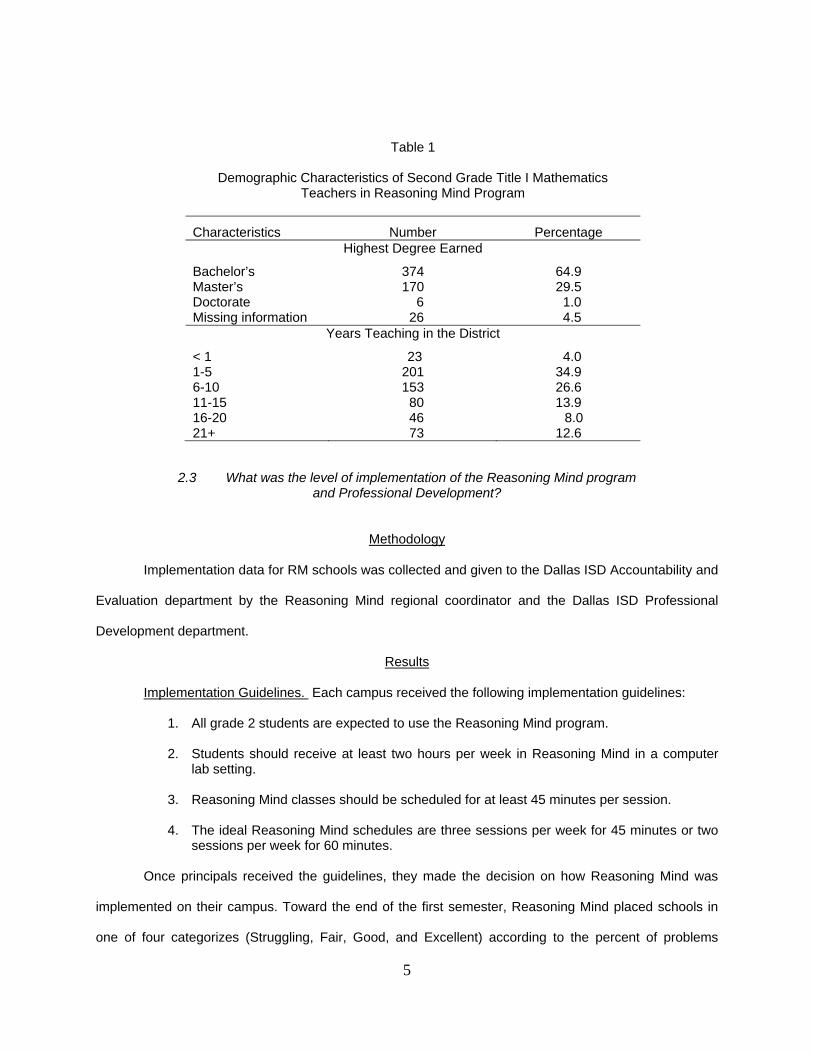
Table 1
Demographic Characteristics of Second Grade Title I Mathematics Teachers in Reasoning Mind Program
Characteristics Number Percentage Highest Degree Earned
Bachelor’s 374 64.9 Master’s 170 29.5 Doctorate 6 1.0 Missing information 26 4.5
Years Teaching in the District
< 1 23 4.0 1-5 201 34.9 6-10 153 26.6 11-15 80 13.9 16-20 46 8.0 21+ 73 12.6
2.3 What was the level of implementation of the Reasoning Mind program and Professional Development?
Methodology
Implementation data for RM schools was collected and given to the Dallas ISD Accountability and
Evaluation department by the Reasoning Mind regional coordinator and the Dallas ISD Professional
Development department.
Results
Implementation Guidelines. Each campus received the following implementation guidelines:
1. All grade 2 students are expected to use the Reasoning Mind program.
2. Students should receive at least two hours per week in Reasoning Mind in a computer lab setting.
3. Reasoning Mind classes should be scheduled for at least 45 minutes per session.
4. The ideal Reasoning Mind schedules are three sessions per week for 45 minutes or two sessions per week for 60 minutes.
Once principals received the guidelines, they made the decision on how Reasoning Mind was
implemented on their campus. Toward the end of the first semester, Reasoning Mind placed schools in
one of four categorizes (Struggling, Fair, Good, and Excellent) according to the percent of problems
6
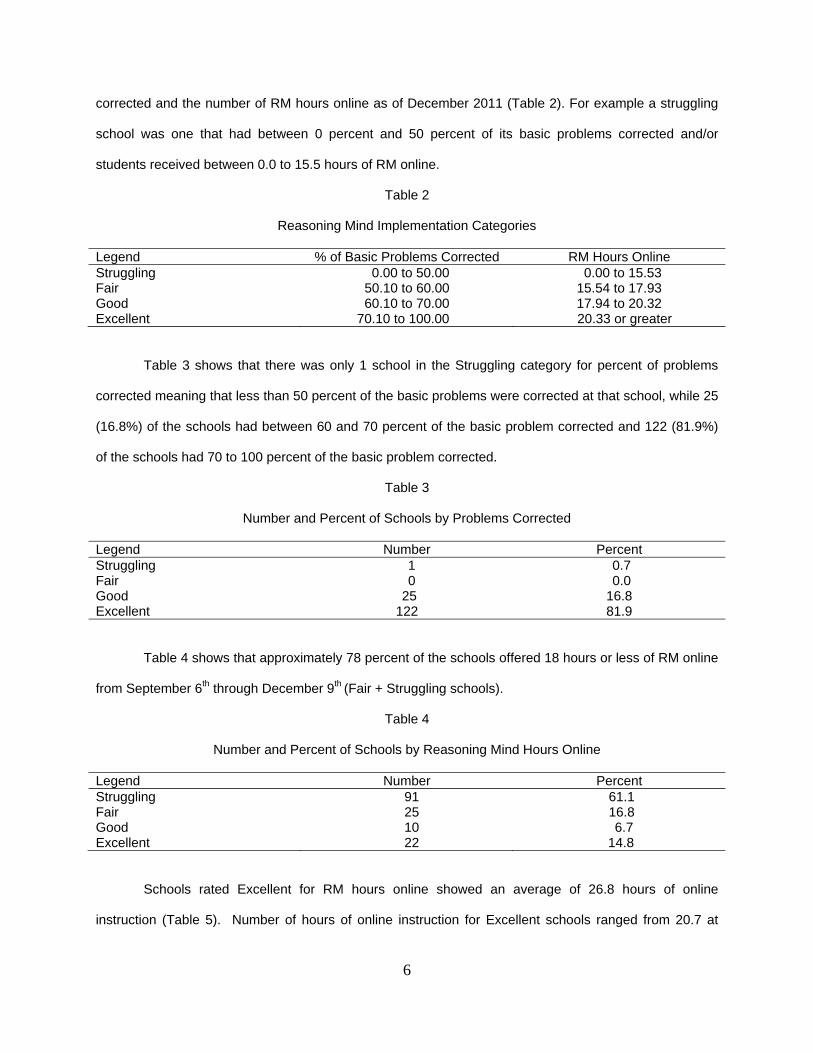
corrected and the number of RM hours online as of December 2011 (Table 2). For example a struggling
school was one that had between 0 percent and 50 percent of its basic problems corrected and/or
students received between 0.0 to 15.5 hours of RM online.
Table 2
Reasoning Mind Implementation Categories
Legend % of Basic Problems Corrected RM Hours Online Struggling 0.00 to 50.00 0.00 to 15.53 Fair 50.10 to 60.00 15.54 to 17.93 Good 60.10 to 70.00 17.94 to 20.32 Excellent 70.10 to 100.00 20.33 or greater
Table 3 shows that there was only 1 school in the Struggling category for percent of problems
corrected meaning that less than 50 percent of the basic problems were corrected at that school, while 25
(16.8%) of the schools had between 60 and 70 percent of the basic problem corrected and 122 (81.9%)
of the schools had 70 to 100 percent of the basic problem corrected.
Table 3
Number and Percent of Schools by Problems Corrected
Legend Number Percent Struggling 1 0.7 Fair 0 0.0 Good 25 16.8 Excellent 122 81.9
Table 4 shows that approximately 78 percent of the schools offered 18 hours or less of RM online
from September 6th through December 9th (Fair + Struggling schools).
Table 4
Number and Percent of Schools by Reasoning Mind Hours Online
Legend Number Percent Struggling 91 61.1 Fair 25 16.8 Good 10 6.7 Excellent 22 14.8
Schools rated Excellent for RM hours online showed an average of 26.8 hours of online
instruction (Table 5). Number of hours of online instruction for Excellent schools ranged from 20.7 at
7
Miller to 46.3 at Bonham. Of the 149 schools in the RM program 22 (14.8%) were classified as Excellent
for number of hours online.
Schools rated Good for RM hours online showed an average of 18.8 hours of online instruction.
Number of hours of online instruction ranged from 18.0 at Dorsey to 19.9 at Pershing. Of the 149 schools
in the RM program 10 (6.7%) were classified as Good for number of hours online.
Schools rated Fair for RM hours online showed an average of 16.7 hours of online instruction.
Number of hours of online instruction ranged from 15.6 at Holland to 17.9 at both Cowart and Turner. Of
the 149 schools in the RM program 25 (16.8%) were classified as Fair for number of hours online.
Schools rated Struggling for RM hours online showed an average of 8.46 hours of online
instruction. Number of hours of online instruction ranged from 0.0 at Alexander to 16.4 at Terry. Of the
149 schools in the RM program 91 (61.1%) were classified as Struggling for number of hours online.
Overall, the average number of hours of RM instruction for all second grade students for the first
semester was 13.4 hours. Given that only one school was in the Struggling category for problems related
to implementation it would seem then that the struggling group should have more RM hours online. The
range for the 149 Dallas ISD schools for RM online instruction was from 46 hours to 0 hours.
Table 5
Average Reasoning Mind Hours Online by Category
Legend Number Percent Average No. of Hours Online Instruction
Struggling 91 61.1 8.46Fair 25 16.8 16.66Good 10 6.7 18.81Excellent 22 14.8 26.80Total 1481 100.0 13.40 1 Data was unavailable for the Disciplinary Alternative Education Program (DAEP)
Data provided by Reasoning Mind shows that the average number of hours online for Dallas ISD
students for the year was 30.6 hours. That indicates that students received 13.4 hours online in semester
one and 17.2 hours online in semester two. Based on six six-weeks sessions for a total of 36 weeks in a
school year, the students received approximately 50 minutes of instruction per week. The range of online
instruction was from 0.0 hours to 168.9 hours. One has to question the validity of the hours online data.
For students to receive 160 or more hours of RM, they would have to receive 4 hours a week of online
8
instruction every week of the school year. In addition, variations within schools seem very unlikely,e.g.,
school A has a range of 124 hours of online instruction with students receiving as little as 27 hours of
instruction and as much as 151 hours (see Appendix A). Variations within schools such as the one just
cited were quite common. Given these ranges and other anomalies in the data the veracity of the hours
online data is highly questionable. A frequency distribution of hours online instruction showed that over
1,000 students received 10 hours or less of RM instruction for the year. It is this evaluator’s
understanding that the district pays for individual registration for each student, and that would amount to a
thousand registration fees for students receiving 17 minutes or less of instruction per week.
Reasoning Mind provided an extensive teacher professional development program to ensure that
teachers are prepared for their new role and familiar with the RM curriculum. The program consists of a
combination online and in-person Teacher Qualification Course, and continues with an additional
yearlong Certification Course which teachers take concurrently with their first year of RM teaching. These
courses are designed to expand teachers’ knowledge of mathematics content and pedagogy, but also to
support higher-quality classroom instruction. In addition, teachers receive ongoing professional
development through structured collaborations with Program Coordinators, as well as access to tutorials
and symposiums hosted by RM.
Reasoning Mind also provides ongoing support to teachers and students in schools using the
program. Program Coordinators meet regularly with teachers to monitor the progress of each classroom.
Program Coordinators also provide support and guidance to effectively integrate technology into their
classrooms.
Data available through the district’s professional development department showed that
Reasoning Mind had two sessions, a day 1 and a day 2 session for grade 2 teachers. Reasoning Mind's
training was a two-day, computer-based course designed to introduce teachers to basic system,
curriculum, and implementation knowledge needed to start a Reasoning Mind classroom in grade 2.
Since a stipend was paid for day 2, it could not be used to satisfy mandatory content credit/compensatory
time requirements. Day 1 sessions (Content Credit) were attended by 222 teachers and were held on
June 27, July 11, 13, 18, 20 & 25, and August 1, 3, 8, 10 & 11 of 2011. Day 2 sessions (Stipend Credit)
9
attended by 214 teachers were held on the following days: June 28, July 12, 14, 19, 21 & 26, and August
4, 9, 11 & 12 of 2011.
2.4 What was the level of performance of Reasoning Mind students on the ITBS?
Methodology
Mathematics subtests of the Iowa Tests of Basic Skills (ITBS) have been used to determine the
level of performance of Reasoning Mind students. Mathematics Total results used for analysis are
combinations of the Mathematics Concepts, Mathematics Problems, and Mathematics Computation
subtest results. Mathematics Computation statistics are provided separately. The following tables and
figures show the ITBS results for second grade students from 2007-08 to 2011-12. The number and
percent of students at or above the 40th and 80th percentile are reported for both Mathematics Total and
Mathematics Computation.
Results
Table 6 and Figure 1 report the results of the ITBS Mathematics Total by year and student group.
Overall, the district result of 58.0 percent of second grade students at or above the 40th percentile shows
an increase of 1.1 percentage points over the previous year; however, the 2011 results showed an
increase of 2.2 percentage points over the 2010 results. Although increases were reported for all student
groups, with the exception of African American students, the increases were less than those reported for
2010 to 2011 for all student groups. The White student group did perform at a higher level than other
student groups.
Table 6
Percent of Students at or Above the 40th Percentile on the ITBS Mathematics Total within Student Group and Year
School Student Groups Year Ending White
African American Hispanic
Econ Disadv
Special Educ LEP District
Number Tested
2008 75.0 53.0 57.9 56.2 28.2 54.8 57.5 13,407
2009 74.5 47.4 54.3 50.7 27.2 47.0 53.2 8,787
2010 76.1 49.7 54.7 53.1 21.8 52.7 54.6 13,231
2011 78.0 50.6 57.5 55.6 24.8 56.2 56.8 13,135
2012* 82.7 48.9 59.0 56.2 26.0 57.1 57.9 13,603 Source: MyData Portal Dallas ISD *School year when Reasoning Mind was implemented.
10
Figure 1 is a graphical presentation of the data presented in Table 6.
Figure 1 Percent students at or above 40th percentile on ITBS Mathematics Total within student group and
year.
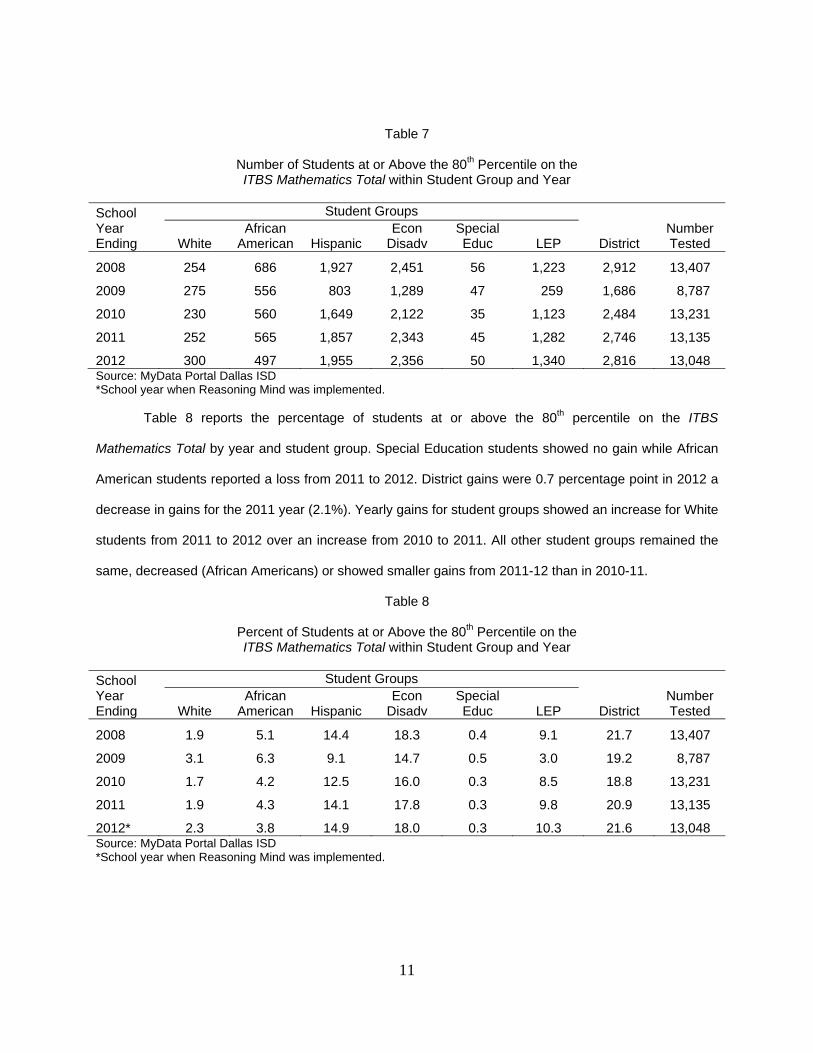
Table 7 presents the number of students at or above the 80th percentile on the ITBS Mathematics
Total by year and student group. With the exception of the White subgroup all other student groups
showed a smaller gain in number from 2011 to 2012 than from the previous year. District totals show the
increase in number of students from 2010 to 2011 to be 262 students, while the increase from 2011 to
2012 was 70 students. In general, the number of students at or above the 80th percentile increased from
2011 to 2012, with the notable exception of African American students, but the increase is less than the
previous year.
White AfricanAm Hispanic Special
Ed LEP EconDisad District
2008 75 53 57.9 56.2 28.2 54.8 57.52009 74.5 47.4 54.3 50.7 27.2 47 53.22010 76.1 49.7 54.7 53.1 21.8 52.7 54.62011 78 50.6 57.5 55.6 24.8 56.2 56.82012 82.7 48.9 59 56.2 26 57.1 57.9
0
10
20
30
40
50
60
70
80
90
% Stude
nts a
t or A
bove
40th Pe
rcen
tile
11
Table 7
Number of Students at or Above the 80th Percentile on the ITBS Mathematics Total within Student Group and Year
School Student Groups Year Ending White
African American Hispanic
Econ Disadv
Special Educ LEP District
Number Tested
2008 254 686 1,927 2,451 56 1,223 2,912 13,407
2009 275 556 803 1,289 47 259 1,686 8,787
2010 230 560 1,649 2,122 35 1,123 2,484 13,231
2011 252 565 1,857 2,343 45 1,282 2,746 13,135
2012 300 497 1,955 2,356 50 1,340 2,816 13,048 Source: MyData Portal Dallas ISD *School year when Reasoning Mind was implemented.
Table 8 reports the percentage of students at or above the 80th percentile on the ITBS
Mathematics Total by year and student group. Special Education students showed no gain while African
American students reported a loss from 2011 to 2012. District gains were 0.7 percentage point in 2012 a
decrease in gains for the 2011 year (2.1%). Yearly gains for student groups showed an increase for White
students from 2011 to 2012 over an increase from 2010 to 2011. All other student groups remained the
same, decreased (African Americans) or showed smaller gains from 2011-12 than in 2010-11.
Table 8
Percent of Students at or Above the 80th Percentile on the ITBS Mathematics Total within Student Group and Year
School Student Groups Year Ending White
African American Hispanic
Econ Disadv
Special Educ LEP District
Number Tested
2008 1.9 5.1 14.4 18.3 0.4 9.1 21.7 13,407
2009 3.1 6.3 9.1 14.7 0.5 3.0 19.2 8,787
2010 1.7 4.2 12.5 16.0 0.3 8.5 18.8 13,231
2011 1.9 4.3 14.1 17.8 0.3 9.8 20.9 13,135
2012* 2.3 3.8 14.9 18.0 0.3 10.3 21.6 13,048 Source: MyData Portal Dallas ISD *School year when Reasoning Mind was implemented.
12
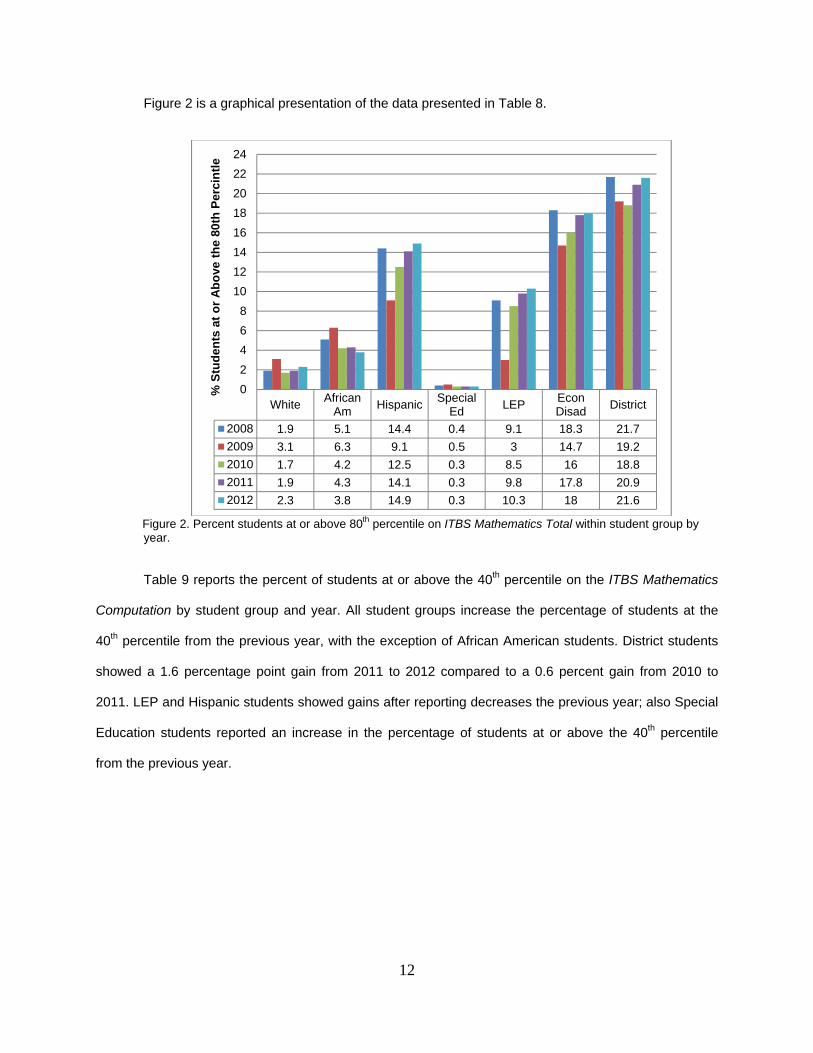
Figure 2 is a graphical presentation of the data presented in Table 8.
Figure 2. Percent students at or above 80th percentile on ITBS Mathematics Total within student group by
year.
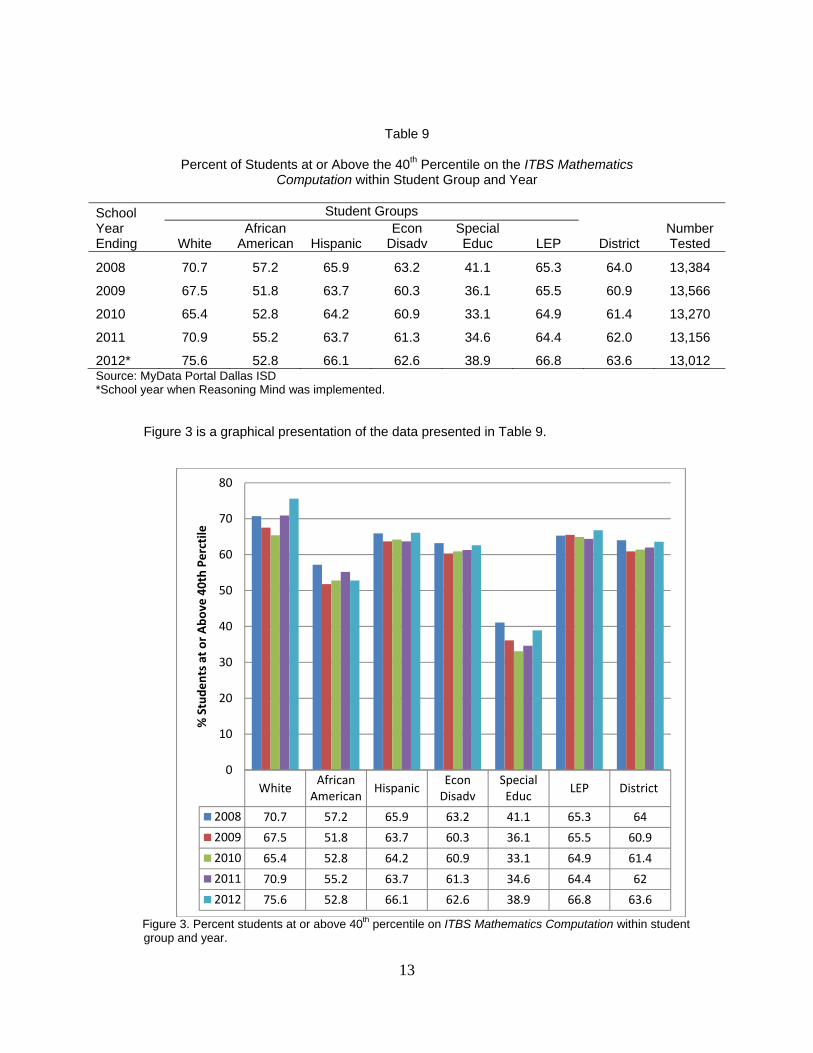
Table 9 reports the percent of students at or above the 40th percentile on the ITBS Mathematics
Computation by student group and year. All student groups increase the percentage of students at the
40th percentile from the previous year, with the exception of African American students. District students
showed a 1.6 percentage point gain from 2011 to 2012 compared to a 0.6 percent gain from 2010 to
2011. LEP and Hispanic students showed gains after reporting decreases the previous year; also Special
Education students reported an increase in the percentage of students at or above the 40th percentile
from the previous year.
White AfricanAm Hispanic Special
Ed LEP EconDisad District
2008 1.9 5.1 14.4 0.4 9.1 18.3 21.72009 3.1 6.3 9.1 0.5 3 14.7 19.22010 1.7 4.2 12.5 0.3 8.5 16 18.82011 1.9 4.3 14.1 0.3 9.8 17.8 20.92012 2.3 3.8 14.9 0.3 10.3 18 21.6
02468
1012141618202224
% S
tude
nts
at o
r Abo
ve th
e 80
th P
erci
ntle
13
Table 9
Percent of Students at or Above the 40th Percentile on the ITBS Mathematics Computation within Student Group and Year
School Student Groups Year Ending White
African American Hispanic
Econ Disadv
Special Educ LEP District
Number Tested
2008 70.7 57.2 65.9 63.2 41.1 65.3 64.0 13,384
2009 67.5 51.8 63.7 60.3 36.1 65.5 60.9 13,566
2010 65.4 52.8 64.2 60.9 33.1 64.9 61.4 13,270
2011 70.9 55.2 63.7 61.3 34.6 64.4 62.0 13,156
2012* 75.6 52.8 66.1 62.6 38.9 66.8 63.6 13,012 Source: MyData Portal Dallas ISD *School year when Reasoning Mind was implemented.
Figure 3 is a graphical presentation of the data presented in Table 9.
Figure 3. Percent students at or above 40th percentile on ITBS Mathematics Computation within student
group and year.
White AfricanAmerican Hispanic Econ
DisadvSpecialEduc LEP District
2008 70.7 57.2 65.9 63.2 41.1 65.3 642009 67.5 51.8 63.7 60.3 36.1 65.5 60.92010 65.4 52.8 64.2 60.9 33.1 64.9 61.42011 70.9 55.2 63.7 61.3 34.6 64.4 622012 75.6 52.8 66.1 62.6 38.9 66.8 63.6
0
10
20
30
40
50
60
70
80
% Stude
nts a
t or A
bove
40th Pe
rctile
14
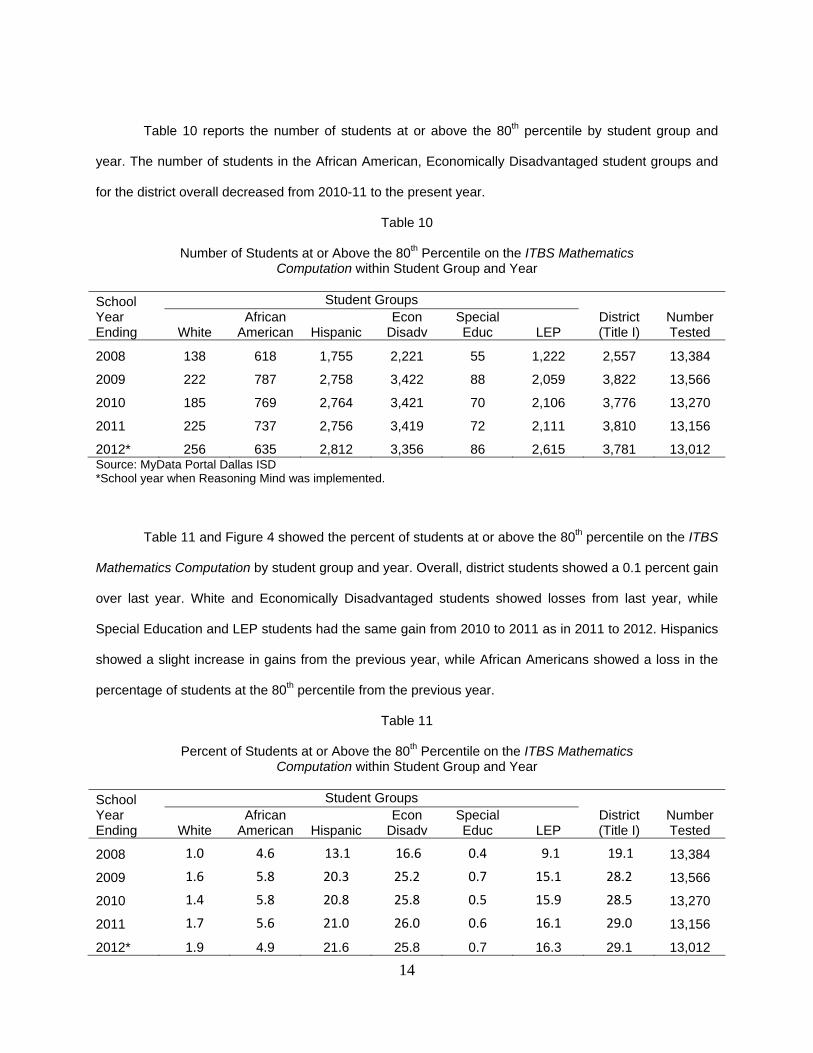
Table 10 reports the number of students at or above the 80th percentile by student group and
year. The number of students in the African American, Economically Disadvantaged student groups and
for the district overall decreased from 2010-11 to the present year.
Table 10
Number of Students at or Above the 80th Percentile on the ITBS Mathematics Computation within Student Group and Year
School Student Groups Year Ending White
African American Hispanic
Econ Disadv
Special Educ LEP
District (Title I)
Number Tested
2008 138 618 1,755 2,221 55 1,222 2,557 13,384
2009 222 787 2,758 3,422 88 2,059 3,822 13,566
2010 185 769 2,764 3,421 70 2,106 3,776 13,270
2011 225 737 2,756 3,419 72 2,111 3,810 13,156
2012* 256 635 2,812 3,356 86 2,615 3,781 13,012 Source: MyData Portal Dallas ISD *School year when Reasoning Mind was implemented.
Table 11 and Figure 4 showed the percent of students at or above the 80th percentile on the ITBS
Mathematics Computation by student group and year. Overall, district students showed a 0.1 percent gain
over last year. White and Economically Disadvantaged students showed losses from last year, while
Special Education and LEP students had the same gain from 2010 to 2011 as in 2011 to 2012. Hispanics
showed a slight increase in gains from the previous year, while African Americans showed a loss in the
percentage of students at the 80th percentile from the previous year.
Table 11
Percent of Students at or Above the 80th Percentile on the ITBS Mathematics Computation within Student Group and Year
School Student Groups Year Ending White
African American Hispanic
Econ Disadv
Special Educ LEP
District (Title I)
Number Tested
2008 1.0 4.6 13.1 16.6 0.4 9.1 19.1 13,384
2009 1.6 5.8 20.3 25.2 0.7 15.1 28.2 13,566
2010 1.4 5.8 20.8 25.8 0.5 15.9 28.5 13,270
2011 1.7 5.6 21.0 26.0 0.6 16.1 29.0 13,156
2012* 1.9 4.9 21.6 25.8 0.7 16.3 29.1 13,012
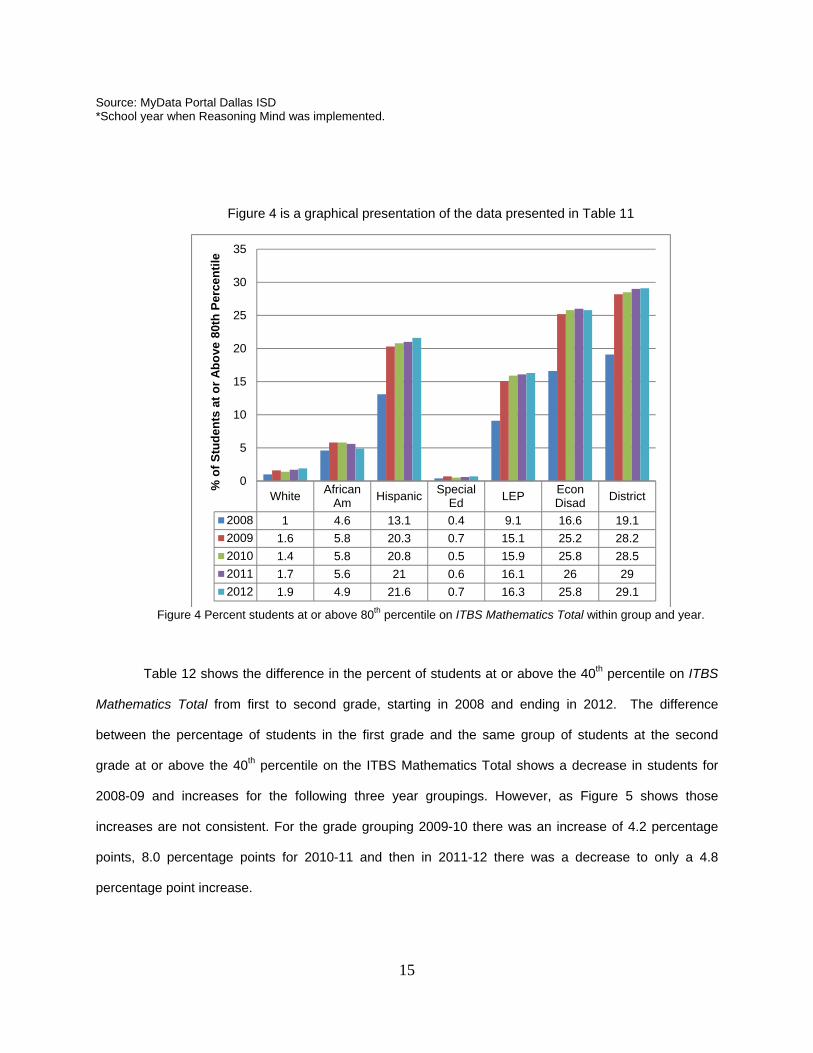
15
Source: MyData Portal Dallas ISD *School year when Reasoning Mind was implemented.
Figure 4 is a graphical presentation of the data presented in Table 11
Figure 4 Percent students at or above 80th percentile on ITBS Mathematics Total within group and year.
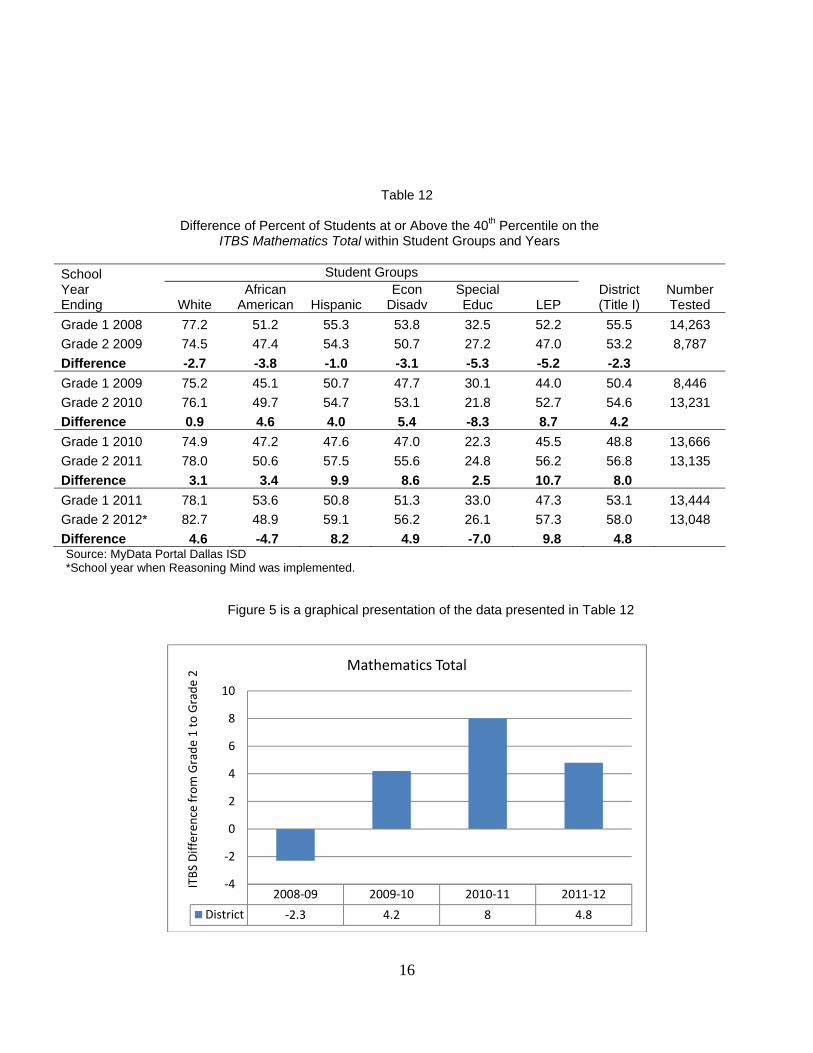
Table 12 shows the difference in the percent of students at or above the 40th percentile on ITBS
Mathematics Total from first to second grade, starting in 2008 and ending in 2012. The difference
between the percentage of students in the first grade and the same group of students at the second
grade at or above the 40th percentile on the ITBS Mathematics Total shows a decrease in students for
2008-09 and increases for the following three year groupings. However, as Figure 5 shows those
increases are not consistent. For the grade grouping 2009-10 there was an increase of 4.2 percentage
points, 8.0 percentage points for 2010-11 and then in 2011-12 there was a decrease to only a 4.8
percentage point increase.
White AfricanAm Hispanic Special
Ed LEP EconDisad District
2008 1 4.6 13.1 0.4 9.1 16.6 19.12009 1.6 5.8 20.3 0.7 15.1 25.2 28.22010 1.4 5.8 20.8 0.5 15.9 25.8 28.52011 1.7 5.6 21 0.6 16.1 26 292012 1.9 4.9 21.6 0.7 16.3 25.8 29.1
0
5
10
15
20
25
30
35
% o
f Stu
dent
s at
or A
bove
80t
h Pe
rcen
tile
16
Table 12
Difference of Percent of Students at or Above the 40th Percentile on the ITBS Mathematics Total within Student Groups and Years
School Student Groups Year Ending White
African American Hispanic
Econ Disadv
Special Educ LEP
District (Title I)
Number Tested
Grade 1 2008 77.2 51.2 55.3 53.8 32.5 52.2 55.5 14,263 Grade 2 2009 74.5 47.4 54.3 50.7 27.2 47.0 53.2 8,787 Difference -2.7 -3.8 -1.0 -3.1 -5.3 -5.2 -2.3 Grade 1 2009 75.2 45.1 50.7 47.7 30.1 44.0 50.4 8,446 Grade 2 2010 76.1 49.7 54.7 53.1 21.8 52.7 54.6 13,231 Difference 0.9 4.6 4.0 5.4 -8.3 8.7 4.2 Grade 1 2010 74.9 47.2 47.6 47.0 22.3 45.5 48.8 13,666 Grade 2 2011 78.0 50.6 57.5 55.6 24.8 56.2 56.8 13,135 Difference 3.1 3.4 9.9 8.6 2.5 10.7 8.0 Grade 1 2011 78.1 53.6 50.8 51.3 33.0 47.3 53.1 13,444 Grade 2 2012* 82.7 48.9 59.1 56.2 26.1 57.3 58.0 13,048 Difference 4.6 -4.7 8.2 4.9 -7.0 9.8 4.8 Source: MyData Portal Dallas ISD *School year when Reasoning Mind was implemented.
Figure 5 is a graphical presentation of the data presented in Table 12
2008‐09 2009‐10 2010‐11 2011‐12District ‐2.3 4.2 8 4.8
‐4
‐2
0
2
4
6
8
10
ITBS
Differen
ce from
Grade
1 to
Grade
2
Mathematics Total
17
Figure 5. Differences in the Percent of Students at or Above 40th Percentile from First to Second Grade on ITBS Mathematics Total.
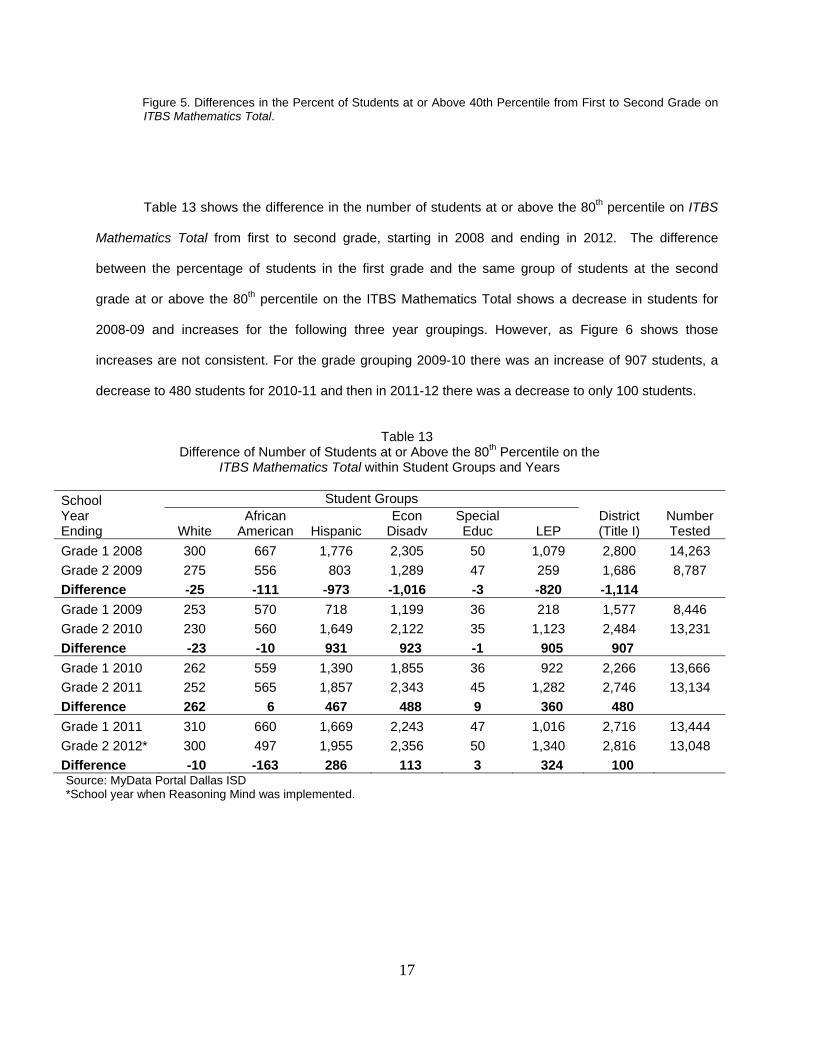
Table 13 shows the difference in the number of students at or above the 80th percentile on ITBS
Mathematics Total from first to second grade, starting in 2008 and ending in 2012. The difference
between the percentage of students in the first grade and the same group of students at the second
grade at or above the 80th percentile on the ITBS Mathematics Total shows a decrease in students for
2008-09 and increases for the following three year groupings. However, as Figure 6 shows those
increases are not consistent. For the grade grouping 2009-10 there was an increase of 907 students, a
decrease to 480 students for 2010-11 and then in 2011-12 there was a decrease to only 100 students.
Table 13
Difference of Number of Students at or Above the 80th Percentile on the ITBS Mathematics Total within Student Groups and Years
School Student Groups Year Ending White
African American Hispanic
Econ Disadv
Special Educ LEP
District (Title I)
Number Tested
Grade 1 2008 300 667 1,776 2,305 50 1,079 2,800 14,263 Grade 2 2009 275 556 803 1,289 47 259 1,686 8,787 Difference -25 -111 -973 -1,016 -3 -820 -1,114 Grade 1 2009 253 570 718 1,199 36 218 1,577 8,446 Grade 2 2010 230 560 1,649 2,122 35 1,123 2,484 13,231 Difference -23 -10 931 923 -1 905 907 Grade 1 2010 262 559 1,390 1,855 36 922 2,266 13,666 Grade 2 2011 252 565 1,857 2,343 45 1,282 2,746 13,134 Difference 262 6 467 488 9 360 480 Grade 1 2011 310 660 1,669 2,243 47 1,016 2,716 13,444 Grade 2 2012* 300 497 1,955 2,356 50 1,340 2,816 13,048 Difference -10 -163 286 113 3 324 100 Source: MyData Portal Dallas ISD *School year when Reasoning Mind was implemented.
18
Figure 6 is a graphical presentation of the data presented in Table 13
Figure 6. Difference in the number of students at or above the 80th percentile from first to second grade on
the ITBS Mathematics Total.
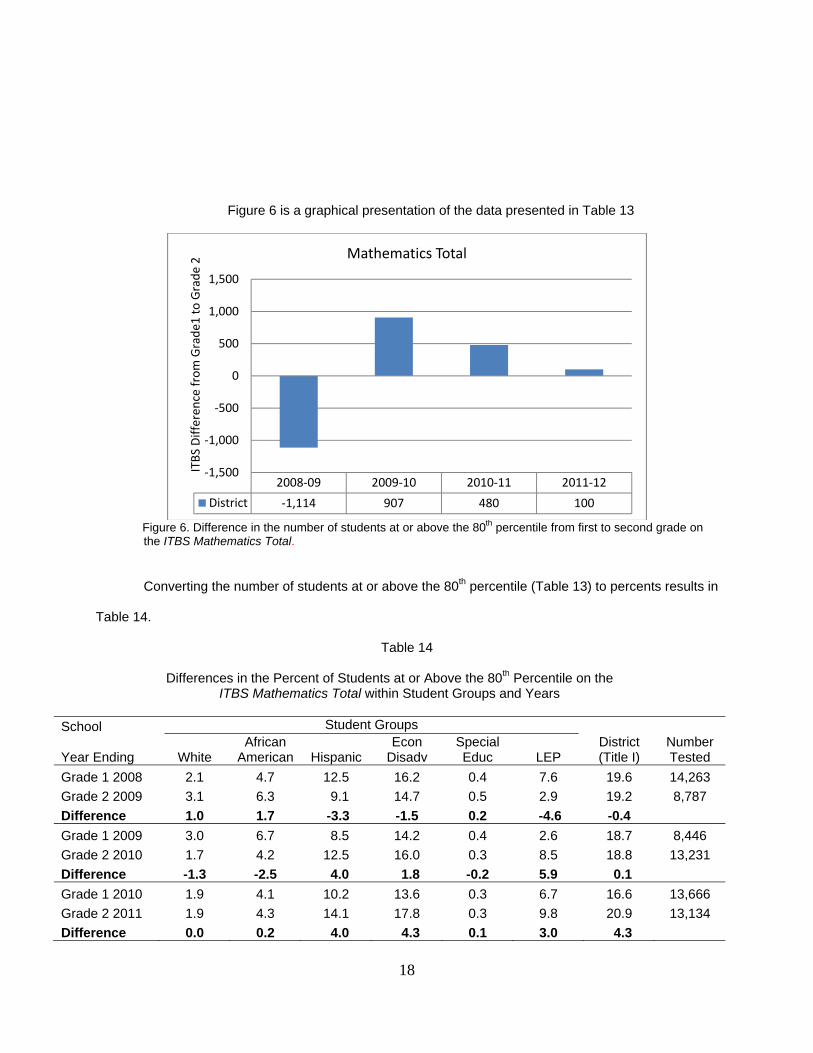
Converting the number of students at or above the 80th percentile (Table 13) to percents results in
Table 14.
Table 14
Differences in the Percent of Students at or Above the 80th Percentile on the ITBS Mathematics Total within Student Groups and Years
School Student Groups
Year Ending White African
American Hispanic Econ
Disadv Special Educ LEP
District (Title I)
Number Tested
Grade 1 2008 2.1 4.7 12.5 16.2 0.4 7.6 19.6 14,263 Grade 2 2009 3.1 6.3 9.1 14.7 0.5 2.9 19.2 8,787 Difference 1.0 1.7 -3.3 -1.5 0.2 -4.6 -0.4 Grade 1 2009 3.0 6.7 8.5 14.2 0.4 2.6 18.7 8,446 Grade 2 2010 1.7 4.2 12.5 16.0 0.3 8.5 18.8 13,231 Difference -1.3 -2.5 4.0 1.8 -0.2 5.9 0.1 Grade 1 2010 1.9 4.1 10.2 13.6 0.3 6.7 16.6 13,666 Grade 2 2011 1.9 4.3 14.1 17.8 0.3 9.8 20.9 13,134 Difference 0.0 0.2 4.0 4.3 0.1 3.0 4.3
2008‐09 2009‐10 2010‐11 2011‐12District ‐1,114 907 480 100
‐1,500
‐1,000
‐500
0
500
1,000
1,500
ITBS
Differen
ce from
Grade
1 to Grade
2
Mathematics Total
19
Grade 1 2011 2.3 4.9 12.4 16.7 0.3 7.6 20.2 13,444 Grade 2 2012* 2.3 3.8 15.0 18.1 0.4 10.3 21.6 13,048 Difference 0.0 -1.1 2.6 1.4 0.0 2.7 1.4 *School year when Reasoning Mind was implemented.
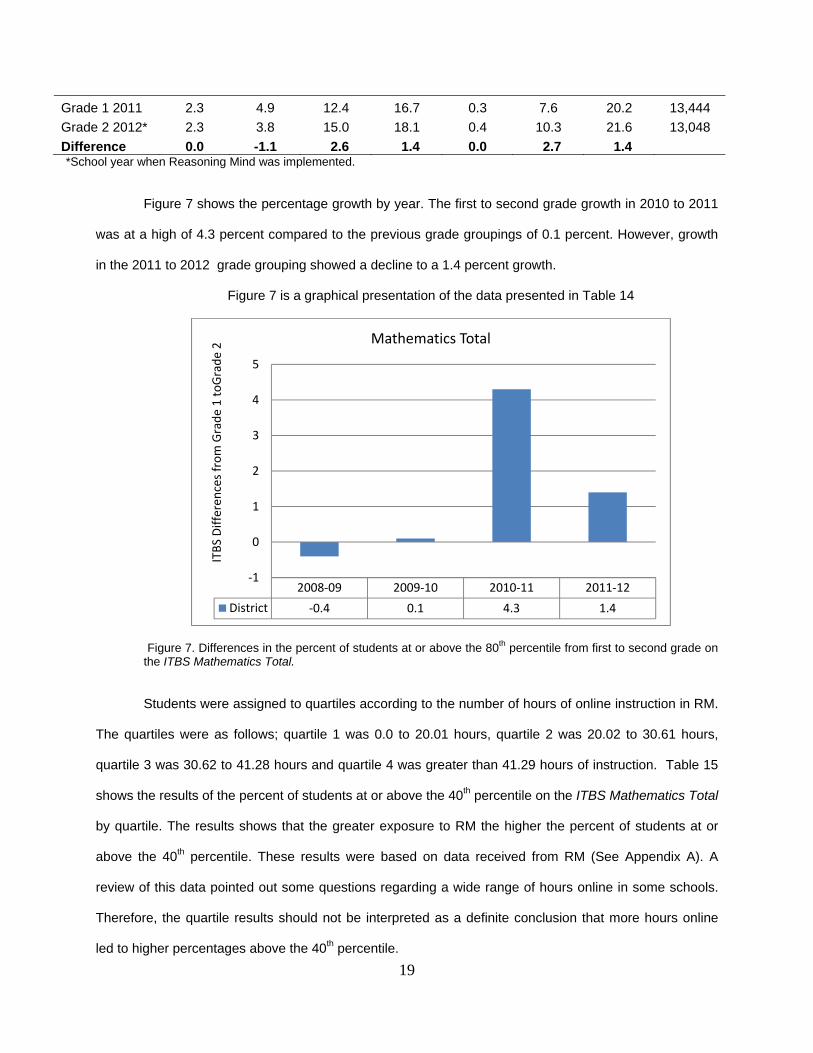
Figure 7 shows the percentage growth by year. The first to second grade growth in 2010 to 2011
was at a high of 4.3 percent compared to the previous grade groupings of 0.1 percent. However, growth
in the 2011 to 2012 grade grouping showed a decline to a 1.4 percent growth.
Figure 7 is a graphical presentation of the data presented in Table 14
Figure 7. Differences in the percent of students at or above the 80th percentile from first to second grade on the ITBS Mathematics Total.
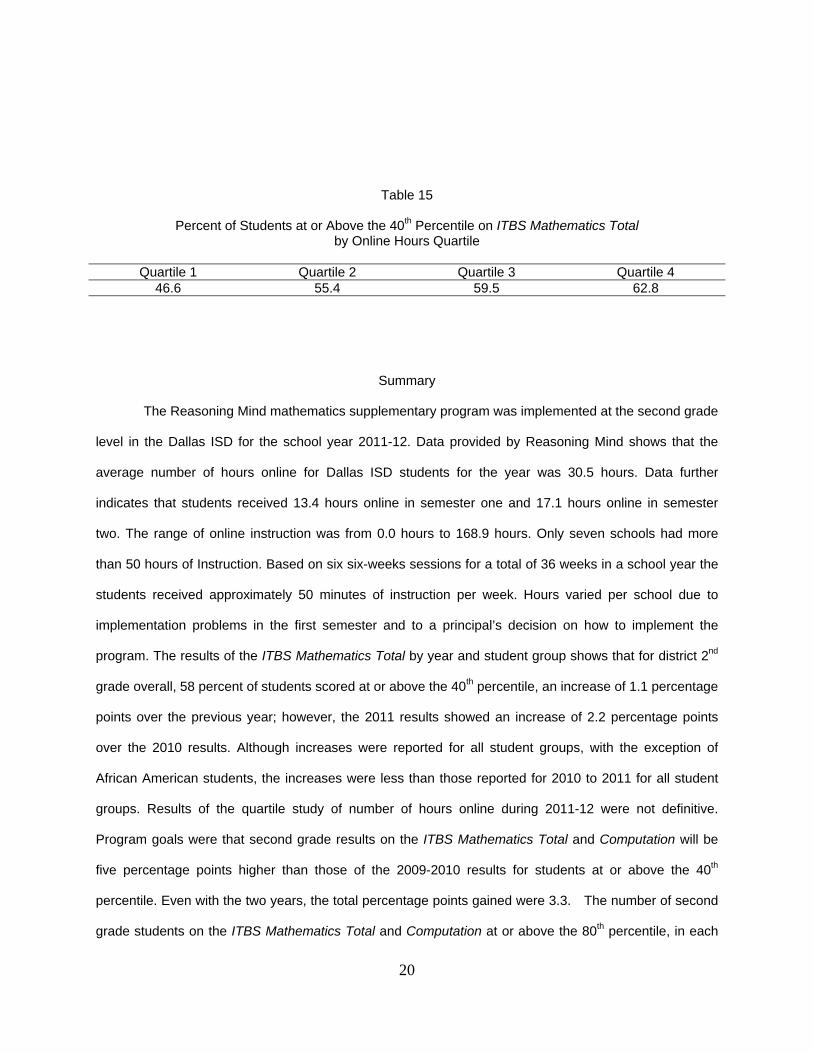
Students were assigned to quartiles according to the number of hours of online instruction in RM.
The quartiles were as follows; quartile 1 was 0.0 to 20.01 hours, quartile 2 was 20.02 to 30.61 hours,
quartile 3 was 30.62 to 41.28 hours and quartile 4 was greater than 41.29 hours of instruction. Table 15
shows the results of the percent of students at or above the 40th percentile on the ITBS Mathematics Total
by quartile. The results shows that the greater exposure to RM the higher the percent of students at or
above the 40th percentile. These results were based on data received from RM (See Appendix A). A
review of this data pointed out some questions regarding a wide range of hours online in some schools.
Therefore, the quartile results should not be interpreted as a definite conclusion that more hours online
led to higher percentages above the 40th percentile.
2008‐09 2009‐10 2010‐11 2011‐12District ‐0.4 0.1 4.3 1.4
‐1
0
1
2
3
4
5
ITBS
Differen
ces from Grade
1 to
Grade
2
Mathematics Total
20
Table 15
Percent of Students at or Above the 40th Percentile on ITBS Mathematics Total by Online Hours Quartile
Quartile 1 Quartile 2 Quartile 3 Quartile 4
46.6 55.4 59.5 62.8
Summary
The Reasoning Mind mathematics supplementary program was implemented at the second grade
level in the Dallas ISD for the school year 2011-12. Data provided by Reasoning Mind shows that the
average number of hours online for Dallas ISD students for the year was 30.5 hours. Data further
indicates that students received 13.4 hours online in semester one and 17.1 hours online in semester
two. The range of online instruction was from 0.0 hours to 168.9 hours. Only seven schools had more
than 50 hours of Instruction. Based on six six-weeks sessions for a total of 36 weeks in a school year the
students received approximately 50 minutes of instruction per week. Hours varied per school due to
implementation problems in the first semester and to a principal’s decision on how to implement the
program. The results of the ITBS Mathematics Total by year and student group shows that for district 2nd
grade overall, 58 percent of students scored at or above the 40th percentile, an increase of 1.1 percentage
points over the previous year; however, the 2011 results showed an increase of 2.2 percentage points
over the 2010 results. Although increases were reported for all student groups, with the exception of
African American students, the increases were less than those reported for 2010 to 2011 for all student
groups. Results of the quartile study of number of hours online during 2011-12 were not definitive.
Program goals were that second grade results on the ITBS Mathematics Total and Computation will be
five percentage points higher than those of the 2009-2010 results for students at or above the 40th
percentile. Even with the two years, the total percentage points gained were 3.3. The number of second
grade students on the ITBS Mathematics Total and Computation at or above the 80th percentile, in each
21
sub-population will increase by at least ten percentage points higher than the number of students in
2009-2010. One has to question why goals were set for comparisons with two year old data rather than
last year’s data. Given that district ITBS scores for second grade students have been increasing since
2009 it would seem that Reasoning Mind would be getting credit for increasing scores in 2010 when the
program was not in Dallas ISD second grade at the time.
In general, Reasoning Mind did not achieve their stated goals of increasing mathematics
achievement by the proposed amount for second grade Dallas ISD students. This is a costly program,
approximately $1,500,000 for the 2011-12 school year. Program results did not indicate significant
improvements for students served. Program implementation was not a major focus of this report;
however, there were indications that fidelity of implementation may be an issue. Therefore, since the
district has funded and expanded the program for 2012-13, evaluation should focus on both achievement
and implementation results. There should be oversight by district personnel to ensure appropriate
implementation.
22
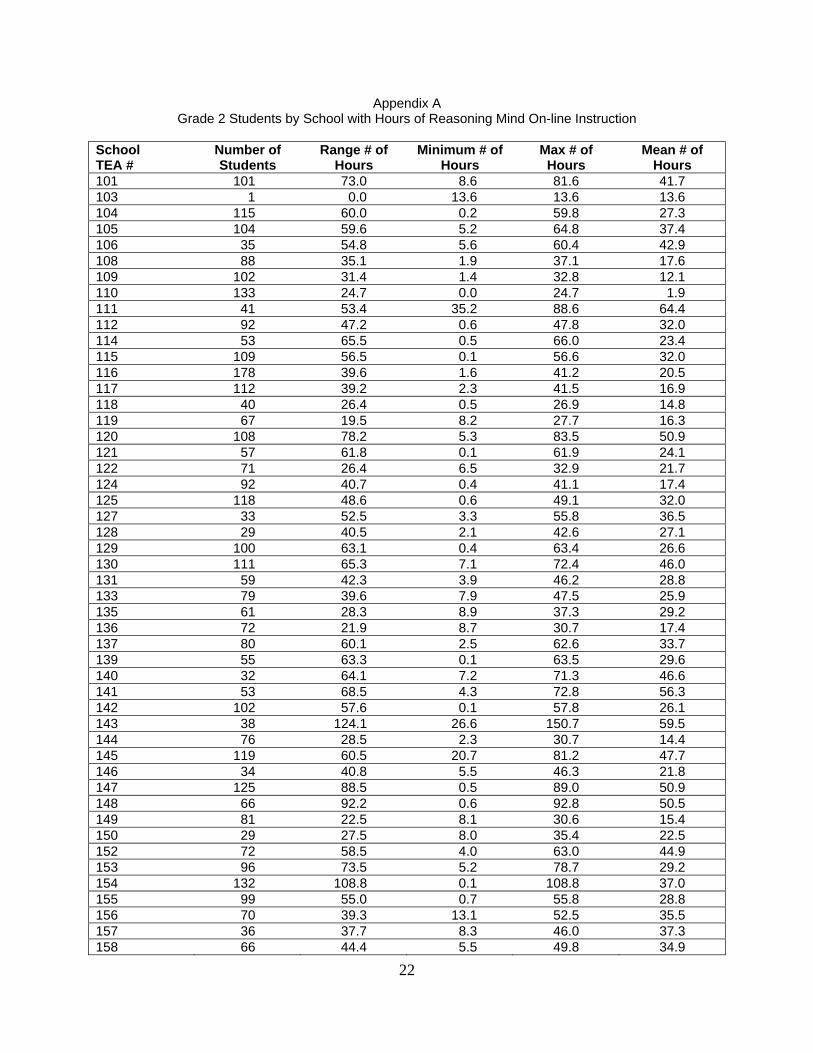
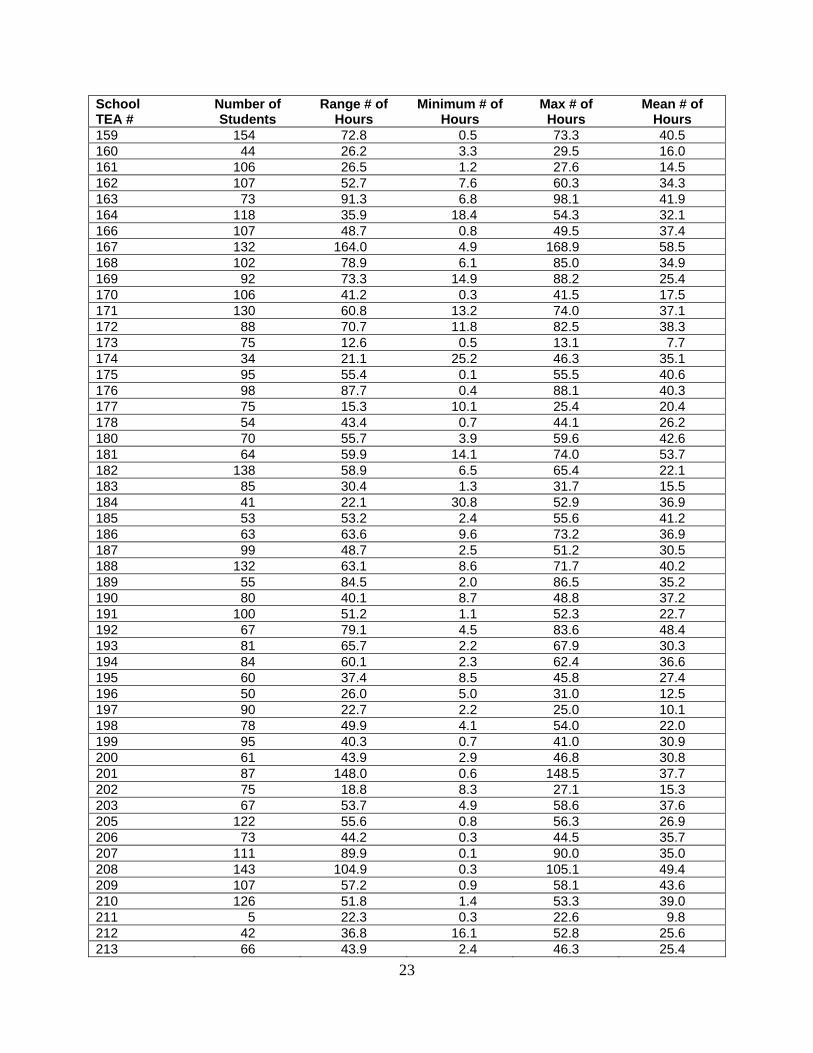
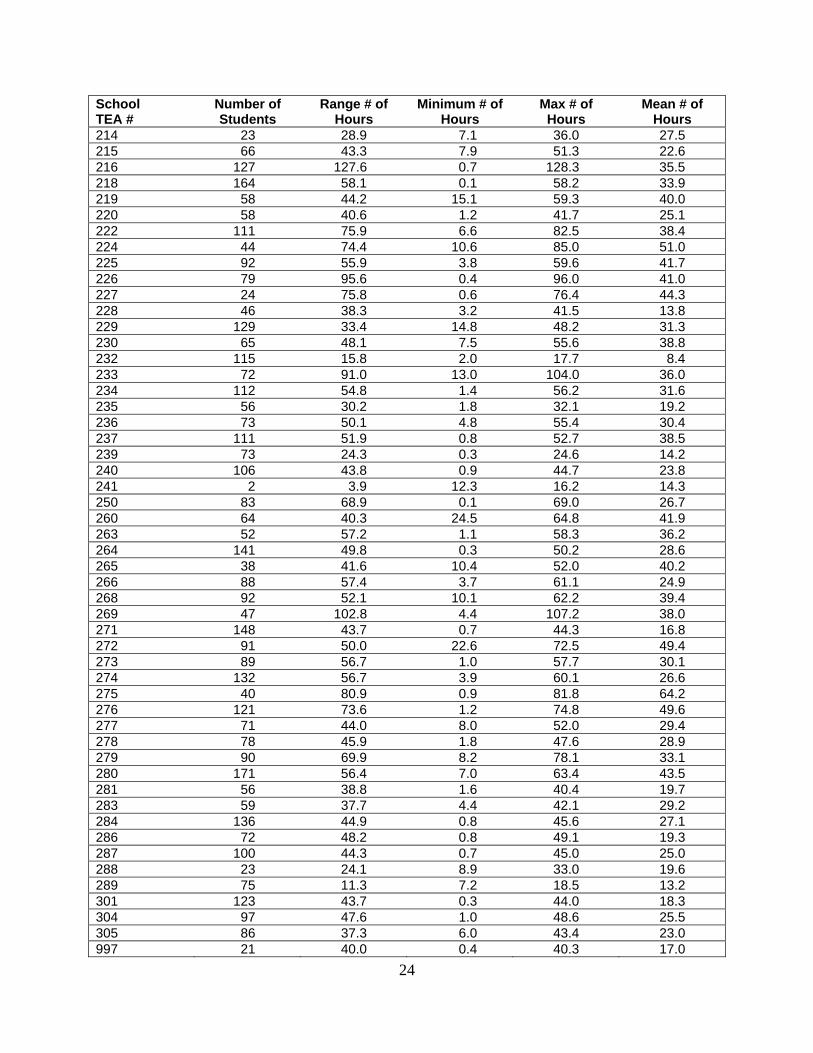
Appendix A Grade 2 Students by School with Hours of Reasoning Mind On-line Instruction
School TEA #
Number of Students
Range # of Hours
Minimum # of Hours
Max # of Hours
Mean # of Hours
101 101 73.0 8.6 81.6 41.7 103 1 0.0 13.6 13.6 13.6 104 115 60.0 0.2 59.8 27.3 105 104 59.6 5.2 64.8 37.4 106 35 54.8 5.6 60.4 42.9 108 88 35.1 1.9 37.1 17.6 109 102 31.4 1.4 32.8 12.1 110 133 24.7 0.0 24.7 1.9 111 41 53.4 35.2 88.6 64.4 112 92 47.2 0.6 47.8 32.0 114 53 65.5 0.5 66.0 23.4 115 109 56.5 0.1 56.6 32.0 116 178 39.6 1.6 41.2 20.5 117 112 39.2 2.3 41.5 16.9 118 40 26.4 0.5 26.9 14.8 119 67 19.5 8.2 27.7 16.3 120 108 78.2 5.3 83.5 50.9 121 57 61.8 0.1 61.9 24.1 122 71 26.4 6.5 32.9 21.7 124 92 40.7 0.4 41.1 17.4 125 118 48.6 0.6 49.1 32.0 127 33 52.5 3.3 55.8 36.5 128 29 40.5 2.1 42.6 27.1 129 100 63.1 0.4 63.4 26.6 130 111 65.3 7.1 72.4 46.0 131 59 42.3 3.9 46.2 28.8 133 79 39.6 7.9 47.5 25.9 135 61 28.3 8.9 37.3 29.2 136 72 21.9 8.7 30.7 17.4 137 80 60.1 2.5 62.6 33.7 139 55 63.3 0.1 63.5 29.6 140 32 64.1 7.2 71.3 46.6 141 53 68.5 4.3 72.8 56.3 142 102 57.6 0.1 57.8 26.1 143 38 124.1 26.6 150.7 59.5 144 76 28.5 2.3 30.7 14.4 145 119 60.5 20.7 81.2 47.7 146 34 40.8 5.5 46.3 21.8 147 125 88.5 0.5 89.0 50.9 148 66 92.2 0.6 92.8 50.5 149 81 22.5 8.1 30.6 15.4 150 29 27.5 8.0 35.4 22.5 152 72 58.5 4.0 63.0 44.9 153 96 73.5 5.2 78.7 29.2 154 132 108.8 0.1 108.8 37.0 155 99 55.0 0.7 55.8 28.8 156 70 39.3 13.1 52.5 35.5 157 36 37.7 8.3 46.0 37.3 158 66 44.4 5.5 49.8 34.9
23
School TEA #
Number of Students
Range # of Hours
Minimum # of Hours
Max # of Hours
Mean # of Hours
159 154 72.8 0.5 73.3 40.5 160 44 26.2 3.3 29.5 16.0 161 106 26.5 1.2 27.6 14.5 162 107 52.7 7.6 60.3 34.3 163 73 91.3 6.8 98.1 41.9 164 118 35.9 18.4 54.3 32.1 166 107 48.7 0.8 49.5 37.4 167 132 164.0 4.9 168.9 58.5 168 102 78.9 6.1 85.0 34.9 169 92 73.3 14.9 88.2 25.4 170 106 41.2 0.3 41.5 17.5 171 130 60.8 13.2 74.0 37.1 172 88 70.7 11.8 82.5 38.3 173 75 12.6 0.5 13.1 7.7 174 34 21.1 25.2 46.3 35.1 175 95 55.4 0.1 55.5 40.6 176 98 87.7 0.4 88.1 40.3 177 75 15.3 10.1 25.4 20.4 178 54 43.4 0.7 44.1 26.2 180 70 55.7 3.9 59.6 42.6 181 64 59.9 14.1 74.0 53.7 182 138 58.9 6.5 65.4 22.1 183 85 30.4 1.3 31.7 15.5 184 41 22.1 30.8 52.9 36.9 185 53 53.2 2.4 55.6 41.2 186 63 63.6 9.6 73.2 36.9 187 99 48.7 2.5 51.2 30.5 188 132 63.1 8.6 71.7 40.2 189 55 84.5 2.0 86.5 35.2 190 80 40.1 8.7 48.8 37.2 191 100 51.2 1.1 52.3 22.7 192 67 79.1 4.5 83.6 48.4 193 81 65.7 2.2 67.9 30.3 194 84 60.1 2.3 62.4 36.6 195 60 37.4 8.5 45.8 27.4 196 50 26.0 5.0 31.0 12.5 197 90 22.7 2.2 25.0 10.1 198 78 49.9 4.1 54.0 22.0 199 95 40.3 0.7 41.0 30.9 200 61 43.9 2.9 46.8 30.8 201 87 148.0 0.6 148.5 37.7 202 75 18.8 8.3 27.1 15.3 203 67 53.7 4.9 58.6 37.6 205 122 55.6 0.8 56.3 26.9 206 73 44.2 0.3 44.5 35.7 207 111 89.9 0.1 90.0 35.0 208 143 104.9 0.3 105.1 49.4 209 107 57.2 0.9 58.1 43.6 210 126 51.8 1.4 53.3 39.0 211 5 22.3 0.3 22.6 9.8 212 42 36.8 16.1 52.8 25.6 213 66 43.9 2.4 46.3 25.4
24
School TEA #
Number of Students
Range # of Hours
Minimum # of Hours
Max # of Hours
Mean # of Hours
214 23 28.9 7.1 36.0 27.5 215 66 43.3 7.9 51.3 22.6 216 127 127.6 0.7 128.3 35.5 218 164 58.1 0.1 58.2 33.9 219 58 44.2 15.1 59.3 40.0 220 58 40.6 1.2 41.7 25.1 222 111 75.9 6.6 82.5 38.4 224 44 74.4 10.6 85.0 51.0 225 92 55.9 3.8 59.6 41.7 226 79 95.6 0.4 96.0 41.0 227 24 75.8 0.6 76.4 44.3 228 46 38.3 3.2 41.5 13.8 229 129 33.4 14.8 48.2 31.3 230 65 48.1 7.5 55.6 38.8 232 115 15.8 2.0 17.7 8.4 233 72 91.0 13.0 104.0 36.0 234 112 54.8 1.4 56.2 31.6 235 56 30.2 1.8 32.1 19.2 236 73 50.1 4.8 55.4 30.4 237 111 51.9 0.8 52.7 38.5 239 73 24.3 0.3 24.6 14.2 240 106 43.8 0.9 44.7 23.8 241 2 3.9 12.3 16.2 14.3 250 83 68.9 0.1 69.0 26.7 260 64 40.3 24.5 64.8 41.9 263 52 57.2 1.1 58.3 36.2 264 141 49.8 0.3 50.2 28.6 265 38 41.6 10.4 52.0 40.2 266 88 57.4 3.7 61.1 24.9 268 92 52.1 10.1 62.2 39.4 269 47 102.8 4.4 107.2 38.0 271 148 43.7 0.7 44.3 16.8 272 91 50.0 22.6 72.5 49.4 273 89 56.7 1.0 57.7 30.1 274 132 56.7 3.9 60.1 26.6 275 40 80.9 0.9 81.8 64.2 276 121 73.6 1.2 74.8 49.6 277 71 44.0 8.0 52.0 29.4 278 78 45.9 1.8 47.6 28.9 279 90 69.9 8.2 78.1 33.1 280 171 56.4 7.0 63.4 43.5 281 56 38.8 1.6 40.4 19.7 283 59 37.7 4.4 42.1 29.2 284 136 44.9 0.8 45.6 27.1 286 72 48.2 0.8 49.1 19.3 287 100 44.3 0.7 45.0 25.0 288 23 24.1 8.9 33.0 19.6 289 75 11.3 7.2 18.5 13.2 301 123 43.7 0.3 44.0 18.3 304 97 47.6 1.0 48.6 25.5 305 86 37.3 6.0 43.4 23.0 997 21 40.0 0.4 40.3 17.0

25