Embed Size (px)
Citation preview

EA 08-472214 Jonathan den Hartog, P.E.
Project Overview
• Purpose & Need: Rehabilitate over 12 lane-miles of deteriorated PCC pavement.
• Accelerated construction and contracting innovations used: – CA4PRS, Dynameq, Extended Weekend Closures,
Incentives/Disincentives, Precast Pavement • Goal: Minimize disruptions to traffic, without
sacrificing quality and pavement life – Get in, get out, stay out

Project Location
Ontario International
Airport
RR Track
RR Track
California Speedway (NASCAR)
Ontario Mills Mall
Scandia Amusement
Park Auto
Dealers
Warehouses
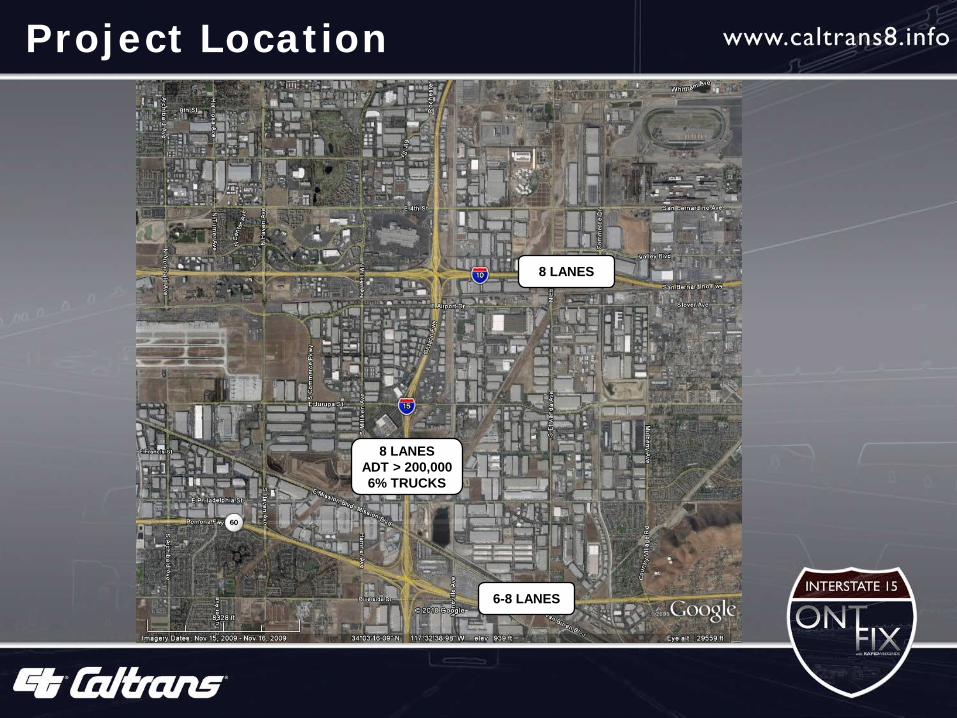
Project Location
8 LANES
6-8 LANES
8 LANES ADT > 200,000 6% TRUCKS

Project Features
• Median Paving & Barrier • Bridge Widening • AC Shoulder/Ramp Rehab • Pavement Rehabilitation
• 12 ln-mi lane replacement • Random slab replacements • Includes 12 freeway-to-freeway
connectors • Precast Pavement (Super-Slab)

Traffic Volumes
I-15 Ontario Daily Traffic
0
1,000
2,000
3,000
4,000
5,000
6,000
7,000
8,000
1 3 5 7 9 11 13 15 17 19 21 23
Hour
Flow
NB_Weekday:117k ADTNB_Sat:107k ADTSB_Weekday: 103k ADTSB_Sat:105k ADT
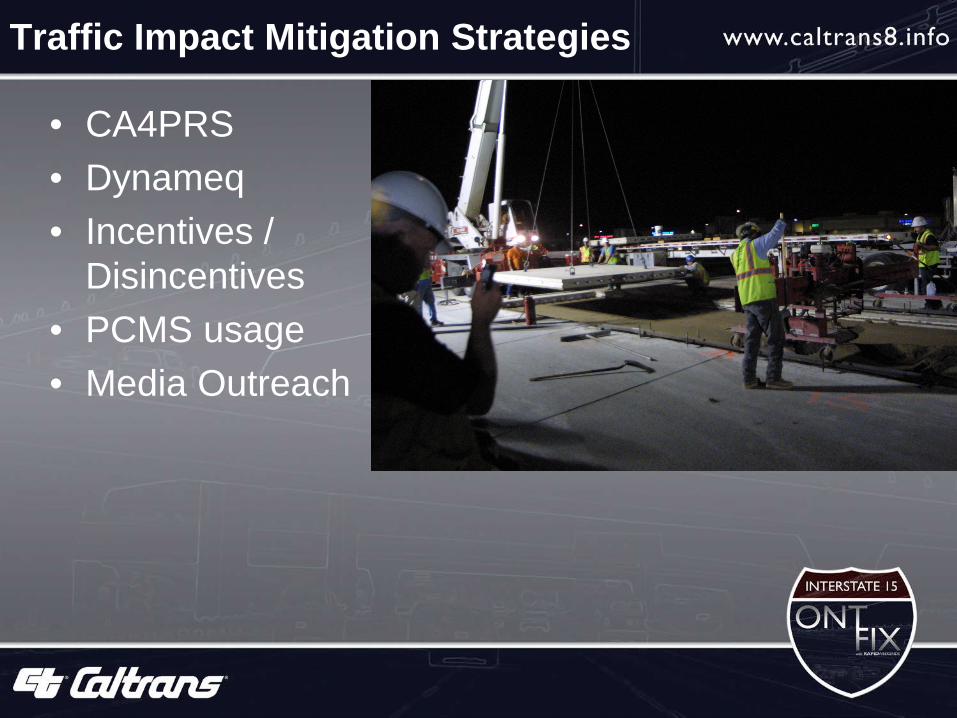
Traffic Impact Mitigation Strategies
• CA4PRS • Dynameq • Incentives /
Disincentives • PCMS usage • Media Outreach

Construction Sequence
• Pave median, widen bridges • Shift southbound I-15 two lanes toward the CL • Rehab pavement weekday and weekend • Repeat for northbound I-15

Typical Closure

Rapid Weekends
• 5 Major Stages, 25 sub-stages
• 410 Working Days (~2 yrs) • 55-Hour Weekend Closures
– Beginning late Friday evening – Ending early Monday morning
• Approximately 30 weekends • ~8 full roadbed closures

Traffic/Staging Analysis
• CA4PRS – 2 Phase Study
• Alternative Analysis And Comparison • Detailed Study of Preferred Alternative
– Performed by consultant sub • Construction Traffic Modeling (Dynameq)
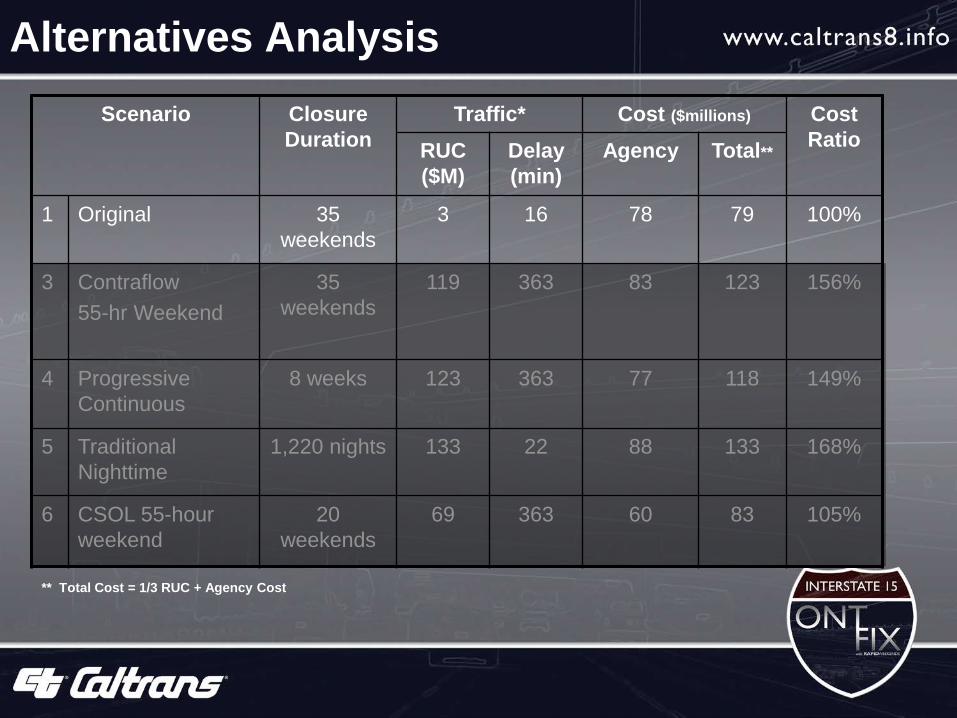
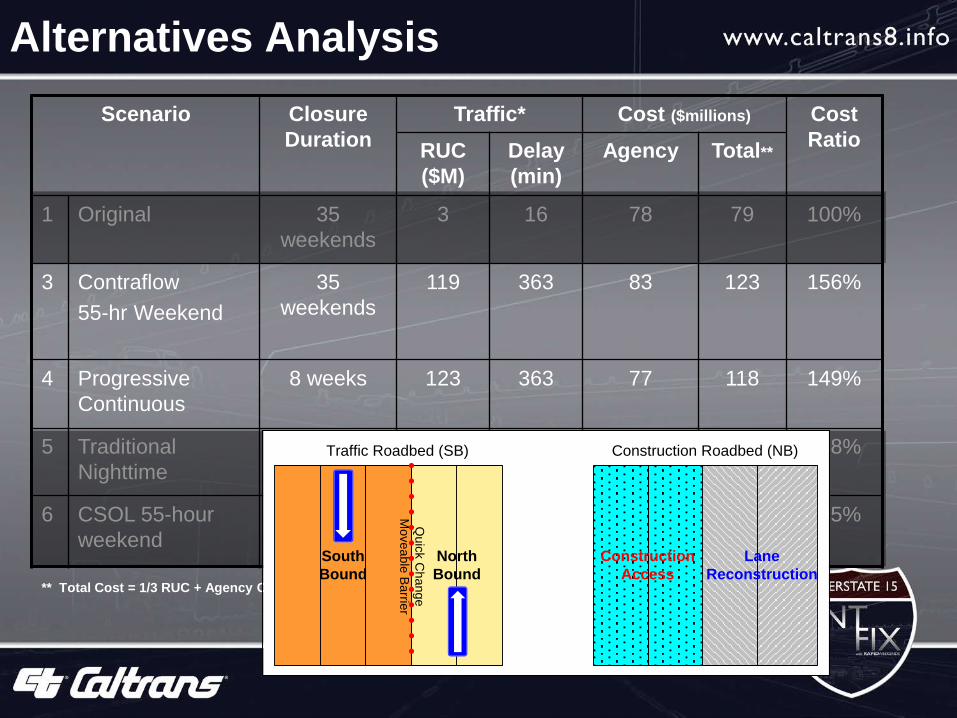
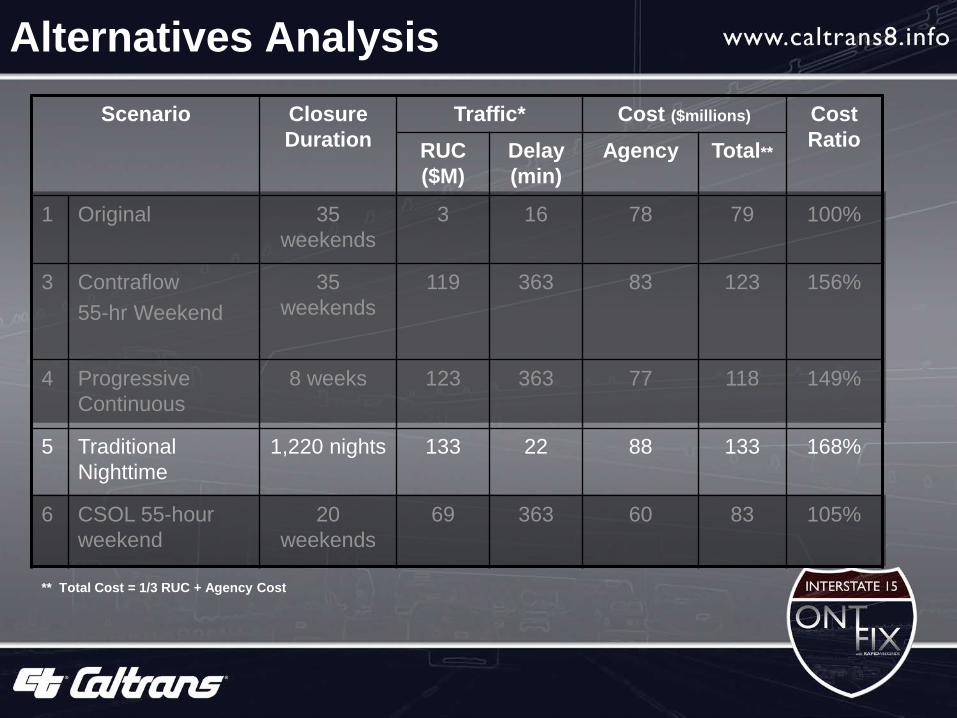
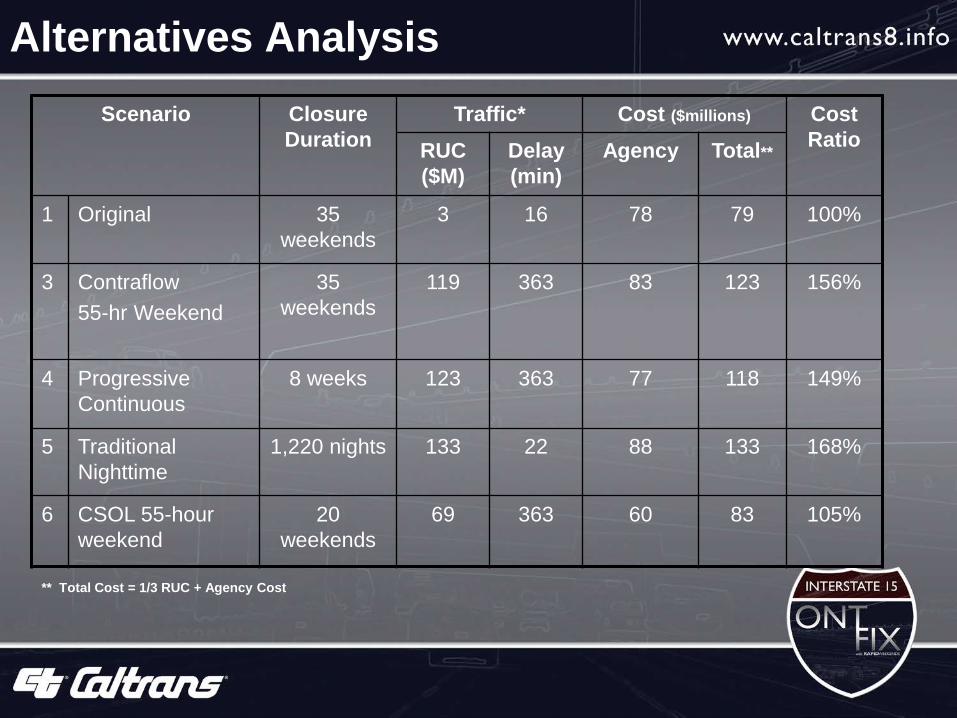
Scenario Closure Duration
Traffic* Cost ($millions) Cost Ratio RUC
($M) Delay (min)
Agency Total**
1 Original 35 weekends
3 16 78 79 100%
3 Contraflow 55-hr Weekend
35 weekends
119 363 83 123 156%
4 Progressive Continuous
8 weeks 123 363 77 118 149%
5 Traditional Nighttime
1,220 nights 133 22 88 133 168%
6 CSOL 55-hour weekend
20 weekends
69 363 60 83 105%
** Total Cost = 1/3 RUC + Agency Cost
Alternatives Analysis
North Bound
Traffic Roadbed (SB) Construction Roadbed (NB)
Lane Reconstruction
Construction Access
South Bound
Quick C
hange M
oveable Barrier
Scenario Closure Duration
Traffic* Cost ($millions) Cost Ratio RUC
($M) Delay (min)
Agency Total**
1 Original 35 weekends
3 16 78 79 100%
3 Contraflow 55-hr Weekend
35 weekends
119 363 83 123 156%
4 Progressive Continuous
8 weeks 123 363 77 118 149%
5 Traditional Nighttime
1,220 nights 133 22 88 133 168%
6 CSOL 55-hour weekend
20 weekends
69 363 60 83 105%
** Total Cost = 1/3 RUC + Agency Cost
Alternatives Analysis
North Bound
Traffic Roadbed (SB) Construction Roadbed (NB)
Construction Access
South Bound
Quick C
hange M
oveable Barrier
Crack-Seat AC Overlay (CSOL) including shoulders
Scenario Closure Duration
Traffic* Cost ($millions) Cost Ratio RUC
($M) Delay (min)
Agency Total**
1 Original 35 weekends
3 16 78 79 100%
3 Contraflow 55-hr Weekend
35 weekends
119 363 83 123 156%
4 Progressive Continuous
8 weeks 123 363 77 118 149%
5 Traditional Nighttime
1,220 nights 133 22 88 133 168%
6 CSOL 55-hour weekend
20 weekends
69 363 60 83 105%
** Total Cost = 1/3 RUC + Agency Cost
Alternatives Analysis
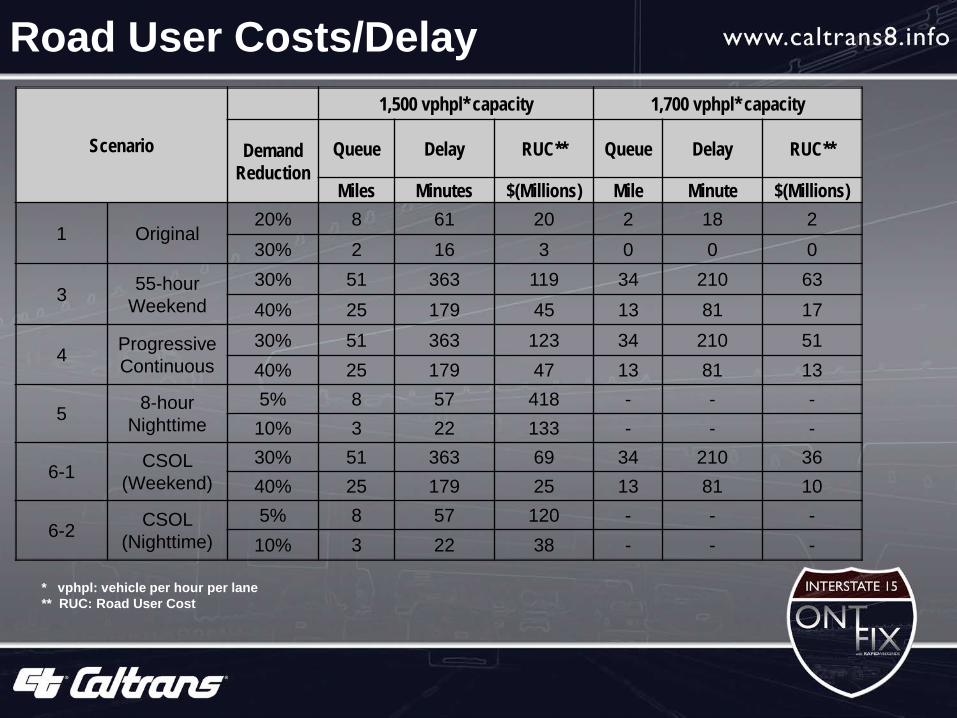
Road User Costs/Delay
Scenario
1,500 vphpl* capacity 1,700 vphpl* capacity
Demand Reduction
Queue Delay RUC** Queue Delay RUC**
Miles Minutes $(Millions) Mile Minute $(Millions)
1 Original 20% 8 61 20 2 18 2 30% 2 16 3 0 0 0
3 55-hour Weekend
30% 51 363 119 34 210 63 40% 25 179 45 13 81 17
4 Progressive Continuous
30% 51 363 123 34 210 51 40% 25 179 47 13 81 13
5 8-hour Nighttime
5% 8 57 418 - - - 10% 3 22 133 - - -
6-1 CSOL (Weekend)
30% 51 363 69 34 210 36 40% 25 179 25 13 81 10
6-2 CSOL (Nighttime)
5% 8 57 120 - - - 10% 3 22 38 - - -
* vphpl: vehicle per hour per lane ** RUC: Road User Cost

Stage Analysis (Sample)
Stage Station No. of Lanes
Length Rehab Type
Total 55-hour
Closures
Start End (m) (lane-km) (lane-km) Estimate
4B, 4C
836+81 837+81 1 100.00 0.100 CLR
2.50 2 SB I-15 Conn WB
SR-60 2 773.20 1.546 CLR
SB I-15 Conn EB SR-60 2 1430.50 0.858 RSR
2A 7+40 11+79 2 439.00 0.878 CLR
1.28 1 Jurupa On-ramp SB I-15 2 500.00 0.400 ACR
2B
20+90 22+77 2 187.00 0.374 CLR
3.01 3
22+77 28+51 1 574.00 0.574 CLR
28+51 33+03 2 452.00 0.904 CLR
20+96 28+95 1 799.00 0.240 RSR
WB I-10 CONN SB I-15 1 337.70 0.338 CLR
SB I-15 Jurupa Off-ramp 2 500.00 0.400 ACR
WB I-10 Conn SB I-15 2 300.00 0.180 RSR
Note: CLR=Continuous Lane Reconstruction; RSR=Random Slab Replacement; ACR=Asphalt Concrete Rehabilitation

Traffic Study (Dynameq)
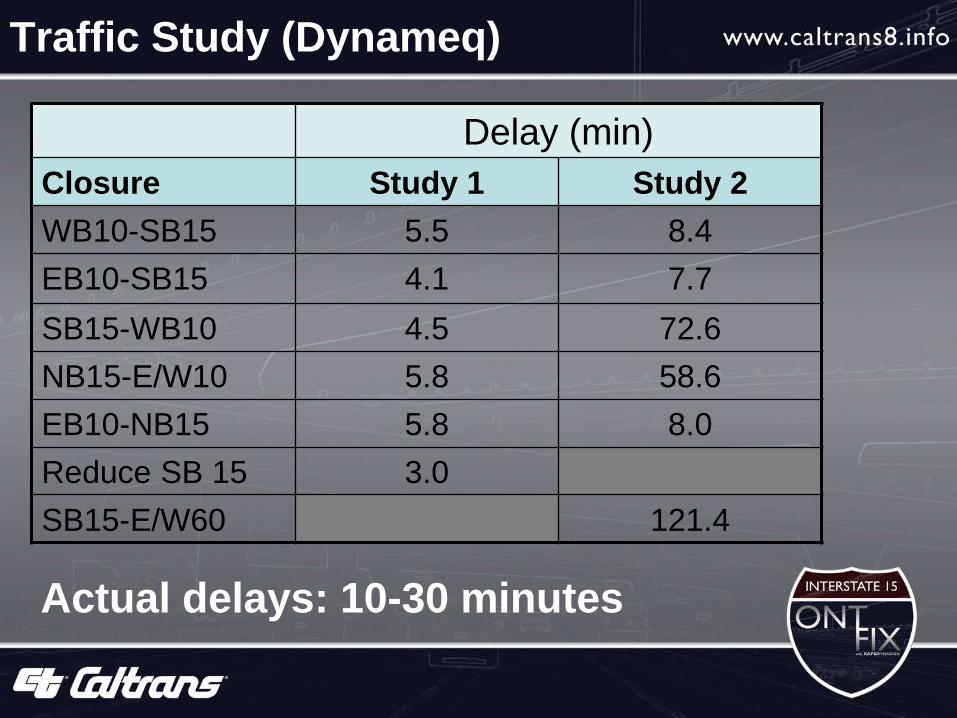
Traffic Study (Dynameq)
Delay (min) Closure Study 1 Study 2 WB10-SB15 5.5 8.4 EB10-SB15 4.1 7.7 SB15-WB10 4.5 72.6 NB15-E/W10 5.8 58.6 EB10-NB15 5.8 8.0 Reduce SB 15 3.0 SB15-E/W60 121.4
Actual delays: 10-30 minutes
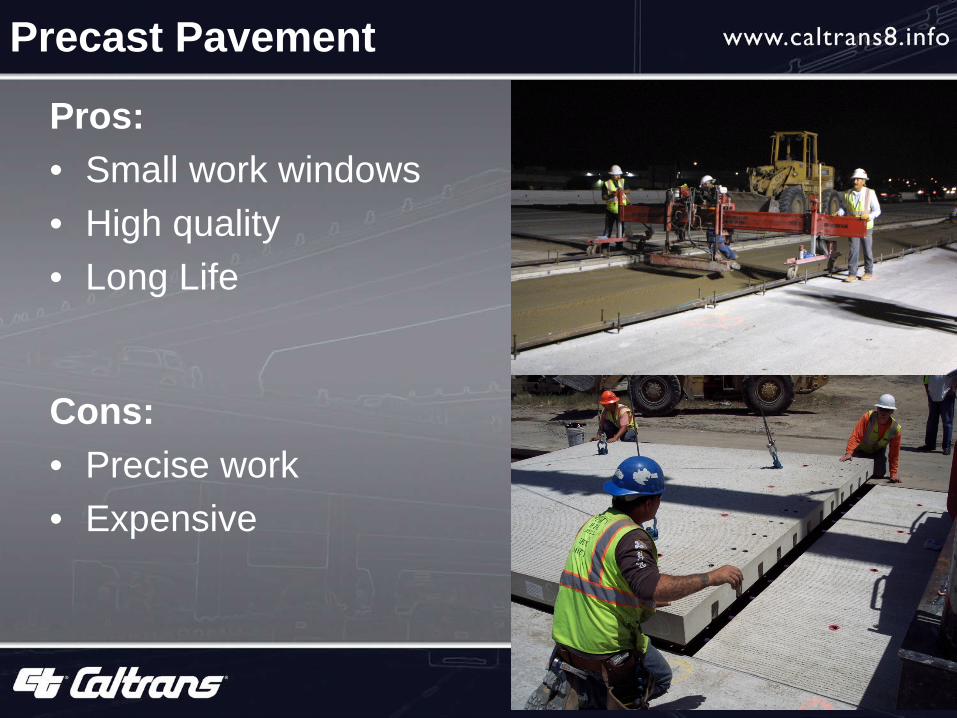
Precast Pavement
Pros: • Small work windows • High quality • Long Life
Cons: • Precise work • Expensive
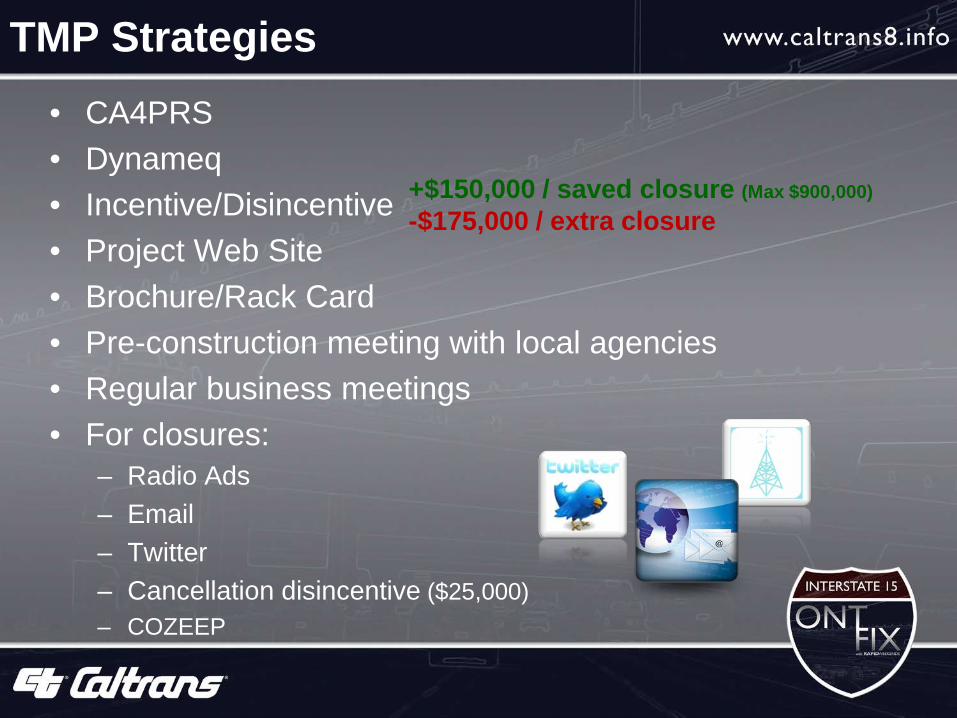
• CA4PRS • Dynameq • Incentive/Disincentive • Project Web Site • Brochure/Rack Card • Pre-construction meeting with local agencies • Regular business meetings • For closures:
– Radio Ads – Email – Twitter – Cancellation disincentive ($25,000) – COZEEP
TMP Strategies
+$150,000 / saved closure (Max $900,000) -$175,000 / extra closure
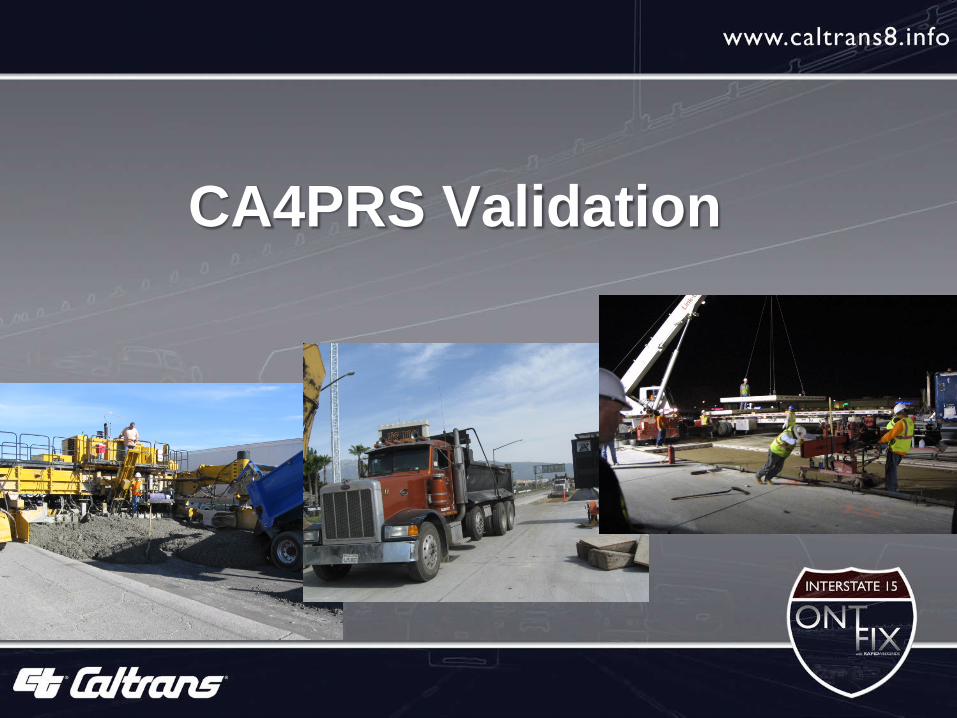
CA4PRS Validation
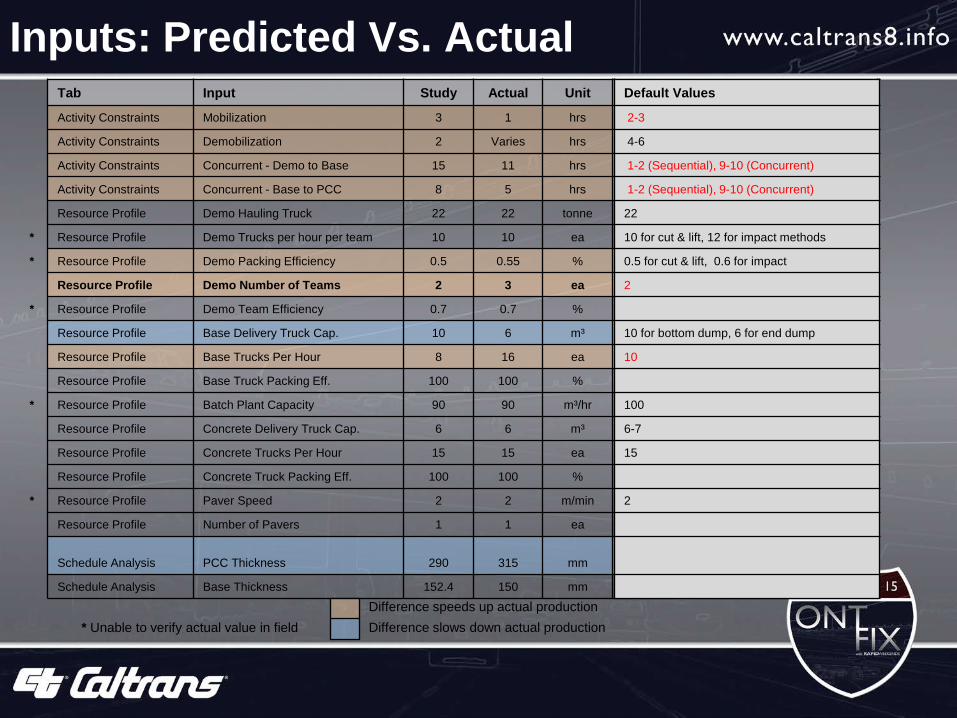
Inputs: Predicted Vs. Actual Tab Input Study Actual Unit Notes
Activity Constraints Mobilization 3 1 hrs
Activity Constraints Demobilization 2 Varies hrs
Activity Constraints Concurrent - Demo to Base 15 11 hrs
Activity Constraints Concurrent - Base to PCC 8 5 hrs
Resource Profile Demo Hauling Truck 22 22 tonne
* Resource Profile Demo Trucks per hour per team 10 10 ea
* Resource Profile Demo Packing Efficiency 0.5 0.55 % Used impact method instead of cut & lift
Resource Profile Demo Number of Teams 2 3 ea BIG IMPACT!
* Resource Profile Demo Team Efficiency 0.7 0.7 %
Resource Profile Base Delivery Truck Cap. 10 6 m³ Used end dumps instead of bottom dumps
Resource Profile Base Trucks Per Hour 8 16 ea
Resource Profile Base Truck Packing Eff. 100 100 %
* Resource Profile Batch Plant Capacity 90 90 m³/hr
Resource Profile Concrete Delivery Truck Cap. 6 6 m³
Resource Profile Concrete Trucks Per Hour 15 15 ea
Resource Profile Concrete Truck Packing Eff. 100 100 %
* Resource Profile Paver Speed 2 2 m/min
Resource Profile Number of Pavers 1 1 ea Sometimes double-lane width
Schedule Analysis PCC Thickness 290 315 mm 345 mm for mainline lanes (315 for connectors)
Schedule Analysis Base Thickness 152.4 150 mm
* Unable to verify actual value in field Difference slows down actual production Difference speeds up actual production
Default Values
2-3
4-6
1-2 (Sequential), 9-10 (Concurrent)
1-2 (Sequential), 9-10 (Concurrent)
22
10 for cut & lift, 12 for impact methods
0.5 for cut & lift, 0.6 for impact
2
10 for bottom dump, 6 for end dump
10
100
6-7
15
2
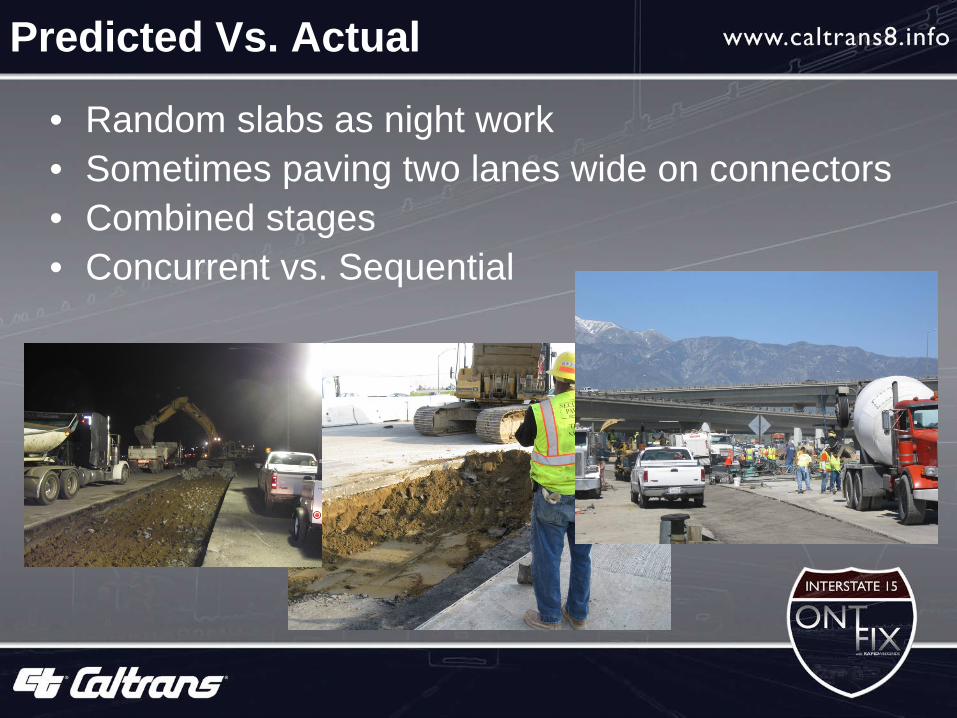
Predicted Vs. Actual
• Random slabs as night work • Sometimes paving two lanes wide on connectors • Combined stages • Concurrent vs. Sequential
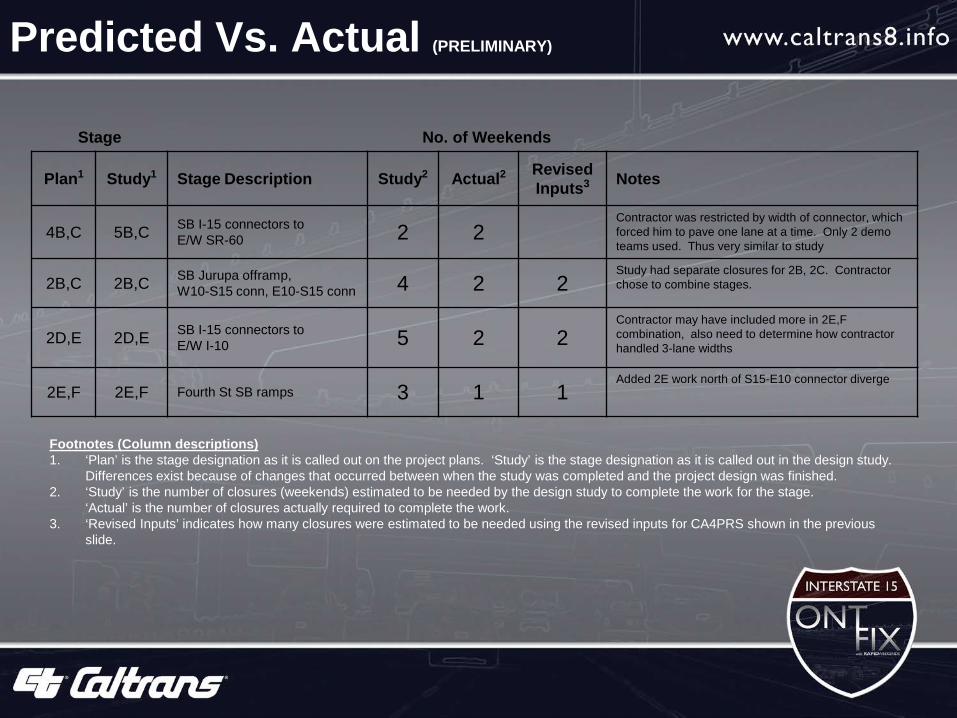
Predicted Vs. Actual (PRELIMINARY)
Stage No. of Weekends
Plan1 Study1 Stage Description Study2 Actual2 Revised Inputs3 Notes
4B,C 5B,C SB I-15 connectors to E/W SR-60 2 2
Contractor was restricted by width of connector, which forced him to pave one lane at a time. Only 2 demo teams used. Thus very similar to study
2B,C 2B,C SB Jurupa offramp, W10-S15 conn, E10-S15 conn 4 2 2
Study had separate closures for 2B, 2C. Contractor chose to combine stages.
2D,E 2D,E SB I-15 connectors to E/W I-10 5 2 2
Contractor may have included more in 2E,F combination, also need to determine how contractor handled 3-lane widths
2E,F 2E,F Fourth St SB ramps 3 1 1 Added 2E work north of S15-E10 connector diverge
Footnotes (Column descriptions) 1. ‘Plan’ is the stage designation as it is called out on the project plans. ‘Study’ is the stage designation as it is called out in the design study.
Differences exist because of changes that occurred between when the study was completed and the project design was finished. 2. ‘Study’ is the number of closures (weekends) estimated to be needed by the design study to complete the work for the stage.
‘Actual’ is the number of closures actually required to complete the work. 3. ‘Revised Inputs’ indicates how many closures were estimated to be needed using the revised inputs for CA4PRS shown in the previous
slide.
CA4PRS Lessons Learned
• Construction experience is IMPORTANT • Design input important for efficiency • Breadth of knowledge required
– Traffic – Pavement – Construction – Estimating
• Team approach may be best

User Survey
0% newspaper
31%
5% 17%
47%
Preferred Info Source
newspaper
radio
television
internet
25%
50%
0% facebook
8%
17%
Internet Source google
caltranswebsite
other website
1.5
2.0
2.5
3.0
3.5
4.0
4.5
Project Brochure
Rack C
ard
Em
ail Alert
Twitter U
pdate
Radio Ad
New
spaper
Public M
eeting
Importance of Info Source 1 – least important 5 – most important
Likert Scale Questions
Average Std. Dev.
* Prefer extended weekend closures? 3.75 1.32 * Worth it to widen bridges (20% more cost)? 3.64 1.27 * Super-Slab worth it? 4.08 1.14 * Support measures taken to minimize traffic impacts? 3.78 1.08 * Satisfied with pavement rehabilitation? 3.53 1.28
1 – Strongly disagree …. 5 – Strongly agree

Future Directions
• Continue training on CA4PRS and promote its use on high-impact projects.
• Statewide Standards group for Precast Pavement Systems (PCPS) to make it easier to use.
• Multi-disciplinary team to use CA4PRS.
Contact Info
Jonathan den Hartog (909) 383-5998
More info:
http://www.dot.ca.gov/hq/research/roadway/ca4prs/index.htm
http://www.fhwa.dot.gov/research/deployment/ca4prs.cfm