Embed Size (px)
Citation preview
E41 - ThermoFluid Mechanics
Design Laboratory: Commuter Vehicle Systems
Fall 2007 – Rio Akasaka, Alex Bell, Jonathan Harris
The idea behind cost-effective, fuel efficient commuter vehicles consists of several tiers:
1) Weight reduction – The average American weighs, according to the latest statistics,
approximately 177.65lbs1. Additional weight on a mechanical system reduces overall
efficiency and increases fuel consumption in engines where heat is transformed into useable
energy. A reduction in weight, however, should not be accompanied by a compromise in
safety, and it was decided upon that a full body shell would be desirable.
2) Aerodynamics – Fuel in a vehicle is spent most on overcoming drag resistance present in
air, which is proportional to the drag coefficient. The drag coefficient can be reduced by a
more aerodynamic design through the reduction of frontal area as well as lower vehicle
speeds. The design will be for a vehicle with an average speed of 10 mph.
The drag force is defined as 212d dF v C Aρ= where ρ is the density of the fluid through which the
vehicle is moving (air, at approximately ) is the velocity of the vehicle through the
fluid, is the drag coefficient, (at approximately 0.29 to 0.37 for an average Class A-E vehicle
31.293 /kg m v
dC 2),
and A is the surface area.
1 “Advance Data from Vital and Health Statistics.” <http://www.cdc.gov/nchs/data/ad/ad347.pdf>
In order to design a cost-effective fuel efficient motor vehicle, several existing designs are first
considered for reference:
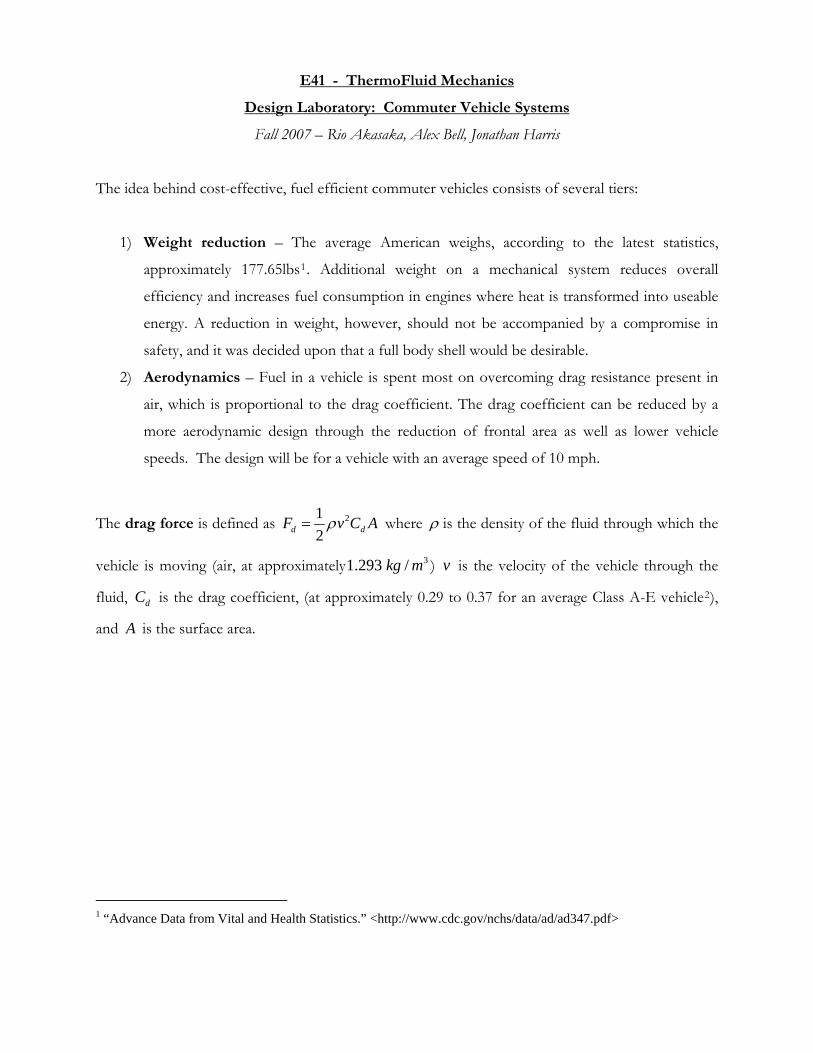
BMW C13 - Enclosed Scooter/Feet Forwards Motorcycle
125cc, 4-stroke 1 cylinder gasoline (fuel-injected) engine with 15 bhp
Empty weight: 125kg
Fuel consumption: 6.3 (City) - 4.4 (Highway) L/100km, allowing for up to 88mpg
Maximum speed: 75mph
Aluminum frame construction with roll cage
2 “Aerodynamic Drag, Data for Airfoils, Wings, Aircraft, Automobiles” http://aerodyn.org/Drag/tables.html#cars 3 “Advanced Technology Vehicles Program / 2001 - 2002 Annual Report” http://www.tc.gc.ca/programs/environment/atvpgm/reports/annual/atvp0102.pdf
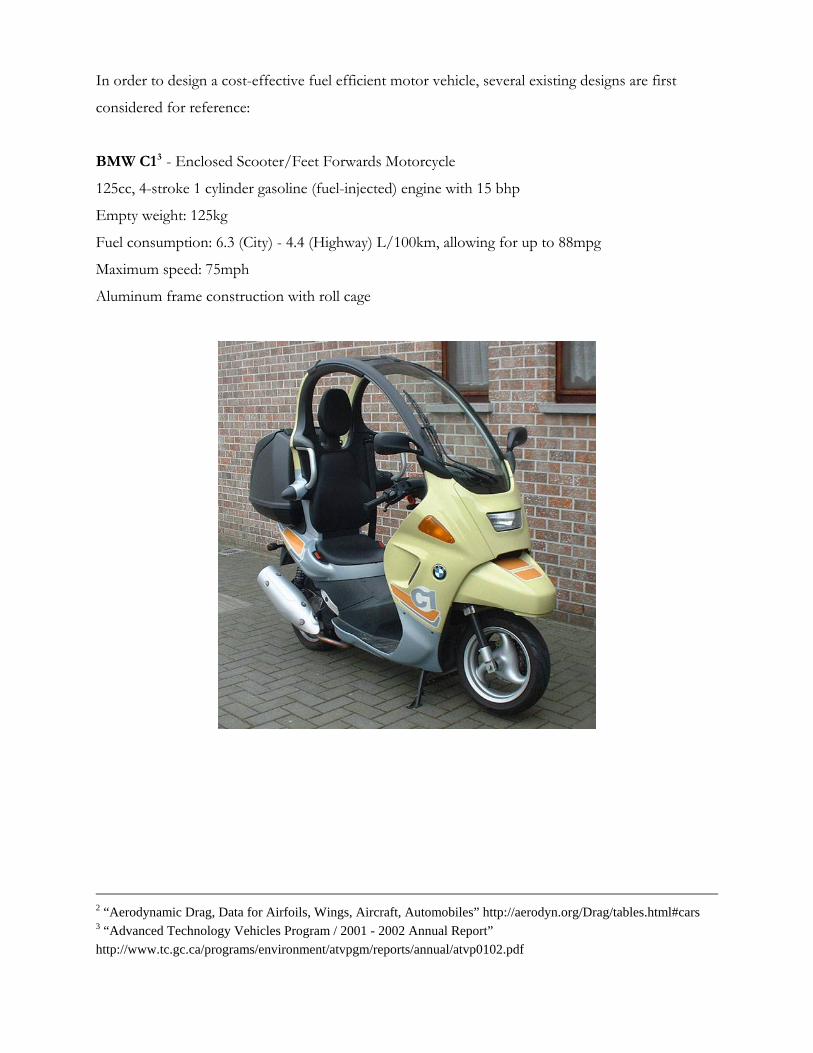
BMW C.L.E.V.E.R (Compact Low Emission Vehicle for Urban Transport)4 - Prototype
Runs on single-cylinder 230cc BMW compressed natural gas engine with 17HP, 12.5kW
Empty weight: Approx. 395kg
Fuel consumption: 2.4L/100km (estimated)
2CO emissions of approximately 59.5g/km
Front end surface area of 1m2, aluminum and plastic frame
Maximum Speed: 50mph
4 http://www.leftlanenews.com/bmws-clever-concept-completed.html and http://clever-project.net/gb/gb_design_sketches.htm
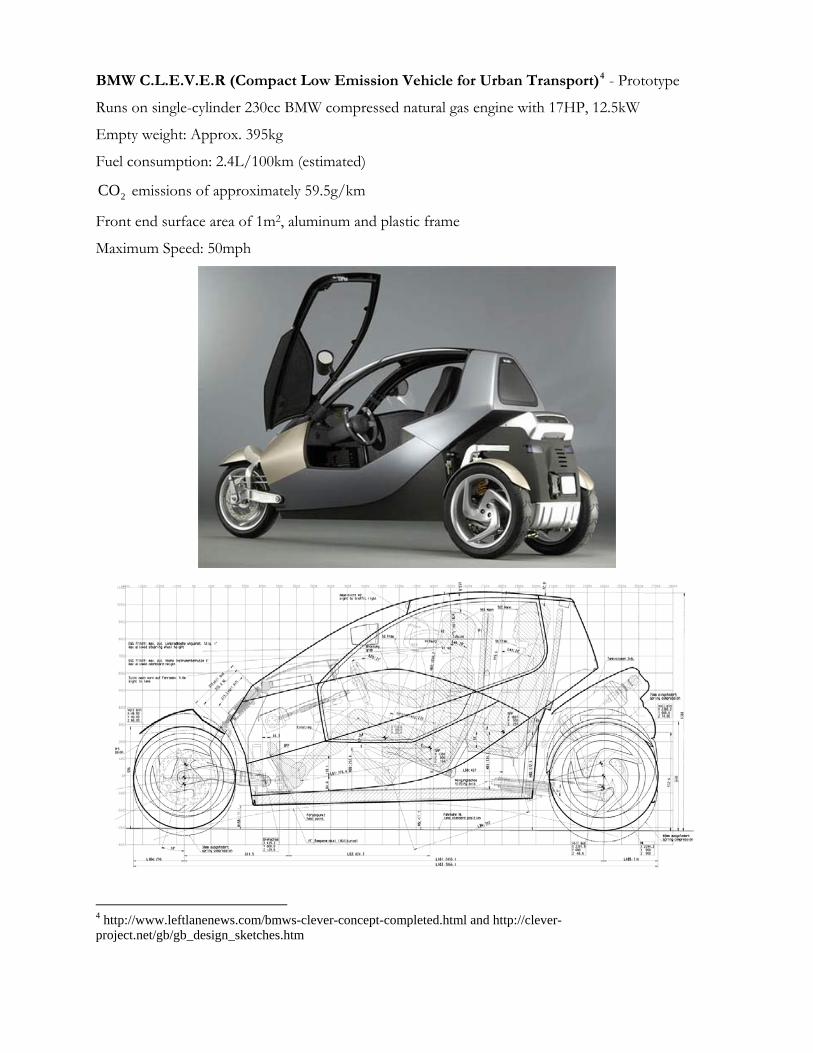
VentureOne e505 - Prototype
50kW hybrid system involving internal combustion engine, 15-20kW generator, 50kW motor, 4
gallon fuel tank and high capacity lithium battery. To be offered for sale in 2009.
Weight: 635kg
Drag coefficient (published, suboptimal): 0.32
Maximum speed: 100mph
Steel roll cage frame.
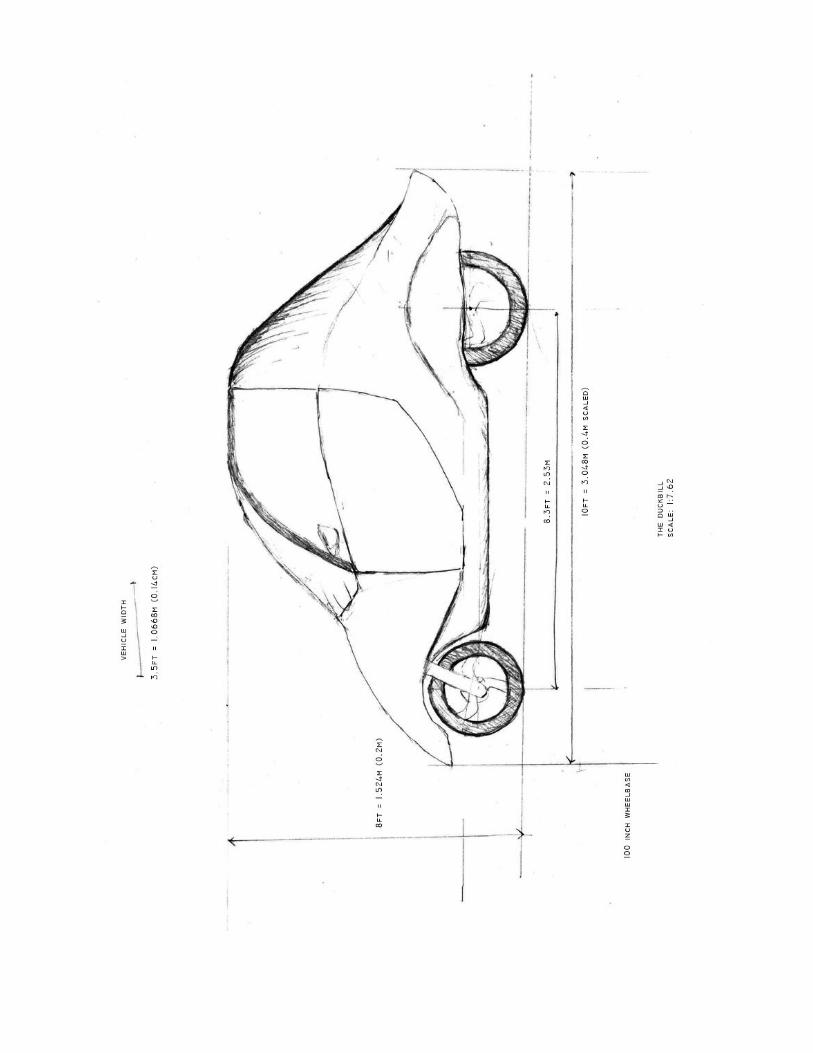
Taking the above designs into consideration, the proposed vehicle will have three wheels to allow
for upright stability as well as limiting ground contact (and friction) and reducing overall vehicle
weight. A curved front will be used to reduce frontal area.
5 http://www.flytheroad.com/
THE RIGHT ENGINE
Choosing the right engine for the task can be extremely difficult. Here, we are given the parameters
that are required to be matched: a set distance, weight, and velocity to be achieved. After carefully
examining the various engines and cycles, we have decided that the high specific power two-stroke
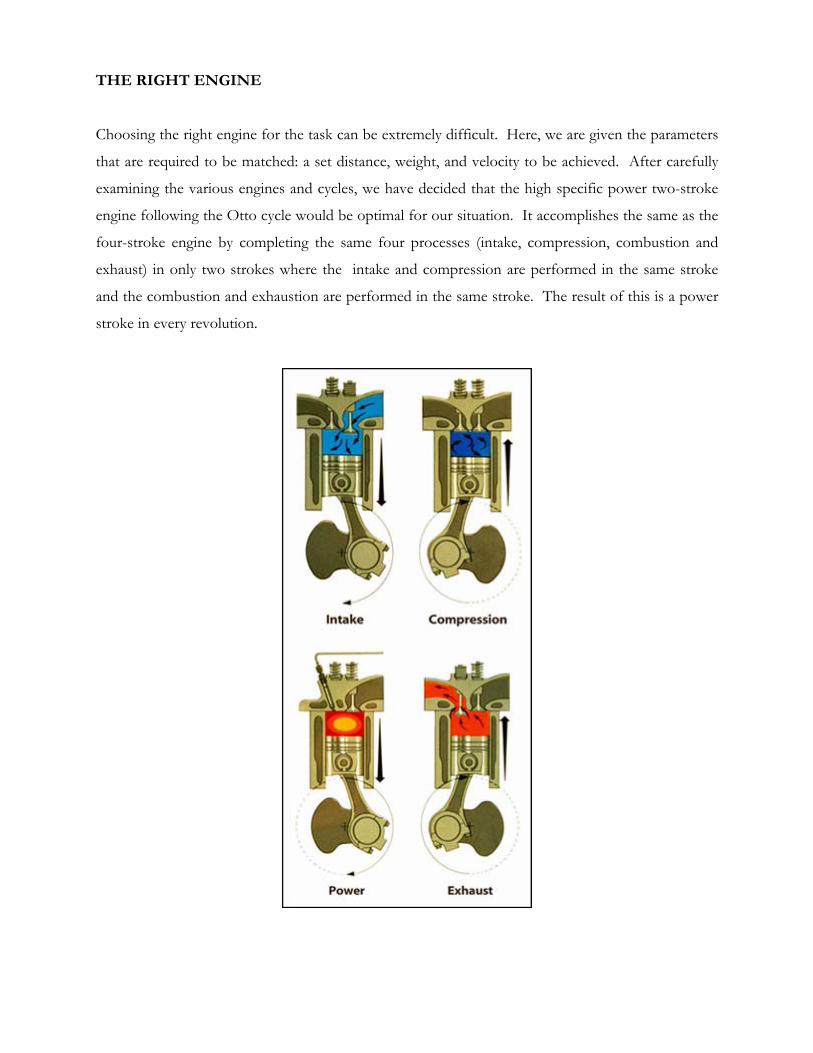
engine following the Otto cycle would be optimal for our situation. It accomplishes the same as the
four-stroke engine by completing the same four processes (intake, compression, combustion and
exhaust) in only two strokes where the intake and compression are performed in the same stroke
and the combustion and exhaustion are performed in the same stroke. The result of this is a power
stroke in every revolution.
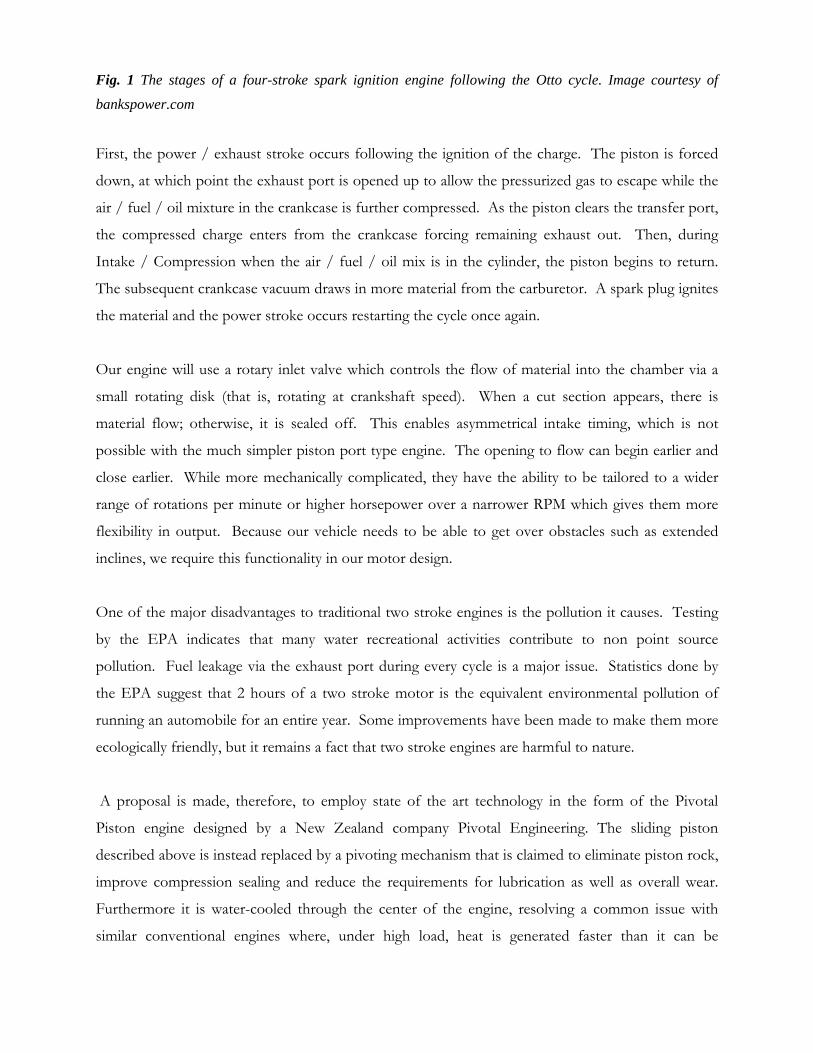
Fig. 1 The stages of a four-stroke spark ignition engine following the Otto cycle. Image courtesy of
bankspower.com
First, the power / exhaust stroke occurs following the ignition of the charge. The piston is forced
down, at which point the exhaust port is opened up to allow the pressurized gas to escape while the
air / fuel / oil mixture in the crankcase is further compressed. As the piston clears the transfer port,
the compressed charge enters from the crankcase forcing remaining exhaust out. Then, during
Intake / Compression when the air / fuel / oil mix is in the cylinder, the piston begins to return.
The subsequent crankcase vacuum draws in more material from the carburetor. A spark plug ignites
the material and the power stroke occurs restarting the cycle once again.
Our engine will use a rotary inlet valve which controls the flow of material into the chamber via a
small rotating disk (that is, rotating at crankshaft speed). When a cut section appears, there is
material flow; otherwise, it is sealed off. This enables asymmetrical intake timing, which is not
possible with the much simpler piston port type engine. The opening to flow can begin earlier and
close earlier. While more mechanically complicated, they have the ability to be tailored to a wider
range of rotations per minute or higher horsepower over a narrower RPM which gives them more
flexibility in output. Because our vehicle needs to be able to get over obstacles such as extended
inclines, we require this functionality in our motor design.
One of the major disadvantages to traditional two stroke engines is the pollution it causes. Testing
by the EPA indicates that many water recreational activities contribute to non point source
pollution. Fuel leakage via the exhaust port during every cycle is a major issue. Statistics done by
the EPA suggest that 2 hours of a two stroke motor is the equivalent environmental pollution of
running an automobile for an entire year. Some improvements have been made to make them more
ecologically friendly, but it remains a fact that two stroke engines are harmful to nature.
A proposal is made, therefore, to employ state of the art technology in the form of the Pivotal
Piston engine designed by a New Zealand company Pivotal Engineering. The sliding piston
described above is instead replaced by a pivoting mechanism that is claimed to eliminate piston rock,
improve compression sealing and reduce the requirements for lubrication as well as overall wear.
Furthermore it is water-cooled through the center of the engine, resolving a common issue with
similar conventional engines where, under high load, heat is generated faster than it can be
dissipated. While options of using hydrogen as a means to fuel this engine can be considered, as the
company suggests, we decided to follow instead by using compressed natural gas (CNG) primarily
because hydrogen fuel cells are still considerably expensive and availability is very limited.
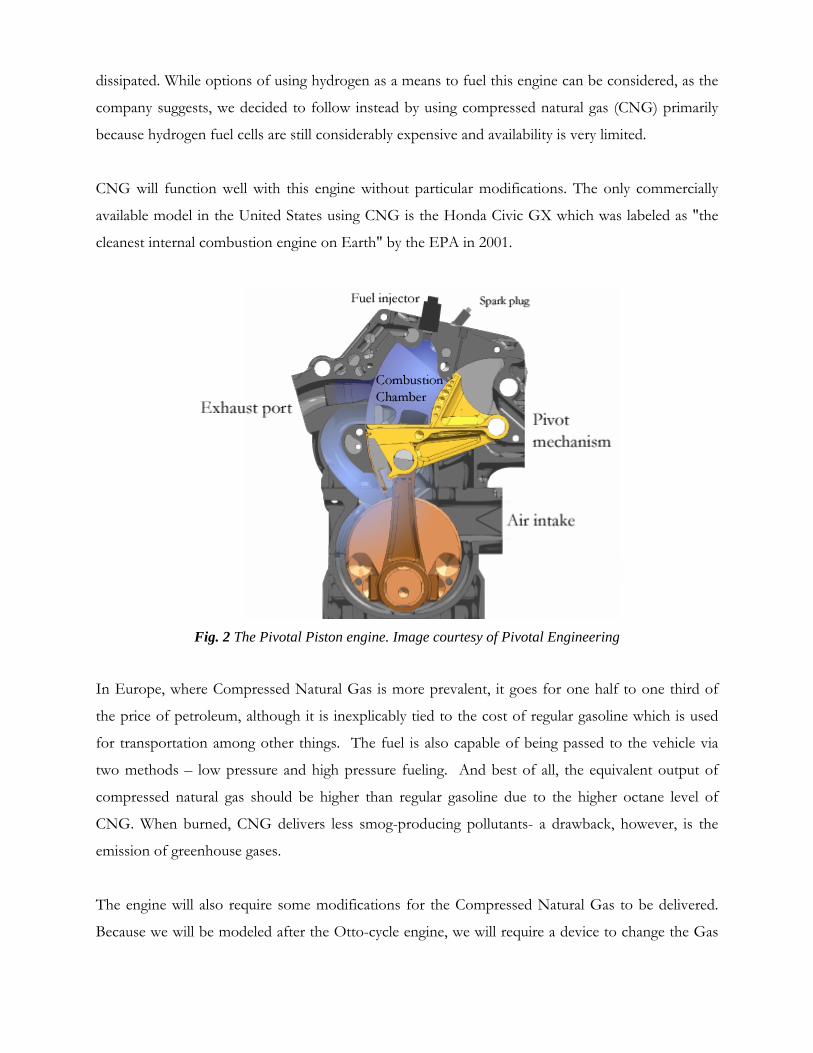
CNG will function well with this engine without particular modifications. The only commercially
available model in the United States using CNG is the Honda Civic GX which was labeled as "the
cleanest internal combustion engine on Earth" by the EPA in 2001.
Fig. 2 The Pivotal Piston engine. Image courtesy of Pivotal Engineering
In Europe, where Compressed Natural Gas is more prevalent, it goes for one half to one third of
the price of petroleum, although it is inexplicably tied to the cost of regular gasoline which is used
for transportation among other things. The fuel is also capable of being passed to the vehicle via
two methods – low pressure and high pressure fueling. And best of all, the equivalent output of
compressed natural gas should be higher than regular gasoline due to the higher octane level of
CNG. When burned, CNG delivers less smog-producing pollutants- a drawback, however, is the
emission of greenhouse gases.
The engine will also require some modifications for the Compressed Natural Gas to be delivered.
Because we will be modeled after the Otto-cycle engine, we will require a device to change the Gas
from our storage pressure to the desired pressure, a pressure regulator. Similarly, we will require a
method metering the fuel input, a gas injector or gas mixer.
THE OTTO CYCLE
A brief discussion is necessary about the ideal Otto Cycle. The most common and widely used
implementation of the Otto Cycle is in the four-stroke engine which is the mechanism by which
internal combustion engines of today’s vehicles function.
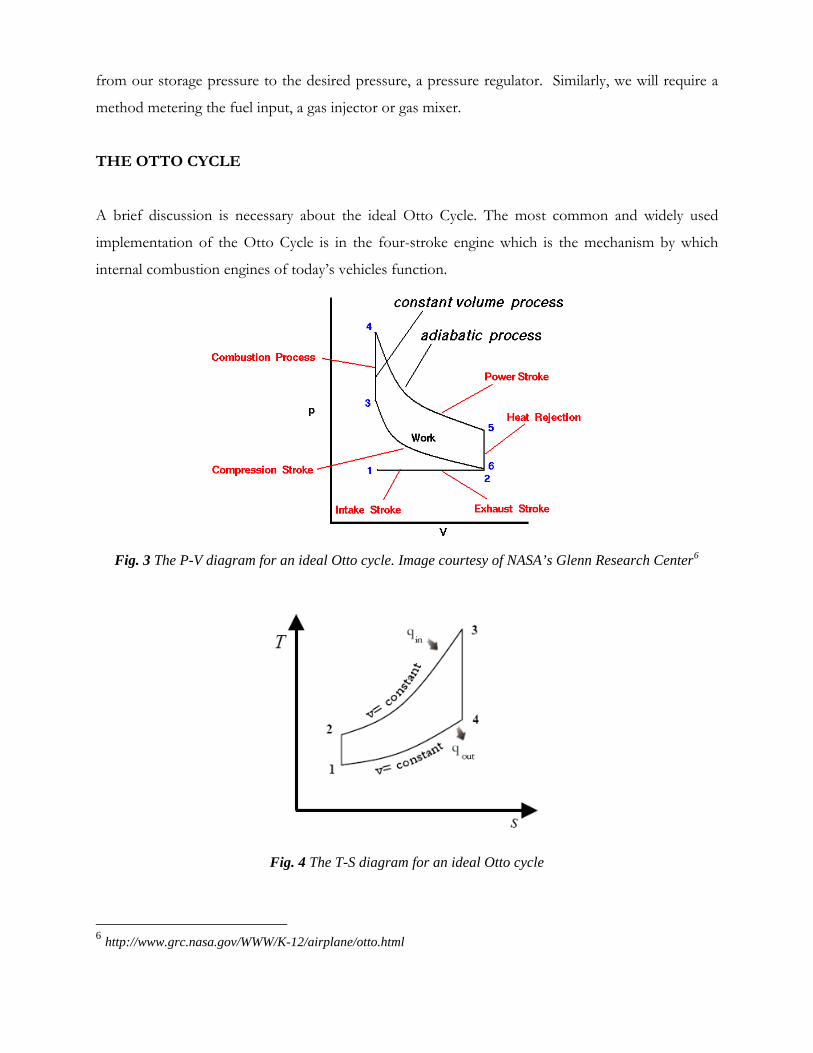
Fig. 3 The P-V diagram for an ideal Otto cycle. Image courtesy of NASA’s Glenn Research Center6
Fig. 4 The T-S diagram for an ideal Otto cycle
6 http://www.grc.nasa.gov/WWW/K-12/airplane/otto.html
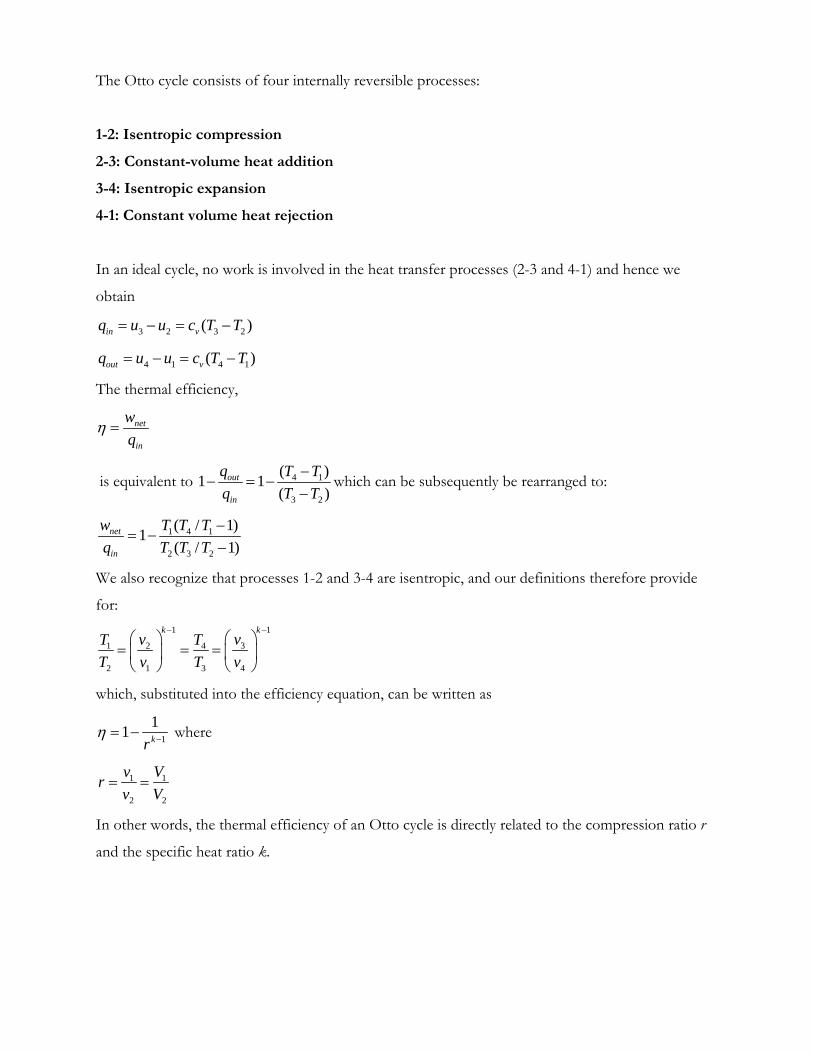
The Otto cycle consists of four internally reversible processes:
1-2: Isentropic compression
2-3: Constant-volume heat addition
3-4: Isentropic expansion
4-1: Constant volume heat rejection
In an ideal cycle, no work is involved in the heat transfer processes (2-3 and 4-1) and hence we
obtain
3 2 3 2( )in vq u u c T T= − = −
4 1 4 1( )out vq u u c T T= − = −
The thermal efficiency,
net
in
wq
η =
is equivalent to 4 1
3 2
(1 1( )
out
in
q T Tq T
−− = −
−)
Twhich can be subsequently be rearranged to:
1 4 1
2 3 2
( / 1)1( / 1)
net
in
w T T Tq T T T
−= −
−
We also recognize that processes 1-2 and 3-4 are isentropic, and our definitions therefore provide
for: 1 1
31 2 4
2 1 3 4
k kvT v T
T v T v
− −⎛ ⎞ ⎛ ⎞
= = =⎜ ⎟ ⎜ ⎟⎝ ⎠ ⎝ ⎠
which, substituted into the efficiency equation, can be written as
1
11 krη −= − where
1 1
2 2
v Vrv V
= =
In other words, the thermal efficiency of an Otto cycle is directly related to the compression ratio r
and the specific heat ratio k.
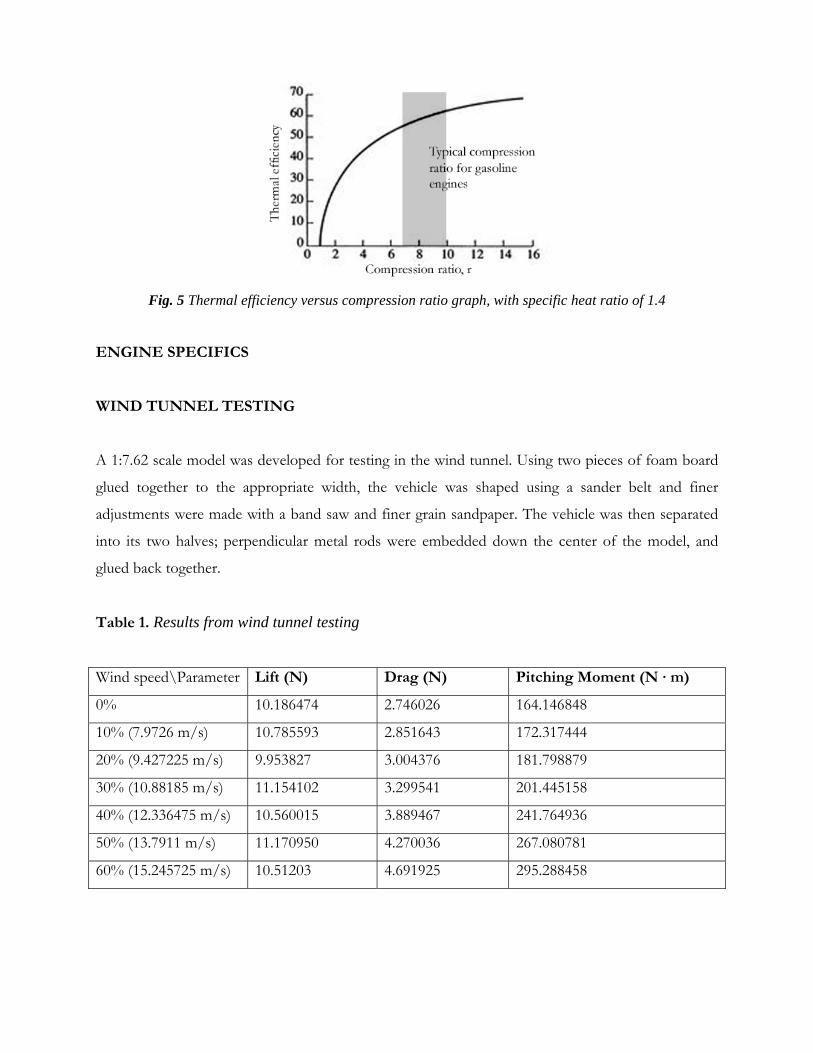
Fig. 5 Thermal efficiency versus compression ratio graph, with specific heat ratio of 1.4
ENGINE SPECIFICS
WIND TUNNEL TESTING
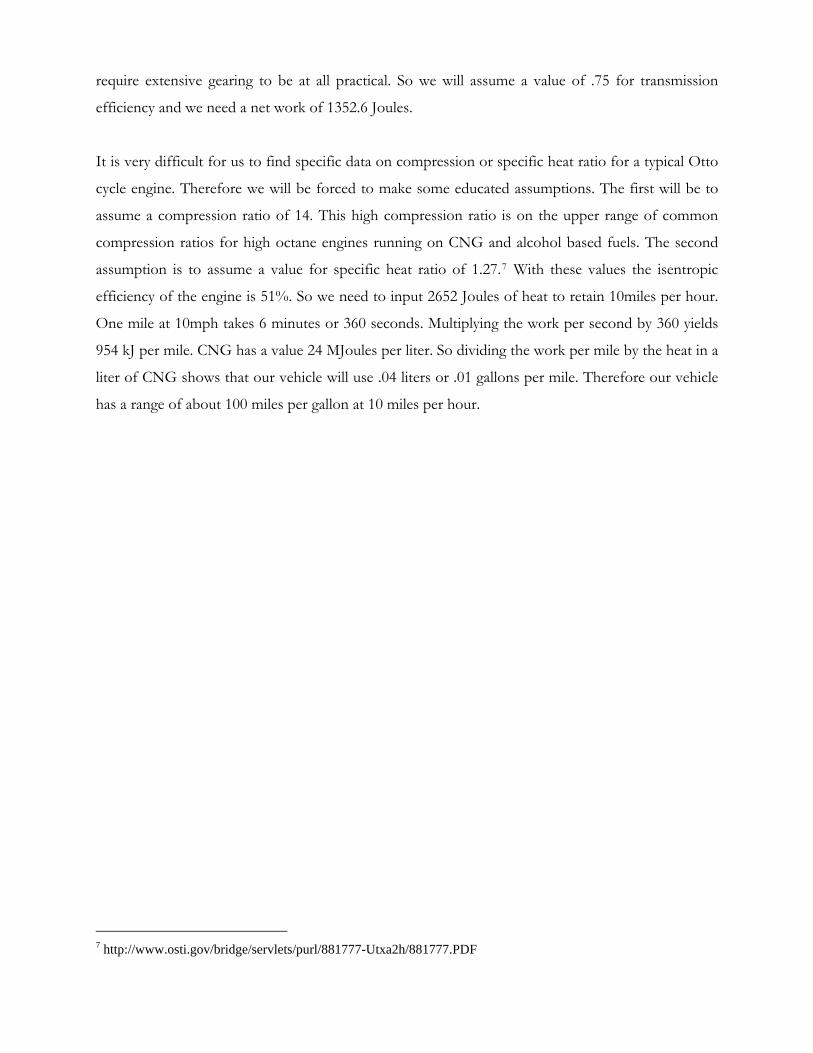
A 1:7.62 scale model was developed for testing in the wind tunnel. Using two pieces of foam board
glued together to the appropriate width, the vehicle was shaped using a sander belt and finer
adjustments were made with a band saw and finer grain sandpaper. The vehicle was then separated
into its two halves; perpendicular metal rods were embedded down the center of the model, and
glued back together.
Table 1. Results from wind tunnel testing
Wind speed\Parameter Lift (N) Drag (N) Pitching Moment (N · m)
0% 10.186474 2.746026 164.146848
10% (7.9726 m/s) 10.785593 2.851643 172.317444
20% (9.427225 m/s) 9.953827 3.004376 181.798879
30% (10.88185 m/s) 11.154102 3.299541 201.445158
40% (12.336475 m/s) 10.560015 3.889467 241.764936
50% (13.7911 m/s) 11.170950 4.270036 267.080781
60% (15.245725 m/s) 10.51203 4.691925 295.288458
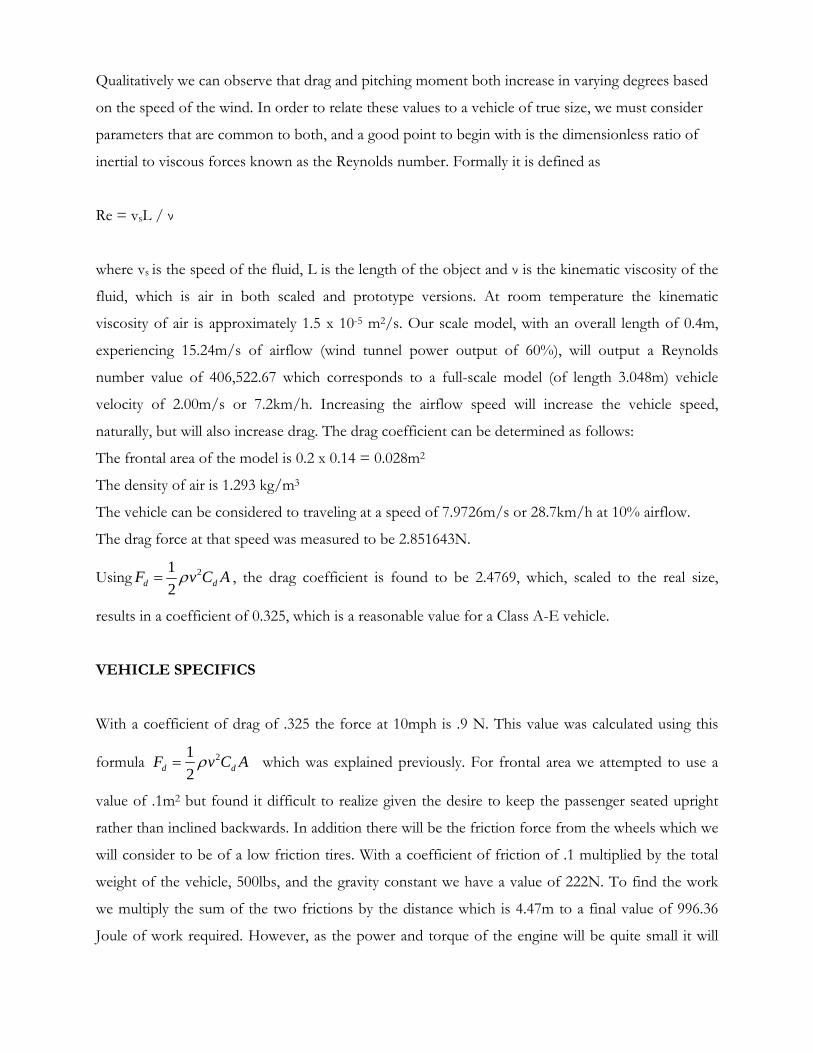
Qualitatively we can observe that drag and pitching moment both increase in varying degrees based
on the speed of the wind. In order to relate these values to a vehicle of true size, we must consider
parameters that are common to both, and a good point to begin with is the dimensionless ratio of
inertial to viscous forces known as the Reynolds number. Formally it is defined as
Re = vsL / ν
where vs is the speed of the fluid, L is the length of the object and ν is the kinematic viscosity of the
fluid, which is air in both scaled and prototype versions. At room temperature the kinematic
viscosity of air is approximately 1.5 x 10⁻⁵ m2/s. Our scale model, with an overall length of 0.4m,
experiencing 15.24m/s of airflow (wind tunnel power output of 60%), will output a Reynolds
number value of 406,522.67 which corresponds to a full-scale model (of length 3.048m) vehicle
velocity of 2.00m/s or 7.2km/h. Increasing the airflow speed will increase the vehicle speed,
naturally, but will also increase drag. The drag coefficient can be determined as follows:
The frontal area of the model is 0.2 x 0.14 = 0.028m2
The density of air is 1.293 kg/m3
The vehicle can be considered to traveling at a speed of 7.9726m/s or 28.7km/h at 10% airflow.
The drag force at that speed was measured to be 2.851643N.
Using 212d dF v C Aρ= , the drag coefficient is found to be 2.4769, which, scaled to the real size,
results in a coefficient of 0.325, which is a reasonable value for a Class A-E vehicle.
VEHICLE SPECIFICS
With a coefficient of drag of .325 the force at 10mph is .9 N. This value was calculated using this
formula 212d dF v C Aρ= which was explained previously. For frontal area we attempted to use a
value of .1m2 but found it difficult to realize given the desire to keep the passenger seated upright
rather than inclined backwards. In addition there will be the friction force from the wheels which we
will consider to be of a low friction tires. With a coefficient of friction of .1 multiplied by the total
weight of the vehicle, 500lbs, and the gravity constant we have a value of 222N. To find the work
we multiply the sum of the two frictions by the distance which is 4.47m to a final value of 996.36
Joule of work required. However, as the power and torque of the engine will be quite small it will
require extensive gearing to be at all practical. So we will assume a value of .75 for transmission
efficiency and we need a net work of 1352.6 Joules.
It is very difficult for us to find specific data on compression or specific heat ratio for a typical Otto
cycle engine. Therefore we will be forced to make some educated assumptions. The first will be to
assume a compression ratio of 14. This high compression ratio is on the upper range of common
compression ratios for high octane engines running on CNG and alcohol based fuels. The second
assumption is to assume a value for specific heat ratio of 1.27.7 With these values the isentropic
efficiency of the engine is 51%. So we need to input 2652 Joules of heat to retain 10miles per hour.
One mile at 10mph takes 6 minutes or 360 seconds. Multiplying the work per second by 360 yields
954 kJ per mile. CNG has a value 24 MJoules per liter. So dividing the work per mile by the heat in a
liter of CNG shows that our vehicle will use .04 liters or .01 gallons per mile. Therefore our vehicle
has a range of about 100 miles per gallon at 10 miles per hour.
7 http://www.osti.gov/bridge/servlets/purl/881777-Utxa2h/881777.PDF
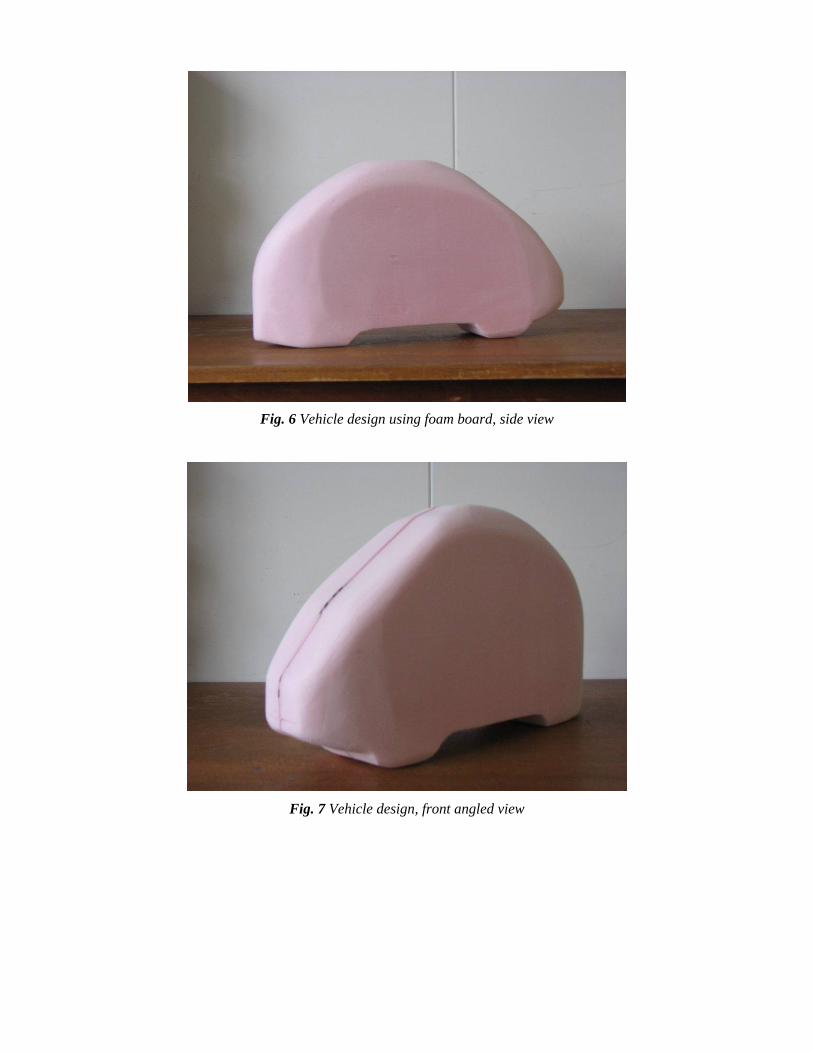
Fig. 6 Vehicle design using foam board, side view
Fig. 7 Vehicle design, front angled view
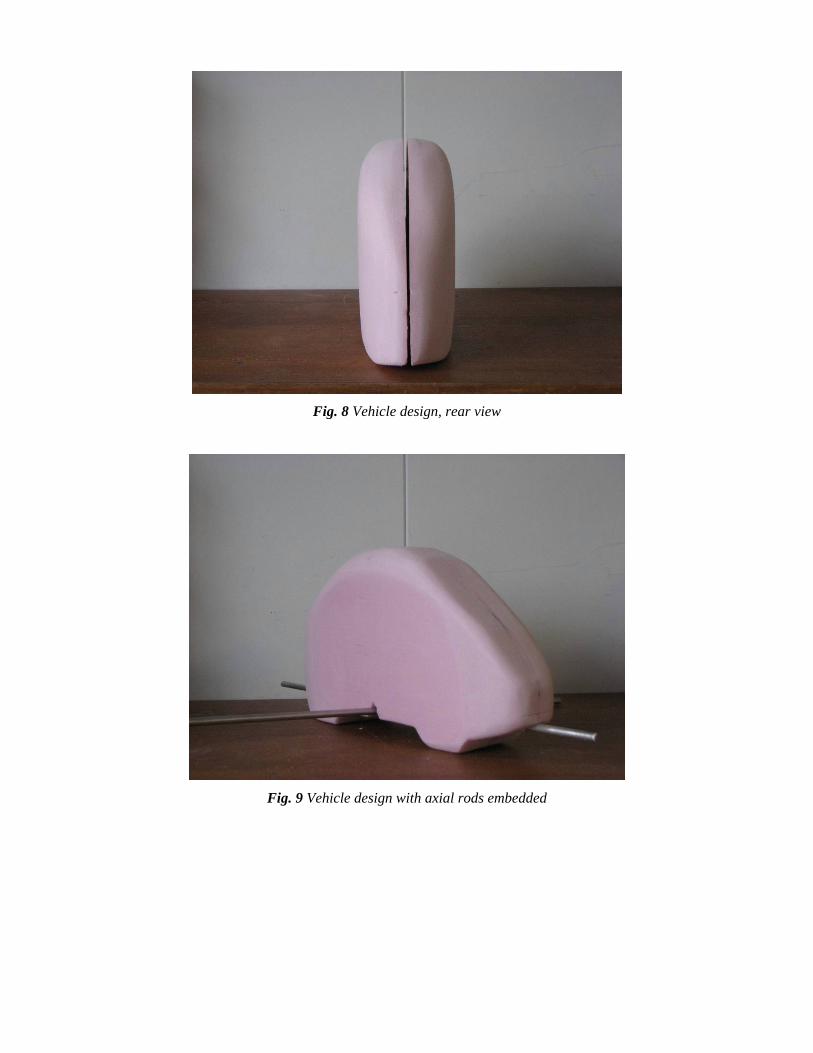
Fig. 8 Vehicle design, rear view
Fig. 9 Vehicle design with axial rods embedded
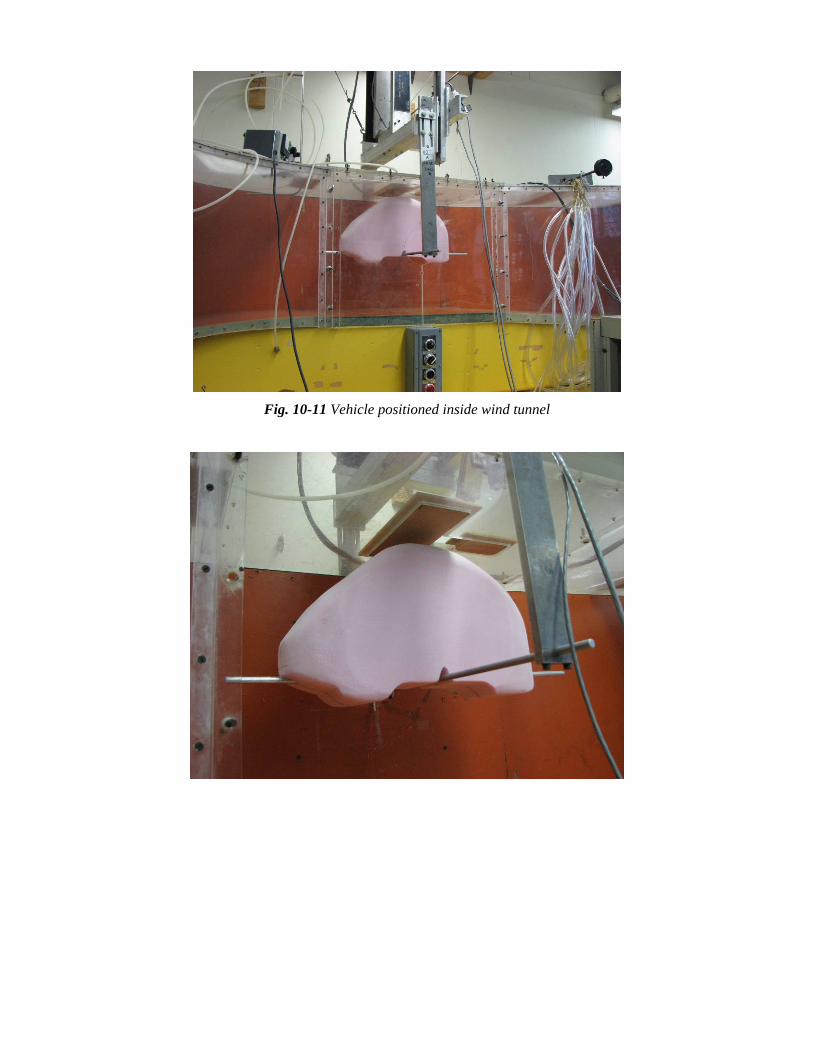
Fig. 10-11 Vehicle positioned inside wind tunnel
CONCLUSION
This lab reinforced some of the concepts learned during the course on fluid mechanics, and allowed
us to design a relatively efficient commuter vehicle that is capable of reasonable speeds of
approximately 10mph without significant drag, and allowed the group to understand the various
components necessary in designing, including modeling of the car as well as wind tunnel testing.
While the scale model itself was relatively crude in shape and overall representation of our actual
design, it did however provide the group with the opportunity to test it in a wind tunnel.
Our group ultimately decided to remain conventional by using an Otto-cycle engine but added a bit
of state-of-the art technology in using the Pivotal piston engine, which promises to change the way
combustible engines function by making them simultaneously more efficient while allowing for
greater Carnot efficiency by running a cooling line through the center of the engine itself. As the
engine is still in its experimental stages specifics are not known, but it is a promising device
nonetheless for alternative-fuel engines of the future. Another consideration taken was to use CNG
instead of standard gasoline, which is more efficient and less destructive to the environment – it is
yet to be widely accepted and employed in the United States, however, with the only currently
available vehicle being the Honda Civic GX. As fuel prices rise and environmental concern is taken
more seriously by consumers and producers alike, one would hope that alternative fuel vehicles will
gradually replace existing gasoline-powered vehicles.
REFERENCES
http://findarticles.com/p/articles/mi_qa4078/is_200406/ai_n9454444#
Grateful acknowledgement is made to Prof. Carr Everbach for allowing for the construction of, as
well as the wind tunnel testing of our vehicle design.