Embed Size (px)
Citation preview

e-Waste Assessment in Uganda
A situational analysis of e-waste management and generation with special emphasis on personal computers
Final Report 6 May 2008
Authors
John Wasswa, Uganda Cleaner Production Centre, Kampala/Uganda
Mathias Schluep, Empa, St.Gallen/Switzerland

e-Waste Assessment in Uganda – a situational analysis
2/35
Table of Contents
1 Executive Summary.......................................................................................................................... 4 2 Introduction ...................................................................................................................................... 7
2.1 Problem identification................................................................................................................ 7 2.2 Geographical Scope.................................................................................................................. 7 2.3 Product Scope .......................................................................................................................... 8 2.4 Objective of the assessment ..................................................................................................... 8
3 What is e-waste? .............................................................................................................................. 9 4 Methods .......................................................................................................................................... 11
4.1 Data acquisition ...................................................................................................................... 11 4.2 Massflow Assessment............................................................................................................. 12
5 System Definition ........................................................................................................................... 13 5.1 Development indicators........................................................................................................... 13
5.1.1 People........................................................................................................................... 13 5.1.2 Environment .................................................................................................................. 13 5.1.3 Economy ....................................................................................................................... 14 5.1.4 States & Markets ........................................................................................................... 14
5.2 Policy & Legislation................................................................................................................. 16 5.2.1 e-Waste related policies................................................................................................. 16 5.2.2 e-Waste related legislation............................................................................................. 17 5.2.3 Specific e-waste management legislation....................................................................... 18 5.2.4 Institutional framework................................................................................................... 18
5.3 Stakeholders........................................................................................................................... 19 5.3.1 Stakeholder overview..................................................................................................... 19 5.3.2 Manufacturers and importers ......................................................................................... 20 5.3.3 Distributors .................................................................................................................... 21 5.3.4 Consumers .................................................................................................................... 22 5.3.5 Collectors ...................................................................................................................... 25 5.3.6 Refurbishers .................................................................................................................. 27 5.3.7 Recyclers....................................................................................................................... 28 5.3.8 Downstream vendors..................................................................................................... 32 5.3.9 Final Disposers.............................................................................................................. 32 5.3.10 Most affected communities ...................................................................................... 33 5.3.11 Other stakeholders .................................................................................................. 33
6 Massflow Assessment.................................................................................................................... 35 6.1 Massflow system chart ............................................................................................................ 35 6.2 Current massflows .................................................................................................................. 36
7 Impacts ........................................................................................................................................... 40 7.1 Social...................................................................................................................................... 40 7.2 Environment............................................................................................................................ 40 7.3 Economy................................................................................................................................. 41
8 Conclusion...................................................................................................................................... 42 8.1 Strengths and Weaknesses of the Current Situation................................................................ 42 8.2 Recommendations for the UNIDO/Microsoft refurbishment initiative ........................................ 44
9 References...................................................................................................................................... 46

e-Waste Assessment in Uganda – a situational analysis
3/35
1 Executive Summary
Within the framework of the partnership agreement that was signed in July 2006, UNIDO and Microsoft plan to make secondary PCs available to SMEs in developing economies in a safe and sustainable way. As part of this initiative it is intended to support the establishment of local sustainable e-waste recycling facilities.
The study’s objectives are to provide a situational analysis with respect to the generation and management of electronic waste in Uganda. It aims:
• to provide the necessary data to define a solution for handling the e-waste associated with the UNIDO/Microsoft refurbishment project.
• to provide general data about the e-waste situation in Uganda and thus the study should also serve for further initiatives by other stakeholders, e.g. for the developing a policy framework, etc.
Current situation
There is currently no e-waste specific policy or legislation in Uganda. However, approx. 9 national (envi-ronmental) laws and approx. 9 signed international conventions have a bearing on e-waste.
Currently around 10 computers per 1,000 inhabitants are installed. This amounts to about 300’000 installed computers in 2007. The installed computers are mainly owned by governmental & educational Institution and NGOs (~75 %), followed by large enterprises (~20 %) and private households, SMEs and others (~5%). According to Customs records 25,000 new computers and 4,000 second-hand computers were imported in 2007. There is evidence that due to the newly introduced “zero tax policy on importation of computers” a large portion of imported second-hand computers is not registered through customs and thus this number easily could double.
Government and large enterprises replace computers after 3-5 years and often auction them for second-hand use, where the computer is used for another 5-8 years. Imported second-hand computers through professional refurbishment centres have a life span of approx. 5 years. Based on this numbers it was estimated that around 53,000 computer units reached their end of life in 2007.
It is expected that only around 10% of those computers reach the waste stream, whereas the rest is kept in storage without being used. The 10% in the waste stream get collected by individuals, whereas material and parts are sold informally and the rest gets dumped informally. This suggests that Uganda has built up a com-puter waste stock of approx. 80,000 pieces. This equals to about 2,000 tons of computer waste (desktop unit and CRT screen) in total, which contains e.g. 80 tons of printed circuit boards and 400 tons of plastic. This numbers are hypothetical but represent a realistic order of magnitude.
0
50000
100000
150000
200000
250000
300000
350000
1995 1996 1997 1998 1999 2000 2001 2002 2003 2004 2005 2006 2007
Am
oun
t of
com
pute
rs
Installed computers originating from second-hand imports
Installed computers originating from new imports
amount of computers which reach their end-of-life
Total amount of installed computers
Analysis of generated end-of-life computers based on a life-span of second-hand computers of 5 years and new com-puters of 9 years

e-Waste Assessment in Uganda – a situational analysis
4/35
Formal e-waste recyclers do not exist in Uganda. However there are recycling options for different waste streams generated by a personal computer, which includes the plastic (needs investments to include plastic from e-waste), ferrous metals, aluminium and copper. There are no recycling options for printed wiring boards, cathode ray tubes and hazardous fractions, such as batteries. No signs were found for the existence of any informal leaching activities to extract precious metals from e-waste (e.g. gold recovery). It has to be ex-pected that cables and probably other parts from electrical and electronic equipment are burned in open fires in order to recover copper.
Recycling options in Uganda for different waste streams generated by a personal computer Material fraction Recycling in Uganda Possible downstream partners Plastic partially Plastic Recycling Industries (U) Ltd (capable to recy-
cle e-waste plastic only with investments) Ferrous metals yes Steel rolling mills Ltd Aluminum yes Shumuk Aluminium Industries (U) Ltd Copper partially H&H Ltd. (dismantling practice for cables unclear) Printed wiring boards (precious metals)
no Not available in Uganda, export to Europe or Asia.
CRT tubes (containing lead, beryl-lium, phosphor, etc.)
no Needs a hazardous waste treatment facility (special incineration or controlled landfill) which is not avail-able in Uganda.
Export to Europe Hazardous fraction (PCB in capaci-tors, mercury in backlights, batter-ies)
no Needs a hazardous waste treatment facility (special incineration or controlled landfill) which is not avail-able in Uganda, Smaller capacitors and batteries can be left on the PWB when sold to international smelt-ers. Export to Europe
Conclusion
Considering the recent development in ICT imports of new and second-hand equipment and the already ex-isting stock of computer waste it is expected that considerably more e-waste will show up on the street in short time. Hence it is the right time for Uganda to engage in addressing the problem of increasing e-waste volumes. Waiting too long with actions bears the risk of a developing informal sector and more informal dumping, with all its social and environmental drawbacks.
Results of this study underline that the idea to address the e-waste problem within the UNIDO/Microsoft re-furbishment initiative was well anticipated. The initiative could play a pioneer role in Uganda in the respon-sible treatment of end-of-life computers. The manual disassembly of computer waste and further sales of the resulting material fractions can generate income for some of the fractions. However the correct disposal of the problematic fractions (especially CRT screens and batteries) will cost money. Thus it is expected that the sustainable recycling of computer waste in Uganda cannot be paid by the intrinsic value of the computer unit’s material content. The UNIDO/Microsoft refurbishment initiative will need to have a strategy to cover recycling and disposal costs.

e-Waste Assessment in Uganda – a situational analysis
5/35
2 Introduction
2.1 Problem identification
Difficulty of access to hardware and software to leverage the benefits of ICT is particularly acute for small and medium enterprises (SMEs) in less developed countries. Within the framework of the partnership agreement that was signed in July 2006, UNIDO and Microsoft plan to make secondary PCs available to SMEs in developing economies in a safe and sustainable way. As part of this initiative it is intended to sup-port the establishment of local sustainable e-waste recycling facilities.
The programme will develop a comprehensive refurbishment model, which addresses each stage of the re-furbished computer programme - from the time it arrives in the recipient countries, all the way to its proper disposal. The UNIDO-MS refurbishment initiative addresses the proper disposal and recycling of the com-puters once they reach their end of life. E-waste is becoming an ever-growing challenge, not only in indus-trialized but also in developing countries, such as Uganda.
There is a rapidly increasing computer market in Uganda as a result of the government’s policy to improve ICT and fight computer illiteracy in the country. However, there are no specific procedures of managing electronic waste within the country. Although the magnitude of the e-waste generation in Uganda cannot be stated with precision, the lack of a definite e-waste management policy and absence of disposal facilities for e-waste and hazardous materials in general within the country remains a subject of concern.
The UNIDO-MS initiative addresses this challenge in a responsible and innovative way and dedicates a pro-ject for the assessment and improvement of e-waste management related to the UNIDO-MS refurbishment initiative which could become a model for Uganda.
2.2 Geographical Scope
Uganda is located in East Africa and lies across the equator, about 800 kilometres inland from the Indian Ocean. It lies between 10 29’ South and 40 12’ North latitude, 290 34 East and 350 0’ East longitude. The country is landlocked, bordered by Kenya in the East; Sudan in the North; Democratic Republic of Congo in the West; Tanzania in the South; and Rwanda in South West. It has an area of 241,038 square kilometres, of which the land area covers 197,323 square kilometres. The country has a developing, market economy based largely on agriculture which generates 90% of export earnings. The Gross National Production (GNP) per capita is among the lowest in the world. The country was divided into 80 districts, sub divided into lower administrative units. These are counties, sub-counties, parishes and villages or Local Council 1 (LC 1) with the aim of making administration and delivery of services easier.
Twenty years ago, 70% of the communication services were concentrated in urban areas, leaving the rural areas with the least access to communication services. As a result of the liberalization policies adopted by the government during the 1990s, the infrastructure situation has changed, with tremendous growth in communi-cation and ICT infrastructure registered even in rural settings. However the level of infrastructure and ser-vices are way below the average compared with other economies in the World. Moreover most of the devel-opments are still concentrated in urban areas.
For this reason the scope of this study included all main urban centres in the country with Kampala as the main focus.
2.3 Product Scope
This study concentrates on personal computers and partly on associated CRT and LCD screens. The source of data in the report will be based on: Investigation/Survey at various levels and professional citizens; re-cords, reports and policies from relevant government organs, none government organizations (NGOs) and the private sector; websites of government departments and NGOs; and interviews with importers, collectors,

e-Waste Assessment in Uganda – a situational analysis
6/35
electronic products sellers, refurbishment centres, dismantlers in waste electronic products, distributing cen-tres, second hand products exchange markets and end-users.
2.4 Objective of the assessment
The study’s objectives are to provide a situational analysis with respect to the generation and management of electronic waste in Uganda. It aims
• to provide the necessary data to define a solution for handling the e-waste associated with the UNIDO/Microsoft refurbishment project. The definition of such a solution will be subject to a fol-lowing study defining different possible business cases for incorporating a manual dismantling fa-cility in the refurbishment operations.
• to provide general data about the e-waste situation in Uganda and thus the study should also serve for further initiatives by other stakeholders, e.g. for the developing a policy framework, etc.

e-Waste Assessment in Uganda – a situational analysis
7/35
3 What is e-waste?
Waste electrical and electronic equipment (WEEE) or e-waste for short is a generic term embracing various forms of electric and electronic equipment that have ceased to be of any value to their owners. In this article, we use the terms WEEE and e-waste synonymously and in accordance to the EU WEEE Directive. The cate-gories according to the EU WEEE Directive are listed in Table 1.
Table 1: WEEE categories according to the EU directive on WEEE No. Category Label
1
2
3
4
5
6
7
8
9
10
Large household appliances
Small household appliances
IT and telecommunications equipment
Consumer equipment
Lighting equipment
Electrical and electronic tools (with the exception of large-scale stationary industrial tools)
Toys, leisure and sports equipment
Medical devices (with the exception of all implanted and infected products)
Monitoring and control instruments
Automatic dispensers
Large HH
Small HH
ICT
CE
Lighting
E & E tools
Toys
Medical equipment
M & C
Dispensers
When e-waste is disposed of or recycled without any controls, there are predictable negative impacts on the environment and human health. E-waste contains more than 1000 different substances, many of which are toxic, such as lead, mercury, arsenic, cadmium, selenium, hexavalent chromium, and flame retardants that create dioxins emissions when burned. About 70 % of the heavy metals (mercury and cadmium) in US land-fills come from electronic waste. Consumer electronics make up 40 % of the lead in landfills. These toxins can cause brain damage, allergic reactions and cancer. E-waste contains considerable quantities of valuable materials such as precious metals. Early generation PCs used to contain up to 4 g of gold each; however this has decreased to about 1 g today. The value of ordinary metals contained in e-waste is also very high: 1 ton of e-waste contains up to 0.2 tons of copper, which can be sold for about 1000 US$ at the current world price (as of 2007). Recycling e-waste has the potential therefore to be an attractive business.
Given the diverse range of materials found in WEEE, it is difficult to give a generalised material composi-tion for the entire waste stream (Figure 1). However, most studies examine five categories of materials: fer-rous metals, non-ferrous metals, glass, plastics and other.
According to the European Topic Centre on Resource and Waste Management (ETC/RWM), iron and steel are the most common materials found in electrical and electronic equipment and account for almost half of the total weight of WEEE. Plastics are the second largest component by weight representing approximately 21% of WEEE. Non-ferrous metals, including precious metals, represent approximately 13% of the total weight of WEEE (with copper accounting for 7%).
Figure 1: Material composition of PC/servers, Laptops and CRT monitors (SWICO Recycling Guarantee 2007)

e-Waste Assessment in Uganda – a situational analysis
8/35
4 Methods
4.1 Data acquisition
Literature
There is no specific literature on e-waste generation and management available for Uganda. However some literature analyzing solid waste in general and studies regarding the development of the ICT sector in Uganda could be identified. In addition statistical data could be obtained through internet sources and gov-ernment records.
Importers of EEE were identified by a comprehensive review of customs verification records from Uganda Revenue Authority, a government organ under the Ministry of Finance which examines and verifies for taxa-tion/tax exemption all goods imported into the country. Distributors of EEE were identified through internet search.
Information on existing policies, laws and regulations within the country concerning generation, distribution, handling/management and disposal of e-waste in Uganda has been obtained by literature search from the ministry responsible for Information and Communication Technology (ICT), Education Ministry, the minis-try responsible for Trade and Industry and National Environment Management Authority (NEMA), a gov-ernment body that oversees and regulates all environment issues within the country.
Questionnaires
Questionnaires were used to get an overview of the consumer behaviour of various stakeholders. In addition they were designed to retrieve further information about the presence and nature of possible informal recy-clers and the purpose for which e-waste is used.
Questionnaires were sent to government institutions, NGOs, education institutions and businesses (Appendix 1) and were designed to extract the following:
• The number of computers and related peripherals possessed by an institution
• Life span of the of the computers and related peripherals
• What happens to obsolete computers
• Major obstacles in management of obsolete computers
• Opinion on the existing policies, among others.
Information obtained from literature search together with that extracted by use of questionnaires has been used to describe and quantify the flows and stocks of the products generating e-wastes in Uganda
Interviews
Personal interview have been conducted with various experts in order to obtain or complement information. Appendix 2 provides a list of the people interviewed in the course of this study.
4.2 Massflow Assessment
Material flow analysis method was selected for this assessment. The system and mathematical descriptions are well described in Empa’s e-Waste Assessment Methodology (Empa 2007) and applied in other e-waste assessment studies (Steubing, 2007).

e-Waste Assessment in Uganda – a situational analysis
9/35
5 System Definition
5.1 Development indicators
5.1.1 People
Uganda’s population is made up of different ethnic groups with varying customs and norms. These play a major role in shaping the behaviours and ways of life of the people in the country. Some of the traditional values have changed due to the integration of the people as a result of migration and/or intermarriages. Some cultural groupings are headed by traditional kings or chiefs who are not politically elected but have an indi-rect role in community governance and moral build up. There are a number of languages spoken because of the many tribes in Uganda; however English is the official language. The Swahili language is being pro-moted in the spirit of Regional Socio-Economic Corporation, and integration of the East African Commu-nity.
The level of urbanization is only 12.3 percent with urban unemployment rate estimated at 5.4 percent while that for rural areas is estimated at 2.0 percent (Uganda Bureau of Statistics 2002).
Table 2: Development indicators for Uganda with a bearing on e-waste, section “People” (World Bank 2007) Indicator Year Value
Population, total (in Mio) 2005 28.8
Population growth (annual %) 2005 3.5
Economically active children, total (% of children ages 7-14) 2003 13.1
Unemployment, total (% of total labor force) 2003 3.2
GINI index 2002 45.7
5.1.2 Environment
Major environmental problems in Uganda include industrial and domestic waste pollution, overgrazing, de-forestation, and primitive agricultural methods. Attempts aimed at controlling mosquitoes and tsetse flies have involved the use of hazardous chemicals. Industrial and domestic pollution also threaten the country’s water supply whose major source is Lake Victoria (NEMA 2007).
Although Uganda is one of the least urbanized countries in the world in absolute terms, the urban population is growing. Beginning from below one million in 1969, the urban population increased to around 3 million in 2002. The urban population is also growing faster (3.7%) than the national average (3.4%). The growth in the urban population means that pollution issues such as solid waste management, and the provision of ade-quate safe water and acceptable levels of sanitation coverage will have to be addressed.
Table 3: Development indicators for Uganda with a bearing on e-waste, section “Environment” (World Bank 2007) Indicator Year Value
Land area (sq. km) 2005
Population in largest city (in Mio) 2005 1.3
Population in urban agglomerations > 1 million (% of total population) 2005 4.6
Rural population (% of total population) 2005 87.4
Urban population (% of total) 2005 12.6
Household size national (number of people) 1991 4.9
Household size urban (number of people) 1991 4.0
e-Waste Assessment in Uganda – a situational analysis
10/35
5.1.3 Economy
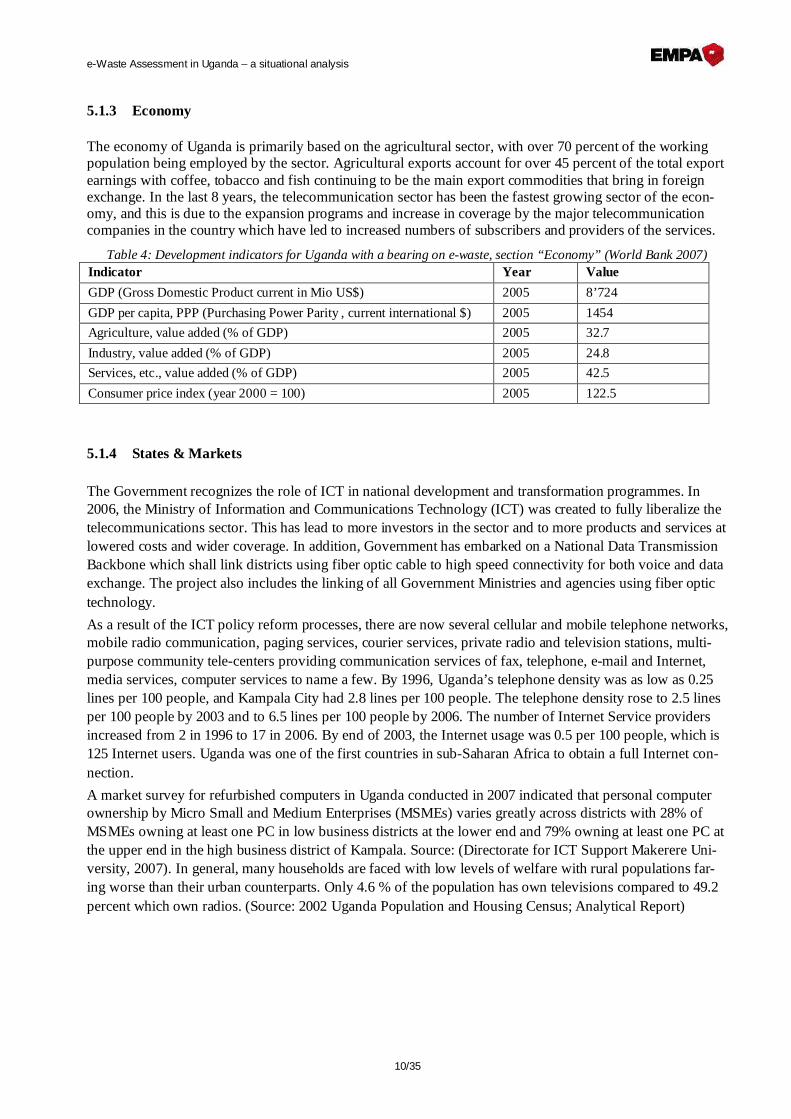
The economy of Uganda is primarily based on the agricultural sector, with over 70 percent of the working population being employed by the sector. Agricultural exports account for over 45 percent of the total export earnings with coffee, tobacco and fish continuing to be the main export commodities that bring in foreign exchange. In the last 8 years, the telecommunication sector has been the fastest growing sector of the econ-omy, and this is due to the expansion programs and increase in coverage by the major telecommunication companies in the country which have led to increased numbers of subscribers and providers of the services.
Table 4: Development indicators for Uganda with a bearing on e-waste, section “Economy” (World Bank 2007) Indicator Year Value
GDP (Gross Domestic Product current in Mio US$) 2005 8’724
GDP per capita, PPP (Purchasing Power Parity , current international $) 2005 1454
Agriculture, value added (% of GDP) 2005 32.7
Industry, value added (% of GDP) 2005 24.8
Services, etc., value added (% of GDP) 2005 42.5
Consumer price index (year 2000 = 100) 2005 122.5
5.1.4 States & Markets
The Government recognizes the role of ICT in national development and transformation programmes. In 2006, the Ministry of Information and Communications Technology (ICT) was created to fully liberalize the telecommunications sector. This has lead to more investors in the sector and to more products and services at lowered costs and wider coverage. In addition, Government has embarked on a National Data Transmission Backbone which shall link districts using fiber optic cable to high speed connectivity for both voice and data exchange. The project also includes the linking of all Government Ministries and agencies using fiber optic technology.
As a result of the ICT policy reform processes, there are now several cellular and mobile telephone networks, mobile radio communication, paging services, courier services, private radio and television stations, multi-purpose community tele-centers providing communication services of fax, telephone, e-mail and Internet, media services, computer services to name a few. By 1996, Uganda’s telephone density was as low as 0.25 lines per 100 people, and Kampala City had 2.8 lines per 100 people. The telephone density rose to 2.5 lines per 100 people by 2003 and to 6.5 lines per 100 people by 2006. The number of Internet Service providers increased from 2 in 1996 to 17 in 2006. By end of 2003, the Internet usage was 0.5 per 100 people, which is 125 Internet users. Uganda was one of the first countries in sub-Saharan Africa to obtain a full Internet con-nection.
A market survey for refurbished computers in Uganda conducted in 2007 indicated that personal computer ownership by Micro Small and Medium Enterprises (MSMEs) varies greatly across districts with 28% of MSMEs owning at least one PC in low business districts at the lower end and 79% owning at least one PC at the upper end in the high business district of Kampala. Source: (Directorate for ICT Support Makerere Uni-versity, 2007). In general, many households are faced with low levels of welfare with rural populations far-ing worse than their urban counterparts. Only 4.6 % of the population has own televisions compared to 49.2 percent which own radios. (Source: 2002 Uganda Population and Housing Census; Analytical Report)

e-Waste Assessment in Uganda – a situational analysis
11/35
Figure 2: Number of telephone customers (Tusuburia and Kaggwa 2005)
Overall, Uganda's economy is 64.4 percent free, according to the index of economic index (A product of The Heritage Foundation and Wall Street Journal) 2008 assessment, which makes it the world's 52nd freest econ-omy. Its overall score is 0.7 percentage point higher than last year, reflecting improved scores in four of the 10 economic freedoms. Uganda is ranked 3rd out of 40 countries in the sub-Saharan Africa region, and its overall score is much higher than the regional average. The country scores well in fiscal freedom, govern-ment size, financial freedom, and labor freedom. The top income and corporate tax rates are moderate and overall tax revenues are not large as a percentage of GDP. Government expenditures are fairly low. The small financial sector is dominated by banking. The labor sector is elastic in work hours and workforce flexibility. Uganda is weaker in freedom from corruption, property rights, and business freedom. Commer-cial licensing is burdensome, and regulations are enforced inconsistently. Corruption is perceived as wide-spread. Uganda ranks 105th out of 163 countries (CPI 2.7) in Transparency International's Corruption Per-ceptions Index for 2006. In addition to demands for and acceptance of bribes, bureaucratic apathy and igno-rance of rules within public organizations also contribute to perceptions of corruption. Foreign businesses are not specifically targeted for bribes and payoffs, but they report some difficulties due to lack of transparency and possible collusion between competing business interests and government officials.
Table 5: Development indicators for Uganda with a bearing on e-waste, section “States & Markets” (World Bank 2007)
Indicator Year Value
Personal computers (per 1,000 people) 2005 8.7
Internet users (per 1,000 people) 2005 17.4
Telephone mainlines (per 1,000 people) 2005 3.5
Mobile phone subscribers (per 1,000 people) 2005 52.9
Households with television (%) 2002 4.5
5.2 Policy & Legislation
5.2.1 e-Waste related policies
The supreme law of Uganda is its Constitution and the state is by law committed to protecting all its natural recourses through National Objectives XII, XX1 and XXVII.
XIII. Protection of Natural Resources. The State shall protect important natural resources, including land, water, wetlands, minerals, oil, fauna and flora on behalf of the people of Uganda.

e-Waste Assessment in Uganda – a situational analysis
12/35
XXI. Clean and Safe Water. The State shall take all practical measures to promote a good water management system at all levels.
XXVII. The Environment. (i) The State shall promote sustainable development and public awareness of the need to manage land, air, water resources in a balanced and sustainable manner for the present and future generations.
(ii) The utilization of the natural resources of Uganda shall be managed in such a way as to meet the de-velopment and environmental needs of present and future generations of Ugandans; and in particular, the State shall take all possible measures to prevent or minimize damage and destruction to land, air and water resources resulting from pollution or other causes.
(iii) The State shall promote and implement energy policies that will ensure that people's basic needs and those of environmental preservation are met.
(iv) The State, including local governments, shall- (a) Create and develop parks, reserves and recreation areas and ensure the conservation of natural resources; (b) promote the rational use of natural resources so as to safeguard and protect the bio-diversity of Uganda.(c) have binding force all authorities and persons throughout Uganda The State shall protect important natural resources, including land, water, wetlands, min-erals, oil, fauna and flora on behalf of the people of Uganda
5.2.2 e-Waste related legislation
Uganda’s constitution also enjoins Parliament to make laws that may further the principles and policies of the State. In pursuance of these constitutional provisions, a number of laws exist in Uganda relating to dif-fract aspect of e-waste management within the country. Relevant laws are given in Table 6 below.
Table 6: Environmental laws related to e-waste management Legal instrument Objective of legislation National Environment Act 4/1995
To provide for sustainable management of the environment; to establish an authority as a coordinating, monitoring and super-visory body for that purpose
The Environmental Impact Assessment Regula-tions S.1 No 13/1998
To collect, organize, analyze, interpret and communicate in-formation that is relevant to the consideration of the initiation of a new project;
The National Environment (Delegation of Waste Discharge Functions) Regulations S.I. No. 56/1999
Monitoring and implementation of standards
The National Environment (Standards for Dis-charge of Effluent into Water or on Land) Regu-lations S.I. No. 5/1999
To regulate management of waste waster
The National Environment (Solid Waste Man-agement) Regulations S.I. No. 52/1999
To regulate management of solid wastes
The National Environment (Management of Ozone Depleting Substances and Products) Regulations S.I. No. 63/2001
To regulate management of ODSs
The Ratification of Treaties Act 5/1998
Provides for the procedure for ratification of treaties in accor-dance with Article 123 of the Constitution.
The Water Statute 9/1995
To provide for the use, protection and management of water resources and supply.
The Waste and Hazardous Waste Management Regulations, 2000
To regulate the management of wastes and hazardous wastes including: sorting, disposing, internal movement, transporta-tion, packaging, labeling, trans-boundary movement, notifica-tion procedures, environmental impact assessment.

e-Waste Assessment in Uganda – a situational analysis
13/35
Uganda is a signatory to a number international conventions and guidelines which in one way or another ad-dress issues pertaining to e-waste. The International Conventions to which Uganda is a signatory are give in table 3.2
Table 7: International conventions and guidelines related to e-waste management Instrument Objective London Guidelines for the Exchange of Informa-tion on Chemicals in International Trade 1987 (as amended in 1989) (voluntary)
Intend to increase chemical safety through the exchange of information on chemicals in international trade.
Convention on the Prohibition of the Develop-ment, production, stockpiling and use of Chemi-cal Weapons and on their Destruction 1994.
Ban development, production and use of chemical warfare agents and precursors
World Charter for Nature 1982 To avoid discharge of pollutants into natural systems. Rotterdam Convention on the Prior Informed Consent Procedure for certain hazardous chemi-cals in international trade.
To promote shared responsibility and cooperative efforts among parties in the international trade of certain hazardous chemicals in order to protect human health and the environ-ment from potential harm.
Code of Ethics on the International trade in Chemicals (voluntary) 1994
Sets forth principles and guidance for private sector parties, governing standards of conduct in the production and man-agement of chemicals in international trade with the purpose of reducing risks to human health and the environment.
Vienna Convention for the Protection of the O-zone Layer (1985)
To raise international cooperation in protecting the ozone layer from depletion.
Montreal Protocol on substances that deplete the ozone layer (1987)
To provide in detail for the technical issues relating to ozone depleting substances.
Basel Convention on the Control of Transbound-ary Movements of Hazardous Wastes and their disposal.
To provide for proper management of hazardous wastes and other wastes including their transboundary movement and dis-posal.
Stockholm Convention on Persistent Organic Pollutants (POPs
To protect human health and the environment from persistent organic pollutants (POPs).
5.2.3 Specific e-waste management legislation
Uganda does not have e-waste specific legislation but instead uses the existing generic National Environment (solid waste management) Regulations of 1999 that are enshrined in the National Environment Act, Cap. 153 to address solid waste issues.
5.2.4 Institutional framework
The 1995 Constitution established Uganda as a republic with an executive, legislative, and judicial branch. The three branches operate as follow:
• The Executive branch Cabinet. The Executive branch is headed by the President who is assisted by the Vice President, the Prime Minister and Cabinet Ministers.
• The Judiciary. It is formed by the various courts of judicature, which are independent of the other arms of government. They include the magisterial courts, High Court, Court of Appeal and the Su-preme Court. The Judiciary is headed by the Chief Justice and deputized by the Deputy Chief Jus-tice.
• The Parliament which is the legislative arm of the government. It consists of 305 members most of whom are elected through the ballot box except a few special interest groups like the army, women, youth and the disabled whose representatives were elected by Electoral Colleges.

e-Waste Assessment in Uganda – a situational analysis
14/35
The roles and powers of each of the Government arms are enshrined and spelt out in the Uganda Constitution 1995.
5.3 Stakeholders
5.3.1 Stakeholder overview
The main stake holders in e-waste generation and management are the manufactures, distributors/importers, refurbishment centres, consumers, collectors, recyclers, policy makers and policy implementers. There are no computer manufacturing industries in Uganda; computers are imported as whole (ready to sell) and in iso-lated cases are imported in parts and then assembled, although not at full commercial basis.
The major stake holders in e-waste generation and management in Uganda can be described graphically as follows.
Figure 3: System figure showing stake holders in e-waste generation and management in Uganda
5.3.2 Manufacturers and importers
Records from Customs Department of the Uganda Revenue Authority indicate that a total of 82,388 com-puters have been imported into Uganda between 2003 and 2006. A distribution of imports over these years is shown in Figure 4. According to customs officials all computers (whether old or new) imported into the country are supposed to be registered through customs. However it appears that since the introduction of the ‘zero tax policy’ on importation of computers, Uganda customs officials do not put emphasis on the numbers of second-hand computers in a particular consignment provided it is declared to be containing computers. Thus it is estimated that the amount of imported second-hand computers is considerable higher than reflected in the customs numbers (indicated in Figure 4 as “second-hand not registered”).
In addition inconsistencies in the taxation of computer related components contrary to this policy have been reported. Unassembled computer parts tend to attract taxes while assembled computers are zero rated (The Parliament of Uganda 2006).
The commonly used branded computers whether purchased new or second hand are IBM, Dell, Hewlett Packard, Acer, and Toshiba (Figure 5). Branded computers dominated the imports of either new or second hand computers.

e-Waste Assessment in Uganda – a situational analysis
15/35
0
5000
10000
15000
20000
25000
30000
35000
2003 2004 2005 2006
amo
un
tsecond-hand not registered(estimated)
second-hand registered
new
Figure 4: Number of computers imported into Uganda between 2003-2006 (URA 2008)
Figure 5: Estimated market share of the main computer brands found in Uganda based on a survey among 62 con-
sumer respondents
Figure 6: New vs. second hand importations of branded and non branded computers

e-Waste Assessment in Uganda – a situational analysis
16/35
5.3.3 Distributors
Over 100 distributers of computers in the country exist. The main distributors according to customs records are:
• Computer Point (U) Ltd • Kazinga Channel • NCR service and computer industries • Seven Seas computer empire • CAL (Computer applications Ltd); The IBM representatives • MFI computer solutions • Master electronics (U) Ltd
In 2007 the seven companies above imported a combined total of 12, 056 computers representing 42% of all the imports in that year. Major clients of the firms are finance and banking institution, non-government or-ganizations, education and research institutions, corporate sectors and government ministries / parastatals.
The personnel in each of the firms is on average 20, who undergo training to offer after sale services
Telecommunication companies (MTN, UTL, CELTEL) sell off 3 year old computers to their staff and schools.
Figure 7: Impressions of computer distributors in Kampala, Uganda
5.3.4 Consumers
Data response from at least 33 distributors as well as records from customs indicate that at an average, 74.3% percent of all computers imported between 2004 – 2006 were distributed or sold to government institutions, education institutions and non-government organizations. Approximately 18.6 % of the computers were dis-tributed or imported for business purposes and purpose for which the remaining percentage was sold out could not be stated with precision but could be pegged to households and other purposes (Figure 8). Accord-ing to another study by (Tusuburia and Kaggwa 2005) around 3.5% of households in urban areas and 0.4% of households in rural areas claim to possess a computer Figure 9.

e-Waste Assessment in Uganda – a situational analysis
17/35
Figure 8: Consumer usage of Computers by sector
Presence of working computer in a household
0%
20%
40%
60%
80%
100%
Co
l%
Urban 3.50% 96.50%
rural 0.40% 99.60%
Yes No
Figure 9: Computer distribution by location (Tusuburia and Kaggwa 2005)
Statistics say that in 2005 approx. 8.7 computers were installed per 1,000 people, which sums up to an in-stalled base of 250,000 computers. However the number of computers imported then in 2005 was 11,606; this figure has since almost tripled (Figure 4). Assuming that only a few computers were thrown away since 2005 a total installed base of 300,000 could be expected for Uganda in 2007. Assuming a population growth of 3.7% the installed computer base per 1,000 people would increase to 9.7 in 2007.
Figure 10 shows the development of the installed base since 1995. It can be seen that there is a relevant in-crease from 2004 to 2005. It is very probable that this goes back to the introduction of the zero tax policy on importation of computers.

e-Waste Assessment in Uganda – a situational analysis
18/35
0
50000
100000
150000
200000
250000
300000
350000
1995 1996 1997 1998 1999 2000 2001 2002 2003 2004 2005 2006 2007
Tota
l in
stal
led
bas
e o
f per
son
al c
omp
uter
s
Figure 10: Total installed base of personal computers 1995-2007 (World Bank 2007)
Among the business community, computers are mainly used for office administration (Figure 11)
The life span of a computer in most business enterprises is 4 year (according to 73% response from this study) after which new component, if available are fixed.
Figure 11: Functional uses of computers among business consumers
Government: According to interviews from Ministries of Trade Tourism and Industry; Health, Finance and Works/Transport, the average life span of new computers is 3-5 years. After this period, the now “old com-puters” are auctioned to the public (which might include employees of the ministry in question) after being inspected by the Board of Surveys which is under the ministry of finance. The reason given for the life span ranges between 3-5 years is that some computers when inspected at 3 years are found “suitable for use” for another two years whereas others are not.
Large enterprises: In large enterprises (source: telecommunication companies and NGO’s) the average life span of new computers is 4 years after which they are sold to small/medium enterprises, the public or do-nated to schools.

e-Waste Assessment in Uganda – a situational analysis
19/35
MSMEs including schools: Micro, small and medium sized enterprises are the major buyers of second hand/refurbished computers. Responses from 5 selected schools and 3 medium enterprises indicate that life span of second hand computers is 5 years but can be extended to 7 years when the faulty components are replaced by new ones.
Private households: Based on a random sampling among 20 private computer owners, private house holds tend to hold on their PCs longer than any other sector. All the interviewees had bought second hand com-puters.11 out of the households indicated that that they had been with their (second-hand) PCs for more than 5 years and believed that they could serve for another 3 years because most had replaced the hard drives with new ones.
5.3.5 Collectors
According to the National Environment Management Authority (NEMA) there is no formal collection of e-waste in Uganda. Informal collection of junk computers (e-waste material) exists; individuals buy old com-puters at a cost approximately US $20. These are not formal companies but individuals survive on selling scrap from old computers. Some individuals were identified to be practicing informal collection (Table 8).
Table 8: Some of the individuals practicing informal collection Names Contacts Nature of waste and purpose
Ssemwanga Moses Kampala Industrial Area, 7th Street. Tel 256-772-631068
- Computer monitors
- Started collecting two years ago
- estimates to have collected 2 tones of plastic since
-key metallic components sold to informal vendors
-Plastic sold to Sunshine Plastics
Ali Kimera Mperererwe, Gayaza Road. Tel 256-775337008
-CPU and Computer monitors
-Sold to informal vendors
-Plastic sold to Sunshine plastic
-Collects scrap monitors mainly from KCC landfill in Kiteezi
-Started one year ago and estimated to have collected 500,000 kg of plastic
Habib Kulumba Katwe, Telephone 256 772425951
CPU, monitors and printers
Informal collection scheme is known from the plastics waste stream where plastic plants use a “scrap for cash” principle as a mode of payment; with some families living on selling plastic scrap (Figure 12).

e-Waste Assessment in Uganda – a situational analysis
20/35
Figure 12: Backyard of a family who collects plastic waste for sale
5.3.6 Refurbishers
There exists two categories computer refurbishing industries in Uganda; the formal and informal refurbishing industries. The informal industry appears to be well developed to the extent that a big percentage of com-puters in Uganda have second or even several usage times. The major informal refurbishing centres are summarized in Table 9.
Table 9: Major Informal computer Refurbishers in Uganda Name of company Location Operations E-Waste generated
Computer Facilities Plot 61 Bukoto Street, Kamwokya, Kampala, Uganda
Upgrading of the operating system and the exchange of peripheral hardware such as keyboard and mouse.
Approximately 10 Kg of metallic components per week
Collected by street vendors
(Source of information: Personal Interview)
Global Tech Computer Distributors Uganda Lim-ited
Kampala Uganda Local tech support, customer service and repair
Metallic usually collected by vendor
-About 500kg of junk print-ers awaiting disposal
(Source of information: Personal Interview)
SBM General Suppliers
Kampala Uganda Computer distributors and repairs
Many small companies and individuals describe themselves as experts in computer repairing. In addition, several small scale businesses exist who survive on refilling ink cartridges for printers.
According to two of the informal refurbishers presented (Computer Facilities and Global Tech Computer Distributors Uganda Limited) the number of computers brought to each company for refurbishing ranges between 10 -20 per week. The operations include upgrading of the operating system and the exchange of pe-ripheral hardware such as keyboard and mouse. However, they do claim that their technicians are usually contacted on private arrangements and repair the computers from their customers’ premises which greatly affect their businesses. 5 independent technicians were interviewed and have separately indicated that they

e-Waste Assessment in Uganda – a situational analysis
21/35
service an average of 5 computers a week. In Kampala alone they are more than 30 private computer service technicians. It is estimated that the above mentioned informal refurbishers (Table 9) represent around 30% of all informal refurbishment operations in Uganda.
The second category is the commercial refurbishment centres in which used computers are imported and re-furbished them re-sell. Computers from such centres are cheaper compared with the new brands, the prices ranging between US $ 130 – US $ 250. The two most common centres for commercially refurbished com-puters are Second Life and Inter Connection Uganda (Table 10).
It is estimated that the above mentioned commercial refurbishers (Table 10) represent around 70% of all formal refurbishment operations in Uganda, considering that some upcountry urban town were not covered during the study.
Table 10: Major Commercial computer Refurbishment centres in Uganda Name of Company Years of operation and
number of computers im-ported
Waste generated Life span of com-puters
Second Life 2005 – 1000 computers
2006 – 2000 computers
2007 – 2400 computers
Approximately 6% of imports are wastes
Waste collected infor-mally
Currently in possession of about 300kg of junk printers
3-5 years
(Contact Person: Robert Jan Nieuwpoort;)
Interconnection Uganda Officially launched its opera-tions on 30th June 2007 – Have so far imported about 1400 computers
Approximately 70 pieces Estimated life span 4years
UNIDO/Microsoft is also in a process of establishing a modern computer refurbishment centre which is an-ticipated to increase access to more affordable quality computers to low income earners. Disposal of used products (metallic and plastic) remains a challenge to the two centres.
5.3.7 Recyclers
5.3.7.1 e-Waste recycling
Formal e-waste recyclers do not exist in Uganda. However a few informal activities were identified, whereas re-use and recycling cannot always be distinguished perfectly:
• Collection of computer wastes and re-sell of key components by a few individuals • Some monitors are transformed into TV screens and resold in Kampala suburbs • Plastic casing are sold to plastic recycling plants. • No signs were found for the existence of any informal leaching activities to extract precious metals
from e-waste (e.g. gold recovery). • Although no visual evidence could be found for informal copper recycling it has to be expected that
cables and probably other parts from EEE are burned in open fires in order to recover the copper
5.3.7.2 Plastic recycling
Three plastic recycling plants exist in Kampala:
Plastic Recycling Industries (U) Ltd
• located in Nakawa Industrial Area Kampala

e-Waste Assessment in Uganda – a situational analysis
22/35
• This plant recycles 8 tones of plastic per month worth 8,000 Euros • The plant recycles mainly Polyethylene Terephthalate (PET) and High Density Polyethylene
(HDPE) plastics • Plastic is bought directly from collectors (in Kg), manually sorted before being recycled • The company plans for an extension to include recycling of other forms of plastic such as Polysty-
rene (PS) and ABS • The owner of the plant (Alex Byaugaba) shows great interest to extend his operations to include
plastic from e-waste, i.e. he suggested that he could run such a facility on behalf of the refurbishment centre
• According to his information a well pre-sorted ABS plastic from IT equipment (40% of all plastic in IT equipment) is worth ~2000 US$/ton. Numbers from South Africa support this estimation where this kind if plastic is sold at a prize of 1800 US$/ton to China.
Figure 13: Plastics Recycling Industries (U) Ltd
Sunshine Plastics Ltd
• Located on Plot No 1 Sembule close, Nalukolongo industrial area , Kampala • This plant has a lower turnover of about 2 tones per month and is located on a small piece of land • The plant also recycles Polyethylene Terephthalate (PET) and High Density Polyethylene (HDPE)
plastics only • The proprietors buy computer casings from informal collectors and from Kampala City council land-
fill, and intend to export it to China • For the two year the company has been in operation, approximately two tones of computer casings
have been bought from the informal collector which since is piled in its premises. Assuming a plastic content of 5 kg per personal computer (desktop and screen) the plastic is originating from around 400 computers.

e-Waste Assessment in Uganda – a situational analysis
23/35
Figure 14: Computer casings at Sunshine Plastics Ltd
Bwaise Plastic Recycling Plant
• located in Katoogo Zone, Kawempe Division, 4 Km from Kampala City • This plant can be categorized as an informal recycling plant and is located in a residential area • Its capacity is only 700Kg a week, recycles only Polyethylene Terephthalate (PET) and collects plas-
tic from hotels and dumping sites • The plant sells its products to Sunshine Plastics Ltd for export to China
Figure 15: A side View of Bwaise Plastic Recycling Plant
5.3.7.3 Metal recycling
There are also metal recycling plants dealing in steel and aluminium of which two main ones were identified. One company buying copper could be identified as well, whereas there are no detailed information available for this company. There is a problem of copper theft in Uganda, especially with copper electric cables. It has to be assumed that metal recyclers are also buying copper from such informal sources.
Steel rolling mills Ltd
• located at Masese on the outskirts of East of Jinja town, 5km along Jinja- Tororo highway is equipped with some of the fine technologies in the recycling and manufacturing of steel products
• The company is equipped with a two twin 8-tons induction furnaces and is currently producing an average 30,000 metric tonnes of steel annually but has the capacity to produce over 50,000 Metric tonnes annually
• The company has established selling outlets in all major towns across the country to be able to meet the market its products as well as buy scrap metals from the locals
• The company’s scrap metal collection provides many rural and urban collectors and transporters countrywide with steady incomes.
Shumuk Aluminium Industries (U) Ltd
• located on Plot 24 Mukabya Road Kampala Uganda, manufacture aluminium utensils for kitchen use and aluminium dinnerware
• Shumuk company also buys aluminium scrap from rural and urban collectors • The company has a 4,200- metric-ton-per-year (t/yr) capacity but is only utilized to only 60% of its
capacity due to a low supply of aluminium scrap
H&H Ldt
• buys copper products • cable dismantling technique unclear (burning of cables to recover copper?)

e-Waste Assessment in Uganda – a situational analysis
24/35
Figure 16: Shumuk adverts for scrap purchase
5.3.8 Downstream vendors
It has been established that down stream vendors engage in the following activities:
• Resale of whole units – Reselling e-scrap that has been collected in any marketplace to small work-shops where various components are removed and assembled with those from earlier pieces, and as-sembled for re-sell.
• Refurbishing for reuse – Replacing some or all of the parts with the aim of improving the e-scrap to bring it to a workable condition. Equipment may is then resold.
• Dismantling into parts and subassemblies – Manually taking apart equipment into distinct compo-nents such as printed circuit boards with market value.
• Materials recovery – Manually taking apart equipment into materials such as plastics and metals, to be sold into secondary recycling markets.
• Material processing – Mechanically shredding or grinding equipment to capture plastics, metals, and/or glass which are also sold into secondary recycle markets.
• Copper components are sold to local welding practitioners.
5.3.9 Final Disposers
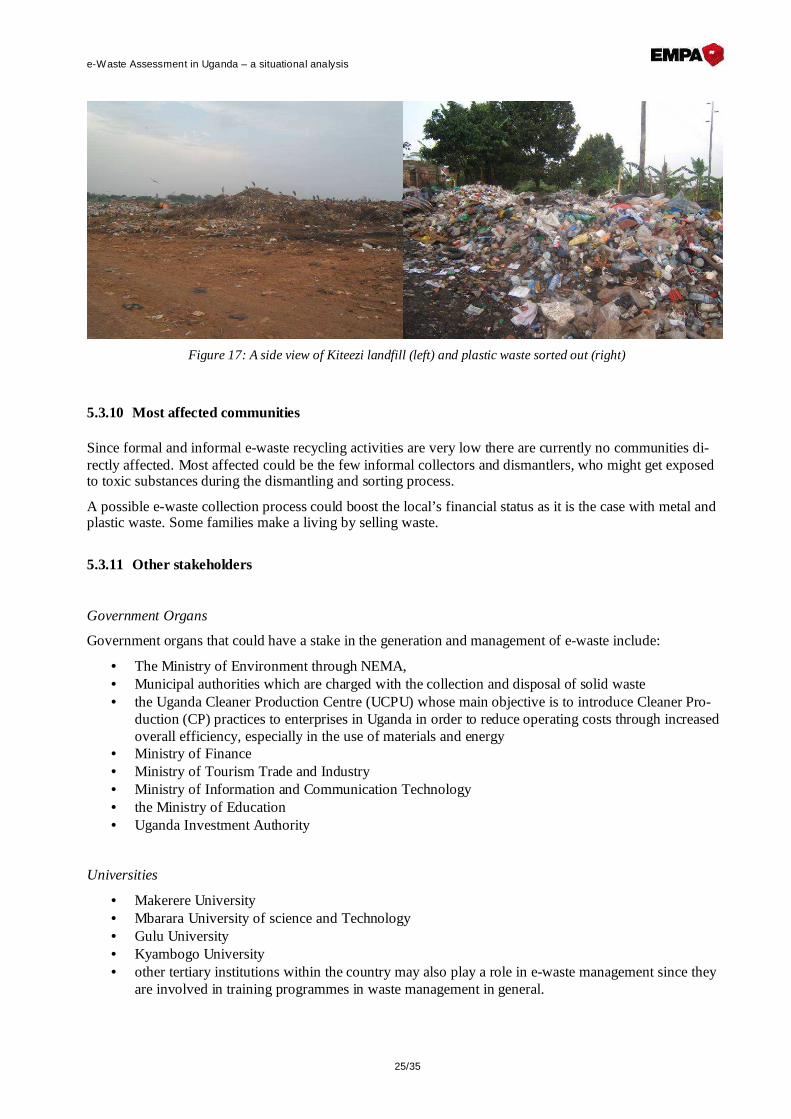
There are no disposal facilities in Uganda for Hazardous wastes. However, Kampala City Council (KCC) is responsible for the collection of all solid waste in Kampala, which is disposed of at Kiteezi landfill 8 km from the city centre. In other urban centres, the municipal councils have the responsibility to collect and dis-pose off all solid waste. The Kiteezi landfill is designated for non hazardous municipality waste and is oper-ated as a containment type of landfill. It has an on site system for cleaning leachates (remains of chemicals and minerals from garbage).
Although the landfill is not supposed to receive hazardous waste, the control measures are insufficient that this kind of waste such as plastic gets mixed up with ordinary waste and deposited there. Plastic companies employ people who sort out the plastic (Figure 17) and is then transported to their premises.
e-Waste Assessment in Uganda – a situational analysis
25/35
Figure 17: A side view of Kiteezi landfill (left) and plastic waste sorted out (right)
5.3.10 Most affected communities
Since formal and informal e-waste recycling activities are very low there are currently no communities di-rectly affected. Most affected could be the few informal collectors and dismantlers, who might get exposed to toxic substances during the dismantling and sorting process.
A possible e-waste collection process could boost the local’s financial status as it is the case with metal and plastic waste. Some families make a living by selling waste.
5.3.11 Other stakeholders
Government Organs
Government organs that could have a stake in the generation and management of e-waste include:
• The Ministry of Environment through NEMA, • Municipal authorities which are charged with the collection and disposal of solid waste • the Uganda Cleaner Production Centre (UCPU) whose main objective is to introduce Cleaner Pro-
duction (CP) practices to enterprises in Uganda in order to reduce operating costs through increased overall efficiency, especially in the use of materials and energy
• Ministry of Finance • Ministry of Tourism Trade and Industry • Ministry of Information and Communication Technology • the Ministry of Education • Uganda Investment Authority
Universities
• Makerere University • Mbarara University of science and Technology • Gulu University • Kyambogo University • other tertiary institutions within the country may also play a role in e-waste management since they
are involved in training programmes in waste management in general.

e-Waste Assessment in Uganda – a situational analysis
26/35
Relevant industry associations
• Uganda Manufactures Association whose objectives are to promote, protect and coordinate the inter-ests of industrialists in Uganda
• Uganda Small Scale Industries Association • Uganda Private Sector Foundation

e-Waste Assessment in Uganda – a situational analysis
27/35
6 Massflow Assessment
6.1 Massflow system chart
Figure 18 gives an overview of the different life cycle stages of a computer in Uganda. Main stages of the product are the import, the distribution via retailers and refurbishment centres and the consumption. Once the computer reaches its end-of-life (EOL) it might stay in storage at the consumer for some time(not shown in diagram), but eventually enters the waste stream. In the waste stream it either gets dumped informally or formally on dump and landfill sites or gets collected. In Uganda currently only informal collectors exist, who sort out plastics and metals and sell those fractions to existing plastic and metal recyclers. Remaining parts most probably are dumped or buried informally.
refurbishmentand distribution Consume Dispose
Waste
Importof new computers
Import of second-hand computers
Informal / formal
Refurbish-ment centres
Distributors / Retail
Government, educational org., NGOs
Businesses
Private households
& others
Informal collection & pre-sorting
Plastic & Metal
Recyclers
Informal recycling (copper
recovery)
Official landfill sites
Informal dumping
(e.g. burying)
Collect Material recovery
Product
Figure 18: Massflow diagram of computers in Uganda, current situation as of 2007
6.2 Current massflows
Current massflows were calculated for the year 2007. Table 11 summarizes the key data for the assessment as elaborated in chapter 5 “System Definition”.
Massflows are presented in Figure 19. 29,000 computers were imported in 2007, whereas 4,000 of them were imported as second-hand computers (see Figure 4 on page21). Reported second-hand imports by the two major formal refurbishment centres in Kampala (see Table 10 on page 28) match this number. However this suggests that the imports of informal refurbishment centres do not show up in the import records of the Customs Department.
It was assumed that the installed base of computers in use was 300,000 in 2007. As discussed in chapter 5.3.4 “Consumers” this number could also be lower around 200’000. However it gives a realistic order of magnitude. Most of the installed computers are with governmental, educational and non-governmental or-

e-Waste Assessment in Uganda – a situational analysis
28/35
ganizations (74.3%), followed by businesses (18.6%) and private households (7.1%). It is assumed that the amount of new and second-hand computers is equally distributed among these consumer types.
Based on statistical data from the World Bank for Uganda and a constant distribution of new and second-hand computers a scenario was calculated for the generation of computer waste. The scenario assumes a life span of second-hand computers of 5 years and 9 years for new computers. The life span of new computers is a result of two usage stages: first use of about 4 years as it was reported by several businesses and a second use phase of 5 years according to the life span of a second-hand computer. Figure 20 shows the development of generated end-of-life (EOL) appliances from 1995 – 2007. It can be seen that a total of 53,000 computers should have reached their EOL in 2007.
However the field study in Kampala revealed that only a minor fraction of these appliances appears at infor-mal collectors, plastic and metal recyclers and landfill sites. Roughly estimated only around a 1000 com-puters might be collected informally by individuals and another 1000 might be dumped either on official landfills or informally somewhere. It is thought that most of EOL equipment in Uganda simply stays in stor-age, even if it is not functioning anymore. This finding was confirmed orally by several consumers (e.g. schools). This means that until now most of the generated e-waste in Uganda has built up a stock. Assuming that only around 10% of EOL equipment currently reaches the waste stream the country might have up to 80,000 computer units in stock, which are not in use anymore. This equals to about 2,000 tons of computer waste (desktop unit and CRT screen) in total, which contains e.g. 80 tons of printed circuit boards and 400 tons of plastic. This numbers are hypothetical but represent a realistic order of magnitude.
Table 11: Key data for the massflow assessment of computers in Uganda in 2007 Indicator Unit Value Comments
Total installed base of personal computers 300,000 See Table 5 and Figure 10
- Thereof installed in government, educational institutions and NGOs
% 74.3 See Figure 8
- Thereof installed in businesses % 18.6 See Figure 8
- Thereof installed in private households (and others)
% 7.1 See Figure 8
Imported computers 29,000 See Figure 4
- thereof second-hand imports 4,000 See Figure 4
- Thereof new imports 25,000 See Figure 4
Life span of second-hand computers years 5 See chapter 5.3.6 “Refurbishers”
Life span of new computers years 9 Assuming a first usage phase of 4 years (businesses) and a second usage phase of 5 years (according to sec-ond-hand computers)
Waste generated out of refurbishment opera-tions
% 6 Estimated amount by SecondLife (Table 10)

e-Waste Assessment in Uganda – a situational analysis
29/35
refurbishmentand distribution
Consume Dispose
Waste
Importof new computers
Import of second-hand computers
Informal / formal
Refurbish-ment centres
Distributors / Retail
Government, educational org., NGOs
Businesses
Private households
& others
Informal collection & pre-sorting
Plastic & Metal
Recyclers
Informal recycling (copper
recovery)
Official landfill sites
Informal dumping
(e.g. burying)
Collect Material recovery
Product
25,000
4,0004,000
25,00022,000
5,000
2,00021,000
223,00039,000
in useEOL
56,00010,000
in useEOL
4,000in useEOL
consumer
x,xxxx,xxx
in useEOL
= installed base of computers= amount of computers which reached their end-of-life (EOL)
300,00053,000
in useEOL
250ca. 1000
ca. 1000
n.a.
n.a.
n.a.
n.a.
n.a.
n.a.
Figure 19: Estimated computer massflow in Uganda for 2007 (in amount of computer units)
0
50000
100000
150000
200000
250000
300000
350000
1995 1996 1997 1998 1999 2000 2001 2002 2003 2004 2005 2006 2007
Am
ou
nt
of
com
pu
ters
Installed computers originating from second-hand imports
Installed computers originating from new imports
amount of computers which reach their end-of-life
Total amount of installed computers
Figure 20: Scenario analysis of generated end-of-life computers based on a life-span of second-hand computers of 5 years and new computers of 9 years

e-Waste Assessment in Uganda – a situational analysis
30/35
7 Impacts
7.1 Social
Four sub-sectors have been considered decisive for a social impact analysis of e-waste management in Uganda. That is to say; Collection, Refurbishment, Material recovery mainly for recycling and final disposal.
• In general recyclable waste is viewed as a resource and income-generating opportunity. • Electronic-waste is mostly handled by the informal sector and provides jobs for people that have dif-
ficulty accessing formal employment by; o Collecting (and re-selling waste) o Practicing re-pairs both formally and informally o Recycling and o Disposal
• Working with the informal sector will boost employment opportunities. • Due to the fact that e-waste is currently handled informally, there is little regulation in place to safe-
guard the health of those who handle the equipment. • There is lack of awareness among consumers and collectors of the potential hazards to human health
and the environment of e-waste, crude ‘backyard’ recycling and other disposal practices. For exam-ple, workers handling plastic waste have no protective gear (see pictures in Figure 13, page 29)
• In an existing plastic recycling plant for example, employees are paid on a daily basis (at a rate of US $ 3.5 per day) depending on availability of activities.
• In some instances, waste collection centres are located in residential (and predominantly slum area) and provide breeding centres for malaria spreading mosquitoes
• In general terms, there are social benefits in e-waste products, as they make goods available to low- income people, raising standards of living. For example, an obsolete computer is bought at a cost ap-proximately US $ 20 by street vendors.
• Given that unregulated processing in Uganda generates income, there is a strong economic force driving the creation of an informal sector, which poses a challenge for enforcement of regulations.
7.2 Environment
Unlike other traditional solid waste in Uganda, the main environmental impacts of e-waste mainly arise due to inappropriate processing, rather than inherent toxic contents although drawing boundaries between secon-dary goods intended for reuse and waste materials may be a challenge.
• Presently the informal processing of e-waste in Uganda is not under any environmental monitoring and as a result, the crude methods used to reclaim materials from the e-waste are a potential for many kinds of pollutants being generated creating serious problems to ecological environment and human health.
• E-waste contains more than 1000 different substances, many of which are highly toxic. E-waste con-tains both valuable materials, such as gold and copper, as well as highly toxic substances, such as lead and mercury.
• The toxic substances such as lead may leach into ground water and in spring wells. In Kampala city, the majority of the population (87.66 %) has physical access to piped water or protected springs. However a recent water quality survey found most of the protected springs contaminated with heavy metals (Zn, Cr, Pb) and the source was traced to poor disposal methods of metallic waste, batteries, cells and waste from workshops.
• Polyaromatic hydrocarbons (PAHs), polychlorinated biphenyls (PCBs) and polybrominated biphenyl ethers (PBDEs) can also be generated through recycling plastics. The open burning of cables to re-cover copper produces highly toxic dioxin emissions, which are emitted to the ambient air.
• However, since the introduction of a modern system of environment management in Uganda in early 90s, there have been a lot of developments that have shaped the way the country manages the envi-

e-Waste Assessment in Uganda – a situational analysis
31/35
ronment. Key among these developments is the introduction of the requirement for Environmental Impact Assessment (EIA) for all development projects and activities that are likely to have signifi-cant impact on the environment, so that adverse impacts can be foreseen before they are imple-mented and ways and means identified to eliminate or minimize them, while the positive impacts could be maximized.
7.3 Economy
There are significant economic potentials if valuable materials in e- waste are recovered. The e-waste indus-try will provide income-generating opportunities for both individuals and enterprises, as waste is sold and traded among collectors, processors, second-hand dealers and consumers. For example:
• Plastic recycling Industry in Kampala exports are worth 8,000 Euros per month, has 23 permanent employees, over 20 causal workers and a countrywide network of collectors whose survival depends entirely on plastic waste collection
• The Steel Rolling Mills Company (which recycles steel products) provides employment to over 650 Ugandans and has trimmed the country’s imports of steel, saving the country US$ 25 million per year.
High investment costs and costs related to environmental compliance are economic disincentives to e-waste recycling within Uganda.
• Government financial priorities are at the moment, Universal education, primary health, agriculture and defence.
• National environment laws require a developer of any project to carry out an environmental impact assessment, establish possible impacts, and put in place measures to mitigate them. In addition, the developer is required to carry out a routine self monitoring process. All these processes are fully fi-nanced by the developer. For example:
o Steel Rolling Mills is in the process of acquiring a fully computerized spectrometer to rein-force the chemical laboratory as a means of carrying out self monitoring in addition to the routine chemical analyses in its operations. This will cost the company close to US $ 200,000
e-Waste Assessment in Uganda – a situational analysis
32/35
8 Conclusion
8.1 Strengths and Weaknesses of the Current Situation
Due to the relatively young development of Uganda in ICT equipment, until now, the country mainly was building up stocks of end-of-life computers, which are entering the waste stream only in small quantities. Thus currently the problem seems to be minor. However this investigation shows that up to 80,000 PCs which are not in use anymore might be in stock. Considering the recent development in ICT imports of new and second-hand equipment it is expected that considerably more e-waste will show up on the street in short time. Hence it is the right time for Uganda to engage in addressing the problem of increasing e-waste vol-umes. Waiting too long with actions bears the risk of a developing informal sector, with all its social and en-vironmental drawbacks.
Main strengths of the current situation:
• The national policy and legislation framework offers opportunities to include e-waste management. • The total amount of installed computers in Uganda is still very low, i.e. the problem of adverse im-
pacts of computer waste generation is currently low. • The problem of imported computer junk seems to be minor; most of imported second-hand com-
puters seem to be functioning. • Most computers in use are held with governmental, educational, and non-governmental organization,
which supports an easier control over generated e-waste. • Computers reaching their end-of-life are mostly stored by their owners and not dumped. • Experiences from informal collection systems exist from the recycling of plastics and could partly be
transferable to e-waste collection. • There is a recycling industry, which could absorb the plastic and ferrous metals and aluminium frac-
tions (Table 12).
Main weaknesses of the current system:
• There is no specific policy or legislation for e-waste management. • There is no special infrastructure available for the formal collection and recycling of e-waste. • The few informal activities associated with e-waste might lead to the exposure of individuals to haz-
ardous substances and local pollution of the environment. • Dumping of computer waste on official landfills, informal dump sites and burying might lead to an
increase of pollutants in spring water in their vicinity. • There is no infrastructure available for the disposal of the hazardous fraction from e-waste (Table
12). • Uganda is a land-locked country which complicates the export of problematic e-waste fractions,
which cannot be treated in the country. • There is a general lack of awareness among consumers and collectors of the potential hazards of e-
waste to human health and the environment.

e-Waste Assessment in Uganda – a situational analysis
33/35
Table 12: Recycling options in Uganda for different waste streams generated by a personal computer Material fraction Recycling and dis-
posal in Uganda Possible downstream partners
Comments
Plastic partially Plastic Recycling Indus-tries (U) Ltd
Needs investments for upgrading the local recyclers
Selling the fraction generates income
Ferrous metals yes Steel rolling mills Ltd Selling the fraction generates income
Aluminum yes Shumuk Aluminium In-dustries (U) Ltd
Selling the fraction generates income
Copper partially H&H Ltd. Cable dismantling technique unclear (possibility that cables are burned for copper recovery)
Selling the fraction generates income
Exporting bears the danger of stimulat-ing copper robbery
Printed wiring boards (PWB con-taining precious metals)
no Not available in Uganda, export to Europe or Asia.
Although PWB need to be transported to the next harbour it is expected that the sale of these fraction to a global re-finery can generate income
Finding a partner e.g. in Kenya could be an advantage.
CRT tubes (contain-ing lead, beryllium, phosphor, etc.)
no Needs a hazardous waste treatment facility (special incineration or controlled landfill) which is not available in Uganda.
Export to Europe
Metal smelters might be able to use CRT glass partially as a substitute for sand as a fluxing material. However the environmental impacts of such a solu-tion would have to be evaluated care-fully. A metal smelter might take the tubes for free. Otherwise the tubes need to be exported to specialized recycling companies e.g. in Europe, which is costly.
Hazardous fraction (PCB in capacitors, mercury in back-lights, batteries)
no Needs a hazardous waste treatment facility (special incineration or controlled landfill) which is not available in Uganda, Smaller capacitors and batteries can be left on the PWB when sold to inter-national smelters.
Export to Europe
Needs either investment into a local hazardous waste treatment facility or needs to be exported to specialized fa-cilities abroad (e.g. to Europe)
8.2 Recommendations for the UNIDO/Microsoft refurbishment initiative
Results of this study underline that the idea to address the e-waste problem within the UNIDO/Microsoft re-furbishment initiative was well anticipated. The initiative could play a pioneer role in Uganda in the respon-sible treatment of EOL computers. According to the results as summarized in Table 12 the manual disassem-bly of computer waste and further sales of the resulting material fractions can generate income for some of the fractions. Studies from China and South Africa suggest that the manual disassembly of a desktop com-puter (without screens) can generate net revenues around 1-1.5 US$. These results are based on theoretical scenarios and highly depend on the availability of local recycling and disposal infrastructure as well as the ability to export specific fractions. However the correct disposal of the problematic fractions (especially CRT

e-Waste Assessment in Uganda – a situational analysis
34/35
screens and batteries) will cost money. E.g. in South Africa the sustainable disposal of CRT screens (involv-ing the export of the leaded glass) was calculated to be around 1-2 US$ per item. It is expected that the sus-tainable recycling of computer waste in Uganda cannot be paid by the intrinsic value of the computer unit’s material content.
Based on this study it is recommended to develop a business case for a material recovery facility (MRF) as-sociated with the UNIDO/Microsoft refurbishment initiative. The associated cost analysis should especially focus on revenues through the sale of material fractions, investment costs for infrastructure and equipment, labour costs, transport costs and disposal costs. The business case should also quantify the job creation po-tential. It is suggested to assess the following information:
• Up-stream partners: on one-hand side a refurbishment centre alone will only generate low volumes of e-waste. On the other hand-side there is an increasing demand for a MRF for e-waste in Uganda and currently stored EOL appliances most probably offer a steep start (large enough volumes) for operations. It is recommended that this analysis should include in a first stage governmental, educa-tional and non-governmental organizations and big businesses in Kampala. Private households pos-sess only a small portion of the installed computer base in Uganda and are usually harder to reach via a collection system. E-waste generated in other parts of the country could be included once a MRF is running in Kampala either through a centralized system in Kampala or a decentralized sys-tem including other pre-processing facilities.
• Opportunities for a suitable collection system: The currently informal collection activities and estab-lished collection strategies by the plastic recyclers should be considered. However, when first aiming at the large e-waste generators (e.g. government), this might be a second priority.
• Downstream partners in Uganda: Based on the stakeholder analysis (especially the plastic and metal recyclers) possible recycling partners for different material fractions should be assessed in more de-tail.
• Down-stream partners in neighbouring countries and overseas: Especially problematic fractions, such as CRT tubes, PCB containing capacitors, etc. might need a disposal solution abroad. But also valuable fractions such a printed circuit boards yield better revenues when sold directly to a global professionalized smelter (Boliden/Sweden, Umicore/Belgium, etc.)
• Strategies to pay for the non-viable part of e-waste recycling: As outlined above it is expected that the sustainable recycling of computer waste in Uganda cannot be paid by the intrinsic value of the computer unit’s material content. The UNIDO/Microsoft refurbishment initiative will need to have a strategy to cover recycling and disposal costs.
• Opportunities for other e-waste categories to be included: this study only focuses on personal com-puters and partly on printers. However other electrical and electronic equipment might be easily in-cluded in a MRF (especially other ICT equipment and consumer electronics)
It is also recommended that the UNIDO/Microsoft initiative pro-actively gets involved in a national stake-holder process, which could drive national policy and legislation and initiatives from the private (ICT) sector (corporate social responsibility programmes, take back programmes by large global manufacturers, etc.)

e-Waste Assessment in Uganda – a situational analysis
35/35
9 References
NEMA (2007). Uganda State of Environment Report 2006/2007, National Environment Management Au-thority. SWICO Recycling Guarantee (2007). Activity Report 2006. Zurich, Switzerland, Swiss Association for In-formation, Communications and Organization Technology (SWICO). The Parliament of Uganda (2006). Report of the Sessional Committee on Information and Communication Technology on the Ministerial Policy Statement and Budget Estimates for the Ministry of Information and Communication Technology for the Financial Year 2006/2007, August 2006. C. o. I. a. C. Technology. Tusuburia, F. and I. Kaggwa (2005). E-usage Uganda Report, draft final of 1 April 2005 (supersedes drafts 1 to 4). Uganda Bureau of Statistics (2002). Uganda 2002 population and housing census. Kampala, Uganda. URA (2008). Computer import records. Kampala, Uganda, Customs & Excise Department, Uganda Revenue Authority. World Bank (2007). World Development Indicators. Washington DC, USA, International Bank for Recon-struction and Development.