Embed Size (px)
Citation preview
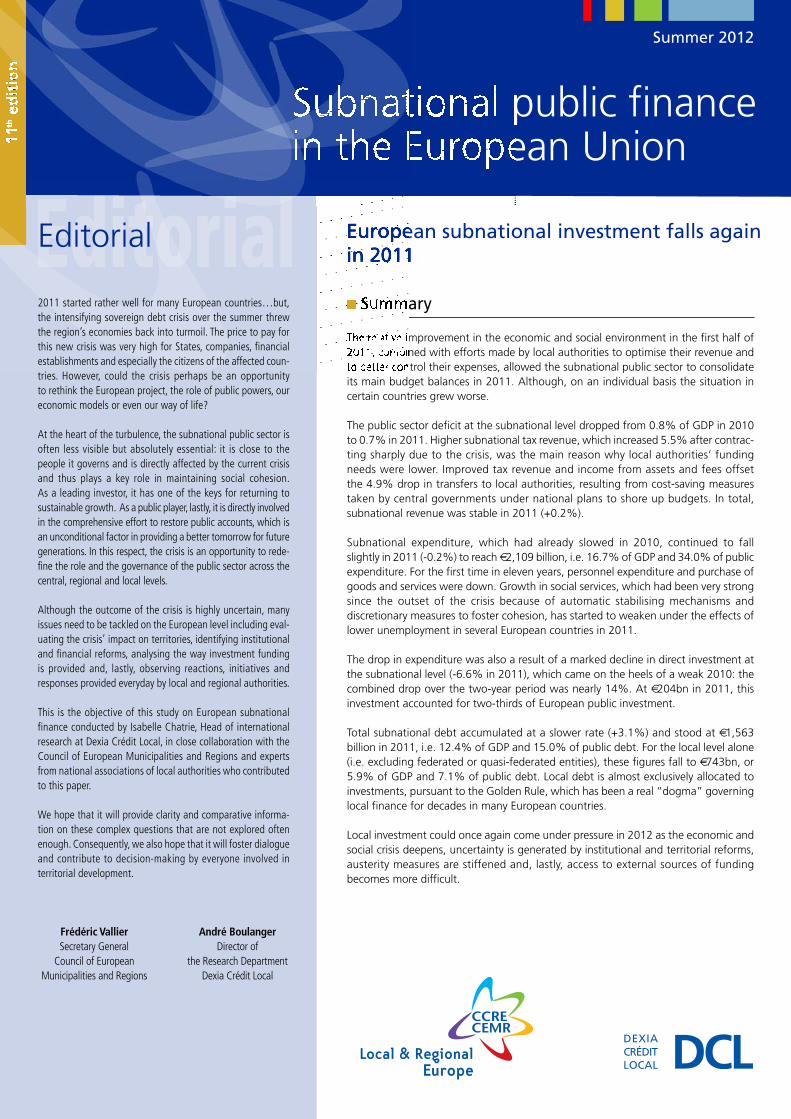
Editorial European subnational investment falls againin 2011
Summer 2012
Summary
The relative improvement in the economic and social environment in the first half of2011, combined with efforts made by local authorities to optimise their revenue andto better control their expenses, allowed the subnational public sector to consolidateits main budget balances in 2011. Although, on an individual basis the situation incertain countries grew worse.
The public sector deficit at the subnational level dropped from 0.8% of GDP in 2010to 0.7% in 2011. Higher subnational tax revenue, which increased 5.5% after contrac-ting sharply due to the crisis, was the main reason why local authorities’ funding needs were lower. Improved tax revenue and income from assets and fees offset the 4.9% drop in transfers to local authorities, resulting from cost-saving measurestaken by central governments under national plans to shore up budgets. In total, subnational revenue was stable in 2011 (+0.2%).
Subnational expenditure, which had already slowed in 2010, continued to fall slightly in 2011 (-0.2%) to reach €2,109 billion, i.e. 16.7% of GDP and 34.0% of public expenditure. For the first time in eleven years, personnel expenditure and purchase ofgoods and services were down. Growth in social services, which had been very strongsince the outset of the crisis because of automatic stabilising mechanisms and discretionary measures to foster cohesion, has started to weaken under the effects oflower unemployment in several European countries in 2011.
The drop in expenditure was also a result of a marked decline in direct investment atthe subnational level (-6.6% in 2011), which came on the heels of a weak 2010: thecombined drop over the two-year period was nearly 14%. At €204bn in 2011, thisinvestment accounted for two-thirds of European public investment.
Total subnational debt accumulated at a slower rate (+3.1%) and stood at €1,563 billion in 2011, i.e. 12.4% of GDP and 15.0% of public debt. For the local level alone(i.e. excluding federated or quasi-federated entities), these figures fall to €743bn, or5.9% of GDP and 7.1% of public debt. Local debt is almost exclusively allocated toinvestments, pursuant to the Golden Rule, which has been a real “dogma” governinglocal finance for decades in many European countries.
Local investment could once again come under pressure in 2012 as the economic andsocial crisis deepens, uncertainty is generated by institutional and territorial reforms,austerity measures are stiffened and, lastly, access to external sources of fundingbecomes more difficult.
11thedition
Subnational public finance in the European Union
Editorial
2011 started rather well for many European countries…but,the intensifying sovereign debt crisis over the summer threwthe region’s economies back into turmoil. The price to pay forthis new crisis was very high for States, companies, financialestablishments and especially the citizens of the affected coun-tries. However, could the crisis perhaps be an opportunity to rethink the European project, the role of public powers, oureconomic models or even our way of life?
At the heart of the turbulence, the subnational public sector isoften less visible but absolutely essential: it is close to the people it governs and is directly affected by the current crisisand thus plays a key role in maintaining social cohesion. As a leading investor, it has one of the keys for returning to sustainable growth. As a public player, lastly, it is directly involvedin the comprehensive effort to restore public accounts, which isan unconditional factor in providing a better tomorrow for futuregenerations. In this respect, the crisis is an opportunity to rede-fine the role and the governance of the public sector across thecentral, regional and local levels.
Although the outcome of the crisis is highly uncertain, manyissues need to be tackled on the European level including eval-uating the crisis’ impact on territories, identifying institutionaland financial reforms, analysing the way investment funding is provided and, lastly, observing reactions, initiatives andresponses provided everyday by local and regional authorities.
This is the objective of this study on European subnationalfinance conducted by Isabelle Chatrie, Head of internationalresearch at Dexia Crédit Local, in close collaboration with theCouncil of European Municipalities and Regions and expertsfrom national associations of local authorities who contributedto this paper.
We hope that it will provide clarity and comparative informa-tion on these complex questions that are not explored oftenenough. Consequently, we also hope that it will foster dialogueand contribute to decision-making by everyone involved in territorial development.
Frédéric Vallier André BoulangerSecretary General Director of
Council of European the Research DepartmentMunicipalities and Regions Dexia Crédit Local
Subnational public finance in the European Union | Dexia - CEMR | Summer 2012
2 Methodology
Methodology
2009 reform of the financing system of Autonomous Communities,
which has been fully operational since 2011, it was decided to no
longer proceed with this restatement and keep data from the
Autonomous Communities within the Federated States sector by
considering them quasi-federated entities (S1312).
Key indicators
Public expenditure by category: current expenditure (intermediateconsumption, personnel, social spending, subsidies and other current
transfers, interest charges, taxes) and capital expenditure (direct capital
expenditure and capital transfers, excluding capital payments on
borrowings).
Direct investment expenditure: gross fixed-capital formation (P51)and acquisitions less non-financial assets (land and other non-financial
non-produced assets).
Indirect investment expenditure: capital transfers.Expenditure by economic function: according to the ten areas defined in the Classification of the Functions of Government (COFOG).
Tax revenue: taxes on production and imports (D2), current taxes onincome and wealth (D5) and capital taxes (D91). Note: they include both
own-source and shared tax revenues.
Non-tax revenues: in opposition, all other revenues: tariffs and fees,property income, current and capital grants, social contributions
Budget balance: deficit/surplus is defined as the net lending/net borrowing as laid out in the Protocol to the Maastricht Treaty (B9A)
restated for interest on debt swaps. It measures the difference
between all expenditure and revenue.
Public debt: gross debt as defined in the Protocol to the Maastricht
Treaty (i.e. the financial assets of the public administrations are not
deducted). The definition does not include all financial liabilities:
derivative financial products, accrued interest as well as other payable
accounts are excluded. It is consolidated in nominal value at the end
of the year.
Currencies
Data was extracted directly in euros. For countries outside of the euro
area, an annual average exchange rate was used for all indicators, except
public debt for which the exchange rate at 31 December was used.
Changes
Annual and multi-year changes are all calculated, except otherwise
indicated, in constant euros (in volume terms) so as to not take into
account inflation measured in terms of the GDP deflator (2000 =
100). Changes between 2000 and 2011 are average annual changes
in volume.
Data
The primary source of data used in this study was Eurostat, the
statistical office of the European Union, which centralises and processes
data from national public sources (national statistics institutes, central
banks, ministries, etc.).
Data was extracted on 2 May 2012 covering all 27 Member States
of the European Union. This data remains provisional and will be
updated at the end of October 2012 by Eurostat.
The classification of data is based on the European System of Accounts
(ESA 95), the standard methodology used by Member States of the
European Union.
Several restatements were made for this analysis, including:
• United Kingdom: restatement of public investment expenditurefor 2005 in order to neutralise an exceptional measure that affected
the central administration that year.
• France: 2010 local public sector tax revenues and grants wererestated in order to incorporate the initial effects of the abolition
of the professional tax: the temporary compensation paid by the State
for 2010 was re-assigned to tax revenues pending the allocation of
new tax revenues to local authorities in 2011.
The data covers the period 2000-2011. 2011 data are provisional.
Analysis scope
Public sector: classified as S13 under ESA 95, it comprises four sub-sectors:
• S1311: central administrations; • S1312: federated States (Germany, Austria and Belgium) and quasi-federated (Spanish Autonomous Communities) and related public
entities;
• S1313: local authorities and related local public entities (see "localpublic sector" below);
• S1314: social security funds. S13 data is consolidated (neutralisation of financial cross-flows) as
well as those of each subsector between their different components.
However, data is not consolidated between subsectors (i.e. the sum
of the subsectors "S1311 + S1312 + S1313 + S1314" is greater
than "S13").
Subnational public sector: includes the two sub-sectors S1312 andS1313. The data is not consolidated between the two sub-sectors.
Local public sector: classified S1313 by the ESA 95, it comprises localauthorities with general competencies (local and regional governments)
and bodies with more specialised competencies (responsibilities vary
from one country to the next). As mentioned above, data within the
local public sector is consolidated.
Note: in previous versions of this analysis, Dexia Crédit Local restatedthe accounts of the Spanish Autonomous Communities by reintegra-
ting them in the local public sector (S1313) given that Spain remains aunitary State (Eurostat considers them federated entities). Following the
Table of contentsMacro-economic environment and public finances (p. 3)
Territorial organisation and reforms (p. 6)
Revenue and taxation (p. 12)
Expenditure and investment (p. 19)
Budget balance and debt (p. 29)
2011 provisional data
Subnational public finance in the European Union | Dexia - CEMR | Summer 2012
3Macro-economic environment and public finances
Macro-economic environment and public finances
Renewed deterioration of the economy at theend of 2011 after a slight improvement in 2010
The improvement in the economic situation, which was alreadyweak in 2010 (+2.0% increase in GDP in volume terms) and during
the first half of 2011 in the EU, will not have lasted very long. In fact,
growth began to deteriorate once again in the summer of 2011 due
to effects, notably, from the sovereign debt crisis, crumbling
investor and consumer confidence, fiscal austerity measures, which
weighed on domestic demand, and, lastly, the slowdown in global
growth, which limited exports.
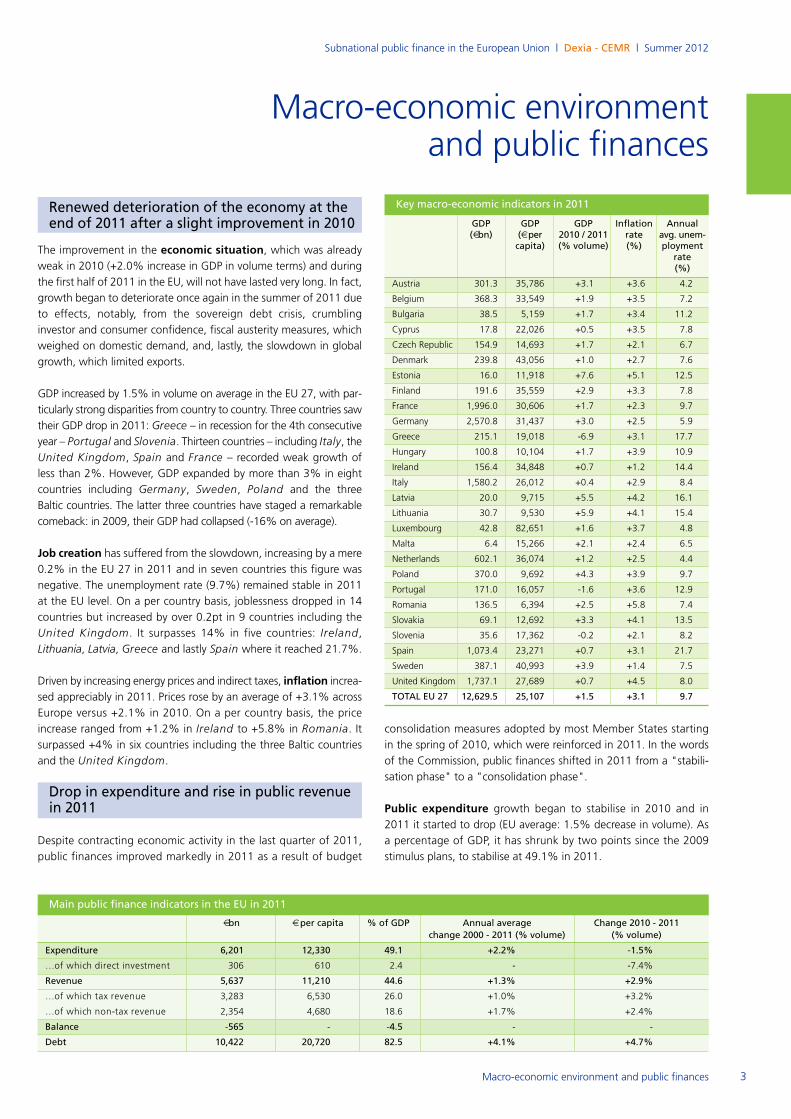
GDP increased by 1.5% in volume on average in the EU 27, with par-
ticularly strong disparities from country to country. Three countries saw
their GDP drop in 2011: Greece – in recession for the 4th consecutiveyear – Portugal and Slovenia. Thirteen countries – including Italy, theUnited Kingdom, Spain and France – recorded weak growth of
less than 2%. However, GDP expanded by more than 3% in eight
countries including Germany, Sweden, Poland and the three
Baltic countries. The latter three countries have staged a remarkable
comeback: in 2009, their GDP had collapsed (-16% on average).
Job creation has suffered from the slowdown, increasing by a mere0.2% in the EU 27 in 2011 and in seven countries this figure was
negative. The unemployment rate (9.7%) remained stable in 2011
at the EU level. On a per country basis, joblessness dropped in 14
countries but increased by over 0.2pt in 9 countries including the
United Kingdom. It surpasses 14% in five countries: Ireland,Lithuania, Latvia, Greece and lastly Spain where it reached 21.7%.
Driven by increasing energy prices and indirect taxes, inflation increa-sed appreciably in 2011. Prices rose by an average of +3.1% across
Europe versus +2.1% in 2010. On a per country basis, the price
increase ranged from +1.2% in Ireland to +5.8% in Romania. It surpassed +4% in six countries including the three Baltic countries
and the United Kingdom.
Drop in expenditure and rise in public revenuein 2011
Despite contracting economic activity in the last quarter of 2011,
public finances improved markedly in 2011 as a result of budget
consolidation measures adopted by most Member States starting
in the spring of 2010, which were reinforced in 2011. In the words
of the Commission, public finances shifted in 2011 from a "stabili-
sation phase" to a "consolidation phase".
Public expenditure growth began to stabilise in 2010 and in
2011 it started to drop (EU average: 1.5% decrease in volume). As
a percentage of GDP, it has shrunk by two points since the 2009
stimulus plans, to stabilise at 49.1% in 2011.
Main public finance indicators in the EU in 2011
€bn € per capita % of GDP Annual average Change 2010 - 2011 change 2000 - 2011 (% volume) (% volume)
Expenditure 6,201 12,330 49.1 +2.2% -1.5%
…of which direct investment 306 610 2.4 - -7.4%
Revenue 5,637 11,210 44.6 +1.3% +2.9%
…of which tax revenue 3,283 6,530 26.0 +1.0% +3.2%
…of which non-tax revenue 2,354 4,680 18.6 +1.7% +2.4%
Balance -565 - -4.5 - -
Debt 10,422 20,720 82.5 +4.1% +4.7%
Key macro-economic indicators in 2011
GDP GDP GDP Inflation Annual(€bn) (€ per 2010 / 2011 rate avg. unem-
capita) (% volume) (%) ploymentrate(%)
Austria 301.3 35,786 +3.1 +3.6 4.2
Belgium 368.3 33,549 +1.9 +3.5 7.2
Bulgaria 38.5 5,159 +1.7 +3.4 11.2
Cyprus 17.8 22,026 +0.5 +3.5 7.8
Czech Republic 154.9 14,693 +1.7 +2.1 6.7
Denmark 239.8 43,056 +1.0 +2.7 7.6
Estonia 16.0 11,918 +7.6 +5.1 12.5
Finland 191.6 35,559 +2.9 +3.3 7.8
France 1,996.0 30,606 +1.7 +2.3 9.7
Germany 2,570.8 31,437 +3.0 +2.5 5.9
Greece 215.1 19,018 -6.9 +3.1 17.7
Hungary 100.8 10,104 +1.7 +3.9 10.9
Ireland 156.4 34,848 +0.7 +1.2 14.4
Italy 1,580.2 26,012 +0.4 +2.9 8.4
Latvia 20.0 9,715 +5.5 +4.2 16.1
Lithuania 30.7 9,530 +5.9 +4.1 15.4
Luxembourg 42.8 82,651 +1.6 +3.7 4.8
Malta 6.4 15,266 +2.1 +2.4 6.5
Netherlands 602.1 36,074 +1.2 +2.5 4.4
Poland 370.0 9,692 +4.3 +3.9 9.7
Portugal 171.0 16,057 -1.6 +3.6 12.9
Romania 136.5 6,394 +2.5 +5.8 7.4
Slovakia 69.1 12,692 +3.3 +4.1 13.5
Slovenia 35.6 17,362 -0.2 +2.1 8.2
Spain 1,073.4 23,271 +0.7 +3.1 21.7
Sweden 387.1 40,993 +3.9 +1.4 7.5
United Kingdom 1,737.1 27,689 +0.7 +4.5 8.0
TOTAL EU 27 12,629.5 25,107 +1.5 +3.1 9.7
Subnational public finance in the European Union | Dexia - CEMR | Summer 2012
4 Macro-economic environment and public finances
In particular, direct investment (-7.4%) plummeted, which was
the second consecutive year it had done so. As a percentage of GDP,
it fell from 2.9% to 2.4% between 2010 and 2011.
Public revenue, which was very depressed in 2009 (-5.4%), confir-
med the turnaround that began in 2010 recording a 2.9% increase
in 2011. Specifically, tax revenue, which had imploded under the
effects of the economic and social crisis (-8.4% in 2009), increased
in 2010 and especially in 2011 (+3.2%). These good revenue figures
resulted from a slight improvement in the economic picture as well
as tax measures included in austerity plans.
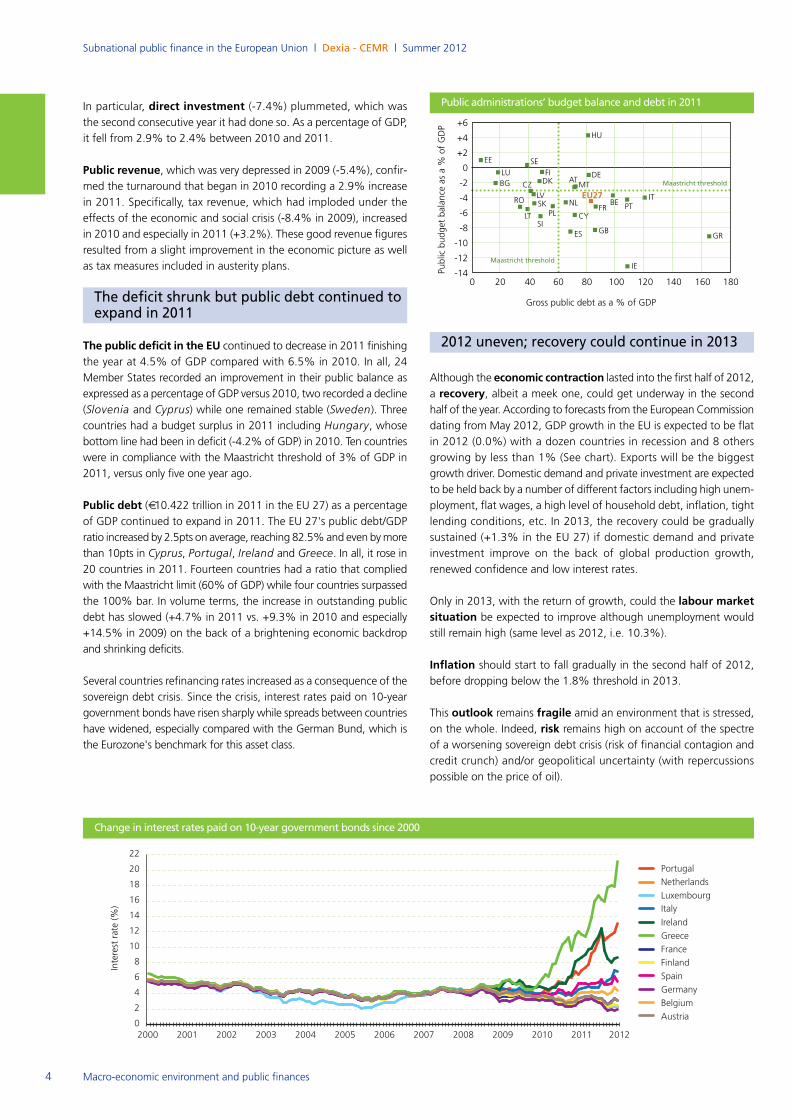
The deficit shrunk but public debt continued toexpand in 2011
The public deficit in the EU continued to decrease in 2011 finishing
the year at 4.5% of GDP compared with 6.5% in 2010. In all, 24
Member States recorded an improvement in their public balance as
expressed as a percentage of GDP versus 2010, two recorded a decline
(Slovenia and Cyprus) while one remained stable (Sweden). Threecountries had a budget surplus in 2011 including Hungary, whosebottom line had been in deficit (-4.2% of GDP) in 2010. Ten countries
were in compliance with the Maastricht threshold of 3% of GDP in
2011, versus only five one year ago.
Public debt (€10.422 trillion in 2011 in the EU 27) as a percentageof GDP continued to expand in 2011. The EU 27's public debt/GDP
ratio increased by 2.5pts on average, reaching 82.5% and even by more
than 10pts in Cyprus, Portugal, Ireland and Greece. In all, it rose in20 countries in 2011. Fourteen countries had a ratio that complied
with the Maastricht limit (60% of GDP) while four countries surpassed
the 100% bar. In volume terms, the increase in outstanding public
debt has slowed (+4.7% in 2011 vs. +9.3% in 2010 and especially
+14.5% in 2009) on the back of a brightening economic backdrop
and shrinking deficits.
Several countries refinancing rates increased as a consequence of the
sovereign debt crisis. Since the crisis, interest rates paid on 10-year
government bonds have risen sharply while spreads between countries
have widened, especially compared with the German Bund, which is
the Eurozone's benchmark for this asset class.
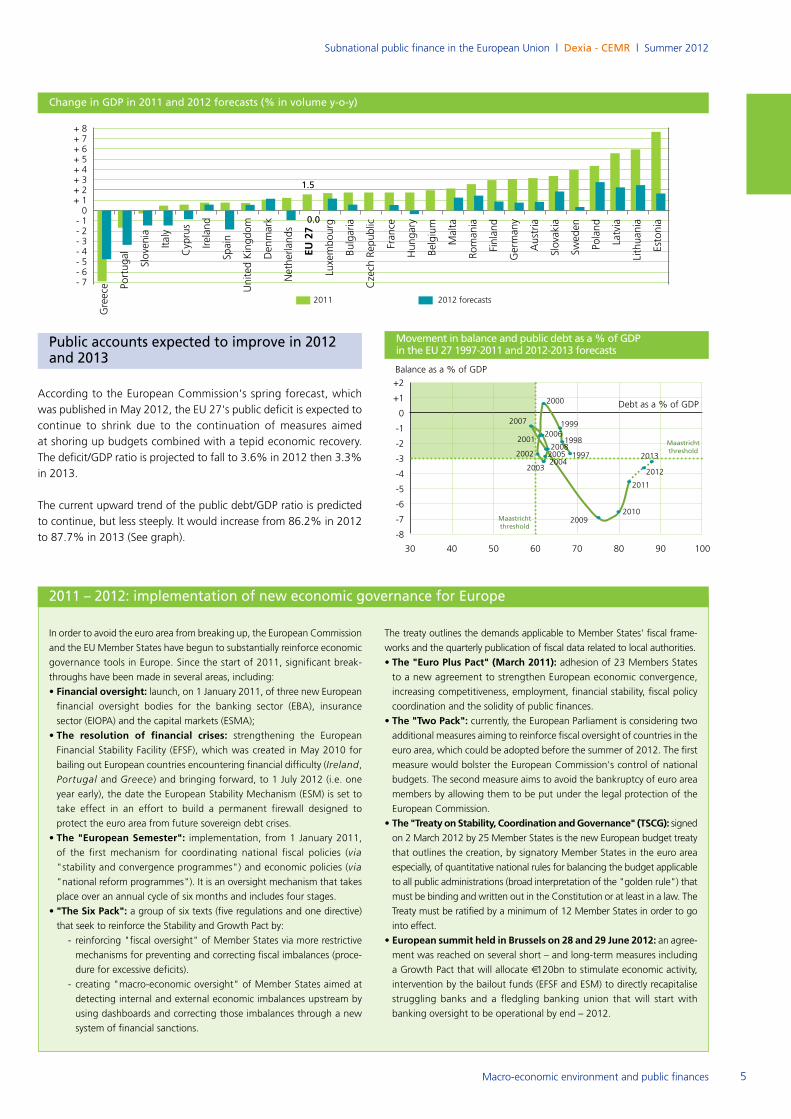
2012 uneven; recovery could continue in 2013
Although the economic contraction lasted into the first half of 2012,a recovery, albeit a meek one, could get underway in the secondhalf of the year. According to forecasts from the European Commission
dating from May 2012, GDP growth in the EU is expected to be flat
in 2012 (0.0%) with a dozen countries in recession and 8 others
growing by less than 1% (See chart). Exports will be the biggest
growth driver. Domestic demand and private investment are expected
to be held back by a number of different factors including high unem-
ployment, flat wages, a high level of household debt, inflation, tight
lending conditions, etc. In 2013, the recovery could be gradually
sustained (+1.3% in the EU 27) if domestic demand and private
investment improve on the back of global production growth,
renewed confidence and low interest rates.
Only in 2013, with the return of growth, could the labour marketsituation be expected to improve although unemployment would
still remain high (same level as 2012, i.e. 10.3%).
Inflation should start to fall gradually in the second half of 2012,
before dropping below the 1.8% threshold in 2013.
This outlook remains fragile amid an environment that is stressed,on the whole. Indeed, risk remains high on account of the spectreof a worsening sovereign debt crisis (risk of financial contagion and
credit crunch) and/or geopolitical uncertainty (with repercussions
possible on the price of oil).
Public administrations’ budget balance and debt in 2011
0
2
4
6
8
10
12
14
16
18
20
22
Portugal
Netherlands
Luxembourg
Italy
Ireland
Greece
France
Finland
Spain
Germany
Belgium
Austria
2011 20122000 2001 2002 2003 2004 2005 2006 2007 2008 2009 2010
Change in interest rates paid on 10-year government bonds since 2000
0 20 40 60 80 100 120 140 160 180
+6
+4
+2
0
-2
-4
-6
-8
-10
-12
-14Public budget balance as a %
of GDP
Gross public debt as a % of GDP
GR
IE
ES
CY
ITNL
MTDE
LT
ROLV
CZ DKFI
SE
BGLU
EE
HU
EU27
AT
BE PTFR
GBSI
PLSK
Maastricht threshold
Maastricht threshold
Interest rate (%
)
Subnational public finance in the European Union | Dexia - CEMR | Summer 2012
5
Public accounts expected to improve in 2012and 2013
According to the European Commission's spring forecast, which
was published in May 2012, the EU 27's public deficit is expected to
continue to shrink due to the continuation of measures aimed
at shoring up budgets combined with a tepid economic recovery.
The deficit/GDP ratio is projected to fall to 3.6% in 2012 then 3.3%
in 2013.
The current upward trend of the public debt/GDP ratio is predicted
to continue, but less steeply. It would increase from 86.2% in 2012
to 87.7% in 2013 (See graph).
In order to avoid the euro area from breaking up, the European Commission
and the EU Member States have begun to substantially reinforce economic
governance tools in Europe. Since the start of 2011, significant break-
throughs have been made in several areas, including:
• Financial oversight: launch, on 1 January 2011, of three new Europeanfinancial oversight bodies for the banking sector (EBA), insurance
sector (EIOPA) and the capital markets (ESMA);
• The resolution of financial crises: strengthening the EuropeanFinancial Stability Facility (EFSF), which was created in May 2010 for
bailing out European countries encountering financial difficulty (Ireland,
Portugal and Greece) and bringing forward, to 1 July 2012 (i.e. one
year early), the date the European Stability Mechanism (ESM) is set to
take effect in an effort to build a permanent firewall designed to
protect the euro area from future sovereign debt crises.
• The "European Semester": implementation, from 1 January 2011,
of the first mechanism for coordinating national fiscal policies (via
"stability and convergence programmes") and economic policies (via
"national reform programmes"). It is an oversight mechanism that takes
place over an annual cycle of six months and includes four stages.
• "The Six Pack": a group of six texts (five regulations and one directive)that seek to reinforce the Stability and Growth Pact by:
- reinforcing "fiscal oversight" of Member States via more restrictive
mechanisms for preventing and correcting fiscal imbalances (proce-
dure for excessive deficits).
- creating "macro-economic oversight" of Member States aimed at
detecting internal and external economic imbalances upstream by
using dashboards and correcting those imbalances through a new
system of financial sanctions.
2011 – 2012: implementation of new economic governance for Europe
The treaty outlines the demands applicable to Member States' fiscal frame-
works and the quarterly publication of fiscal data related to local authorities.
• The "Euro Plus Pact" (March 2011): adhesion of 23 Members States
to a new agreement to strengthen European economic convergence,
increasing competitiveness, employment, financial stability, fiscal policy
coordination and the solidity of public finances.
• The "Two Pack": currently, the European Parliament is considering twoadditional measures aiming to reinforce fiscal oversight of countries in the
euro area, which could be adopted before the summer of 2012. The first
measure would bolster the European Commission's control of national
budgets. The second measure aims to avoid the bankruptcy of euro area
members by allowing them to be put under the legal protection of the
European Commission.
• The "Treaty on Stability, Coordination and Governance" (TSCG): signedon 2 March 2012 by 25 Member States is the new European budget treaty
that outlines the creation, by signatory Member States in the euro area
especially, of quantitative national rules for balancing the budget applicable
to all public administrations (broad interpretation of the "golden rule") that
must be binding and written out in the Constitution or at least in a law. The
Treaty must be ratified by a minimum of 12 Member States in order to go
into effect.
• European summit held in Brussels on 28 and 29 June 2012: an agree-ment was reached on several short – and long-term measures including
a Growth Pact that will allocate €120bn to stimulate economic activity,intervention by the bailout funds (EFSF and ESM) to directly recapitalise
struggling banks and a fledgling banking union that will start with
banking oversight to be operational by end – 2012.
Change in GDP in 2011 and 2012 forecasts (% in volume y-o-y)
+ 8+ 7+ 6+ 5+ 4+ 3+ 2+ 10
- 1- 2- 3- 4- 5- 6- 7
Greece
Romania
Ireland
Latvia
Spain
Bulgaria
Cyprus
Hungary
Slovenia
United Kingdom
Italy
Lithuania
Portugal
France
Netherlands
EU 27
Austria
Denmark
Belgium
Czech Republic
Estonia
Finland
Luxembourg
Germany
Malta
Poland
Slovakia
Sweden
Macro-economic environment and public finances
1.5
0.0
30 40 50 60 70 80 90 100
+2
+1
0
-1
-2
-3
-4
-5
-6
-7
-8
Debt as a % of GDP
Movement in balance and public debt as a % of GDP in the EU 27 1997-2011 and 2012-2013 forecasts
Balance as a % of GDP
2012
2011
20102009
2002
2001
2007
2000
1998
19992006
20082005
2011 2012 forecasts
Maastrichtthreshold
2003
20132004
1997
Maastrichtthreshold
Subnational public finance in the European Union | Dexia - CEMR | Summer 2012
6
Territorial organisation and reforms
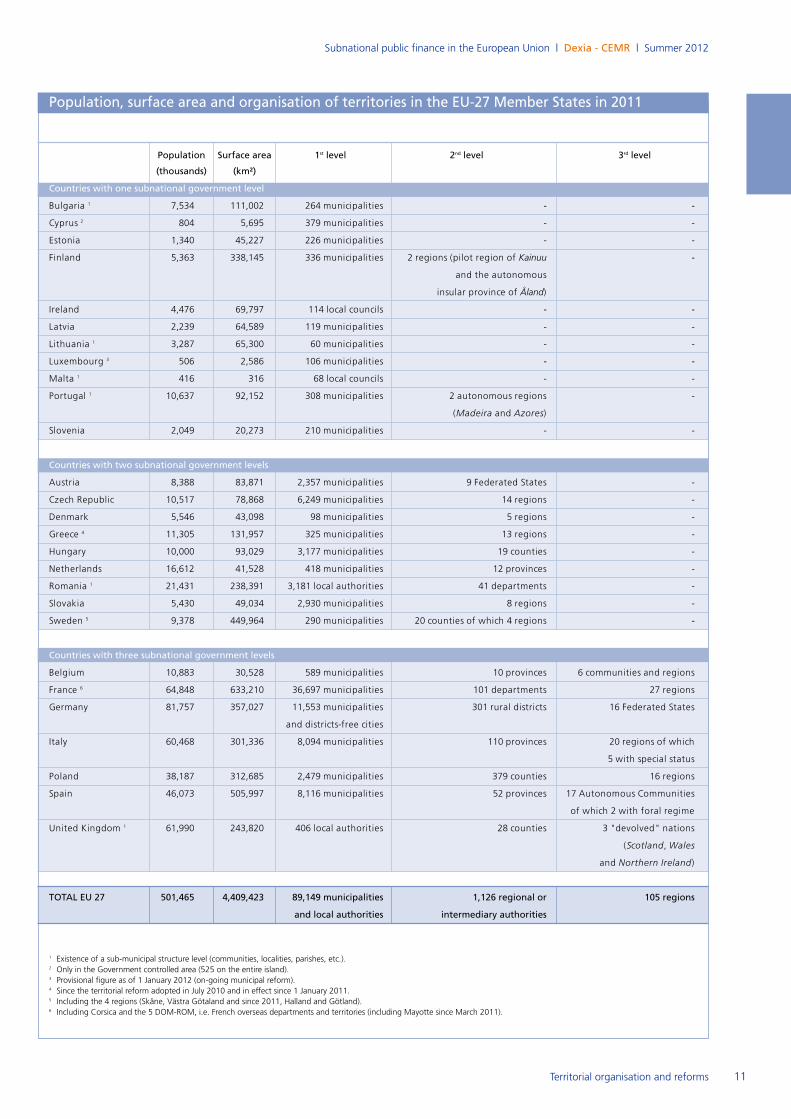
In 2011, there were nearly 90,400 local andregional governments in the EU
The European Union is comprised of 27 Member States, including three
with a federal structure (Germany, Austria, Belgium), a quasi-federal
State (Spain), and 23 unitary States. Despite their unitary structure, someof these latter States have a heterogeneous territorial organisation.
As such, Portugal, United Kingdom and Finland include regions on
only a part of the national territory (autonomous regions of Madeiraand Azores, the "devolved" nations Scotland, Wales and Northern Ireland, Kainuu and the autonomous island province of Åland). Asa "regionalised" unitary State with regions that have "ordinary" as well
as "special" status, Italy has a special place in the European landscape.
Eleven countries have just one level of subnational authorities, i.e.
municipalities; nine others have two levels (municipalities and regions)
while the remaining seven, which are some of the biggest countries
in the EU, have three levels: municipalities, regions and intermediary
entities (i.e. departments, provinces, counties, etc.).
In 2011, there were a total of 90,380 subnational governmentsin the EU 27 (See table), including 89,149 municipalities, 981 inter-mediary entities (departments, provinces, etc.) and 250 "regions"
belonging to the 2nd or 3rd level. Among these regions, there were
31 federated and quasi-federated entities: the 16 Länder in Germany,the nine Austrian provinces, the six regions and communities in
Belgium and 17 Autonomous Communities in Spain.
The economic crisis was an opportunity to step up the movement
toward reorganising territories and to rationalise and pool resourcesin an effort to increase the efficiency of local public action.
Institutional organisation of power has also changed considera-bly in the last few years in Europe, with sometimes discrete federali-
sation, decentralisation or recentralisation processes unfolding, which
in some cases led to reducing the autonomy of local authorities and
their financial capacities. These territorial and institutional changes
affected subnational authorities at all levels.
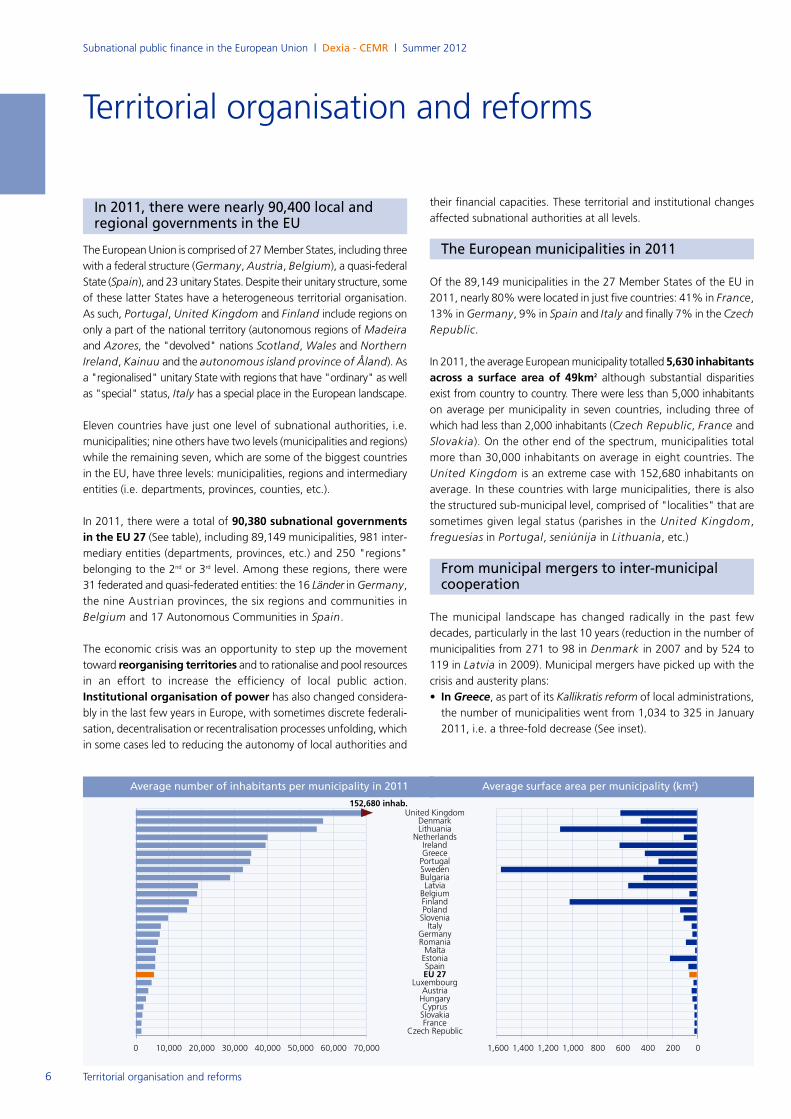
The European municipalities in 2011
Of the 89,149 municipalities in the 27 Member States of the EU in
2011, nearly 80% were located in just five countries: 41% in France,13% in Germany, 9% in Spain and Italy and finally 7% in the CzechRepublic.
In 2011, the average European municipality totalled 5,630 inhabitantsacross a surface area of 49km2 although substantial disparities
exist from country to country. There were less than 5,000 inhabitants
on average per municipality in seven countries, including three of
which had less than 2,000 inhabitants (Czech Republic, France and
Slovakia). On the other end of the spectrum, municipalities total
more than 30,000 inhabitants on average in eight countries. The
United Kingdom is an extreme case with 152,680 inhabitants on
average. In these countries with large municipalities, there is also
the structured sub-municipal level, comprised of "localities" that are
sometimes given legal status (parishes in the United Kingdom,
freguesias in Portugal, seniúnija in Lithuania, etc.)
From municipal mergers to inter-municipalcooperation
The municipal landscape has changed radically in the past few
decades, particularly in the last 10 years (reduction in the number of
municipalities from 271 to 98 in Denmark in 2007 and by 524 to
119 in Latvia in 2009). Municipal mergers have picked up with the
crisis and austerity plans:
• In Greece, as part of its Kallikratis reform of local administrations,
the number of municipalities went from 1,034 to 325 in January
2011, i.e. a three-fold decrease (See inset).
Average number of inhabitants per municipality in 2011 Average surface area per municipality (km2)
10,0000 30,00020,000 1,600 1,400 1,200 1,000 800 600 400 200 040,000 50,000 60,000 70,000
EU 27
Netherlands
United Kingdom
Czech Republic
Slovenia
Austria
BelgiumFinland
Sweden
Denmark
Germany
Hungary
Poland
Slovakia
Lithuania
France
Cyprus
Luxembourg
Malta
Italy
Romania
Ireland
Latvia
Portugal
Estonia
Bulgaria
Spain
Greece
152,680 inhab.
Territorial organisation and reforms
Subnational public finance in the European Union | Dexia - CEMR | Summer 2012
7Territorial organisation and reforms
• In Germany, municipalities continued to be merged in several
Länder. In 2010 and 2011, the Land of Saxony-Anhalt lost ¾ of itsmunicipalities (from 840 municipalities to roughly 220). In all, the
number of German municipalities has dropped 7% in four years,
i.e. from 12,456 in 2007 to 11,553 in 2011.
• In Luxembourg, there were 106 municipalities at 1 January 2012versus 116 in 2009. The downward trend is poised to continue and
by 2017 there is expected to be 71 municipalities in Luxembourgwith the critical mass of a municipality being set at a minimum of
3,000 inhabitants as set out by the government's territorial
reorganisation programme.
• In Finland, the new government seeks to step up the current paceof mergers launched in 2007 (the PARAS programme of municipal
services restructuring), which gradually reduced the number of muni-
cipalities from 431 in 2006 to 336 in 2011. The new policy begun
in 2012, entitled "New municipalities 2017", aims to implement
municipal organisation with various configurations depending on
the urban or rural nature of territories and to promote the creation
of an infra-municipal level. At the same time, municipal competen-
cies are likely to be strengthened, particularly for social services.
• In Ireland, the government announced in June 2011 it was encou-raging mergers between cities and counties and the streamlining
of the urban authority system.
• In Spain, the government has been preparing, since 2012, a
municipal streamlining plan affecting municipalities of less than 5,000
inhabitants, i.e. 84% of current municipalities. The plan would merge
or encourage municipalities to cooperate within inter-municipal
groups. To facilitate these mergers, competencies would be
distributed depending on population size. The region of Castileand León, which is home to nearly 2,200 municipalities with lessthan 5,000 inhabitants, would be the most concerned by this policy.
The basic law on local government will also be revised, notably Article
25, which defines the competencies of each municipality. These
competencies are expected to be reduced and clarified. Part of the
competencies of municipalities with under 20,000 inhabitants could
be taken over by the provinces.
Despite being stepped up in several countries, this trend continues to
meet stiff resistance. This is the case in France, for example, (meagresuccess of the "new municipalities" of which only 13 are expected to
be created in 2012 and 2013) and in Luxembourgwhere the mergerprocess is moving forward slowly (a new assessment of the situation
is expected for 2013). At times, the trend has been stopped in its tracks.
In Northern Ireland, the reform that would have cut the number ofdistricts from 26 to 11 with the May 2011 elections was cancelled in
May 2010 and postponed to 2015. In Italy, the plan for eliminatingsmall municipalities of less than 1,000 inhabitants, which was part of
2011 austerity measures, seems to have been abandoned in favour of
greater inter-municipal cooperation.
Governments are increasingly encouraging inter-municipal coope-ration, which is seen as an alternative to merging municipalities oras a complementary route. It has take different forms including
simple delegation agreements or shared services or more integrated
and institutionalised forms of cooperation.
• In Italy, the municipalities with fewer than 5,000 inhabitants will haveto share their resources starting in 2013 (group purchasing, municipal
unions) while reducing the number of municipal councillors.
• In England, the government has asked districts to sign Shared ServiceAgreements for certain public services.
• In Ireland, the local authorities are encouraged to set up shared services in waste treatment and water services as well as rent
recovery, tariffs and fees.
• Moreover in the Netherlands, municipalities continue to merge anda reduction in the number of local elected officials is under conside-
ration. At the same time, the pooling of municipal administrations
is being encouraged via the creation of shared service centres.
• In Portugal, a vast reform of the local government was launched in2011. Besides eliminating some of the parishes, the reform will streng-
then competencies and financial resources of the 23 "inter-municipal
communities" and two metropolitan areas including Lisbon and Porto.
Institutional reforms in countries the Troika is monitoring
Heavily affected by the financial and economic crisis, several countries in
the EU asked for an IMF bailout to help them overcome budget and exter-
nal imbalances. In 2008 – 2009, Hungary, Latvia and Romaniawere partof the first wave of rescues by the IMF and the European Commission. In
2010 – 2011, Ireland (December 2010), Greece (May 2010) and Portugal(May 2011), all three members of the euro area, also reached out for
assistance in the form of strengthened cooperation between the IMF, the
Commission and the European Central Bank, dubbed the "Troika". The
Memoranda of Understanding (MoU) that were signed with these
countries include major territorial and institutional reforms. The goal is to
streamline territorial organisation and to reduce and optimise public
spending through reinforcing decentralisation.
In Portugal, the current reform of local government is founded on the
Green Paper published in October 2011 and the MoU with the Troika. It
includes four parts: reform of local public companies, of territorial organi-
sation, municipal/inter-municipal management and financial management
as well as reform of local democracy. New competencies will be delegated
by the State to municipalities and inter-municipal groups whose financial
resources will be increased. Some 1,500 civil parishes (freguesias, adminis-
trative subdivision of municipalities), out of a total of 4,259, will be elimi-
nated. A vote on the laws is scheduled for the summer of 2012.
In Greece, the Kallikratis reform, adopted as part of the 3852/2010 lawand operational since 1 January 2011, is both a territorial reform (merging
municipalities, replacement of departments by regions) and institutional
reform. The new municipalities were given more competencies and resources
(personnel, grants), which are transferred by the State but generally inhe-
rited from the old departments (school transport, welfare, urban planning
agencies). Thirteen new regions, including two "metropolitan regions",
were created to ensure regional development primarily. The number of
municipal companies should also plummet from 6,000 to 2,000. For its part,
the central State set up new territorial organisation with seven administra-
tive departments (dioceses).
In Ireland, the Reforming Local Government plan, which has been underdiscussion since the 2007 Green Paper, was resuscitated in the summer of
2012. It is part of the Programme for a National Government and aims to
increase decentralisation. The goals of the reform are to strengthen local
authorities' competencies, functions, leadership and financing mechanisms.
Local councillors were consulted starting in June 2012 notably regarding
the possible election of mayors through direct elections. Although, the
project aimed at consolidating "regional authorities" seems to be on hold.
Subnational public finance in the European Union | Dexia - CEMR | Summer 2012
8 Territorial organisation and reforms
• In Wallonia, municipalities may be asked to create municipal
communities in order to manage certain competencies at the
municipal and provincial level (See below).
• In France, territorial reform, set up as part of the law passed on16 December 2010, aims, in particular, to complete and stream-
line the inter-municipal map, has made significant progress. Since
2012, a departmental plan for inter-municipal cooperation has
been completed in two-thirds of French departments. It will enable
the enlargement of the scopes of existing inter-municipal groups
with their own-source tax resources (groupements de communesà fiscalité propre) and it will also combine them with the last
isolated municipalities. Plans would reduce both the number of
groupings of municipalities with own-source tax revenue by
20% (from 1,828 to 1,477) and the number of inter-municipal
syndicates (syndicats de communes).
The institutionalisation of the “metropolitanphenomenon"
In the last few years, several European countries have stepped up inter-
municipal cooperation at the urban centre level. The objective is
to make the "metropolisation" phenomenon a political-institutional
reality and improve the governance of the "metropolitan areas"as well as capital cities.
• In the Netherlands, with the emergence of the project of the"Metropoolregio" metropolitan region, which covers Rotterdamand the Hague;
• In Finland, Helsinki and its surroundings are treated differentlyunder the "New municipalities 2017" programme.
• In Italy, the law passed in March 2009 created a special status for
Rome and for nine metropolitan cities (Turin, Milan, Venice, Genoa,Bologna, Florence, Bari and Naples, and Reggio Calabria);
• In Portugal, the territorial reform currently underway aims to
reinforce the competencies of the metropolitan zones of Lisbon
and Porto created in 2003, which have already been reformed once(2008). A project to give two metropolises an institutional struc-
ture is currently under discussion, which could lead to the creation
of metropolitan municipalities with expanded competencies and
greater financial autonomy.
• In France, under the territorial reform of 2010, metropolises (over500,000 inhabitants) and metropolitan centres (over 300,000 inha-
bitants) will be set up. The first metropolis (out of eight potentially)
was created on 1 January 2012 (Nice-Côte d'Azur) in addition tofive metropolitan centres on 1 June 2012. The governance of GrandParis has not yet been determined.
• In Poland, the 2009 bill has been rekindled. It aims to create a
dozen metropolitan areas. This renewed interest has followed
proposals by the European Commission regarding the program-
ming of structural funds for the 2014 – 2020 period (5% of funds
could be allocated to urban development projects).
• In England, launch of the "City Deals" process, which consists ofgiving ten of England’s biggest cities new competencies if they
consolidate the way in which they are governed. The failure of the
local referendums in May 2012 – which proposed to elect mayors
via direct elections in 10 cities (9 yeah and 1 nay votes) – is liable
to slow the process.
• In Ireland, the "Local Government (Dublin Mayor and Regional
Authority) Bill 2010" created the position of an elected mayor to
manage Dublin and its region and handle questions of territorial
development, housing, waste and water management as well as
regional transport.
• In Greece, following territorial reform and regionalisation, the
metropolises of Attica and Thessaloniki will be given an institutio-nal structure within a regional framework. The metropolitan regions
will manage issues related to transport and communications,
the environment and quality of life, territorial planning, urban
development as well as security.
Decentralisation in France and in England
It is often tempting to compare France and England, as their demographic,
economic and political landscapes are relatively similar, e.g. both have a
central State that is traditionally strong. However, in terms of territorial
organisation and decentralisation, the two countries have chosen relatively
different paths: in France, a uniform territorial organisation and "political"
decentralisation together with financial decentralisation; in England, an
asymmetrical territorial organisation and a more "functional" and techni-
cal decentralisation, along the lines of the New Public Management, without
real financial autonomy. France and England are currently experiencing a
new transformation phase of their territorial organisation. How have these
two governance models evolved? Let’s take a look at the main directions…
England is currently undergoing a period of profound institutional changeas the Localism Act, which was signed on 15 November 2011, went into
effect in April 2012. This reform is part of a broader "Big society" (vs. "Big
government") project designed by the new British government. The reform
plans to transfer many State responsibilities to local authorities and civil
society (as opposed to the public or private sectors). The idea is to give
local groups (cooperatives, mutuals, neighbourhood communities, citizen
and volunteer groups, charities, social enterprises, etc.) local services. Social
initiatives are being particularly targeted as well as culture and education
(free schools for example).
The law intends to push decentralisation forward. It also gives local autho-
rities a general power of competence excluding the ability to raise taxes.
The economic power of major cities and London is expected to be exten-
ded to the areas of housing and economic development. Local councils will
also be in charge of public health starting in April 2013, which has been a
function carried out by the central State.
In addition, a reform of local government funding aiming to increase finan-
cial autonomy is being prepared (See revenue section). Lastly, several layers
of State control (e.g. Audit commission) and governance of local public
action were abolished because they generated bureaucracy and additional
procedures.
In France, a major reform of local authorities, which includes several parts(distribution of competencies, creation of territorial councillors, inter-muni-
cipality, metropolisation, reforms of local taxation and equalisation mecha-
nisms, co-financing framework, local democracy, etc.), was begun under
the law passed on 16 December 2010 and several finance laws thereafter.
It led, notably, to the loss of tax autonomy for local governments, particu-
larly regions and departments. With the new government formed in 2012,
a new stage has been set towards strengthening decentralisation. Act III of
decentralisation (in reference to "Act II" of 2003 – 2004) was announced
for 2013. It plans to transfer new responsibilities (employment, training,
European policies) and re-expand local tax power and reorganisation of local
democracy (limiting the accumulation of political positions, local initiative
referendums, etc.). Part of the territorial reform of December 2010 is likely
to be abrogated, notably those concerning the new "territorial councillors".
Subnational public finance in the European Union | Dexia - CEMR | Summer 2012
9Territorial organisation and reforms
Intermediary levels being reformed
Present in seven EU countries, intermediary-level authorities occupy
a unique position between regions and municipalities. They have been
the subject of an ongoing debate in these countries and the crisis has
provided an opportunity to hasten changes to these entities:
• In England, the two-level system, which remains in place in somerural areas, is disappearing with counties being gradually replaced
by unitary authorities.
• In Italy, the elimination of 110 provinces as elected entities hadbeen taken under consideration in 2011 in the aim of cutting
fiscal costs. However, the plan was dropped in June 2012 as the
project met resistance and because of the fact that it would have
required a constitutional amendment. It appears that the govern-
ment is leaning towards combining provinces, the number of which
could be brought down to 60. A decision confirming this strategy
is expected to be made in July 2012.
• In Spain, under the current review of the basic law on local autho-rities, the provinces could take over competencies currently carried
out by the municipalities.
• In Belgium, the provincial level is also being reformed but in varying
ways depending on the region. In Wallonia, certain provincial com-petencies will be taken up by the regions (roadways) or transferred
to communities of municipalities. In Flanders, the provinces standto lose some of their competencies (education, culture and health)
and only maintain competencies related to the territory. In the
two regions, the number of elected officials from the provinces
would also be cut.
In France, however, the territorial reform begun in 2010, which projected, notably, to set up new territorial councillors that would govern
in general councils (department level) and regional councils (regional
level) in 2014 is likely to be revoked in 2012 under the aegis of
the new government. This project could have been a prelude to a
potential redefinition of the role of departmental and regional
levels and perhaps mergers between regions and departments. A
third round of decentralisation is slated for 2013 and the role of
departments in the French territorial landscape, particularly when
compared with regions and inter-municipal groups, is expected to
be discussed.
The reinforcement of regions in Europe: yes…but
The regional level has also been appreciably changed in the last few
years. Overall, the regional level has been strengthened, which has
resulted in either the attribution of new competencies and resources
to existing regions or through the creation of, or experimentation
with, new regional levels (from scratch or based on pre-existing admi-
nistrative entities or policies):
• In Spain, Italy and Germany, laws dating from 2009 on financialfederalism gave regions greater financial autonomy, even though
the crisis has, at the same time, led central governments to
strengthen their fiscal control over regions (See the financial
sections hereinafter).
• In Belgium, the institutional agreement of October 2011 on State
reform will translate, starting in 2014, into transfers of competen-
cies towards the federated entities whose fiscal autonomy will
be increased (See inset).
• In the United Kingdom, a certain form of "federalisation" is
underfoot in regions (Northern Ireland, Wales and Scotland) whoseinstitutional and fiscal autonomy is being beefed up (See inset).
• In Poland, a law passed on 23 January 2009 bolstered the com-petencies of regions
• In Greece, 13 democratically-elected regions, which were givennew competencies (Kallikratis reform), replaced the 54 departmentson 1 January 2011.
Federalism progresses
Besides the two reforms of German federalism (in 2006 and 2008 for
financial aspects) and reforms to financing of Autonomous Communities
in Spain and Italian regions (making reference to the "financial federalism"),
profound institutional changes have taken place in the United Kingdom and
Belgium:
In the United Kingdom, since the devolution laws of 1998, which trans-
ferred major competencies to the three nations comprising the Kingdom
(i.e. Northern Ireland, Wales and Scotland), their autonomy has continued
to increase even if the process has varied depending on the nation. More
recently, a November 2010 referendum extended the powers of the Welsh
assembly by attributing it full legislative competency for devolved issues
(agriculture, environment, housing, education and healthcare). In Scotland,
the Scotland Bill of November 2010 will transfer new competencies to the
Scottish government and modify its financing: the nation would no longer
be funded by British government subsidies but rather through tax revenue
transfers (stamp tax, environmental tax).
It would also have the power to modify the income tax scale via an addi-
tional tax. A referendum is being organised for 2013 or 2014 on Scottish
independence.
In Belgium, the institutional agreement on State reform, validated in
October 2011, is a major reform of federalism. It would translate, from
2014, into the transfer of competencies from the federal government and
social security towards the communities and regions, estimated at 4.4% of
GDP in four main areas: employment, healthcare and social assistance (elderly
and disabled), family support and justice. The reform also includes the
revision of the Special Financing Act, which will lead to the reinforcement
of federated entities' financial autonomy (See revenue section). In addi-
tion, a reform of provinces was begun in Wallonia and in Flanders, which
will consist of also transferring competencies towards regions, municipali-
ties and inter-municipal cooperation structures.
Subnational public finance in the European Union | Dexia - CEMR | Summer 2012
10 Territorial organisation and reforms
Regional reforms are still being debated in several countries:
• In Romania, where a territorial reorganisation plan was launchedin 2011 in the aim of creating 8 to 16 major regions replacing the
current departments. Discussions on the exact configuration of the
reform are expected to recommence after the June 2012 elections.
• In France, the regions, which had lost a major part of their fiscalpower with the 2010 fiscal reform, could regain some prerogatives
in 2013 with the Act III decentralisation project by the government,
which was elected in May 2012.
• In the Netherlands, the government wishes to encourage
provinces to cooperate, or even merge based on the "RandstadProvince" model, cooperation between Northern Holland, Utrechtand Flevoland. Their competencies could also change with pro-
vinces taking on territorial development and water management.
Discussions in Bulgaria (creation of regions), in the Czech Republic(reinforcement of regional competencies), in Cyprus (creation of asecond level) are underway but have not led to concrete results at
this point.
This observation regarding the progress of regionalisation should be
nuanced, however. In fact, in certain countries, the regional level has
been weakened. Moreover, several regionalisation projects have been
postponed, or even abandoned. Regionalisation is far from being a
fait accompli, as demonstrated by the following examples:
• In Denmark, the 5 regions created in 2007, by replacing the 14counties to take on the bulk of health responsibilities, suffer from
a lack of legitimacy. Some voices have expressed a desire to
eliminate them or transform them into an administrative level
of the State.
• In Slovenia, while the regionalisation project had been conside-red a foregone conclusion in February 2011 (creation of 6 regions
instead of the 14 outlined in the 2008 bill, which was abandoned),
it seems as if the project had been halted yet again.
• In Hungary, the former regionalisation project was abandoned
with the constitutional reform and the 2011 law on local govern-
ment. In accordance with the new law on local administration
passed in December 2011, Hungarian counties, just like munici-
palities, will lose several major competencies (healthcare, notably
hospitals, social initiatives and education) starting in January 2012,
which will be recentralised. They will be in charge of regional
development for the most part.
• In Portugal, the regionalisation project on the continent is no longer on the agenda while the two autonomous regions' authority,
notably fiscal, is being limited by the austerity programme and the
current reform of the local and regional government.
• In Sweden, while the status of regions was attributed in 2011 totwo new counties (Halland and Götland), in addition to the two counties that were already experimenting with it since 1997
1998 (Skåne and Västra Götaland), the project for widespreadregionalisation to 2015 seems to have been put on hold. The
transformation of all counties into between 6 and 9 regions had
been planned by giving them competencies in health matters and
regional planning.
• In Finland, the government extended in March 2011 the Kainuuregionalisation project until 2016 but no longer seems willing to
expand regionalisation throughout the country.
• Although the autonomy of the devolved nations in the UnitedKingdom seems to have increased, regionalisation in Englandseems to be more compromised since the government decided in
2010 to eliminate the regional development agencies that would
have served as a base for the emergence of elected officials at the
regional level. At present, only one region-metropolis, Greater
London, has an elected regional assembly and mayor.
• In Ireland, austerity measures have interrupted the process of
consolidating "regional authorities" and their transformation into
elected regions.
• In Lithuania and in Latvia, recent territorial reforms from 2009and 2010 were not, in the end, joined by the creation of an
elected regional level, like initially planned. In Lithuania notably,
the administrative counties of the State, which were eliminated
on 1 July 2010, were not replaced by elected regions in the
end: their competencies were distributed between the State and
the municipalities.
Subnational public finance in the European Union | Dexia - CEMR | Summer 2012
11Territorial organisation and reforms
Population, surface area and organisation of territories in the EU-27 Member States in 2011
Population Surface area 1st level 2nd level 3rd level
(thousands) (km²)
Countries with one subnational government level
Bulgaria 1 7,534 111,002 264 municipalities - -
Cyprus 2 804 5,695 379 municipalities - -
Estonia 1,340 45,227 226 municipalities - -
Finland 5,363 338,145 336 municipalities 2 regions (pilot region of Kainuu -
and the autonomous
insular province of Åland)
Ireland 4,476 69,797 114 local councils - -
Latvia 2,239 64,589 119 municipalities - -
Lithuania 1 3,287 65,300 60 municipalities - -
Luxembourg 3 506 2,586 106 municipalities - -
Malta 1 416 316 68 local councils - -
Portugal 1 10,637 92,152 308 municipalities 2 autonomous regions -
(Madeira and Azores)
Slovenia 2,049 20,273 210 municipalities - -
Countries with two subnational government levels
Austria 8,388 83,871 2,357 municipalities 9 Federated States -
Czech Republic 10,517 78,868 6,249 municipalities 14 regions -
Denmark 5,546 43,098 98 municipalities 5 regions -
Greece 4 11,305 131,957 325 municipalities 13 regions -
Hungary 10,000 93,029 3,177 municipalities 19 counties -
Netherlands 16,612 41,528 418 municipalities 12 provinces -
Romania 1 21,431 238,391 3,181 local authorities 41 departments -
Slovakia 5,430 49,034 2,930 municipalities 8 regions -
Sweden 5 9,378 449,964 290 municipalities 20 counties of which 4 regions -
Countries with three subnational government levels
Belgium 10,883 30,528 589 municipalities 10 provinces 6 communities and regions
France 6 64,848 633,210 36,697 municipalities 101 departments 27 regions
Germany 81,757 357,027 11,553 municipalities 301 rural districts 16 Federated States
and districts-free cities
Italy 60,468 301,336 8,094 municipalities 110 provinces 20 regions of which
5 with special status
Poland 38,187 312,685 2,479 municipalities 379 counties 16 regions
Spain 46,073 505,997 8,116 municipalities 52 provinces 17 Autonomous Communities
of which 2 with foral regime
United Kingdom 1 61,990 243,820 406 local authorities 28 counties 3 "devolved" nations
(Scotland, Wales
and Northern Ireland)
TOTAL EU 27 501,465 4,409,423 89,149 municipalities 1,126 regional or 105 regions
and local authorities intermediary authorities
1 Existence of a sub-municipal structure level (communities, localities, parishes, etc.).2 Only in the Government controlled area (525 on the entire island).3 Provisional figure as of 1 January 2012 (on-going municipal reform).4 Since the territorial reform adopted in July 2010 and in effect since 1 January 2011.5 Including the 4 regions (Skåne, Västra Götaland and since 2011, Halland and Götland).6 Including Corsica and the 5 DOM-ROM, i.e. French overseas departments and territories (including Mayotte since March 2011).
Subnational public finance in the European Union | Dexia - CEMR | Summer 2012
12 Revenue and taxation
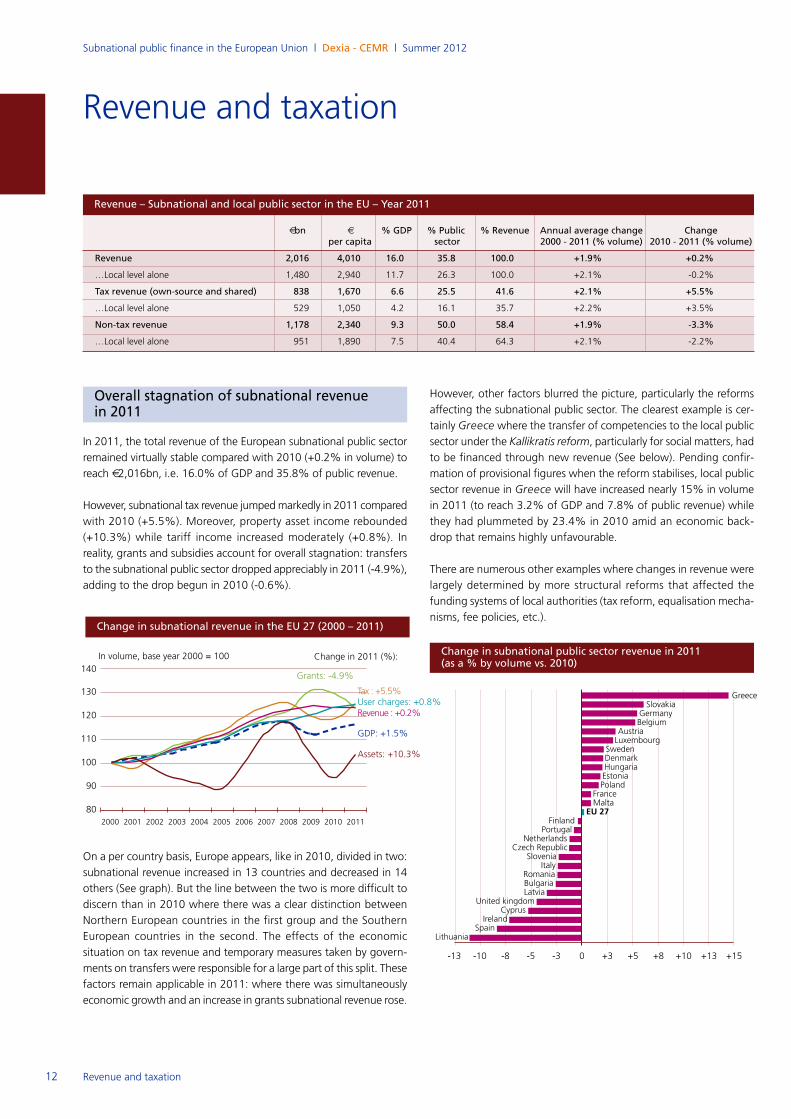
Overall stagnation of subnational revenue in 2011
In 2011, the total revenue of the European subnational public sector
remained virtually stable compared with 2010 (+0.2% in volume) to
reach €2,016bn, i.e. 16.0% of GDP and 35.8% of public revenue.
However, subnational tax revenue jumped markedly in 2011 compared
with 2010 (+5.5%). Moreover, property asset income rebounded
(+10.3%) while tariff income increased moderately (+0.8%). In
reality, grants and subsidies account for overall stagnation: transfers
to the subnational public sector dropped appreciably in 2011 (-4.9%),
adding to the drop begun in 2010 (-0.6%).
On a per country basis, Europe appears, like in 2010, divided in two:
subnational revenue increased in 13 countries and decreased in 14
others (See graph). But the line between the two is more difficult to
discern than in 2010 where there was a clear distinction between
Northern European countries in the first group and the Southern
European countries in the second. The effects of the economic
situation on tax revenue and temporary measures taken by govern-
ments on transfers were responsible for a large part of this split. These
factors remain applicable in 2011: where there was simultaneously
economic growth and an increase in grants subnational revenue rose.
However, other factors blurred the picture, particularly the reforms
affecting the subnational public sector. The clearest example is cer-
tainly Greece where the transfer of competencies to the local publicsector under the Kallikratis reform, particularly for social matters, hadto be financed through new revenue (See below). Pending confir-
mation of provisional figures when the reform stabilises, local public
sector revenue in Greece will have increased nearly 15% in volume
in 2011 (to reach 3.2% of GDP and 7.8% of public revenue) while
they had plummeted by 23.4% in 2010 amid an economic back-
drop that remains highly unfavourable.
There are numerous other examples where changes in revenue were
largely determined by more structural reforms that affected the
funding systems of local authorities (tax reform, equalisation mecha-
nisms, fee policies, etc.).
Revenue and taxation
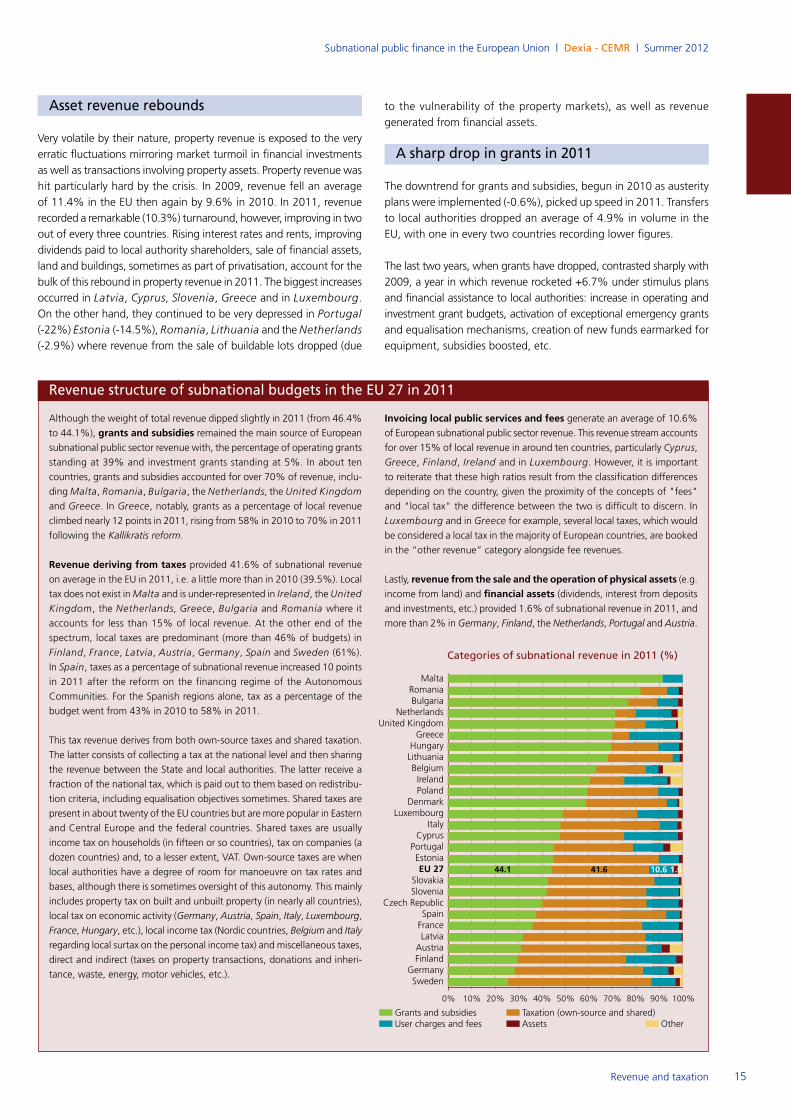
Revenue – Subnational and local public sector in the EU – Year 2011
€bn € % GDP % Public % Revenue Annual average change Change per capita sector 2000 - 2011 (% volume) 2010 - 2011 (% volume)
Revenue 2,016 4,010 16.0 35.8 100.0 +1.9% +0.2%
…Local level alone 1,480 2,940 11.7 26.3 100.0 +2.1% -0.2%
Tax revenue (own-source and shared) 838 1,670 6.6 25.5 41.6 +2.1% +5.5%
…Local level alone 529 1,050 4.2 16.1 35.7 +2.2% +3.5%
Non-tax revenue 1,178 2,340 9.3 50.0 58.4 +1.9% -3.3%
…Local level alone 951 1,890 7.5 40.4 64.3 +2.1% -2.2%
Change in subnational revenue in the EU 27 (2000 – 2011)
In volume, base year 2000 = 100 Change in 2011 (%):
130
120
110
100
90
802000 2001 2002 2003 2004 2005 2006 2007 2008 2009 2010
Grants: -4.9%
GDP: +1.5%
Assets: +10.3%
Change in subnational public sector revenue in 2011 (as a % by volume vs. 2010)
-10-13 -8 -5 -3 0 +3 +5 +8 +10 +13 +15
EU 27
Netherlands
United kingdom
Czech RepublicSlovenia
AustriaBelgium
Finland
SwedenDenmark
Germany
Hungaria
Poland
Slovakia
Lithuania
France
Cyprus
Luxembourg
Malta
ItalyRomania
Ireland
Latvia
Portugal
Estonia
Bulgaria
Spain
Greece
2011
140
User charges: +0.8%Revenue : +0.2%
Tax : +5.5%
Subnational public finance in the European Union | Dexia - CEMR | Summer 2012
13Revenue and taxation
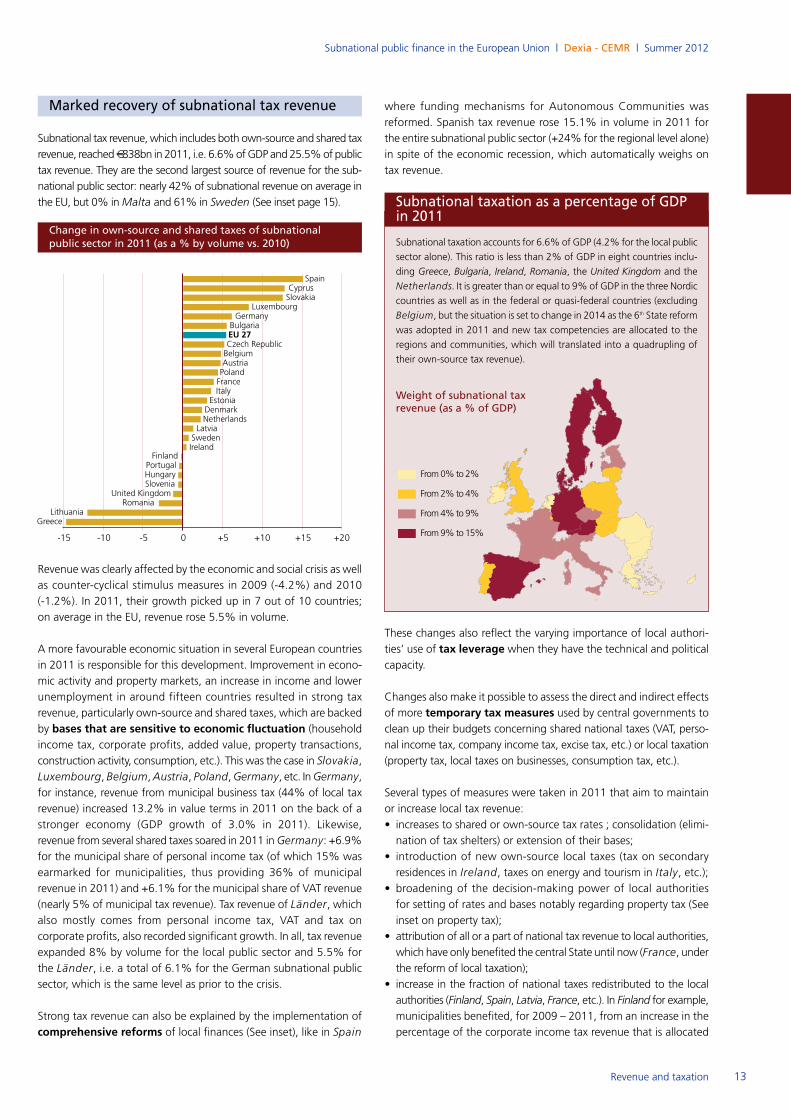
Marked recovery of subnational tax revenue
Subnational tax revenue, which includes both own-source and shared tax
revenue, reached €838bn in 2011, i.e. 6.6% of GDP and 25.5% of public
tax revenue. They are the second largest source of revenue for the sub-
national public sector: nearly 42% of subnational revenue on average in
the EU, but 0% in Malta and 61% in Sweden (See inset page 15).
Revenue was clearly affected by the economic and social crisis as well
as counter-cyclical stimulus measures in 2009 (-4.2%) and 2010
(-1.2%). In 2011, their growth picked up in 7 out of 10 countries;
on average in the EU, revenue rose 5.5% in volume.
A more favourable economic situation in several European countries
in 2011 is responsible for this development. Improvement in econo-
mic activity and property markets, an increase in income and lower
unemployment in around fifteen countries resulted in strong tax
revenue, particularly own-source and shared taxes, which are backed
by bases that are sensitive to economic fluctuation (householdincome tax, corporate profits, added value, property transactions,
construction activity, consumption, etc.). This was the case in Slovakia,Luxembourg, Belgium, Austria, Poland, Germany, etc. In Germany,for instance, revenue from municipal business tax (44% of local tax
revenue) increased 13.2% in value terms in 2011 on the back of a
stronger economy (GDP growth of 3.0% in 2011). Likewise,
revenue from several shared taxes soared in 2011 in Germany: +6.9%for the municipal share of personal income tax (of which 15% was
earmarked for municipalities, thus providing 36% of municipal
revenue in 2011) and +6.1% for the municipal share of VAT revenue
(nearly 5% of municipal tax revenue). Tax revenue of Länder, whichalso mostly comes from personal income tax, VAT and tax on
corporate profits, also recorded significant growth. In all, tax revenue
expanded 8% by volume for the local public sector and 5.5% for
the Länder, i.e. a total of 6.1% for the German subnational public
sector, which is the same level as prior to the crisis.
Strong tax revenue can also be explained by the implementation of
comprehensive reforms of local finances (See inset), like in Spain
where funding mechanisms for Autonomous Communities was
reformed. Spanish tax revenue rose 15.1% in volume in 2011 for
the entire subnational public sector (+24% for the regional level alone)
in spite of the economic recession, which automatically weighs on
tax revenue.
These changes also reflect the varying importance of local authori-
ties’ use of tax leverage when they have the technical and politicalcapacity.
Changes also make it possible to assess the direct and indirect effects
of more temporary tax measures used by central governments toclean up their budgets concerning shared national taxes (VAT, perso-
nal income tax, company income tax, excise tax, etc.) or local taxation
(property tax, local taxes on businesses, consumption tax, etc.).
Several types of measures were taken in 2011 that aim to maintain
or increase local tax revenue:
• increases to shared or own-source tax rates ; consolidation (elimi-
nation of tax shelters) or extension of their bases;
• introduction of new own-source local taxes (tax on secondary
residences in Ireland, taxes on energy and tourism in Italy, etc.); • broadening of the decision-making power of local authorities
for setting of rates and bases notably regarding property tax (See
inset on property tax);
• attribution of all or a part of national tax revenue to local authorities,
which have only benefited the central State until now (France, underthe reform of local taxation);
• increase in the fraction of national taxes redistributed to the local
authorities (Finland, Spain, Latvia, France, etc.). In Finland for example,municipalities benefited, for 2009 – 2011, from an increase in the
percentage of the corporate income tax revenue that is allocated
Change in own-source and shared taxes of subnationalpublic sector in 2011 (as a % by volume vs. 2010)
-10-15 -5 0 +5 +10 +15 +20
EU 27
Netherlands
United Kingdom
Czech Republic
Slovenia
AustriaBelgium
Finland
Sweden
Denmark
Germany
Hungary
Poland
Slovakia
Spain
France
Cyprus
Luxembourg
Portugal
Italy
Romania
Ireland
Latvia
Estonia
Bulgaria
GreeceLithuania
Subnational taxation as a percentage of GDP in 2011
Subnational taxation accounts for 6.6% of GDP (4.2% for the local public
sector alone). This ratio is less than 2% of GDP in eight countries inclu-
ding Greece, Bulgaria, Ireland, Romania, the United Kingdom and the
Netherlands. It is greater than or equal to 9% of GDP in the three Nordic
countries as well as in the federal or quasi-federal countries (excluding
Belgium, but the situation is set to change in 2014 as the 6th State reform
was adopted in 2011 and new tax competencies are allocated to the
regions and communities, which will translated into a quadrupling of
their own-source tax revenue).
From 0% to 2%
From 2% to 4%
From 4% to 9%
From 9% to 15%
Weight of subnational taxrevenue (as a % of GDP)
Subnational public finance in the European Union | Dexia - CEMR | Summer 2012
14 Revenue and taxation
to them (from 22% to 32%). In another example, Latvia distributed82% (provisional) of personal income tax to municipalities in 2011
up from 80% as the tax rate was dropped from 26% to 25%.
• raising of top tax rates on local taxes that come in addition to
national taxes (Italy).
Lastly, various endeavours have been undertaken such as impro-ving tax recovery methods, collecting back taxes (Bulgaria, Italy), combating tax evasion (Italy, Cyprus, Greece, Latvia, Ireland) ormodernising land registry systems.
Of course, not all European countries enjoyed such growth inlocal taxes. 2011 tax revenue was lower in eight countries. Several
among them were still confronted, in 2011, by recessions including
Slovenia and Portugal. In Portugal, for example, revenue from taxeson property transactions and the local surtax on companies (derrama)continued to fall sharply in 2011. Moreover, several governments
dropped the rates on shared taxes (e.g. Lithuania), reduced the portion redistributed to the municipalities (from 47% to 44% in
Romania in 2011 for personal income tax) or encouraged holding
local tax rates steady in an effort to stimulate growth by reducing
the tax burden. In England, for example, in 2011 and for the second consecutive year, the UK government has encouraged local councils
to freeze the rate on the Council Tax by promising to raise grants:
80% of local councils accepted the deal. Lastly, in Greece, wheretax revenue fell the most in Europe (though this should be put into
context: less than 10% of local revenue comes from taxes), the
explanations are adding up including the recession and the effects
of the Kallikratis reform, particularly the abolition of local entities thathad previously benefited from tax revenue.
User fee revenue still increasing
Boosted in 2010 when local authorities were scrambling to find new
sources of finance, revenue from user fees and charges, which are
generated when public authorities charge people for using a service,
continued to increase in 2011.
Growth was slightly down from last year (+0.8% vs. +2.4%). It is
uncertain whether local authorities have run out of ideas in this area:
transformation of local public services that were once free-of-charge
now come at a price, remodelling of user fee rates, increase in fees and
changes depending on the user's ability to pay, charges ramp-up,
creation of new paying services. Authorities probably have additio-
nal ideas and local leeway is limited given that it is a politically-
sensitive topic (especially during an election) and users' ability to
absorb rate hikes is also limited. In addition, it is also possible that
usage rates of some public services will drop or services that are
deemed non-essential could be dropped altogether in the wake of
austerity plans, even though they generate revenue.
In any case, revenue from user fees and charges is deteriorating in
11 countries, which is offset by an increase in the 16 other countries.
The most marked increases and decreases in 2011 were in countries
where these revenue are an important revenue contributor for local
authorities and generally offset the very minor portion of local taxation.
These revenues increased particularly in Latvia, Cyprus, Bulgaria andSlovenia but lost the most ground in Greece, Luxembourg and the
United Kingdom. In Greece, notably, they plummeted nearly 20% in
volume, to such an extent that their weight in the budget dropped from
32% in 2010 to 22% in 2011.
In countries such as Italy, Germany, Portugal and France, growthrates of user fees and charges were relatively high in 2011 (between
+2.5% and +4%), attesting to efforts by local authorities to find
financial resources by exploring new, wider and more varied areas:
household waste removal, parking lots, infant care, after-school
activities, greater use of sporting and cultural facilities, use of public
transport, healthcare services, elderly care, occupying the public
domain, etc.
Property tax in the spotlight
The property tax is the most common local tax in Europe and is often
one of its oldest. Its "permanent", "localised" and "visible" nature make
it the most important local tax, closely associated with providing public
services in a territory. It offers a relatively more equitable geographic dis-
tribution of tax bases between local authorities and to provide stable
revenue, even if they do not rise quickly during periods of economic
growth. It resisted the crisis well, in general. As such, the crisis provided
an opportunity to optimise revenue from this tax. Numerous countries
enacted reforms in this direction, which are sometimes imposed by the
protocol agreements for countries under the surveillance of the Troika.
In Ireland, a tax on secondary residence was created in addition to the"household charge" in 2012 to be replaced by in 2014 by a broader
reform of the property tax. In Portugal, the highest property tax bracket(IMI) was raised in 2012. In Greece, a special tax on property tax was setup in September 2011 and was immediately applicable. The tax will be
assessed for two years and will cost an average of €4/m² and it will becollected via the electricity bill. In Latvia, the tax rate on unbuilt and builtproperty was increased in 2010 and the taxable base was enlarged.
Taxation on residential buildings was also rolled out. From 2012, muni-
cipalities will have leverage over the property tax of which they can now
set the rates instead of the State. In Italy, property tax on primary resi-dences (ICI), which was abolished in 2006, was reintroduced for 2012
under a new single municipal tax (IMU), grouping together the ICI and
a residence tax which will depend on the type of building and the com-
position of the household. Moreover, tax rates on secondary residences
have been increased. In Germany, a work group was set up in September2010 to consider how to reform the property tax. In the UnitedKingdom, reform of the taxation of corporate and household property
is at the heart of the future local government finance law. In Bulgaria,amendments to the law on local taxation and local fees, which took effect
in 2011, increased the maximum property tax rate. A more comprehen-
sive reform of the current local taxation system, which has been dee-
med obsolete, is expected to be enacted in 2012 – 2013. In Slovenia,the property tax was reformed on 1 January 2012. A portion of revenue
on the new tax, founded on the market value of property, will be
distributed to municipalities. In the Czech Republic, the property taxrate on built and unbuilt property doubled. However, in Slovakia, muni-cipalities' authority to set property tax rates on corporate property has
been reduced significantly. Moreover, in Estonia, the property tax willbe practically abolished in 2013.
In addition, many countries have committed to reforms on land registries,
valuation methods on tax bases (founded on property characteristics and
their market values or rental value) and their revaluation. The following
countries should also be included Portugal, Greece, Germany, France,Slovenia, Latvia, Spain, Romania and Italy.
Subnational public finance in the European Union | Dexia - CEMR | Summer 2012
15Revenue and taxation
Asset revenue rebounds
Very volatile by their nature, property revenue is exposed to the very
erratic fluctuations mirroring market turmoil in financial investments
as well as transactions involving property assets. Property revenue was
hit particularly hard by the crisis. In 2009, revenue fell an average
of 11.4% in the EU then again by 9.6% in 2010. In 2011, revenue
recorded a remarkable (10.3%) turnaround, however, improving in two
out of every three countries. Rising interest rates and rents, improving
dividends paid to local authority shareholders, sale of financial assets,
land and buildings, sometimes as part of privatisation, account for the
bulk of this rebound in property revenue in 2011. The biggest increases
occurred in Latvia, Cyprus, Slovenia, Greece and in Luxembourg.On the other hand, they continued to be very depressed in Portugal(-22%) Estonia (-14.5%), Romania, Lithuania and the Netherlands(-2.9%) where revenue from the sale of buildable lots dropped (due
to the vulnerability of the property markets), as well as revenue
generated from financial assets.
A sharp drop in grants in 2011
The downtrend for grants and subsidies, begun in 2010 as austerity
plans were implemented (-0.6%), picked up speed in 2011. Transfers
to local authorities dropped an average of 4.9% in volume in the
EU, with one in every two countries recording lower figures.
The last two years, when grants have dropped, contrasted sharply with
2009, a year in which revenue rocketed +6.7% under stimulus plans
and financial assistance to local authorities: increase in operating and
investment grant budgets, activation of exceptional emergency grants
and equalisation mechanisms, creation of new funds earmarked for
equipment, subsidies boosted, etc.
Revenue structure of subnational budgets in the EU 27 in 2011
Although the weight of total revenue dipped slightly in 2011 (from 46.4%
to 44.1%), grants and subsidies remained the main source of Europeansubnational public sector revenue with, the percentage of operating grants
standing at 39% and investment grants standing at 5%. In about ten
countries, grants and subsidies accounted for over 70% of revenue, inclu-
ding Malta, Romania, Bulgaria, the Netherlands, the United Kingdom
and Greece. In Greece, notably, grants as a percentage of local revenue
climbed nearly 12 points in 2011, rising from 58% in 2010 to 70% in 2011
following the Kallikratis reform.
Revenue deriving from taxes provided 41.6% of subnational revenue
on average in the EU in 2011, i.e. a little more than in 2010 (39.5%). Local
tax does not exist in Malta and is under-represented in Ireland, the United
Kingdom, the Netherlands, Greece, Bulgaria and Romania where it
accounts for less than 15% of local revenue. At the other end of the
spectrum, local taxes are predominant (more than 46% of budgets) in
Finland, France, Latvia, Austria, Germany, Spain and Sweden (61%).
In Spain, taxes as a percentage of subnational revenue increased 10 points
in 2011 after the reform on the financing regime of the Autonomous
Communities. For the Spanish regions alone, tax as a percentage of the
budget went from 43% in 2010 to 58% in 2011.
This tax revenue derives from both own-source taxes and shared taxation.
The latter consists of collecting a tax at the national level and then sharing
the revenue between the State and local authorities. The latter receive a
fraction of the national tax, which is paid out to them based on redistribu-
tion criteria, including equalisation objectives sometimes. Shared taxes are
present in about twenty of the EU countries but are more popular in Eastern
and Central Europe and the federal countries. Shared taxes are usually
income tax on households (in fifteen or so countries), tax on companies (a
dozen countries) and, to a lesser extent, VAT. Own-source taxes are when
local authorities have a degree of room for manoeuvre on tax rates and
bases, although there is sometimes oversight of this autonomy. This mainly
includes property tax on built and unbuilt property (in nearly all countries),
local tax on economic activity (Germany, Austria, Spain, Italy, Luxembourg,
France, Hungary, etc.), local income tax (Nordic countries, Belgium and Italy
regarding local surtax on the personal income tax) and miscellaneous taxes,
direct and indirect (taxes on property transactions, donations and inheri-
tance, waste, energy, motor vehicles, etc.).
Invoicing local public services and fees generate an average of 10.6%of European subnational public sector revenue. This revenue stream accounts
for over 15% of local revenue in around ten countries, particularly Cyprus,
Greece, Finland, Ireland and in Luxembourg. However, it is important
to reiterate that these high ratios result from the classification differences
depending on the country, given the proximity of the concepts of "fees"
and "local tax" the difference between the two is difficult to discern. In
Luxembourg and in Greece for example, several local taxes, which would
be considered a local tax in the majority of European countries, are booked
in the “other revenue” category alongside fee revenues.
Lastly, revenue from the sale and the operation of physical assets (e.g.income from land) and financial assets (dividends, interest from depositsand investments, etc.) provided 1.6% of subnational revenue in 2011, and
more than 2% in Germany, Finland, the Netherlands, Portugal and Austria.
Categories of subnational revenue in 2011 (%)
Denmark
France
Finland
Latvia
GermanySweden
Luxembourg
Poland
Lithuania
Cyprus
Hungary
BelgiumIreland
United Kingdom
Romania
NetherlandsBulgaria
Malta
Grants and subsidies Taxation (own-source and shared)User charges and fees Assets Other
Austria
Greece
Estonia
SloveniaSlovakia
Italy
Portugal
EU 27
SpainCzech Republic
0% 10% 20% 30% 40% 50% 60% 70% 80% 90% 100%
44.1 41.6 10.6 1.6
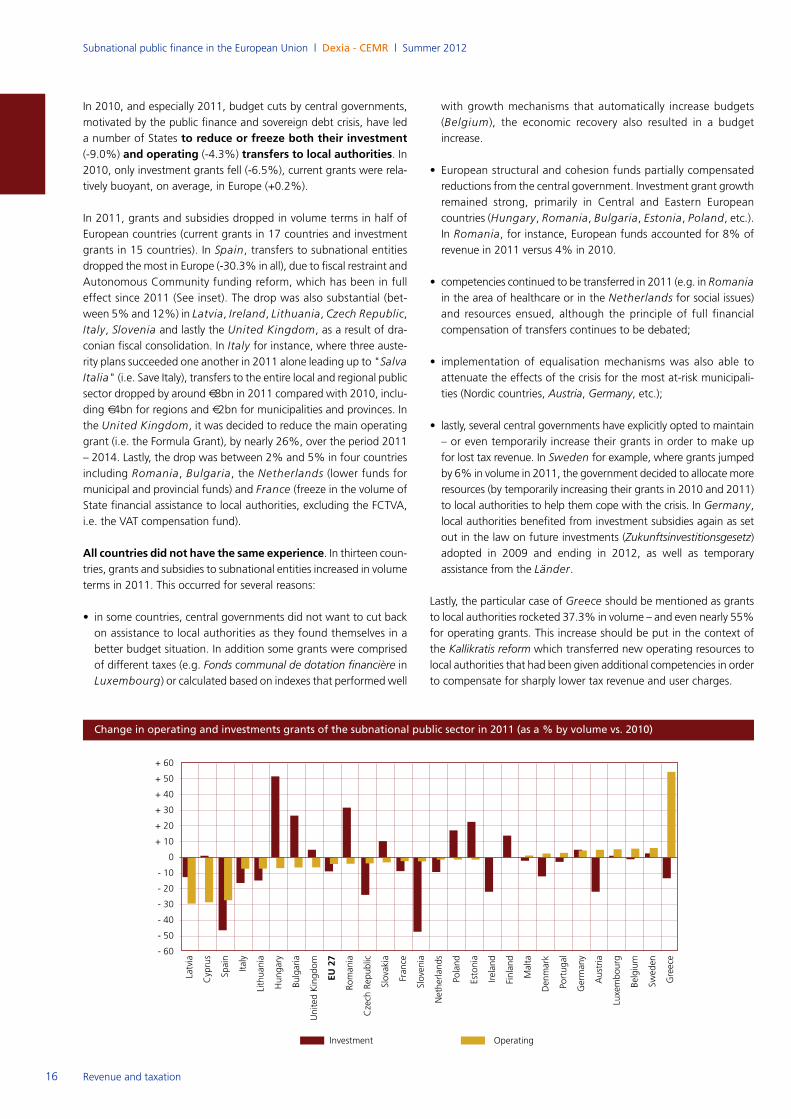
Subnational public finance in the European Union | Dexia - CEMR | Summer 2012
16 Revenue and taxation
In 2010, and especially 2011, budget cuts by central governments,
motivated by the public finance and sovereign debt crisis, have led
a number of States to reduce or freeze both their investment(-9.0%) and operating (-4.3%) transfers to local authorities. In2010, only investment grants fell (-6.5%), current grants were rela-
tively buoyant, on average, in Europe (+0.2%).
In 2011, grants and subsidies dropped in volume terms in half of
European countries (current grants in 17 countries and investment
grants in 15 countries). In Spain, transfers to subnational entitiesdropped the most in Europe (-30.3% in all), due to fiscal restraint and
Autonomous Community funding reform, which has been in full
effect since 2011 (See inset). The drop was also substantial (bet-
ween 5% and 12%) in Latvia, Ireland, Lithuania, Czech Republic,Italy, Slovenia and lastly the United Kingdom, as a result of dra-
conian fiscal consolidation. In Italy for instance, where three auste-rity plans succeeded one another in 2011 alone leading up to "SalvaItalia" (i.e. Save Italy), transfers to the entire local and regional publicsector dropped by around €8bn in 2011 compared with 2010, inclu-ding €4bn for regions and €2bn for municipalities and provinces. Inthe United Kingdom, it was decided to reduce the main operating
grant (i.e. the Formula Grant), by nearly 26%, over the period 2011
– 2014. Lastly, the drop was between 2% and 5% in four countries
including Romania, Bulgaria, the Netherlands (lower funds formunicipal and provincial funds) and France (freeze in the volume ofState financial assistance to local authorities, excluding the FCTVA,
i.e. the VAT compensation fund).
All countries did not have the same experience. In thirteen coun-tries, grants and subsidies to subnational entities increased in volume
terms in 2011. This occurred for several reasons:
• in some countries, central governments did not want to cut back
on assistance to local authorities as they found themselves in a
better budget situation. In addition some grants were comprised
of different taxes (e.g. Fonds communal de dotation financière inLuxembourg) or calculated based on indexes that performed well
with growth mechanisms that automatically increase budgets
(Belgium), the economic recovery also resulted in a budget
increase.
• European structural and cohesion funds partially compensated
reductions from the central government. Investment grant growth
remained strong, primarily in Central and Eastern European
countries (Hungary, Romania, Bulgaria, Estonia, Poland, etc.).In Romania, for instance, European funds accounted for 8% of
revenue in 2011 versus 4% in 2010.
• competencies continued to be transferred in 2011 (e.g. in Romaniain the area of healthcare or in the Netherlands for social issues)and resources ensued, although the principle of full financial
compensation of transfers continues to be debated;
• implementation of equalisation mechanisms was also able to
attenuate the effects of the crisis for the most at-risk municipali-
ties (Nordic countries, Austria, Germany, etc.);
• lastly, several central governments have explicitly opted to maintain
– or even temporarily increase their grants in order to make up
for lost tax revenue. In Sweden for example, where grants jumped
by 6% in volume in 2011, the government decided to allocate more
resources (by temporarily increasing their grants in 2010 and 2011)
to local authorities to help them cope with the crisis. In Germany,local authorities benefited from investment subsidies again as set
out in the law on future investments (Zukunftsinvestitionsgesetz)adopted in 2009 and ending in 2012, as well as temporary
assistance from the Länder.
Lastly, the particular case of Greece should be mentioned as grants
to local authorities rocketed 37.3% in volume – and even nearly 55%
for operating grants. This increase should be put in the context of
the Kallikratis reform which transferred new operating resources to
local authorities that had been given additional competencies in order
to compensate for sharply lower tax revenue and user charges.
Change in operating and investments grants of the subnational public sector in 2011 (as a % by volume vs. 2010)
EU 27
Netherlands
United Kingdom
Czech Republic
Slovenia
Austria
Belgium
Finland
Sweden
Greece
Denmark
Germany
Hungary
Poland
Slovakia
Lithuania
France
Cyprus
Luxembourg
Malta
Spain
Italy
Romania
Ireland
Latvia
Portugal
Estonia
Bulgaria
Investment Operating
+ 60
+ 50
+ 40
+ 30
+ 20
+ 10
0
- 10
- 20
- 30
- 40
- 50
- 60
Subnational public finance in the European Union | Dexia - CEMR | Summer 2012
17Revenue and taxation
Subparagraph 5 of Article 9 of the European charter of local self-government
encourages countries to set up solidarity and/or redistribution mecha-nisms to correct wealth and responsibility imbalances between the local
authorities and to foster a degree of equality. Although equalisation is now
recognised as a necessity in a growing number of countries (and in certain
countries such as Germany, Italy, Spain and France it has constitutional
force), the size of resources granted to reducing inequality varies tremen-
dously from one country to the next.
The practical methods for applying equalisation are also very diverse andinclude:
- vertical equalisation (redistribution by the State, or a level higher than the
local level, to local authorities) or horizontal equalisation (redistribution
between local authorities at the same level);
- upstream (i.e. up-front) equalisation (revenue) or downstream equalisation
(expenses or spending needs);
- tax equalisation vs. equalisation from general or ad hoc grants.
They are not mutually exclusive and mixed systems that combine different
types of equalisation are common. They also change quickly. They are often
the subject of technical and political debate, which has taken on greater
importance with the crisis – for example, in Germany – and as territorial
inequalities deepen; they are constantly being adjusted.
Let’s look at a few examples of recent reforms…
In Sweden, an audit of the equalisation system, which combines verticaland horizontal redistribution reformed in 2005, has been underway since
2008. The audit already resulted in an initial reform that went into effect
on 1 January 2012: streamlining the equalisation rate on tax resources at
115% for municipalities and counties. The cost equalisation grant, which
provides horizontal equalisation by levelling the playing field with regard
to the cost of services, is also expected to be reviewed in January 2013
aimed at simplifying the methods for evaluating cost disparities and impro-
ving transparency.
In Italy, a progressive horizontal equalisation mechanism between regionshas been in place since 2001. It is founded on equalisation of revenues and
expenditure needs (particularly public health spending). Tension surfaced
quickly between the North and the South of the country and it was deci-
ded, under Law 42 on federalism in March 2009, to reinforce equalisation
via a fund managed by the State. The fund guarantees the coverage of
essential public services (healthcare, education, social assistance) in regions
with low tax revenue. The funds allocated by the State will be calculated
based on standard cost, for each service based on expenditure in the region
that spends the least and no longer on what was spent the previous year
(i.e. the historical cost).
In Spain, the existing equalisation system was reformed as part of the 2009law on financing the Autonomous Communities. The goal is to guarantee a
minimum level of public service across the entire territory and to rebalance
the regions’ resources in order to avoid egregious inequalities from occurring.
Regarding the first point, a fund guaranteeing basic public services, three-
quarters of which will be funded by regional tax revenue and the remaining
quarter by the State, was set up to guarantee egalitarian funding per capita
across all regions. The principle of convergence between regions has been
maintained with the creation of two funds, which receive additional State
financing. The first is a Competitiveness fund that will be shared on an annual
basis by regions with low tax income. The second is a Cooperation fund that
favours regions that are relatively less rich and have a weaker demographic
dynamic.
In France, two main forms of equalisation coexist: vertical and horizontal.The latter is less developed but is gaining ground at present under the reform
of the business tax and, more broadly, the rethinking of public deficit, leading
to a freeze, in particular, of State grants to local authorities thus making
vertical equalisation more difficult to use than in the past. The vast overhaul
of tax reform was an opportunity for the government to set up new horizon-
tal equalisation mechanisms. They apply to the entire local public sector and
take effect over a period running from 2011 to 2016. During 2012, the
Equalisation fund for inter-municipal and municipal resources (FPIC) was imple-
mented. With a goal of redistributing 2% of tax revenues in 2016, it will be
more important than the other new equalisation mechanisms: the depart-
mental fund of equalisation of revenue from the transfer tax on property trans-
actions (droits de mutations) and the Equalisation funds of the revenue from
tax on businesses’ added value (CVAE) for the departments and regions. These
mechanisms are mainly based on taxes on municipalities in a better financial
position; this revenue is redistributed to municipalities that are considered
to have limited revenue or whose expenditure is constrained. An evaluation
of the effects of these measures, in an effort to adjust the mechanisms as
accurately as possible, is already being planned.
In the United Kingdom, the current equalisation system, founded on the
"Revenue Support Grant" is both a vertical and horizontal equalisation.
Deemed complex and lacking transparency, it is being reformed.
Consequently, the future business retention rate is expected to be calcula-
ted on the base of equalisation criteria.
Territorial inequalities and financial equalisation in Europe
Focus on a few recent or future comprehensive reforms for financing local authorities
Subnational public finance in the European Union | Dexia - CEMR | Summer 2012
18 Revenue and taxation
Spain: the reform of the regime for financing the Autonomous Communities(law 22/2009 from 18 December 2009), initiated before the crisis, has been
in full effect since 2011. It has multiple facets. The first consists of increa-
sing the financial autonomy of regions while increasing their tax revenue in
order to offset the drop in grants: the redistribution of shared national taxes
went from 33% to 50% for income tax and the VAT and from 40% to 58%
for the special taxes (tax on beverages, hydrocarbons, tobacco). The regions
also have greater leeway with these taxes (ceilings, exonerations, taxable
minimum, etc.). The two other facets aim to guarantee basic public ser-
vices and to improve the equalisation mechanisms of revenue (see inset on
equalisation). Moreover, the revision of the law on funding municipalities
and provinces, which had been postponed since the 2005 White paper, was
announced by the new government in order to improve the way in which
their competencies are financed, which would be re-evaluated, among other
revisions.
Italy: the law on financial federalism no. 42/2009 modifying the article 119of the Constitution is applied through eight decrees, which are expected to
be adopted before 2016. The objective is to replace a portion of State grants
with a share of national taxes and to reinforce the equalisation regarding
the calculation of State transfers (See inset on equalisation). Three decrees
were issued in 2010 concerning the attribution to the municipalities of a
portion of the State’s property ("public property federalism"), creation of a
legal status for "Rome Capital" and the definition of standard costs. In
March and May 2011, four decrees on municipal federalism, tax autonomy of
regions and provinces, equalisation funds for the South and the sanctions
system were issued. The process was however slowed by the economic and
public finance crisis and a number of the 70 concrete measures that have not
yet been adopted or implemented. Several tax measures were passed in 2011,
some of which were applied in 2012 on property taxation (See inset), the
increase of regional and municipal surtaxes on income tax and the reinforce-
ment of the fight against tax evasion.
Belgium: The 6th reform of the State, adopted on 11 October 2011, includes
the revision of the Special law relative to the financing of the federated
entities. It aims to devolve additional competencies and reinforce the tax
autonomy of federated entities and is slated to go into effect in 2014. It will
bolster the own-source revenue of regions and communities, to compensate
for the elimination of grants from the federal government. The regions
will be able to raise additional “enlarged” percentages of individual income
tax revenue (impôt sur les personnes physiques or IPP), i.e. €10.7bn (referenceyear 2012), or around 25% of IPP receipts. This "regionalisation" of the
personal income tax will be, in the future, the main revenue source of the
regions. Their tax competencies will also be increased regarding tax bases and
exonerations. The equalisation mechanism, called "national solidarity", was
maintained. A transition mechanism will also be set up for a period of ten years.
France: the business tax (taxe professionnelle) was abolished and its partialreplacement, the territorial economic contribution (CET), itself comprised of
a business real estate tax (CFE) and a tax on businesses’ added value (CVAE),
led to a broader overhaul of the local tax system. The creation of the CET
was joined by a flat-rate tax on companies in the electricity grid (IFER) and
by new national tax transfers (Special tax on insurance contracts, Tax on
commercial premises, etc.). Moreover, a kind of specialisation took place
through the transfer of tax responsibilities between subnational levels, which
led to less power in setting tax rates, particularly in regions and departments,
on the whole. The residence tax (taxe d’habitation) is now allocated to muni-
cipalities and inter-municipal entities and the tax on built property (taxe sur
le foncier bâti) has become more important for departments. Regions now
only have limited authority to set tax rates (on vehicle registration tax and
on marginal changes to the domestic tax on petroleum products (TIPP) whose
ceiling was increased, however).
This reform required direct funding by the State, in the form of extra grants,
and brought on the implementation of new “horizontal” equalisation
systems started in 2011 (See inset). With the new government elected in
May 2012, a new step in financial decentralisation was announced for 2013.
Portugal: a bill on local and regional finances has been on the table since2012. It would establish a multi-year budget plan, spell out expenditure
rules, budget balance and the debt by setting stricter debt limits and finally
it would give the State greater fiscal oversight. The regime governing
transfers from the State to local authorities will be reviewed as will
property taxation. The autonomous regions are expected to have their tax
power reduced with regard to exonerations.
United Kingdom: under the Localism reform, the British government
launched an in-depth review of the way in which local councils are funded.
The Local Government Finance Bill could be put to vote in 2013. The
stated goal is to do away with the government Formula grant and replace
it with more own resources, anchored by the Council Tax and the business
rates for which the local authorities currently have no leeway. Local autho-
rities would also keep part of the revenue from these two taxes according
to the principle of "localisation" and "fair return" but with an equalisation
mechanism. Also, in England a reform is underway of social housing (HRA)
funding, which would give local authorities control of social housing and
revenues from rents. In exchange, local authorities would also take on the
debt of social housing bodies.
The Scottish Parliament will be endowed with taxation powers starting
April 2015, with two taxes that will be delegated to it (law on property
transactions and tax on use of waste management facilities). A regional
income surtax will go into effect starting April 2016.
Germany: in 2010, the federal government charged a "Municipal finance
commission" (Gemeindefinanzkommission) with drafting proposals for
restructuring local authority funding. It focused most of its efforts on
streamlining charges weighing on local authorities in order to reduce
the widening gap between competencies provided and available resources,
to re-examine “standards” and abolishing the business tax, which was
deemed too sensitive to economic fluctuation and therefore a source of
instability for local budgets. Upon finishing its work in June 2011, an
agreement on replacing this tax had not been found. However, following
the commission’s work, the federal government accepted to ease the rising
cost of social expenditure by gradually taking on basic services linked to
the ageing population and unemployment (15% in 2011 the 45% in 2012,
75% in 2013 and 100% in 2014).
Czech Republic: a reform is being discussed that would modify the redis-tribution system of the three shared taxes (personal and corporate income
taxes, VAT) from 2013 in order to augment these taxes as a percentage of
total local revenue (and drop the percentage of grants) and also reduce
revenue disparities between local authorities. This would result in an increase
in the shared tax revenue of small municipalities to the detriment of
municipalities in cities. This would be offset by (over a transitional period
to 2017) State grants.
Slovakia: Slovakia wishes to change its local authority funding model by
introducing a mixed-tax system (today, shared taxation comes entirely from
personal income tax). In 2011, the government proposed sharing several
taxes by adding to income tax, business tax, VAT and consumption taxes.
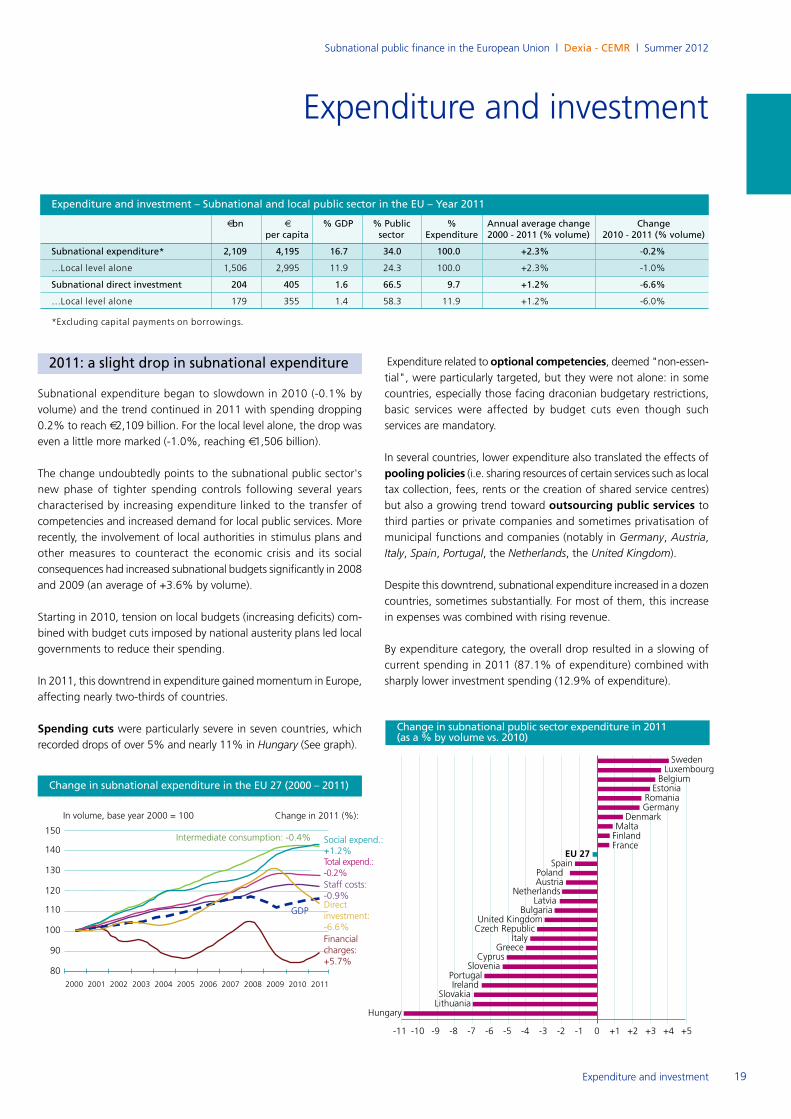
Subnational public finance in the European Union | Dexia - CEMR | Summer 2012
Expenditure and investment
Expenditure and investment – Subnational and local public sector in the EU – Year 2011
2011: a slight drop in subnational expenditure
Subnational expenditure began to slowdown in 2010 (-0.1% by
volume) and the trend continued in 2011 with spending dropping
0.2% to reach €2,109 billion. For the local level alone, the drop waseven a little more marked (-1.0%, reaching €1,506 billion).
The change undoubtedly points to the subnational public sector's
new phase of tighter spending controls following several years
characterised by increasing expenditure linked to the transfer of
competencies and increased demand for local public services. More
recently, the involvement of local authorities in stimulus plans and
other measures to counteract the economic crisis and its social
consequences had increased subnational budgets significantly in 2008
and 2009 (an average of +3.6% by volume).
Starting in 2010, tension on local budgets (increasing deficits) com-
bined with budget cuts imposed by national austerity plans led local
governments to reduce their spending.
In 2011, this downtrend in expenditure gained momentum in Europe,
affecting nearly two-thirds of countries.
Spending cuts were particularly severe in seven countries, which recorded drops of over 5% and nearly 11% in Hungary (See graph).
Expenditure related to optional competencies, deemed "non-essen-tial", were particularly targeted, but they were not alone: in some
countries, especially those facing draconian budgetary restrictions,
basic services were affected by budget cuts even though such
services are mandatory.
In several countries, lower expenditure also translated the effects of
pooling policies (i.e. sharing resources of certain services such as localtax collection, fees, rents or the creation of shared service centres)
but also a growing trend toward outsourcing public services tothird parties or private companies and sometimes privatisation of
municipal functions and companies (notably in Germany, Austria,Italy, Spain, Portugal, the Netherlands, the United Kingdom).
Despite this downtrend, subnational expenditure increased in a dozen
countries, sometimes substantially. For most of them, this increase
in expenses was combined with rising revenue.
By expenditure category, the overall drop resulted in a slowing of
current spending in 2011 (87.1% of expenditure) combined with
sharply lower investment spending (12.9% of expenditure).
€bn € % GDP % Public % Annual average change Change per capita sector Expenditure 2000 - 2011 (% volume) 2010 - 2011 (% volume)
Subnational expenditure* 2,109 4,195 16.7 34.0 100.0 +2.3% -0.2%
…Local level alone 1,506 2,995 11.9 24.3 100.0 +2.3% -1.0%
Subnational direct investment 204 405 1.6 66.5 9.7 +1.2% -6.6%
…Local level alone 179 355 1.4 58.3 11.9 +1.2% -6.0%
*Excluding capital payments on borrowings.
Change in subnational public sector expenditure in 2011 (as a % by volume vs. 2010)
-11 -10 -9 -8 -7 -6 -5 -4 -3 -2 -1 0 +1 +2 +3 +4 +5
Netherlands
United KingdomCzech Republic
Slovenia
Austria
Belgium
Finland
Sweden
DenmarkGermany
Poland
SlovakiaLithuania
France
Cyprus
Luxembourg
Spain
Latvia
Portugal
Greece
Change in subnational expenditure in the EU 27 (2000 – 2011)
In volume, base year 2000 = 100
150
140
130
120
110
100
90
802000 2001 2002 2003 2004 2005 2006 2007 2008 2009 2010 2011
Intermediate consumption: -0.4% Social expend.: +1.2%Total expend.: -0.2%
Direct investment: -6.6%
Staff costs: -0.9%
GDP
Financialcharges: +5.7%
Change in 2011 (%):
Hungary
EU 27
Malta
Italy
Romania
Ireland
Estonia
Bulgaria
Expenditure and investment 19
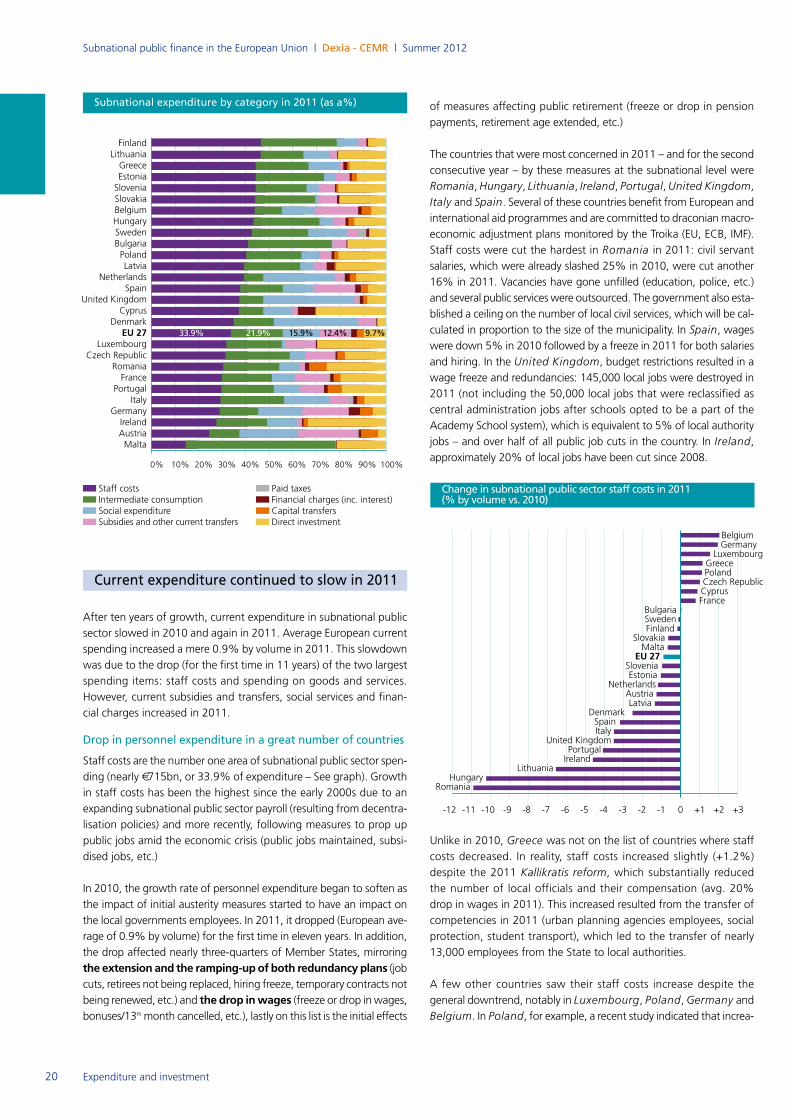
Current expenditure continued to slow in 2011
After ten years of growth, current expenditure in subnational public
sector slowed in 2010 and again in 2011. Average European current
spending increased a mere 0.9% by volume in 2011. This slowdown
was due to the drop (for the first time in 11 years) of the two largest
spending items: staff costs and spending on goods and services.
However, current subsidies and transfers, social services and finan-
cial charges increased in 2011.
Drop in personnel expenditure in a great number of countries
Staff costs are the number one area of subnational public sector spen-
ding (nearly €715bn, or 33.9% of expenditure – See graph). Growth
in staff costs has been the highest since the early 2000s due to an
expanding subnational public sector payroll (resulting from decentra-
lisation policies) and more recently, following measures to prop up
public jobs amid the economic crisis (public jobs maintained, subsi-
dised jobs, etc.)
In 2010, the growth rate of personnel expenditure began to soften as
the impact of initial austerity measures started to have an impact on
the local governments employees. In 2011, it dropped (European ave-
rage of 0.9% by volume) for the first time in eleven years. In addition,
the drop affected nearly three-quarters of Member States, mirroring
the extension and the ramping-up of both redundancy plans (jobcuts, retirees not being replaced, hiring freeze, temporary contracts not
being renewed, etc.) and the drop in wages (freeze or drop in wages,bonuses/13th month cancelled, etc.), lastly on this list is the initial effects
of measures affecting public retirement (freeze or drop in pension
payments, retirement age extended, etc.)
The countries that were most concerned in 2011 – and for the second
consecutive year – by these measures at the subnational level were
Romania, Hungary, Lithuania, Ireland, Portugal, United Kingdom,
Italy and Spain. Several of these countries benefit from European andinternational aid programmes and are committed to draconian macro-
economic adjustment plans monitored by the Troika (EU, ECB, IMF).
Staff costs were cut the hardest in Romania in 2011: civil servant
salaries, which were already slashed 25% in 2010, were cut another
16% in 2011. Vacancies have gone unfilled (education, police, etc.)
and several public services were outsourced. The government also esta-
blished a ceiling on the number of local civil services, which will be cal-
culated in proportion to the size of the municipality. In Spain, wageswere down 5% in 2010 followed by a freeze in 2011 for both salaries
and hiring. In the United Kingdom, budget restrictions resulted in a
wage freeze and redundancies: 145,000 local jobs were destroyed in
2011 (not including the 50,000 local jobs that were reclassified as
central administration jobs after schools opted to be a part of the
Academy School system), which is equivalent to 5% of local authority
jobs – and over half of all public job cuts in the country. In Ireland,approximately 20% of local jobs have been cut since 2008.
Unlike in 2010, Greece was not on the list of countries where staff
costs decreased. In reality, staff costs increased slightly (+1.2%)
despite the 2011 Kallikratis reform, which substantially reduced
the number of local officials and their compensation (avg. 20%
drop in wages in 2011). This increased resulted from the transfer of
competencies in 2011 (urban planning agencies employees, social
protection, student transport), which led to the transfer of nearly
13,000 employees from the State to local authorities.
A few other countries saw their staff costs increase despite the
general downtrend, notably in Luxembourg, Poland, Germany andBelgium. In Poland, for example, a recent study indicated that increa-
Subnational public finance in the European Union | Dexia - CEMR | Summer 2012
20 Expenditure and investment
Change in subnational public sector staff costs in 2011(% by volume vs. 2010)
-12 -11 -10 -9 -8 -7 -6 -4 -3 -2 -1-5 0 +1 +2 +3
EU 27
Netherlands
United Kingdom
Czech Republic
Slovenia
Austria
Belgium
FinlandSweden
Denmark
Germany
Hungary
FranceCyprus
Luxembourg
Malta
SpainItaly
Romania
Ireland
Latvia
Portugal
Estonia
Greece
Bulgaria
Poland
Slovakia
Lithuania
Subnational expenditure by category in 2011 (as a%)
Denmark
France
Finland
Latvia
Germany
Sweden
Luxembourg
Poland
Lithuania
Cyprus
HungaryBelgium
Ireland
United Kingdom
Romania
Netherlands
Bulgaria
Malta
Staff costsIntermediate consumptionSocial expenditureSubsidies and other current transfers
Paid taxesFinancial charges (inc. interest)Capital transfersDirect investment
Austria
GreeceEstoniaSloveniaSlovakia
ItalyPortugal
EU 27
Spain
Czech Republic
0% 10% 20% 30% 40% 50% 60% 70% 80% 90% 100%
33.9% 21.9% 15.9% 12.4% 9.7%
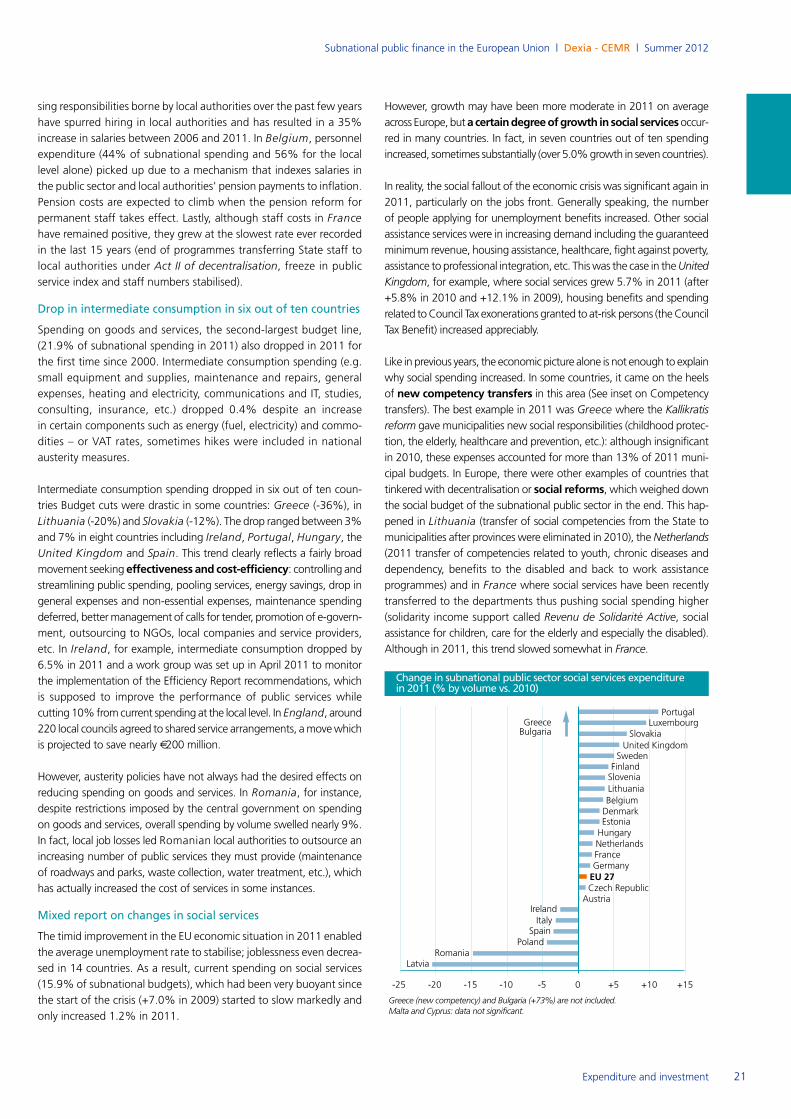
Subnational public finance in the European Union | Dexia - CEMR | Summer 2012
21Expenditure and investment
sing responsibilities borne by local authorities over the past few years
have spurred hiring in local authorities and has resulted in a 35%
increase in salaries between 2006 and 2011. In Belgium, personnel
expenditure (44% of subnational spending and 56% for the local
level alone) picked up due to a mechanism that indexes salaries in
the public sector and local authorities' pension payments to inflation.
Pension costs are expected to climb when the pension reform for
permanent staff takes effect. Lastly, although staff costs in Francehave remained positive, they grew at the slowest rate ever recorded
in the last 15 years (end of programmes transferring State staff to
local authorities under Act II of decentralisation, freeze in public service index and staff numbers stabilised).
Drop in intermediate consumption in six out of ten countries
Spending on goods and services, the second-largest budget line,
(21.9% of subnational spending in 2011) also dropped in 2011 for
the first time since 2000. Intermediate consumption spending (e.g.
small equipment and supplies, maintenance and repairs, general
expenses, heating and electricity, communications and IT, studies,
consulting, insurance, etc.) dropped 0.4% despite an increase
in certain components such as energy (fuel, electricity) and commo-
dities – or VAT rates, sometimes hikes were included in national
austerity measures.
Intermediate consumption spending dropped in six out of ten coun-
tries Budget cuts were drastic in some countries: Greece (-36%), in
Lithuania (-20%) and Slovakia (-12%). The drop ranged between 3%
and 7% in eight countries including Ireland, Portugal, Hungary, theUnited Kingdom and Spain. This trend clearly reflects a fairly broadmovement seeking effectiveness and cost-efficiency: controlling andstreamlining public spending, pooling services, energy savings, drop in
general expenses and non-essential expenses, maintenance spending
deferred, better management of calls for tender, promotion of e-govern-
ment, outsourcing to NGOs, local companies and service providers,
etc. In Ireland, for example, intermediate consumption dropped by6.5% in 2011 and a work group was set up in April 2011 to monitor
the implementation of the Efficiency Report recommendations, which
is supposed to improve the performance of public services while
cutting 10% from current spending at the local level. In England, around220 local councils agreed to shared service arrangements, a move which
is projected to save nearly €200 million.
However, austerity policies have not always had the desired effects on
reducing spending on goods and services. In Romania, for instance,despite restrictions imposed by the central government on spending
on goods and services, overall spending by volume swelled nearly 9%.
In fact, local job losses led Romanian local authorities to outsource an
increasing number of public services they must provide (maintenance
of roadways and parks, waste collection, water treatment, etc.), which
has actually increased the cost of services in some instances.
Mixed report on changes in social services
The timid improvement in the EU economic situation in 2011 enabled
the average unemployment rate to stabilise; joblessness even decrea-
sed in 14 countries. As a result, current spending on social services
(15.9% of subnational budgets), which had been very buoyant since
the start of the crisis (+7.0% in 2009) started to slow markedly and
only increased 1.2% in 2011.
However, growth may have been more moderate in 2011 on average
across Europe, but acertain degree of growth in social servicesoccur-red in many countries. In fact, in seven countries out of ten spending
increased, sometimes substantially (over 5.0% growth in seven countries).
In reality, the social fallout of the economic crisis was significant again in
2011, particularly on the jobs front. Generally speaking, the number
of people applying for unemployment benefits increased. Other social
assistance services were in increasing demand including the guaranteed
minimum revenue, housing assistance, healthcare, fight against poverty,
assistance to professional integration, etc. This was the case in the UnitedKingdom, for example, where social services grew 5.7% in 2011 (after
+5.8% in 2010 and +12.1% in 2009), housing benefits and spending
related to Council Tax exonerations granted to at-risk persons (the Council
Tax Benefit) increased appreciably.
Like in previous years, the economic picture alone is not enough to explain
why social spending increased. In some countries, it came on the heels
of new competency transfers in this area (See inset on Competencytransfers). The best example in 2011 was Greece where the Kallikratisreform gave municipalities new social responsibilities (childhood protec-
tion, the elderly, healthcare and prevention, etc.): although insignificant
in 2010, these expenses accounted for more than 13% of 2011 muni-
cipal budgets. In Europe, there were other examples of countries that
tinkered with decentralisation or social reforms, which weighed downthe social budget of the subnational public sector in the end. This hap-
pened in Lithuania (transfer of social competencies from the State to
municipalities after provinces were eliminated in 2010), the Netherlands(2011 transfer of competencies related to youth, chronic diseases and
dependency, benefits to the disabled and back to work assistance
programmes) and in France where social services have been recently
transferred to the departments thus pushing social spending higher
(solidarity income support called Revenu de Solidarité Active, social assistance for children, care for the elderly and especially the disabled).
Although in 2011, this trend slowed somewhat in France.
Change in subnational public sector social services expenditure in 2011 (% by volume vs. 2010)
-20-25 -15 -10 -5 0 +5 +10 +15
EU 27
Netherlands
United Kingdom
Czech Republic
Slovenia
Austria
Belgium
FinlandSweden
Denmark
Germany
Hungary
Poland
Slovakia
Lithuania
France
Luxembourg
SpainItaly
Romania
Ireland
Latvia
Portugal
Estonia
GreeceBulgaria
Greece (new competency) and Bulgaria (+73%) are not included.Malta and Cyprus: data not significant.
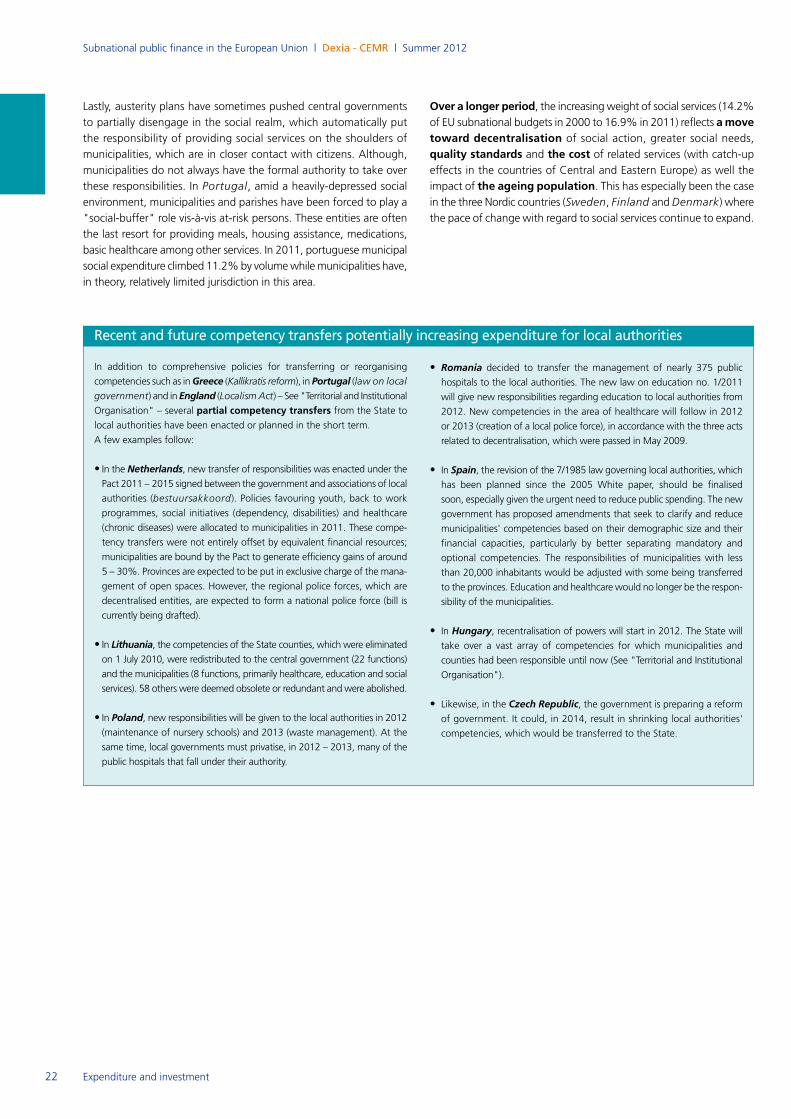
Subnational public finance in the European Union | Dexia - CEMR | Summer 2012
22 Expenditure and investment
Lastly, austerity plans have sometimes pushed central governments
to partially disengage in the social realm, which automatically put
the responsibility of providing social services on the shoulders of
municipalities, which are in closer contact with citizens. Although,
municipalities do not always have the formal authority to take over
these responsibilities. In Portugal, amid a heavily-depressed social
environment, municipalities and parishes have been forced to play a
"social-buffer" role vis-à-vis at-risk persons. These entities are often
the last resort for providing meals, housing assistance, medications,
basic healthcare among other services. In 2011, portuguese municipal
social expenditure climbed 11.2% by volume while municipalities have,
in theory, relatively limited jurisdiction in this area.
Over a longer period, the increasing weight of social services (14.2%of EU subnational budgets in 2000 to 16.9% in 2011) reflects a movetoward decentralisation of social action, greater social needs,
quality standards and the cost of related services (with catch-upeffects in the countries of Central and Eastern Europe) as well the
impact of the ageing population. This has especially been the casein the three Nordic countries (Sweden, Finland and Denmark) wherethe pace of change with regard to social services continue to expand.
In addition to comprehensive policies for transferring or reorganising
competencies such as in Greece (Kallikratis reform), in Portugal (law on local
government) and in England (Localism Act) – See "Territorial and Institutional
Organisation" – several partial competency transfers from the State tolocal authorities have been enacted or planned in the short term.
A few examples follow:
• In the Netherlands, new transfer of responsibilities was enacted under thePact 2011 – 2015 signed between the government and associations of local
authorities (bestuursakkoord). Policies favouring youth, back to work
programmes, social initiatives (dependency, disabilities) and healthcare
(chronic diseases) were allocated to municipalities in 2011. These compe-
tency transfers were not entirely offset by equivalent financial resources;
municipalities are bound by the Pact to generate efficiency gains of around
5 – 30%. Provinces are expected to be put in exclusive charge of the mana-
gement of open spaces. However, the regional police forces, which are
decentralised entities, are expected to form a national police force (bill is
currently being drafted).
• In Lithuania, the competencies of the State counties, which were eliminatedon 1 July 2010, were redistributed to the central government (22 functions)
and the municipalities (8 functions, primarily healthcare, education and social
services). 58 others were deemed obsolete or redundant and were abolished.
• In Poland, new responsibilities will be given to the local authorities in 2012(maintenance of nursery schools) and 2013 (waste management). At the
same time, local governments must privatise, in 2012 – 2013, many of the
public hospitals that fall under their authority.
• Romania decided to transfer the management of nearly 375 public
hospitals to the local authorities. The new law on education no. 1/2011
will give new responsibilities regarding education to local authorities from
2012. New competencies in the area of healthcare will follow in 2012
or 2013 (creation of a local police force), in accordance with the three acts
related to decentralisation, which were passed in May 2009.
• In Spain, the revision of the 7/1985 law governing local authorities, whichhas been planned since the 2005 White paper, should be finalised
soon, especially given the urgent need to reduce public spending. The new
government has proposed amendments that seek to clarify and reduce
municipalities' competencies based on their demographic size and their
financial capacities, particularly by better separating mandatory and
optional competencies. The responsibilities of municipalities with less
than 20,000 inhabitants would be adjusted with some being transferred
to the provinces. Education and healthcare would no longer be the respon-
sibility of the municipalities.
• In Hungary, recentralisation of powers will start in 2012. The State will take over a vast array of competencies for which municipalities and
counties had been responsible until now (See "Territorial and Institutional
Organisation").
• Likewise, in the Czech Republic, the government is preparing a reformof government. It could, in 2014, result in shrinking local authorities'
competencies, which would be transferred to the State.
Recent and future competency transfers potentially increasing expenditure for local authorities
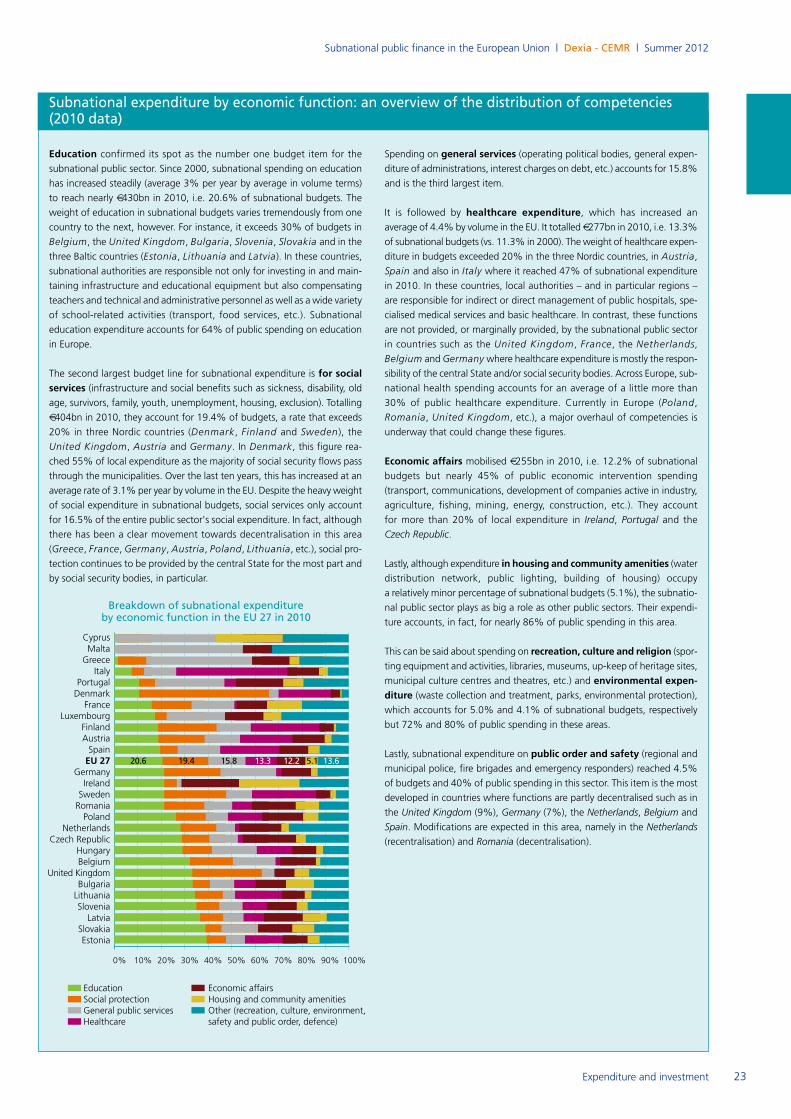
Subnational public finance in the European Union | Dexia - CEMR | Summer 2012
23Expenditure and investment
Education confirmed its spot as the number one budget item for the
subnational public sector. Since 2000, subnational spending on education
has increased steadily (average 3% per year by average in volume terms)
to reach nearly €430bn in 2010, i.e. 20.6% of subnational budgets. The
weight of education in subnational budgets varies tremendously from one
country to the next, however. For instance, it exceeds 30% of budgets in
Belgium, the United Kingdom, Bulgaria, Slovenia, Slovakia and in the
three Baltic countries (Estonia, Lithuania and Latvia). In these countries,
subnational authorities are responsible not only for investing in and main-
taining infrastructure and educational equipment but also compensating
teachers and technical and administrative personnel as well as a wide variety
of school-related activities (transport, food services, etc.). Subnational
education expenditure accounts for 64% of public spending on education
in Europe.
The second largest budget line for subnational expenditure is for socialservices (infrastructure and social benefits such as sickness, disability, oldage, survivors, family, youth, unemployment, housing, exclusion). Totalling
€404bn in 2010, they account for 19.4% of budgets, a rate that exceeds
20% in three Nordic countries (Denmark, Finland and Sweden), the
United Kingdom, Austria and Germany. In Denmark, this figure rea-
ched 55% of local expenditure as the majority of social security flows pass
through the municipalities. Over the last ten years, this has increased at an
average rate of 3.1% per year by volume in the EU. Despite the heavy weight
of social expenditure in subnational budgets, social services only account
for 16.5% of the entire public sector's social expenditure. In fact, although
there has been a clear movement towards decentralisation in this area
(Greece, France, Germany, Austria, Poland, Lithuania, etc.), social pro-
tection continues to be provided by the central State for the most part and
by social security bodies, in particular.
Spending on general services (operating political bodies, general expen-diture of administrations, interest charges on debt, etc.) accounts for 15.8%
and is the third largest item.
It is followed by healthcare expenditure, which has increased an average of 4.4% by volume in the EU. It totalled €277bn in 2010, i.e. 13.3%of subnational budgets (vs. 11.3% in 2000). The weight of healthcare expen-
diture in budgets exceeded 20% in the three Nordic countries, in Austria,
Spain and also in Italy where it reached 47% of subnational expenditure
in 2010. In these countries, local authorities – and in particular regions –
are responsible for indirect or direct management of public hospitals, spe-
cialised medical services and basic healthcare. In contrast, these functions
are not provided, or marginally provided, by the subnational public sector
in countries such as the United Kingdom, France, the Netherlands,
Belgium and Germany where healthcare expenditure is mostly the respon-
sibility of the central State and/or social security bodies. Across Europe, sub-
national health spending accounts for an average of a little more than
30% of public healthcare expenditure. Currently in Europe (Poland,
Romania, United Kingdom, etc.), a major overhaul of competencies is
underway that could change these figures.
Economic affairs mobilised €255bn in 2010, i.e. 12.2% of subnational
budgets but nearly 45% of public economic intervention spending
(transport, communications, development of companies active in industry,
agriculture, fishing, mining, energy, construction, etc.). They account
for more than 20% of local expenditure in Ireland, Portugal and the
Czech Republic.
Lastly, although expenditure in housing and community amenities (waterdistribution network, public lighting, building of housing) occupy
a relatively minor percentage of subnational budgets (5.1%), the subnatio-
nal public sector plays as big a role as other public sectors. Their expendi-
ture accounts, in fact, for nearly 86% of public spending in this area.
This can be said about spending on recreation, culture and religion (spor-ting equipment and activities, libraries, museums, up-keep of heritage sites,
municipal culture centres and theatres, etc.) and environmental expen-diture (waste collection and treatment, parks, environmental protection),which accounts for 5.0% and 4.1% of subnational budgets, respectively
but 72% and 80% of public spending in these areas.
Lastly, subnational expenditure on public order and safety (regional andmunicipal police, fire brigades and emergency responders) reached 4.5%
of budgets and 40% of public spending in this sector. This item is the most
developed in countries where functions are partly decentralised such as in
the United Kingdom (9%), Germany (7%), the Netherlands, Belgium and
Spain. Modifications are expected in this area, namely in the Netherlands
(recentralisation) and Romania (decentralisation).
Subnational expenditure by economic function: an overview of the distribution of competencies (2010 data)
Breakdown of subnational expenditure by economic function in the EU 27 in 2010
DenmarkFrance
Finland
Latvia
Germany
Sweden
Luxembourg
Poland
Lithuania
Cyprus
HungaryBelgium
Ireland
United Kingdom
Romania
Netherlands
Bulgaria
Malta
Education Economic affairsSocial protection Housing and community amenitiesGeneral public services Other (recreation, culture, environment,Healthcare safety and public order, defence)
Austria
Greece
Estonia
Slovenia
Slovakia
ItalyPortugal
EU 27Spain
Czech Republic
0% 10% 20% 30% 40% 50% 60% 70% 80% 90% 100%
20.6 19.4 15.8 13.3 12.2 5.1 13.6
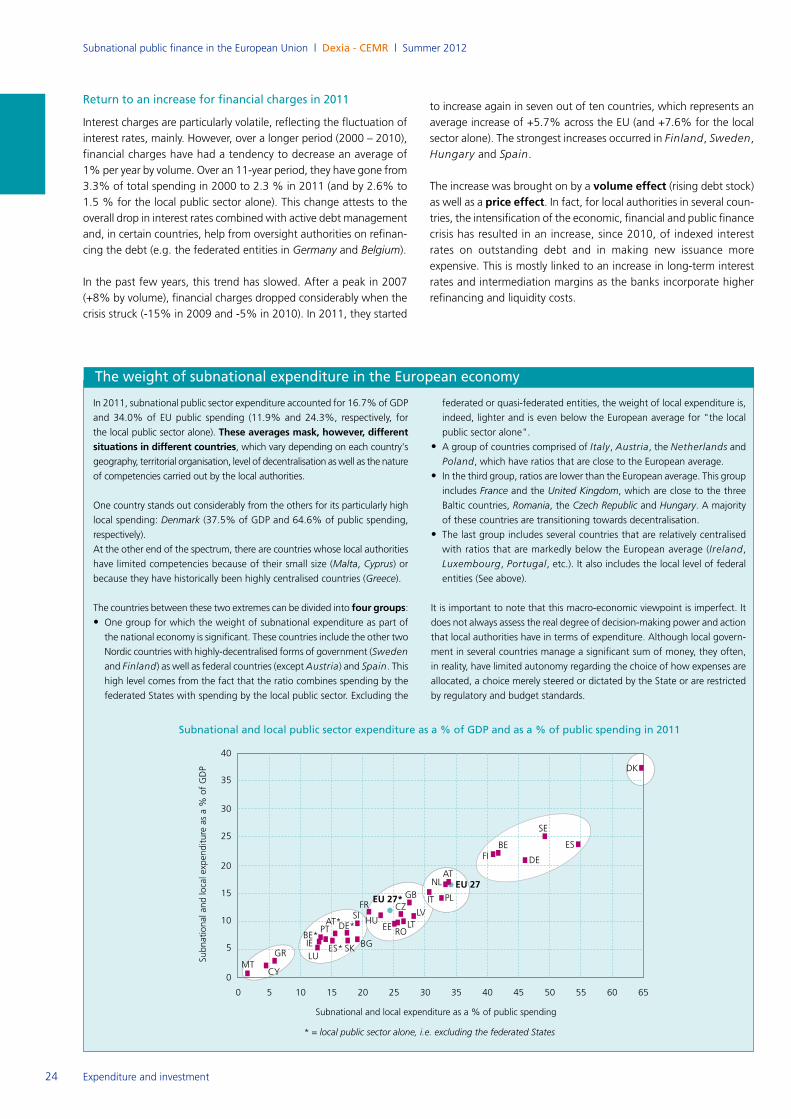
Subnational public finance in the European Union | Dexia - CEMR | Summer 2012
24 Expenditure and investment
Return to an increase for financial charges in 2011
Interest charges are particularly volatile, reflecting the fluctuation of
interest rates, mainly. However, over a longer period (2000 – 2010),
financial charges have had a tendency to decrease an average of
1% per year by volume. Over an 11-year period, they have gone from
3.3% of total spending in 2000 to 2.3 % in 2011 (and by 2.6% to
1.5 % for the local public sector alone). This change attests to the
overall drop in interest rates combined with active debt management
and, in certain countries, help from oversight authorities on refinan-
cing the debt (e.g. the federated entities in Germany and Belgium).
In the past few years, this trend has slowed. After a peak in 2007
(+8% by volume), financial charges dropped considerably when the
crisis struck (-15% in 2009 and -5% in 2010). In 2011, they started
to increase again in seven out of ten countries, which represents an
average increase of +5.7% across the EU (and +7.6% for the local
sector alone). The strongest increases occurred in Finland, Sweden,Hungary and Spain.
The increase was brought on by a volume effect (rising debt stock)as well as a price effect. In fact, for local authorities in several coun-tries, the intensification of the economic, financial and public finance
crisis has resulted in an increase, since 2010, of indexed interest
rates on outstanding debt and in making new issuance more
expensive. This is mostly linked to an increase in long-term interest
rates and intermediation margins as the banks incorporate higher
refinancing and liquidity costs.
The weight of subnational expenditure in the European economy
LUIE
PT
40
35
30
25
20
15
10
5
0
0 5 10 15 20 25 30 35 45 5540 50 60 65
Subnational and local expenditure as a % of public spending
Subnational and local expenditure as a % of GDP
CY
GRMT
BGSK
SIFR
ROHU
GB ITLV
CZ
LTEE
PL
EU 27NLAT
DEFIBE
SE
ES
DK
BE*
AT*DE*
EU 27*
* = local public sector alone, i.e. excluding the federated States
ES*
Subnational and local public sector expenditure as a % of GDP and as a % of public spending in 2011
In 2011, subnational public sector expenditure accounted for 16.7% of GDP
and 34.0% of EU public spending (11.9% and 24.3%, respectively, for
the local public sector alone). These averages mask, however, different situations in different countries, which vary depending on each country'sgeography, territorial organisation, level of decentralisation as well as the nature
of competencies carried out by the local authorities.
One country stands out considerably from the others for its particularly high
local spending: Denmark (37.5% of GDP and 64.6% of public spending,
respectively).
At the other end of the spectrum, there are countries whose local authorities
have limited competencies because of their small size (Malta, Cyprus) or
because they have historically been highly centralised countries (Greece).
The countries between these two extremes can be divided into four groups: • One group for which the weight of subnational expenditure as part of
the national economy is significant. These countries include the other two
Nordic countries with highly-decentralised forms of government (Sweden
and Finland) as well as federal countries (except Austria) and Spain. This
high level comes from the fact that the ratio combines spending by the
federated States with spending by the local public sector. Excluding the
federated or quasi-federated entities, the weight of local expenditure is,
indeed, lighter and is even below the European average for "the local
public sector alone".
• A group of countries comprised of Italy, Austria, the Netherlands and
Poland, which have ratios that are close to the European average.
• In the third group, ratios are lower than the European average. This group
includes France and the United Kingdom, which are close to the three
Baltic countries, Romania, the Czech Republic and Hungary. A majority
of these countries are transitioning towards decentralisation.
• The last group includes several countries that are relatively centralised
with ratios that are markedly below the European average (Ireland,
Luxembourg, Portugal, etc.). It also includes the local level of federal
entities (See above).
It is important to note that this macro-economic viewpoint is imperfect. It
does not always assess the real degree of decision-making power and action
that local authorities have in terms of expenditure. Although local govern-
ment in several countries manage a significant sum of money, they often,
in reality, have limited autonomy regarding the choice of how expenses are
allocated, a choice merely steered or dictated by the State or are restricted
by regulatory and budget standards.
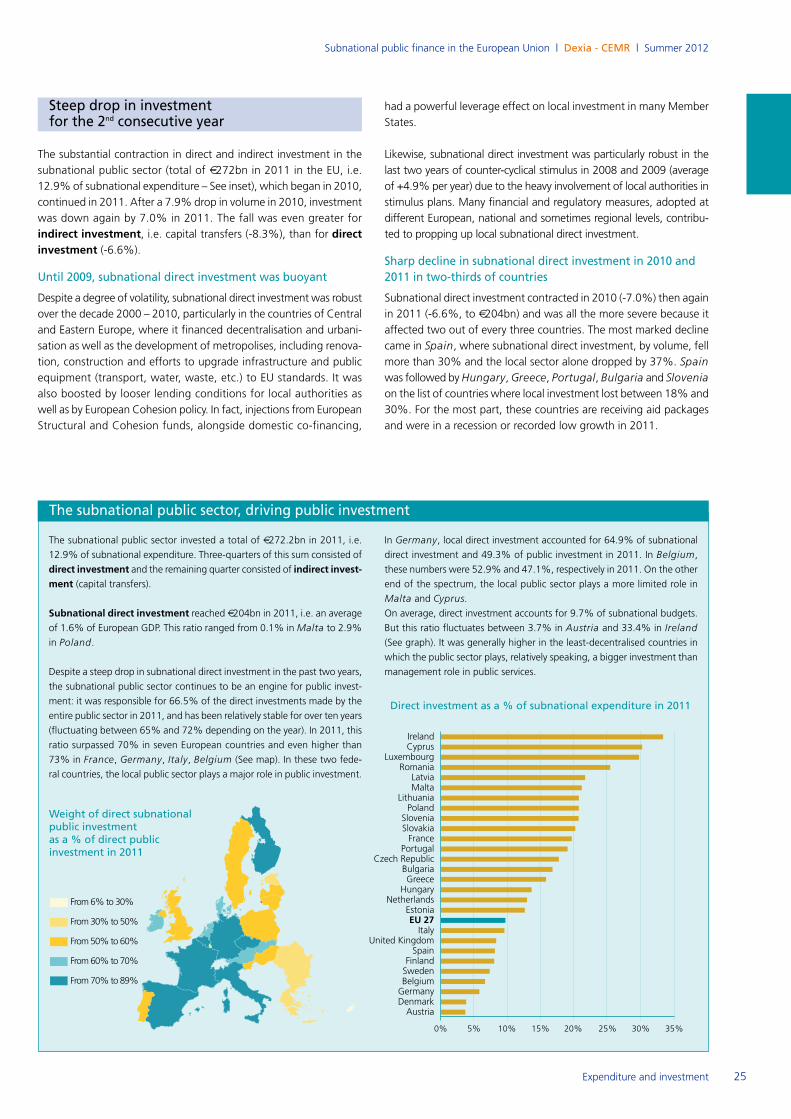
Subnational public finance in the European Union | Dexia - CEMR | Summer 2012
25
Steep drop in investment for the 2nd consecutive year
The substantial contraction in direct and indirect investment in the
subnational public sector (total of €272bn in 2011 in the EU, i.e.12.9% of subnational expenditure – See inset), which began in 2010,
continued in 2011. After a 7.9% drop in volume in 2010, investment
was down again by 7.0% in 2011. The fall was even greater for
indirect investment, i.e. capital transfers (-8.3%), than for direct investment (-6.6%).
Until 2009, subnational direct investment was buoyant
Despite a degree of volatility, subnational direct investment was robust
over the decade 2000 – 2010, particularly in the countries of Central
and Eastern Europe, where it financed decentralisation and urbani-
sation as well as the development of metropolises, including renova-
tion, construction and efforts to upgrade infrastructure and public
equipment (transport, water, waste, etc.) to EU standards. It was
also boosted by looser lending conditions for local authorities as
well as by European Cohesion policy. In fact, injections from European
Structural and Cohesion funds, alongside domestic co-financing,
had a powerful leverage effect on local investment in many Member
States.
Likewise, subnational direct investment was particularly robust in the
last two years of counter-cyclical stimulus in 2008 and 2009 (average
of +4.9% per year) due to the heavy involvement of local authorities in
stimulus plans. Many financial and regulatory measures, adopted at
different European, national and sometimes regional levels, contribu-
ted to propping up local subnational direct investment.
Sharp decline in subnational direct investment in 2010 and2011 in two-thirds of countries
Subnational direct investment contracted in 2010 (-7.0%) then again
in 2011 (-6.6%, to €204bn) and was all the more severe because itaffected two out of every three countries. The most marked decline
came in Spain, where subnational direct investment, by volume, fellmore than 30% and the local sector alone dropped by 37%. Spainwas followed by Hungary, Greece, Portugal, Bulgaria and Sloveniaon the list of countries where local investment lost between 18% and
30%. For the most part, these countries are receiving aid packages
and were in a recession or recorded low growth in 2011.
The subnational public sector invested a total of €272.2bn in 2011, i.e.12.9% of subnational expenditure. Three-quarters of this sum consisted of
direct investment and the remaining quarter consisted of indirect invest-ment (capital transfers).
Subnational direct investment reached €204bn in 2011, i.e. an averageof 1.6% of European GDP. This ratio ranged from 0.1% in Malta to 2.9%
in Poland.
Despite a steep drop in subnational direct investment in the past two years,
the subnational public sector continues to be an engine for public invest-
ment: it was responsible for 66.5% of the direct investments made by the
entire public sector in 2011, and has been relatively stable for over ten years
(fluctuating between 65% and 72% depending on the year). In 2011, this
ratio surpassed 70% in seven European countries and even higher than
73% in France, Germany, Italy, Belgium (See map). In these two fede-
ral countries, the local public sector plays a major role in public investment.
In Germany, local direct investment accounted for 64.9% of subnational
direct investment and 49.3% of public investment in 2011. In Belgium,
these numbers were 52.9% and 47.1%, respectively in 2011. On the other
end of the spectrum, the local public sector plays a more limited role in
Malta and Cyprus.
On average, direct investment accounts for 9.7% of subnational budgets.
But this ratio fluctuates between 3.7% in Austria and 33.4% in Ireland
(See graph). It was generally higher in the least-decentralised countries in
which the public sector plays, relatively speaking, a bigger investment than
management role in public services.
The subnational public sector, driving public investment
Direct investment as a % of subnational expenditure in 2011
0% 5% 10% 15% 20% 25% 30% 35%
Poland
Denmark
Slovakia
Ireland
EU 27
Finland
Netherlands
Latvia
Czech Republic
Spain
Austria
France
Italy
GermanyBelgium
Slovenia
Hungary
Lithuania
Sweden
United Kingdom
Estonia
Romania
Portugal
Luxembourg
BulgariaGreece
Cyprus
Malta
From 6% to 30%
From 30% to 50%
From 50% to 60%
From 60% to 70%
From 70% to 89%
Weight of direct subnationalpublic investment as a % of direct publicinvestment in 2011
Expenditure and investment
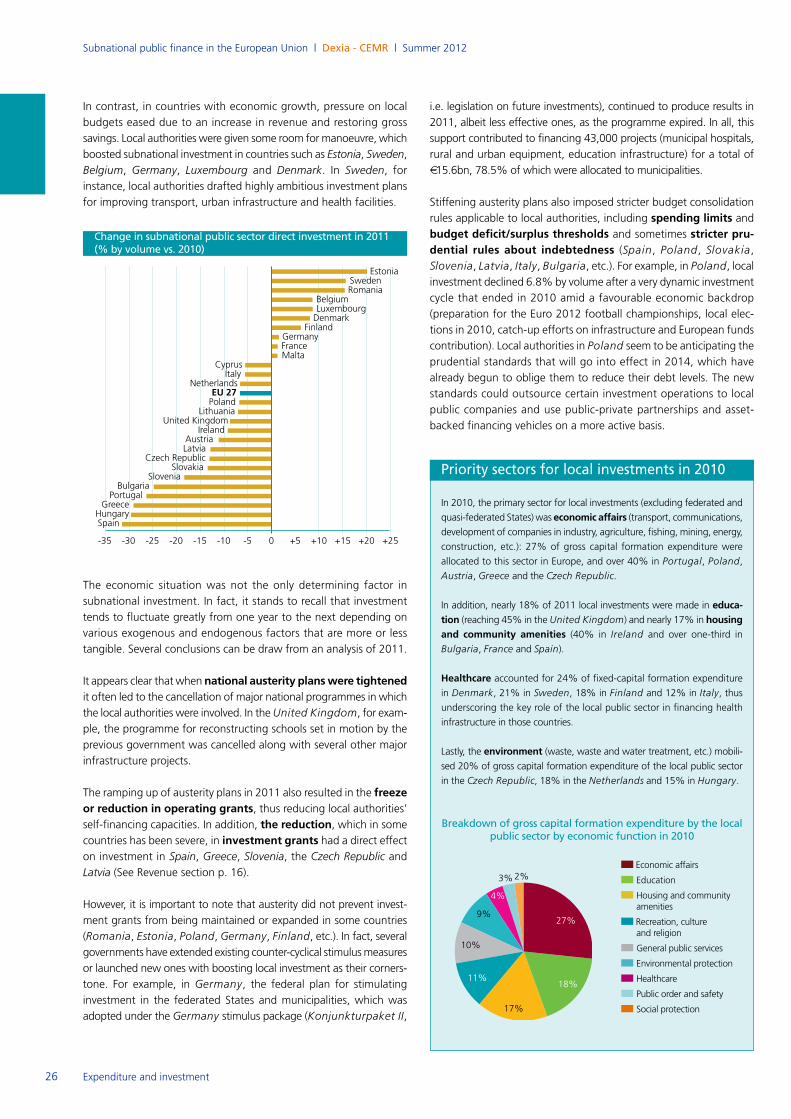
Subnational public finance in the European Union | Dexia - CEMR | Summer 2012
26 Expenditure and investment
In contrast, in countries with economic growth, pressure on local
budgets eased due to an increase in revenue and restoring gross
savings. Local authorities were given some room for manoeuvre, which
boosted subnational investment in countries such as Estonia, Sweden,Belgium, Germany, Luxembourg and Denmark. In Sweden, for instance, local authorities drafted highly ambitious investment plans
for improving transport, urban infrastructure and health facilities.
The economic situation was not the only determining factor in
subnational investment. In fact, it stands to recall that investment
tends to fluctuate greatly from one year to the next depending on
various exogenous and endogenous factors that are more or less
tangible. Several conclusions can be draw from an analysis of 2011.
It appears clear that when national austerity plans were tightenedit often led to the cancellation of major national programmes in which
the local authorities were involved. In the United Kingdom, for exam-
ple, the programme for reconstructing schools set in motion by the
previous government was cancelled along with several other major
infrastructure projects.
The ramping up of austerity plans in 2011 also resulted in the freezeor reduction in operating grants, thus reducing local authorities'self-financing capacities. In addition, the reduction, which in somecountries has been severe, in investment grants had a direct effecton investment in Spain, Greece, Slovenia, the Czech Republic andLatvia (See Revenue section p. 16).
However, it is important to note that austerity did not prevent invest-
ment grants from being maintained or expanded in some countries
(Romania, Estonia, Poland, Germany, Finland, etc.). In fact, severalgovernments have extended existing counter-cyclical stimulus measures
or launched new ones with boosting local investment as their corners-
tone. For example, in Germany, the federal plan for stimulating investment in the federated States and municipalities, which was
adopted under the Germany stimulus package (Konjunkturpaket II,
i.e. legislation on future investments), continued to produce results in
2011, albeit less effective ones, as the programme expired. In all, this
support contributed to financing 43,000 projects (municipal hospitals,
rural and urban equipment, education infrastructure) for a total of
€15.6bn, 78.5% of which were allocated to municipalities.
Stiffening austerity plans also imposed stricter budget consolidation
rules applicable to local authorities, including spending limits andbudget deficit/surplus thresholds and sometimes stricter pru-dential rules about indebtedness (Spain, Poland, Slovakia,Slovenia, Latvia, Italy, Bulgaria, etc.). For example, in Poland, localinvestment declined 6.8% by volume after a very dynamic investment
cycle that ended in 2010 amid a favourable economic backdrop
(preparation for the Euro 2012 football championships, local elec-
tions in 2010, catch-up efforts on infrastructure and European funds
contribution). Local authorities in Poland seem to be anticipating theprudential standards that will go into effect in 2014, which have
already begun to oblige them to reduce their debt levels. The new
standards could outsource certain investment operations to local
public companies and use public-private partnerships and asset-
backed financing vehicles on a more active basis.
In 2010, the primary sector for local investments (excluding federated and
quasi-federated States) was economic affairs (transport, communications,development of companies in industry, agriculture, fishing, mining, energy,
construction, etc.): 27% of gross capital formation expenditure were
allocated to this sector in Europe, and over 40% in Portugal, Poland,
Austria, Greece and the Czech Republic.
In addition, nearly 18% of 2011 local investments were made in educa-tion (reaching 45% in the United Kingdom) and nearly 17% in housingand community amenities (40% in Ireland and over one-third in
Bulgaria, France and Spain).
Healthcare accounted for 24% of fixed-capital formation expenditure
in Denmark, 21% in Sweden, 18% in Finland and 12% in Italy, thus
underscoring the key role of the local public sector in financing health
infrastructure in those countries.
Lastly, the environment (waste, waste and water treatment, etc.) mobili-sed 20% of gross capital formation expenditure of the local public sector
in the Czech Republic, 18% in the Netherlands and 15% in Hungary.
Priority sectors for local investments in 2010
Economic affairs
Education
Housing and communityamenities
Recreation, culture and religion
General public services
Environmental protection
Healthcare
Public order and safety
Social protection
27%
17%
10%
9%
3%
4%
11%18%
2%
Breakdown of gross capital formation expenditure by the localpublic sector by economic function in 2010
Change in subnational public sector direct investment in 2011(% by volume vs. 2010)
-35 -30 -25 -20 -15 -10 -5 0 +5 +10 +15 +20 +25
Netherlands
United Kingdom
Czech Republic
Slovenia
Austria
Belgium
Finland
Sweden
Denmark
Germany
Hungary
Poland
Slovakia
Lithuania
Greece
Bulgaria
France
CyprusMalta
Luxembourg
Spain
Italy
Romania
Ireland
Latvia
Portugal
Estonia
EU 27
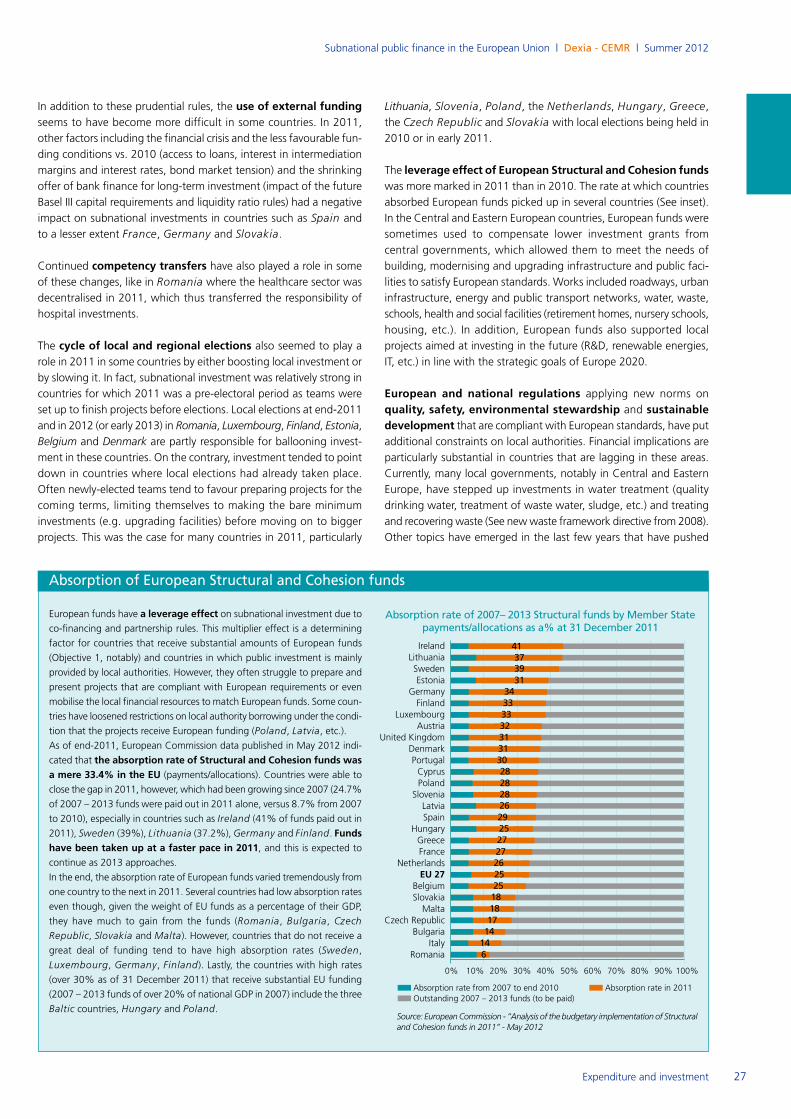
Subnational public finance in the European Union | Dexia - CEMR | Summer 2012
27Expenditure and investment
In addition to these prudential rules, the use of external fundingseems to have become more difficult in some countries. In 2011,
other factors including the financial crisis and the less favourable fun-
ding conditions vs. 2010 (access to loans, interest in intermediation
margins and interest rates, bond market tension) and the shrinking
offer of bank finance for long-term investment (impact of the future
Basel III capital requirements and liquidity ratio rules) had a negative
impact on subnational investments in countries such as Spain and
to a lesser extent France, Germany and Slovakia.
Continued competency transfers have also played a role in someof these changes, like in Romania where the healthcare sector was
decentralised in 2011, which thus transferred the responsibility of
hospital investments.
The cycle of local and regional elections also seemed to play a
role in 2011 in some countries by either boosting local investment or
by slowing it. In fact, subnational investment was relatively strong in
countries for which 2011 was a pre-electoral period as teams were
set up to finish projects before elections. Local elections at end-2011
and in 2012 (or early 2013) in Romania, Luxembourg, Finland, Estonia,Belgium and Denmark are partly responsible for ballooning invest-
ment in these countries. On the contrary, investment tended to point
down in countries where local elections had already taken place.
Often newly-elected teams tend to favour preparing projects for the
coming terms, limiting themselves to making the bare minimum
investments (e.g. upgrading facilities) before moving on to bigger
projects. This was the case for many countries in 2011, particularly
Lithuania, Slovenia, Poland, the Netherlands, Hungary, Greece,the Czech Republic and Slovakia with local elections being held in2010 or in early 2011.
The leverage effect of European Structural and Cohesion fundswas more marked in 2011 than in 2010. The rate at which countries
absorbed European funds picked up in several countries (See inset).
In the Central and Eastern European countries, European funds were
sometimes used to compensate lower investment grants from
central governments, which allowed them to meet the needs of
building, modernising and upgrading infrastructure and public faci-
lities to satisfy European standards. Works included roadways, urban
infrastructure, energy and public transport networks, water, waste,
schools, health and social facilities (retirement homes, nursery schools,
housing, etc.). In addition, European funds also supported local
projects aimed at investing in the future (R&D, renewable energies,
IT, etc.) in line with the strategic goals of Europe 2020.
European and national regulations applying new norms on
quality, safety, environmental stewardship and sustainabledevelopment that are compliant with European standards, have putadditional constraints on local authorities. Financial implications are
particularly substantial in countries that are lagging in these areas.
Currently, many local governments, notably in Central and Eastern
Europe, have stepped up investments in water treatment (quality
drinking water, treatment of waste water, sludge, etc.) and treating
and recovering waste (See new waste framework directive from 2008).
Other topics have emerged in the last few years that have pushed
European funds have a leverage effect on subnational investment due toco-financing and partnership rules. This multiplier effect is a determining
factor for countries that receive substantial amounts of European funds
(Objective 1, notably) and countries in which public investment is mainly
provided by local authorities. However, they often struggle to prepare and
present projects that are compliant with European requirements or even
mobilise the local financial resources to match European funds. Some coun-
tries have loosened restrictions on local authority borrowing under the condi-
tion that the projects receive European funding (Poland, Latvia, etc.).
As of end-2011, European Commission data published in May 2012 indi-
cated that the absorption rate of Structural and Cohesion funds wasa mere 33.4% in the EU (payments/allocations). Countries were able to
close the gap in 2011, however, which had been growing since 2007 (24.7%
of 2007 – 2013 funds were paid out in 2011 alone, versus 8.7% from 2007
to 2010), especially in countries such as Ireland (41% of funds paid out in
2011), Sweden (39%), Lithuania (37.2%), Germany and Finland. Fundshave been taken up at a faster pace in 2011, and this is expected tocontinue as 2013 approaches.
In the end, the absorption rate of European funds varied tremendously from
one country to the next in 2011. Several countries had low absorption rates
even though, given the weight of EU funds as a percentage of their GDP,
they have much to gain from the funds (Romania, Bulgaria, Czech
Republic, Slovakia and Malta). However, countries that do not receive a
great deal of funding tend to have high absorption rates (Sweden,
Luxembourg, Germany, Finland). Lastly, the countries with high rates
(over 30% as of 31 December 2011) that receive substantial EU funding
(2007 – 2013 funds of over 20% of national GDP in 2007) include the three
Baltic countries, Hungary and Poland.
Absorption of European Structural and Cohesion funds
100%90%80%70%60%50%40%30%20%10%0%
Poland
Denmark
Slovakia
Ireland
EU 27
Finland
Netherlands
Latvia
Czech Republic
Spain
Austria
France
Italy
Germany
Belgium
Slovenia
Hungary
LithuaniaSweden
United Kingdom
Estonia
Romania
Portugal
Luxembourg
Bulgaria
Greece
Cyprus
Malta
Absorption rate from 2007 to end 2010 Absorption rate in 2011Outstanding 2007 – 2013 funds (to be paid)
Absorption rate of 2007– 2013 Structural funds by Member Statepayments/allocations as a% at 31 December 2011
Source: European Commission - “Analysis of the budgetary implementation of Structuraland Cohesion funds in 2011” - May 2012
41373931
343333323131302828282629252727262525181817
14146
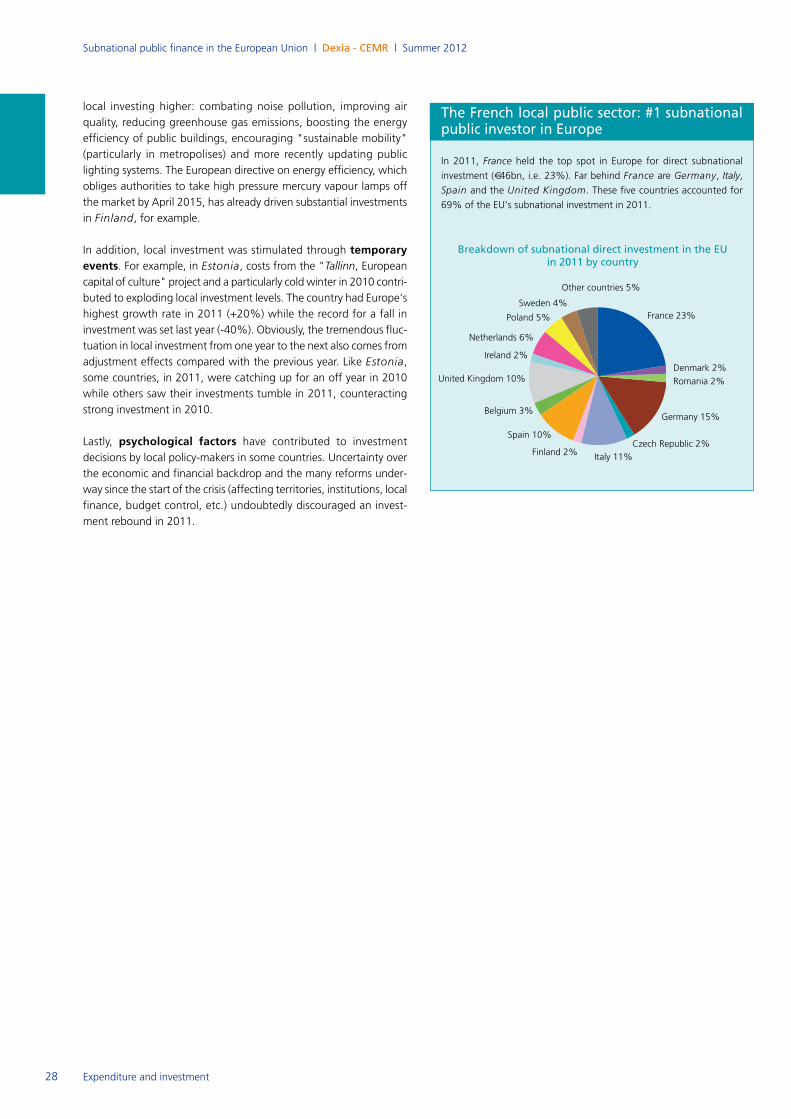
Subnational public finance in the European Union | Dexia - CEMR | Summer 2012
28 Expenditure and investment
local investing higher: combating noise pollution, improving air
quality, reducing greenhouse gas emissions, boosting the energy
efficiency of public buildings, encouraging "sustainable mobility"
(particularly in metropolises) and more recently updating public
lighting systems. The European directive on energy efficiency, which
obliges authorities to take high pressure mercury vapour lamps off
the market by April 2015, has already driven substantial investments
in Finland, for example.
In addition, local investment was stimulated through temporaryevents. For example, in Estonia, costs from the "Tallinn, Europeancapital of culture" project and a particularly cold winter in 2010 contri-
buted to exploding local investment levels. The country had Europe's
highest growth rate in 2011 (+20%) while the record for a fall in
investment was set last year (-40%). Obviously, the tremendous fluc-
tuation in local investment from one year to the next also comes from
adjustment effects compared with the previous year. Like Estonia,some countries, in 2011, were catching up for an off year in 2010
while others saw their investments tumble in 2011, counteracting
strong investment in 2010.
Lastly, psychological factors have contributed to investment
decisions by local policy-makers in some countries. Uncertainty over
the economic and financial backdrop and the many reforms under-
way since the start of the crisis (affecting territories, institutions, local
finance, budget control, etc.) undoubtedly discouraged an invest-
ment rebound in 2011.
In 2011, France held the top spot in Europe for direct subnational
investment (€46bn, i.e. 23%). Far behind France are Germany, Italy,
Spain and the United Kingdom. These five countries accounted for
69% of the EU's subnational investment in 2011.
The French local public sector: #1 subnationalpublic investor in Europe
Breakdown of subnational direct investment in the EU in 2011 by country
16,3%
France 23%
Denmark 2%
Romania 2%
Germany 15%
Czech Republic 2%Italy 11%Finland 2%
Spain 10%
Belgium 3%
United Kingdom 10%
Ireland 2%
Netherlands 6%
Poland 5%
Sweden 4%
Other countries 5%
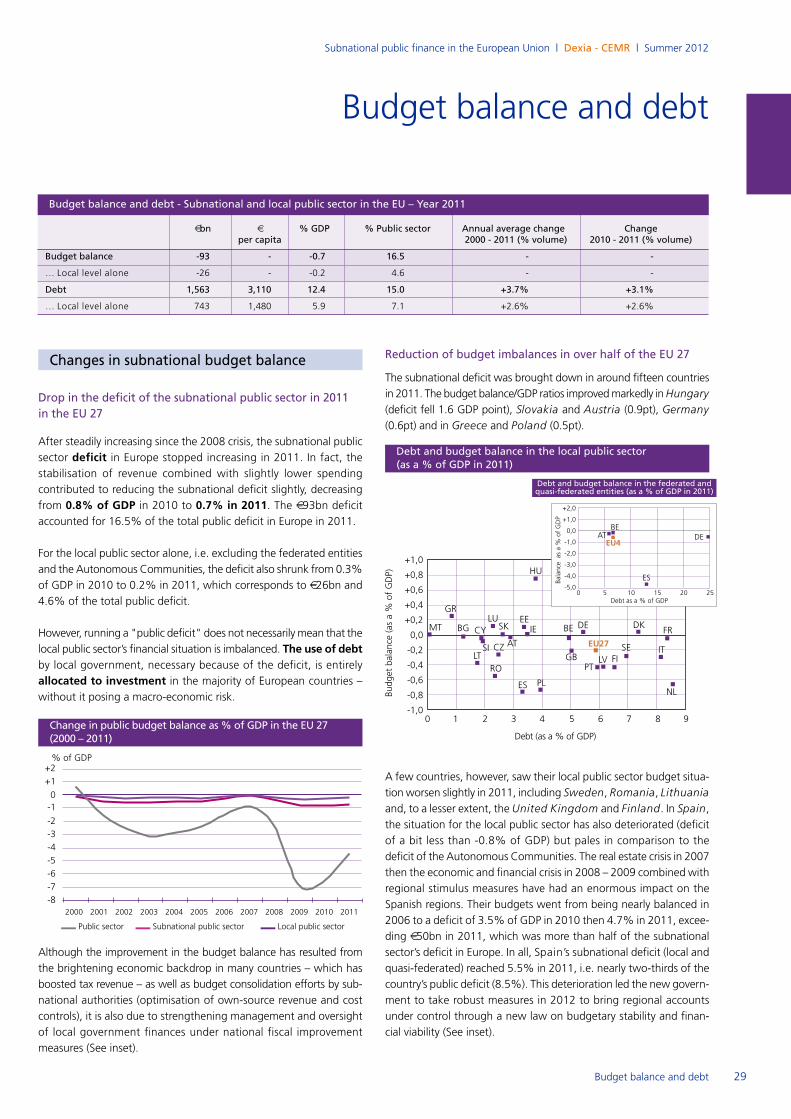
Changes in subnational budget balance
Drop in the deficit of the subnational public sector in 2011 in the EU 27
After steadily increasing since the 2008 crisis, the subnational public
sector deficit in Europe stopped increasing in 2011. In fact, the stabilisation of revenue combined with slightly lower spending
contributed to reducing the subnational deficit slightly, decreasing
from 0.8% of GDP in 2010 to 0.7% in 2011. The €93bn deficitaccounted for 16.5% of the total public deficit in Europe in 2011.
For the local public sector alone, i.e. excluding the federated entities
and the Autonomous Communities, the deficit also shrunk from 0.3%
of GDP in 2010 to 0.2% in 2011, which corresponds to €26bn and4.6% of the total public deficit.
However, running a "public deficit" does not necessarily mean that the
local public sector’s financial situation is imbalanced. The use of debtby local government, necessary because of the deficit, is entirely
allocated to investment in the majority of European countries –
without it posing a macro-economic risk.
Although the improvement in the budget balance has resulted from
the brightening economic backdrop in many countries – which has
boosted tax revenue – as well as budget consolidation efforts by sub-
national authorities (optimisation of own-source revenue and cost
controls), it is also due to strengthening management and oversight
of local government finances under national fiscal improvement
measures (See inset).
Reduction of budget imbalances in over half of the EU 27
The subnational deficit was brought down in around fifteen countries
in 2011. The budget balance/GDP ratios improved markedly in Hungary(deficit fell 1.6 GDP point), Slovakia and Austria (0.9pt), Germany(0.6pt) and in Greece and Poland (0.5pt).
A few countries, however, saw their local public sector budget situa-
tion worsen slightly in 2011, including Sweden, Romania, Lithuaniaand, to a lesser extent, the United Kingdom and Finland. In Spain,the situation for the local public sector has also deteriorated (deficit
of a bit less than -0.8% of GDP) but pales in comparison to the
deficit of the Autonomous Communities. The real estate crisis in 2007
then the economic and financial crisis in 2008 – 2009 combined with
regional stimulus measures have had an enormous impact on the
Spanish regions. Their budgets went from being nearly balanced in
2006 to a deficit of 3.5% of GDP in 2010 then 4.7% in 2011, excee-
ding €50bn in 2011, which was more than half of the subnationalsector’s deficit in Europe. In all, Spain’s subnational deficit (local and
quasi-federated) reached 5.5% in 2011, i.e. nearly two-thirds of the
country’s public deficit (8.5%). This deterioration led the new govern-
ment to take robust measures in 2012 to bring regional accounts
under control through a new law on budgetary stability and finan-
cial viability (See inset).
Change in public budget balance as % of GDP in the EU 27(2000 – 2011)
% of GDP+2
+1
0-1
-2
-3
-4
-5
-6
-7
-82000 2001 2002 2003 2004 2005 2006 2007 2008 2009 2010 2011
Public sector Subnational public sector Local public sector
0 1 2 3 4 5 6 7 8 9
+1,0
+0,8
+0,6
+0,4
+0,2
0,0
-0,2
-0,4
-0,6
-0,8
-1,0
Budget balance (as a % of GDP)
Debt (as a % of GDP)
PT
FR
GBSI
PL
HU
ES
EU27
BEMT
GREELU
BG
ROLT
CZ
SK
LV
DK
AT
NL
FISE
DECY IE
IT
Subnational public finance in the European Union | Dexia - CEMR | Summer 2012
29Budget balance and debt
Budget balance and debt
Budget balance and debt - Subnational and local public sector in the EU – Year 2011
€bn € % GDP % Public sector Annual average change Change per capita 2000 - 2011 (% volume) 2010 - 2011 (% volume)
Budget balance -93 - -0.7 16.5 - -
… Local level alone -26 - -0.2 4.6 - -
Debt 1,563 3,110 12.4 15.0 +3.7% +3.1%
… Local level alone 743 1,480 5.9 7.1 +2.6% +2.6%
0 5 10 15 20 25
+2,0
+1,0
0,0
-1,0
-2,0
-3,0
-4,0
-5,0
Balance as a % of GDP
Dette en % du PIB
Debt and budget balance in the federated andquasi-federated entities (as a % of GDP in 2011)
ES
EU4
BEAT DE
Debt as a % of GDP
Debt and budget balance in the local public sector (as a % of GDP in 2011)
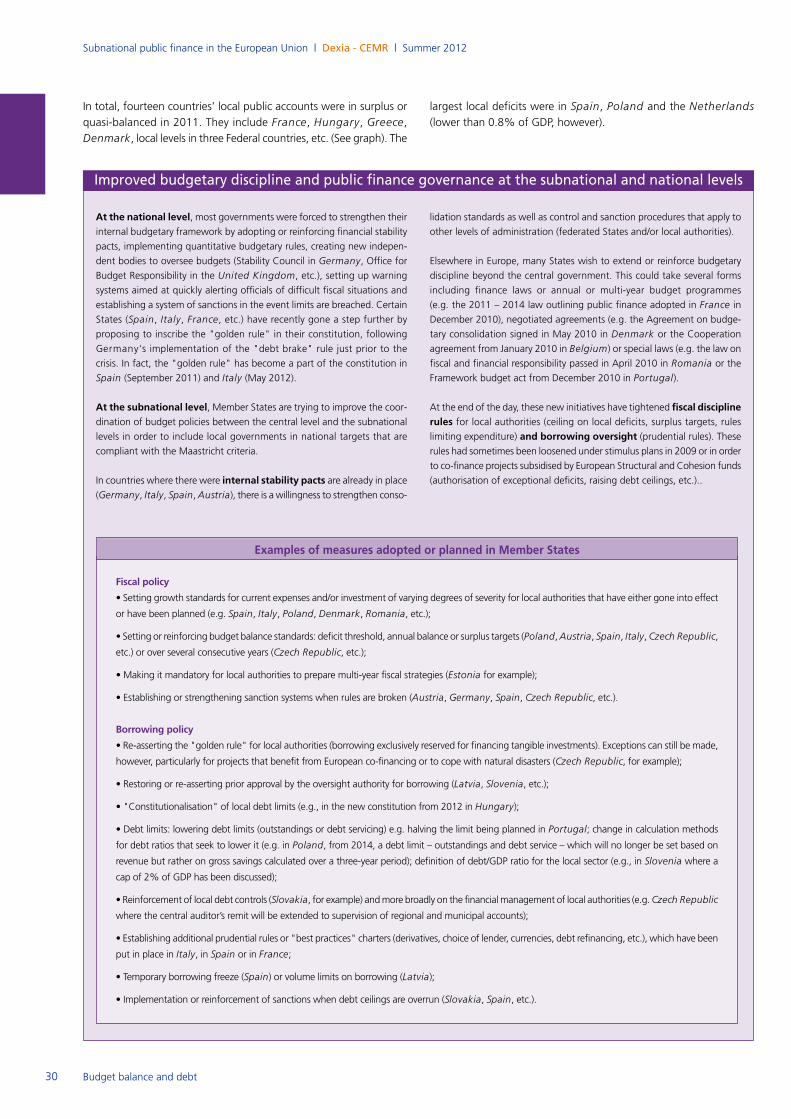
Subnational public finance in the European Union | Dexia - CEMR | Summer 2012
30 Budget balance and debt
Improved budgetary discipline and public finance governance at the subnational and national levels
In total, fourteen countries’ local public accounts were in surplus or
quasi-balanced in 2011. They include France, Hungary, Greece,Denmark, local levels in three Federal countries, etc. (See graph). The
largest local deficits were in Spain, Poland and the Netherlands(lower than 0.8% of GDP, however).
Fiscal policy
• Setting growth standards for current expenses and/or investment of varying degrees of severity for local authorities that have either gone into effect
or have been planned (e.g. Spain, Italy, Poland, Denmark, Romania, etc.);
• Setting or reinforcing budget balance standards: deficit threshold, annual balance or surplus targets (Poland, Austria, Spain, Italy, Czech Republic,
etc.) or over several consecutive years (Czech Republic, etc.);
• Making it mandatory for local authorities to prepare multi-year fiscal strategies (Estonia for example);
• Establishing or strengthening sanction systems when rules are broken (Austria, Germany, Spain, Czech Republic, etc.).
Borrowing policy
• Re-asserting the "golden rule" for local authorities (borrowing exclusively reserved for financing tangible investments). Exceptions can still be made,
however, particularly for projects that benefit from European co-financing or to cope with natural disasters (Czech Republic, for example);
• Restoring or re-asserting prior approval by the oversight authority for borrowing (Latvia, Slovenia, etc.);
• "Constitutionalisation" of local debt limits (e.g., in the new constitution from 2012 in Hungary);
• Debt limits: lowering debt limits (outstandings or debt servicing) e.g. halving the limit being planned in Portugal; change in calculation methods
for debt ratios that seek to lower it (e.g. in Poland, from 2014, a debt limit – outstandings and debt service – which will no longer be set based on
revenue but rather on gross savings calculated over a three-year period); definition of debt/GDP ratio for the local sector (e.g., in Slovenia where a
cap of 2% of GDP has been discussed);
• Reinforcement of local debt controls (Slovakia, for example) and more broadly on the financial management of local authorities (e.g. Czech Republic
where the central auditor’s remit will be extended to supervision of regional and municipal accounts);
• Establishing additional prudential rules or "best practices" charters (derivatives, choice of lender, currencies, debt refinancing, etc.), which have been
put in place in Italy, in Spain or in France;
• Temporary borrowing freeze (Spain) or volume limits on borrowing (Latvia);
• Implementation or reinforcement of sanctions when debt ceilings are overrun (Slovakia, Spain, etc.).
Examples of measures adopted or planned in Member States
At the national level, most governments were forced to strengthen theirinternal budgetary framework by adopting or reinforcing financial stability
pacts, implementing quantitative budgetary rules, creating new indepen-
dent bodies to oversee budgets (Stability Council in Germany, Office for
Budget Responsibility in the United Kingdom, etc.), setting up warning
systems aimed at quickly alerting officials of difficult fiscal situations and
establishing a system of sanctions in the event limits are breached. Certain
States (Spain, Italy, France, etc.) have recently gone a step further by
proposing to inscribe the "golden rule" in their constitution, following
Germany's implementation of the "debt brake" rule just prior to the
crisis. In fact, the "golden rule" has become a part of the constitution in
Spain (September 2011) and Italy (May 2012).
At the subnational level, Member States are trying to improve the coor-
dination of budget policies between the central level and the subnational
levels in order to include local governments in national targets that are
compliant with the Maastricht criteria.
In countries where there were internal stability pacts are already in place(Germany, Italy, Spain, Austria), there is a willingness to strengthen conso-
lidation standards as well as control and sanction procedures that apply to
other levels of administration (federated States and/or local authorities).
Elsewhere in Europe, many States wish to extend or reinforce budgetary
discipline beyond the central government. This could take several forms
including finance laws or annual or multi-year budget programmes
(e.g. the 2011 – 2014 law outlining public finance adopted in France in
December 2010), negotiated agreements (e.g. the Agreement on budge-
tary consolidation signed in May 2010 in Denmark or the Cooperation
agreement from January 2010 in Belgium) or special laws (e.g. the law on
fiscal and financial responsibility passed in April 2010 in Romania or the
Framework budget act from December 2010 in Portugal).
At the end of the day, these new initiatives have tightened fiscal disciplinerules for local authorities (ceiling on local deficits, surplus targets, rules limiting expenditure) and borrowing oversight (prudential rules). Theserules had sometimes been loosened under stimulus plans in 2009 or in order
to co-finance projects subsidised by European Structural and Cohesion funds
(authorisation of exceptional deficits, raising debt ceilings, etc.)..
Subnational public finance in the European Union | Dexia - CEMR | Summer 2012
31Budget balance and debt
Change in subnational public sector debt
Expansion of subnational debt slows in 2011
In 2011, the growth of the outstanding subnational debt slowed:
+3.1% by volume versus +5.8% in 2010 and especially compared
with +10.8% in 2009, when stimulus plans required a strong increase
in investment. In 2011, subnational public sector debt reached
€1,563bn in the EU 27, i.e. 12.4% of GDP (versus 9.7% prior to the
crisis). For the local public sector alone, debt reached €743bn afterincreasing by 2.6% by volume in 2011 compared with 2010.
The slowdown in 2011 was due in large part to lower financing needs,falling investment, measures taken by several governments to restrict borrowing under national fiscal consolidation plans (See inset)and more difficult and expensive access to external finance in somecountries.
Subnational outstanding debt even fell by volume in ten countries
(See graph). Several among them reduced their financing needs in
2011 and/or had a balanced budget or surplus. In certain countries
like Slovakia or the Czech Republic, lower local debt outstandingscame as a result of central governments tightening prudential rules.
It should be pointed out, however, that local authority debt in these
countries remains very moderate (less than 3.5% of GDP).
In addition, there were several specific cases. In Hungary for example,local debt outstandings plummeted faster than any other country in
Europe in 2011 (-16.8% by volume) and was partly due to a move to
recentralise the competencies of the counties, which resulted in the
central government taking over their debt. In Italy, subnational debt,among Europe’s highest (8.1% of GDP and 6.8% of public debt)
has fluctuated between stagnation and slower growth in the past five
years (-0.7% in 2011), under the effects of strengthening the Internal
Stability Pact: first in 2007 (limitation of local spending and budget
balance targets), then in 2009 with the 133/2008 law that set new
budget and debt targets, then again in 2011.
Strengthening internal stability pacts
• Germany: Germany’s fundamental law (Grundgesetz) already included fiscal stability measures in its original version dating back to 1949. Since then,
it has been amended three times (1969, 2006 and 2009). The 2009 reform,
which was part of the 2nd reform of federalism (Föderalismusreform II),
added a new measure called the “debt brake” (Schuldenbremse). According
to this amendment, the federal government must reduce its structural deficit
to 0.35% of GDP before 2016 while Länder will no longer be allowed to run
a structural deficit of any kind starting in 2020. Although, they will be allowed
to run a temporary deficit. The rule could also be suspended in the event of a
natural disaster, an economic crisis or other exceptional circumstances. The
consolidation phase will span from 2011 to 2019. Länder encountering finan-
cial problems will receive financial aid on an extraordinary basis from 2011 to
2019, particularly Berlin, Bremen, Saarland, Saxony-Anhalt and Schleswig-
Holstein. In the future, the Länder will also need to adopt similar rules for
including the “debt brake” in their regional constitution or in a fiscal frame-
work law.
• Spain: in 2001, Spain passed its first fiscal stability law applying to all levels
of government. Revised several times and loosened in 2009 under the Spanish
stimulus package, this law was again modified on 1 May 2012 in response to
the deterioration of the country’s fiscal situation, particularly in the Autonomous
Communities. In addition to the balanced budget rule from September 2011
(Article 135 of the Spanish constitution, the new "Organic Law on Budgetary
Stability and Financial Sustainability" contributes to stricter control on regio-
nal accounts (e.g. debt and spending limits set up, transparency requirements
and monthly, quarterly and full-year reporting to the central government) and
budget oversight e.g. correction mechanisms, or even sanctions, when targets
are not met (fiscal belt-tightening, especially in education and healthcare,
implementing fiscal recovery measures, prior permission to borrow, enforce-
ment measures, dissolution as a last resort, etc.). In addition, the central
State set up a "supplier payment fund" for Autonomous Communities and
municipalities. These financing lines, heavily regulated and controlled by the
Finance Ministry, are granted to the Autonomous Communities under the
condition that they implement particularly strict economic/financial consolida-
tion programmes. These measures also apply to towns and provinces. Given
this fiscal rigor, all Autonomous Communities approved fiscal restoration plans.
They are expected to result in lowering the regional deficit in 2012, bearing in
mind that the deficit ceiling was written into law at 1.5% of GDP for 2012.
• Austria: national fiscal coordination between the federal government, the federated States and municipalities has been regulated by the Austrian
Stability Pact (Österreichischer Stabilitätspakt – ÖStP). The 2011 – 2014
Pact introduced several new elements, notably stricter sanctions, improved
fiscal coordination and greater transparency. The Pact also integrates the new
“debt brake” rule, inspired by the German model, and passed in December
2011 by Austria. The rule will therefore apply to subnational entities, as well.
For 2011 – 2014, the Pact set a cap on the Länder’s deficit and for Vienna
(0.75% of GDP in 2011 and 0.5% in 2013 and 2014). It also includes the
budget balance provision for municipalities. There are plans to revise the Pact
in 2012 in order to integrate more precise rules on expenditure and debt. From
2017, it sets a limit of 0.35% for the structural deficit at the federal level and
an aggregate for the Länder and municipalities of 0.1%.
• Italy: an Internal Stability Pact (Patto di Stabilità Interno) was set out in1998 in the Italian legal system via law no. 448. Compliance with the Pact by
all levels of government is based on the constitutional principle of coordina-
ting public finances (Art. 117 and 119 of the Italian constitution). These rules
are redefined every year when the finance law (Manovra d’Estate) is drafted.
Broken down into two sub-pacts, one for the regions and the other for local
entities, the Pact, depending on the year, sets targets on expenditure, deficit,
debt or a combination of rules, which are spelled out in the finance laws. It
also sets requirements on communication, information and certification as well
as a sanctions system in the event of a default. Since 2007, the use of debt
has been particularly constrained by the Pact. In 2011 and 2012, the various
finance and stability laws have defined new budget balancing targets,
current-spending constraints and have tightened access to borrowing for
subnational entities. Finally, the constitutional reform introducing the budget
stability rule in the Italian constitution was passed in May 2012. This "golden
rule" will guarantee Italy’s compliance with fiscal equilibrium, which should
be reached in 2013 thanks to the new austerity plan. It will result in a ban on
the use of debt to finance the deficit and will affect the public administration’s
fiscal discipline as a whole, including the territorial entities (regions, provinces,
municipalities and cities).
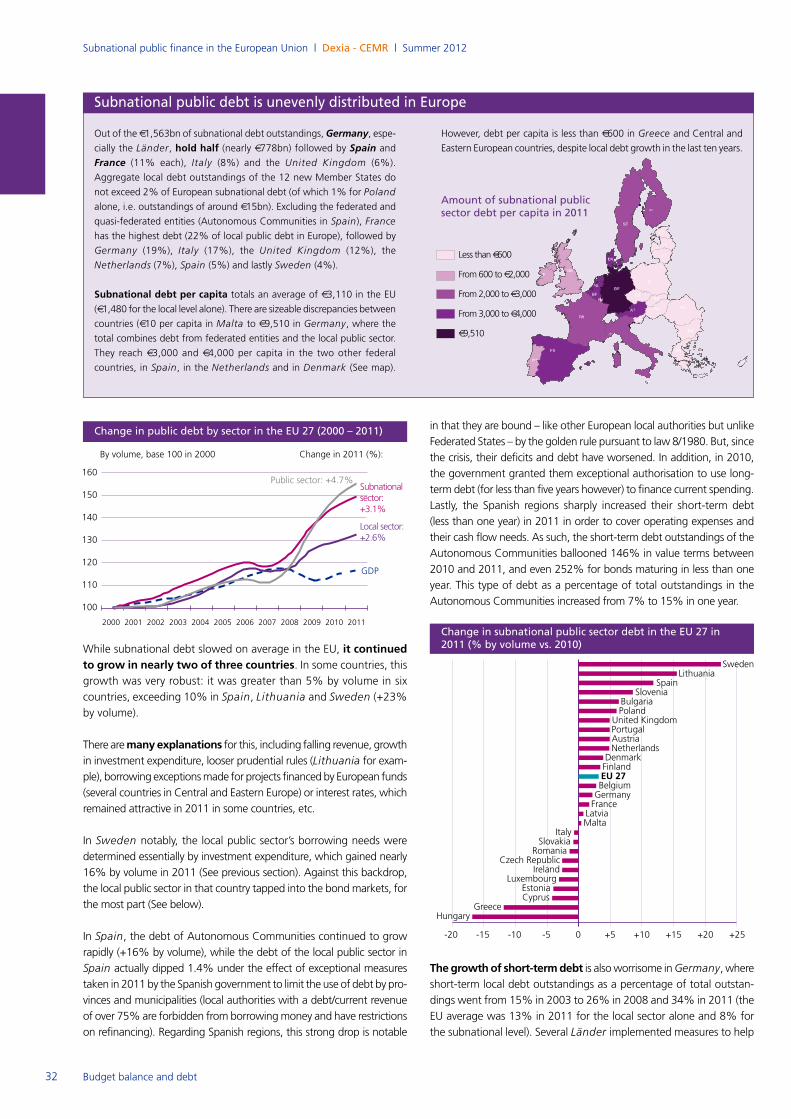
Subnational public debt is unevenly distributed in Europe
Subnational public finance in the European Union | Dexia - CEMR | Summer 2012
32 Budget balance and debt
While subnational debt slowed on average in the EU, it continuedto grow in nearly two of three countries. In some countries, thisgrowth was very robust: it was greater than 5% by volume in six
countries, exceeding 10% in Spain, Lithuania and Sweden (+23%
by volume).
There are many explanations for this, including falling revenue, growthin investment expenditure, looser prudential rules (Lithuania for exam-ple), borrowing exceptions made for projects financed by European funds
(several countries in Central and Eastern Europe) or interest rates, which
remained attractive in 2011 in some countries, etc.
In Sweden notably, the local public sector’s borrowing needs were
determined essentially by investment expenditure, which gained nearly
16% by volume in 2011 (See previous section). Against this backdrop,
the local public sector in that country tapped into the bond markets, for
the most part (See below).
In Spain, the debt of Autonomous Communities continued to growrapidly (+16% by volume), while the debt of the local public sector in
Spain actually dipped 1.4% under the effect of exceptional measures
taken in 2011 by the Spanish government to limit the use of debt by pro-
vinces and municipalities (local authorities with a debt/current revenue
of over 75% are forbidden from borrowing money and have restrictions
on refinancing). Regarding Spanish regions, this strong drop is notable
in that they are bound – like other European local authorities but unlike
Federated States – by the golden rule pursuant to law 8/1980. But, since
the crisis, their deficits and debt have worsened. In addition, in 2010,
the government granted them exceptional authorisation to use long-
term debt (for less than five years however) to finance current spending.
Lastly, the Spanish regions sharply increased their short-term debt
(less than one year) in 2011 in order to cover operating expenses and
their cash flow needs. As such, the short-term debt outstandings of the
Autonomous Communities ballooned 146% in value terms between
2010 and 2011, and even 252% for bonds maturing in less than one
year. This type of debt as a percentage of total outstandings in the
Autonomous Communities increased from 7% to 15% in one year.
The growth of short-term debt is also worrisome in Germany, whereshort-term local debt outstandings as a percentage of total outstan-
dings went from 15% in 2003 to 26% in 2008 and 34% in 2011 (the
EU average was 13% in 2011 for the local sector alone and 8% for
the subnational level). Several Länder implemented measures to help
Change in public debt by sector in the EU 27 (2000 – 2011)
By volume, base 100 in 2000
150
160
140
130
120
110
100
2000 2001 2002 2003 2004 2005 2006 2007 2008 2009 2010 2011
Change in 2011 (%):
Public sector: +4.7%
Local sector: +2.6%
Subnationalsector: +3.1%
GDP
Out of the €1,563bn of subnational debt outstandings, Germany, espe-cially the Länder, hold half (nearly €778bn) followed by Spain and
France (11% each), Italy (8%) and the United Kingdom (6%).
Aggregate local debt outstandings of the 12 new Member States do
not exceed 2% of European subnational debt (of which 1% for Poland
alone, i.e. outstandings of around €15bn). Excluding the federated andquasi-federated entities (Autonomous Communities in Spain), France
has the highest debt (22% of local public debt in Europe), followed by
Germany (19%), Italy (17%), the United Kingdom (12%), the
Netherlands (7%), Spain (5%) and lastly Sweden (4%).
Subnational debt per capita totals an average of €3,110 in the EU(€1,480 for the local level alone). There are sizeable discrepancies betweencountries (€10 per capita in Malta to €9,510 in Germany, where the
total combines debt from federated entities and the local public sector.
They reach €3,000 and €4,000 per capita in the two other federal countries, in Spain, in the Netherlands and in Denmark (See map).
However, debt per capita is less than €600 in Greece and Central and
Eastern European countries, despite local debt growth in the last ten years.
Less than €600
From 600 to €2,000
From 2,000 to €3,000
From 3,000 to €4,000
€9,510
Amount of subnational publicsector debt per capita in 2011
Change in subnational public sector debt in the EU 27 in2011 (% by volume vs. 2010)
-20 -15 -10 -5 0 +5 +10 +15 +20 +25
Netherlands
United Kingdom
Czech Republic
Slovenia
Austria
Belgium
Finland
Sweden
Denmark
Germany
Hungary
Poland
Slovakia
Lithuania
Greece
Bulgaria
France
Cyprus
Malta
Luxembourg
Spain
Italy
Romania
Ireland
Latvia
Portugal
Estonia
EU 27
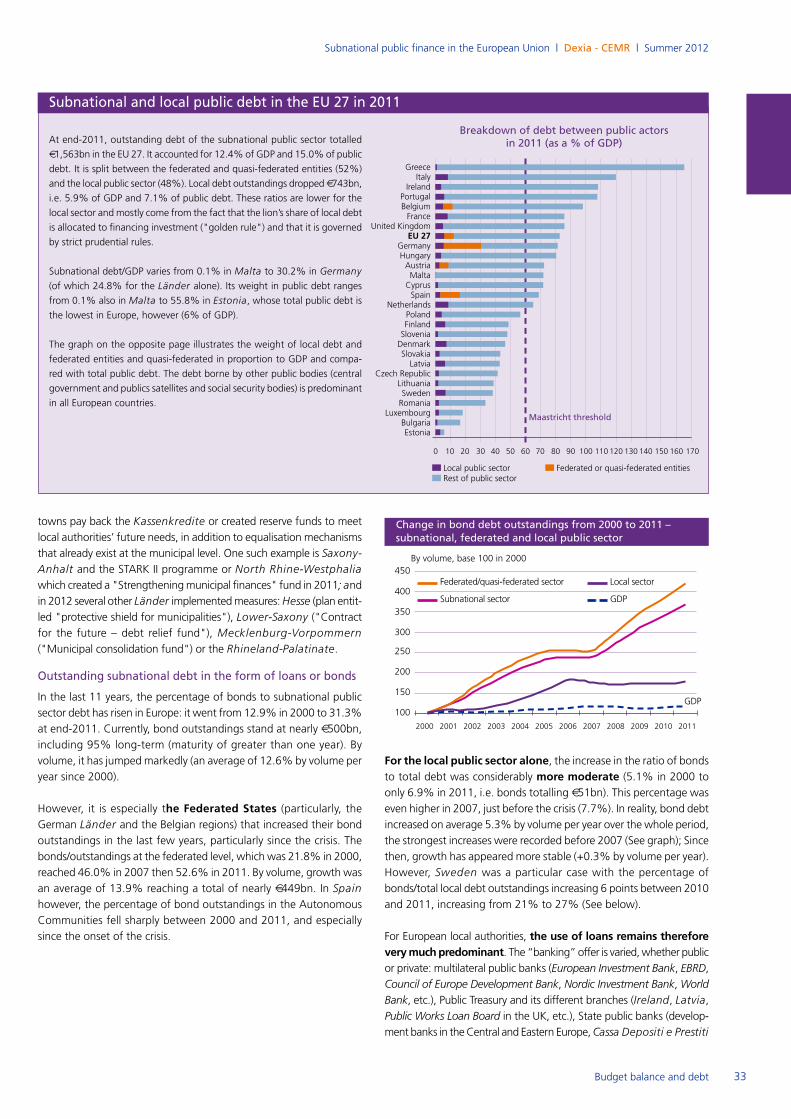
Subnational public finance in the European Union | Dexia - CEMR | Summer 2012
33
towns pay back the Kassenkredite or created reserve funds to meet
local authorities’ future needs, in addition to equalisation mechanisms
that already exist at the municipal level. One such example is Saxony-Anhalt and the STARK II programme or North Rhine-Westphaliawhich created a "Strengthening municipal finances" fund in 2011; andin 2012 several other Länder implemented measures: Hesse (plan entit-led "protective shield for municipalities"), Lower-Saxony ("Contractfor the future – debt relief fund"), Mecklenburg-Vorpommern("Municipal consolidation fund") or the Rhineland-Palatinate.
Outstanding subnational debt in the form of loans or bonds
In the last 11 years, the percentage of bonds to subnational public
sector debt has risen in Europe: it went from 12.9% in 2000 to 31.3%
at end-2011. Currently, bond outstandings stand at nearly €500bn,including 95% long-term (maturity of greater than one year). By
volume, it has jumped markedly (an average of 12.6% by volume per
year since 2000).
However, it is especially the Federated States (particularly, theGerman Länder and the Belgian regions) that increased their bondoutstandings in the last few years, particularly since the crisis. The
bonds/outstandings at the federated level, which was 21.8% in 2000,
reached 46.0% in 2007 then 52.6% in 2011. By volume, growth was
an average of 13.9% reaching a total of nearly €449bn. In Spainhowever, the percentage of bond outstandings in the Autonomous
Communities fell sharply between 2000 and 2011, and especially
since the onset of the crisis.
For the local public sector alone, the increase in the ratio of bondsto total debt was considerably more moderate (5.1% in 2000 to
only 6.9% in 2011, i.e. bonds totalling €51bn). This percentage waseven higher in 2007, just before the crisis (7.7%). In reality, bond debt
increased on average 5.3% by volume per year over the whole period,
the strongest increases were recorded before 2007 (See graph); Since
then, growth has appeared more stable (+0.3% by volume per year).
However, Sweden was a particular case with the percentage of
bonds/total local debt outstandings increasing 6 points between 2010
and 2011, increasing from 21% to 27% (See below).
For European local authorities, the use of loans remains thereforevery much predominant. The “banking” offer is varied, whether publicor private: multilateral public banks (European Investment Bank, EBRD,Council of Europe Development Bank, Nordic Investment Bank, WorldBank, etc.), Public Treasury and its different branches (Ireland, Latvia,Public Works Loan Board in the UK, etc.), State public banks (develop-ment banks in the Central and Eastern Europe, Cassa Depositi e Prestiti
Subnational and local public debt in the EU 27 in 2011
At end-2011, outstanding debt of the subnational public sector totalled
€1,563bn in the EU 27. It accounted for 12.4% of GDP and 15.0% of public
debt. It is split between the federated and quasi-federated entities (52%)
and the local public sector (48%). Local debt outstandings dropped €743bn,i.e. 5.9% of GDP and 7.1% of public debt. These ratios are lower for the
local sector and mostly come from the fact that the lion’s share of local debt
is allocated to financing investment ("golden rule") and that it is governed
by strict prudential rules.
Subnational debt/GDP varies from 0.1% in Malta to 30.2% in Germany
(of which 24.8% for the Länder alone). Its weight in public debt ranges
from 0.1% also in Malta to 55.8% in Estonia, whose total public debt is
the lowest in Europe, however (6% of GDP).
The graph on the opposite page illustrates the weight of local debt and
federated entities and quasi-federated in proportion to GDP and compa-
red with total public debt. The debt borne by other public bodies (central
government and publics satellites and social security bodies) is predominant
in all European countries.
Breakdown of debt between public actors in 2011 (as a % of GDP)
0 10 20 30 40 50 60 70 80 90 100 110 120 130 140 150 160 170
EU 27
Netherlands
United Kingdom
Czech Republic
Slovenia
Austria
Finland
Sweden
Denmark
GermanyHungary
Poland
Slovakia
Lithuania
France
Cyprus
Luxembourg
Malta
Spain
Italy
Romania
Ireland
Latvia
Estonia
Greece
Bulgaria
Local public sector Federated or quasi-federated entitiesRest of public sector
Maastricht threshold
BelgiumPortugal
Change in bond debt outstandings from 2000 to 2011 – subnational, federated and local public sector
By volume, base 100 in 2000
400
350
300
250
200
150
100
2000 2001 2002 2003 2004 2005 2006 2007 2008 2009 2010 2011
450Federated/quasi-federated sector Local sector
Subnational sector GDP
Budget balance and debt
GDP
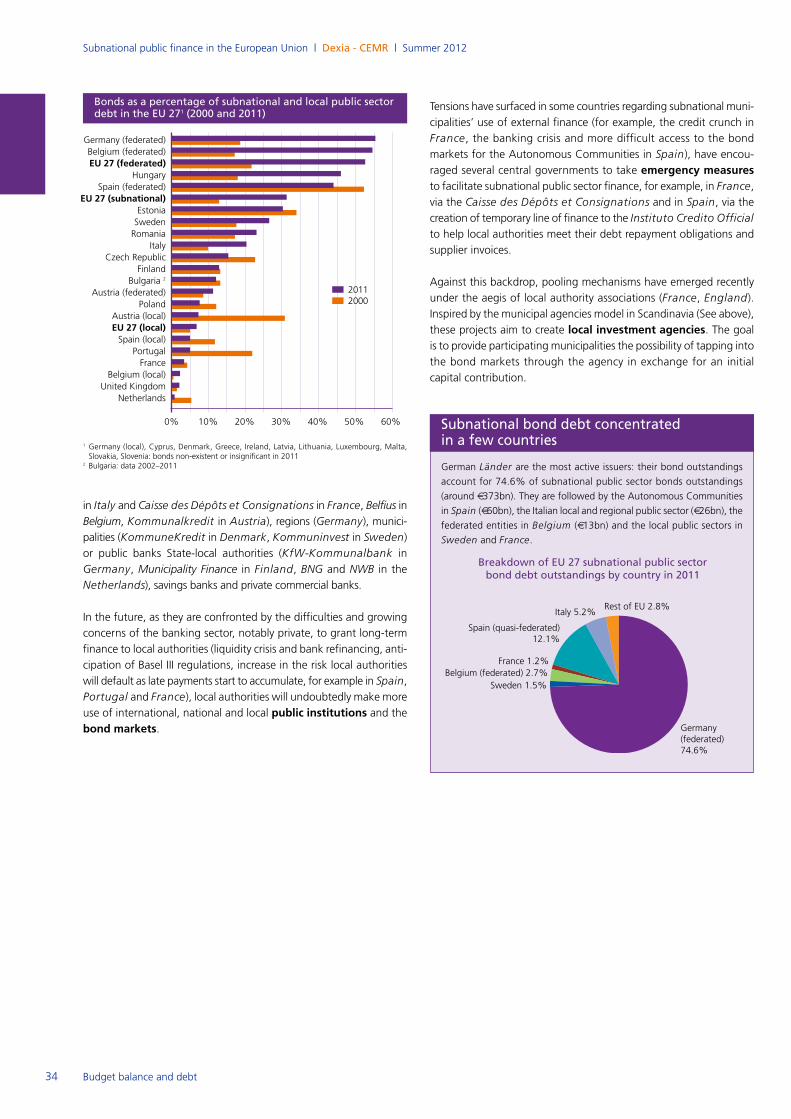
Subnational public finance in the European Union | Dexia - CEMR | Summer 2012
34 Budget balance and debt
in Italy and Caisse des Dépôts et Consignations in France, Belfius inBelgium, Kommunalkredit in Austria), regions (Germany), munici-palities (KommuneKredit in Denmark, Kommuninvest in Sweden)or public banks State-local authorities (KfW-Kommunalbank in
Germany, Municipality Finance in Finland, BNG and NWB in the
Netherlands), savings banks and private commercial banks.
In the future, as they are confronted by the difficulties and growing
concerns of the banking sector, notably private, to grant long-term
finance to local authorities (liquidity crisis and bank refinancing, anti-
cipation of Basel III regulations, increase in the risk local authorities
will default as late payments start to accumulate, for example in Spain,Portugal and France), local authorities will undoubtedly make moreuse of international, national and local public institutions and thebond markets.
Tensions have surfaced in some countries regarding subnational muni-
cipalities’ use of external finance (for example, the credit crunch in
France, the banking crisis and more difficult access to the bond
markets for the Autonomous Communities in Spain), have encou-raged several central governments to take emergency measuresto facilitate subnational public sector finance, for example, in France,via the Caisse des Dépôts et Consignations and in Spain, via thecreation of temporary line of finance to the Instituto Credito Officialto help local authorities meet their debt repayment obligations and
supplier invoices.
Against this backdrop, pooling mechanisms have emerged recently
under the aegis of local authority associations (France, England).Inspired by the municipal agencies model in Scandinavia (See above),
these projects aim to create local investment agencies. The goalis to provide participating municipalities the possibility of tapping into
the bond markets through the agency in exchange for an initial
capital contribution.
Subnational bond debt concentrated in a few countries
German Länder are the most active issuers: their bond outstandings
account for 74.6% of subnational public sector bonds outstandings
(around €373bn). They are followed by the Autonomous Communitiesin Spain (€60bn), the Italian local and regional public sector (€26bn), thefederated entities in Belgium (€13bn) and the local public sectors inSweden and France.
Breakdown of EU 27 subnational public sector bond debt outstandings by country in 2011
Germany (federated)74.6%
Sweden 1.5%Belgium (federated) 2.7%
France 1.2%
Spain (quasi-federated) 12.1%
Italy 5.2%Rest of EU 2.8%
60%50%40%30%20%10%0%
Poland
EU 27 (federated)
Finland
Netherlands
Czech Republic
Spain (local)
Austria (federated)
France
Italy
Germany (federated)Belgium (federated)
Hungary
Sweden
United Kingdom
Estonia
Romania
Portugal
Bulgaria 2
Bonds as a percentage of subnational and local public sectordebt in the EU 271 (2000 and 2011)
Spain (federated)EU 27 (subnational)
Austria (local)EU 27 (local)
Belgium (local)
20112000
1 Germany (local), Cyprus, Denmark, Greece, Ireland, Latvia, Lithuania, Luxembourg, Malta,Slovakia, Slovenia: bonds non-existent or insignificant in 2011
2 Bulgaria: data 2002–2011
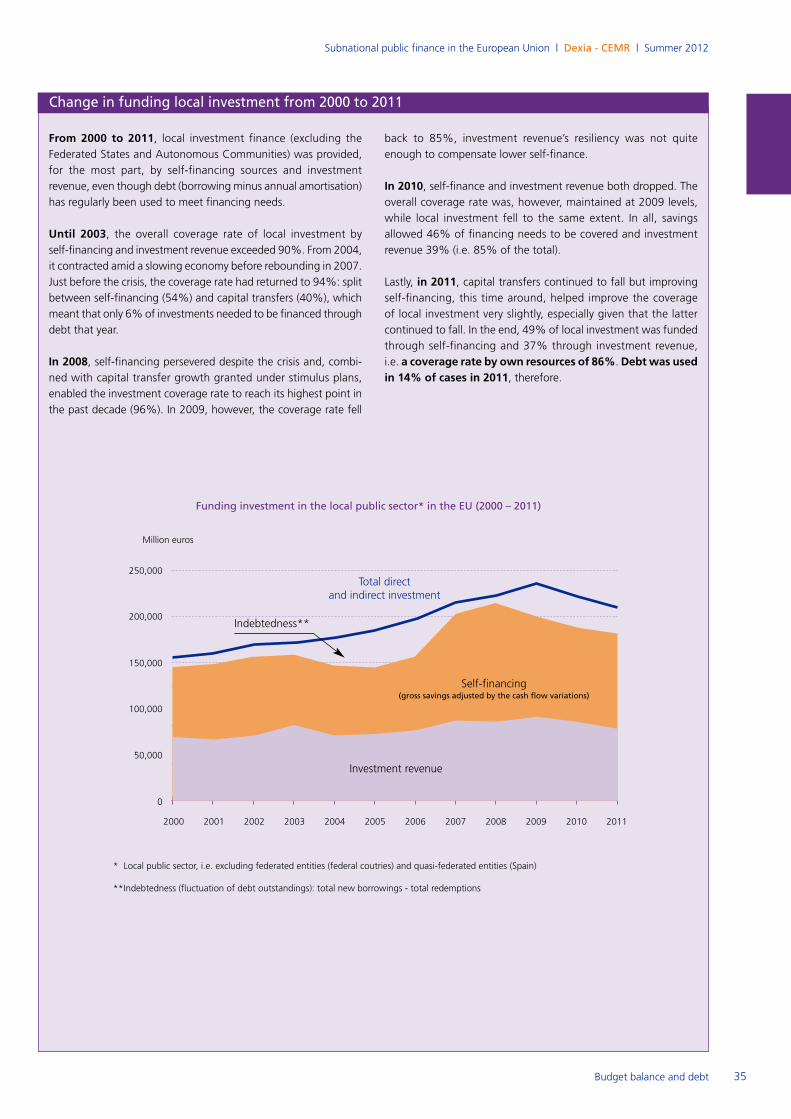
Subnational public finance in the European Union | Dexia - CEMR | Summer 2012
35Budget balance and debt
Change in funding local investment from 2000 to 2011
Funding investment in the local public sector* in the EU (2000 – 2011)
Million euros
250,000
200,000
150,000
100,000
50,000
0
2000 2001 2002 2003 2004 2005 2006 2007 2008 2009 2010 2011
Self-financing(gross savings adjusted by the cash flow variations)
Total direct and indirect investment
Indebtedness**
Investment revenue
* Local public sector, i.e. excluding federated entities (federal coutries) and quasi-federated entities (Spain)
**Indebtedness (fluctuation of debt outstandings): total new borrowings - total redemptions
From 2000 to 2011, local investment finance (excluding the
Federated States and Autonomous Communities) was provided,
for the most part, by self-financing sources and investment
revenue, even though debt (borrowing minus annual amortisation)
has regularly been used to meet financing needs.
Until 2003, the overall coverage rate of local investment by
self-financing and investment revenue exceeded 90%. From 2004,
it contracted amid a slowing economy before rebounding in 2007.
Just before the crisis, the coverage rate had returned to 94%: split
between self-financing (54%) and capital transfers (40%), which
meant that only 6% of investments needed to be financed through
debt that year.
In 2008, self-financing persevered despite the crisis and, combi-ned with capital transfer growth granted under stimulus plans,
enabled the investment coverage rate to reach its highest point in
the past decade (96%). In 2009, however, the coverage rate fell
back to 85%, investment revenue’s resiliency was not quite
enough to compensate lower self-finance.
In 2010, self-finance and investment revenue both dropped. Theoverall coverage rate was, however, maintained at 2009 levels,
while local investment fell to the same extent. In all, savings
allowed 46% of financing needs to be covered and investment
revenue 39% (i.e. 85% of the total).
Lastly, in 2011, capital transfers continued to fall but improving
self-financing, this time around, helped improve the coverage
of local investment very slightly, especially given that the latter
continued to fall. In the end, 49% of local investment was funded
through self-financing and 37% through investment revenue,
i.e. a coverage rate by own resources of 86%. Debt was usedin 14% of cases in 2011, therefore.
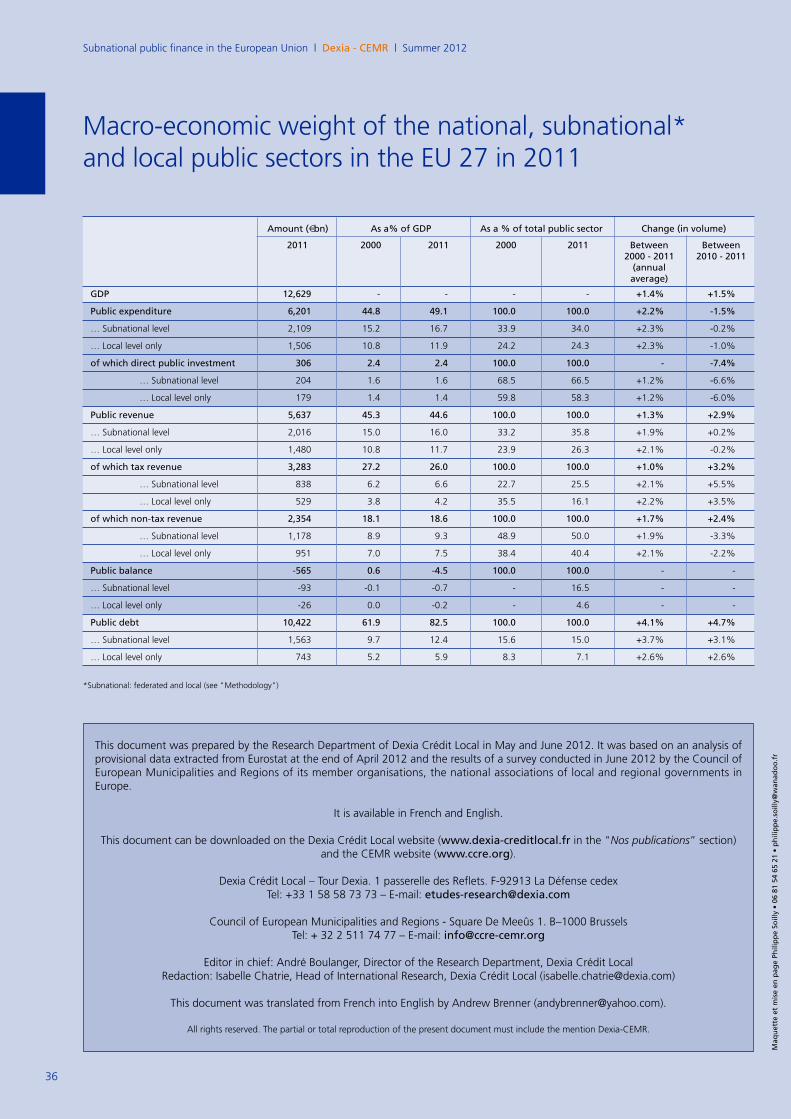
Subnational public finance in the European Union | Dexia - CEMR | Summer 2012
36
Maq
uet
te e
t m
ise
en p
age
Phili
ppe
Soill
y • 06
81
54 6
5 21
• p
hili
ppe.
soill
y@w
anad
oo.fr
Amount (€bn) As a% of GDP As a % of total public sector Change (in volume)
2011 2000 2011 2000 2011 Between Between2000 - 2011 2010 - 2011
(annualaverage)
GDP 12,629 - - - - +1.4% +1.5%
Public expenditure 6,201 44.8 49.1 100.0 100.0 +2.2% -1.5%
… Subnational level 2,109 15.2 16.7 33.9 34.0 +2.3% -0.2%
… Local level only 1,506 10.8 11.9 24.2 24.3 +2.3% -1.0%
of which direct public investment 306 2.4 2.4 100.0 100.0 - -7.4%
… Subnational level 204 1.6 1.6 68.5 66.5 +1.2% -6.6%
… Local level only 179 1.4 1.4 59.8 58.3 +1.2% -6.0%
Public revenue 5,637 45.3 44.6 100.0 100.0 +1.3% +2.9%
… Subnational level 2,016 15.0 16.0 33.2 35.8 +1.9% +0.2%
… Local level only 1,480 10.8 11.7 23.9 26.3 +2.1% -0.2%
of which tax revenue 3,283 27.2 26.0 100.0 100.0 +1.0% +3.2%
… Subnational level 838 6.2 6.6 22.7 25.5 +2.1% +5.5%
… Local level only 529 3.8 4.2 35.5 16.1 +2.2% +3.5%
of which non-tax revenue 2,354 18.1 18.6 100.0 100.0 +1.7% +2.4%
… Subnational level 1,178 8.9 9.3 48.9 50.0 +1.9% -3.3%
… Local level only 951 7.0 7.5 38.4 40.4 +2.1% -2.2%
Public balance -565 0.6 -4.5 100.0 100.0 - -
… Subnational level -93 -0.1 -0.7 - 16.5 - -
… Local level only -26 0.0 -0.2 - 4.6 - -
Public debt 10,422 61.9 82.5 100.0 100.0 +4.1% +4.7%
… Subnational level 1,563 9.7 12.4 15.6 15.0 +3.7% +3.1%
… Local level only 743 5.2 5.9 8.3 7.1 +2.6% +2.6%
*Subnational: federated and local (see "Methodology")
Macro-economic weight of the national, subnational* and local public sectors in the EU 27 in 2011
This document was prepared by the Research Department of Dexia Crédit Local in May and June 2012. It was based on an analysis ofprovisional data extracted from Eurostat at the end of April 2012 and the results of a survey conducted in June 2012 by the Council ofEuropean Municipalities and Regions of its member organisations, the national associations of local and regional governments inEurope.
It is available in French and English.
This document can be downloaded on the Dexia Crédit Local website (www.dexia-creditlocal.fr in the "Nos publications” section) and the CEMR website (www.ccre.org).
Dexia Crédit Local – Tour Dexia. 1 passerelle des Reflets. F-92913 La Défense cedexTel: +33 1 58 58 73 73 – E-mail: [email protected]
Council of European Municipalities and Regions - Square De Meeûs 1. B–1000 BrusselsTel: + 32 2 511 74 77 – E-mail: [email protected]
Editor in chief: André Boulanger, Director of the Research Department, Dexia Crédit LocalRedaction: Isabelle Chatrie, Head of International Research, Dexia Crédit Local ([email protected])
This document was translated from French into English by Andrew Brenner ([email protected]).
All rights reserved. The partial or total reproduction of the present document must include the mention Dexia-CEMR.