Embed Size (px)
Citation preview

WORLD ENERGY COUNCIL CONSEIL MONDIAL DE L’ÉNERGIE
World Energy Resources E-storage: Shifting from cost to value Wind and solar applications 2016

Officers of the World Energy Council
Marie-José Nadeau Chair
Younghoon David Kim Co-chair
Leonhard Birnbaum Vice Chair Europe
Oleg Budargin Vice Chair Responsibility for Regional Development José da Costa Carvalho Neto Chair Programme Committee
TBC Vice Chair Asia Pacific/South Asia
Jean-Marie Dauger Chair Communications & Outreach Committee
Hon. Hasan Murat Mercan Vice Chair 2016 Congress, Istanbul
Bonang Mohale Vice Chair Africa
O.H. (Dean) Oskvig Vice Chair North America
Brian A. Statham Chair Studies Committee
José Antonio Vargas Lleras Vice Chair Latin America/Caribbean
Klaus-Dieter Barbknecht Vice Chair Finance
Nuer Baikeli Vice Chair Asia
Matar Al Neyadi Vice Chair Special Responsibility Gulf States & Middle East
Christoph Frei Secretary General
E-storage: shifting from cost to value Wind and solar applications
World Energy Council Copyright © 2016 World Energy Council
All rights reserved. All or part of this publication may be used or reproduced as long as the following citation is included on each copy or transmission: Used by permission of the World Energy Council, London, www.worldenergy.org’
Published 2016 by: World Energy Council 62-64 Cornhill London EC3V 3NH United Kingdom
Registered in England and Wales
No. 4184478 VAT Reg. No. GB 123 3802 48 Registered Office 62-64 Cornhill London EC3V 3NH
ISBN: 978 0 946121 44 1

Contents
Executive summary ...................................................................................... 4 Recommendations ............................................................................................... 4 Metrics for cost of energy ................................................................................... 4 Methodological challenges ................................................................................. 5 Shifting from cost to value: key messages ....................................................... 6
1. Introduction ............................................................................................ 8
2. Technology ............................................................................................. 9 Technology overview .......................................................................................... 9
Potential for cost reduction in production ........................................................... 13 Case studies ....................................................................................................... 14
3. Cost modelling ..................................................................................... 16 Approach ............................................................................................................ 17
Metrics................................................................................................................ 17 Specific investment costs ...................................................................................... 18 Levelised cost of energy and levelised cost of storage ......................................... 18
Application cases ............................................................................................... 19 Results ................................................................................................................ 20
Specific investment costs................................................................................... 20 Levelised cost of storage ................................................................................... 22 Levelised cost of storage, co-located with PV ................................................... 23 Levelised cost of storage, co-located with wind plant ........................................ 24
Limitations of the results .................................................................................. 25
4. Discussion and recommendations ..................................................... 27 Methodological challenges ............................................................................... 28 Implications ........................................................................................................ 30 Recommendations ............................................................................................. 31
Appendix 1: Technology tables ................................................................. 32
Appendix 2: Modelling assumptions ......................................................... 36 Assumptions for short term storage................................................................ 40 Assumptions for long term storage ................................................................. 41
Appendix 3: Characteristics of volatility of wind and PV ......................... 42
Appendix 4: List of references ................................................................... 44
Appendix 5: Glossary ................................................................................. 46
Appendix 6: Table of figures and tables .................................................... 48 List of figures ...................................................................................................... 48 List of tables ....................................................................................................... 49
Appendix 7: Project participation .............................................................. 50

E-storage: Shifting from cost to value, wind and solar applications - 2016
4
Executive summary
Following rapid cost reductions and significant improvements in capacity and efficiency, the global energy sector is captivated by the promise of deploying energy storage alongside renewables. Storage is promoted as the “game-changer” which could contribute to solving the volatility challenge of wind and solar electricity generation. Whilst there is plenty of visionary thinking, business models are not always fully understood and there are not many studies on cost data.
This report seeks to analyse what the cost base of an array of storage technologies really means. A key conclusion is that a narrow focus on levelised cost alone can be misleading. Throughout the cost modelling process, the same issues repeatedly emerged, namely the importance of defining the business model under consideration and how the storage plant was being operated. Although the report focused on cost, it led to a number of insights on the value of storage from which certain recommendations can be made.
Recommendations Recommendations for policymakers include:
To focus less on an investment cost only approach for storage technology assessment, where only technologies with the lowest levelised cost of storage (LCOS)1 are rewarded. Cheapest is not always best, or possible.
To examine storage through holistic case studies within a specific context, rather than place faith in generic cost estimations.
To accelerate the development of flexible markets, working with transmission and distribution system operators and regulators to help quantify and realise the true potential value of increasing system flexibility2.
To establish policy support and an enabling regulatory framework to facilitate further commercial deployment of storage technologies.
To consider storage as a key component when planning for grid expansion or extension.
Metrics for cost of energy A common metric employed when comparing the cost profile of different generation technologies is the levelised cost of energy (LCOE3). This report defines and models
1 LCOS is defined as the levelised cost of storage (LCOS) and is the (fictitious) average ‘net’ price that must be received per unit of output (effectively kWh or MWh) as payment for storing and discharging power in order to reach a specified financial return. In other words, it reflects the average ‘net’ price the project must earn per megawatt-hour (sold over the entire lifetime of the technology) in order to break even on the investment and operational costs. The LCoS calculation standardises the units of measuring the lifecycle costs of storing and discharging electricity, thereby facilitating the comparison of the cost of discharging one megawatt-hour of stored electric energy by each technology. 2 In the US, relevant actors would be independent system operators and regional transmission operators. 3 For the purposes of this paper, LCOE is defined as the levelised cost of electricity (LCOE) and is the (fictitious) average price that must be received per unit of output (effectively kWh or MWh) as payment for producing power in order to reach a specified financial return. In other words, it reflects the average price the project must earn per megawatt-hour (sold over the entire lifetime of the technology) in order to break even on the investment and operational costs. The LCOE calculation standardises the units of measuring

E-storage: Shifting from cost to value, wind and solar applications - 2016
5
two plausible applications of storage: storage with solar plant and storage with wind plant, assessing the resultant LCOS of a storage plant4. The load factor and the average discharge time at rated power is an important determinant of the LCOS, with the cycle frequency becoming a secondary parameter.
For solar-storage: The application case considered for solar-storage was daily storage, with six hours discharge time at rated power. For this predefined application, the most competitive energy storage technologies had LCOS of 50-200 €/MWh. By 2030, a much wider range of technologies offered LCOS below 100 €/MWh. Looking to 2030, it is particularly striking that battery technology becomes much more competitive.
For wind-storage: The application case considered for wind-storage was a two-day storage structure, with 24 hours discharge time at rated power. For this predefined application, few technologies appeared attractive. The levelised costs are higher for the wind-storage case than the solar-storage case, because of the high sensitivity of the LCOS to the number of discharge cycles per year, and the suboptimal energy-to-power ratios required for the wind-storage case as defined.
General LCOS analysis: An important aspect about the LCOS of storage is that it will always depend on the load factor for discharging and therefore the way it is used cannot be ignored. However, for these hypothetical cases, if the constraints of the solar and wind application cases are ignored, the findings show a significant decrease in cost for the majority of storage technologies from the 2015 study period to 2030. Battery technologies followed by sensible thermal, latent thermal and supercapacitors show the greatest reduction in cost. Battery technologies show a reduction from the 2015 study period around 100-700 €/MWh to 50-190 €/MWh in 2030 (€_2014), which is a reduction of over 70% in the upper cost limit in the coming years. Pumped storage shows the lowest cost reduction, due to the current maturity level of the technology, followed by compressed air energy storage.
Important assumptions to note in relation to the LCOS formula are that it excludes the costs of the wind or solar plant; a zero cost for the energy imported into the storage system; Weighted Average Cost of Capital (WACC) was calculated at 8% and this figure was also used to discount future electricity discharge. Cost estimates were developed both for the 2015 study period (based on studies from 2012 to 2014) and for 2030 (€_2014). Cost ranges of the solar-storage and wind-storage plant are specific to the application cases.
Methodological challenges The report uncovered various methodological challenges. The focus of the cost modelling was to better understand and investigate the underlying economics and cost methodologies for storage plant. During the process, challenges of using LCOS as a metric to determine storage costs became clear.
However, using the LCOS metric has many advantages:
Familiarity: This metric is commonly used and well understood, as it is used as a key economic parameter for renewables and for power plants more generally.
the lifecycle costs of producing electricity thereby facilitating the comparison of the cost of producing one megawatt hour by each technology. 4 For further differentiation between LCOE and LCOS, please refer to Section 3.

E-storage: Shifting from cost to value, wind and solar applications - 2016
6
Comparison across technologies: This metric allows storage costs to be framed alongside the generation costs of other power plants.
A comparison point against revenue: The LCOS can be compared against possible revenues, such as average price spreads or support mechanisms. However, it can only be considered to be a rough proxy of the revenue which would be required for the project to be economically viable.
On the other hand, the cost modelling of this report also revealed two challenges for energy storage cost modelling, which are not encountered when applying this metric to renewables:
Arbitrariness: Storage levelised costs are arbitrary since the amount of energy (kWh) stored and discharged by the storage plant over a period can vary depending on the application.
Incompleteness: Storage levelised cost estimations are incomplete, since they do not cover the needed business models and its characteristics for storage. In the LCOE philosophy, the required revenue is only reflected by the applied discount factor (which is related to a predetermined return for the investor, reflected in the ‘weighted average cost of capital’, the WACC). Since it neglects higher potential revenues, e.g., from providing flexibility, it is a simplified approach for the actual value of storage.
Shifting from cost to value: key messages The key conclusions based on the analysis of this report are that:
Context matters: Economic analysis of storage conducted without a specific context, is both arbitrary and incomplete. Applications should be assessed on a case-by-case basis.
Wide variation in energy storage costs: This reflects the immaturity of the storage industry in combination with generation and grid applications. Increased use of renewable energy generation will increase the demand for energy storage and then economies of scale and improvements in the manufacturing and engineering of batteries will bring costs down further over the next couple of years.
Public enthusiasm for storage is justified, but for the wrong reason. Cost reduction of storage is important, yet insufficient. The important metric is value, where value is a function of both cost and revenue. The value of storage can be evaluated differently according to the market; the intrinsic and extrinsic value of storage and the costs avoided by its operation.
The industry's focus on cost seems to stem from two areas. Firstly, it is a legacy from the renewables industry, which tends to have a very narrow focus on LCOE, as it benefited from policy mechanisms which de-risk its revenue streams. Secondly, the focus on cost stems from the fact that in most energy markets, flexibility is not sufficiently valued or monetised. This narrow focus on levelised cost helps explain why the business case for storage is often poorly formulated, resulting in misperceptions.
From a country and societal perspective, the value of storage is the ability to provide power quality and reliability, and security of supply. This can be in the form of uninterrupted power supply to end-users, providing some reserve margin or initial power to restart the grid after a blackout. In this context, high reliability is more important than high costs.

E-storage: Shifting from cost to value, wind and solar applications - 2016
7
Storage creates additional value through its function to level the load, it enables deferral of grid investment, especially at congestion points and creates the possibility of price arbitrage.

E-storage: Shifting from cost to value, wind and solar applications - 2016
8
1. Introduction
Power systems have to be flexible to allow supply and demand to be balanced at all times. As the deployment of wind and solar generation increases globally, the challenge of managing increased volatility of generation grows and hence, the need for increased system flexibility is becoming more urgent. Electricity storage is an important option to provide this additional flexibility.
Following reports of rapid cost reduction, the global energy sector is enthusiastic about the promise of using storage to assist in solving this flexibility challenge5,6,7. It is often proclaimed that storage will prove to be a "game changer" for the energy industry, disrupting business models and technology operations in the process8,9,10. Whilst there is plenty of visionary thinking, there is a gap in solid cost data.
This report seeks to investigate and understand the cost base of an array of storage technologies. The goal was not to collect new cost data on technologies, but to use modelling to interrogate what the existing data really shows.
Energy storage technologies can be defined to incorporate all forms of energy. For the purposes of this report, it is defined as a system installed within a power system that can, given an independent control, store electrical energy generated within the power system, and release when required. This energy can be stored in various forms.
The application of renewables alongside storage is one of many models which are being pursued. Energy storage is also being deployed in stand-alone grid-level applications and in electric vehicles. Although heat and gas storage are not a primary focus of this report, as discussed in the following section, heat can be used as a form to store electrical energy.
The report is structured as follows:
Section 2: Technology overview: an introduction to energy storage technologies and case studies of how it is already being applied.
Section 3: Cost modelling: a summary of the cost analysis work done for this report.
Section 4: Discussion and recommendations: including next steps for policymakers.
5 ARENA, 2015: Energy Storage Study: A storage market review and recommendations for funding and knowledge sharing priorities, http://arena.gov.au/ 6 IRENA, 2015: Battery Storage for Renewables: Market status and technology outlook, http://www.irena.org/ 7 Nykvist and Nilsson, 2015: "Rapidly falling costs of battery packs for electric vehicles" in Natural Climate Change 5, 329-332, http://www.nature.com/ 8 Price, 2015: "Energy storage is a game changer", http://www.imeche.org/ 9 Makower, 2015: "State of Green Business: Energy storage becomes a game changer", http://www.greenbiz.com/ 10 Olson and Chediak, 2014: "Battery storage may vie with US oil boom as energy game changer", http://www.renewableenergyworld.com/

E-storage: Shifting from cost to value, wind and solar applications - 2016
9
2. Technology
Section overview
Storage technologies: There are a number of energy storage technologies, covering both short and long term applications.
Technology classification: Storage technologies can be classified based on scientific categorisation, on performance characteristics, and on storage duration. The combination of these characteristics defines the potential application and business models of each storage technology.
Application-specific technology: Specific subsets of storage technologies are suitable for certain applications. The power vs energy density of a storage device is the key to defining this.
This section gives an overview of energy storage technologies and recent case studies of how and why storage is deployed.
Technology overview Energy storage is not a single technology, but rather refers to a suite of diverse technologies. This section serves as an introduction to the key differences between technologies, providing the necessary background for the cost modelling in Section 2. Due to the wide range of technologies, it is important to begin by outlining the types of technologies which can be deployed and the different roles that they can play within the energy system.
Storage technologies can be categorised and clustered in many different ways, according to:
Scientific categorisation i.e. mechanical, thermal, chemical, electro-chemical and electrical. See Figure 1 below.
Key performance characteristics i.e. according to the discharge time at rated power and energy capacity. See Figure 2 below.
Storage duration i.e. seconds to minutes, daily, weekly to monthly. See Figure 3 below.
Maturity i.e. research and development, demonstration and deployment, commercialisation. See Figure 4 below.
The combination of the above characteristics defines the potential application and feasible business models of each storage technology.
Figure 1 separates the technologies examined in this report into five categories, which are used to distinguish between the forms in which the energy is stored. The five

E-storage: Shifting from cost to value, wind and solar applications - 2016
10
categories are mechanical, thermal, chemical, electro-chemical and electrical storage systems11.
Figure 1: Scientific categorisation of storage Source: PwC, 2015. CAES is Compressed Air Energy Storage; LAES is Liquid Air Energy Storage; SNG is Synthetic Natural Gas.
Currently, world energy storage capacity is dominated by pumped hydropower storage. Analysis of energy storage projects compiled by the US Department of Energy shows that pumped hydropower storage capacity in operation worldwide forms over 97% of the total storage capacity in operation12.
Each technology and category has advantages and disadvantages which can be mapped to the applications that are most suited to each specific technology. The technologies have a range of different performance characteristics, summarised in Figure 2 below, based on their energy capacity and discharge time at rated power. These are considered the most relevant characteristics for the purposes of this report, though other characteristics may of course be relevant, depending on the application. Supercapacitors and batteries are associated with the characteristics of lower energy capacity and shorter discharge time at rated power and are therefore more suited to higher power applications. By contrast, power-to-gas (P2G) technologies are associated with the characteristics of higher energy capacity and a longer discharge time at rated power. These are better suited to storing large amounts of energy which is discharged over longer periods of time.
11 Both CAES and LAES are classified as mechanical forms of storage. However, both also can have characteristics of thermal storage, as they may produce or consume heat or 'cold', which could also be stored, or which could be used in industrial processes to improve the overall project economics. 12 Global Energy Storage Database, http://www.energystorageexchange.org/ . Analysis was constrained to Operational projects only. The database may not capture all small-scale and domestic-scale projects and therefore is likely to underestimate battery storage capacity in particular. However, the dominance of pumped hydropower storage is clear.
Electrical Energy Storage Systems
Mechanical
Pumped-storage
Hydropower
CAES
LAES
Flywheels
Thermal
Thermo-chemical
Sensible thermal
Latent thermal
Chemical
Hydrogen Storage
SNG
Electro-chemical
Lithium-Ion Battery
Lead Acid Battery
NaS Battery
Redox flow Battery
Electrical
Super-capacitors

E-storage: Shifting from cost to value, wind and solar applications - 2016
11
Figure 2: Mapping storage technologies according to performance characteristics Source: PwC, 2015, following Sterner et al. 2014
The following two examples emphasise that not all storage devices are suitable for all applications: a grid connected storage system co-located with renewables may need a combination of both the ability to shift energy on an hourly basis, whilst also supplying high power at other times of the day to deal with the inherent volatility problems associated with renewable energy. Hence, as shown in Figure 3, battery technologies are often suited to such an application. As a comparison, to support the balancing of national power systems and in order to supply adequate reserve capacity, storage devices which are able to time-shift large amounts of energy over daily time periods are required; in this case technologies such as pumped hydropower storage are more pertinent.
Figure 3 further illustrates the challenge of comparing storage technologies on a like to like basis. Similar to Figure 2, the storage technologies are categorised according to the Energy to Power Ratio (E2P) or 'discharge time'. However, in Figure 3, the mapping is continued to the most relevant aspects of the business case for each technology.

E-storage: Shifting from cost to value, wind and solar applications - 2016
12
Figure 3: Duration and frequency of power supply Source: PwC, 2015, following ISEA Aachen, 201213; E2P stands for Energy to Power Ratio
Figure 4 below indicates the commercial maturity of storage technologies. Pumped hydropower storage and compressed air energy storage are the most mature and other technologies bring a cost and risk premium due to their lower levels of commercial maturity. As technologies move from demonstration and deployment stage to commercialisation, the cost of the technology reduces and the technical characteristics are often enhanced. For example, in certain technologies, technical progress to date has seen the overall round trip efficiency increase and lifetime of the storage system improve. The time in which technologies mature is driven by many factors such as market incentives, installation volumes, technical constraints and geographical restrictions.
13 Institut für Stromrichtertechnik und Elektrische Antriebe RWTH Aachen (ISEA), 2012: "Technology Overview on Electricity Storage"
Dur
atio
n an
d fr
eque
ncy
of
pow
er s
uppl
y "Seconds to minutes“
Short term energy storage systems
E2P ratio: 0,25h
Batteries Supercapacitors
Flywheels
"Daily storage“ Medium term energy
storage systems E2P ratio: 1 - 10h
Batteries Pumped hydropower
storage CAES / LAES
Thermochemical Redox Flow
"Weekly to monthly“ Long term energy storage
E2P ratio: 50 - 500h
Sensible / Latent thermal
PtG
• Grid services • Compensation for day-
night load imbalance • Peak shaving, valley
filling, load shifting • Correction of forecast
errors of renewable producers
• Prevention of re-dispatch • Opportunity of spot
market price fluctuations
• Future application to bridge periods of low wind and photovoltaic generation
• Seasonal storage for thermal energy

E-storage: Shifting from cost to value, wind and solar applications - 2016
13
Figure 4: Storage technology maturity, for grid applications Source: IEA, 201414.
Potential for cost reduction in production Energy storage is often regarded in terms of high capital costs, but for several storage technologies there is reason to believe that costs will fall as production volumes increase. Figure 5 below shows the experience curve for Lithium-ion batteries for electrical vehicles, compared to consumer Lithium-ion batteries. Experience curves are based on the observation that for manufactured products, each time the total amount of that product is doubled, the cost declines by a certain percentage. Part of this reduction can be attributed to economies of scale, manufacturing and engineering improvements.
Figure 5: Experience curve for Lithium-ion battery Source: Bloomberg New Energy Finance, 2015 BNEF stands for Bloomberg New Energy Finance, EV stands for electric vehicle, LiB stands Lithium-Ion battery
14 International Energy Agency (IEA), 2014: "Technology Roadmap"

E-storage: Shifting from cost to value, wind and solar applications - 2016
14
Case studies As described above, energy storage deployment is case-specific and therefore, real-life application cases from the power sector are described below to illustrate how storage technologies are already being used.
Case study: Enel Green Power PV storage project, Catania 1, Italy
This project was built in 2014-15 and consists of a 10 MW PV plant (limited to 8 MW due to grid constraints) and a sodium-nickel chloride battery (NaNiCl2) of 1 MW/ 2 MWh .This technology was selected due to its energy intensive application.
The energy is sold to the market, with the stored energy classifying as green energy, under existing incentives for the PV plant. The roles performed by the storage plant are as follows:
Active energy management Improved predictability of generation Less volatile generation profile Provision of ancillary services to the grid
There were challenges in integrating the new system with the existing system, and with the system for real time remote control and energy management. Installing the storage system involved several upgrades on the power plant itself and defining a new framework for authorisation required the involvement of several authorities.
Case study: Off-grid hybrid storage project, Ollagüe, Chile
This project was built in 2014consisting of PV (200 kW), wind (30 kW), a sodium-nickel chloride battery (NaNiCl2) of 520 kWh net for users and a diesel generator.
The aim was for this off-grid power plant to provide energy 24 hours a day to the local mining community and in particular to:
Reduce diesel consumption Provide energy throughout the night
The project is located in an extremely harsh environment, with extreme daily temperature ranges and dusty conditions. Robust technologies were needed for both the PV system (3Sun double glass PV modules) and for the storage unit (BESS sodium nickel chloride by Fiamm, and redundant inverters by Nidec-ASI).

E-storage: Shifting from cost to value, wind and solar applications - 2016
15
Case study: InovCity grid-connected energy storage in Évora, Portugal
This project was built in 2015 consisting of a battery storage system of 393kW / 196kWh, connected to the MV distribution grid.
The purpose of the project is to demonstrate how an energy storage system can contribute to the EDP Distribuição's main technical challenges
Increase in grid reliability Improvement of grid power quality Reduction of grid losses
The main function is to provide backup to the main load/client. Nevertheless, there are other auxiliary functions under investigation, such as fault-ride-through (for grid support), peak-shaving (for grid loss reduction) and voltage control.
There were challenges in developing a priority management plan to achieve system optimisation. Grid simulation studies were necessary in order to obtain authorisation to connect the storage system to the distribution network.

E-storage: Shifting from cost to value, wind and solar applications - 2016
16
3. Cost modelling
Section overview
Approach: The cost analysis has been developed based on a literature review, cost modelling, and review by the World Energy Council membership.
Metrics: The two key metrics considered in the analysis are specific investment costs and levelised cost of storage (LCOS)15. These are estimated based on recent cost data (from studies undertaken in 2012-2015 and referred to as ‘the 2015 study period’ throughout the report) and 2030 conditions (€_2014). LCOS in particular, raises methodological difficulties, which are discussed in detail.
Application cases: The modelling of levelised cost is applied to two hypothetical, but standardised application cases, namely solar storage and wind storage.
Solar storage results: Assuming daily cycles and six hours discharge time at rated power, the most competitive technologies have LCOS of 50-200 €/MWh, though these are technologies which are not necessarily suited to all PV projects. Battery technologies are next, around 200-400 €/MWh. By 2030, a much wider range of technologies offer LCOS below 100 €/MWh. Looking to 2030, it is particularly striking that battery technology becomes especially more competitive, with sodium (NaS), lead acid and lithium-ion technologies leading the way.
Wind storage results: This application assumes a two-day cycle structure and 24 hours discharge time at rated power. Few technologies appear attractive. Levelised costs are much higher for the wind storage case than the solar storage case because of the high sensitivity of the LCOS to the number of discharge cycles and the sub-optimal energy-to-power ratios required for the wind storage case as defined.
It is important to stress that the cost ranges of the solar storage and wind storage plant are specific to the application cases and assumptions defined in this report.
15 See ‘Levelised cost of energy and levelised cost of storage’ in Section 3.

E-storage: Shifting from cost to value, wind and solar applications - 2016
17
This section summarises the results of economic modelling of the cost of different storage technologies, both in the 2015 study period and projections out to 2030. The objective is not to collect new cost data on technologies, but to conduct modelling that interrogates what existing data really means.
Tables documenting underlying assumptions, references and definitions of key terms are found in Appendices 1 and 2.
Approach The cost analysis of this project has been led by PwC and the approach is summarised in Figure 6 below. This leads to three key sets of results, namely the specific investment costs, the general application levelised cost of storage (LCOS) and the application-based LCOS. These results are presented in Section 3.
Figure 6: Approach to cost modelling
Metrics The two metrics examined are specific investment costs (SIC), and levelised cost of storage (LCOS). However, a key driver for both metrics is the E2P ratio16, which is assumed for each storage technology individually. This parameter directly influences the investment costs as well as the amount of electricity which can be stored for a given number of cycles per year.
16 The E2P ratio defines the discharge time at rated power.
Literature review (see list of
references in Appendix 4)
Development of key assumptions and
parameters (detailed in Appendix 1 and 2)
Cost modelling
Scrutiny by the World Energy
Council membership
Clarifications and revisions
Results of Cost modelling

E-storage: Shifting from cost to value, wind and solar applications - 2016
18
The E2P ratios used within the calculations are as follows:
Storage technology E2P ratio min. (h) E2P ratio max. (h)
Pumped Hydro 100 100
Compressed Air (adiabatic) 6 6
Lithium 1 4
Sodium Sulphur NaS 6 6
Lead Acid 1 4
Redox Flow 1 4
Thermochemical Storage 6 6
Supercaps 0.25 0.25
Flywheels 0.25 0.25
Sensible Thermal Storage 200 200
Latent Thermal Storage 200 200
Power to Gas H2 200 200
Power to Gas SNG 200 200
Specific investment costs The metric of specific investment costs (SIC) describes the installation costs for power and energy storage capacity. In the following work, we refer to the specific investment costs in €/kW, i.e. the investment cost per installed discharging capacity (€/kW). The individual energy capacity is reflected in the assumed E2P ratio (hours) as per the table above.
Levelised cost of energy and levelised cost of storage The metric of LCOE is typically used in the industry to assess the cost of electricity from different power plant types. In this analysis the formula has been transferred to storage technologies, as an economic exploration of the discharging side of energy storage. Because storage plant does not generate power and depends on another generating technology, the formula is referred to as the levelised cost of storage (LCOS). It still enables comparison between different types of storage technologies in terms of average cost per produced / stored kWh.
The levelised cost calculation used is summarised as follows:
Note that the annual total costs, At, consist of annual fixed costs and other variable costs.
Discounted rate (WACC) (%)

E-storage: Shifting from cost to value, wind and solar applications - 2016
19
Other main assumptions include:
The weighted average cost of capital (WACC) is 8%; this figure is also used to discount future electricity discharge
No change in parameters or prices during lifetime The cost (price) for input (charging) electric power is taken as zero Technical lifetimes are as summarised in Figure 15, Appendix 2 Specific technology assumptions are documented in the tables in Appendix 2
Table 1: Explanation of LCOS calculation Input Variables Elements Example values
Investment costs (€) Specific investment cost * rated power
700 - 1500 €/kW * rated power
Annual total costs in year t (€)
Operational costs (in %) * Investment costs
2% * Investment costs
Produced electricity in each year (kWh)
Rated power * Equivalent full-load hours * Efficiency
Rated power *1460 h/a * 80%
Technical lifetime (years)
Technical lifetime 50 years
Discount rate (WACC) Discount rate 8%
It is important to note that the generated electricity is strongly dependent on the assumed application (linked with the cycles per year. LCOS for energy storage is not identical to LCOE for generating technologies. This difficulty is recognised, but the concept is found useful within the industry17,18. Some organisations specifically use the term 'Levelised Cost of Storage' (LCOS)19.
For the LCOS formula, it is crucial to note that the cost of the input energy is not included. This is done for clarity and to avoid obscuring the fundamental issues with too many assumptions. In any specific application, the formula above can be modified to include in the term At the cost of imported energy, and the in/out efficiency of the storage device.
In electricity systems with a large fraction of wind or solar generation, the price of energy during periods of high wind or solar production is likely to be low.
Application cases To help focus the analysis of this report, the cost modelling analyses how energy storage might be deployed alongside renewables. Two application cases are used, summarised in Table 2 below. These are just sample application cases and in practice, storage can operate in a range of ways alongside renewables and also without co-location with renewables.
17 IRENA, 2015: Battery storage for renewables: Market status and technology outlook, http://www.irena.org/documentdownloads/publications/irena_battery_storage_report_2015.pdf 18 DOE/EPRI 2013: Electricity Storage Handbook in Collaboration with NRECA, http://www.sandia.gov/ess/publications/SAND2013-5131.pdf 19 Lazard,2015: LAZARD LAUNCHES LEVELIZED COST OF ENERGY STORAGE ANALYSIS, https://www.lazard.com/media/2394/lazard-launches-levelized-cost-of-energy-storage-analysis_11172015.pdf

E-storage: Shifting from cost to value, wind and solar applications - 2016
20
Table 2: Application cases assumed in cost modelling Application cases
1. Storage co-located with PV 365 cycles/year (daily)
Six hours discharge time at rated power 2. Storage co-located with wind plant 183 cycles/year (two-day structure)
24 hours discharge time at rated power
When applying the LCOS metric, it is important to understand the implications for the assumed application case of the Energy to Power Ratio (E2P). In the cost modelling conducted in this report, where the potential E2P Ratio of a storage plant does not cover the requirements of the application case, the rated power has been increased, to increase the energy capacity. As a consequence, potentially higher investment costs are derived. In the case of lithium, lead acid and redox flow batteries, an E2P Ratio of 4 is applied for each application case. This represents the upper limit applied in the calculation of the general LCOS and is most suitable for the application cases.
Another critical issue is the assumption on usage, i.e. cycles per year. For PV, a daily cycle is fully justified. However, for wind in north-western Europe which has a relatively high penetration of wind generation for example, weather cycles are typically in the order of three to four days (this is described further in Appendix 3). This is driven by the passage of large weather systems eastwards over the Atlantic. Assumptions being used are a four-day cycle for wind applications and usage of the storage device at 90 times per annum. Therefore the LCOS results will be around twice the level for a two-day cycle. This strong effect shows the importance of understanding the application assumptions behind any cost estimate.
One possible alternative to conducting the LCOS analysis based on an application is to calculate the LCOS, assuming the maximum number of full discharge cycles for each technology, as specified in the storage device technical specification. However, in practice, this would not be the case and really presents the best possible case. This approach brings the benefit of revealing the lowest possible LCOS for a storage device and is also presented in the following section. Such an approach risks missing the fundamental relationship between the storage device and its application and therefore, the application approach is also adopted in this report.
Results This section summarises the SIC of each technology20, before moving onto the main results on levelised cost.
Specific investment costs Figure 7 summarises the SIC costs for the 2015 study period, and possible SICs in 2030 are presented in Figure 8. The range or lengths of the bars in these graphs represent both uncertainty, and the effects of location, project size and other variables.
20 Results for Liquid Air Energy Storage were not calculated; although cost data was obtained from a reputable manufacturer, at present there are insufficient other sources of data to use as validation.

E-storage: Shifting from cost to value, wind and solar applications - 2016
21
Figure 7: Specific investment costs for the 2015 study period (€_2014) Source: PwC, 201521
Figure 8: Specific investment costs, 2030 (€_2014) Source: PwC, 2015
Figure 7 and Figure 8 show that, at present, pumped hydropower storage, CAES, lead-acid batteries and flywheels have the lowest SICs. However in 2030 other battery technologies reach a comparable cost to these technologies. The battery and power-to-gas technologies range between 500 - 4000 €/kW currently and are estimated to be between 200 -1800 €/kW in 2030. Both for the 2015 study period and in 2030 thermo-sens and thermo-lat technologies have the highest upper cost limits. However the gap between the technologies is emphasised in the 2030 projections. All technologies show a reduction in overall cost, which could be expected to have a significant impact on the total storage deployed by 2030. The more mature technologies such as pumped hydropower storage show a less significant cost reduction than less mature technologies.
21 PwC, 2015: calculation made by PwC, Sources for Economics parameters: Agora Energiewende (2014) , ISEA Aachen (2012), Fraunhofer IWES, IAEW Aachen, Stiftung Umweltenergierecht (2014), PwC research.

E-storage: Shifting from cost to value, wind and solar applications - 2016
22
Levelised cost of storage This section summarises the general LCOS of each technology, i.e. without applying the application cases for wind or PV described above. Instead, it is assumed that an individual and suitable application process is used and the technical lifetime of which the technology is capable of, is fully utilised, as well as a general number of cycles per year and the E2P ratio is applied (see Appendix 2).
Figure 9 presents the LCOS costs for the 2015 study period, and then Figure 10 shows the possible LCOS costs in 2030.
Figure 9: Levelised cost of energy in the 2015 study period (€_2014) Source: PwC, 2015
Figure 10: Levelised cost of energy in 2030 (€_2014). Source: PwC, 2015

E-storage: Shifting from cost to value, wind and solar applications - 2016
23
Levelised cost of storage, co-located with PV Figure 11 shows the recent (i.e. 2015) LCOS of different energy storage technologies co-located with PV given the assumptions discussed earlier in the section.
Figure 11: Levelised Cost of Storage co-located with PV in the 2015 study period (€_2014) Source: PwC, 2015
In particular, the figure shows the following. On a strict economic basis, and given the assumption that the storage device operates a daily six hour discharge time at rated power, CAES and thermo-chem technologies are most competitive for this particular solar-storage application. These technologies all come in at around 50-200 €/MWh. This is followed by battery technologies and pumped hydropower storage. Though the battery technology costs are higher these technologies are still suited to a solar-storage system, as when multiple applications are stacked, the compromise between power and energy density that battery technologies offer become attractive. Also, CAES and pumped hydropower storage depend on suitable locations, and CAES, pumped hydropower storage and thermo-chem technologies are suited to larger unit sizes than some PV projects.
The technologies with the greatest uncertainties and costs are flywheels, lithium batteries, thermo-lat and super capacitor technologies. This large uncertainty is illustrated by the length of the bar on the chart, and is largely a reflection of the uncertainty in the maturity of these technologies. The high costs associated with flywheels and supercapacitors in this application are due to the technologies being ill-suited to time-shifting large amounts of energy; they are in fact more suited to high power applications. Given the application selected in this report, where the technologies need to discharge at rated power for six hours, multiple devices are used to achieve the desired application, hence the high LCOS costs. Such technologies are generally more suited to dealing with the short term volatility problems associated with renewable integration or applications such as supplying synthetic inertia or fast frequency response services. Figure 12 shows how the LCOS of different energy storage technologies co-located with PV might look in 2030. The cost reduction of batteries is particularly striking, with NaS and lead-acid technologies leading the way.
E-storage: Shifting from cost to value, wind and solar applications - 2016
24
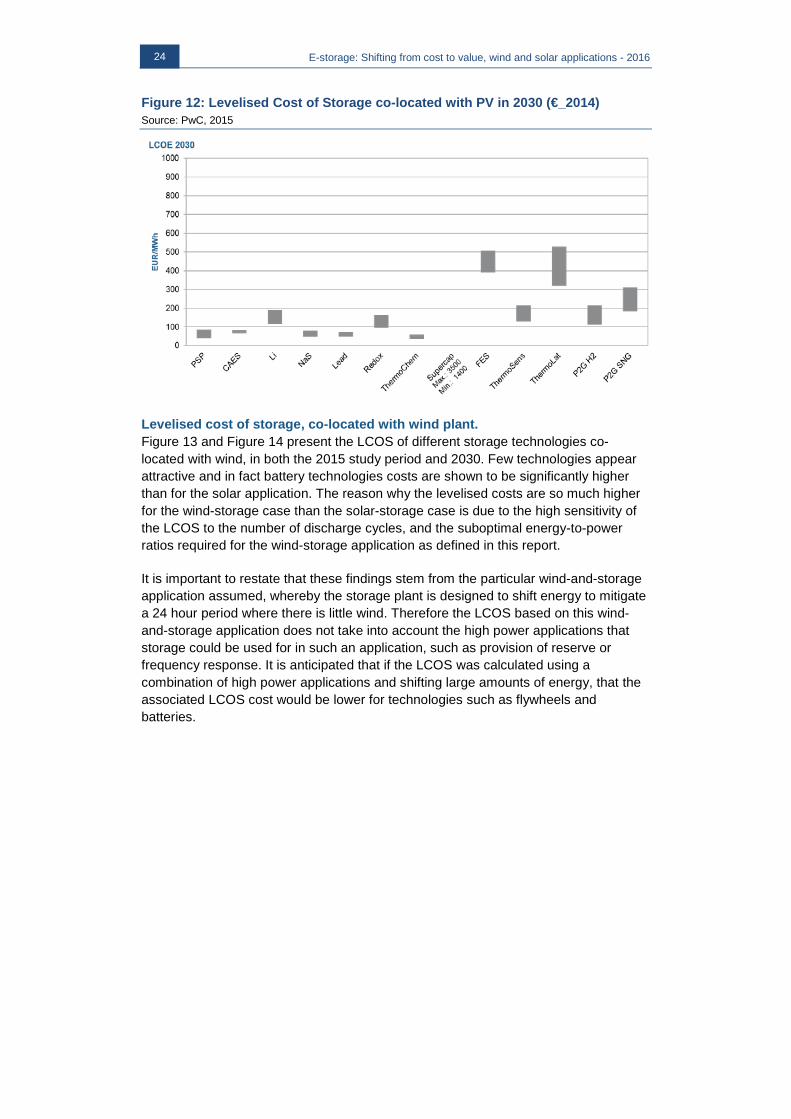
Figure 12: Levelised Cost of Storage co-located with PV in 2030 (€_2014) Source: PwC, 2015
Levelised cost of storage, co-located with wind plant. Figure 13 and Figure 14 present the LCOS of different storage technologies co-located with wind, in both the 2015 study period and 2030. Few technologies appear attractive and in fact battery technologies costs are shown to be significantly higher than for the solar application. The reason why the levelised costs are so much higher for the wind-storage case than the solar-storage case is due to the high sensitivity of the LCOS to the number of discharge cycles, and the suboptimal energy-to-power ratios required for the wind-storage application as defined in this report.
It is important to restate that these findings stem from the particular wind-and-storage application assumed, whereby the storage plant is designed to shift energy to mitigate a 24 hour period where there is little wind. Therefore the LCOS based on this wind-and-storage application does not take into account the high power applications that storage could be used for in such an application, such as provision of reserve or frequency response. It is anticipated that if the LCOS was calculated using a combination of high power applications and shifting large amounts of energy, that the associated LCOS cost would be lower for technologies such as flywheels and batteries.

E-storage: Shifting from cost to value, wind and solar applications - 2016
25
Figure 13: Levelised Cost of Storage co-located with wind in the 2015 study period (€_2014) Source: PwC, 2015
Figure 14: Levelised Cost of Storage co-located with wind in 2030 (€_2014) Source: PwC, 2015
Limitations of the results It is important to note a number of limitations to the cost modelling, the most important of which are documented below:
Definition of application cases: It is difficult to define a "typical" application case for solar-storage and wind-storage, particularly for wind-storage. This is due to the multiplicity of ways that storage plant can be operated, both between different projects and over time. For instance, wind-storage could have quite different characteristics if the onsite storage instead serves the role of frequency response and provides controllable power22. In addition, there are a limited number of commercial deployments to learn from, and real-life brings additional complexities such as the possibility of developing hybrid projects (e.g. wind and solar in
22 Such storage applications have already been piloted in the wind industry, although it should be noted that the rotating masses of turbines can also to some extent provide such services through 'synthetic inertia' functionality.

E-storage: Shifting from cost to value, wind and solar applications - 2016
26
combination with storage). As a result, application cases are possible, rather than representative in nature.
Comparison of such a broad range of storage technologies under one framework: As explained in Section 2, storage is a broad technical area, and different technologies are at different points in their maturity journey, with different strengths - some are more appropriate for short-term storage, others for longer durations. In addition, some storage technologies, such as pumped hydropower storage and CAES, are location-constrained - meaning that even though they might have attractive LCOS, their deployment might in real life be infeasible in some regions. These kinds of constraints are not captured in LCOS charts. Thus, conducting a meaningful comparative analysis of technologies is challenging.
Identification of up-to-date cost inputs: A range of cost estimates can be found in the literature, and the results of this study are contingent upon the quality of the data sources used, which are referenced in Appendices 1 and 2.
Definition of technology pathway to 2030: Clearly, 2030 projections are indicative only and although technology development will reduce the level of uncertainty, the projections are still subject to a certain level of uncertainty given the fast pace of change in this sector. Moreover, (assumptions for) the storage characteristic and its individual application (i.e. E2P ratio and number of cycles) are current and will be key drivers for LCOS.
Real-life decision-making: In this report, to enable comparison between technologies, the levelised costs were calculated against a predefined application case. In real-life commercial deployment, the way that a storage plant is operated would be optimised in conjunction with consideration of the technical characteristics of the selected technology, leading to lower LCOS. In addition, in real-life deployment, the full LCOS of a renewables and storage system would be compared with an alternative means to achieving the same service, such as a diesel generator. The LCOS would be just one of a range of factors influencing technology choice, for instance, carbon emissions, and the logistics of fuel delivery, are examples of other factors which might be relevant.
Regional differentiation: The report takes a global perspective on cost, rather than distinguishing between local differences in cost factors.

E-storage: Shifting from cost to value, wind and solar applications - 2016
27
4. Discussion and recommendations
Section Overview
Two challenges: The cost modelling done for this report shows that the renewables industry faces two main challenges when it applies the LCOS metric:
Arbitrariness: Storage levelised cost estimations are arbitrary, since the application case can vary widely.
Incompleteness: Storage levelised cost estimations are incomplete, since they do not cover the needed business models and its characteristics for storage. In the LCOE philosophy, the needed revenue is only reflected by the applied discount factor (which is related to a predetermined return for the investor, reflected in the ‘weighted average cost of capital’, the WACC). Since it neglects higher potential revenues, e.g., from providing flexibility, it is a simplified approach for the actual value of storage.
Insight: The energy sector has reasons to be enthusiastic about storage, but from the wrong perspective. Although investment cost reduction is important, what matters increasingly, is the growing value of specific storage technologies in specific contexts.
Recommendations: Policymakers should examine storage through holistic case studies in context, rather than place faith in generic cost estimations. Flexible markets should be developed as a matter of urgency.
The previous section summarises the results of the cost modelling. This section discusses the results in more detail for the following aspects:
Methodological challenges Implications Policymaker recommendations

E-storage: Shifting from cost to value, wind and solar applications - 2016
28
Methodological challenges The focus of the cost modelling was not so much the particular numbers, but rather to better understand and interrogate the underlying economics of storage plant. In particular, the application cases studied were chosen to illustrate the important issues. Other application cases may be equally valid and can produce very different results. The cost analysis unveiled the challenges of viewing storage costs through the lens of the metric of LCOS.
The energy storage community is still discussing the correct approach to calculate the costs and values of energy storage in a logical and replicable way. In this report, several metrics are examined, including LCOS for specific application cases. However, it is acknowledged that there are other approaches and that the focus should be on the 'value’, i.e. the ‘best' depends on the objectives.
On the one hand, the LCOS metric has many advantages:
Familiarity: LCOE is a metric commonly used not just as a key economic parameter for renewables, but for power plants more generally, so it is a well-known term. However, it is not always clear how it should be applied to storage, as it depends on the price assumption for input (charging) electric power and therefore the term LCOS is also used.
Comparison across technologies: This metric allows storage costs to be compared for different application cases and combinations with the generation costs of (renewable) power plants.
A comparison point against revenue: The LCOS can be compared against possible revenues, such as average price spreads or support mechanisms, although it can only be considered to be a very rough proxy of the revenue required for the project to be economically viable.
Yet the cost modelling of this report also revealed two challenges for energy storage cost modelling, which are not encountered when applying this metric to renewables:
Arbitrariness: Storage levelised costs are arbitrary, since the energy (kWh) produced by the storage plant over a period depends on the application case. In other words, storage systems are not straightforward "kWh producers" like renewables. The cost modelling of this report addresses this through defining specific application cases in which the number of kWh produced is fixed. Yet defining these application cases remains challenging. For instance, the characteristics of wind-storage plant, and to a lesser extent solar-storage plant, can vary substantially based on the local requirements for number of discharge cycles per year, and duration of discharge. This has significant implications for levelised costs. It is a challenge less commonly seen for renewables, whose generation patterns are the result of the location's wind or solar resource, rather than a purposeful choice in how plant is operated.
Incompleteness: Storage levelised cost estimations are incomplete, since they
do not cover the needed business models and its characteristics for storage. In the LCOE philosophy, the needed revenue is only reflected by the applied discount factor (which is related to a predetermined return for the investor, reflected in the ‘weighted average cost of capital’, the WACC). Since it neglects higher potential revenues, e.g., from providing flexibility, it is a simplified approach for the actual value of storage.
These two challenges are summarised in Table 3 below.

E-storage: Shifting from cost to value, wind and solar applications - 2016
29
Table 3: Two challenges of applying levelised cost methodology to storage The renewables industry encounters two main problems when it applies LCOS to energy storage.
Challenge one: Arbitrariness
Storage levelised cost is arbitrary, since the energy produced by the storage plant can vary depending on the application.
Challenge two: Incompleteness
Storage levelised cost estimations are incomplete, since they do not cover the needed business models and its characteristics for storage.
Essential background
A key parameter in the levelised cost equation is the number of kWhs generated.
Investors ultimately seek to maximise profit, which is a function of cost and revenue.
Why this challenge does not apply to wind and PV
For wind and solar plant, which have zero marginal cost, the goal is always to maximise kWh, and the maximum amount of kWhs generated can be estimated with a fair degree of accuracy once a site’s wind speed or solar irradiation is known.
For renewables, revenue is often largely fixed due to the presence of subsidies such as feed-in tariffs, meaning that levelised cost is often by itself a good guide to measure profitability.
Why this challenge emerges for storage
For storage, the number of kWh “generated” is a choice, meaning that any assumption on kWh generation by a cost modeller is somewhat arbitrary. The choice on how storage plant is operated will be a function of many factors, not least the revenue incentives on offer.
Levelised cost by itself is a very incomplete guide to the profitability for storage. Unlike renewables, storage typically lacks revenue-de-risking mechanisms; its revenue streams are often uncertain and aggregated.
Why this challenge matters
The LCOS is highly sensitive to the way the storage plant is operated, particularly how much energy is produced over a given period.
Revenue streams may vary substantially both over time and between locations and profitability is highly sensitive to revenue.
What this means Context matters: “generic” levelised costs should be treated with caution.
Context matters: cheapest is not always best.

E-storage: Shifting from cost to value, wind and solar applications - 2016
30
Implications The key implication of these challenges is that context matters. Without
context on the application and market, LCOS analyses of storage are arbitrary and incomplete. In addition, it is important to note that when specific applications are defined, as in this report, it is not necessarily possible to generalise from this, due to the high sensitivity of the overall result on the assumptions, particularly on discharge cycles.
Wide variation in energy storage costs. This reflects the immaturity of the storage industry in combination with generation and grid applications. Increased use of renewable energy generation will increase the demand for energy storage and then economies of scale and improvements in the manufacturing and engineering of batteries will bring costs down further over the next couple of years.
Public enthusiasm for storage is justified, but for the wrong reason. Cost reduction of storage is important, yet insufficient. The important metric is value, where value is a function of both cost and revenue. The value of storage can be evaluated differently according to the market; the intrinsic value of storage and the costs avoided by its operation. The wider justification for storage is the long-term trend towards the growth of volatile renewables (wind and solar), which creates a need for increasing flexibility. This is what makes storage increasingly valuable.
Cost reduction of storage is important, yet insufficient. Investment costs cannot be considered independent of the application and the important metric is value, where value is a function of both cost and revenue and is locally determined. For instance, one indicator of value could be the spread of traded kWh prices as a function of time, for storage plant using price arbitrage as their primary business model. For these reasons and others, it is not yet possible to judge which storage technologies will be the most successful.
The industry's focus on cost seems to stem from two areas. Firstly, it is a legacy from the renewables industry, which tends to have a very narrow focus on LCOE, as it benefited from policy mechanisms which de-risk its revenue streams. Secondly, the focus on cost stems from the fact that in most energy markets, flexibility is not sufficiently valued or monetised. This narrow focus on levelised cost helps explain why the business case for storage is often poorly formulated resulting in misperceptions.
From a country and societal perspective, the value of storage is the ability to provide power quality and reliability, and security of supply. This can be in the form of uninterrupted power supply to end-users, providing some reserve margin or initial power to restart the grid after a blackout. In this context, high reliability is more important than high costs.
Storage creates additional value through its function to level the load. Storage enables deferral of grid investment, especially at congestion points and creates the possibility of price arbitrage.

E-storage: Shifting from cost to value, wind and solar applications - 2016
31
Understanding the revenue side of storage has urgency due to its complexity. Whilst both policymakers and the renewables industry are familiar with levelised cost for generation technologies, they are not as well informed around issues of flexibility for generating and storage technologies. Assessing revenue is fundamentally more complex than showing a neat downward investment cost curve and involves stacking multiple uncertain revenue streams. These revenue streams are context-specific, depending on the market, policy regime and availability of competing resources, making it hard to generalise and make international comparisons.
Recommendations Solving the two challenges of storage costs will take a concerted effort across the energy sector, but policymakers can help lead the way. Some recommendations are provided below:
To go beyond a narrow levelised cost approach to storage technology assessment. The renewables industry has become accustomed to technology assessment based on investment costs, which are then translated to levelised cost, where only the lowest cost technologies are rewarded. This LCOS assessment is then used to inform policy development, so that the so-called cheapest technologies are promoted. But these two challenges for storage mean that this approach will not work for storage. The cheapest technologies might not necessarily deliver the greatest value.
To examine storage through holistic case studies in context, rather than place faith in generic cost estimations. The best way to understand the value of storage is to consider specific applications, such as solar in combination with storage, or else specific services being offered by storage, such as frequency response. It is also important that these case studies are not examined in a geographic vacuum, as it is the local energy market that critically determines the revenue available for each service. More system-integration approaches and evaluations are needed to add to the knowledge base.
To accelerate the development of flexible markets, working with transmission and distribution system operators and regulators.23 The growth in deployment of volatile renewables is creating new urgency around flexible markets. This would include the need to ensure that ancillary services markets are designed so as to be a level playing field for all. The development of flexible markets will help address the revenue risk associated with storage plant. As clearer monetary signals are assigned to flexible services, this will increase the energy sector's literacy on flexibility and help to build the business case for storage. As part of the storage deployment planning, it should also be considered whether storage would be better suited on a local (distribution) level or at the bulk wholesale level.
To establish policy support and an enabling regulatory framework to
facilitate further commercial deployment of storage technologies. To consider storage as a key component when planning for grid expansion
or extension.
23In the US, the relevant actors would be independent system operators and regional transmission operators.

E-storage: Shifting from cost to value, wind and solar applications - 2016
32
Appendix 1: Technology tables
This Appendix summarises the assumed key features of individual storage technologies, segmented into short term and long term storage technologies.

E-storage: Shifting from cost to value, wind and solar applications - 2016
33
Table 4a: Characteristics of short term storage Sources for technical parameters: ISEA Aachen (2012), Fraunhofer IWES, IAEW Aachen, Stiftung Umweltenergierecht (2014)24; Sources for Economics parameters: Agora Energiewende (2014)25, ISEA Aachen (2012), Fraunhofer IWES, IAEW Aachen, Stiftung Umweltenergierecht (2014), PwC research.
Technology Pumped hydropower storage* Compressed air* Liquid air* Lithium battery* NaS battery*
Parameter Unit
Main applications Frequency control (secondary reserve,
minute reserve), voltage control, peak
shaving, load levelling, standing reserve,
black start. Note that pumped hydropower
storage can also provide long term
storage subject to suitable topography.
Frequency control, peak
shaving, load levelling, island
grids, residential storage
systems, uninterruptible power
supply
Frequency control (negative secondary
reserve, positive and negative minute
reserve), peak shaving, load levelling,
standing reserve, black start, island
grids, residential storage systems,
uninterruptible power supply.
Frequency control,
voltage control, peak
shaving, load levelling,
electro mobility,
residential storage
systems
Frequency control, peak
shaving, load levelling, island
grids, electro mobility,
uninterruptible power supply
Technical parameters
Technology maturity (-) Well developed technology Developed technology Demonstration phase Developed technology Developed technology
Rated power (kW) Up to > 1 000 000 Up to 320 000 Up to 600 000 Up to 10 000 Up to 34 000
E2P Ratio (h) 1-10 1-10 1-10 1-10 1 - 10
Efficiency (%) 75 – 80 60 – 70 50 – 70 80 – 92 75 – 80
Maximum depth of discharge (%) 80 - 100 80 - 100 80 – 100 up to 100 up to 90
Technical lifetime (a) 40 - 80 20 – 30 20 – 30 5 – 20 15 – 25
Response time (min) 3 3 – 10 5 – 15 0.003 – 0.005 0.003 – 0.005
Economics parameters
Specific investment costs (€/kW) 700 – 1 500 900 – 1 800 1 100 – 3 000 800 – 3 700 2 900 – 3 900
Operation costs (%*Invests) 1,5 - 2 1,5 – 2 1 – 2 1,5 – 2 1,5 – 2
*Assumption: Pumped hydropower storage with E2P Ratio of 4; Compressed air with E2P Ratio of 6; Liquid air with E2P Ratio of 6; Lithium battery with E2P Ratio of 1-4; for both application cases: 4; NaS battery with E2P Ratio of 6.
24 Fraunhofer-Institut für Windenergie und Energiesystemtechnik Kassel, Institut für elektrische Anlagen und Energiewirtschaft RWTH Aachen (IAEW), Stiftung Umweltenergierecht Würzburg, 2014: "Roadmap Speicher". 25 Agora Energiewende, 2014: "Stromspeicher in der Energiewende"

E-storage: Shifting from cost to value, wind and solar applications - 2016
34
Table 4b: Characteristics of short term storage Sources for technical parameters: ISEA Aachen (2012), Fraunhofer IWES, IAEW Aachen, Stiftung Umweltenergierecht (2014).
Sources for economics parameters: Agora Energiewende (2014); IEA-ETSAP; IRENA (2013);ISEA Aachen (2012); Fraunhofer IWES; IAEW Aachen; Stiftung Umweltenergierecht (2014), PwC research.
Technology Lead acid battery Redox flow battery Thermochemical Supercapacitors Flywheels
Parameter Unit
Main applications Frequency control, peak shaving,
load levelling, island grids,
residential storage systems,
uninterruptible power supply.
Secondary / tertiary
frequency control, long-term
storage, island grids
Frequency control, voltage control,
peak shaving, load levelling,
standing reserve, black start
Primary frequency control,
voltage control, peak shaving
Primary frequency
control, voltage
control, peak
shaving
Technical parameters
Technology maturity (-) Well developed technology Development phase Development phase Development phase Developed
technology
Rated power (kW) Up to 70 000 Up to 10 000 Up to 100 000 1 < 500
E2P Ratio (h) 1 - 10 1 - 10 1 – 10 < 0.25 < 0.25
Efficiency (%) 65 – 90 70 – 80 75 – 100** 90 – 94** 80 - 95
Maximum depth of
discharge
(%) 60 - 70 Up to 100 Up to 100 75 Up to 100
Technical lifetime (a) 5 – 15 10 – 20 10 – 30 15 15
Response time (min) 0.003 – 0,005 seconds - < 10 10
Economics parameters
Specific investment
costs*
(€/kW) 500 – 1 700 1 000 – 3 500 900 – 3 000 2 100 – 4 200 600 –1 000
Operation costs (%*Invests) 1.5 – 2 1.5 – 2 1.5 – 2 1.5 – 2 1.5 –2
*Assumption: Lead acid battery with E2P Ratio of 1-4; for both application cases: 4; Redox flow battery with E2P Ratio of 1-4; for both application cases: 4; Thermochemical with E2P Ratio of 6; Supercapacitors with E2P Ratio of 0.25; Flywheels with E2P Ratio of 0.25. **Thermal efficiency

E-storage: Shifting from cost to value, wind and solar applications - 2016
35
Table 5: Characteristics of Long term storage Source for technical parameters: IRENA (2013), ISEA Aachen (2012), Fraunhofer IWES, IAEW Aachen, Stiftung Umweltenergierecht (2014).
Sources for economics parameters: Agora Energiewende (2014), IAEW Aachen, IEA-ETSAP, IRENA (2013), ISEA Aachen (2012), Fraunhofer IWES, Stiftung Umweltenergierecht (2014), PwC research.
Technology Sensible thermal Latent thermal Power-to-gas //
H2 cavern
Power-to-gas //
Hydrogen // SNG
Parameter Unit
Main applications Daily/seasonal storage, system
balancing
Seasonal storage Seasonal storage, island grid Seasonal storage, island grid
Technical parameters
Technology maturity (-) Development phase Development phase Development phase Development phase
Rated power (kW) Up to 25 000 Up to 500 Up to 6 000 Up to 6 000
E2P Ratio (h) 50-500 50 - 500 50 - 500 50 - 500
Efficiency* (%) 50 – 90 75 - 90 30 - 48 30 - 35
Maximum depth of discharge (%) Up to 100 Up to 100 Up to 100 Up to 100
Technical lifetime (a) 10 – 30 10 - 30 15 15
Response time (min) - - 10 10
Economics parameters
Specific investment costs** (€/kW) 2 800 – 5 600 6 900 – 22 100 1 600 – 2 100 2 000 – 3 100
Operation costs (%*Invests) 1.5 – 2 1.5 - 2 1.5 - 2 1.5 - 2
*Thermal efficiency
**Assumption: Sensible thermal with E2P Ratio of 200; Latent thermal with E2P Ratio of 200; Power-to-gas (H2 cavern) with E2P Ratio of 200, Power-to-gas (Hydrogen // SNG E2P) with E2P Ratio of 20

E-storage: Shifting from cost to value, wind and solar applications - 2016
36
Appendix 2: Modelling assumptions
This Appendix documents both economic and technical assumptions underpinning the report's cost modelling. The assumptions are as follows:
Technical lifetimes are as summarised in Figure 15 Specific technology assumptions are documented in the tables below, segmented
into short term and long term storage technologies The weighted average cost of capital (WACC) is 8% No change in parameters or prices during lifetime The cost (price) for input (charging) electric power is taken as zero
Liquid air energy storage is not listed here, as data from a wide range of sources is not yet available.
Table 6a: Assumptions underpinning development of specific cumulated investment costs to 2030 Storage Type Development of storage costs
Pumped hydropower storage
Mature technology; no further cuts in specific investment costs expected in the future.
Compressed air (adiabatic)
PwC calculations and recent market data show a cost reduction of around 20% by 2030.
Development of specific turbomachinery, materials and heat storage technology for adiabatic compressed aid energy storage (CAES) will cut specific investment costs. Mass production of this material will further drive costs down.
Economic potential and R&D activity are highly dependent on the regulatory framework changes for fluctuating renewable generation.
Lithium PwC calculations and recent market data indicate that battery costs will be reduced by at least around 55% by 2030.
Growing demand for lithium-ion batteries in the automotive industry and large-scale mass production will drive costs down. Both, material research and manufacturing technology will contribute to drive costs down. Intensive R&D activity and growing demand indicate that costs are likely to drop significantly until 2030 with only small downside risk.

E-storage: Shifting from cost to value, wind and solar applications - 2016
37
Table 6b: Assumptions underpinning development of specific cumulated investment costs to 2030 Storage Type Development of storage costs
Sodium sulphur (NaS)
PwC calculations and recent market data indicate that investment costs of NaS will drop by around 75% until 2030.
Expiring patents on NaS technology can increase competitive pressure.
Extensive potential for technology improvements in the areas of stack/system construction, optimisation of interfaces and modifications of chemistries like the development of new electrolyte.
Lead acid PwC calculations and recent market data indicate that battery costs will be reduced by around 65 % by 2030.
Development of advanced lead acid batteries, pilot projects for large-scale stationary mass production, especially for large-scale stationary batteries, automation and process improvement lead to significant cost reduction. Strong competition against lithium batteries raises competitive pressure to improve the technology and cut costs.
Redox flow PwC calculations and recent market data indicate that battery costs will be reduced by around 50% by 2030.
Development of cost-effective redox-pairs, upscaling of cell stack to minimise production costs.
R&D focuses on new material for redox pairs as current pairs are expensive. Improvement of manufacturing process technologies could further drive costs down.
Expiring patents on NaS technology can increase competitive pressure.
Thermochemical storage
Still more or less a subject of R&D (still in the laboratory stage). Engineering and material issues have to be solved.
Assessment is difficult, consequently high insecurity with regard to future cost reduction.
Supercapacitors High costs for supercapacitors will be reduced by the introduction of mass-production for the automobile industry (hybrid cars).
Additionally, efficient manufacturing, new materials (such as nanomaterials) and novel designs paramount in reduction of storage costs of supercapacitors.
Hence, storage costs of supercapacitors are likely to drop significantly (by around 50%), with only slight downside risk.

E-storage: Shifting from cost to value, wind and solar applications - 2016
38
Table 6c: Assumptions underpinning development of specific cumulated investment costs to 2030
Storage Type
Development of storage costs
Flywheels Research is conducted into the use of flywheels in the automotive sector in order to store braking energy. Hence, costs for flywheels in the energy sector could be decreased by synergy effects to the automotive sector.
Storage costs of flywheels are expected to decrease significantly (by around 60%) in the future, with little downside risk.
Sensible thermal storage
Challenge: development of cost-effective and adapted thermal storage systems & customized heat-pump processes. Thermo-economic optimization of sensible thermal storage systems under different market conditions. Increase of efficiency by reducing the heat losses (depending on the insulation).
Assessment is difficult as sensible thermal storage lacks wide-spread use and market penetration. Hence, there is high insecurity concerning the future cost reduction.
Latent thermal storage
Still more or less a subject of R&D.
Costs for phase-changing materials are still too high. Therefore, cost reduction of existing material/technologies as well as development of new cost-effective material/technologies will be required for latent thermal storage to become economically viable.
Assessment is difficult, consequently high insecurity with regards to future cost reduction.
P2G // H2 Cavern
Progress in the field of high-pressure electrolysers is expected.
Synergies with the development of new power plant processes which use hydrogen rich gas.
Hydrogen turbines may be commercially available in the near future and new types of material (e.g. polymer membranes) currently in R&D status have the potential to further lower electrolyser system costs.
All in all, cost reductions of about 30% are expected.
P2G // H2 // SNG
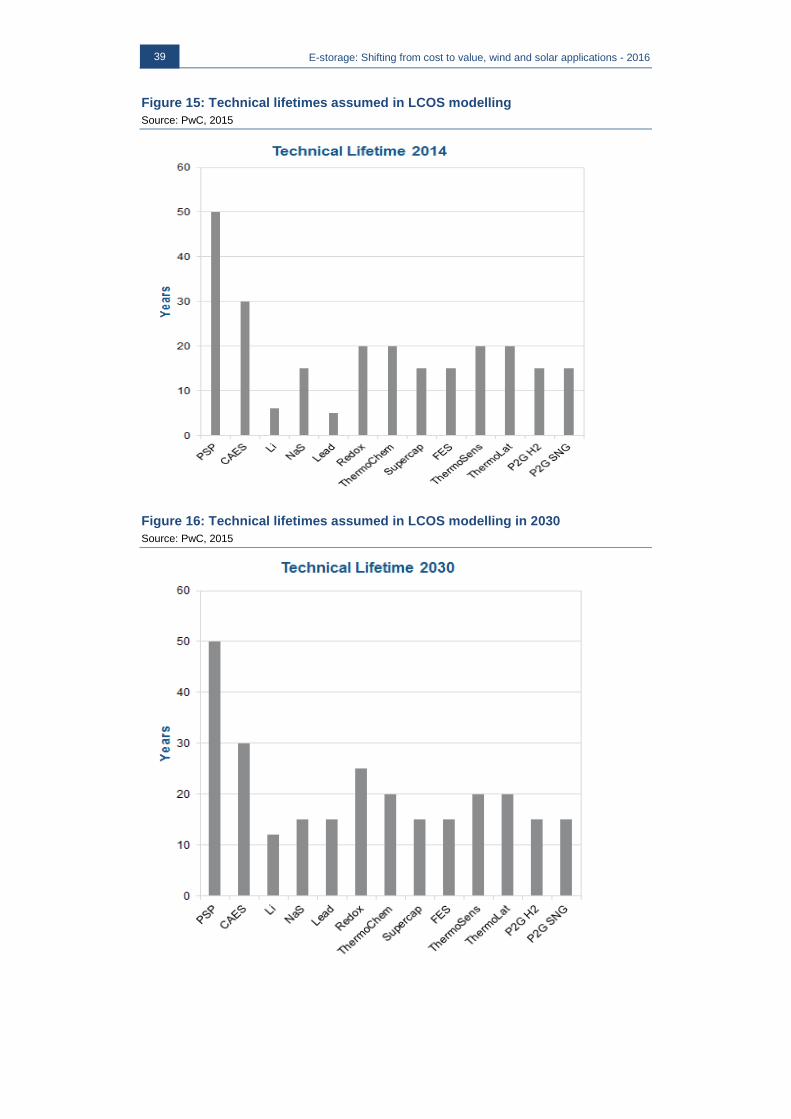
E-storage: Shifting from cost to value, wind and solar applications - 2016
39
Figure 15: Technical lifetimes assumed in LCOS modelling Source: PwC, 2015
Figure 16: Technical lifetimes assumed in LCOS modelling in 2030 Source: PwC, 2015

E-storage: Shifting from cost to value, wind and solar applications - 2016
40
Assumptions for short term storage Table 7a: Individual assumptions for short term storage Sources: AGORA (2014), BET (2013)26, ISEA et al. (2014), PwC research.
Table 7b: Individual assumptions for short term storage Sources: AGORA (2014), IRENA (2013), ISEA (2013)27, ISEA et al. (2014), PwC research.
26 BET Büro für Energiewirtschaft und technische Planung GmbH, 2013: "Möglichkeiten zum Ausgleich fluktuierender Einspeisungen aus erneuerbaren Energien" 27 Institut für Stromrichtertechnik und Elektrische Antriebe RWTH Aachen (ISEA), 2013: "Marktanreizprogramm für dezentrale Speicher insbesondere für PV-Strom"
Technology Pumped hydropower
storage
Compressed air Lithium battery NaS battery
Parameter Unit Recent 2030 Recent 2030 Recent 2030 Recent 2030
Full-load
hours
equivalent
(h/a) 1 460 1 460 2 190 2 190 365 –
1 460
365 –
1 460
2190 2190
Specific
investment
costs
(€/kW) 700 – 1 500 700 –
1 500
900 –
1 800
900 –
1 100
800 –
3 700
300 –
1 700
2 900 –
3 900
600 –
1 100
Operation
costs
(%*Invests) 2 2 2 2 2 2 2 2
Efficiency (%) 80 80 65 70 85 92 77 84
Maximum
depth of
discharge
(%) 100 100 100 100 70 80 90 90
Technical
lifetime
(a) 50 50 30 30 6 12 15 15
Technolog
y
Lead acid
battery
Redox flow
battery
Thermochemical Supercapacitor Flywheels
Parameter Unit Recent 2030 Recent 2030 Recent 2030 Recent 2030 Rece
2030
Full-load
hours
equivalent
(h/a) 365 –
1 460
365 –
1 460
365 –
1 460
365 –
1 460
2 190 2 190 1 825 1 825 1 825 1 825
Specific
investment
costs
(€/kW) 500 –
1 700
100 –
600
1 000
–
3 500
500 –
1 600
900 –
3 000
600 –
1 100
2 100 –
4 200
1 000 –
2 100
600 –
1 000
200 –
300
Operation
costs
(%*Invests) 2 2 2 2 2 2 2 2 2 2
Efficiency (%) 77 82 70 78 100 100 92 92 88 88
Maximum
depth of
discharge
(%) 65 75 100 100 75 100 100 100 100 100
Technical
lifetime
(a) 5 15 20 25 20 20 15 15 15 15

E-storage: Shifting from cost to value, wind and solar applications - 2016
41
Assumptions for long term storage Table 8: Individual assumptions for long term storage Sources: ISEA et al. (2014), AGORA (2014), IRENA (2013), PwC research.
Technology Sensible thermal Latent thermal Power-to-gas (H2
cavern)
Power-to-gas //
Hydrogen // SNG
Parameter Unit Recent 2030 Recent 2030 Recent 2030 Recent 2030
Full-load hours
equivalent
(h/a) 2 000 2 000 2 000 2 000 2 000 2 000 2 000 2 000
Specific
investment
(€/kW) 2 800 –
5 600
2 100 –
3 500
6 900 –
22 100
5 200 –
8 500
1 600 –
2 100
800 –
1 400
2 000 –
3 100
1 000 –
1 700
Operation
(%*Inv
2 2 2 2 2 2 2 2
Efficiency (%) 50 90 75 90 35 42 30 35
Maximum
depth of
(%) 100 100 100 100 100 100 100 100
Technical
(a) 20 20 20 20 15 15 15 15

E-storage: Shifting from cost to value, wind and solar applications - 2016
42
Appendix 3: Characteristics of volatility of wind and PV
Both wind and solar PV are volatile renewables technologies, and for this study it is important to understand the characteristics of that volatility.
Other renewable technologies are also volatile. Tidal energy is highly volatile (four generation cycles per day) but is highly predictable; wave energy has characteristics very similar to wind. However both are currently at relatively low levels of penetration and so are not considered in this study.
Run-of-river hydro is also volatile, but is a mature technology and is well understood in any specific location.
Solar PV The dominant component of volatility is the daily cycle. The duration and peak value of this cycle can readily be calculated for any geographical location, panel orientation, and site shading characteristics. Cloud effects are more random: they can cause rapid fluctuations in output of a single installation (timescales of seconds), but over distances of around one kilometer they are uncorrelated on timescales of tens of seconds or minutes, and when spread over the area of an electricity distribution system they are only correlated on timescales of hours. Periods of cloud cover can be forecasted with relatively good accuracy.
Therefore, when considering storage co-located with PV installations, the applications are:
1. Storage of tens of seconds or a few minutes, to remove fluctuations due to cloud cover, if this is important for the electricity sales agreement or the grid connection agreement.
2. To provide ancillary services such as frequency response or reserve, if a market or a mandatory requirement exists.
3. Storage of a few hours, in order to time-shift production to times of the day when the price is higher. Electricity systems with a high penetration of PV already show a strong impact on spot prices.
The third issue is currently the most important.

E-storage: Shifting from cost to value, wind and solar applications - 2016
43
Note that panel orientation may not necessarily be chosen to maximise production: if the electricity price varies throughout the day, and in particular if it drops at times of high PV production, panel orientation may be chosen to give maximum production at higher-price periods, e.g. early and late in the day. This approach may compete against storage.
The annual cycle is also important, but requires seasonal storage. For the foreseeable future, this is not feasible for storage co-located with PV.
Wind The output of a single wind turbine varies on almost all timescales, from seconds and longer. Turbulence exists in the wind at faster timescales (sub-second), but is averaged across the rotor disk.
The output of a wind farm of several wind turbines also shows considerable averaging, so that volatility occurs on timescales of tens of seconds and slower.
The summated output of wind farms spread across an area typical of an electricity distribution system (~100 km) shows volatility on timescales of tens of minutes and slower. Across a transmission system (~1000 km), experience shows that the most extreme changes are of the order of 20% of capacity in 30 minutes.
In some locations the dominant cycle is daily, driven by thermal effects (particularly deserts and coastal regions). However in northern Europe, which has a very high penetration of wind, the dominant cycle is driven by weather systems moving across the Atlantic, on cycles of three to four days.
Therefore, for storage co-located with a small wind farm, the applications are similar to PV:
1. Storage of tens of seconds or a few minutes, to remove fluctuations due to wind turbulence, if this is important for the electricity sales agreement or the grid connection agreement.
2. To provide ancillary services such as frequency response or reserve, if a market or a mandatory requirement exists.
3. Storage of several hours, in order to time-shift production to times when the price is higher. Electricity systems with a high penetration of wind already show a strong impact on spot prices.
As with solar, the third issue is currently the most important, However, in regions where the dominant weather cycles are longer than a day, use of storage may be driven more by within-day variations in electricity prices, driven by the daily electricity demand profile, than by variations in output of wind generation.

E-storage: Shifting from cost to value, wind and solar applications - 2016
44
Appendix 4: List of references
Agora Energiewende, 2014: Stromspeicher in der Energiewende, Berlin – Germany.
Akhil A. et. al., 2013: DOE/EPRI 2013 Electricity Storage Handbook in Collaboration with NRECA, Albuquerque, New Mexico and Livermore, California – United States of America, Sandria National Laboratories.
ARENA, 2015: Energy Storage Study: A storage market review and recommendations for funding and knowledge sharing priorities, http://arena.gov.au/
BET Büro für Energiewirtschaft und technische Planung GmbH, 2013: Möglichkeiten zum Ausgleich fluktuierender Einspeisungen aus erneuerbaren Energien, Aachen - Germany.
European Association for Storage of Energy (EASE), European Energy Research Alliance (EERA), 2013: European Energy Storage Technology Development Roadmap Towards 2030
Fraunhofer-Institut für Windenergie und Energiesystemtechnik Kassel (IWES), Institut für elektrische Anlagen und Energiewirtschaft RWTH Aachen (IAEW), Stiftung Umweltenergierecht Würzburg 2014: Roadmap Speicher.
Institut für Stromrichtertechnik und Elektrische Antriebe RWTH Aachen (ISEA), 2013: Marktanreizprogramm für dezentrale Speicher insbesondere für PV-Strom, Aachen - Germany.
Institut für Stromrichtertechnik und Elektrische Antriebe RWTH Aachen (ISEA), 2012: Technology Overview on Electricity Storage, Aachen - Germany.
International Energy Agency (IEA), 2014: Technology Roadmap Energy Storage, Paris Cedex - France.
International Renewable Energy Agency (IRENA), 2013: Thermal Energy Storage: Technology Brief, https://www.irena.org/DocumentDownloads/Publications/IRENA-ETSAP%20Tech%20Brief%20E17%20Thermal%20Energy%20Storage.pdf.
International Renewable Energy Agency (IRENA), 2015: Battery Storage for Renewables: Market status and technology outlook, http://www.irena.org/documentdownloads/publications/irena_battery_storage_report_2015.pdf.
Lazard, 2015: “Lazard launches levelized cost of energy storage analysis”, https://www.lazard.com/media/2394/lazard-launches-levelized-cost-of-energy-storage-analysis_11172015.pdf, New York – United States of America.
Makower J., 2015: "State of Green Business: Energy storage becomes a game changer", http://www.greenbiz.com/blog/2014/02/19/state-green-business-energy-storage-becomes-

E-storage: Shifting from cost to value, wind and solar applications - 2016
45
game-changer.
Nykvist, B. and Nilsson M., 2015: "Rapidly falling costs of battery packs for electric vehicles" in Natural Climate Change 5, 329-332, http://www.nature.com/nclimate/journal/v5/n4/full/nclimate2564.html.
Olson and Chediak, 2014: "Battery storage may vie with US oil boom as energy game changer", http://www.renewableenergyworld.com/.
Price A., 2015: "Energy storage is a game changer", http://www.imeche.org/news/blog/energy-storage-is-a-game-changer.

E-storage: Shifting from cost to value, wind and solar applications - 2016
46
Appendix 5: Glossary
Capacity specific investment costs
Summarises the cost of a 1 kWh capacity installation.
Cycles per year Show how often the storage is charged and discharged completely.
Efficiency Measures the energy loss in (%) comparing the storage’s output with its input. In this analysis ‘round-trip-efficiency’ is used which is also called AC-AC-efficiency.
E2P Ratio (Energy to power Ratio)
Describes the ratio of installed capacity and rated power in (kWh/kW). It shows how long energy can be transferred in or out the storage at rated power.
Full-load hours equivalent
A measure of the usage of the storage system. It is defined as the annual energy production from the storage device, divided by rated power.
Levelised cost of energy (LCOE)
Levelised cost of storage (LCOS)
The levelised cost of electricity (LCOE) is the (fictitious) average price that must be received per unit of output (effectively kWh or MWh) as payment for producing power in order to reach a specified financial return. In other words, it reflects the average price the project must earn per megawatt-hour (sold over the entire lifetime of the technology) in order to break even on the investment and operational costs. The LCOE calculation standardises the units of measuring the lifecycle costs of producing electricity thereby facilitating the comparison of the cost of producing one megawatt hour by each technology.
The levelised cost of storage (LCOS) is the (fictitious) average ‘net’ price that must be received per unit of output (effectively kWh or MWh) as payment for storing and discharging power in order to reach a specified financial return. In other words, it reflects the average ‘net’ price the project must earn per megawatt-hour (sold over the entire lifetime of the technology) in order to break even on the investment and operational costs. The LCOS calculation standardises the units of measuring the lifecycle costs of storing and discharging electricity, thereby facilitating the comparison of the cost of discharging one megawatt-hour of stored electric energy by each technology.

E-storage: Shifting from cost to value, wind and solar applications - 2016
47
Maximum depth of discharge
Shows the share of discharged energy in the total storage capacity in (%). 100 % DOD resembles the maximum amount of energy that can be discharged and equals a fully discharged system.
Operation costs Includes costs for operation and maintenance. In this report it is calculated by a specific share of total cumulated investment costs.
Power specific investment costs
Reflects the cost of 1 kW rated power installation.
Rated power Shows the typical power size of the energy storage technology in (kW). The higher the rated power, the faster energy can be stored.
Response time The response time measures the duration in hours until the system reaches full power.
Specific investment costs
Consists of 1 kW power installation costs and of 1 kWh capacity installation costs with consideration of E2P Ratio and maximum depth of discharge.
Technology maturity Expresses the degree of "technical and commercial readiness" of a technology. The following maturity categories are used in this report, in order: development phase, developed technology, well developed technology.
Technical lifetime The average lifetime of a specific storage technology in years.
E-storage: Shifting from cost to value, wind and solar applications - 2016
48
Appendix 6: Table of figures and tables
List of figures Figure 1: Scientific categorisation of storage............................................................... 10
Figure 2: Mapping storage technologies according to performance characteristics ... 11
Figure 3: Duration and frequency of power supply ...................................................... 12
Figure 4: Storage technology maturity, for grid applications ....................................... 13
Figure 5: Experience curve for Lithium-ion battery ...................................................... 13
Figure 6: Approach to cost modelling .......................................................................... 17
Figure 7: Specific investment costs for the 2015 study period (€_2014) .................... 21
Figure 8: Specific investment costs, 2030 (€_2014) ................................................... 21
Figure 9: Levelised cost of energy in the 2015 study period (€_2014) ....................... 22
Figure 10: Levelised cost of energy in 2030 (€_2014). ............................................... 22
Figure 11: Levelised Cost of Storage co-located with PV in the 2015 study period (€_2014) ............................................................................................................... 23
Figure 12: Levelised Cost of Storage co-located with PV in 2030 (€_2014) ............... 24
Figure 13: Levelised Cost of Storage co-located with wind in the 2015 study period (€_2014) ............................................................................................................... 25
Figure 14: Levelised Cost of Storage co-located with wind in 2030 (€_2014) ............ 25
Figure 15: Technical lifetimes assumed in LCOS modelling ....................................... 39
Figure 16: Technical lifetimes assumed in LCOS modelling in 2030 .......................... 39

E-storage: Shifting from cost to value, wind and solar applications - 2016
49
List of tables Table 1: Explanation of LCOS calculation ................................................................... 19
Table 2: Application cases assumed in cost modelling ............................................... 20
Table 3: Two challenges of applying levelised cost methodology to storage .............. 29
Table 4a: Characteristics of short term storage........................................................... 33
Table 4b: Characteristics of short term storage......................................................... 334
Table 5: Characteristics of Long term storage............................................................. 35
Table 6a: Assumptions underpinning development of specific cumulated investment costs to 2030 ........................................................................................................ 36
Table 6b: Assumptions underpinning development of specific cumulated investment costs to 2030 ...................................................................................................... 367
Table 6c: Assumptions underpinning development of specific cumulated investment costs to 2030 ...................................................................................................... 368
Table 7a: Individual assumptions for short term storage ............................................. 40
Table 7b: Individual assumptions for short term storage ............................................. 40
Table 8: Individual assumptions for long term storage ................................................ 41

E-storage: Shifting from cost to value, wind and solar applications - 2016
50
Appendix 7: Project participation
Executive Chair of Resources Project Management
Hans-Wilhelm Schiffer Zulandi van der Westhuizen RWE, Germany Christoph Menzel Energy Storage Knowledge Network Lead Author Paul Gardner Felicity Jones Matthew Rowe Ali Nouri Haike van de Vegte DNV GL, UK Knowledge Network Members Anna Nordling AF consult Sweden Bálint Hartmann Budapest University of Technology & Economics (BME) Hungary Csaba Marton Voith Hydro Holding GmbH & Co. KG Germany Fabrizio Bizzarri Luigi Lanuzza Enel Green Power Italy
Special contributions towards cost and technical analysis
Volker Breisig
Christian Linden Thomas Pütz
PwC, Germany
Marco Gazzino Enel S.p.A.
Italy
Mervin Azeta Schlumberger Corporation
UK
Volkmar Pflug Rainer Saliger
Siemens AG Germany
Ian Philp
MaRS Discovery District Canada

E-storage: Shifting from cost to value, wind and solar applications - 2016
51
Member committees of the World Energy Council
Armenia Algeria Argentina Austria Bahrain Belgium Bolivia Botswana Brazil Bulgaria Canada Chad Chile China Colombia Congo (Democratic Republic) Côte d'Ivoire Croatia Cyprus Czech Republic Denmark Ecuador Egypt (Arab Republic) Estonia Ethiopia Finland France Gabon Germany Ghana Greece Hong Kong, China Iceland India Indonesia Iran (Islamic Republic) Iraq Ireland Israel Italy Japan Jordan Kazakhstan Kenya Korea (Republic) Kuwait
Latvia Lebanon Libya Lithuania Luxembourg Mexico Monaco Morocco Namibia Nepal Netherlands New Zealand Niger Nigeria Pakistan Paraguay Peru Philippines Poland Portugal Qatar Romania Russian Federation Saudi Arabia Senegal Serbia Slovakia Slovenia South Africa Spain Sri Lanka Swaziland Sweden Switzerland Syria (Arab Republic) Tanzania Thailand Trinidad & Tobago Tunisia Turkey Ukraine United Arab Emirates United Kingdom United States Uruguay Zimbabwe
Patrons of the World Energy Council
Alstom Bloomberg New Energy Finance Electricité de France Emirates Nuclear Energy Corporation ENGIE GE Power and Water Hydro-Québec Korea Electric Power Corp.
Marsh & McLennan Corp Oliver Wyman PricewaterhouseCoopers Saudi Aramco Siemens AG Swiss Re Corporate Solutions Tokyo Electric Power Co. Verbundnetz Gas AG

E-storage: Shifting from cost to value, wind and solar applications - 2016
52
The World Energy Council (WEC) is the principal impartial network of leaders and practitioners promoting an affordable, stable and environmentally sensitive energy system for the greatest benefit of all. Formed in 1923, WEC is the UN-accredited global energy body, representing the entire energy spectrum, with more than 3000 member organisations located in over 90 countries and drawn from governments, private and state corporations, academia, NGOs and energy related stakeholders. WEC informs global, regional and national energy strategies by hosting high-level events, publishing authoritative studies, and working through its extensive member network to facilitate the world’s energy policy dialogue. Further details at www.worldenergy.org and @WECouncil
World Energy Council 62-64 Cornhill London EC3V 3NH United Kingdom T (+44) 20 7734 5996 F (+44) 20 7734 5926 E [email protected] www.worldenergy.org For sustainable energy. ISBN: 978 0 946121 44 1