Embed Size (px)
Citation preview

Sustainable
Transport VIP
2020 – 2021
E-Scooter Impact
Report


1
Authors Page
Contribution: Project leader. Designed the net
environmental benefit and net additional fatalities
formulas. Compiled the fatality, GHG emissions, and
SCC parameters. Explained the design/choice, and
limitations of formulas and parameter values used in
the methodology. Wrote the individual case studies and
contributed to the case study summary. Produced all the
graphs/figures not copied directly from sources.
Jac McCluskey - Third Year
Economics Student
Contribution: Conducted and compiled research for
each case study. Wrote the case study summary.
Researched demographic and geographic features of
each city. Investigated research found by previous
Sustainable Transport VIP team to assess its
applicability to our project. Coordinated team members
and created the research findings and policy proposals
summary poster.
Eve Butler-Smith - Second
Year Psychology Student

2
Contribution: Researched and evaluated the
psychological factors involved in sustainable transport
use and transport decision-making in urban settings.
Evaluated the psychological factors implicated in the
use of e-scooters and in creating a positive modal shift.
Created policy proposal suggests based on these
psychological factors and evidence from previous case
studies. Evaluated the temporal and predictive
importance of these proposals.
Faye Sanders - Second Year
Psychology Student
Contribution: Produced an introduction on the
relevance of the topic and the Bath Clean Air Zone
(CAZ). Analysed GHG emissions maps around Bath.
Using the PCT, analysed key parameters of LSOAs and
MSOAs around the B&NES area. Identified key target
areas around and within the CAZ for e-scooter
deployment
Vignesh Ramesh - Second
Year Chemical Engineering
Student

3
Contribution: Analysed and compared
the global warming impact of e-scooters to
other modes of transport based on multiple
life cycle assessments. Identified key
variables that have significant impacts on
the overall GHG emissions of e-scooters.
Trang Vo – Final Year
Chemical Engineering Student
Contribution: Analysed the wider
sustainability impact of e-scooters and
their batteries. Created guideline advice
for selection of e-scooter and/or e-scooter
company.
Tasha Marino – MSc Environmental
Engineering Student
Contribution: Academic Supervisor.
Helped to find useful sources and provide
information on the current
schemes/projects currently operating in
Bath and the rest of the UK. Provided a
strong theoretical understanding,
especially with regards to the literature
review section, and gave invaluable
feedback at every stage.
Dr Ian Walker – Senior Lecturer
Department of Psychology

4
Table of Contents
Introduction .............................................................................................................................. 6
Aims ....................................................................................................................................... 6
Structure ................................................................................................................................. 6
Context ................................................................................................................................... 6
Methodology ............................................................................................................................. 9
Formulas and Parameters ....................................................................................................... 9
Formula Explanation ............................................................................................................ 10
Limitations: ...................................................................................................................... 11
Emissions Parameter Explanation ........................................................................................ 12
Life Cycle Analysis (LCA) Results Examination:........................................................... 13
SCC Explanation .................................................................................................................. 20
Limitations: ...................................................................................................................... 22
Safety Parameter Explanation .............................................................................................. 24
Limitations: ...................................................................................................................... 24
Case Studies ............................................................................................................................ 26
Paris (Lime, 2019a) .............................................................................................................. 26
Brussels (Dott)...................................................................................................................... 34
Chicago Pilot (Chicago, 2020a) ........................................................................................... 39
Los Angeles Pilot (DOT, 2020) ........................................................................................... 55
Lisbon (Lime) ....................................................................................................................... 61
Case Study Summary ........................................................................................................... 63
City Demographics: ......................................................................................................... 66
Rider Demographics: ....................................................................................................... 66
Trip Purpose: .................................................................................................................... 68
Weather: ........................................................................................................................... 69
Bike Lanes: ...................................................................................................................... 69
Safety and Environmental Impact:................................................................................... 70
Psychology Literature Review .............................................................................................. 75
Source Review...................................................................................................................... 77
Consistency: ..................................................................................................................... 77
Cleanliness: ...................................................................................................................... 77
Cost: ................................................................................................................................. 77
Social Safety: ................................................................................................................... 78
5
Integrative Ability: ........................................................................................................... 78
Policy Proposals ..................................................................................................................... 79
Target Areas for E-Scooters within the B&NES Area ......................................................... 79
Infrastructure & Operational ................................................................................................ 85
Cost schemes:................................................................................................................... 85
Integration: ....................................................................................................................... 85
Cleanliness: ...................................................................................................................... 86
Consistency: ..................................................................................................................... 86
Social Safety: ................................................................................................................... 87
Bike Lanes: ...................................................................................................................... 88
Operator Choices .................................................................................................................. 89
Extend E-Scooter Lifetime: ............................................................................................. 89
E-Scooter Management Requirements: ........................................................................... 89
Integrate E-Scooter Mobility with Public Transport: ...................................................... 90
Use Electricity Generated Using Renewable Energy Sources: ........................................ 90
Encourage E-Scooter Firms to Engage in Carbon Offsetting: ......................................... 91
Increase the Size of E-Scooter Wheels: ........................................................................... 91
Environmental Benefit Scenarios ......................................................................................... 92
Calculation Example: ....................................................................................................... 94
References ............................................................................................................................... 97

6
Introduction
Aims
The aim of this report is to provide policy makers (e.g. B&NES council) with an academic
insight into how e-scooters within the city of Bath will impact upon the environment and road
safety (specifically road fatalities).
Structure
This report combines: a case-series of e-scooter schemes within different cities, theoretical (and
empirically verified) barriers to micro mobility usage, and observable characteristics of the
City of Bath to identify possible policy proposals which could maximise an e-scooter scheme’s
net environmental benefit.
Context
In 2019, carbon dioxide emissions from the UK transport sector were 119.6 million tonnes
(Mt), 2.8 per cent (3.5 Mt) lower than in 2018, and 4.6 per cent lower than in 1990. General
UK transport in 2019 accounted for 34% of all carbon dioxide emissions. The bulk of emissions
of general UK transport are from UK road transport. Transport carbon dioxide grew to a peak
in 2007, 8.5% higher than in 1990 in the UK, primarily because of a continual growth in vehicle
kilometres travelled on roads. Now emissions in road transport have fallen back to around 1990
levels, due to improvements in new car fuel efficiency, as well as less traffic owing to the
2008/2009 recession (BEIS, 2020).
To meet the UK’s carbon budgets, carbon neutrality by 2050, CO2 emissions would need to
fall by another 31% by 2030. With the current projection given by the government, only a 10%
fall is expected with the current strategies (Evans, 2020). E-Scooters can be a potential strategy
to help meet this target in reducing both CO2 emissions and NO2 emissions.
7
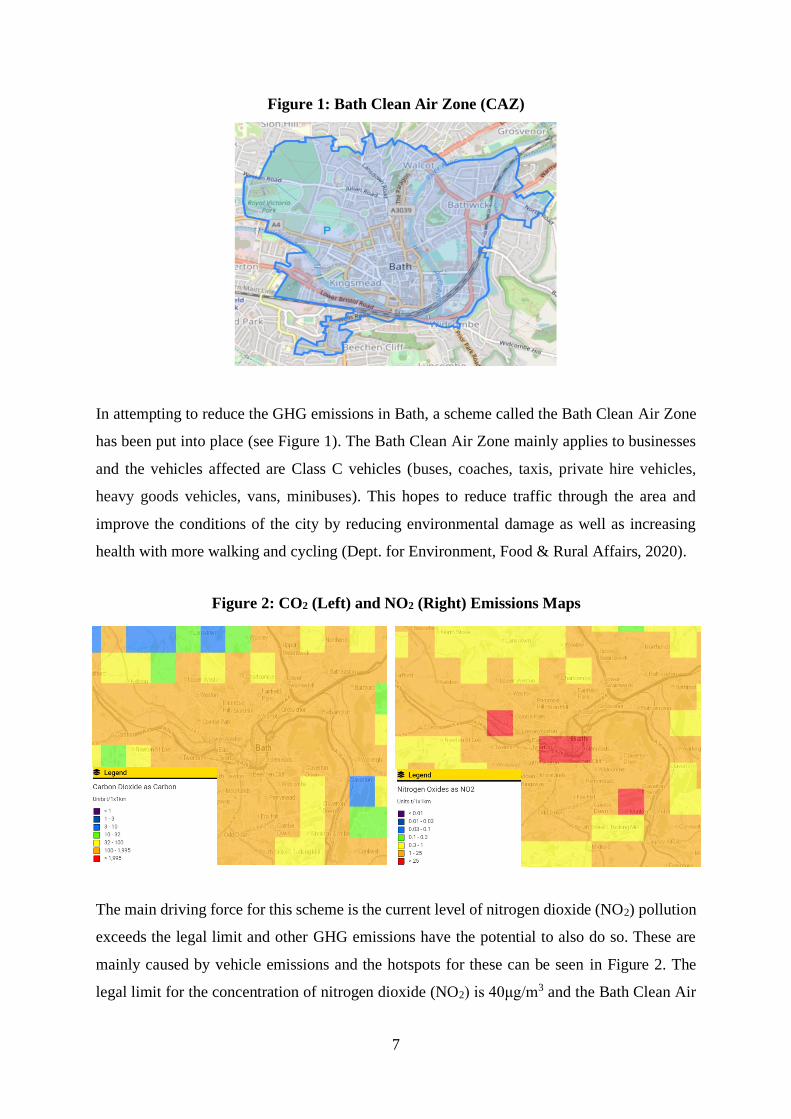
Figure 1: Bath Clean Air Zone (CAZ)
In attempting to reduce the GHG emissions in Bath, a scheme called the Bath Clean Air Zone
has been put into place (see Figure 1). The Bath Clean Air Zone mainly applies to businesses
and the vehicles affected are Class C vehicles (buses, coaches, taxis, private hire vehicles,
heavy goods vehicles, vans, minibuses). This hopes to reduce traffic through the area and
improve the conditions of the city by reducing environmental damage as well as increasing
health with more walking and cycling (Dept. for Environment, Food & Rural Affairs, 2020).
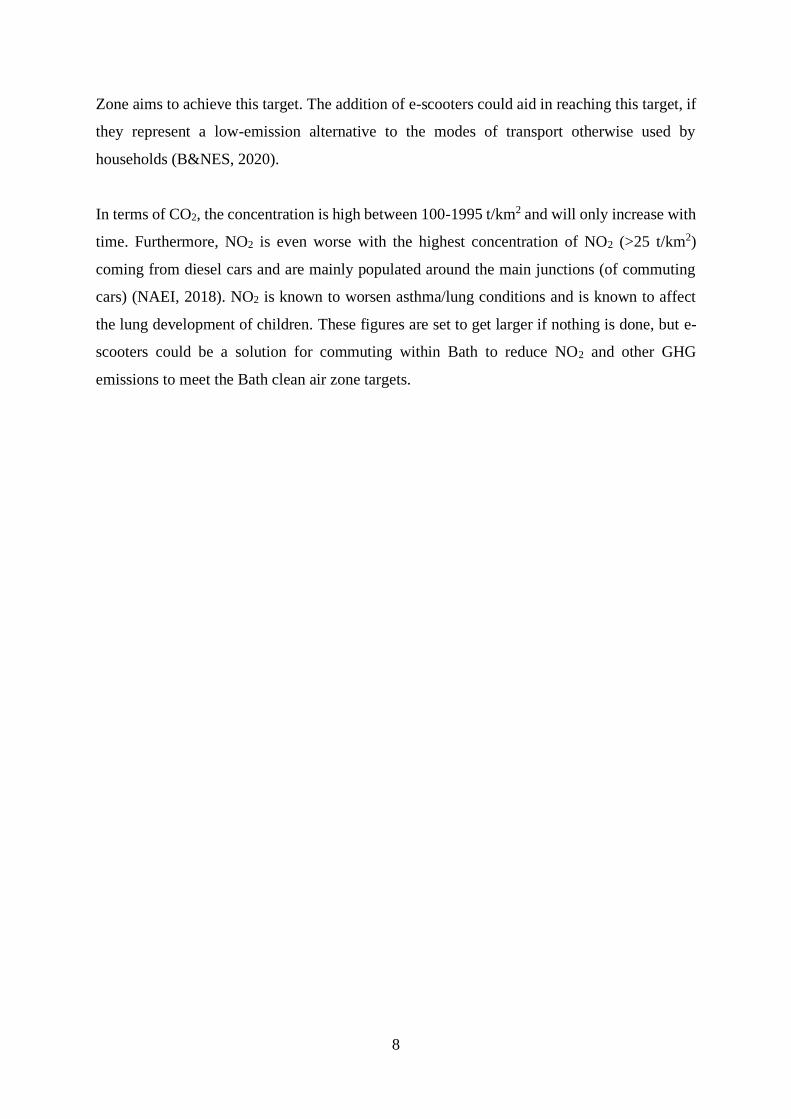
The main driving force for this scheme is the current level of nitrogen dioxide (NO2) pollution
exceeds the legal limit and other GHG emissions have the potential to also do so. These are
mainly caused by vehicle emissions and the hotspots for these can be seen in Figure 2. The
legal limit for the concentration of nitrogen dioxide (NO2) is 40μg/m3 and the Bath Clean Air
Figure 2: CO2 (Left) and NO2 (Right) Emissions Maps
8
Zone aims to achieve this target. The addition of e-scooters could aid in reaching this target, if
they represent a low-emission alternative to the modes of transport otherwise used by
households (B&NES, 2020).
In terms of CO2, the concentration is high between 100-1995 t/km2 and will only increase with
time. Furthermore, NO2 is even worse with the highest concentration of NO2 (>25 t/km2)
coming from diesel cars and are mainly populated around the main junctions (of commuting
cars) (NAEI, 2018). NO2 is known to worsen asthma/lung conditions and is known to affect
the lung development of children. These figures are set to get larger if nothing is done, but e-
scooters could be a solution for commuting within Bath to reduce NO2 and other GHG
emissions to meet the Bath clean air zone targets.
9
Methodology
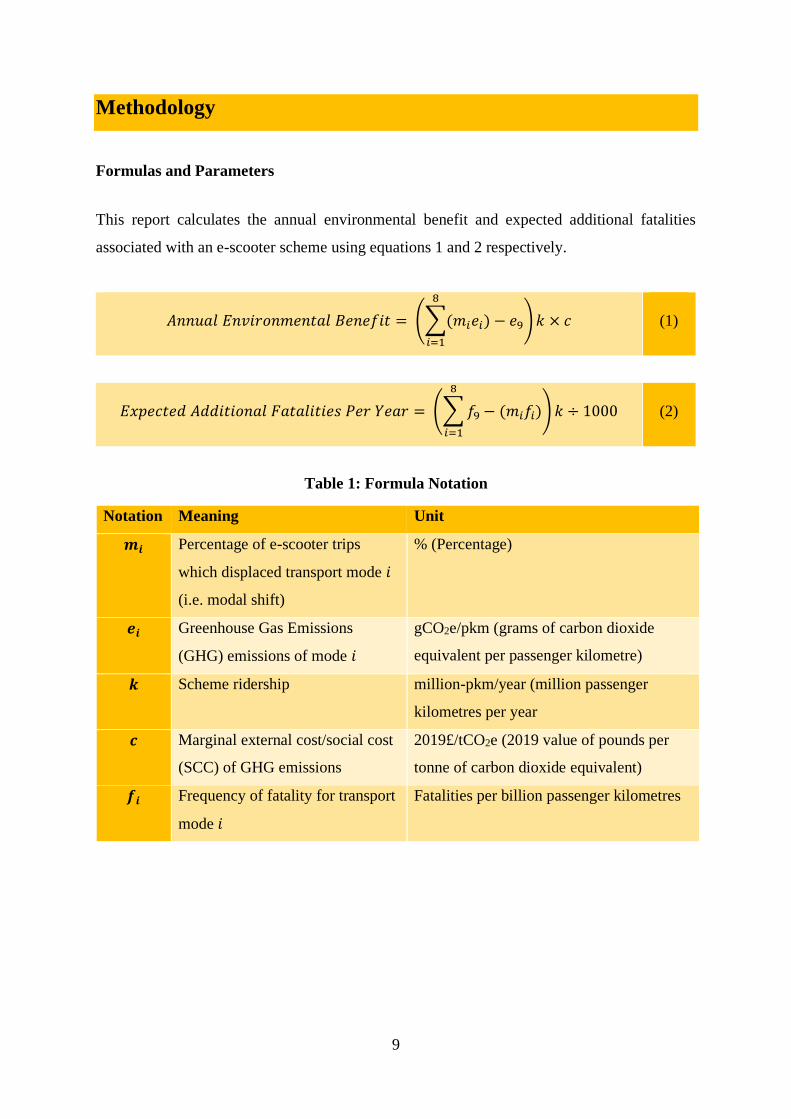
Formulas and Parameters
This report calculates the annual environmental benefit and expected additional fatalities
associated with an e-scooter scheme using equations 1 and 2 respectively.
𝐴𝑛𝑛𝑢𝑎𝑙 𝐸𝑛𝑣𝑖𝑟𝑜𝑛𝑚𝑒𝑛𝑡𝑎𝑙 𝐵𝑒𝑛𝑒𝑓𝑖𝑡 = (∑(𝑚𝑖𝑒𝑖) − 𝑒9
8
𝑖=1
) 𝑘 × 𝑐
(1)
𝐸𝑥𝑝𝑒𝑐𝑡𝑒𝑑 𝐴𝑑𝑑𝑖𝑡𝑖𝑜𝑛𝑎𝑙 𝐹𝑎𝑡𝑎𝑙𝑖𝑡𝑖𝑒𝑠 𝑃𝑒𝑟 𝑌𝑒𝑎𝑟 = (∑ 𝑓9 − (𝑚𝑖𝑓𝑖)
8
𝑖=1
) 𝑘 ÷ 1000
(2)
Table 1: Formula Notation
Notation Meaning Unit
𝒎𝒊 Percentage of e-scooter trips
which displaced transport mode 𝑖
(i.e. modal shift)
% (Percentage)
𝒆𝒊 Greenhouse Gas Emissions
(GHG) emissions of mode 𝑖
gCO2e/pkm (grams of carbon dioxide
equivalent per passenger kilometre)
𝒌 Scheme ridership million-pkm/year (million passenger
kilometres per year
𝒄 Marginal external cost/social cost
(SCC) of GHG emissions
2019£/tCO2e (2019 value of pounds per
tonne of carbon dioxide equivalent)
𝒇𝒊 Frequency of fatality for transport
mode 𝑖
Fatalities per billion passenger kilometres

10
Table 2: Parameter Values
𝒊 Mode 𝒆𝒊 𝒇𝒊
1 Car 162 1.4**
2 Taxi* 427.7
3 Bus 91.4 0.1
4 Train 43.4 0.1***
6 Bicycle 16.9 11
6 Bikeshare 57.5
7 Moped 73.1 45
8 Walk 0 14
9 E-scooter See Table 3 39****
*Single passenger “ride sourcing ICE car” e.g. Uber trip
**Assumed to be equal to car fatality frequency
***Assumed to be similar to bus fatality frequency
****(100+78)÷(2×2.3) i.e. average fatality frequency per billion rides divided by median trip
length (2.3km)
Table 3: Sensitivity Variable Values
Sensitivity Variable Low Central High
𝒄 34 55 125
𝒆𝟗 37 103.6 132.8
Formula Explanation
Equation 1 subtracts the expected annual GHG emissions of e-scooter usage from the expected
annual GHG emissions from the other modes of transport which would have been used if e-
scooters were not an option.
Similarly, equation 2 subtracts the expected annual fatalities (riders and non-riders included)
caused by e-scooter usage from the expected annual fatalities from other modes of transport
which would have been used if e-scooters were not an option.
11
Limitations:
Both equations assume that if users had completed their journey with alternate modes of
transport, on average the route would be of equal length. This is semi-realistic because the start
point and destination are independent of the mode of transport used, and because e-scooters
are supposed to be used on the roads. However, buses do not take direct routes and car parks
may be in a different location than the desired destination. People who walk may be able to
take a more direct route than the road, however it is assumed that CO2 emissions from walking
are negligible (and therefore do not depend on distance).
This report considers equation 2 to be the most accurate, and least complicated, safety
calculation given the data available on e-scooters. Ideally, a safety calculation would calculate
the relative frequency and severity of specific injury classifications across transport modes,
however ITF consider there to be “too few studies on hospital admissions” and possibly
substantial underreporting of pedestrian injuries (ITF, 2020a). Calculating safety by comparing
fatality rates also removes the need to compare the relative importance of different injury
severities. However, neglecting minor injuries can be expected to result in an overestimation
of e-scooter safety both in absolute and relative terms.
The additional fatalities equation fails to incorporate the effect of safety regulation on fatality
frequency (due to lack of data). Hence, case study comparisons do not reflect the relative safety
of micro mobility operations, but simple acknowledge the possible trade-off between
environmental impact and safety.
12
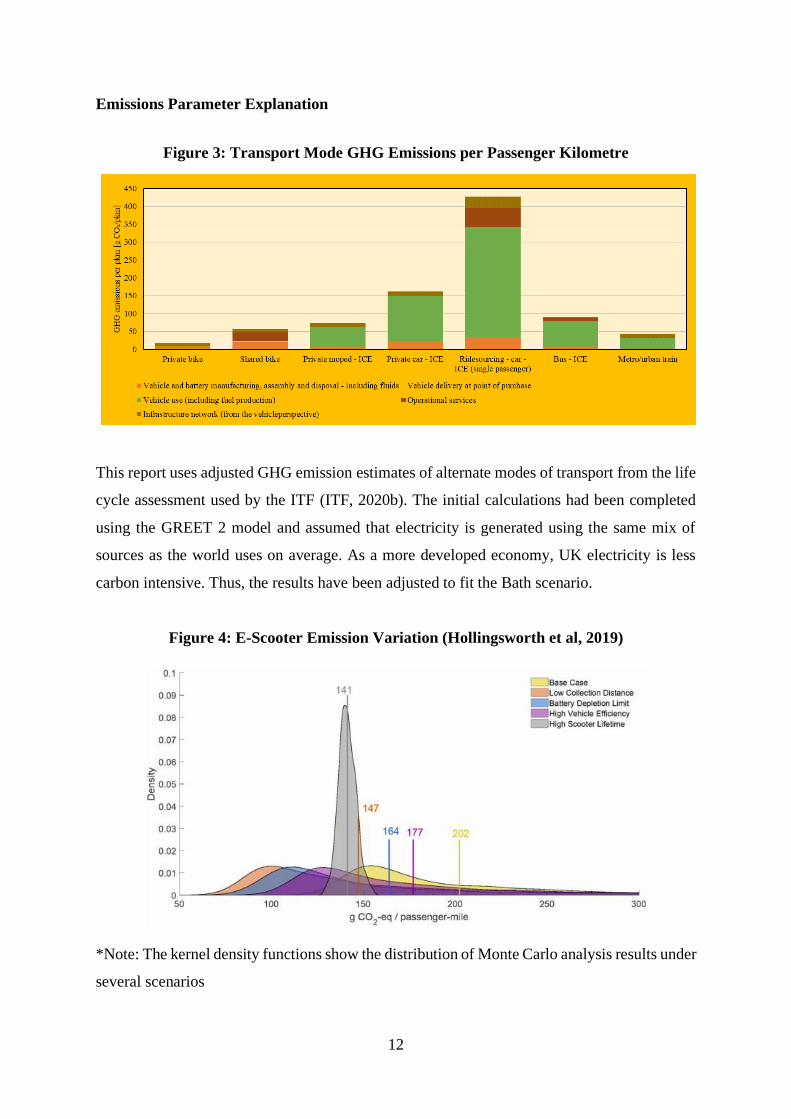
Emissions Parameter Explanation
Figure 3: Transport Mode GHG Emissions per Passenger Kilometre
This report uses adjusted GHG emission estimates of alternate modes of transport from the life
cycle assessment used by the ITF (ITF, 2020b). The initial calculations had been completed
using the GREET 2 model and assumed that electricity is generated using the same mix of
sources as the world uses on average. As a more developed economy, UK electricity is less
carbon intensive. Thus, the results have been adjusted to fit the Bath scenario.
Figure 4: E-Scooter Emission Variation (Hollingsworth et al, 2019)
*Note: The kernel density functions show the distribution of Monte Carlo analysis results under
several scenarios
13
Low, central, and high estimates for the GHG emissions of e-scooters are necessary to account
for: uncertainty over emission calculations, technological advancement over time, and varying
emissions depending on how differed micro-mobility firms operate. For example, it is clear
from Figure 4, that GHG emissions are dependent on several variables. Hence, if improvements
are made to standard e-scooter operation and battery lifespan, the GHG emissions of e-scooters
will fall.
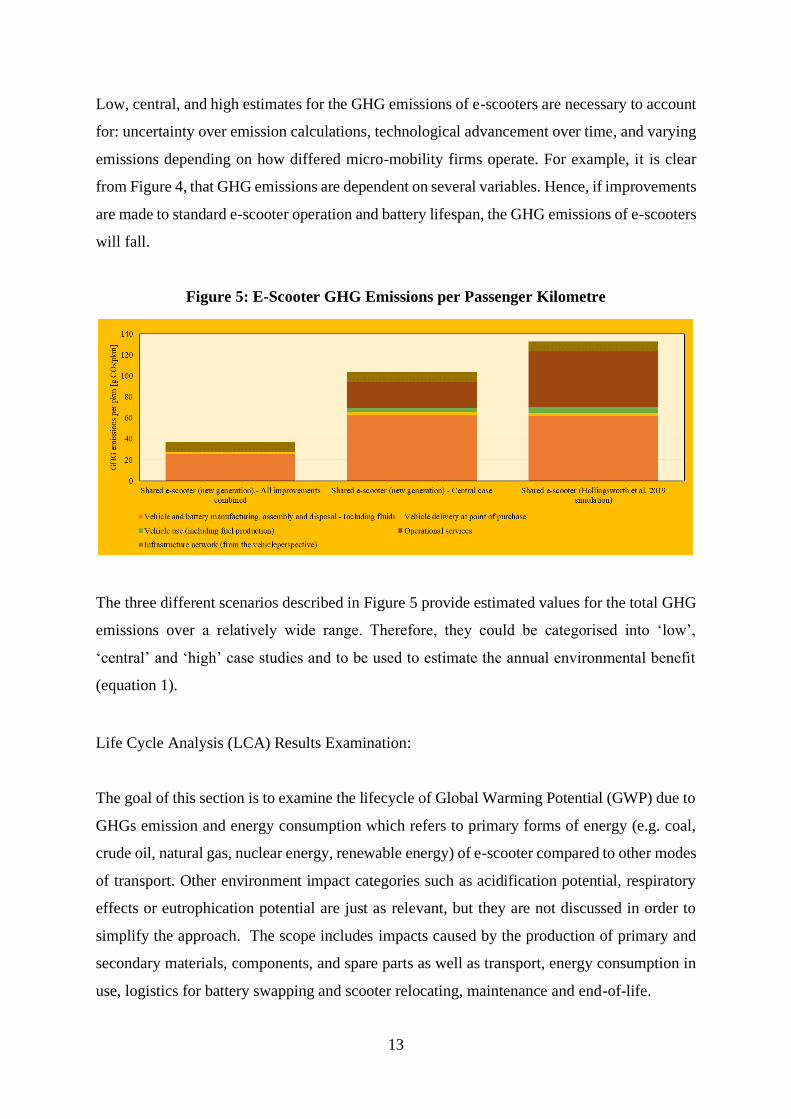
Figure 5: E-Scooter GHG Emissions per Passenger Kilometre
The three different scenarios described in Figure 5 provide estimated values for the total GHG
emissions over a relatively wide range. Therefore, they could be categorised into ‘low’,
‘central’ and ‘high’ case studies and to be used to estimate the annual environmental benefit
(equation 1).
Life Cycle Analysis (LCA) Results Examination:
The goal of this section is to examine the lifecycle of Global Warming Potential (GWP) due to
GHGs emission and energy consumption which refers to primary forms of energy (e.g. coal,
crude oil, natural gas, nuclear energy, renewable energy) of e-scooter compared to other modes
of transport. Other environment impact categories such as acidification potential, respiratory
effects or eutrophication potential are just as relevant, but they are not discussed in order to
simplify the approach. The scope includes impacts caused by the production of primary and
secondary materials, components, and spare parts as well as transport, energy consumption in
use, logistics for battery swapping and scooter relocating, maintenance and end-of-life.
14
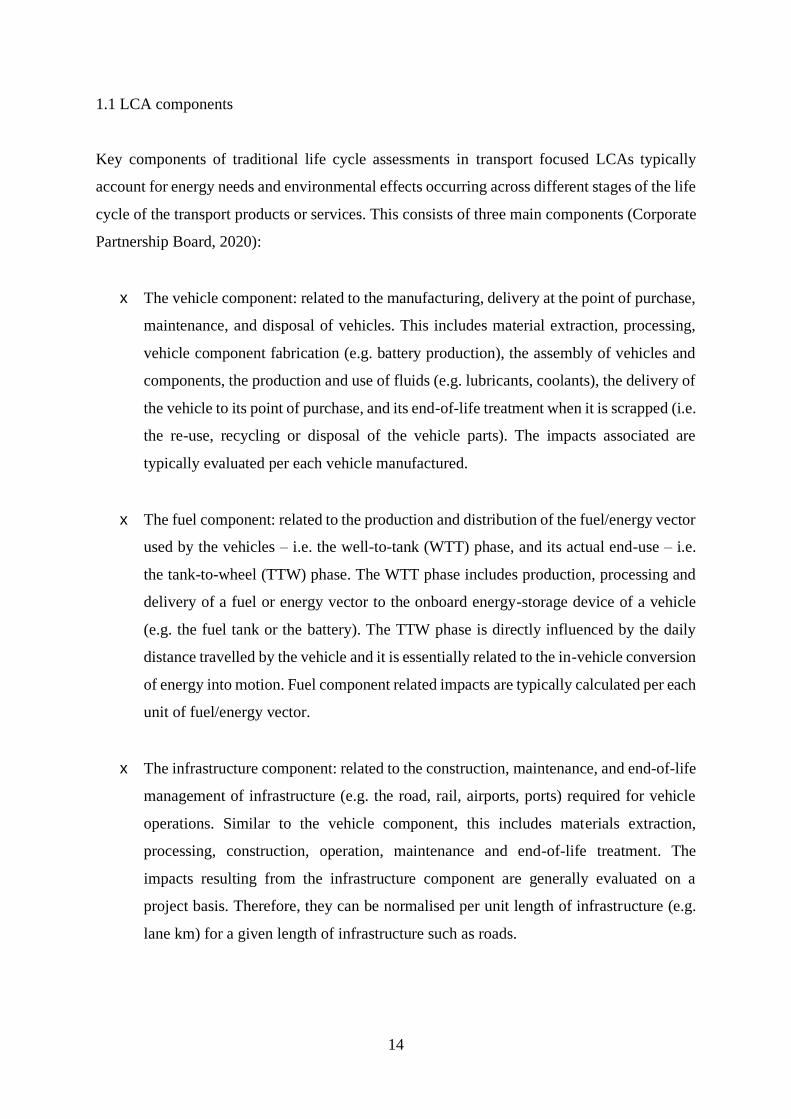
1.1 LCA components
Key components of traditional life cycle assessments in transport focused LCAs typically
account for energy needs and environmental effects occurring across different stages of the life
cycle of the transport products or services. This consists of three main components (Corporate
Partnership Board, 2020):
¶ The vehicle component: related to the manufacturing, delivery at the point of purchase,
maintenance, and disposal of vehicles. This includes material extraction, processing,
vehicle component fabrication (e.g. battery production), the assembly of vehicles and
components, the production and use of fluids (e.g. lubricants, coolants), the delivery of
the vehicle to its point of purchase, and its end-of-life treatment when it is scrapped (i.e.
the re-use, recycling or disposal of the vehicle parts). The impacts associated are
typically evaluated per each vehicle manufactured.
¶ The fuel component: related to the production and distribution of the fuel/energy vector
used by the vehicles – i.e. the well-to-tank (WTT) phase, and its actual end-use – i.e.
the tank-to-wheel (TTW) phase. The WTT phase includes production, processing and
delivery of a fuel or energy vector to the onboard energy-storage device of a vehicle
(e.g. the fuel tank or the battery). The TTW phase is directly influenced by the daily
distance travelled by the vehicle and it is essentially related to the in-vehicle conversion
of energy into motion. Fuel component related impacts are typically calculated per each
unit of fuel/energy vector.
¶ The infrastructure component: related to the construction, maintenance, and end-of-life
management of infrastructure (e.g. the road, rail, airports, ports) required for vehicle
operations. Similar to the vehicle component, this includes materials extraction,
processing, construction, operation, maintenance and end-of-life treatment. The
impacts resulting from the infrastructure component are generally evaluated on a
project basis. Therefore, they can be normalised per unit length of infrastructure (e.g.
lane km) for a given length of infrastructure such as roads.
15
Figure 6: Key Components of Life Cycle Assessments Used in Transport
Given the shared nature of the new urban mobility options, LCAs of these services require an
expansion of the system boundaries typically used for traditional modes to servicing (including
refuelling or charging), repositioning (and parking) and the integration of vehicle movements
occurring without passengers but necessary to enable operation. The formers are more relevant
for forms of mobility that use free-floating vehicles, but also in use for the rebalancing of
docked vehicles. The latter is most relevant for public transport, taxis and on-demand, door-to-
door services, and private owned cars in cases of cruising distance while searching for parking
or picking up others.
1.2 Energy use and carbon dioxide emissions of e-scooter versus other transport options
The details on GHG emissions and energy use for the three main life-cycle components
(vehicle, fuel and infrastructure), as well as other services, need for the operation of vehicles
relevant for new forms of mobility are taken from the LCA conducted by (Corporate
Partnership Board, 2020), as shown in Figure 3 and Figure 7 below. The assessment was
developed in an attempt to give a representative picture of the current situation of the global
energy and transport system with some key assumptions. These include 1) The carbon intensity
of petroleum fuels due to oil extraction and refining reflects a global average value of 15.4
gCO2/MJ and does not differentiate between specific types of primary resources, 2) The
electricity generation mix reflects the global average in 2017, 3) The carbon intensity of battery
manufacturing accounts for a large reliance on coal-based electricity for smelting, which
translates in a value of 93 kg CO2/kWh of pack capacity. The inputs developed in this
estimation include components such as the average number of passengers, the electricity mix
16
and the ratio of operation distance per active distance (km) and is defined by global averages
observed prior to the Covid-19 pandemic.
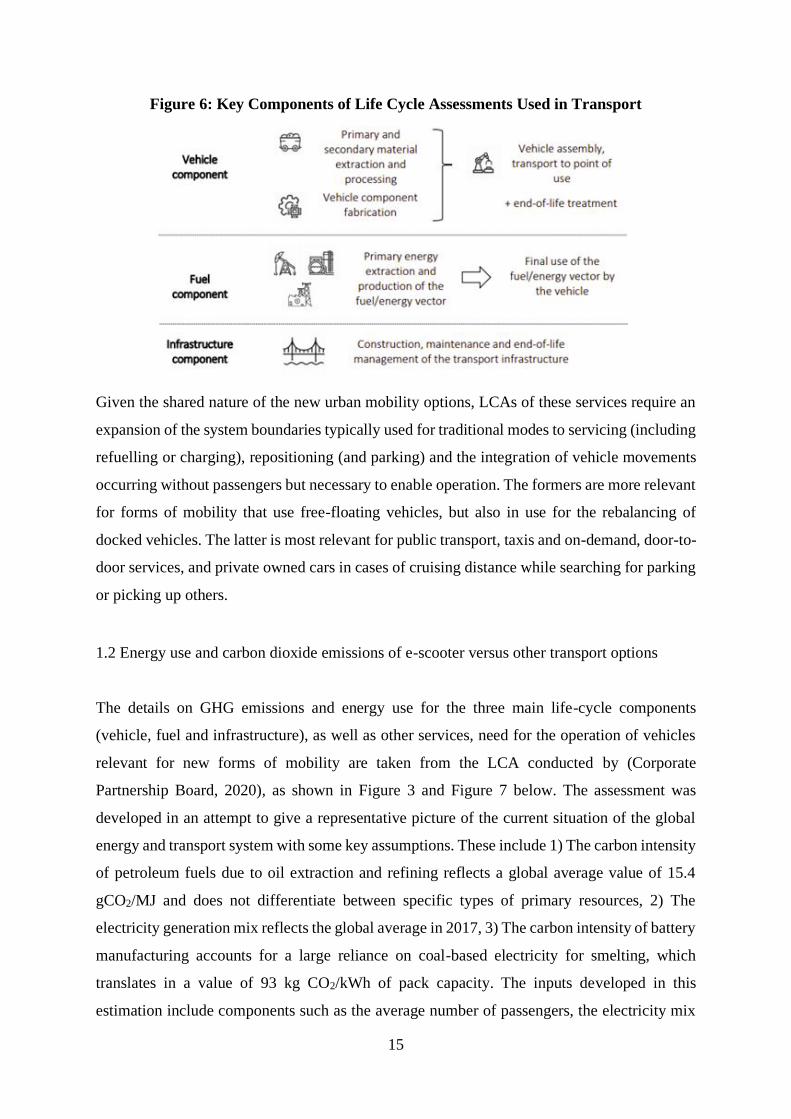
Figure 7: Transport Mode Life-Cycle Energy Requirements
Comparing Figures 3 and 5, shared e-scooters use significantly less energy and emit much less
GHG per person-kilometre over their life cycle than cars. However, the energy use and GHG
emissions from shared e-scooters are the highest among the shared micro-mobility (involving
e-scooters, bikes, e-bikes and mopeds), and also slightly higher in magnitude than those of
metros and buses. These are mainly imputable to the vehicle component due to a rather low
lifetime and operational services such as repositioning and charging. Energy and GHG
emissions per passenger kilometre due to the fuel and infrastructure components are most
relevant for individual vehicles using combustion technology and requiring the use of
significant amounts of lane km of roads, including parking (i.e. for private car) as well as taxis
and ride-sourcing. They are less relevant for lighter vehicles that share the road infrastructure
with cars in cases with a low frequency of use and require smaller dedicated lanes for higher
frequencies of infrastructure use.
Another LCA conducted by Hollingsworth et al. (2019) also showed similar findings with 50%
and 43% of the average global warming impacts coming from materials/manufacturing and
collection/distribution respectively, while the burdens from the electricity used to charge the
scooter and the transportation from the manufacture are trivial.
17
1.3 Changes in GHG emissions of e-scooters compared to other means of transport by changing
key input parameters
To investigate the inherent variability and uncertainty of several of the parameters,
Hollingsworth et al. (2019) conducted a Monte Carlo analysis with assumed distributions for
relevant parameters to determine the overall distribution of life cycle impacts. The sensitivity
of the results to each parameter is then tested in isolation, using the Base Case assumptions to
determine which parameters have the greatest impact, as shown in Figure 8.
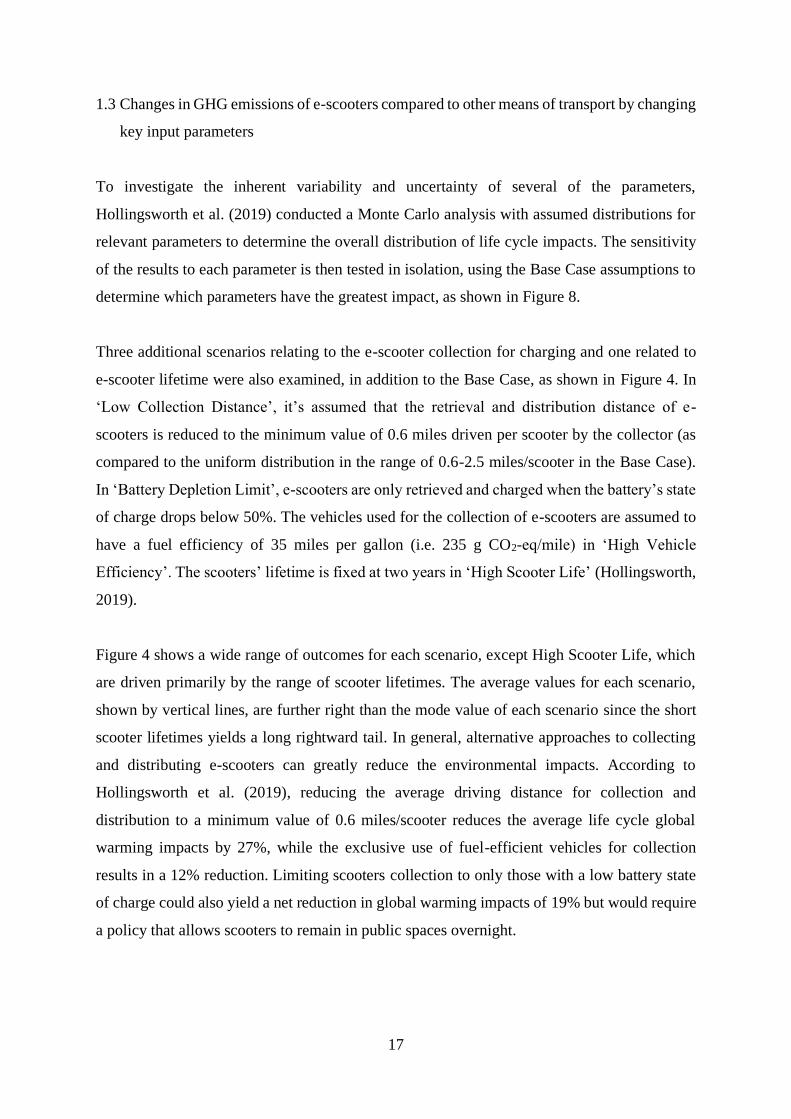
Three additional scenarios relating to the e-scooter collection for charging and one related to
e-scooter lifetime were also examined, in addition to the Base Case, as shown in Figure 4. In
‘Low Collection Distance’, it’s assumed that the retrieval and distribution distance of e-
scooters is reduced to the minimum value of 0.6 miles driven per scooter by the collector (as
compared to the uniform distribution in the range of 0.6-2.5 miles/scooter in the Base Case).
In ‘Battery Depletion Limit’, e-scooters are only retrieved and charged when the battery’s state
of charge drops below 50%. The vehicles used for the collection of e-scooters are assumed to
have a fuel efficiency of 35 miles per gallon (i.e. 235 g CO2-eq/mile) in ‘High Vehicle
Efficiency’. The scooters’ lifetime is fixed at two years in ‘High Scooter Life’ (Hollingsworth,
2019).
Figure 4 shows a wide range of outcomes for each scenario, except High Scooter Life, which
are driven primarily by the range of scooter lifetimes. The average values for each scenario,
shown by vertical lines, are further right than the mode value of each scenario since the short
scooter lifetimes yields a long rightward tail. In general, alternative approaches to collecting
and distributing e-scooters can greatly reduce the environmental impacts. According to
Hollingsworth et al. (2019), reducing the average driving distance for collection and
distribution to a minimum value of 0.6 miles/scooter reduces the average life cycle global
warming impacts by 27%, while the exclusive use of fuel-efficient vehicles for collection
results in a 12% reduction. Limiting scooters collection to only those with a low battery state
of charge could also yield a net reduction in global warming impacts of 19% but would require
a policy that allows scooters to remain in public spaces overnight.

18
Figure 8: Sensitivity Analysis of GHG Emissions for Various E-Scooter Scenarios
From Figure 8, it can be concluded that the global warming impacts are most sensitive to the
daily usage of the e-scooter, e-scooter lifetime, distance driven for collection and vehicle fuel
efficiency; and global warming impacts are insensitive to the distance for transporting the
scooter from the manufacturer to the point of use and the grid emissions. Both low daily usage
of scooter and low scooter lifetimes show very high global warming impacts which are driven
from the manufacturing and materials burdens spread across a smaller number of passenger-
miles travelled over an e-scooter’s lifetime.
Even though the study conducted by Hollingsworth et al. (2019) is specific to Raleigh, North
Carolina, the results can be interpreted and used for a wide range of locations. This is because
the environmental impacts of the transportation of the scooter from the manufacturer to the
end-use location are found to be trivial and the potential differences in grid emissions for
charging the e-scooter yield small changes in the overall results. Relative to emissions from
charging in Raleigh, charging with a 0 kgCO2/kWh power source (to approximate wind, solar
or nuclear) would decrease life cycle emissions by 6%, while charging with a 1 kgCO2/kWh
power source (to approximate coal generation) would increase life cycle emission by 4%
(Hollingsworth, 2019). The collection miles driven per scooter mile is the most important
parameter that would vary across locations. Higher densities of e-scooters and lower collection
driving distances per scooter are expected in more densely populated metropolitan areas, in

19
contrast to sparsely populated or sprawling areas which would like to necessitate higher
collection miles driven.
1.4 Battery Concerns – Social and Environmental complications of lithium mining
There is a lot of detail in the Salar de Atacama case study. Whilst it is not directly relevant to
the Voi study, it is important in regard to the LCA and for understanding the impact that the
source materials for a product can have. Even when a company advocated for 100%
sustainability, it is very rare that this is true.
The Voi scooters in Bath use Lithium-ion batteries which provide a low emission mode of
transport around the city (Voi, 2021). However, less is known about the true sustainability
issues and social impacts that the mining for lithium for use within these batteries can actually
have on delicate ecosystems.
Due to the increase of electric-powered vehicles, the lithium mining industry has seen an
increase of 20% per year since 2000 (Martin et al., 2017). They are expected to aid in the
transition from fossil fuel to more renewable energies, thus mitigating air pollution concerns
from burning fuels (Tran et al., 2012). 57% of the world’s lithium resources are located in the
South American Lithium Triangle (Gruber et al., 2011). Mining in the area occurs on hyper-
arid salt flats, where it poses a threat to the hydrodynamics, richness in flora and fauna, social
wellbeing and, biodiversity (Babidge et al., 2018) (Marazuela et al., 2019). The Salar de
Atacama, the largest source of lithium in the world, provides a modern example of the
stakeholders and impacts at play surrounding lithium mining.
Hydrodynamics
The lithium mining in the Salar de Atacama has led to the depletion of groundwater reservoirs
and a drawdown of the water table (Marazuela et al., 2019). Being an endorheic basin, the
aquifers in this area are produced due to rainfall. With the scarce water network within this
hyper-arid climate, water extraction and evaporation occur faster than replenishment leaving a
leaving significant ecological impact on these salt flats (Marazuela et al., 2019).

20
Flora, Fauna and Biodiversity
The area is facing huge losses to biodiversity due to the reduction in water availability.
Reportedly, flamingos have nearly completely left the lagoons, however, SQM (a mining
company operating in Chile) argue that further research is needed to prove it is caused by
mining activities. The biodiversity here, due to it being a hyper-arid climate, is low but also
highly vulnerable to change.
Social complications and Key Stakeholders
The mining in the Salar De Atacama has led to drastic implications for the local communities
around the area. One of these mainly being the depletion of groundwater reservoirs, leaving
the communities to try to source their water through alternative methods such as fog harvesting
or through the aids of NGOs. There are great tensions caused by the impacts of this mining
leading to decades of arguments between the stakeholders. In Chile, the water network is
privatised and usage is sold off through permits mainly to the mining companies, leaving local
people through arduous court appeals to prevent the use of these permits. Issues such as these
are bringing in forced migration and causing local people to leave ancestral homes.
Final notes
To conclude this section, it is evident that lithium-ion batteries have had a devastating impact
on local communities and the environment. It creates a difficult argument as on the one hand,
the scooters can add to creating sustainable habits and lifestyles in Bath, whereas on the other
the production of them is leading to mass environmental damage of a potentially larger
magnitude. This has to be weighed up in the argument for sustainability with the Voi scooters
and perhaps lead to an investigation into other electrical storage options for the scooters.
SCC Explanation
Equation 1 uses 3 different SCC values to reflect the uncertainty of results. They are estimated
by calculating the 1st, 2nd, and 3rd quartiles of a sample of SCC values taken from multiple
sources. Multiple sources are used to reflect the variation across calculations. Sources were
21
selected based on the reputation of the institution as well as their perceived independence,
because environmental policies can be politically motivated.
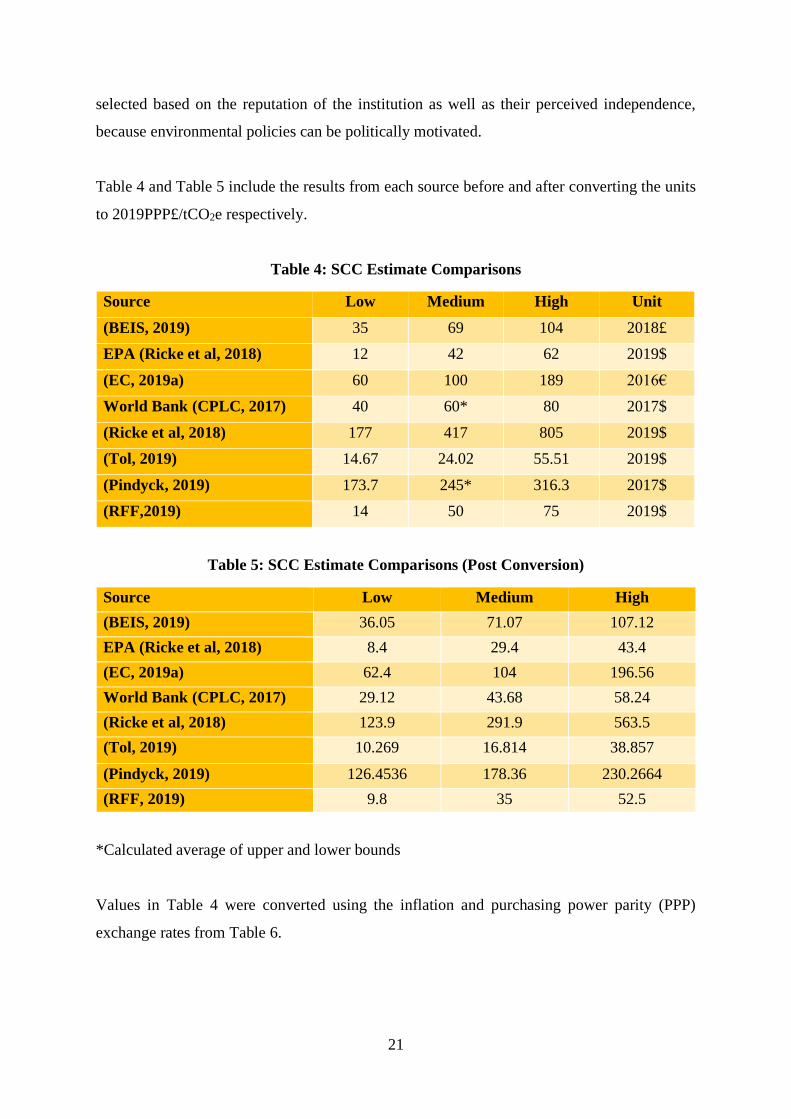
Table 4 and Table 5 include the results from each source before and after converting the units
to 2019PPP£/tCO2e respectively.
Table 4: SCC Estimate Comparisons
Source Low Medium High Unit
(BEIS, 2019) 35 69 104 2018£
EPA (Ricke et al, 2018) 12 42 62 2019$
(EC, 2019a) 60 100 189 2016€
World Bank (CPLC, 2017) 40 60* 80 2017$
(Ricke et al, 2018) 177 417 805 2019$
(Tol, 2019) 14.67 24.02 55.51 2019$
(Pindyck, 2019) 173.7 245* 316.3 2017$
(RFF,2019) 14 50 75 2019$
Table 5: SCC Estimate Comparisons (Post Conversion)
Source Low Medium High
(BEIS, 2019) 36.05 71.07 107.12
EPA (Ricke et al, 2018) 8.4 29.4 43.4
(EC, 2019a) 62.4 104 196.56
World Bank (CPLC, 2017) 29.12 43.68 58.24
(Ricke et al, 2018) 123.9 291.9 563.5
(Tol, 2019) 10.269 16.814 38.857
(Pindyck, 2019) 126.4536 178.36 230.2664
(RFF, 2019) 9.8 35 52.5
*Calculated average of upper and lower bounds
Values in Table 4 were converted using the inflation and purchasing power parity (PPP)
exchange rates from Table 6.

22
Table 6: Unit Conversion Values
Conversion Unit Value Source
PPP Exchange Rate 2019£/$ 0.7 (OECD, 2020)
PPP Exchange Rate 2019£/€ 1 (OECD, 2020)
Cumulative Inflation Rate 2019$/2017$ 1.04 (US Inflation Calculator, 2020)
Cumulative Inflation Rate 2019€/2016€ 1.04 (Inflation Tool, 2020)
Cumulative Inflation Rate 2019£/2018£ 1.03 (BoE, 2020)
Limitations:
Estimations of the social cost of carbon (SCC) vary across sources, depending on the chosen
discount rate and model used in the SCC calculations. This report does not compare the relative
accuracy of different models used to measure the SCC (e.g. The Dynamic Integrated model of
Climate and the Economy (DICE), the Framework for Uncertainty, Negotiation and
Distribution (FUND) model, or Policy Analysis of the Greenhouse Effect (PAGE) model) or
conclude which discount rate should be used.
A discount rate is a parameter value commonly used in models, which devalues the importance
of results in future periods to reflect impatience. Since GHG emissions have a lasting negative
effect, a higher discount rate is associated with a lower SCC estimation, ce t e ri s pari bus , as
represented by Figure 9.

23
Figure 9: Impact of Discount Rates on SCC Estimates
Figure 10 depicts the values from Table 5 as a frequency chart. Most SCC estimates are
clustered in the 0-80 region. It is worth noting that most of the smaller estimates came from
reputable, but political, institutions, whereas the more extreme results originate from journal
publications.
Figure 10: SCC Estimates (2019£/tCO2e)
24
Safety Parameter Explanation
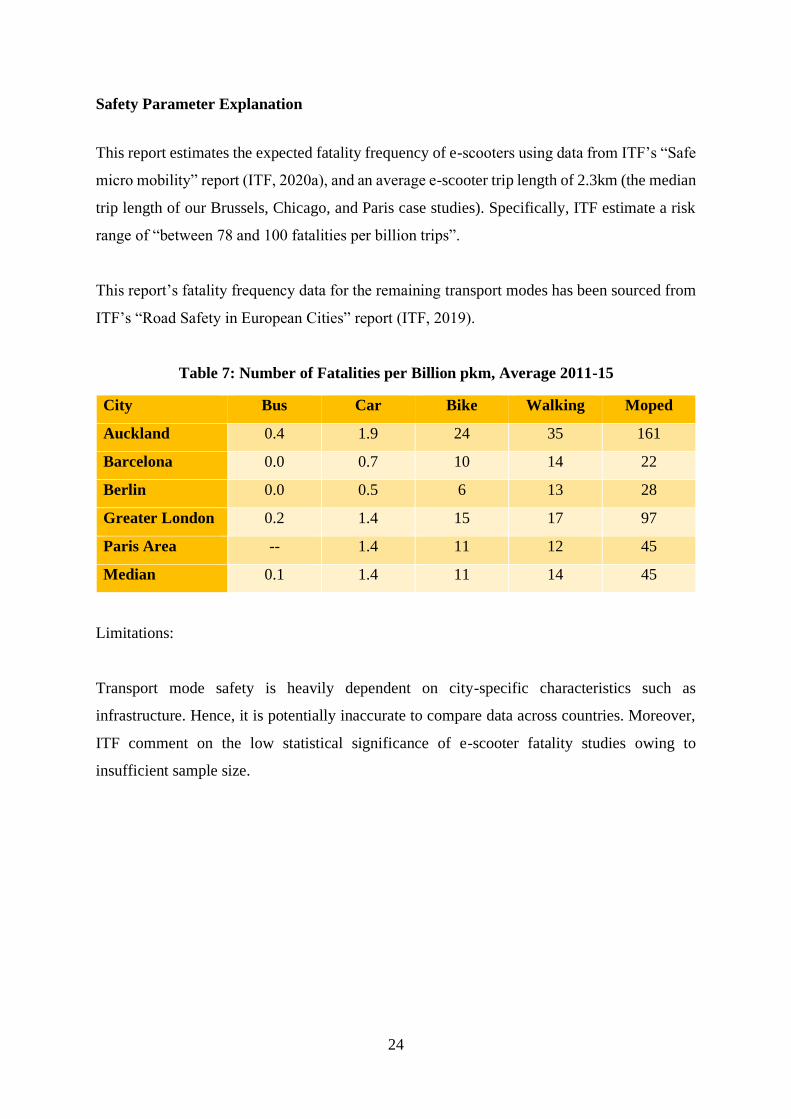
This report estimates the expected fatality frequency of e-scooters using data from ITF’s “Safe
micro mobility” report (ITF, 2020a), and an average e-scooter trip length of 2.3km (the median
trip length of our Brussels, Chicago, and Paris case studies). Specifically, ITF estimate a risk
range of “between 78 and 100 fatalities per billion trips”.
This report’s fatality frequency data for the remaining transport modes has been sourced from
ITF’s “Road Safety in European Cities” report (ITF, 2019).
Table 7: Number of Fatalities per Billion pkm, Average 2011-15
City Bus Car Bike Walking Moped
Auckland 0.4 1.9 24 35 161
Barcelona 0.0 0.7 10 14 22
Berlin 0.0 0.5 6 13 28
Greater London 0.2 1.4 15 17 97
Paris Area -- 1.4 11 12 45
Median 0.1 1.4 11 14 45
Limitations:
Transport mode safety is heavily dependent on city-specific characteristics such as
infrastructure. Hence, it is potentially inaccurate to compare data across countries. Moreover,
ITF comment on the low statistical significance of e-scooter fatality studies owing to
insufficient sample size.

25
Figure 11: Number of Crashes Reported by E-Scooter Companies
Figure 11 also indicates a downward trend in e-scooter collisions. Hence, this report’s fatality
frequency parameter may become outdated quickly if fatalities are linked to the inexperience
of e-scooter riders (which is expected to diminish over time). Alternatively, the decline could
be due to implementation of effective safety regulation.
26
Case Studies
Paris (Lime, 2019a)
Elevation Range (ft) Average Salary (£) Median Age (Years)
555 39,388 36
Bike Lanes
(km/km2)
PT Reliability and
Quality (Score/10)
Average
Temperature (C°)
Average Rainfall
(mm/year)
9.5 7.5 5 & 20 (W & S) 607 – 641
Lime launched their Paris shared e-scooter service in June 2018 and achieved a ridership of
20,195,000 passenger kilometres in their first year alone (Lime, 2019a). Lime is one of 10
“free-floating” electric scooter services in Paris (6t-bureau, 2019). As the current global e-
scooter market leader, Lime has received significantly more funding than their competitors.
For example, in his 2020 report on “Integrating e-scooters in urban transportation: problems,
policies, and the prospect of system change”, Gossling recorded that Lime had nearly triple the
funding of Bird (the second largest e-scooter company) despite selling less than 10% more
rides globally (Gossling, 2020).
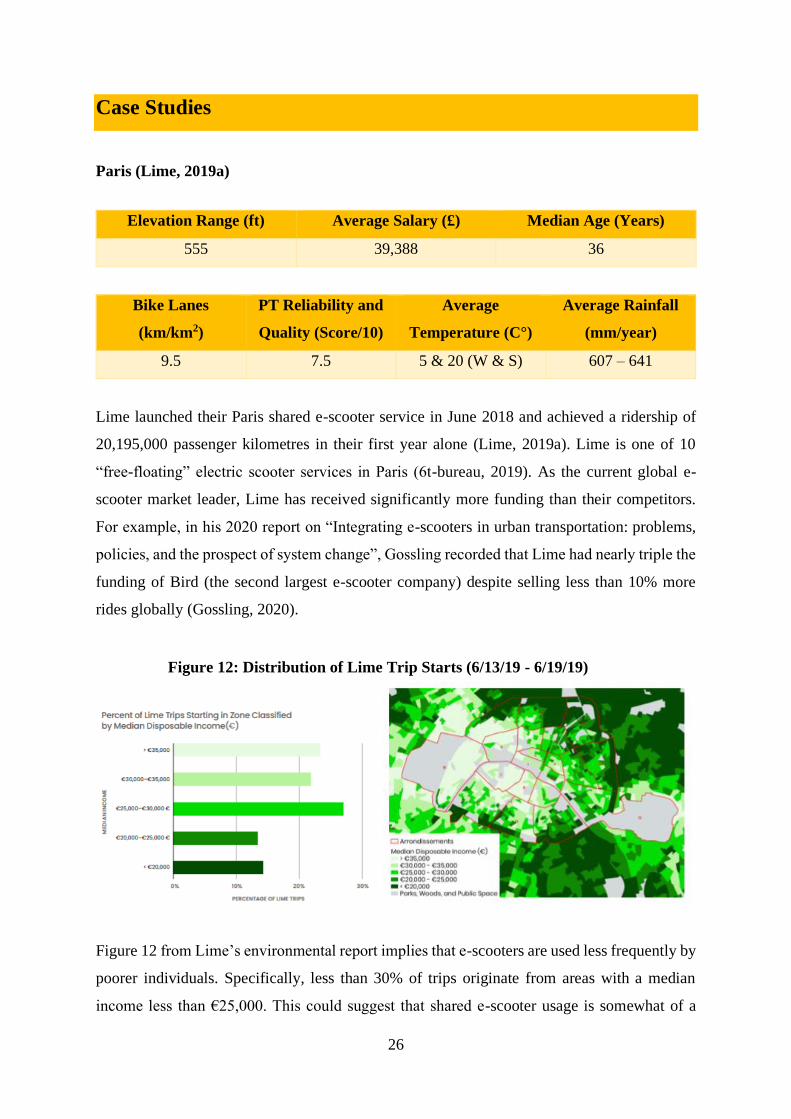
Figure 12 from Lime’s environmental report implies that e-scooters are used less frequently by
poorer individuals. Specifically, less than 30% of trips originate from areas with a median
income less than €25,000. This could suggest that shared e-scooter usage is somewhat of a
Figure 12: Distribution of Lime Trip Starts (6/13/19 - 6/19/19)

27
luxury. Indeed, Figure 13 shows that 10% of journeys had no purpose (“strolls”) and that 69%
of users considered the pleasure derived from travelling by e-scooter as one of their main
motivations for choosing micro-mobility over other modes (6t-bureau, 2019). However, Figure
12’s results are strongly influenced by Paris’ income distribution. For example, the results may
merely reflect that a higher proportion of Paris’ population live in areas with a median income
which exceeds €25,000.
Figure 13: E-Scooter Usage Motivations
6-t estimated that, on average, 58% of e-scooter users in Paris are local (i.e. live in Paris),
suggesting that e-scooters may be popular with tourists (6t-bureau, 2019). However, as with
the case of income, it is difficult to analyse this data without knowing the average proportion
of individuals in Paris who live locally.
6-t also found that: 66% of local e-scooter users were men; 28% of local e-scooter users were
between 25 and 34 years old; and 19% of local e-scooter users were students (6t-bureau, 2019).
Each case represents an over-representation of the French population (Table 8). However, Paris
may have a different demographic to the rest of France.
Table 8: Area Demographic Comparison
Area Men 23-34 Years Old Students
Local e-scooter users (%) 66 28 19
French population (%) 50 14 -
Paris Population (%) - - 13
6-t reported that 38% of local e-scooter users frequently use free-floating e-scooter services
(once a week), and that 7% use e-scooters almost every day (6t-bureau, 2019). Moreover, 23%

28
of trips are intermodal (i.e. e-scooters are used in combination with another transport mode),
with 66% and 19% of intermodal e-scooter trips used in conjunction with public transport and
walking respectively.
Figure 14: Barriers to E-Scooter Usage
6-t’s report on the “Users and uses of free-floating electric scooters in France” compiles several
factors which negatively influence e-scooter ridership e.g. low availability. Interestingly, most
users consider “feeling unsafe” a drawback of e-scooter usage but are opposed to safety
regulations such as a helmet requirement (6t-bureau, 2019). Thus, although safety measures
increase the net external safety benefit of e-scooter schemes, they may also decrease their
usage, resulting in lower profits and lower environmental and congestion benefits.
Between 2015 and 2020, Paris devoted resources to doubling the number of bike lanes as part
of The Paris Bike Plan. Lime’s report indicates that the routes with bike lanes experience higher
e-scooter usage and recommends installation of “protected micro-mobility travel lanes” on
routes with shared bus and bike lanes (to increase both ridership and safety).
29
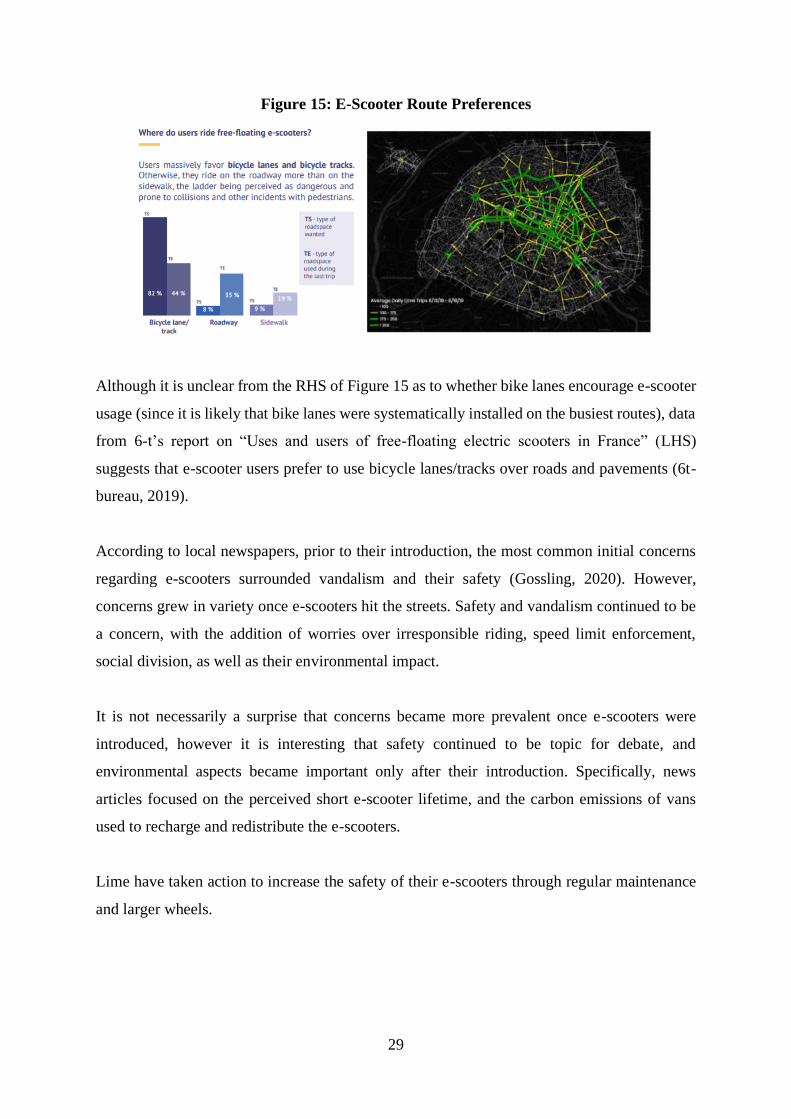
Figure 15: E-Scooter Route Preferences
Although it is unclear from the RHS of Figure 15 as to whether bike lanes encourage e-scooter
usage (since it is likely that bike lanes were systematically installed on the busiest routes), data
from 6-t’s report on “Uses and users of free-floating electric scooters in France” (LHS)
suggests that e-scooter users prefer to use bicycle lanes/tracks over roads and pavements (6t-
bureau, 2019).
According to local newspapers, prior to their introduction, the most common initial concerns
regarding e-scooters surrounded vandalism and their safety (Gossling, 2020). However,
concerns grew in variety once e-scooters hit the streets. Safety and vandalism continued to be
a concern, with the addition of worries over irresponsible riding, speed limit enforcement,
social division, as well as their environmental impact.
It is not necessarily a surprise that concerns became more prevalent once e-scooters were
introduced, however it is interesting that safety continued to be topic for debate, and
environmental aspects became important only after their introduction. Specifically, news
articles focused on the perceived short e-scooter lifetime, and the carbon emissions of vans
used to recharge and redistribute the e-scooters.
Lime have taken action to increase the safety of their e-scooters through regular maintenance
and larger wheels.
30
Figure 16: Paris Traffic Congestion vs 2019 Lime Activity
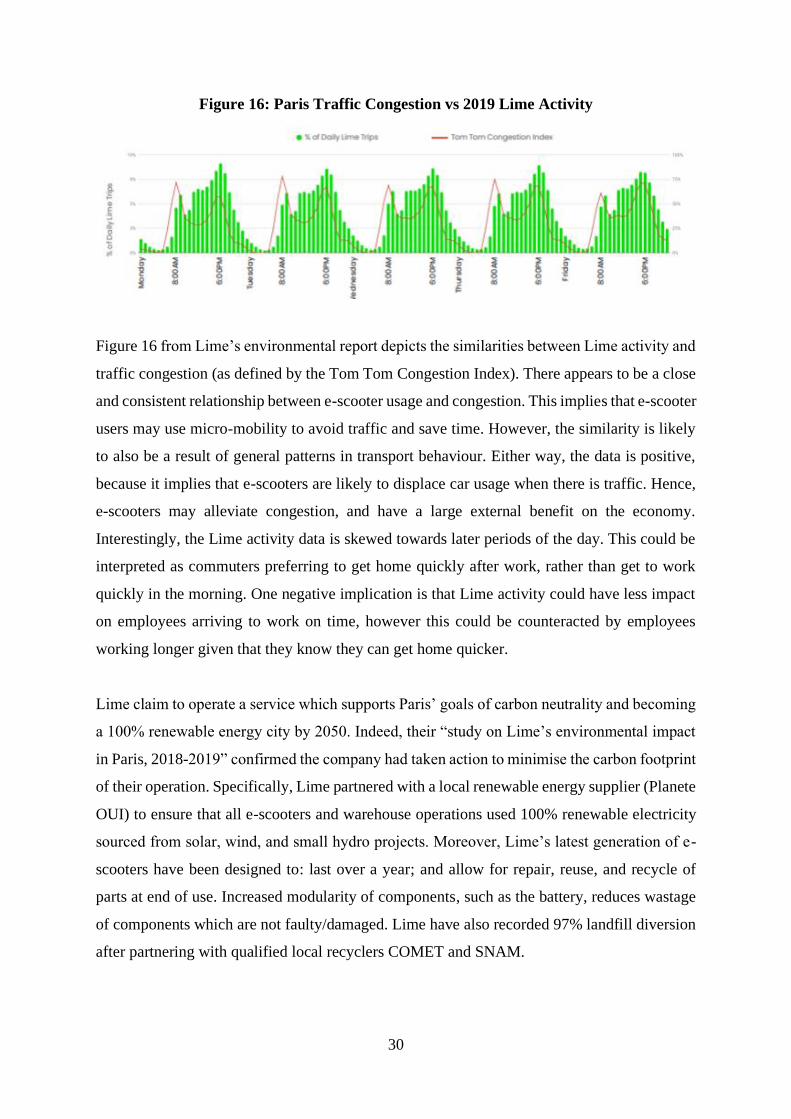
Figure 16 from Lime’s environmental report depicts the similarities between Lime activity and
traffic congestion (as defined by the Tom Tom Congestion Index). There appears to be a close
and consistent relationship between e-scooter usage and congestion. This implies that e-scooter
users may use micro-mobility to avoid traffic and save time. However, the similarity is likely
to also be a result of general patterns in transport behaviour. Either way, the data is positive,
because it implies that e-scooters are likely to displace car usage when there is traffic. Hence,
e-scooters may alleviate congestion, and have a large external benefit on the economy.
Interestingly, the Lime activity data is skewed towards later periods of the day. This could be
interpreted as commuters preferring to get home quickly after work, rather than get to work
quickly in the morning. One negative implication is that Lime activity could have less impact
on employees arriving to work on time, however this could be counteracted by employees
working longer given that they know they can get home quicker.
Lime claim to operate a service which supports Paris’ goals of carbon neutrality and becoming
a 100% renewable energy city by 2050. Indeed, their “study on Lime’s environmental impact
in Paris, 2018-2019” confirmed the company had taken action to minimise the carbon footprint
of their operation. Specifically, Lime partnered with a local renewable energy supplier (Planete
OUI) to ensure that all e-scooters and warehouse operations used 100% renewable electricity
sourced from solar, wind, and small hydro projects. Moreover, Lime’s latest generation of e-
scooters have been designed to: last over a year; and allow for repair, reuse, and recycle of
parts at end of use. Increased modularity of components, such as the battery, reduces wastage
of components which are not faulty/damaged. Lime have also recorded 97% landfill diversion
after partnering with qualified local recyclers COMET and SNAM.

31
Lime intend to reduce the emissions of their vehicle fleet (required for collection and
redistribution) by increasing the number of cargo bikes used for light maintenance and
rebalancing. However, Lime invest in “carbon offsetting” to “neutralise vehicle emissions that
can’t be eliminated”. Essentially, Lime considers their vehicle to be “carbon-neutral” because,
although their operation is not carbon-neutral, they include the emissions savings associated
with “Green projects” they invest in - such as a Gold Standard community water filtration
project in Ethiopia.
The environmental benefits detailed by Lime’s own report could be considered misleading to
the public. Their report calculated Lime’s annual Greenhouse Gas (GHG) reduction from
“Auto Trip Replacement” by multiplying the estimating the number of “Auto kilometres
replaced by Lime” (1,996,173) by the average per kilometre GHG emissions of a car (165
gCO2e/pkm). This calculation either disregards the GHG emissions of e-scooter usage or
assumes that an e-scooter running on 100% renewable electricity has zero GHG emissions.
The formula used within this report considers the life-cycle emissions of each mode of
transport. Hence, even Lime’s e-scooters which use 100% renewable electricity are assumed
to have a negative impact on the environment due to emissions associated with their production
and disposal. The positive aspect of choosing 100% renewable electricity could also be slightly
diluted if the local supply of renewable energy is relatively inelastic, or close to capacity.
Essentially, choosing a 100% renewable source could have the counteracting effect of
increasing the price of Planete OUI’s energy, thus causing other Planete OUI customers to
favour other, less environmental, utility providers.

32
Figure 17: Household Auto Ownership Compared to Lime Ridership
Lime’s environmental report also neglects the environmental impacts associated with other
modal shifts induced by Lime’s service. Only 9.9% of Lime users would have travelled by car
in Lime’s absence. Hence, over 90% of journeys are excluded by Lime’s calculation.
Moreover, we can infer from Figure 17 that e-scooters users are likely to live in areas of low
vehicle ownership. Lime considers this a positive, as the data suggests that Lime compliments
a car-free lifestyle. However, we could also interpret this as a negative, since the data implies
e-scooters are more likely to displace non-car transport such as walking or cycling.
Estimation of the true environmental benefit of Lime’s Paris e-scooter scheme requires data on
the modal shift with regards to non-car transport. Without this data, this report estimates modal
shift by assuming that the remaining e-scooter users are a representative sample of the non-car
modal split (Deloitte, 2019a). The estimates can be considered fairly accurate since the
calculation produces similar results to the average modal shift of all 10 e-scooter schemes in
Paris calculated by 6-t in their report. 6-t’s results were not used because their car displacement
estimate (14%) dramatically exceeded the numbers reported by Lime (9.9%) (likely due to only
using local respondents).

33
Table 9: Modal Shift Estimates
Car Bus Train Bicycle Walking Other
Modal Split (%) 25 25 2 46 2
6-t Modal shift (%) 14 30 12 44 0
Modal Shift (%) 9.9 15.4* 15.4* 2.5** 56.8*** 0****
*Assumes Bus and Train modes are equally represented by public transport usage figures
**Bicycle modal shift ≈ 90.1% × 2% / (2% + 25% + 46%)
***Walking modal shift ≈ 90.1% × 46% / (2% + 25% + 46%)
****Other modes excluded given that they likely refer to e-scooters, and it is uncertain what
their average GHG emissions are per passenger kilometre.
Under this calculation method (and given that Lime’s scooters can be considered in the lowest
emission category) all three sensitivity estimates for net environmental benefit are positive.
Hence, Lime has had a positive impact on the environment (which would not necessarily have
been the case if not for their near carbon-neutral operation). However, the impact is
significantly smaller than calculated in Lime’s environmental report, given that the scheme
results in individuals switching from active transport to e-scooter usage.
Table 10: Net Environmental Benefit Estimates
Estimate Low Central High
Net Environmental Benefit (2019£) 150.9 244 554.6
Lime created 2 growth scenarios forecasting an increase in ridership to 175,412,000 and
412,264,000 respectively, as well as increase in auto-modal shift from 9.9% to 15% by 2030.
Under these two scenarios, the net environmental benefit of Lime’s Paris e-scooter scheme
rises dramatically. Innovations to e-scooter design and electricity production could further
increase this figure, and the social cost of carbon could either decrease or increase depending
on global efforts to reduce climate change.
34
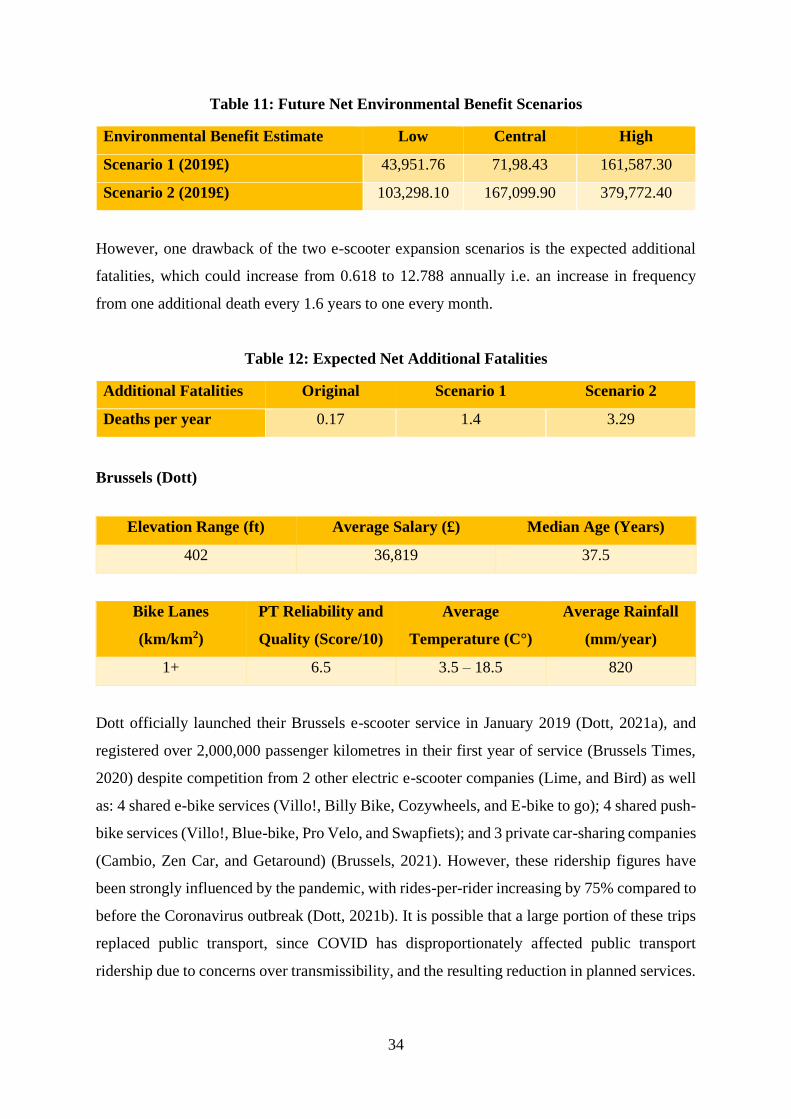
Table 11: Future Net Environmental Benefit Scenarios
Environmental Benefit Estimate Low Central High
Scenario 1 (2019£) 43,951.76 71,98.43 161,587.30
Scenario 2 (2019£) 103,298.10 167,099.90 379,772.40
However, one drawback of the two e-scooter expansion scenarios is the expected additional
fatalities, which could increase from 0.618 to 12.788 annually i.e. an increase in frequency
from one additional death every 1.6 years to one every month.
Table 12: Expected Net Additional Fatalities
Additional Fatalities Original Scenario 1 Scenario 2
Deaths per year 0.17 1.4 3.29
Brussels (Dott)
Elevation Range (ft) Average Salary (£) Median Age (Years)
402 36,819 37.5
Bike Lanes
(km/km2)
PT Reliability and
Quality (Score/10)
Average
Temperature (C°)
Average Rainfall
(mm/year)
1+ 6.5 3.5 – 18.5 820
Dott officially launched their Brussels e-scooter service in January 2019 (Dott, 2021a), and
registered over 2,000,000 passenger kilometres in their first year of service (Brussels Times,
2020) despite competition from 2 other electric e-scooter companies (Lime, and Bird) as well
as: 4 shared e-bike services (Villo!, Billy Bike, Cozywheels, and E-bike to go); 4 shared push-
bike services (Villo!, Blue-bike, Pro Velo, and Swapfiets); and 3 private car-sharing companies
(Cambio, Zen Car, and Getaround) (Brussels, 2021). However, these ridership figures have
been strongly influenced by the pandemic, with rides-per-rider increasing by 75% compared to
before the Coronavirus outbreak (Dott, 2021b). It is possible that a large portion of these trips
replaced public transport, since COVID has disproportionately affected public transport
ridership due to concerns over transmissibility, and the resulting reduction in planned services.

35
Figure 18: Dott's Target Marget
Dott believe their target market to include: students who do not own a car; young workers; as
well as established professionals, having calculated that, on average, e-scooters are 43% faster
during rush hour than a car (Dott, 2021b). This figure is unsurprising, since the average Belgian
spent just under 40 hours in traffic during 2019, making Belgium the second most congested
country in Europe (Deloitte, 2019b).
Figure 19: Hours Spent in Road Congestion Annually
*Note: Belgium = BE
In 2018, the European Commission gave Belgium a formal warning regarding Brussels’ illegal
air pollution levels. The Regional Authority for Mobility in Brussels responded by developing
a 10-year plan to reduce car usage by 24% (DW, 2021). Specifically, Bike, tram line, and metro
line infrastructure improvements and extensions aim to encourage public transport and active
transport over car usage. Moreover, a city wide 30km/h speed limit has been introduced to
discourage automotive transport as part of the “Good Move” plan (DW, 2021). Such initiatives
could increase e-scooter ridership, as well as induce a positive modal shift from automobiles
to shared e-scooters.
Between 2017 and 2020, Brussels fell from 32nd to the 65th most congested city in the world
(TomTom, 2021). E-Scooters were introduced between 2018 and 2019, which could suggest
36
that their implementation alleviated a portion of congestion. However, the magnitude/existence
of this causal relationship is difficult to analyse given the implementation of mobility initiatives
during this period.
In July 2020, Dott, TIER, and Voi agreed to commit to a set of environmental standards
(Intelligent Transport, 2020). Principally, they focused on ensuring all new e-scooters had
swappable batteries and that by 2021 all new e-scooters would be manufactured with 20%
recycled material. Since then, the three companies have halved their total logistics trips, and
reduced emissions by up to 81% since switching to swappable batteries. According to Dott, a
2020 study found that swappable batteries had reduced their operational CO2 emissions by 56%
(Dott, 2021c).
Swappable batteries reduce emissions because the e-scooters can be charged on the spot, or the
battery can be transported to where it is needed (Dott, 2021c). This reduces the load that Dott’s
vans must carry and reduces damage from transportation (extending e-scooter lifetime).
However, this benefit diminishes once Dott commits to a 100% renewable electric fleet of vans
(Dott, 2021a).
E-scooters are also easier to recycle when the battery can be removed, which aids Dott’s
business model whereby they focus on repair and re-use, and only recycle once the parts
become non-salvageable (Dott, 2021c).
Since 2019, Dott has ensured carbon neutrality by compensating CO2 emissions by planting
trees and through other green initiatives (Dott, 2021a).
To increase the safety of their e-scooters, Dott check their e-scooters every 10 rides (Dott,
2021a), and purchase scooters with large wheels, a double brake system, and speed restricting
capabilities (Dott, 2021d).
37
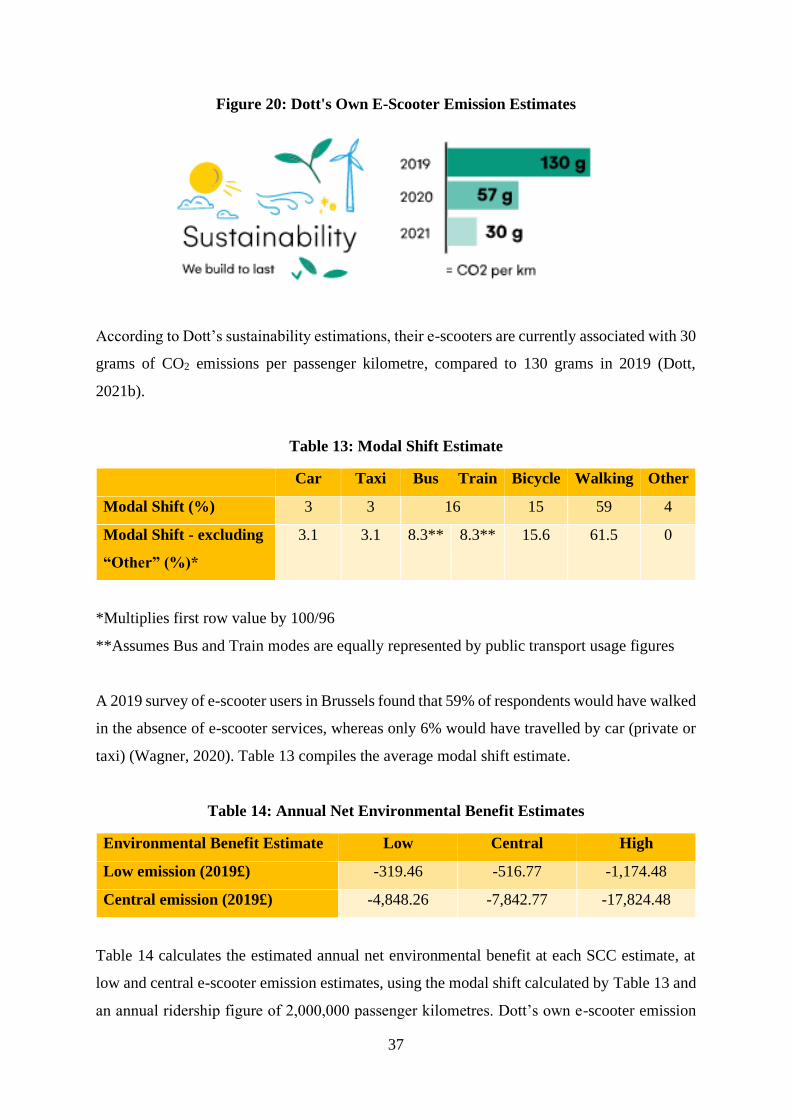
Figure 20: Dott's Own E-Scooter Emission Estimates
According to Dott’s sustainability estimations, their e-scooters are currently associated with 30
grams of CO2 emissions per passenger kilometre, compared to 130 grams in 2019 (Dott,
2021b).
Table 13: Modal Shift Estimate
Car Taxi Bus Train Bicycle Walking Other
Modal Shift (%) 3 3 16 15 59 4
Modal Shift - excluding
“Other” (%)*
3.1 3.1 8.3** 8.3** 15.6 61.5 0
*Multiplies first row value by 100/96
**Assumes Bus and Train modes are equally represented by public transport usage figures
A 2019 survey of e-scooter users in Brussels found that 59% of respondents would have walked
in the absence of e-scooter services, whereas only 6% would have travelled by car (private or
taxi) (Wagner, 2020). Table 13 compiles the average modal shift estimate.
Table 14: Annual Net Environmental Benefit Estimates
Environmental Benefit Estimate Low Central High
Low emission (2019£) -319.46 -516.77 -1,174.48
Central emission (2019£) -4,848.26 -7,842.77 -17,824.48
Table 14 calculates the estimated annual net environmental benefit at each SCC estimate, at
low and central e-scooter emission estimates, using the modal shift calculated by Table 13 and
an annual ridership figure of 2,000,000 passenger kilometres. Dott’s own e-scooter emission

38
estimates are not used in case of differing calculation methods, and bias. However, their e-
scooter GHG emission estimates and environmentally conscious operation indicate that the
high e-scooter emission estimate can be disregarded.
Figure 21: Deloitte Analysis of Brussels Transport Mode Choices
*Note: (Top) Belgian Distribution of Answers When Asked: "What Is The Most Important
Aspect of Mobility?", (Bottom) Modes of Transport Mapped According to Scores on
Reliability and Ease of Use
Under this calculation method, all 6 sensitivity estimates indicate that Dott’s Brussels e-scooter
operation has had a negative impact on the environment (ranging between £319 and £17,824).
This is primarily due to low displacement of automobile users, and high displacement of active
transport. Deloitte’s report on the “Future of Mobility” for Belgium suggests that Cars’ modal
split dominance is possibly due to perceptions over reliability, safety, and ease of use (Deloitte,
2019b).
However, the net environmental benefit results are reliant on modal shift data calculated prior
to the Coronavirus pandemic and implementation of mobility initiatives such as the city-wide
30km/h speed limit. Whilst the impact of the coronavirus pandemic on modal shift is uncertain,
it is relatively safe to assume that the mobility initiatives will have caused a greater number of
car users to switch to e-scooters. However, if the positive change in modal shift was small, then
39
the 75% increase in e-scooter rides-per-rider since the coronavirus outbreak will have had an
inflationary effect on the annual environmental cost of Dott’s e-scooter scheme.
One positive impact of the relatively low modal shift from private cars, taxis, and public
transport, is that Dott’s Brussels e-scooter scheme is associated with the lowest expected
additional fatalities both yearly (0.057), and per billion passenger kilometres (28.5). Thus, 1
additional fatality is expected to occur once every 17.5 years.
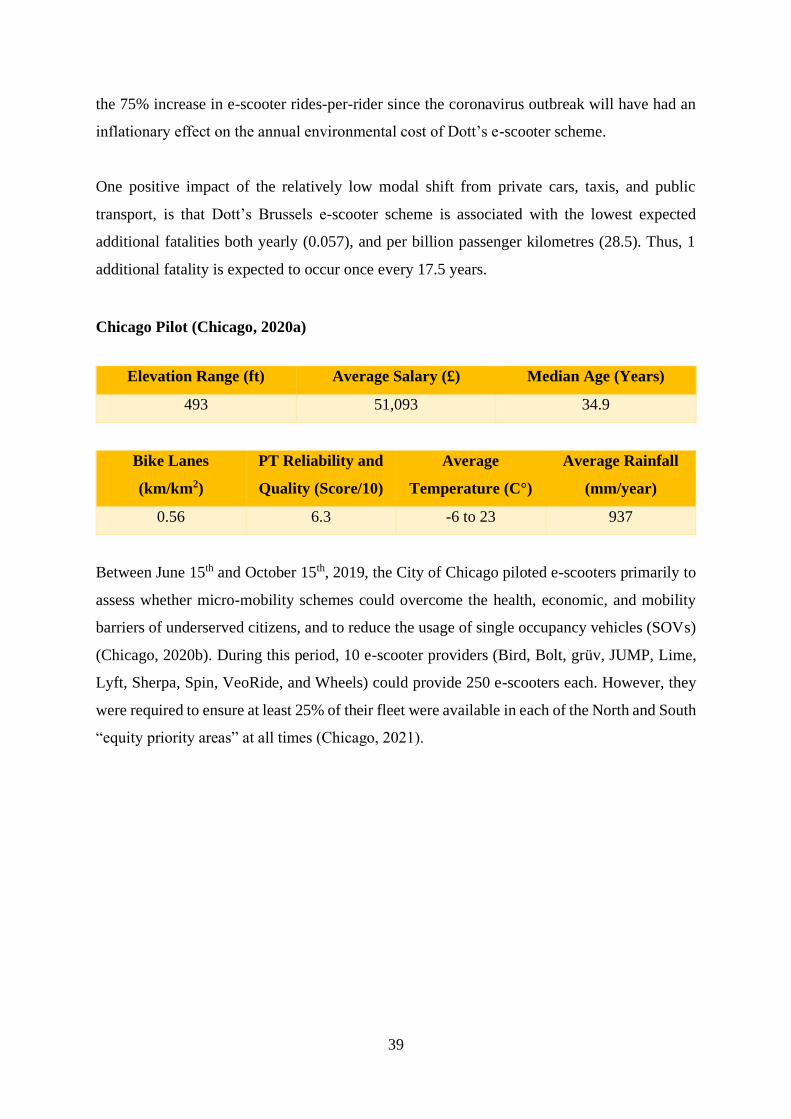
Chicago Pilot (Chicago, 2020a)
Elevation Range (ft) Average Salary (£) Median Age (Years)
493 51,093 34.9
Bike Lanes
(km/km2)
PT Reliability and
Quality (Score/10)
Average
Temperature (C°)
Average Rainfall
(mm/year)
0.56 6.3 -6 to 23 937
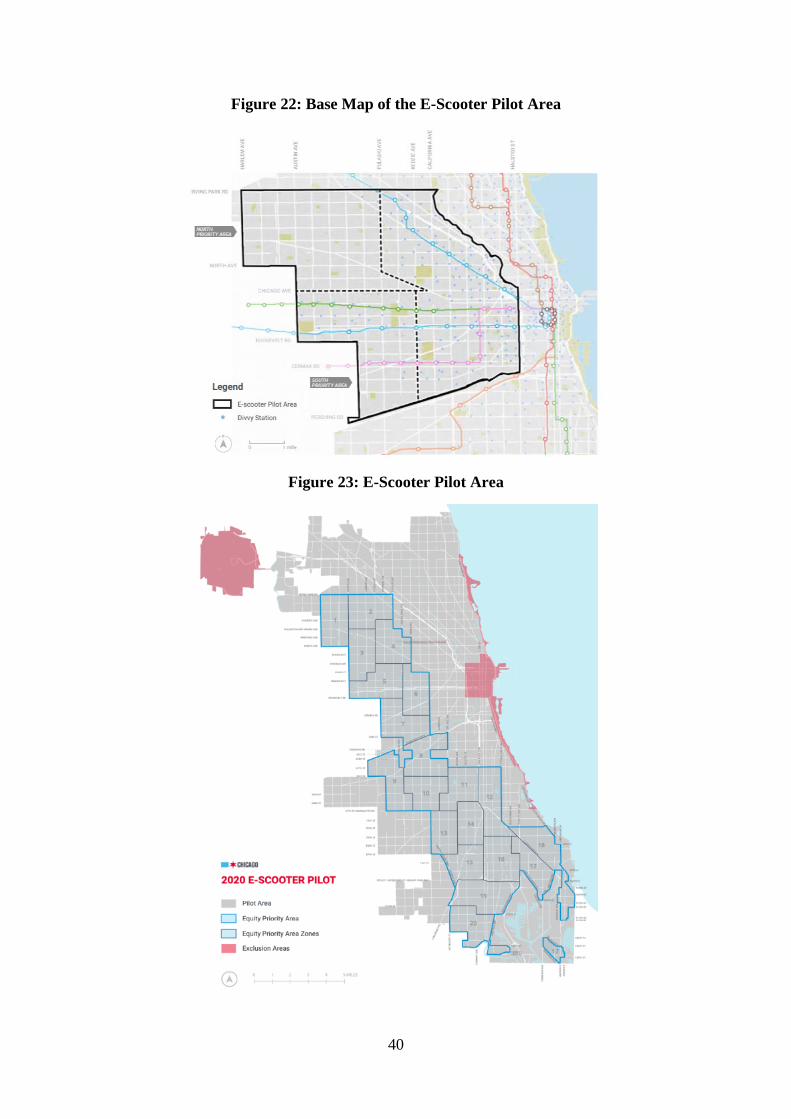
Between June 15th and October 15th, 2019, the City of Chicago piloted e-scooters primarily to
assess whether micro-mobility schemes could overcome the health, economic, and mobility
barriers of underserved citizens, and to reduce the usage of single occupancy vehicles (SOVs)
(Chicago, 2020b). During this period, 10 e-scooter providers (Bird, Bolt, grüv, JUMP, Lime,
Lyft, Sherpa, Spin, VeoRide, and Wheels) could provide 250 e-scooters each. However, they
were required to ensure at least 25% of their fleet were available in each of the North and South
“equity priority areas” at all times (Chicago, 2021).
40
Figure 22: Base Map of the E-Scooter Pilot Area
Figure 23: E-Scooter Pilot Area
41
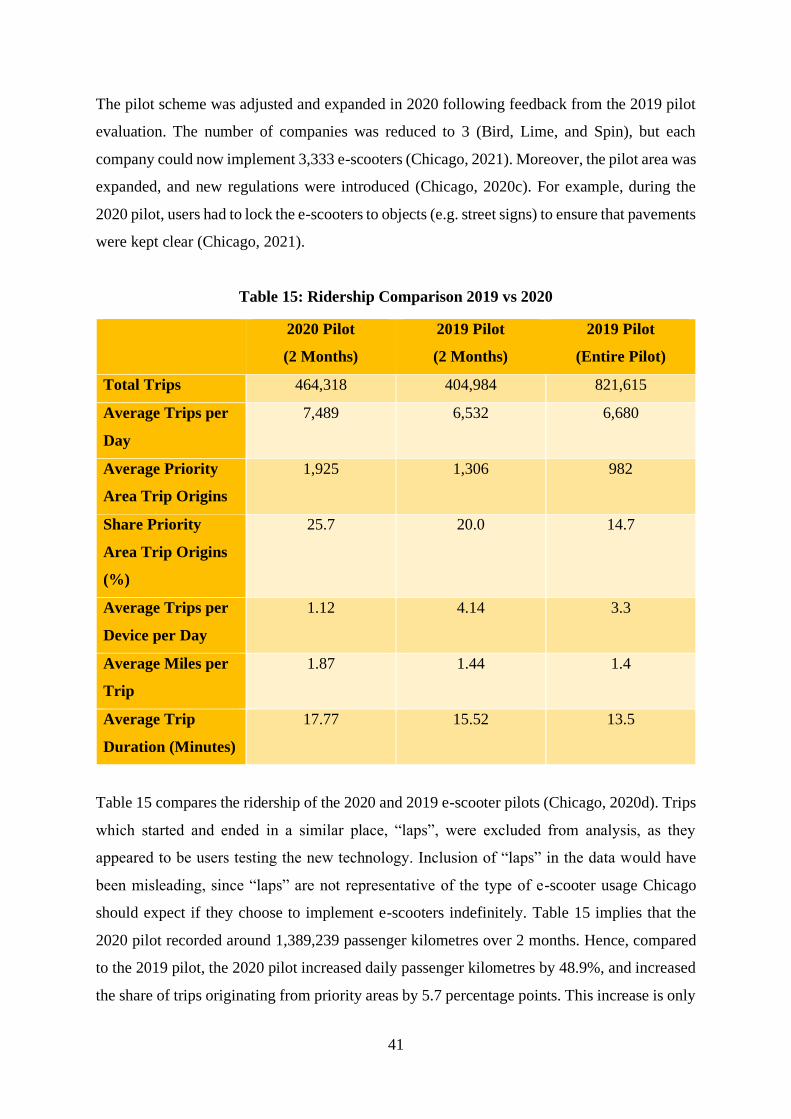
The pilot scheme was adjusted and expanded in 2020 following feedback from the 2019 pilot
evaluation. The number of companies was reduced to 3 (Bird, Lime, and Spin), but each
company could now implement 3,333 e-scooters (Chicago, 2021). Moreover, the pilot area was
expanded, and new regulations were introduced (Chicago, 2020c). For example, during the
2020 pilot, users had to lock the e-scooters to objects (e.g. street signs) to ensure that pavements
were kept clear (Chicago, 2021).
Table 15: Ridership Comparison 2019 vs 2020
2020 Pilot
(2 Months)
2019 Pilot
(2 Months)
2019 Pilot
(Entire Pilot)
Total Trips 464,318 404,984 821,615
Average Trips per
Day
7,489 6,532 6,680
Average Priority
Area Trip Origins
1,925 1,306 982
Share Priority
Area Trip Origins
(%)
25.7 20.0 14.7
Average Trips per
Device per Day
1.12 4.14 3.3
Average Miles per
Trip
1.87 1.44 1.4
Average Trip
Duration (Minutes)
17.77 15.52 13.5
Table 15 compares the ridership of the 2020 and 2019 e-scooter pilots (Chicago, 2020d). Trips
which started and ended in a similar place, “laps”, were excluded from analysis, as they
appeared to be users testing the new technology. Inclusion of “laps” in the data would have
been misleading, since “laps” are not representative of the type of e-scooter usage Chicago
should expect if they choose to implement e-scooters indefinitely. Table 15 implies that the
2020 pilot recorded around 1,389,239 passenger kilometres over 2 months. Hence, compared
to the 2019 pilot, the 2020 pilot increased daily passenger kilometres by 48.9%, and increased
the share of trips originating from priority areas by 5.7 percentage points. This increase is only

42
moderate in magnitude considering the substantial increase in total e-scooter provision;
however, the pilot evaluation notes that the regulation designed to improve safety could have
had a negative impact on ridership. Finally, sustained usage would imply 8,335,424 passenger
kilometres per year. However, this figure excludes demand fluctuations owing to seasonal
effects.
The City of Chicago introduced several regulations to promote safety (Chicago, 2020a). E-
Scooter users could not leave the pilot area, were prohibited from Chicago’s 606 trail, and had
to pass a safety quiz prior to their first e-scooter ride. E-Scooters could not be ridden on
sidewalks; had to be parked “upright and with a minimum of six feet of clearance between the
e-scooter and all public way obstructions”; and could not be parked “within 10 feet of street
corners or intersections, along building facades or blocking fire hydrants, bus stops or
terminals, rail station entrances, loading zones or building access points”. Moreover, the firms
could only operate their service between 5am and 10pm each day and had to remove their e-
scooters from the “public right of way by midnight each night”. The 2020 pilot also imposed a
15mph speed restriction (Chicago, 2020e).
Table 16: Riders and Non-Riders: E-Scooter Operation Rules Knowledge
However, Table 16 suggests that the regulations are unlikely to have been strictly enforced,
since most riders were unaware of the rules over e-scooter usage. For example, staff
observations recorded that “10% of riders used the sidewalk when riding on a street with a bike
lane”, “15.2% of riders used the sidewalk when riding on a street without a bike lane”, and

43
“18.4% of e-scooters were parked incorrectly on the sidewalk”. The first two observations
imply that e-scooter users are less likely to use e-scooters on the sidewalk when they have
access to a bike lane. This could also suggest e-scooters would be more desirable if councils
invested in better cycling/e-scooter infrastructure.
Figure 24: Geofencing Technology Accuracy
Chicago also required the e-scooter providers to use geofencing technology to restrict their e-
scooters speed, or disable them completely, when operated in certain areas. However, although
geofencing decreased e-scooter usage in prohibit areas (e.g. Chicago’s 606 trail), GPS
inaccuracy meant the technology was not 100% effective.
Table 17: Demographics of Riders and Non-Riders as Identified by Survey Respondents
Determining the attractiveness of micro mobility to different demographics requires a
comparison between rider and nonriders. However, without more developed statistical tools,
under/over-representation could be caused by other factors. Thus, they merely suggest possible
groups to which e-scooters are more desirable.
44
Data from Table 17 suggests that e-scooters are significantly more desirable to people aged
between 18 and 44, and males respectively, since both the male gender and 18-44 age group
are over-represented compared to the non-rider sample.
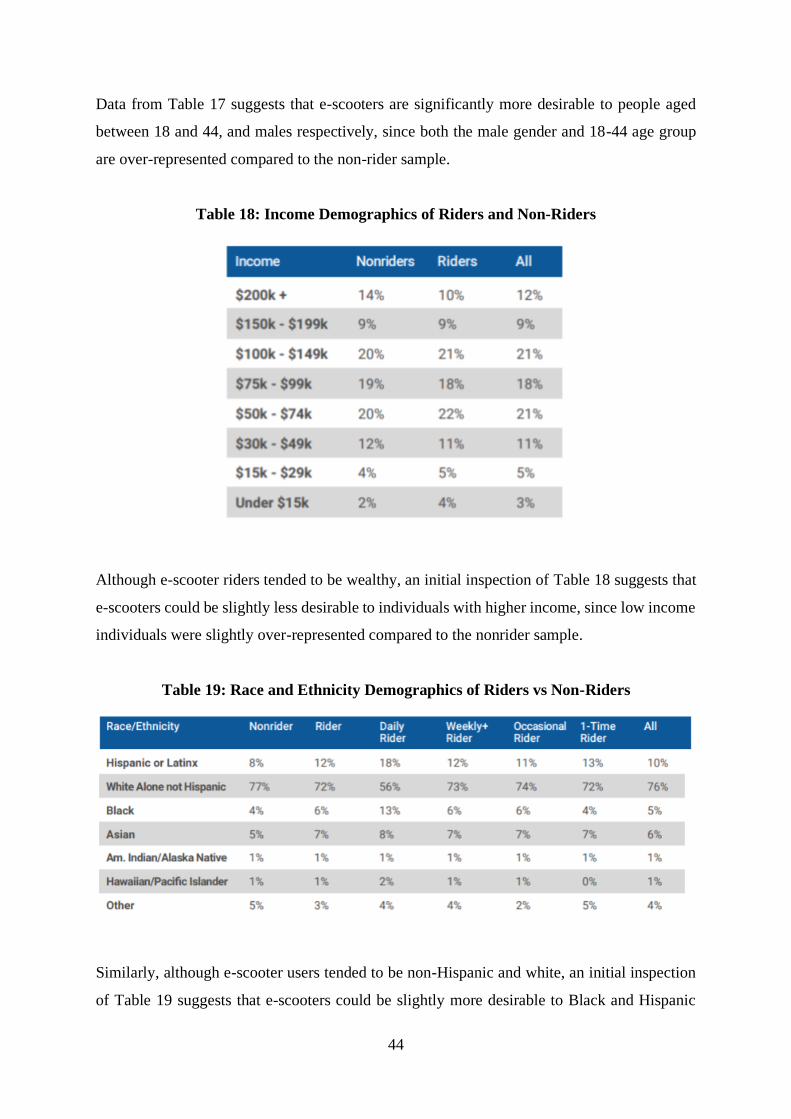
Table 18: Income Demographics of Riders and Non-Riders
Although e-scooter riders tended to be wealthy, an initial inspection of Table 18 suggests that
e-scooters could be slightly less desirable to individuals with higher income, since low income
individuals were slightly over-represented compared to the nonrider sample.
Table 19: Race and Ethnicity Demographics of Riders vs Non-Riders
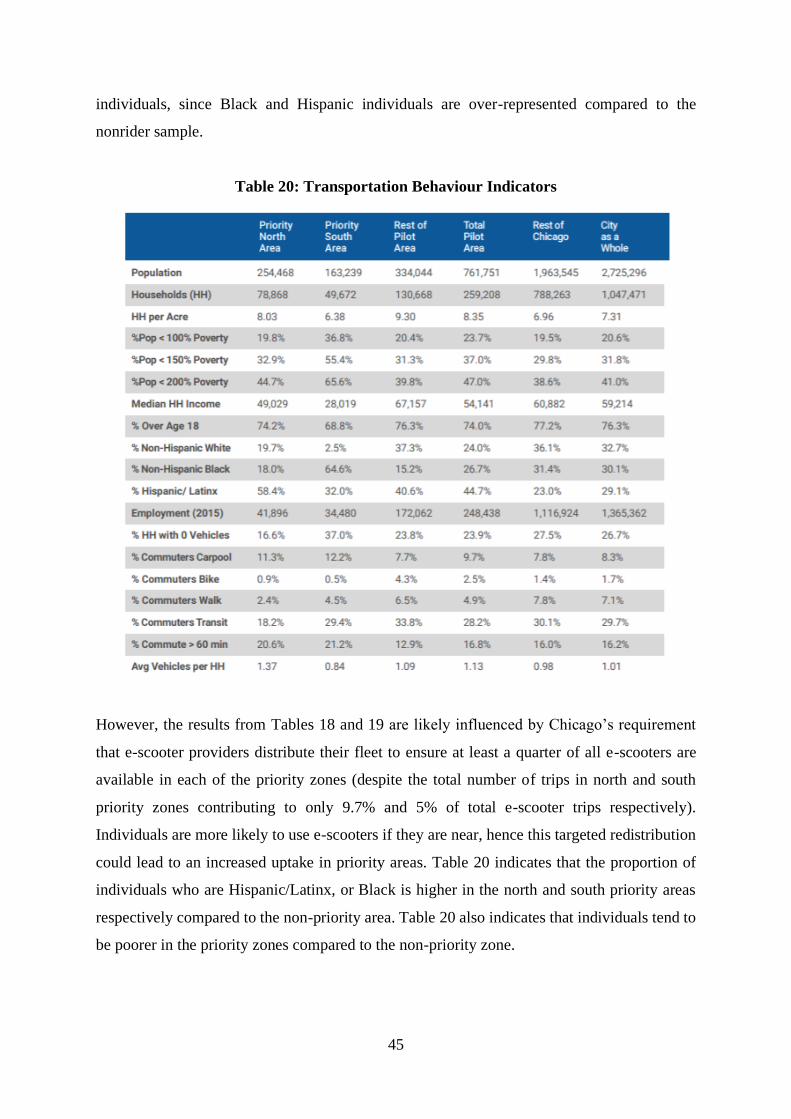
Similarly, although e-scooter users tended to be non-Hispanic and white, an initial inspection
of Table 19 suggests that e-scooters could be slightly more desirable to Black and Hispanic
45
individuals, since Black and Hispanic individuals are over-represented compared to the
nonrider sample.
Table 20: Transportation Behaviour Indicators
However, the results from Tables 18 and 19 are likely influenced by Chicago’s requirement
that e-scooter providers distribute their fleet to ensure at least a quarter of all e-scooters are
available in each of the priority zones (despite the total number of trips in north and south
priority zones contributing to only 9.7% and 5% of total e-scooter trips respectively).
Individuals are more likely to use e-scooters if they are near, hence this targeted redistribution
could lead to an increased uptake in priority areas. Table 20 indicates that the proportion of
individuals who are Hispanic/Latinx, or Black is higher in the north and south priority areas
respectively compared to the non-priority area. Table 20 also indicates that individuals tend to
be poorer in the priority zones compared to the non-priority zone.

46
Figure 25: Selected Demographic Characteristics of the Pilot Area
Hence, it is likely that a portion of the over-representation of Latinx/Hispanic and Black
individuals in e-scooter ridership data is due to this targeted redistribution. Thus, it is difficult
to conclude whether different races or cultures find e-scooters more desirable. Moreover, the
relationship between an individual’s income and e-scooter desirability may only appear
negligible because the true positive relationship is counteracted by the targeted distribution of
e-scooters towards poorer areas.
Table 21: Reason for Trying E-Scooters, by Use Frequency
Table 21 indicates that e-scooters are popular primarily due to their speed and ease of use.
However, Table 22 suggest that e-scooter’s may be popular because of how fun they are. It is
uncertain whether the “fun-factor” is time invariant or could diminish once the novelty wears
off.

47
Table 22: Causes of Positive E-Scooter
Experience
Figure 26: Number of E-Scooter
Rides per User
Figure 26 shows that 59% of e-scooter users ride e-scooters less than once per week. However,
the proportion of rides undertaken by riders who are “occasional users” will be significantly
lower. Table 23 shows that a large number trips are for the purpose of commuting (especially
among the most frequent riders).
Table 23: Trip Purpose for E-Scooter Use

48
Figure 27: Average Daily Trips by Start Hour
Table 23 is supported by the graph in Figure 27 which shows two clear peaks in ridership
during weekdays at 6:00-9:00 and 16:00-19:00 respectively. The second peak is noticeably
larger which suggests riders may be more interested in returning home quickly rather than
arriving on-time. Another possible reason could be that e-scooters are used as a treat after a
day’s work, whereas morning journeys are more habitual. As a result, e-scooters will have
reduced congestion during peak traffic, but more-so in the evening.

49
Figure 28: Daily E-Scooter Trips and Precipitation
The City of Chicago’s e-scooter pilot evaluation considers the association between rainfall and
e-scooter ridership. From Figure 28, the authors conclude that “precipitation did not seem to
be a significant factor in e-scooter ridership” since “the wettest days during the pilot saw slight
upticks in the number of e-scooter trips, potentially indicating riders using e-scooters to
expedite soggy walking trips”. However, there are clear and reoccurring rises in e-scooter
ridership during periods of zero rainfall. Thus, contrary to the findings of the pilot evaluation,
this report believes that the data implies a positive relationship between e-scooter ridership and
dry weather, in addition to the positive relationship between e-scooter ridership and instances
of heavy-rain. Moderate rainfall could deter e-scooter usage if individuals believe wetter roads
would decrease e-scooter safety, or if rainfall encourages individuals to take modes of transport
which provide shelter (e.g. public transport).
50
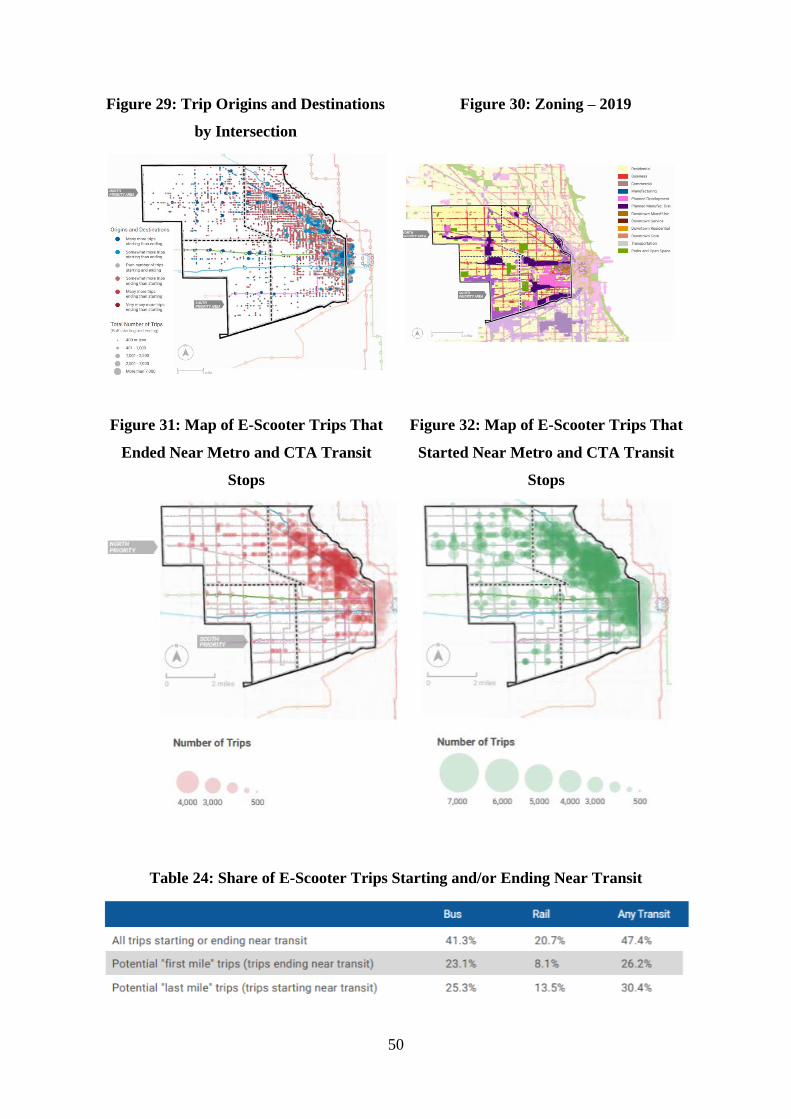
Figure 29: Trip Origins and Destinations
by Intersection
Figure 30: Zoning – 2019
Figure 31: Map of E-Scooter Trips That
Ended Near Metro and CTA Transit
Stops
Figure 32: Map of E-Scooter Trips That
Started Near Metro and CTA Transit
Stops
Table 24: Share of E-Scooter Trips Starting and/or Ending Near Transit

51
Figures 29, 31, and 32 all indicate that e-scooters are more often used at the end of intramodal
trips rather than beginning. Table 24 suggests that e-scooters were more often used in tandem
with buses compared to with metro services, and that intramodal trips could potentially
represent over 50% e-scooter journeys. However, many of these “potential” journeys merely
refer to trips started/ended near to public transport services. The true figure could be
significantly lower since Figure 30 indicates that the metro line associated with most e-scooter
usage operates through a large residential area. This suggests that many individuals could be
taking trips near train stations because they live near train stations. Chicago’s e-scooter pilot
evaluation also concludes that intramodal trips have had a marginal effect on public transport
usage.
Table 25: "Should E-Scooter Companies Continue Operating in Chicago?"
Table 26: Causes of Negative E-Scooter Experience
52
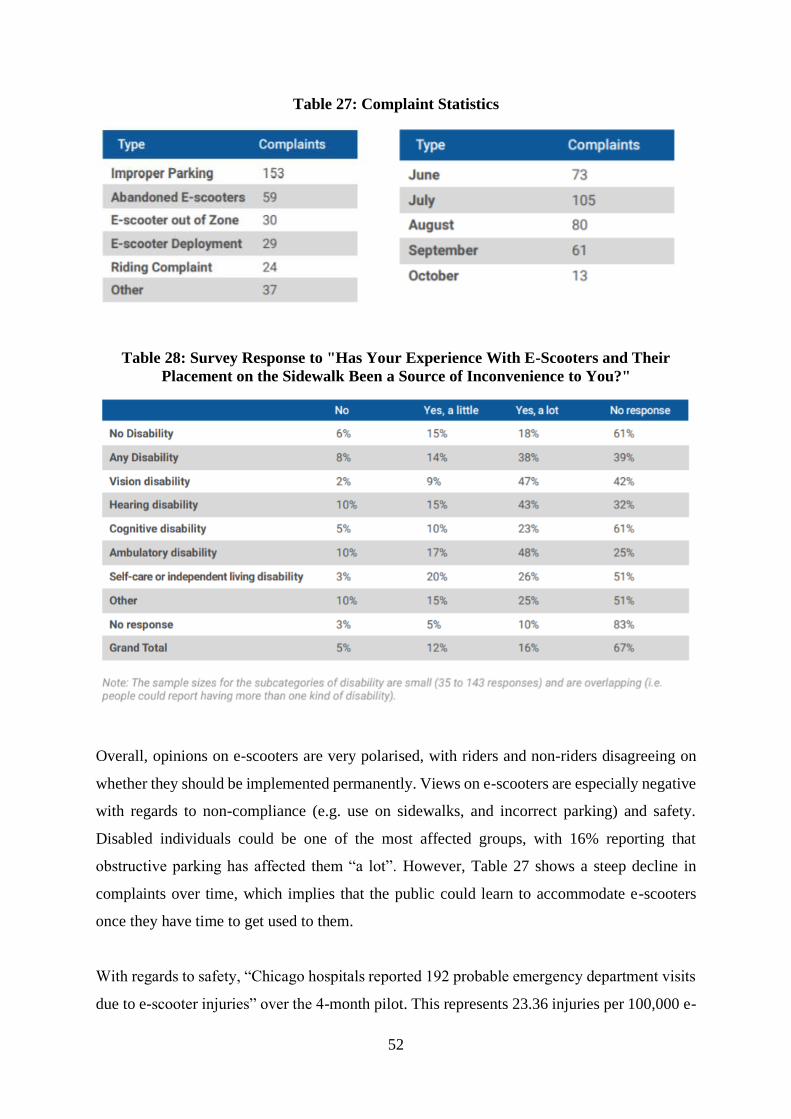
Table 27: Complaint Statistics
Table 28: Survey Response to "Has Your Experience With E-Scooters and Their
Placement on the Sidewalk Been a Source of Inconvenience to You?"
Overall, opinions on e-scooters are very polarised, with riders and non-riders disagreeing on
whether they should be implemented permanently. Views on e-scooters are especially negative
with regards to non-compliance (e.g. use on sidewalks, and incorrect parking) and safety.
Disabled individuals could be one of the most affected groups, with 16% reporting that
obstructive parking has affected them “a lot”. However, Table 27 shows a steep decline in
complaints over time, which implies that the public could learn to accommodate e-scooters
once they have time to get used to them.
With regards to safety, “Chicago hospitals reported 192 probable emergency department visits
due to e-scooter injuries” over the 4-month pilot. This represents 23.36 injuries per 100,000 e-

53
scooter trips, or 1.6. per day. However, only 3 (1.5%) required admission to hospital. Injury
figures may be slightly underestimated if individuals avoided receiving healthcare due to the
financial cost (however this affect is likely negligible).
Figure 33: Survey Respondents Mode Choice if an E-Scooter is Not Available
Table 29: Modal Shift
Car Taxi Bus Train Bike Bikeshare Walk
Modal Shift* (%) 11.1 32.7 10.2 4.3 2.7 4.9 34.1**
*All figures multiplied by 100/97.2 to ensure they add to 100%
**Walking + No Trip
Figure 33 depicts the estimated modal shift, as calculated by the pilot evaluation survey. Table
29 converts the modal shift to percentages which can be used by this report’s environmental
benefit formula. Notably: the modal shifts are scaled up so that they add to 100%, and here (to
fit this reports formula) “walk” refers to zero emission alternatives which includes “no-trip”.
In Chicago’s 2019 pilot evaluation, e-scooter schemes are estimated to generate between 93.75
and 125g per passenger kilometre (“43% coming from collection and distribution and
only 4.3% coming from the electricity used to charge the e-scooters”). The report claims that
this accumulates to “between 50 and 60 tonnes of CO2, or about half as much as the upper
54
estimate of the number of tons removed by shifting trips out of passenger vehicles”. However,
this assumes that cars generate 240g per passenger kilometre.
Since the pilot, Bird, Lime, and Spin have increased the sustainability of their operations
dramatically. Most noticeably, Lime uses 100% renewable energy across all their operations
(including their e-scooters) (Lime, 2019b). Currently, most of the Spin’s energy comes from
renewable sources, and the shared e-scooter provider also intends to be net negative in terms
of emissions by 2025 (Bird, 2019). Meanwhile, Bird purchase carbon offsets (which funds
projects reducing GHG emissions) to mitigate GHG emissions from e-scooter collection and
distribution and purchase Renewable Energy Certificates to compensate for the estimated non-
renewable energy consumption derived from charging their e-scooters (Spin, 2020). All three
companies have taken steps to extend the lifetime of their e-scooters, which significantly
reduces GHG emissions per passenger kilometre.
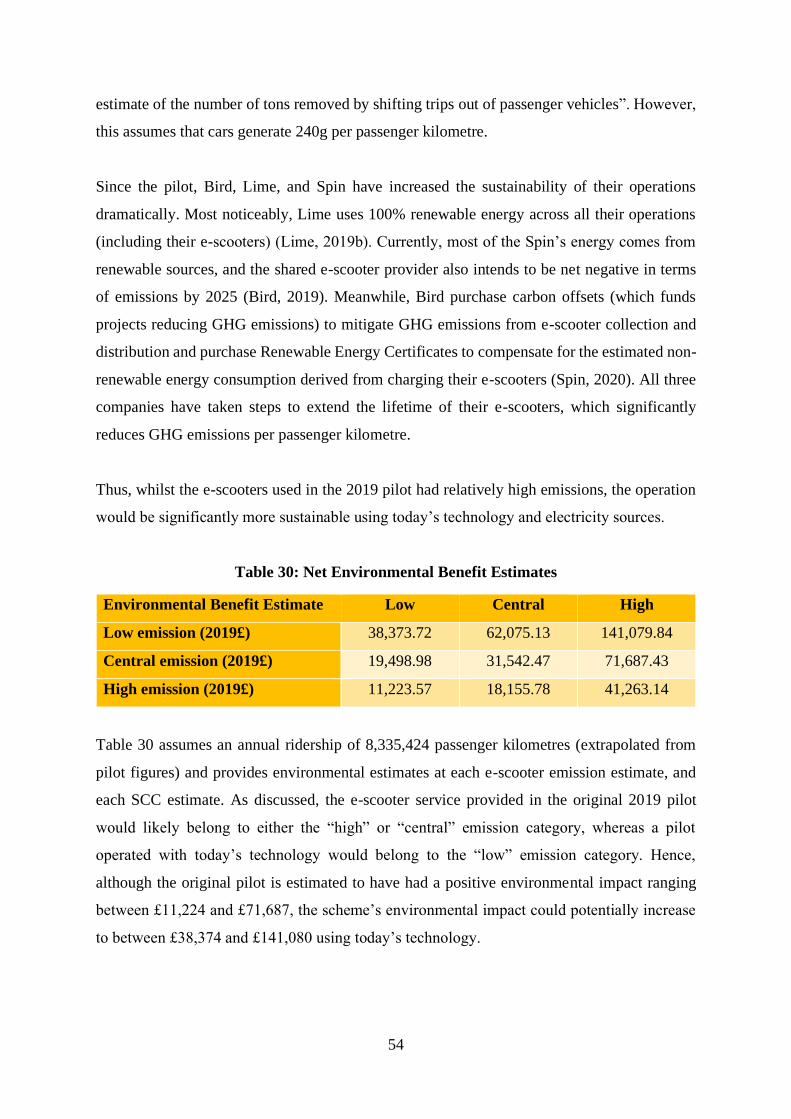
Thus, whilst the e-scooters used in the 2019 pilot had relatively high emissions, the operation
would be significantly more sustainable using today’s technology and electricity sources.
Table 30: Net Environmental Benefit Estimates
Environmental Benefit Estimate Low Central High
Low emission (2019£) 38,373.72 62,075.13 141,079.84
Central emission (2019£) 19,498.98 31,542.47 71,687.43
High emission (2019£) 11,223.57 18,155.78 41,263.14
Table 30 assumes an annual ridership of 8,335,424 passenger kilometres (extrapolated from
pilot figures) and provides environmental estimates at each e-scooter emission estimate, and
each SCC estimate. As discussed, the e-scooter service provided in the original 2019 pilot
would likely belong to either the “high” or “central” emission category, whereas a pilot
operated with today’s technology would belong to the “low” emission category. Hence,
although the original pilot is estimated to have had a positive environmental impact ranging
between £11,224 and £71,687, the scheme’s environmental impact could potentially increase
to between £38,374 and £141,080 using today’s technology.
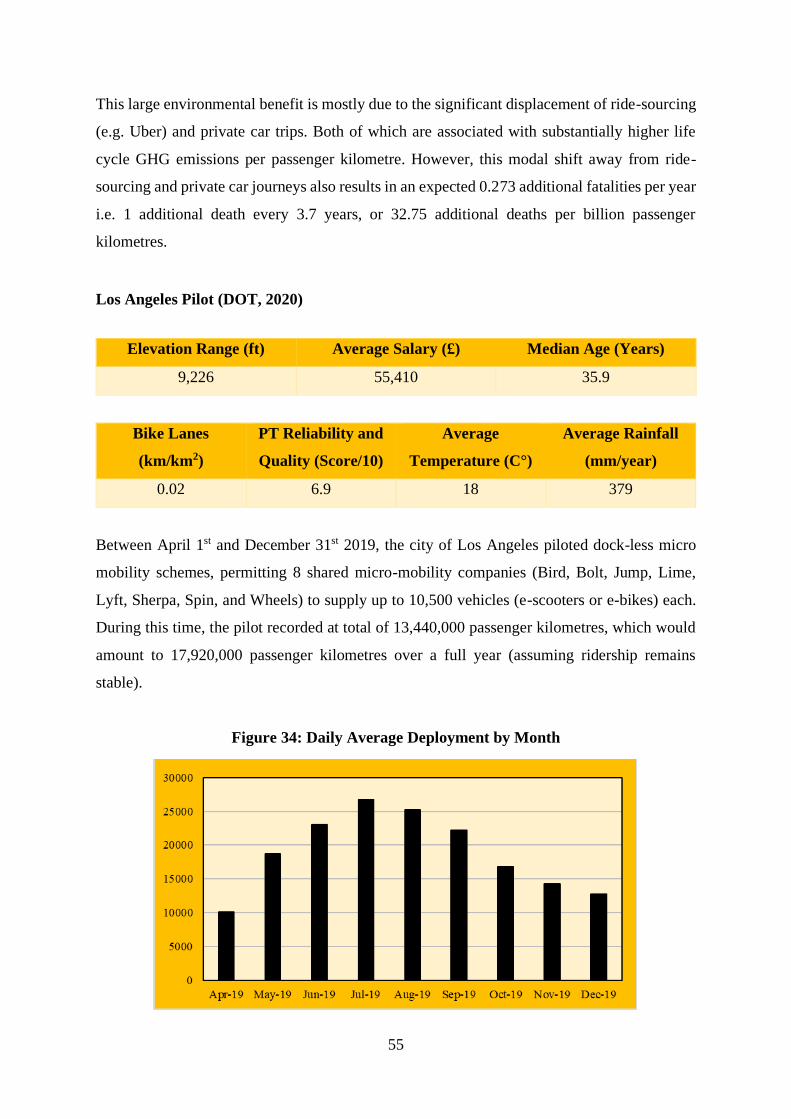
55
This large environmental benefit is mostly due to the significant displacement of ride-sourcing
(e.g. Uber) and private car trips. Both of which are associated with substantially higher life
cycle GHG emissions per passenger kilometre. However, this modal shift away from ride-
sourcing and private car journeys also results in an expected 0.273 additional fatalities per year
i.e. 1 additional death every 3.7 years, or 32.75 additional deaths per billion passenger
kilometres.
Los Angeles Pilot (DOT, 2020)
Elevation Range (ft) Average Salary (£) Median Age (Years)
9,226 55,410 35.9
Bike Lanes
(km/km2)
PT Reliability and
Quality (Score/10)
Average
Temperature (C°)
Average Rainfall
(mm/year)
0.02 6.9 18 379
Between April 1st and December 31st 2019, the city of Los Angeles piloted dock-less micro
mobility schemes, permitting 8 shared micro-mobility companies (Bird, Bolt, Jump, Lime,
Lyft, Sherpa, Spin, and Wheels) to supply up to 10,500 vehicles (e-scooters or e-bikes) each.
During this time, the pilot recorded at total of 13,440,000 passenger kilometres, which would
amount to 17,920,000 passenger kilometres over a full year (assuming ridership remains
stable).
Figure 34: Daily Average Deployment by Month

56
Figure 35: Total Shared E-Scooter Trips
Figure 36: Rides per Vehicle per Day, by Month
Figures 34, 35, and 36 indicate a similar pattern between deployment and usage, with both
peaking during summer. This could either suggest that ridership increases when there is greater
availability, or that micro-mobility companies anticipated a rise in ridership during summer.
This report believes that the latter is the main cause of the observed data, suggesting that
demand for e-scooters is higher during the summer. This could be due to recreational use by
tourists during the holiday or indicate a positive relationship between e-scooter usage and good
weather. Interestingly, total deployment of e-scooter and e-bikes never came close to the
10,500 per company limit. “In December 2019, operators deployed an average 12,766 vehicles
daily, or 35% of the 36,170 vehicles permitted”. Microeconomy theory suggests that total
output (i.e. vehicle deployment) rises as competition increases. This implies that low
deployment is due to a combination of insufficient demand and high distribution costs, since 8
micro-mobility companies in one city could be considered relatively competitive.
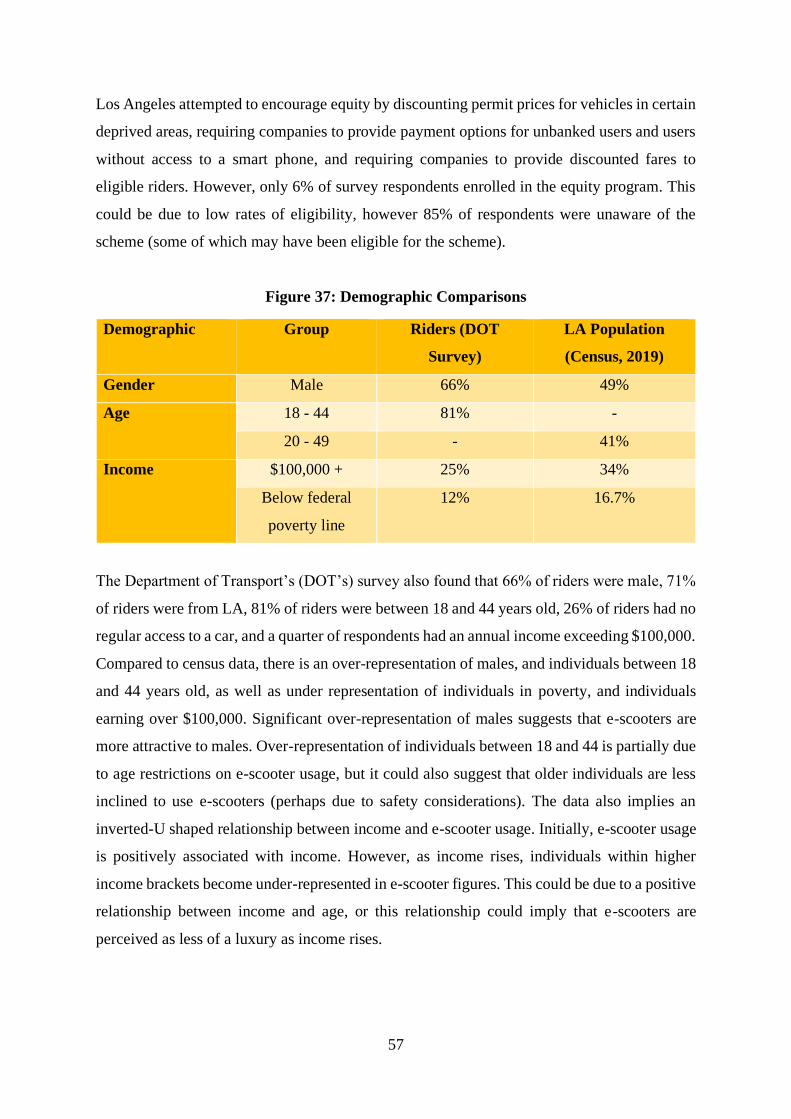
57
Los Angeles attempted to encourage equity by discounting permit prices for vehicles in certain
deprived areas, requiring companies to provide payment options for unbanked users and users
without access to a smart phone, and requiring companies to provide discounted fares to
eligible riders. However, only 6% of survey respondents enrolled in the equity program. This
could be due to low rates of eligibility, however 85% of respondents were unaware of the
scheme (some of which may have been eligible for the scheme).
Figure 37: Demographic Comparisons
Demographic Group Riders (DOT
Survey)
LA Population
(Census, 2019)
Gender Male 66% 49%
Age 18 - 44 81% -
20 - 49 - 41%
Income $100,000 + 25% 34%
Below federal
poverty line
12% 16.7%
The Department of Transport’s (DOT’s) survey also found that 66% of riders were male, 71%
of riders were from LA, 81% of riders were between 18 and 44 years old, 26% of riders had no
regular access to a car, and a quarter of respondents had an annual income exceeding $100,000.
Compared to census data, there is an over-representation of males, and individuals between 18
and 44 years old, as well as under representation of individuals in poverty, and individuals
earning over $100,000. Significant over-representation of males suggests that e-scooters are
more attractive to males. Over-representation of individuals between 18 and 44 is partially due
to age restrictions on e-scooter usage, but it could also suggest that older individuals are less
inclined to use e-scooters (perhaps due to safety considerations). The data also implies an
inverted-U shaped relationship between income and e-scooter usage. Initially, e-scooter usage
is positively associated with income. However, as income rises, individuals within higher
income brackets become under-represented in e-scooter figures. This could be due to a positive
relationship between income and age, or this relationship could imply that e-scooters are
perceived as less of a luxury as income rises.

58
Figure 38: Shared Mobility Trip Purpose
Recreational use appears to be the 2nd most common purpose of shared mobility trips, whereas
only 5% of trips were to/from connecting to transit, suggesting that intramodal trips were not
common.
46% of survey respondents said lack of bike lanes was a barrier to e-bike and e-scooter usage.
Interestingly, 32.6% of riders admitted to regularly using sidewalks, despite 81% of riders
knowing that this is not permitted. Thus, at least 13.6% of riders use sidewalks whilst knowing
it is prohibited. The survey responses helped to inform a $2,000,000 infrastructure and
investment plan to extend existing bike lanes and implement new ones.
Table 31: LADOT’s Own Environmental Savings Estimate
Mode Modal Shift
(%)
Miles
Travelled (est)
CO2 Emissions
(grams/mile)
C02 Savings
(tons)
Walk 48 4,032,687 0 0
Ride Hail 21 1,790,746 593.88 1,063.5
Car 12 977,948 404 395.1
Bus 6 529,992 290 153.7
Bike 4 294,680 0 0
Train 2 164,071 163 26.7
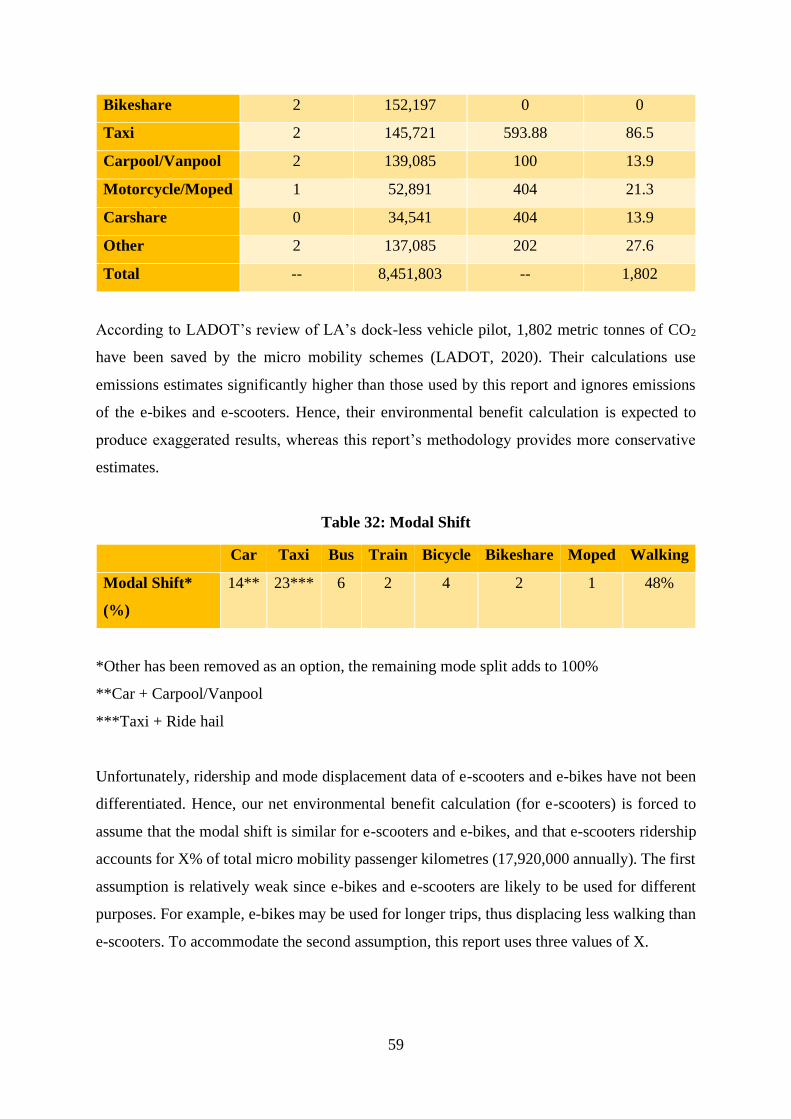
59
Bikeshare 2 152,197 0 0
Taxi 2 145,721 593.88 86.5
Carpool/Vanpool 2 139,085 100 13.9
Motorcycle/Moped 1 52,891 404 21.3
Carshare 0 34,541 404 13.9
Other 2 137,085 202 27.6
Total -- 8,451,803 -- 1,802
According to LADOT’s review of LA’s dock-less vehicle pilot, 1,802 metric tonnes of CO2
have been saved by the micro mobility schemes (LADOT, 2020). Their calculations use
emissions estimates significantly higher than those used by this report and ignores emissions
of the e-bikes and e-scooters. Hence, their environmental benefit calculation is expected to
produce exaggerated results, whereas this report’s methodology provides more conservative
estimates.
Table 32: Modal Shift
Car Taxi Bus Train Bicycle Bikeshare Moped Walking
Modal Shift*
(%)
14** 23*** 6 2 4 2 1 48%
*Other has been removed as an option, the remaining mode split adds to 100%
**Car + Carpool/Vanpool
***Taxi + Ride hail
Unfortunately, ridership and mode displacement data of e-scooters and e-bikes have not been
differentiated. Hence, our net environmental benefit calculation (for e-scooters) is forced to
assume that the modal shift is similar for e-scooters and e-bikes, and that e-scooters ridership
accounts for X% of total micro mobility passenger kilometres (17,920,000 annually). The first
assumption is relatively weak since e-bikes and e-scooters are likely to be used for different
purposes. For example, e-bikes may be used for longer trips, thus displacing less walking than
e-scooters. To accommodate the second assumption, this report uses three values of X.

60
Table 33: Net Environmental Benefit Estimates
X = 25 Low SCC Central SCC High SCC
Low emission
(2019£)
14,159.67 22,905.34 52,057.60
Central emission
(2019£)
4,015.16 6,495.10 14,761.60
High emission
(2019£)
-432.59 -699.78 -1,590.40
X = 50 Low SCC Central SCC High SCC
Low emission
(2019£)
28,319.33 45,810.69 104,115.20
Central emission
(2019£)
8,030.31 12,990.21 29,523.20
High emission
(2019£)
-865.18 -1,399.55 -3,180.80
X = 75 Low SCC Central SCC High SCC
Low emission
(2019£)
42,479.00 68,716.03 156,172.80
Central emission
(2019£)
12,045.47 19,485.31 44,284.80
High emission
(2019£)
-1,297.77 -2,099.33 -4,771.20
Clearly, due to the large displacement of ride-hailing and private car trips, the e-scooter element
of LA’s micro mobility pilot would only have a negative environmental impact if e-scooter
emissions were high. Alternately, the environmental benefit of e-scooters to LA could have
ranged between £12,045 and £156,173 annually if: Dot’s micro-mobility operation belonged
to either of the “central” or “low” emissions categories; and e-scooters contributed to 75% of
the pilot’s total passenger kilometres. However, this conclusion is heavily dependent on several
weak assumptions.
61
Lisbon (Lime)
Elevation Range (ft) Average Salary (£) Median Age (Years)
1,670 29,027 40.4
Bike Lanes
(km/km2)
PT Reliability and
Quality (Score/10)
Average
Temperature (C°)
Average Rainfall
(mm/year)
1 7.1 11.7 – 23.5 710
Between October 2018 and October 2019, 1,800,000 rides were taken on Lime e-scooters
(Lime, 2019c). There are now 9 e-scooter companies providing a total of 120,000 shared e-
scooters in Lisbon, which is a sign of strong demand for micro mobility in the area. Lisbon’s
council have shown signs of increasing environmental awareness. Specifically, Lisbon won a
European Mobility Week Award in 2018 (EC, 2019b), and a €350,000 European Commission
Green Capital Award in 2020 (Cities Today, 2020), following policies such as: new and
expanded bike lanes; 31 new bike-sharing stations; 800 new bike parking areas; free bicycle
repair workshops; and a planned €252,000,000 investment in 420 buses and 25 trams by 2023.
This emphasis on sustainability has had an impact on the government’s management of e-
scooter schemes. For example, at the end of 2019, Portugal and Lisbon City Council signed the
Corporate Mobility Pact along with 56 leading companies, which included commitments
designed to help increase mobility sustainability in Lisbon (Cities Today, 2020). Lisbon
became the first European city to adopt the Mobility Data Specification (following LA’s
example), so that city leaders could make informed decisions based on shared e-scooter data
during fortnightly progress meetings.
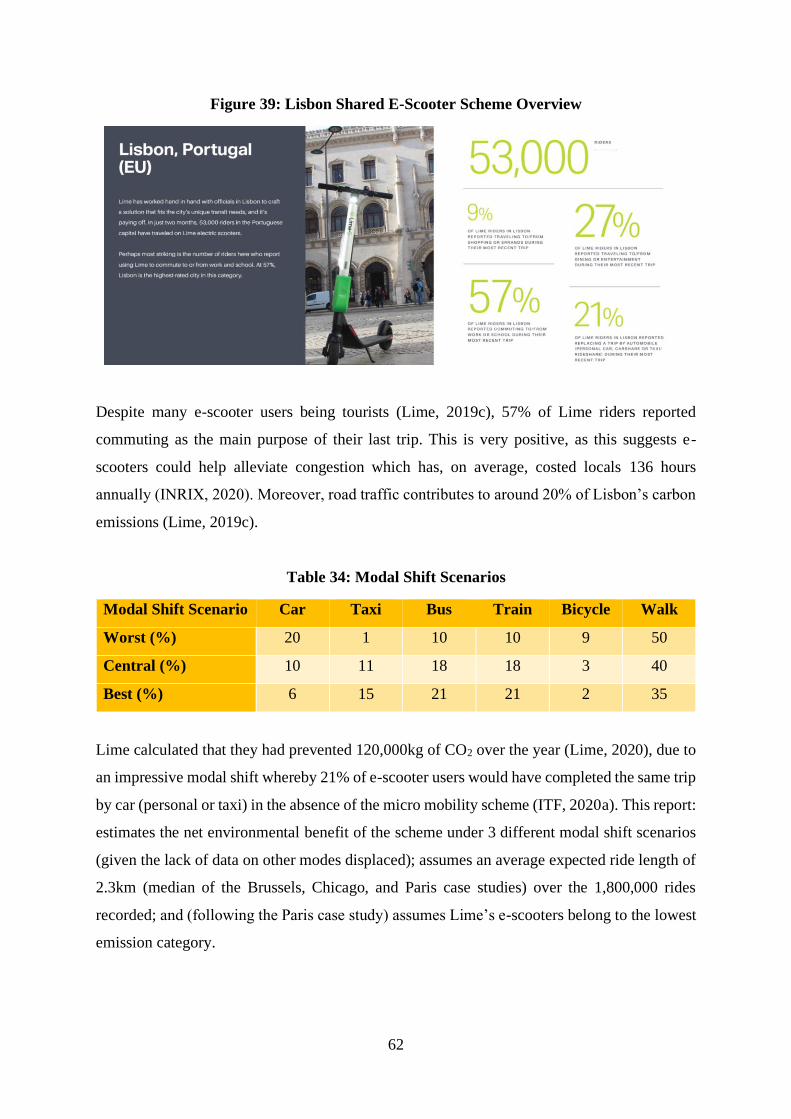
62
Figure 39: Lisbon Shared E-Scooter Scheme Overview
Despite many e-scooter users being tourists (Lime, 2019c), 57% of Lime riders reported
commuting as the main purpose of their last trip. This is very positive, as this suggests e-
scooters could help alleviate congestion which has, on average, costed locals 136 hours
annually (INRIX, 2020). Moreover, road traffic contributes to around 20% of Lisbon’s carbon
emissions (Lime, 2019c).
Table 34: Modal Shift Scenarios
Modal Shift Scenario Car Taxi Bus Train Bicycle Walk
Worst (%) 20 1 10 10 9 50
Central (%) 10 11 18 18 3 40
Best (%) 6 15 21 21 2 35
Lime calculated that they had prevented 120,000kg of CO2 over the year (Lime, 2020), due to
an impressive modal shift whereby 21% of e-scooter users would have completed the same trip
by car (personal or taxi) in the absence of the micro mobility scheme (ITF, 2020a). This report:
estimates the net environmental benefit of the scheme under 3 different modal shift scenarios
(given the lack of data on other modes displaced); assumes an average expected ride length of
2.3km (median of the Brussels, Chicago, and Paris case studies) over the 1,800,000 rides
recorded; and (following the Paris case study) assumes Lime’s e-scooters belong to the lowest
emission category.
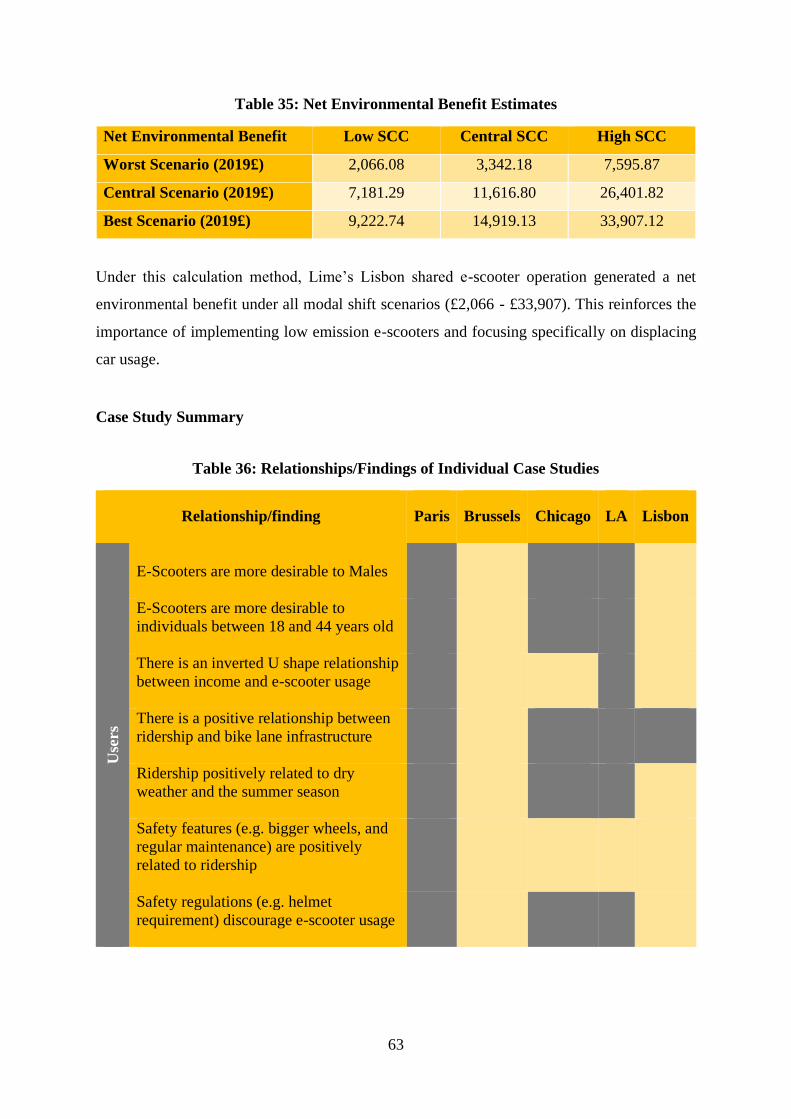
63
Table 35: Net Environmental Benefit Estimates
Net Environmental Benefit Low SCC Central SCC High SCC
Worst Scenario (2019£) 2,066.08 3,342.18 7,595.87
Central Scenario (2019£) 7,181.29 11,616.80 26,401.82
Best Scenario (2019£) 9,222.74 14,919.13 33,907.12
Under this calculation method, Lime’s Lisbon shared e-scooter operation generated a net
environmental benefit under all modal shift scenarios (£2,066 - £33,907). This reinforces the
importance of implementing low emission e-scooters and focusing specifically on displacing
car usage.
Case Study Summary
Table 36: Relationships/Findings of Individual Case Studies
Relationship/finding
Paris Brussels Chicago LA Lisbon
Use
rs
E-Scooters are more desirable to Males
E-Scooters are more desirable to
individuals between 18 and 44 years old
There is an inverted U shape relationship
between income and e-scooter usage
There is a positive relationship between
ridership and bike lane infrastructure
Ridership positively related to dry
weather and the summer season
Safety features (e.g. bigger wheels, and
regular maintenance) are positively
related to ridership
Safety regulations (e.g. helmet
requirement) discourage e-scooter usage
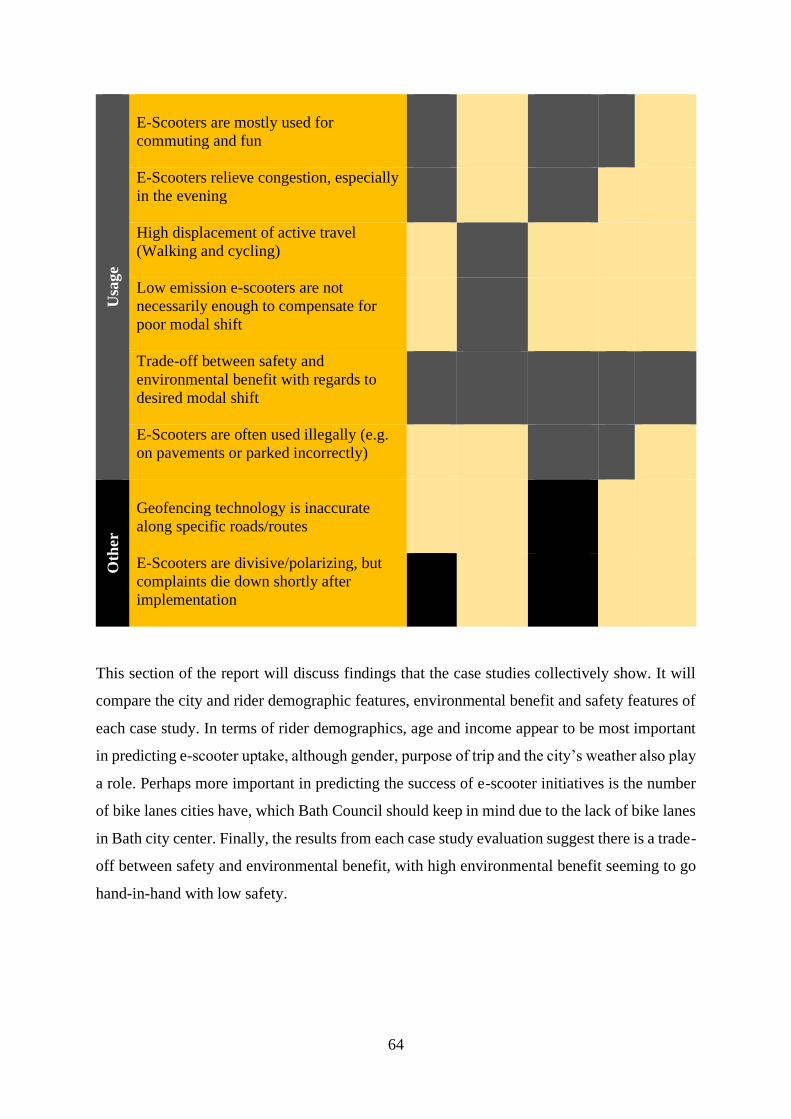
64
Usa
ge
E-Scooters are mostly used for
commuting and fun
E-Scooters relieve congestion, especially
in the evening
High displacement of active travel
(Walking and cycling)
Low emission e-scooters are not
necessarily enough to compensate for
poor modal shift
Trade-off between safety and
environmental benefit with regards to
desired modal shift
E-Scooters are often used illegally (e.g.
on pavements or parked incorrectly)
Oth
er
Geofencing technology is inaccurate
along specific roads/routes
E-Scooters are divisive/polarizing, but
complaints die down shortly after
implementation
This section of the report will discuss findings that the case studies collectively show. It will
compare the city and rider demographic features, environmental benefit and safety features of
each case study. In terms of rider demographics, age and income appear to be most important
in predicting e-scooter uptake, although gender, purpose of trip and the city’s weather also play
a role. Perhaps more important in predicting the success of e-scooter initiatives is the number
of bike lanes cities have, which Bath Council should keep in mind due to the lack of bike lanes
in Bath city center. Finally, the results from each case study evaluation suggest there is a trade-
off between safety and environmental benefit, with high environmental benefit seeming to go
hand-in-hand with low safety.
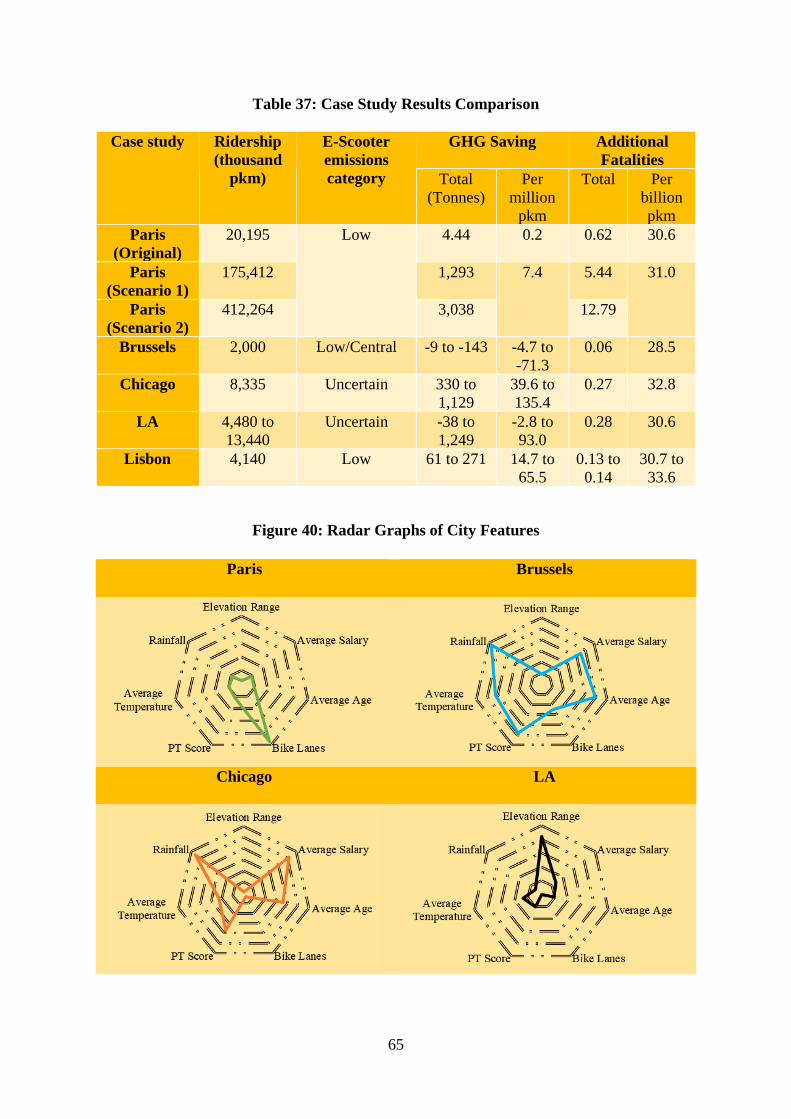
65
Table 37: Case Study Results Comparison
Figure 40: Radar Graphs of City Features
Case study Ridership
(thousand
pkm)
E-Scooter
emissions
category
GHG Saving Additional
Fatalities
Total
(Tonnes)
Per
million
pkm
Total Per
billion
pkm
Paris
(Original)
20,195 Low 4.44 0.2 0.62 30.6
Paris
(Scenario 1)
175,412 1,293 7.4 5.44 31.0
Paris
(Scenario 2)
412,264 3,038 12.79
Brussels 2,000 Low/Central -9 to -143 -4.7 to
-71.3
0.06 28.5
Chicago 8,335 Uncertain 330 to
1,129
39.6 to
135.4
0.27 32.8
LA 4,480 to
13,440
Uncertain -38 to
1,249
-2.8 to
93.0
0.28 30.6
Lisbon 4,140 Low 61 to 271 14.7 to
65.5
0.13 to
0.14
30.7 to
33.6
Paris Brussels
Chicago LA
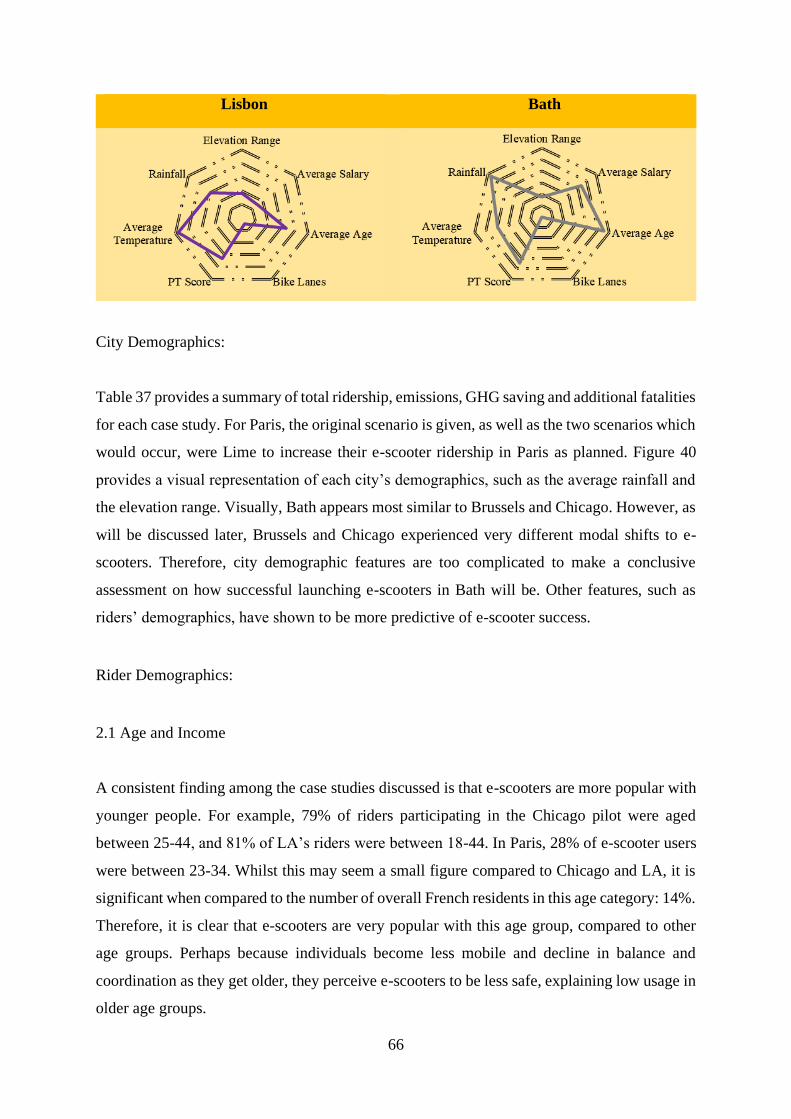
66
City Demographics:
Table 37 provides a summary of total ridership, emissions, GHG saving and additional fatalities
for each case study. For Paris, the original scenario is given, as well as the two scenarios which
would occur, were Lime to increase their e-scooter ridership in Paris as planned. Figure 40
provides a visual representation of each city’s demographics, such as the average rainfall and
the elevation range. Visually, Bath appears most similar to Brussels and Chicago. However, as
will be discussed later, Brussels and Chicago experienced very different modal shifts to e-
scooters. Therefore, city demographic features are too complicated to make a conclusive
assessment on how successful launching e-scooters in Bath will be. Other features, such as
riders’ demographics, have shown to be more predictive of e-scooter success.
Rider Demographics:
2.1 Age and Income
A consistent finding among the case studies discussed is that e-scooters are more popular with
younger people. For example, 79% of riders participating in the Chicago pilot were aged
between 25-44, and 81% of LA’s riders were between 18-44. In Paris, 28% of e-scooter users
were between 23-34. Whilst this may seem a small figure compared to Chicago and LA, it is
significant when compared to the number of overall French residents in this age category: 14%.
Therefore, it is clear that e-scooters are very popular with this age group, compared to other
age groups. Perhaps because individuals become less mobile and decline in balance and
coordination as they get older, they perceive e-scooters to be less safe, explaining low usage in
older age groups.
Lisbon Bath

67
The case studies suggest income has a more complex relationship with e-scooter usage than
age. On the surface, it appears income and e-scooter usage are positively correlated. For
example, despite having similar populations, Table 37 shows Paris’s current e-scooter ridership
is much higher than Brussels’s. Although this could be due to a variety of factors, such as the
number of bike lanes (discussed later), income could be involved. Paris has a higher average
income than Brussels, which could contribute to greater Parisian ridership. Parisian ridership
is also much larger than ridership in the less affluent city Lisbon, however, this is more likely
due to Paris having a larger population.
However, greater income only appears to lead to greater ridership to an optimum point, after
which ridership decreases again. For example, in the Chicago pilot, ridership increases as
income increases until income reaches $75,000: at this point, ridership decreases. This is
similar to findings in LA, where only a quarter of riders earn an income of $100,000 or above,
compared to the 34% of LA residents found on the LA Census to receive this income.
Therefore, income and e-scooter ridership seem to have an inverted-U shaped relationship. As
suggested in the LA section of the report, perhaps people with very high incomes are under-
represented in ridership figures because of the positive correlation between age and ridership.
Alternatively, perhaps e-scooters are considered a luxury to people with a relatively high
income, explaining high ridership, but very rich individuals consider using private cars or taxis
more of a luxury, therefore do not use e-scooters. However, we must be careful when making
conclusions based on data from Chicago and LA case studies, because both pilots attempted to
target deprived areas. This emphasis may have influenced demographic findings on the
relationship between income and ridership.
Bath has an older median age than any of the case studies discussed (42). This could be
problematic for the implementation of e-scooters in Bath, since the case studies have
demonstrated a preference for e-scooters among younger people. Out of all case studies,
Chicago has the largest net environmental benefit, and the youngest median age. Therefore,
Bath’s older median age could lead to a much smaller environmental benefit. However, Bath’s
median age is similar to Lisbon’s, which is only slightly lower at 40.4 years. This report ranked
Lisbon second in its e-scooters’ net environmental benefit. Therefore, it is unlikely Bath’s
slightly older population will drastically decrease the environmental benefit of implementing
e-scooters.

68
Bath also has a lower median income than all other case studies (£36,000), except for Lisbon.
This report has already demonstrated the complex relationship between income and e-scooter
usage. Perhaps the Council could encourage e-scooter usage in areas of Bath with a lower
average income, such as Twerton, following the lead of Chicago and LA pilots. This may
encourage the uptake of e-scooters among all Bath residents regardless of their income levels,
to ensure they are not considered an ‘elite’ mode of transport, thus increasing environmental
benefit.
2.2 Gender
The data suggests there is a strong positive correlation between gender and e-scooter ridership.
In Paris, Chicago and LA, 65-66% of riders were male. Perhaps because riders have expressed
concerns about e-scooter safety, this gender finding can be explained by the assumption that
males are less risk averse and less concerned about injury than females. However, this is only
an assumption based on the data, and should be researched before conclusive statements are
made.
Trip Purpose:
Commuting and pleasure are the two main explanations for e-scooter ridership in the case
studies. In Paris, 10% of journeys had no purpose other than pleasure, and 69% of riders said
pleasure was one of the main motivations for choosing micro mobility. Similarly, in Chicago,
70% of riders said fun was the main factor that contributed to their positive experience with e-
scooters. Therefore, e-scooters are considered a novelty and people enjoy using them.
However, this novelty could reduce as people become accustomed to e-scooters, which may
lead to a decrease in ridership.
Commuting is also an important reason for e-scooter usage. In Lisbon, 57% of riders said their
most recent reason for using e-scooters was to commute to work. In Chicago, 12% of daily
riders used e-scooters for commuting, and there were two significant peaks in usage between
6-9 AM and 4-7 PM. The evening peak was especially significant: perhaps morning commutes
are more habitual and less flexible, whereas individuals choose e-scooters to return home from
work as a treat (incorporating the ‘pleasure’ factor). People may also be less rigid in their

69
structure when returning home, therefore choose an e-scooter rather than sticking to structured
public transport times.
Importantly, usage data suggests that e-scooters can relieve congestion, predominantly in the
evening.
Weather:
The influence of weather on e-scooter usage was only explored in the Chicago case-study.
Despite the City of Chicago concluding that there was no relationship between weather and e-
scooter usage, we concluded that dry weather predicted higher e-scooter ridership, and
moderate rainfall led to a reduced number of riders. Perhaps this is because riders feel unsafe
when the ground is wet, and fear of slipping due to reduced grip on the road. In LA, e-scooter
ridership peaked in the summer. Whilst this may be due to the arrival of tourists who use e-
scooters, it may also be due to better weather. Intuitively, people prefer using active transport
when it is dry. Since Bath experiences an average rainfall of 812 mm per year, precipitation
could slightly reduce ridership. However, it is unlikely to have a significant impact.
Bike Lanes:
Together, Table 37 and Figure 40 show that ridership was highest in the city with the highest
density of bike lanes (Paris). There are several contributary factors which influence this result,
however there is strong theory and evidence to support the hypothesis that bike lanes encourage
e-scooter usage.
Paris has 9.5 km/km² of bike lanes and a large ridership of 20,195 thousand pkm. Following e-
scooter trials, LA and Lisbon city leaders have made plans to invest in bike lane infrastructure
as part of environmental policies, with LA leaders planning a large $2,000,000 investment to
improve existing and implement new bike lanes across the city. The City of Chicago’s research
into their pilot’s success revealed riders were less likely to use e-scooters on sidewalks when
bike lanes were available. In LA, at least 13.6% of riders used e-scooters on sidewalks, despite
knowing it was not allowed. This is likely because almost half of LA riders said the city’s lack
of bike lanes was a barrier to using e-scooters and e-bikes. Perhaps riders feel unsafe when

70
riding on the road, due to the presence of cars. However, using e-scooters on sidewalks has
heavy implications for pedestrians’ safety, therefore should be avoided. Overall, bike lanes
seem to have advantages for safety and e-scooter ridership.
Bath city center has no bike lanes. This is likely to have a negative effect on the uptake of e-
scooters in Bath. It will not prevent residents from using e-scooters, because significant
ridership was still seen in case studies where there was an extremely limited number of bike
lanes (e.g., Chicago and LA). However, perhaps a policy where bike lane infrastructure was
implemented would lead to a large increase in e-scooter uptake, such as what is seen in Paris,
compared to what will occur with Bath’s current infrastructure.
Safety and Environmental Impact:
Figure 41: Fatalities per Billion Passenger Kilometres
Safety appears to be a problem in people’s perspective on e-scooters. In Paris, riders said
feeling unsafe was a downside of using e-scooters, and in Chicago 59%, of nonriders said safety
was a contributing factor to their negative experience of the e-scooter pilot. However, it seems
e-scooter providers’ efforts to rectify safety issues could have a negative impact on ridership
(i.e. counterproductive) or outright ignored (i.e. ineffective). For example, Parisian survey
responders reported being opposed to having to wear helmets, and in Chicago, most riders are
unaware of the e-scooter rules, making them redundant. Nevertheless, providers continue to
advertise their e-scooters’ safety, such as Dott (Brussels) and Lime (Paris, Lisbon) both

71
checking their scooters regularly, and purchasing scooters with large wheels and speed-
restrictive capabilities.
Figure 42: Net Environmental Benefit per Thousand Passenger Kilometres (2019£)
In the discussion of each case study, its estimated environmental benefit was given. This was
often a more conservative environmental benefit than that given by the company. In case
studies where emissions were reduced compared to using other methods of transport, the
environmental benefit often stemmed from companies’ methods of operation, rather than the
e-scooters themselves. For example, Lime (Paris, Lisbon, one of the providers in Chicago and
LA) ensure warehouse operations use 100% renewable energy, repair, reuse and recycle broken
e-scooters and intend to reduce the emissions of their vehicle fleet. Both Lime and Dott
(Brussels) invest in green initiatives to compensate for their CO2 emissions. However, the e-
scooters themselves also have a (smaller) environmental benefit, particularly when companies
have switched to rechargeable batteries (e.g., Dott, Voi and TIER).
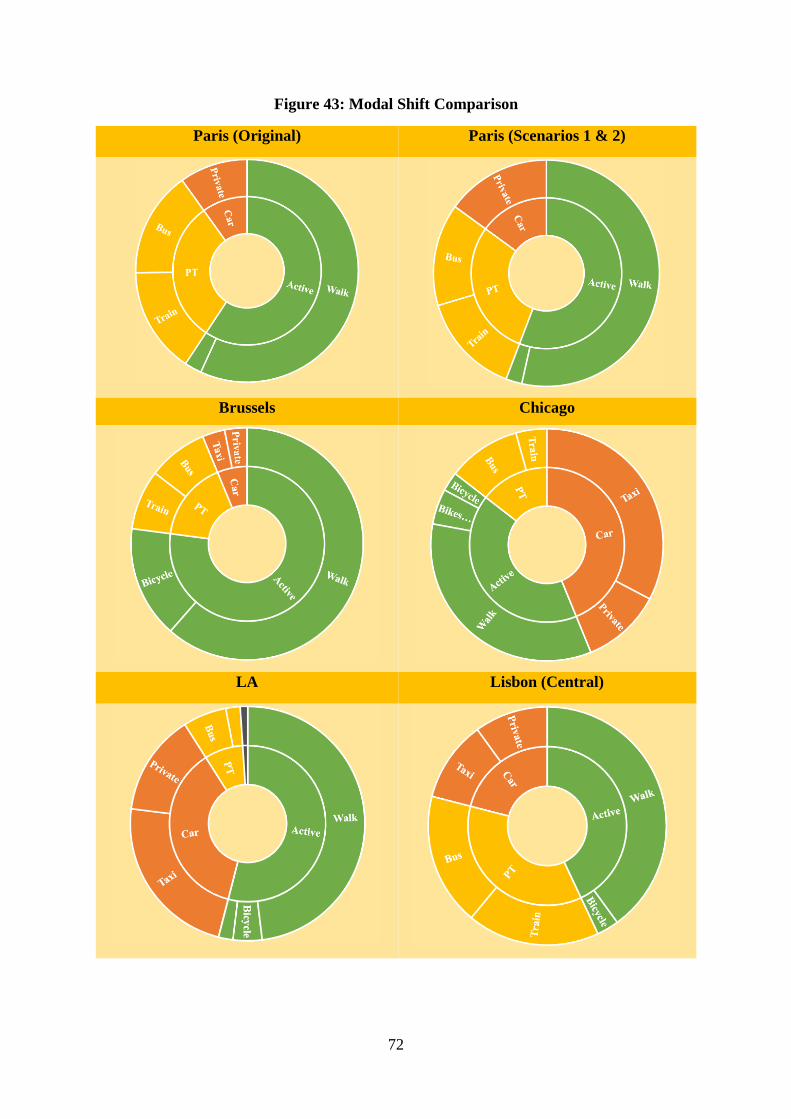
72
Figure 43: Modal Shift Comparison
Paris (Original) Paris (Scenarios 1 & 2)
Brussels Chicago
LA Lisbon (Central)

73
Lisbon (Worst) Lisbon (Best)
The environmental benefit of each e-scooter initiative is clearly dependent on the method of
transport from which riders are switching to e-scooters from. For example, Figure 42 shows
Brussels has a net negative impact on the environment even when their e-scooters are
categorized as low-emission. This is because, as depicted by Figure 43, the Brussels case study
had the largest modal shift from active transport modes (walking and cycling). Walking and
cycling are the most environmentally friendly transport methods, therefore replacing these has
a negative environmental impact. Chicago has the largest net environmental benefit (figure 42),
and the largest modal shift from private cars and taxis of all case studies (figure 43). Taxis have
an especially negative environmental impact, due to emissions released when drivers travel to
pick up the passenger as well as driving the passenger to their location. Therefore, e-scooters
replacing this mode of transport is highly beneficial for the environment. To ensure a large
environmental benefit from the e-scooter initiative in Bath, the Council should encourage
people to use e-scooters who would otherwise have travelled using cars or taxis, rather than
replacing active transport.
From the case studies, we can conclude there is an apparent trade-off between e-scooter safety
and environmental benefit with regards to desired modal shift. Brussels has a low number of
additional fatalities (figure 41) but a net negative impact on the environment (figure 42) and
LA has both a medium number of fatalities (figure 41) and a medium net environmental benefit
(figure 42) compared to other case studies.

74
This trade-off is due to the generally positive relationship between a transport mode’s safety,
and GHG emissions. Specifically, active transport is associated with lower GHG emissions
than cars and public transport, but also tends to result in a higher number of fatalities per
passenger kilometer than cars and public transport. Hence, the modal shift which is best for the
environment, is not the best for minimizing additional fatalities.
For example, whilst Lime estimates an expansion of e-scooters in Paris would lead to an
increase in modal shift from cars and taxis (figure 43), and therefore an increased net
environmental benefit (figure 42), it would also increase the number of fatalities (figure 41),
perhaps from one additional death every year and a half to one additional death every month.
Theoretically, this trade-off can also be extended to include specific safety regulation/policy.
This was noted in the Paris case study, where we predicted measures implemented to increase
e-scooter safety may lead to a decrease in ridership, because riders were opposed to measures
such as a helmet requirement. Decreased ridership will lead to a decrease in environmental
benefit because people will return to travelling by car and public transport.
However, theoretically, there could exist some safety features which could increase ridership.
For example, larger wheels increase safety without affecting their convenience. Hence,
ridership may increase since one barrier to e-scooter usage identified by the Paris case study is
“feeling unsafe”.
Overall, the case studies suggest that policies which maximize the environmental benefit of
micro mobility schemes could come at the cost of additional road fatalities. Bath Council
should take this finding into account when encouraging use of e-scooters to reduce our
environmental impact.
75
Psychology Literature Review
As well as the Voi e-scooter trial in Bath which inspired our investigation into e-scooters, there
are also many factors from a psychological perspective that point towards e-scooters providing
a successful form of sustainable transport which can provide benefits where other types of
sustainable transport are lacking. For example, the stigma associated with buses can steer
individuals away from using them (Batty et al., 2015). This stigma can arise from the quality
of the service provided, whereby individuals do not consider buses to be reliable. This effect
forms part of conditioning theory, whereby negative outcomes (e.g. being late for work) do not
reinforce that behaviour and so the behaviour is less likely to occur in the future (Skinner,
1971). The provision of e-scooters, as long as they are implemented in sufficient quantity to
match demand, would therefore not carry the stigma of unreliability and therefore would
provide a reliable substitute for individuals unwilling to take buses for this reason.
Another additional factor that affects modal shift, particularly relevant during times of COVID-
19, is the cleanliness of the transport. This is because transport cleanliness can also act as a
barrier to individuals taking buses or trains (Batty et al., 2015). From a practical perspective,
the cleanliness of buses and trains is more difficult to ensure when fabric materials are used for
seating as they are not ‘wipe-down’ friendly. Additionally, buses and trains cannot be feasibly
wiped down after every use, due to the timetabling constraints of these services. Therefore,
individuals’ concerns over the cleanliness of buses and trains are not irrational. However, the
materials of e-scooters being ‘wipe-down’ friendly, and also the feasibility for each passenger
to do this after they have completed their journey means that e-scooters would be less likely to
suffer in their modal shift uptake due to cleanliness compared to trains and buses.
Although cleanliness of the form of sustainable transport addresses individuals’ safety concerns
regarding COVID-19 and general health, there is also a social aspect to safety which e-scooters
can also address. Individuals report that in order to feel comfortable using buses or trains, there
needs to be sufficient CCTV, panic buttons and sufficient lighting (Batty et al., 2015; Delbosc
& Currie, 2012). The fact that e-scooters can only be used by one person means that
individuals’ social safety concerns can be reduced as there less opportunity for contact with
others. Also, within the wider theme of safety sits physical safety regarding the likelihood of
accidents. The likelihood of an accident increases as speed increases (Baruya, 1998). The VOI

76
e-scooters have a top speed of 10mph and have trialled pedestrian-detection technology, further
reducing e-scooters potential to endanger individuals’ physical safety.
The ability of a form of sustainable transport to be integrated into a journey is also an important
predictor of whether it can cause a modal shift (Batty et al., 2015). This is also theoretically
supported by research on urban route planning, whereby individuals are more likely to choose
routes with the fewest number of turns even if that means a slightly greater journey distance
(Hölscher et al., 2011). This suggests that changes in a journey are unattractive to the route
planner, and therefore in order to attract individuals to use sustainable transport, the form of
sustainable transport needs to be efficiently integrated into routes in order to reduce the
perception of changes in their route. The relatively small size of e-scooters makes their
integration with other types of transport much more feasible. Furthermore, the flexibility of e-
scooters (e.g. being able to use the e-scooter directly to the door of a bus) in comparison to
other modes of transport (e.g. having to walk from a bus stop to a train station) smoothens the
transition within the route, further increasing their attractiveness to individuals and hence
improving their probability of leading to a modal shift.
Lastly, the perceived cost has also been found to influence individual’s decisions as to whether
to choose to take sustainable transport or not (Batty et al., 2015). With all new cars in the UK
required to be electric by 2030, this is already starting to place pressure on individuals to switch.
However, electric cars are more expensive than diesel/petrol cars (Ortar & Ryghaug, 2019).
With this in mind, it is likely that cost is going to become an even larger factor in individuals’
decision-making regarding their transport choices. Alongside potential changes in employment
policies, whereby COVID-19 has initiated a trend in working from home, if possible, to reduce
employer’s costs, it is possible that individuals will perceive owning an electric car to be not
cost-worthy. Therefore, for shorter journeys where individuals may be leaving their homes to
travel to local shops or amenities, renting e-scooters may very well provide the solution for
individuals making cost-based transport choices.
77
Source Review
Consistency:
Consistency in public transport use refers to the reliability as to which an individual is able to
successfully board the public transport, whereby success is referring to both actually being able
to get on a form of public transport (i.e., overcrowding) and also getting on a form of public
transport on time (i.e., accuracy of timetabling) (Tahnmasseby, 2009). For example, Soza-
Parra, Raveau, Muñoz & Cats (2019) found that crowding and denied boardings in a survey
predicted dissatisfaction with bus and metro usage. Interestingly, crowding’s importance was
stronger for woman than for men, indicating this is more important for women. However, this
has been suggested to be more of an indication of women’s safety concerns as opposed to the
reliability of the service (timetabling). Nevertheless, inaccuracy of timetabling can lead to
overcrowding (Sun et al., 2014), highlighting the underlying importance of timetabling
reliability.
Cleanliness:
Research has consistently highlighted cleanliness to be an important factor influencing modal
shifts towards sustainable transport. For example, Foote (2004) found that improvements to
cleanliness and comfort of Chicago’s metro led to a 5% increase its usage. Furthermore, when
Lisbon residents were asked to describe local train networks, they frequently mentioned words
associated with hygiene, and trains outside of Lisbon were perceived to be more hygienic than
those inside the city (Ramos, Vicente, Passos, 2019). The perceived better hygiene on trains
outside the city suggest a population-density and usage effect, where the larger the quantity of
individuals using the transport, the worse hygiene is perceived to be. This suggests cleanliness
is likely to increase in its importance of predicting modality shifts, due to the predicted
increases in usage of sustainable transport (Currie & Delbosc, 2010).
Cost:
Reducing costs of sustainable transport has been shown to reliably increase usage. For example,
Webb et al. (2007) found that introducing an offer on Sundays where travel on Sundays was

78
free for the elderly was shown to increase usage of sustainable transport. However, making
transport free for students in Belgium was not found to increase use of sustainable transport
(De Witte et al., 2006). This difference in uptake when free transport is introduced was
suggested to be due to differences in awareness of the schemes and transport in general as
opposed to age-related differences in cost’s predictive power of modality shifts. Nevertheless,
the success of day-schemes in shifting modality usage towards sustainable forms of transport
is an optimistic finding, as it provides a feasible method of using cost in order to increase uptake
of sustainable transport. Later findings about integration (described below) may suggest cost
schemes need to occur across a whole transport network (e.g., buses and e-scooters) as opposed
to only being available for one method of transport.
Social Safety:
Safety is a topic of concern for individuals; Delbosc & Currie (2012) found that 10% of
individuals would reconsider sustainable transport on their commutes if their safety concerns
were addressed. This effect was seen to be larger for women and older individuals, suggesting
social safety is of particular importance for modal shifts in ageing populations. Furthermore,
this effect was greater than the effect of the distance of the commute. This suggests individuals
highly value safety on transport in their decision-making process, as it ranks higher than the
distance of the commute which has already been established in the literature as an important
perceived cost to individuals (Dijist, 2006).
Integrative Ability:
The integrative ability of transport refers to how easily commuters can transfer between one
transport form and another in order to smoothen the transition of the journey. For example,
Wener et al. (2003) found that reduced changes within journeys predicted individuals’
reduction in stress levels when a newly improved integrated transport system was used in New
Jersey, USA. Furthermore, the introduction of a zone system for payment instead of payment
for boarding in Israel led to an 8% increase in trips made using public transport (Sharaby &
Shiftan, 2012). This suggests that integration can be introduced from a top-down perspective
by creating systems that increase transition ability. Collectively, these findings suggest that
moving towards a more integrated transport system, where payments and schemes are
equivalent across the different modes in that system will decrease individuals’ stress and hence
lead to increased uptake of public transport.

79
Policy Proposals
Target Areas for E-Scooters within the B&NES Area
To make the most effective use of e-scooters, an analysis using the Propensity to cycle
tool (PCT) was used (Goodman and Lovelace, 2017). The baseline for this information was
the 2011 Census and the analysis on the e bike scenario. The e bike scenario will be
applicable to the use of e-scooters in Middle Super Output Areas (MSOAs) and Lower
Super Output Areas (LSOAs) to identify different target regions in B&NES and
specifically the CAZ.
Table 38: Comparison of the Definitions of LSOAs and MSOAs (ONS, 2011)
Geography Min
population
Max
population
Min no.
households
Max no.
households
LSOA 1000 3000 400 1200
MSOA 5000 15000 2000 1600
Figure 44: A Map of the MSOA Zones Within B&NES
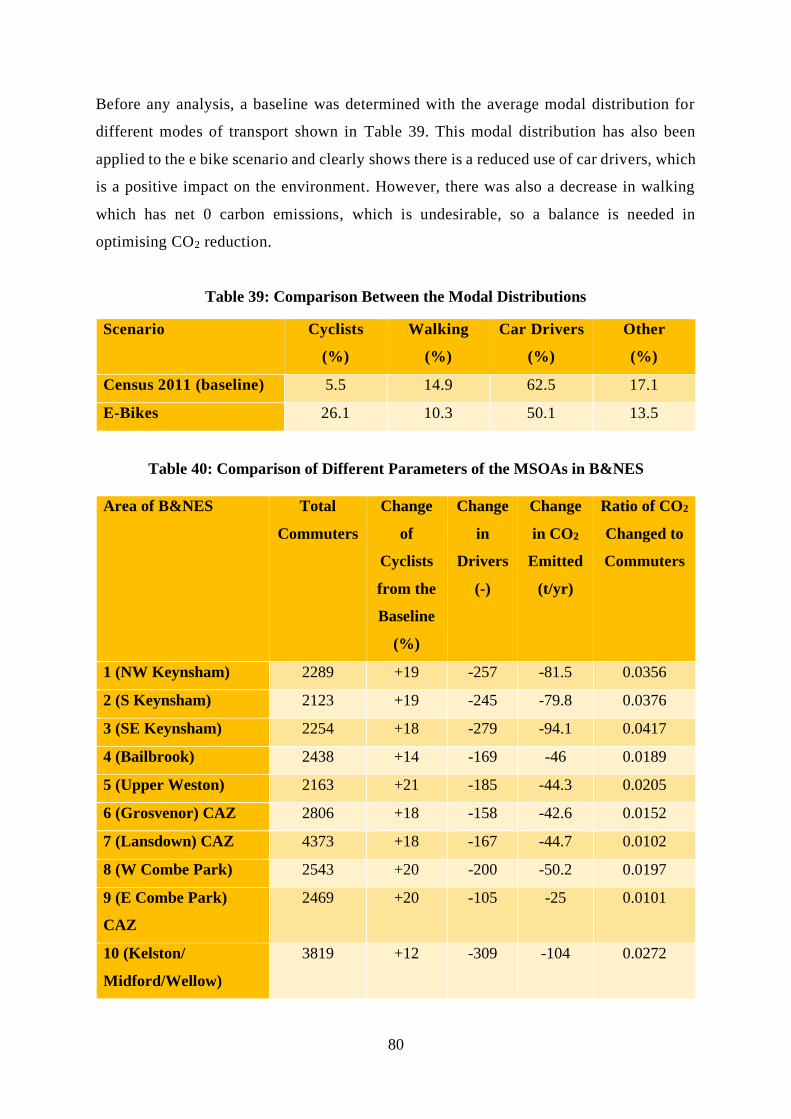
80
Before any analysis, a baseline was determined with the average modal distribution for
different modes of transport shown in Table 39. This modal distribution has also been
applied to the e bike scenario and clearly shows there is a reduced use of car drivers, which
is a positive impact on the environment. However, there was also a decrease in walking
which has net 0 carbon emissions, which is undesirable, so a balance is needed in
optimising CO2 reduction.
Table 39: Comparison Between the Modal Distributions
Scenario Cyclists
(%)
Walking
(%)
Car Drivers
(%)
Other
(%)
Census 2011 (baseline) 5.5 14.9 62.5 17.1
E-Bikes 26.1 10.3 50.1 13.5
Table 40: Comparison of Different Parameters of the MSOAs in B&NES
Area of B&NES Total
Commuters
Change
of
Cyclists
from the
Baseline
(%)
Change
in
Drivers
(-)
Change
in CO2
Emitted
(t/yr)
Ratio of CO2
Changed to
Commuters
1 (NW Keynsham) 2289 +19 -257 -81.5 0.0356
2 (S Keynsham) 2123 +19 -245 -79.8 0.0376
3 (SE Keynsham) 2254 +18 -279 -94.1 0.0417
4 (Bailbrook) 2438 +14 -169 -46 0.0189
5 (Upper Weston) 2163 +21 -185 -44.3 0.0205
6 (Grosvenor) CAZ 2806 +18 -158 -42.6 0.0152
7 (Lansdown) CAZ 4373 +18 -167 -44.7 0.0102
8 (W Combe Park) 2543 +20 -200 -50.2 0.0197
9 (E Combe Park)
CAZ
2469 +20 -105 -25 0.0101
10 (Kelston/
Midford/Wellow)
3819 +12 -309 -104 0.0272

81
11 (N Whiteway/
Twerton)
2176 +23 -212 -45 0.0207
12 (Lyncombe/
Oldfield Park) CAZ
3264 +18 -157 -41.8 0.0128
13 (NW Oldfield Park) 2715 +23 -176 -40 0.0147
14 (SE Oldfield Park) 2405 +22 -170 -37.3 0.0155
15 (S Whiteway) 2495 +21 -255 -57.4 0.0230
16 (Saltford/
Marksbury/Timsbury)
3804 +15 -420 -161.8 0.0425
17 (Bear Flats/
Bloomfield)
2285 +17 -193 -46.6 0.0204
18 (Bear Flats/
Bloomfield)
2053 +18 -191 -45.5 0.0222
19 (W Odd Down) 2676 +20 -282 -70.4 0.0263
20 (Pensford/Clutton/
Cameley)
2718 +14 -290 -113.3 0.0417
24 (Bishop Sutton) 2413 +12 -223 -93.8 0.0389
22 (Inglesbatch/
Carlingcott)
3966 +12 -352 -139.2 0.0351
23 (Paulton) 3770 +14 -421 -144.6 0.0384
24 (Ralstock) 2413 +12 -223 -93.8 0.0389
25 (N Midsomer
Norton)
2831 +17 -346 -83.3 0.0294
26 (E Midsomer
Norton)
2961 +18 -371 -85.4 0.0288
27 (S Midsomer
Norton)
2258 +18 -303 -65.9 0.0292
With this analysis of the MSOAs in Table 40, the highest potential for carbon emissions
reduced relative to the population is area 16 (Saltford/Marksbury/Timsbury) with 0.0425
t/yr saved per commuter. However, looking at the map this region is incredibly large in
comparison to other regions, so in relation to population density this is not the best area to
target for e-scooters. Therefore, considering the relative sizes on the map of the MSOAs

82
is the Keynsham area (1,2,3) with high ratios and a good population density. Furthermore,
the Keynsham area shows a relatively high increase of the use of e bike when implemented
which would be applicable for e -scooters. However, in an attempt to reduce carbon
emissions in the Bath Clean Air Zone, Keynsham does not fall around the CAZ. Therefore,
from the areas that do fall around the CAZ (6,7,9,12), the Grovesnor area has the best ratio
of CO2 saved for every commuter (0.0152 t/yr). This could be a potential target area for
e-scooters to be deployed to reduce emissions within the CAZ.
To further identify target areas in the CAZ to reduce emissions, a LSOA analysis was
conducted on the specified 4 MSOA (6,7,9,12) zones within the CAZ shown in Table 40
below using Figure 45 below:
Figure 45: Map of LSOA Zones Around the CAZ

83
Table 41: Comparison of Different Parameters of the LSOAs Around the CAZ
Areas
Around
CAZ
Total
Commuters
% Change of
Cyclists
from the
Baseline
Change
in Drivers
(-)
Change
in CO2
Emitted
(t/yr)
Ratio of
CO2
Changed to
Commuters
6A 710 +12 -38 -11.4 0.016
6B 531 +19 -31 -8 0.015
6C 823 +17 -49 -13.7 0.017
6D 742 +23 -39 -9.5 0.013
7A 683 +21 -21 -5.5 0.008
7B 833 +21 -31 -8.1 0.010
7C 1014 +18 -31 -8.6 0.008
7D 669 +14 -31 -8.7 0.013
7E 458 +13 -27 -6.2 0.014
7F 716 +17 -26 -7.5 0.010
9C 499 +23 -16 -4.2 0.008
9E 1035 +21 -42 -9.6 0.009
12B 450 +16 -24 -6.2 0.014
12C 616 +20 -25 -6.9 0.011
12E 541 +19 -26 -6.5 0.012
12F 642 +23 -31 -8 0.012
From this analysis of the LSOAs, the best areas for reducing carbon emissions around the
CAZ are 6A, 6B, 6C, 7E and 12B with the highest ratios per commuter. These would be
the ideal target areas for e-scooters and can be even more localised considering popular
cycle routes shown below in Figure 46.
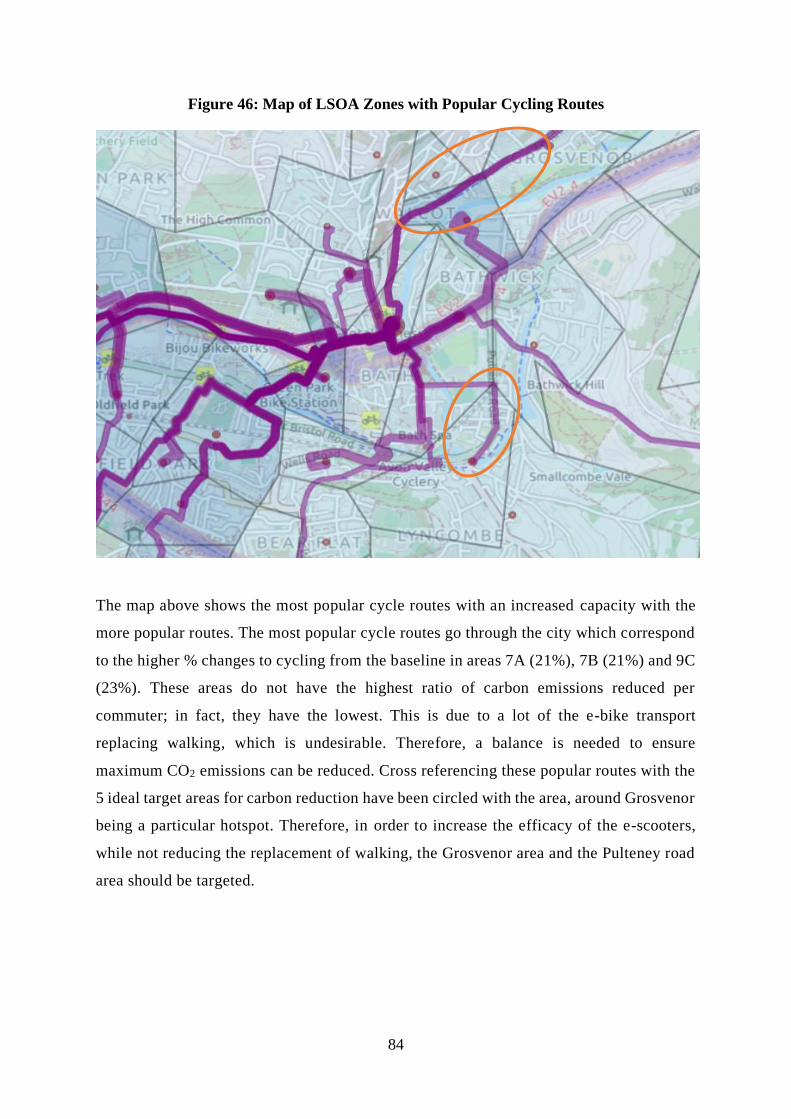
84
Figure 46: Map of LSOA Zones with Popular Cycling Routes
The map above shows the most popular cycle routes with an increased capacity with the
more popular routes. The most popular cycle routes go through the city which correspond
to the higher % changes to cycling from the baseline in areas 7A (21%), 7B (21%) and 9C
(23%). These areas do not have the highest ratio of carbon emissions reduced per
commuter; in fact, they have the lowest. This is due to a lot of the e-bike transport
replacing walking, which is undesirable. Therefore, a balance is needed to ensure
maximum CO2 emissions can be reduced. Cross referencing these popular routes with the
5 ideal target areas for carbon reduction have been circled with the area, around Grosvenor
being a particular hotspot. Therefore, in order to increase the efficacy of the e-scooters,
while not reducing the replacement of walking, the Grosvenor area and the Pulteney road
area should be targeted.
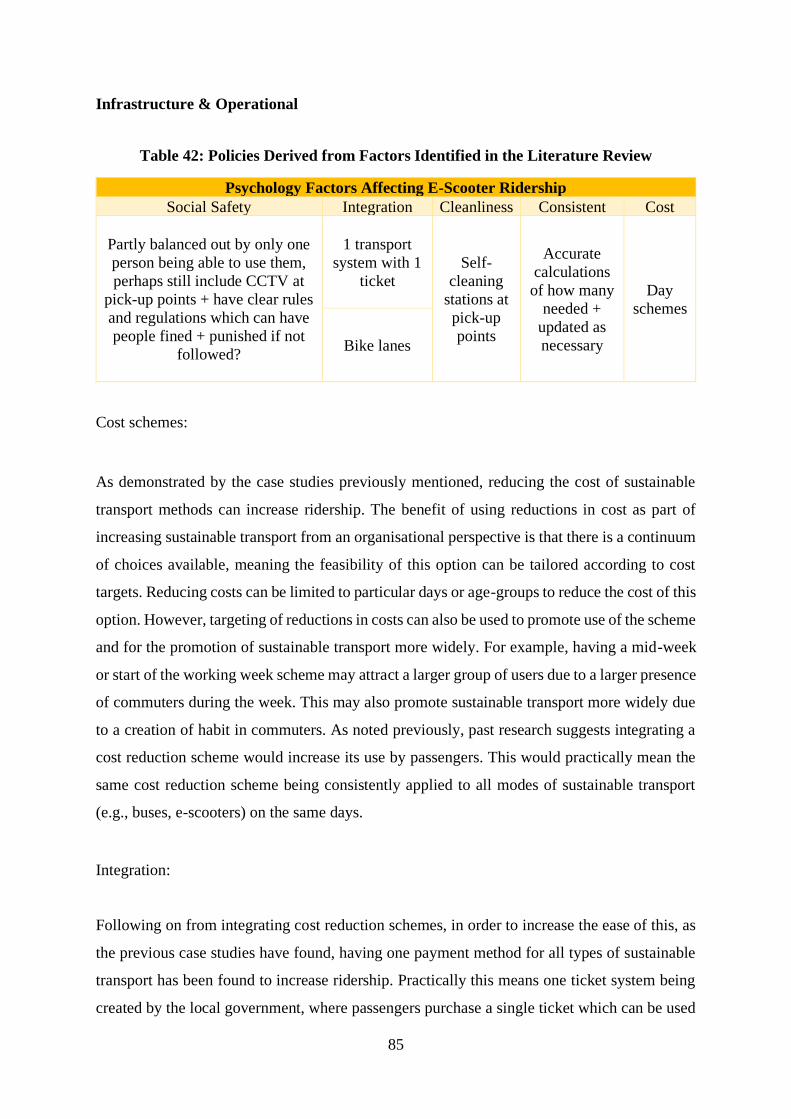
85
Infrastructure & Operational
Table 42: Policies Derived from Factors Identified in the Literature Review
Psychology Factors Affecting E-Scooter Ridership
Social Safety Integration Cleanliness Consistent Cost
Partly balanced out by only one
person being able to use them,
perhaps still include CCTV at
pick-up points + have clear rules
and regulations which can have
people fined + punished if not
followed?
1 transport
system with 1
ticket
Self-
cleaning
stations at
pick-up
points
Accurate
calculations
of how many
needed +
updated as
necessary
Day
schemes
Bike lanes
Cost schemes:
As demonstrated by the case studies previously mentioned, reducing the cost of sustainable
transport methods can increase ridership. The benefit of using reductions in cost as part of
increasing sustainable transport from an organisational perspective is that there is a continuum
of choices available, meaning the feasibility of this option can be tailored according to cost
targets. Reducing costs can be limited to particular days or age-groups to reduce the cost of this
option. However, targeting of reductions in costs can also be used to promote use of the scheme
and for the promotion of sustainable transport more widely. For example, having a mid-week
or start of the working week scheme may attract a larger group of users due to a larger presence
of commuters during the week. This may also promote sustainable transport more widely due
to a creation of habit in commuters. As noted previously, past research suggests integrating a
cost reduction scheme would increase its use by passengers. This would practically mean the
same cost reduction scheme being consistently applied to all modes of sustainable transport
(e.g., buses, e-scooters) on the same days.
Integration:
Following on from integrating cost reduction schemes, in order to increase the ease of this, as
the previous case studies have found, having one payment method for all types of sustainable
transport has been found to increase ridership. Practically this means one ticket system being
created by the local government, where passengers purchase a single ticket which can be used
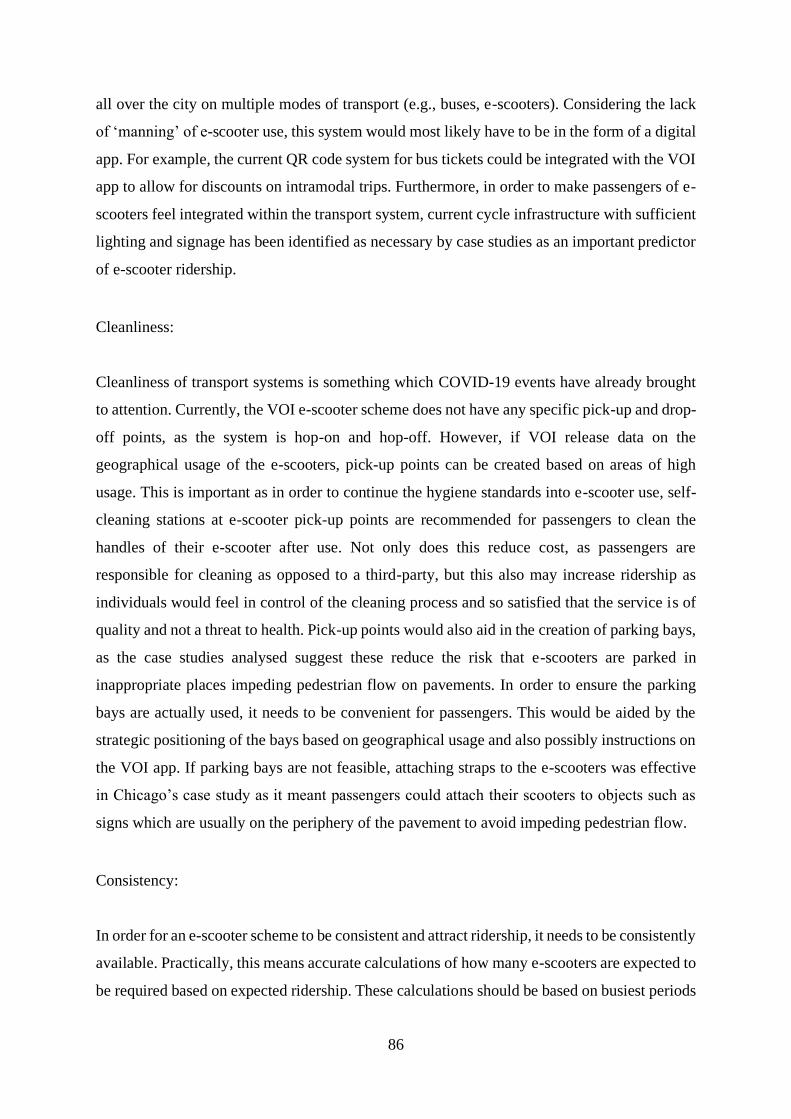
86
all over the city on multiple modes of transport (e.g., buses, e-scooters). Considering the lack
of ‘manning’ of e-scooter use, this system would most likely have to be in the form of a digital
app. For example, the current QR code system for bus tickets could be integrated with the VOI
app to allow for discounts on intramodal trips. Furthermore, in order to make passengers of e-
scooters feel integrated within the transport system, current cycle infrastructure with sufficient
lighting and signage has been identified as necessary by case studies as an important predictor
of e-scooter ridership.
Cleanliness:
Cleanliness of transport systems is something which COVID-19 events have already brought
to attention. Currently, the VOI e-scooter scheme does not have any specific pick-up and drop-
off points, as the system is hop-on and hop-off. However, if VOI release data on the
geographical usage of the e-scooters, pick-up points can be created based on areas of high
usage. This is important as in order to continue the hygiene standards into e-scooter use, self-
cleaning stations at e-scooter pick-up points are recommended for passengers to clean the
handles of their e-scooter after use. Not only does this reduce cost, as passengers are
responsible for cleaning as opposed to a third-party, but this also may increase ridership as
individuals would feel in control of the cleaning process and so satisfied that the service is of
quality and not a threat to health. Pick-up points would also aid in the creation of parking bays,
as the case studies analysed suggest these reduce the risk that e-scooters are parked in
inappropriate places impeding pedestrian flow on pavements. In order to ensure the parking
bays are actually used, it needs to be convenient for passengers. This would be aided by the
strategic positioning of the bays based on geographical usage and also possibly instructions on
the VOI app. If parking bays are not feasible, attaching straps to the e-scooters was effective
in Chicago’s case study as it meant passengers could attach their scooters to objects such as
signs which are usually on the periphery of the pavement to avoid impeding pedestrian flow.
Consistency:
In order for an e-scooter scheme to be consistent and attract ridership, it needs to be consistently
available. Practically, this means accurate calculations of how many e-scooters are expected to
be required based on expected ridership. These calculations should be based on busiest periods
87
and updated regularly in response to changing events and this is particularly relevant in light
of COVID-19 as more individuals will be expected to commute as restrictions ease. The benefit
of implementing e-scooter schemes is that consistency can be tightly controlled unlike other
services which are more susceptible to delay, such as buses. This is as e-scooters do not require
a timetable and so individuals are free to pick up an e-scooter at any point.
Social Safety:
Social safety of e-scooter use is unique to other forms of transport as there is only one passenger
per e-scooter, reducing individuals’ concerns as there is a reduction in the number of people
passengers will come into contact with. However, perhaps social safety concerns may instead
arise from feelings of isolation and vulnerability. In order to address this, it is important that
there is sufficient CCTV at e-scooter pick-up points. The addition of help buttons at pick-up
points may also address social safety concerns, similar to those used in car parks, where
passengers can press the help point to speak to emergency services in the event of an incident.
Furthermore, e-scooter safety concerns have arisen from the passengers themselves when they
are used inappropriately as identified in the case studies. In order to address this, it requires
appropriate law enforcement. Aligning with consensus on dangerous driving of cars, fines for
inappropriate use of e-scooters would need to be implemented. Automatic speed restrictions
on the e-scooters will be able to prevent speeding, however this will not prevent dangerous use
of the e-scooters. Therefore, appropriate fines issued by law enforcement will have to be used.
Due to the reduced quantity of users of e-scooters compared to car users currently, the risk of
receiving a fine may be relatively increased due to law enforcement being able to easily detect
dangerous use in a fewer number of e-scooter users. However, individuals may be less likely
to report dangerous use of e-scooters as there may be more ambiguous social norms (Nordholm,
1975) regarding e-scooters due to their relative infancy. Research agrees that the magnitude of
a fine should increase as the risk of being caught decreases (Polinsky & Shavell, 1979).
Therefore, even though there are a reduced quantity of e-scooters compared to cars, the
ambiguity of social norms regarding reporting dangerous use and the potential increases in e-
scooters in the future, suggests the magnitude of fines should remain equal to that for cars.

88
Bike Lanes:
As demonstrated by the case studies analysed in this report, the presence of bike lanes is an
important predictor of the effectiveness of e-scooter schemes. The success of e-scooter trials
where sufficient bike lanes are present are likely to be explained by the consequential
integration this creates. Integrating the physical infrastructure, as well as the electronic and
financial infrastructure as previously mentioned, allows for e-scooter users to seamlessly
integrate into the current transport network by providing pre-existing routes for e-scooter users
to use.
Table 43: Differentiating Between Impact of Each Policies
Increased Ridership Positive modal shift
Cleanliness One integrated transport system
Social safety Cost schemes
Consistency
Bike Lanes
*Note: “Positive” modal shift refers to displacing high emission modes of transport
(particularly car and taxi/ride-hailing services)
As demonstrated in Table 43, some policies are more suited to targeting a positive modal shift
to specifically encourage car users to switch to e-scooters, whereas some policies are simply
targeted at promoting ridership of the e-scooters. The cost schemes would be of particular
interest to car users, due to the increased cost of running a car, particularly with increasing
charges for electric vehicles soon to be implemented in the UK. Furthermore, an integrated
transport system would also be of particular interest to car users due to the lack of need to park
an e-scooter in a designated space and the reduced physical and psychological distance from a
bus stop in comparison to car parks. The policies outlined to targeted at only promoting
ridership, not specifically generating a positive modal shift, have been selected as e-scooters
are thought to provide more cleanliness and consistency than buses, with social safety being
slightly more unpredictable in its direction. Therefore, in order to generate a positive modal
shift and to generate the most environmentally friendly outcome for the environment, it may
be of more importance to focus on the policies specific for creating a positive modal shift.
89
Operator Choices
The LCA of an e-scooter shows that the largest emissions impact comes from the production
and maintenance of the vehicle itself. While these cannot all be mitigated there are strategies
that the local council and the chosen e-scooter company can cooperate on to achieve lower
emissions and reduced energy consumption. Moreover, the council can maximise the positive
environmental impact of e-scooter schemes by restricting licenses to micro-mobility companies
which adopt sustainable practices.
Extend E-Scooter Lifetime:
This is especially key when considering the LCA of e-scooters, as the longer an e-scooter lasts
without maintenance and repair, the lower the GHG emission and environmental impact. Effort
on the scooter companies part needs to be made to reduce components within the scooter that
have a shorter life span. Within an e-scooter, each individual component is subject to different
rates of quality, and ware and ageing. Therefore, ensuring the supplier favours more durable
vehicles over cheaper and short-lived vehicles is key.
Minimum performance standards should be held to the scooters used within Bath to ensure that
the transport mode remains sustainable. Minimum performance standards can be met by
targeting minimum lifetimes, durability and modular construction. For example, Lime’s latest
generation of e-scooters have been designed to last over a year, and to allow for repair, reuse,
and recycle of parts at end of use. Increased modularity of components, such as the battery,
reduces wastage of components which are not faulty/damaged. Lime have also recorded 97%
landfill diversion after partnering with qualified local recyclers COMET and SNAM.
Moreover, part of the improvements could be anti-tampering features to reduce the number of
vehicles produced. Incentivising such actions may allow companies to take significant action.
Likewise, this can also be met by only offering companies a contract that meets these minimum
performance standards.
E-Scooter Management Requirements:
Imposing a mandatory response time for scooter pick up and maintenance can also help reduce
the environmental-related implications. This can be applied through repositioning the scooter

90
fleet to areas of higher footfall to encourage greater use of their services. This higher usage rate
will help to offset the LCA emissions creating a lower GHG emissions per km ratio than
alternative transport like private cars or buses.
A large component for GHG emissions of an e-scooter comes from the maintenance operations
needed to upkeep the scooters. Close measurement of parameters such as vehicles serviced per
trip and frequency of service should be kept, to ensure there are still environmental benefits for
the modal shift towards micro-mobility.
Integrate E-Scooter Mobility with Public Transport:
Not only will this encourage further usage of the scooters through Bath, creating a discount
scheme for combined usage of public transport and scooters may help to shift main transport
methods from private vehicles. This may help to reduce the number of private cars entering
Bath and therefore the GHG emissions associated with these vehicles. Private vehicles are not
targeted by the new clean air zone in Bath so this can be used as a method to reduce a wider
range of GHG emissions sources.
New policies targeting the integration of public services and e-scooters have the potential to
kick-start higher usage within both sectors. They may also help to alleviate crowded public
transport at peak times, however, adequate road space and safe infrastructure would be a
requirement.
From this assessment coordinated action between councils operating permits for private
companies and the companies themselves are required to ensure the lowest GHG emission and
energy usage per scooter. These proposed strategies aim to help minimise the regulatory duty
and queries held by councils and reduce the cost for servicing and environmental damage
ownership faced by private companies.
Use Electricity Generated Using Renewable Energy Sources:
Requiring e-scooter firms to use 100% renewable electricity can reduce the life cycle GHG
emissions. For example, in the Paris case study, Lime partnered with a local renewable

91
energy supplier (Planete OUI) to ensure that all e-scooters and warehouse operations used
100% renewable electricity sourced from solar, wind, and small hydro projects.
Redistribute E-Scooters Using Low Emissions Vehicles:
The emissions associated with the redistribution of e-scooters can be minimised by using low
emission vehicles. For example, Lime intend to reduce the emissions of their vehicle fleet
(required for collection and redistribution) by increasing the number of cargo bikes used for
light maintenance and rebalancing.
Encourage E-Scooter Firms to Engage in Carbon Offsetting:
E-Scooter companies can compensate for residual emissions (i.e. the unavoidable emissions
from e-scooter production and disposal) by purchasing carbon offsets. For example, Lime
invest in “carbon offsetting” to “neutralise vehicle emissions that can’t be eliminated” (Lime,
2019a). Essentially, Lime considers their vehicle to be “carbon-neutral” because, although their
operation is not carbon-neutral, they include the emissions savings associated with “Green
projects” they invest in - such as a Gold Standard community water filtration project in
Ethiopia.
Requiring a certain carbon saving would encourage companies to decide whether it is more/less
costly to purchase carbon offsets instead of improving the sustainability of their practices (e.g.
by using 100% renewable electricity). Theoretically, an economist expects this arrangement to
maximise social welfare.
Increase the Size of E-Scooter Wheels:
Increasing the size of e-scooter wheels supposedly increases e-scooter safety. Hence, requiring
micro-mobility companies to increase the size of their wheels can lead to a decrease in net
additional fatalities without affecting net environmental impact.
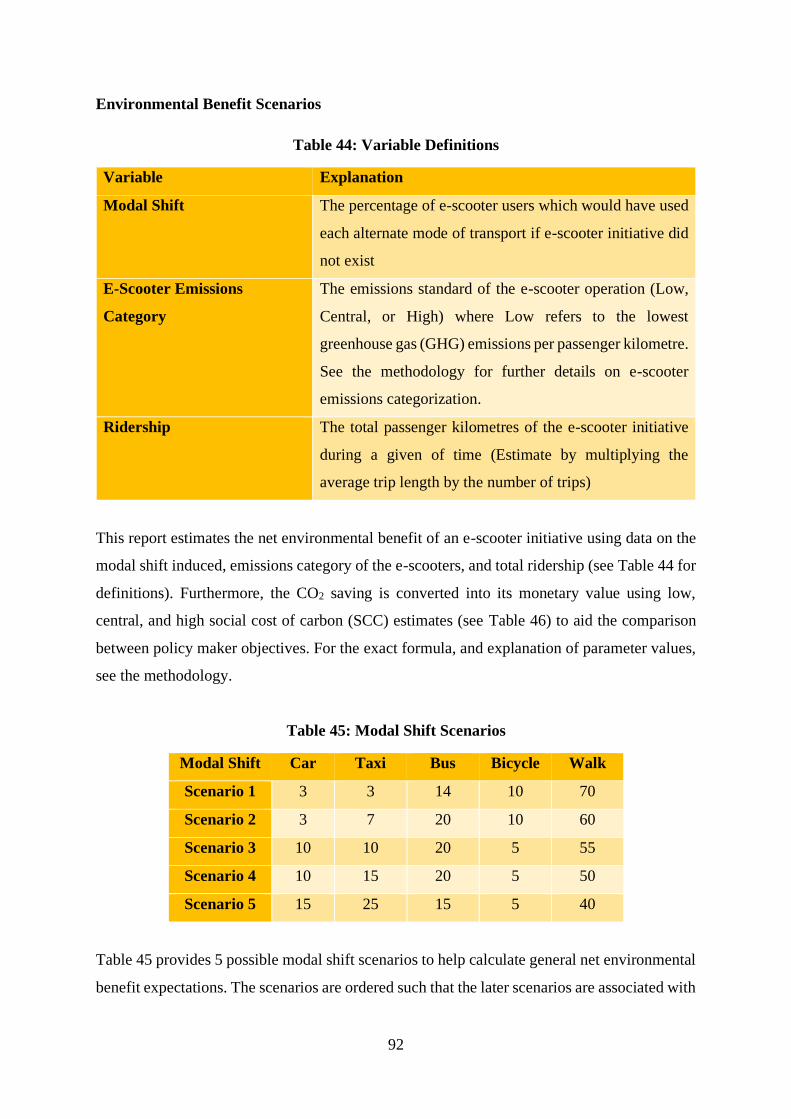
92
Environmental Benefit Scenarios
Table 44: Variable Definitions
Variable Explanation
Modal Shift The percentage of e-scooter users which would have used
each alternate mode of transport if e-scooter initiative did
not exist
E-Scooter Emissions
Category
The emissions standard of the e-scooter operation (Low,
Central, or High) where Low refers to the lowest
greenhouse gas (GHG) emissions per passenger kilometre.
See the methodology for further details on e-scooter
emissions categorization.
Ridership The total passenger kilometres of the e-scooter initiative
during a given of time (Estimate by multiplying the
average trip length by the number of trips)
This report estimates the net environmental benefit of an e-scooter initiative using data on the
modal shift induced, emissions category of the e-scooters, and total ridership (see Table 44 for
definitions). Furthermore, the CO2 saving is converted into its monetary value using low,
central, and high social cost of carbon (SCC) estimates (see Table 46) to aid the comparison
between policy maker objectives. For the exact formula, and explanation of parameter values,
see the methodology.
Table 45: Modal Shift Scenarios
Modal Shift Car Taxi Bus Bicycle Walk
Scenario 1 3 3 14 10 70
Scenario 2 3 7 20 10 60
Scenario 3 10 10 20 5 55
Scenario 4 10 15 20 5 50
Scenario 5 15 25 15 5 40
Table 45 provides 5 possible modal shift scenarios to help calculate general net environmental
benefit expectations. The scenarios are ordered such that the later scenarios are associated with
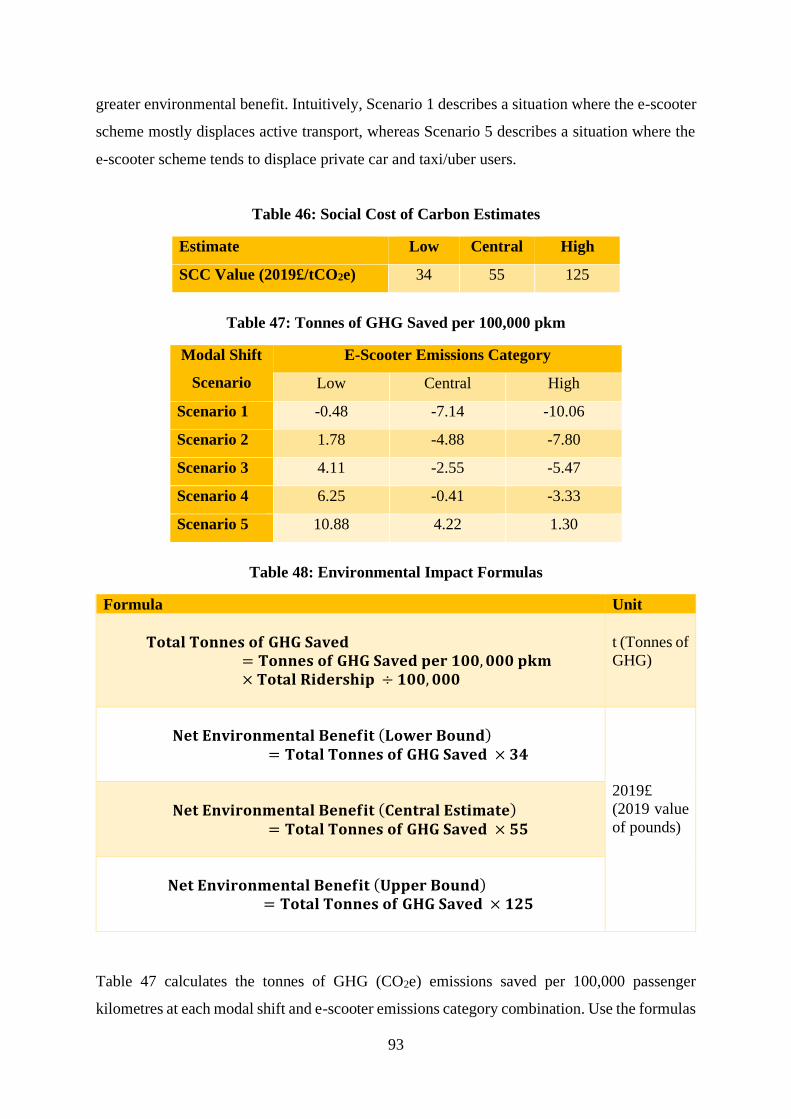
93
greater environmental benefit. Intuitively, Scenario 1 describes a situation where the e-scooter
scheme mostly displaces active transport, whereas Scenario 5 describes a situation where the
e-scooter scheme tends to displace private car and taxi/uber users.
Table 46: Social Cost of Carbon Estimates
Estimate Low Central High
SCC Value (2019£/tCO2e) 34 55 125
Table 47: Tonnes of GHG Saved per 100,000 pkm
Modal Shift
Scenario
E-Scooter Emissions Category
Low Central High
Scenario 1 -0.48 -7.14 -10.06
Scenario 2 1.78 -4.88 -7.80
Scenario 3 4.11 -2.55 -5.47
Scenario 4 6.25 -0.41 -3.33
Scenario 5 10.88 4.22 1.30
Table 48: Environmental Impact Formulas
Formula Unit
𝐓𝐨𝐭𝐚𝐥 𝐓𝐨𝐧𝐧𝐞𝐬 𝐨𝐟 𝐆𝐇𝐆 𝐒𝐚𝐯𝐞𝐝= 𝐓𝐨𝐧𝐧𝐞𝐬 𝐨𝐟 𝐆𝐇𝐆 𝐒𝐚𝐯𝐞𝐝 𝐩𝐞𝐫 𝟏𝟎𝟎, 𝟎𝟎𝟎 𝐩𝐤𝐦 × 𝐓𝐨𝐭𝐚𝐥 𝐑𝐢𝐝𝐞𝐫𝐬𝐡𝐢𝐩 ÷ 𝟏𝟎𝟎, 𝟎𝟎𝟎
t (Tonnes of
GHG)
𝐍𝐞𝐭 𝐄𝐧𝐯𝐢𝐫𝐨𝐧𝐦𝐞𝐧𝐭𝐚𝐥 𝐁𝐞𝐧𝐞𝐟𝐢𝐭 (𝐋𝐨𝐰𝐞𝐫 𝐁𝐨𝐮𝐧𝐝)= 𝐓𝐨𝐭𝐚𝐥 𝐓𝐨𝐧𝐧𝐞𝐬 𝐨𝐟 𝐆𝐇𝐆 𝐒𝐚𝐯𝐞𝐝 × 𝟑𝟒
2019£
(2019 value
of pounds)
𝐍𝐞𝐭 𝐄𝐧𝐯𝐢𝐫𝐨𝐧𝐦𝐞𝐧𝐭𝐚𝐥 𝐁𝐞𝐧𝐞𝐟𝐢𝐭 (𝐂𝐞𝐧𝐭𝐫𝐚𝐥 𝐄𝐬𝐭𝐢𝐦𝐚𝐭𝐞)
= 𝐓𝐨𝐭𝐚𝐥 𝐓𝐨𝐧𝐧𝐞𝐬 𝐨𝐟 𝐆𝐇𝐆 𝐒𝐚𝐯𝐞𝐝 × 𝟓𝟓
𝐍𝐞𝐭 𝐄𝐧𝐯𝐢𝐫𝐨𝐧𝐦𝐞𝐧𝐭𝐚𝐥 𝐁𝐞𝐧𝐞𝐟𝐢𝐭 (𝐔𝐩𝐩𝐞𝐫 𝐁𝐨𝐮𝐧𝐝)= 𝐓𝐨𝐭𝐚𝐥 𝐓𝐨𝐧𝐧𝐞𝐬 𝐨𝐟 𝐆𝐇𝐆 𝐒𝐚𝐯𝐞𝐝 × 𝟏𝟐𝟓
Table 47 calculates the tonnes of GHG (CO2e) emissions saved per 100,000 passenger
kilometres at each modal shift and e-scooter emissions category combination. Use the formulas
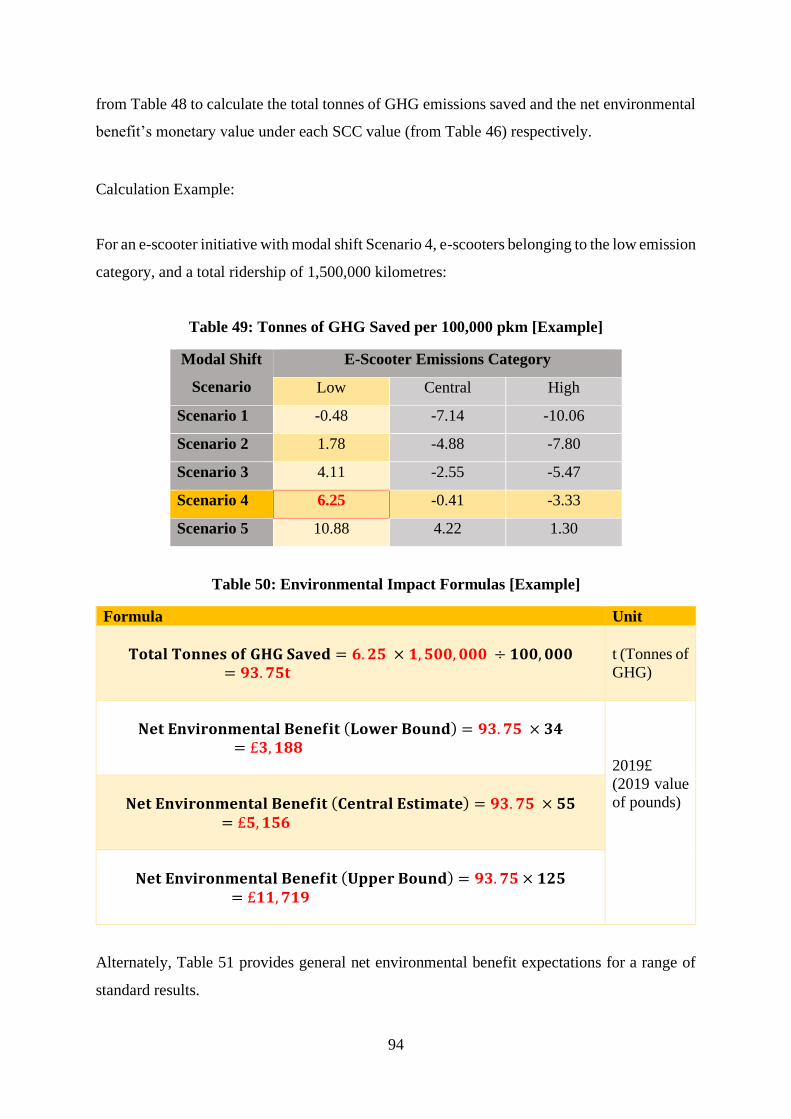
94
from Table 48 to calculate the total tonnes of GHG emissions saved and the net environmental
benefit’s monetary value under each SCC value (from Table 46) respectively.
Calculation Example:
For an e-scooter initiative with modal shift Scenario 4, e-scooters belonging to the low emission
category, and a total ridership of 1,500,000 kilometres:
Table 49: Tonnes of GHG Saved per 100,000 pkm [Example]
Modal Shift
Scenario
E-Scooter Emissions Category
Low Central High
Scenario 1 -0.48 -7.14 -10.06
Scenario 2 1.78 -4.88 -7.80
Scenario 3 4.11 -2.55 -5.47
Scenario 4 6.25 -0.41 -3.33
Scenario 5 10.88 4.22 1.30
Table 50: Environmental Impact Formulas [Example]
Formula Unit
𝐓𝐨𝐭𝐚𝐥 𝐓𝐨𝐧𝐧𝐞𝐬 𝐨𝐟 𝐆𝐇𝐆 𝐒𝐚𝐯𝐞𝐝 = 𝟔. 𝟐𝟓 × 𝟏, 𝟓𝟎𝟎, 𝟎𝟎𝟎 ÷ 𝟏𝟎𝟎, 𝟎𝟎𝟎= 𝟗𝟑. 𝟕𝟓𝐭
t (Tonnes of
GHG)
𝐍𝐞𝐭 𝐄𝐧𝐯𝐢𝐫𝐨𝐧𝐦𝐞𝐧𝐭𝐚𝐥 𝐁𝐞𝐧𝐞𝐟𝐢𝐭 (𝐋𝐨𝐰𝐞𝐫 𝐁𝐨𝐮𝐧𝐝) = 𝟗𝟑. 𝟕𝟓 × 𝟑𝟒= £𝟑, 𝟏𝟖𝟖
2019£
(2019 value
of pounds)
𝐍𝐞𝐭 𝐄𝐧𝐯𝐢𝐫𝐨𝐧𝐦𝐞𝐧𝐭𝐚𝐥 𝐁𝐞𝐧𝐞𝐟𝐢𝐭 (𝐂𝐞𝐧𝐭𝐫𝐚𝐥 𝐄𝐬𝐭𝐢𝐦𝐚𝐭𝐞) = 𝟗𝟑. 𝟕𝟓 × 𝟓𝟓= £𝟓, 𝟏𝟓𝟔
𝐍𝐞𝐭 𝐄𝐧𝐯𝐢𝐫𝐨𝐧𝐦𝐞𝐧𝐭𝐚𝐥 𝐁𝐞𝐧𝐞𝐟𝐢𝐭 (𝐔𝐩𝐩𝐞𝐫 𝐁𝐨𝐮𝐧𝐝) = 𝟗𝟑. 𝟕𝟓 × 𝟏𝟐𝟓= £𝟏𝟏, 𝟕𝟏𝟗
Alternately, Table 51 provides general net environmental benefit expectations for a range of
standard results.

95
Table 51:Standard Net Environmental Benefit Expectations
Ridership (Above) and GHG Emissions Measure (Below)
100,000 (pkm) 500,000 (pkm)
Tonnes
(tCO2e)
SCC (2019£) Tonnes
(tCO2e)
SCC (2019£)
Low Central High Low Central High
E-S
coote
r E
mis
sion
s C
ate
gory (
Left
)
an
d M
od
al
Sh
ift
Scen
ario
(R
igh
t)
Hig
h
1 -10.06 -342 -553 -1,336 -50.31 -1,711 -2,767 -6,681
2 -7.80 -265 -429 -1,036 -39.02 -1,327 -2,146 -5,181
3 -5.47 -186 -301 -726 -27.35 -930 -1,504 -3,632
4 -3.33 -113 -183 -442 -16.66 -566 -916 -2,212
5 1.30 44 71 172 6.49 221 357 862
Cen
tral
1 -7.14 -243 -393 -948 -35.71 -1,214 -1,964 -4,742
2 -4.88 -166 -269 -648 -24.42 -830 -1,343 -3,242
3 -2.55 -87 -140 -339 -12.75 -434 -701 -1,694
4 -0.41 -14 -23 -55 -2.06 -70 -113 -274
5 4.22 143 232 560 21.09 717 1,160 2,801
Low
1 -0.48 -16 -27 -64 -2.41 -82 -133 -320
2 1.78 60 98 236 8.88 302 489 1,180
3 4.11 140 226 546 20.55 699 1,130 2,729
4 6.25 212 344 830 31.24 1,062 1,718 4,149
5 10.88 370 598 1,445 54.39 1,849 2,991 7,223
Ridership (Above) and GHG Emissions Measure (Below)
1,000,000 (pkm) 1500,000 (pkm)
Tonnes
(tCO2e)
SCC (2019£) Tonnes
(tCO2e)
SCC (2019£)
Low Central High Low Central High
E-S
co
ote
r E
mis
sio
ns
Ca
teg
ory
(L
eft
)
an
d M
od
al
Sh
ift
Scen
ario
(R
igh
t)
Hig
h
1 -100.62 -3,421 -5,534 -13,363 -150.93 -5,132 -8,301 -20,044
2 -78.03 -2,653 -4,292 -10,363 -117.05 -3,980 -6,438 -15,544
3 -54.71 -1,860 -3,009 -7,265 -82.06 -2,790 -4,513 -10,897
4 -33.32 -1,133 -1,833 -4,425 -49.98 -1,699 -2,749 -6,637
5 12.98 441 714 1,724 19.47 662 1,071 2,586
Cen
tral
1 -71.42 -2,428 -3,928 -9,485 -107.13 -3,643 -5,892 -14,227
2 -48.83 -1,660 -2,686 -6,485 -73.25 -2,490 -4,029 -9,727
3 -25.51 -867 -1,403 -3,387 -38.26 -1,301 -2,104 -5,081
4 -4.12 -140 -227 -547 -6.18 -210 -340 -821
5 42.18 1,434 2,320 5,602 63.27 2,151 3,480 8,402
Low
1 -4.82 -164 -265 -640 -7.23 -246 -398 -961
2 17.77 604 977 2,360 26.65 906 1,466 3,540
3 41.10 1,397 2,260 5,457 61.64 2,096 3,390 8,186
4 62.48 2,124 3,436 8,297 93.72 3,186 5,155 12,446
5 108.78 3,699 5,983 14,446 163.17 5,548 8,974 21,669
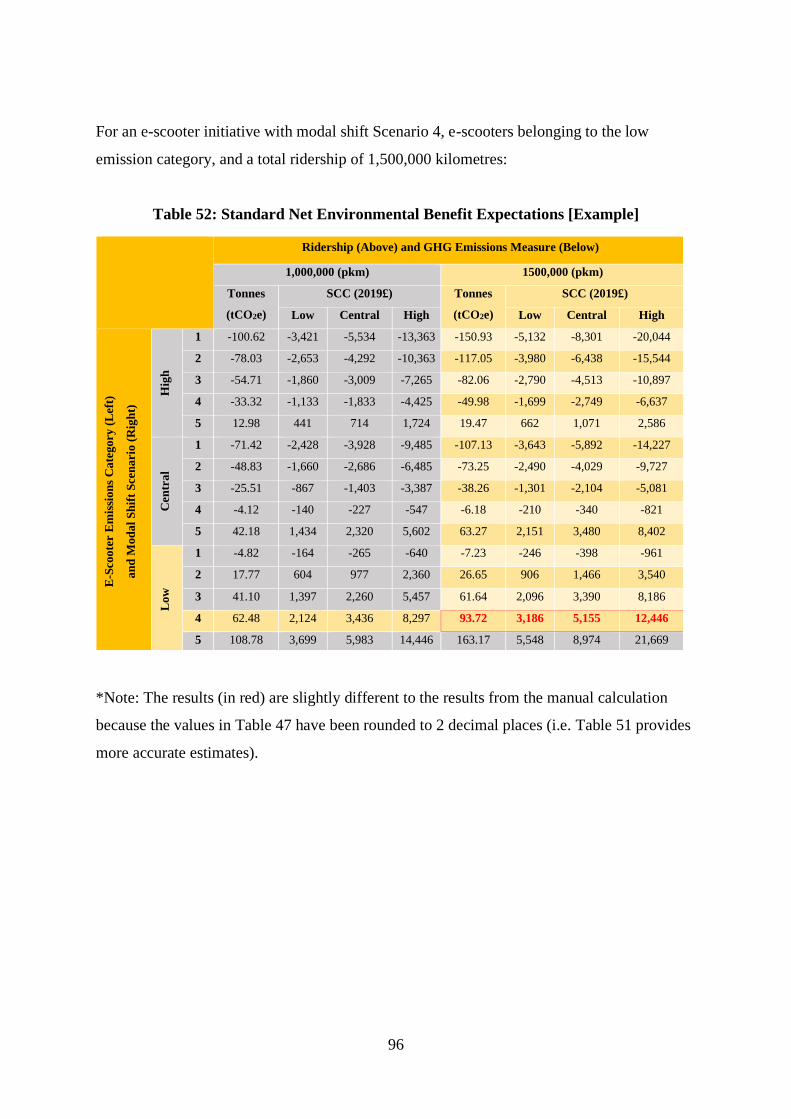
96
For an e-scooter initiative with modal shift Scenario 4, e-scooters belonging to the low
emission category, and a total ridership of 1,500,000 kilometres:
Table 52: Standard Net Environmental Benefit Expectations [Example]
*Note: The results (in red) are slightly different to the results from the manual calculation
because the values in Table 47 have been rounded to 2 decimal places (i.e. Table 51 provides
more accurate estimates).
Ridership (Above) and GHG Emissions Measure (Below)
1,000,000 (pkm) 1500,000 (pkm)
Tonnes
(tCO2e)
SCC (2019£) Tonnes
(tCO2e)
SCC (2019£)
Low Central High Low Central High
E-S
coote
r E
mis
sion
s C
ate
gory (
Left
)
an
d M
od
al
Sh
ift
Scen
ario
(R
igh
t)
Hig
h
1 -100.62 -3,421 -5,534 -13,363 -150.93 -5,132 -8,301 -20,044
2 -78.03 -2,653 -4,292 -10,363 -117.05 -3,980 -6,438 -15,544
3 -54.71 -1,860 -3,009 -7,265 -82.06 -2,790 -4,513 -10,897
4 -33.32 -1,133 -1,833 -4,425 -49.98 -1,699 -2,749 -6,637
5 12.98 441 714 1,724 19.47 662 1,071 2,586
Cen
tral
1 -71.42 -2,428 -3,928 -9,485 -107.13 -3,643 -5,892 -14,227
2 -48.83 -1,660 -2,686 -6,485 -73.25 -2,490 -4,029 -9,727
3 -25.51 -867 -1,403 -3,387 -38.26 -1,301 -2,104 -5,081
4 -4.12 -140 -227 -547 -6.18 -210 -340 -821
5 42.18 1,434 2,320 5,602 63.27 2,151 3,480 8,402
Low
1 -4.82 -164 -265 -640 -7.23 -246 -398 -961
2 17.77 604 977 2,360 26.65 906 1,466 3,540
3 41.10 1,397 2,260 5,457 61.64 2,096 3,390 8,186
4 62.48 2,124 3,436 8,297 93.72 3,186 5,155 12,446
5 108.78 3,699 5,983 14,446 163.17 5,548 8,974 21,669

97
References
[Babidge et al., 2018] Babidge, S., Bolados, P. F. L. & Fabricant, N., 2018. Neoextractivism
and indigenous water ritual in salar de Atacama, Chile. Latin American perspectives, 45(5),
pp. 170-185.
[Baruya, 1998] Baruya, A. 1998. Speed-accident relationships on European roads. In 9th
International Conference on Road Safety in Europe (pp. 1-19).
[Batty et al., 2015] Batty, P., Palacin, R., & González-Gil, A. 2015. Challenges and
opportunities in developing urban modal shift. Travel Behaviour and Society, 2(2), 109-123.
[BEIS, 2019] Department for Business, Energy & Industrial Strategy. 2019. VALUATION OF
ENERGY USE AND GREENHOUSE GAS: Supplementary guidance to the HM Treasury
Green Book on Appraisal and Evaluation in Central Government. Retrieved from:
https://www.gov.uk/government/publications/valuation-of-energy-use-and-greenhouse-gas-
emissions-for-appraisal
[BEIS, 2020] Department for Energy, Business and Industrial Strategy. 2020. 2019 UK
greenhouse gas emissions, provisional figures. [online] Assets.publishing.service.gov.uk.
Retrieved from:
https://assets.publishing.service.gov.uk/government/uploads/system/uploads/attachment_data
/file/875485/2019_UK_greenhouse_gas_emissions_provisional_figures_statistical_release.pd
f
[Bird, 2019] Bird Cities Blog. 2019. Bird’s Sustainable Impact. Retrieved from:
https://www.bird.co/blog/birds-sustainable-impact/
[BoE, 2020] Bank of England. Accessed: 07/12/2020. Inflation calculator. Retrieved from:
https://www.bankofengland.co.uk/monetary-policy/inflation/inflation-calculator
[Brussels, 2021] Visit Brussels webpage. Accessed: 18/02/2021. Alternative Mobility.
Retrieved from: https://www.brussels.be/alternative-mobility
98
[Brussels Times, 2020] The Brussels Times Article. 28/01/2020. Dott and Lime are the biggest
on Brussels scooter market. Retrieved from: https://www.brusselstimes.com/news/belgium-
all-news/92365/dott-lime-account-for-the-bulk-of-the-brussels-scooter-market-bird/
[B&NES, 2020] Bath & North East Somerset Council. 2020. Bath's Clean Air Zone | Bath and
North East Somerset Council. Retrieved from: https://beta.bathnes.gov.uk/bath-clean-air-zone
[Census, 2019] Census Reporter. 2019. Los Angeles County, CA. Retrieved from:
https://censusreporter.org/profiles/16000US0644000-los-angeles-ca/
[Chicago, 2020a] City of Chicago - Mayor Lori Lightfoot. 2020. E-scooter Pilot Evaluation.
Retrieved from: https://www.chicago.gov/content/dam/city/depts/cdot/Misc/EScooters/E-
Scooter_Pilot_Evaluation_2.17.20.pdf
[Chicago, 2020b] Chicago. 2020. 2020 E-scooter Pilot Purpose and Objectives. Retrieved
from:
https://www.chicago.gov/content/dam/city/depts/cdot/Misc/EScooters/2020/2020%20Chicag
o%20E-scooter%20Pilot%20Purpose%20and%20Objectives.pdf
[Chicago, 2020c] Chicago. 2020. 2020 E-scooter Pilot. Retrieved from:
https://www.chicago.gov/content/dam/city/depts/cdot/Misc/EScooters/2020/Chicago%20202
0%20E-Scooter%20Pilot%20Map.pdf
[Chicago, 2020d] Chicago. 2020. Chicago 2020 E-scooter Pilot: Mid-Pilot Report (Aug 12 –
Oct 12). Retrieved from:
https://www.chicago.gov/content/dam/city/depts/cdot/Misc/EScooters/2020/2020%20Chicag
o%20E-scooter%20Pilot%20Mid-Pilot%20Report%20(10-12-20).pdf
[Chicago, 2020e] Chicago Transportation Website. 2020. City of Chicago Launches 2020
Shared E-Scooter Pilot Program with Enhanced Focus on Equity and Safety. Retrieved from:
https://www.chicago.gov/city/en/depts/cdot/provdrs/bike/news/2020/august/city-of-chicago-
launches-2020-shared-e-scooter-pilot-program-wit.html

99
[Chicago, 2021] Chicago Transportation Website. Accessed 25/02/2021. E-Scooter Share Pilot
Program. Retrieved from: https://www.chicago.gov/city/en/depts/cdot/supp_info/escooter-
share-pilot-
project.html#:~:text=The%20City%20of%20Chicago%20granted,%3A%20Bird%2C%20Li
me%20and%20Spin.&text=Each%20company%20was%20allowed%20to,total%20of%2010
%2C000%20scooters%20citywide
[Cities Today, 2020] Cities today article. 2020. How Lisbon is reshaping its mobility
landscape. Retrieved from: https://cities-today.com/how-lisbon-is-reshaping-its-mobility-
landscape/
[CPLC, 2017] Carbon Pricing Leadership Coalition. 2017. Report of the High-Level
Commission on Carbon Prices. Retrieved from:
https://static1.squarespace.com/static/54ff9c5ce4b0a53decccfb4c/t/59244eed17bffc0ac256cf1
6/1495551740633/CarbonPricing_Final_May29.pdf
[Currie & Delbosc, 2010] Currie, G., & Delbosc, A. 2010. Exploring public transport usage
trends in an ageing population. Transportation, 37(1), 151-164.
[Currie & Delbosc, 2012] Currie, G., & Delbosc, A. 2012. Modelling the causes and impacts
of personal safety perceptions on public transport ridership. Transport Policy, 24, 302-309.
[Deloitte, 2019a] Deloitte Insights. 2019. Deloitte City Mobility Index: Paris. Retrieved from:
https://www2.deloitte.com/content/dam/insights/us/articles/4331_Deloitte-City-Mobility-
Index/Paris_GlobalCityMobility_WEB.pdf
[Deloitte, 2019b] Deloitte. 2019. Future of Mobility – A New Deal for Mobility in Belgium.
Retrieved from:
https://www2.deloitte.com/content/dam/Deloitte/be/Documents/strategy/FOMBrochureFinal
Version.pdf
[Dijst, 2006] Dijst, M., Limtanakool, N., & Schwanen, T. 2006. The influence of
socioeconomic characteristics, land use and travel time considerations on mode choice for
medium-and longer-distance trips. Journal of transport geography, 14(5), 327-341.

100
[DOT, 2020] Seleta Reynolds, General Manager, Department of Transportation, City of Los
Angeles. 2020. DOCKLESS BIKE/SCOOTER SHARE PILOT PROGRAM UPDATE (CF
#17-1125). Retrieved from: http://clkrep.lacity.org/onlinedocs/2017/17-1125_rpt_DOT_02-
12-2020.pdf
[Dott, 2021a] Ridedott webpage. Accessed: 18/02/2021. Cities. People. Our Planet. Retrieved
from: https://ridedott.com/the-dott-way/belgium
[Dott, 2021b] Ridedott webpage. Accessed: 18/02/2021. E-scooters in Europe: The new
everyday way to travel. Retrieved from: https://ridedott.com/blog/global/e-scooters-in-europe-
the-new-everyday-way-to-travel
[Dott, 2021c] Ridedott webpage. Accessed: 18/02/2021. Why swappable batteries are the way
to go. Retrieved from: https://ridedott.com/blog/global/why-swappable-batteries-are-the-way-
to-go
[Dott, 2021d] Dott FAQ forum post. Accessed: 18/02/2021. How safe are Dott scooters?
Retrieved from: https://help.ridedott.com/hc/en-us/articles/360019153653-How-safe-are-
Dott-scooters-
[DW, 2021] DW article. Accessed: 18/02/2021. Green Cities: Making Brussels fit for walking
and cycling. Retrieved from: https://www.dw.com/en/brussels-green-traffic-urban-planning-
mobility-congestion-european-green-deal/a-52256405
[EC, 2019a] European Commission. 2019. Handbook on the external cost of transport.
Retrieved from: https://op.europa.eu/en/publication-detail/-/publication/9781f65f-8448-11ea-
bf12-01aa75ed71a1
[EC, 2019b] European Comission. 2019. Mobility and Transport: Sustainable transport -
Lisbon, Lindau and Greater Manchester win European sustainable mobility awards. Retrieved
from: https://ec.europa.eu/transport/themes/sustainable/news/2019-03-21-sustainable-
mobility-award-winners_en
101
[EFRA, 2020] Department for Environment, Food & Rural Affairs. 2020. Clean Air Zones.
Retrieved from: https://www.gov.uk/guidance/driving-in-a-clean-air-zone
[Evans, 2020] S, Evans. 2020. Analysis: UK’s CO2 emissions have fallen 29% over the past
decade. Retrieved from: https://www.carbonbrief.org/analysis-uks-co2-emissions-have-fallen-
29-per-cent-over-the-past-decade
[Foote, 2004] Foote, P. J. 2004. Making buses better in Chicago: strategic implementation of
customer-derived performance measures from 1995 to 2001. Transportation research record,
1884(1), 18-26.
[Goodman and Lovelace, 2017] Goodman, A. and Lovelace, R. 2017. Propensity to Cycle
Tool. Retrieved from: https://www.pct.bike/m/?r=avon
[Gossling,2020] Gössling, S. 2020. Integrating e-scooters in urban transportation: problems,
policies, and the prospect of system change. Transportation Research Part D: Transport and
Environment, 79, https://doi.org/10.1016/j.trd.2020.102230
[Gruber et al., 2011] Gruber, et al. 2011. Global lithium availability. Journal of industrial
ecology, 15(5), pp. 760-775.
[Hollingsworth et al, 2019] Joseph Hollingsworth, Brenna Copeland, and Jeremiah X
Johnson. 2019. Are e-scooters polluters? The environmental impacts of shared dockless electric
scooters. Retrieved from: https://iopscience.iop.org/article/10.1088/1748-9326/ab2da8/pdf
[Hölscher et al., 2011] Hölscher, C., Tenbrink, T., & Wiener, J. M. 2011. Would you follow
your own route description? Cognitive strategies in urban route planning. Cognition, 121(2),
228-247.
[Inflation Tool, 2020] Inflation Tool. Accessed 07/12/2020. Inflation Calculator. Retrieved
from: https://www.inflationtool.com/euro
[INRIX, 2020] INRIX webpage. 2020. INRIX 2020 Global Traffic Scorecard. Retrieved from:
https://inrix.com/scorecard/

102
[Intelligent Transport, 2020] Intelligent Transport Article. 2020. Dott, Tier and Voi commit
to higher e-scooter standards. Retrieved from: https://www.intelligenttransport.com/transport-
news/102774/dott-tier-and-voi-commit-to-higher-e-scooter-standards/
[ITF, 2019] International Transport Forum. 2019. Road Safety in European Cities -
Performance Indicators and Governance Solutions. Retrieved from: https://www.oecd-
ilibrary.org/docserver/ad4de8a1-
en.pdf?expires=1616257146&id=id&accname=guest&checksum=3C03DF5FB751B38BA06
9E8A01D8EA6D1
[ITF, 2020a] International Transport Forum. 2020. Safe Micro mobility. Retrieved from:
https://www.itf-oecd.org/sites/default/files/docs/safe-micromobility_1.pdf
[ITF, 2020b] International Transport Forum. 2020. Good to Go? – Assessing the
Environmental Performance of New Mobility. Retrieved from: https://www.itf-
oecd.org/sites/default/files/docs/environmental-performance-new-
mobility.pdf#page=40&zoom=100,84,256
[LADOT, 2020] LADOT. 2020. YEAR ONE SNAPSHOT - A review of the 2019-2020 dock-
less vehicle pilot program. Retrieved from:
https://ladot.lacity.org/sites/default/files/documents/ladot-dockless-year-one-report.pdf
[Lime, 2019a] Lime. 2020. Lime for Sustainable Pair: A study on Lime’s Environmental
Impact In Paris, 2018-2019. Retrieved from:
https://www.li.me/hubfs/Assets/LIME_ENG_Paris%20Sustainability%20Report_11OCT201
9_RGB.pdf
[Lime, 2019b] Lime – 2nd Street Website Article. 2019. Lime President Reinforces
Commitment to 100% Renewable Energy, Carbon Neutrality. Retrieved from:
https://www.li.me/second-street/lime-reinforces-commitment-100-renewable-energy-carbon-
neutrality

103
[Lime, 2019c] 2nd Street, Lime. 2019. Scooters Mark First Year In Portugal With 120 Tonnes
Of CO2 Prevented. Retrieved from: https://www.li.me/second-street/scooters-first-year-
portugal-120-tonnes-co2-
prevented#:~:text=Cities%20%7C%20October%2014%2C%202019%20%7C%20Share&tex
t=The%20country%20has%20seen%20more,Lime's%20inaugural%20launch%20in%20Lisb
on
[Marazuela et al., 2019] Marazuela, et al. 2019. The effect of brine pumping on the natural
hydrodynamics of the Salar de Atacama: the damping capacity of salt flats. The Science of the
total environment, Volume 654, pp. 1118-1131.
[Martin et al., 2019] Martin, G., Rentsch, L., Hock, M. & Bertau, M., 2017. Lithium market
research – global supply, future demand and price development. Energy Storage Mater,
Volume 6, pp. 171-179.
[NAEI, 2018] UK National Atmospheric Emissions Inventory. 2018. UK Emissions
Interactive Map. Retrieved from: https://naei.beis.gov.uk/emissionsapp/
[Nordholm, 1975] Nordholm, L. A. (1975). Effects of group size and stimulus ambiguity on
conformity. The Journal of Social Psychology, 97(1), 123-130.
[OECD, 2020] Organisation for Economic Co-operation and Development. Accessed:
07/12/2020. Purchasing Power Parities (PPP). Retrieved from:
https://data.oecd.org/conversion/purchasing-power-parities-ppp.htm#indicator-chart
[ONS, 2011] Office for National Statistics. 2011. Census geography - Office for National
Statistics. Retrieved from:
https://www.ons.gov.uk/methodology/geography/ukgeographies/censusgeography
[Ortar & Ryghaug, 2019] Ortar, N., & Ryghaug, M. 2019. Should all cars be electric by 2025?
The electric car debate in Europe. Sustainability, 11(7), 1868.
104
[Pindyck, 2019] Robert Pindyck. 2019. The Social Cost of Carbon Revisited. Journal of
Environmental Economics and Management. Volume 94. Pages 140-160. Retrieved from:
http://web.mit.edu/rpindyck/www/Papers/SCCRevisitedJEEM2019.pdf
[Polinsky & Shavell, 1979] Polinsky, A. M., & Shavell, S. 1979. The optimal trade-off
between the probability and magnitude of fines. The American Economic Review, 69(5), 880-
891.
[Ramos, 2019] Ramos, S., Vicente, P., Passos, A. M., Costa, P., & Reis, E. 2019. Perceptions
of the public transport service as a barrier to the adoption of public transport: A qualitative
study. Social Sciences, 8(5), 150.
[Ricke et al, 2018] Ricke, K., Drouet, L., Caldeira, K. et al. Country-level social cost of carbon.
Nature Climate Change 8, 895–900 (2018). https://www.nature.com/articles/s41558-018-
0282-y
[RFF, 2019] Resources for the Future. 2019. Social Cost of Carbon 101: A review of the social
cost of carbon, from a basic definition to the history of its use in policy analysis. Retrieved
from: https://www.rff.org/publications/explainers/social-cost-carbon-101/
[Sharaby & Shiftan, 2012] Sharaby, N., & Shiftan, Y. 2012. The impact of fare integration
on travel behavior and transit ridership. Transport Policy, 21, 63-70.
[Skinner, 1971] Skinner, B. F. 1971. Operant conditioning. The encyclopaedia of education,
7, 29-33.
[Soza-Parra et al., 2019] Soza-Parra, J., Raveau, S., Muñoz, J. C., & Cats, O. 2019. The
underlying effect of public transport reliability on users’ satisfaction. Transportation Research
Part A: Policy and Practice, 126, 83-93.
[Spin, 2020] Spin Blog Post. 2020. Carbon Negative: Introducing Our Plan to Achieve Net
Negative Emissions by 2025. Retrieved from: https://blog.spin.pm/carbon-negative-
introducing-our-plan-to-achieve-net-negative-emissions-by-2025-fc18e76c1c08
105
[Sun et al., 2014] Sun, L., Jin, J. G., Lee, D. H., Axhausen, K. W., & Erath, A. 2014. Demand-
driven timetable design for metro services. Transportation Research Part C: Emerging
Technologies, 46, 284-299.
[Tahmasseby, 2009] Tahmasseby, S. 2009. Reliability in urban public transport network
assessment and design.
[Tol, 2019] Richard S.J. Tol. 2019. A social cost of carbon for (almost) every country. Energy
Economics. Volume 83. Pages 555-566. Retrieved from:
http://www.sciencedirect.com/science/article/pii/S014098831930218X
[TomTom, 2021] TomTom webpage. Accessed: 18/02/2021. Brussels Traffic. Retrieved from:
https://www.tomtom.com/en_gb/traffic-index/brussels-traffic/
[Tran et al., 2012] Tran, M., Banister, D., Bishop, J. & McCulloch, M. D., 2012. Realizing
the electric-vehicle revolution. Nature Climate Change, 2(5), p. 328=333.
[US Inflation Calculator, 2020] US Inflation Calculator. Accessed 07/12/2020. Inflation
Calculator. Retrieved from: https://www.usinflationcalculator.com/
[Voi, 2021] Voi. Accessed on: 14/03/2021. VOI. - frequently asked questions. Retrieved from:
https://www.voiscooters.com/faq
[Wagner, 2020] I, Wagner. 2020. Replacement for various means of transport by e-scooters in
Brussels (Belgium) 2019. Retrieved from:
https://www.statista.com/statistics/1169427/replacement-for-various-means-of-transport-by-
e-scooters-in-brussels/#statisticContainer
[Wener et al., 2003] Wener, R. E., Evans, G. W., Phillips, D., & Nadler, N. 2003. Running for
the 7: 45: The effects of public transit improvements on commuter stress. Transportation, 30(2),
203-220.
[6t-bureau, 2019] 6t-bureau de recherche. 2019. Uses and Users of Free-floating Electric
Scooters in France. Retrieved from: https://6-t.co/en/free-floating-escooters-france/