Embed Size (px)
Citation preview
JISTEM Revista de Gestão da Tecnologia e Sistemas de Informação Journal of Information Systems and Technology Management Vol. 8, No. 2, 2011, p. 367-388 ISSN online: 1807-1775 DOI: 10.4301/S1807-17752011000200006
_____________________________________________________________________________________ Recebido em/Manuscript first received: 25/11/2008 - 21/12/2009 Aprovado em/Manuscript accepted: 20/02/2011
Endereço para correspondência/ Address for correspondence
Alexandre Pereira Salgado Junior- FEARP-Faculdade de Economia, Administração e Contabilidade de Ribeirão Preto Departamento de Administração PAPO-Programa de Apoio à Produção e Operações http://www.fearp.usp.br/papo +55 (16) 9119-5141 E-mail: [email protected]
Juliana Chiaretti Novi - Faculdade de Economia, Administração e Contabilidade de Ribeirão Preto E-mail: [email protected]
Marcio Mattos Borges de Oliveira - Faculdade de Economia, Administração e Contabilidade de Ribeirão Preto E-mail: [email protected]
Antonio Carlos Pacagnella Junior - Universidade Federal de São Carlos – UFSCar E-mail: [email protected]
ISSN online: 1807-1775 Publicado por/Published by: TECSI FEA USP – 2011
E-SCM AND INVENTORY MANAGEMENT: A STUDY OF MULTIPLE CASES IN A SEGMENT OF THE DEPARTMENT STORE CHAIN
O E-SCM E A GESTÃO DOS ESTOQUES: UM ESTUDO DE MÚLTIPLOS CASOS EM UM SEGMENTO DE CADEIA DE LOJAS DE DEPARTAMENTO
Alexandre Pereira Salgado Junior Universidade de São Paulo USP, SP, Brazil Juliana Chiaretti Novi Universidade de São Paulo USP, SP, Brazil Antonio Carlos Pacagnella Junior Universidade Federal de São Carlos – UFSCar Marcio Mattos Borges de Oliveira Universidade de São Paulo USP, SP, Brazil _____________________________________________________________________________________
ABSTRACT
Inventory management through the supply chains is a theme that has always enticed managers throughout the world. Due to the increase in market competitiveness and complexity, the traditional statistical models of forecasting demand, based on time series, no longer met the needs imposed on businesses to maintain adequate levels of their inventory and supply interruptions. With the intent to meet these market demands, ERP systems appeared in the 1990’s. Nevertheless, even if allowing for a more adequate level of inventory and supply interruptions achieved mainly by the optimization of internal processes and the reduction in lead time, ERP systems did not contribute to reach the SCM’s desired levels of inventory that were aimed at by the more competitive businesses. This is because ERP limits itself to an internal analysis of the business. By contrast, inventory management depends on the consumption information (which is external to the business). Aiming to improve even further the level of
368 Salgado Junior, A. P., Novi, J. C., Pacagnella Junior, A. C.
Vol.8, No. 2, 2011, p. 367-388
services delivered to the end consumer, new solutions have been developed, among them the e-SCM, which, since it makes consumption information available in real time, ends up being more dynamic and efficient than the traditional demand forecasting models, Therefore, the present study aims to analyze how the e-SCM can collaborate in maintaining adequate levels of inventory and interruptions in the supply chains. The hypothesis made is that the traditional statistical forecasting models, based on time series and isolatedly, are no longer adequate to adjust the demand, as the tools based on these models do not update the demand in real time and this is fundamental in the current business dynamics. The research method used was the study of multiple cases in a segment of a chain involving a large retailer, its Distribution Center and a supplier of home appliances. For the analysis of the data, the content analysis technique was used. As main results, it was observed that, after the integration of the chain segment by the e-SCM, there was a reduction in the level of the inventory (36.8% in retail and 18% in the industry) and in inventory turnover (from 18.3 to 5.1 days in retail and from 19.6 to 3.2 days in the Distribution Center), aside from the variation in the interruption (from 17.3% to 2.6% in retail and from 3% to 0.1% in the case of the Distribution Center). Therefore, the study brings forth strong indication that the integration of the chain through the e-SCM, may contribute to the SCM’s competitiveness.
Keywords: e-SCM. Demand Forecast. Department Stores. Level of logistical services.
RESUMO
A gestão dos estoques ao longo da cadeia de suprimentos é um tema que sempre instigou gestores por todo o mundo. Com o aumento da competitividade e da complexidade dos mercados, os tradicionais modelos estatísticos de previsão da demanda, fundamentados em séries temporais, não mais atendiam as necessidades impostas às empresas na adequação de seus níveis de estoques e ruptura. No intuito de atender essas exigências do mercado surgem, nos anos 1990, os sistemas ERP. Entretanto, mesmo possibilitando uma adequação nos estoques e na ruptura, levado principalmente pela otimização dos processos internos e redução do lead time, os ERP não contribuíram para que o SCM atingisse o nível de estoque almejado pelas empresas mais competitivas. Isso porque o ERP limita-se a análise interna da empresa. Já a gestão dos estoques depende de informações de consumo (que são externas a empresa). Buscando-se melhorar ainda mais os níveis de serviços prestados ao consumidor final, novas soluções foram desenvolvidas, dentre elas, o e-SCM que por disponibilizar a informação do consumo em tempo real, acaba sendo mais dinâmico e eficiente que os modelos tradicionais de previsão da demanda. Dessa forma, o presente estudo objetiva analisar como o e-SCM pode colaborar para a adequação dos níveis de estoques e ruptura das cadeias de abastecimento. A hipótese defendida é a de que os modelos estatísticos tradicionais de previsão, baseados em séries temporais, isoladamente não são mais adequados para o ajuste da demanda, tendo em vista que ferramentas baseadas nestes modelos não atualizam a demanda em tempo real e isso é fundamental para a atual dinâmica empresarial. O método de pesquisa utilizado foi o estudo de múltiplos casos em um segmento de cadeia que envolve um grande varejista, seu CD e um fornecedor de linha branca. Para análise dos dados, foi utilizada a técnica de análise de conteúdo. Como principais resultados observou-se que, após a integração do segmento de cadeia pelo e-SCM, houve uma redução no nível dos estoques (36,8% no varejo e 18% na indústria) e no giro (de 18,3 para 5,1 dias no varejo e de 19,6 para 3,2 dias no CD), além da variação da ruptura (de 17,3% para 2,6% no varejo e de 3% para 0,1% no caso do CD). Sendo assim, o estudo traz fortes indícios de que a integração da cadeia, por meio do e-SCM, pode colaborar para o aumento da competitividade da SCM.
Palavras-chave: E-SCM. Previsão da demanda. Lojas de departamento. Nível de serviço logístico.
E-SCM and Inventory Management: a Study of Multiple Cases in a Segment of the Department Store Chain 369
R. Gest. Tecn. Sist. Inf. /JISTEM Journal of Information Systems and Technology Management, Brazil
1 INTRODUCTION
The transformations society has been experiencing, mainly in the last two decades, due to the impact of the so-called new economy, have established an extremely competitive environment for business organizations. In this scenario, inventory management through the supply chain stands out, for it has been a determining factor for the success or failure of many organizations (Gunasekaran; Ngai, 2009). With this increase in complexity of the markets, the traditional statistical demand forecasting models, based on time series, no longer met the needs imposed on them by the more competitive supply chains regarding their adequate levels of inventory and interruptions (Bayraktar et al., 2008). For Laudon and Laudon (2004), this new reality in inventory management depends, more and more, on Information Technology (IT) as a strategic resource in order to obtain a competitive advantage. According to Porter (1996), what one sees is the intensification of the adoption of IT as a support for businesses that begins with the conception of a product/service, passing through its commercialization and arriving at the logistics of its distribution. For Bannerman (2008), the effective use of IT has become imperative to the strategy and even to the survival of the organizations.
According to O’Brien (2004), with the development of information systems Enterprise Resource Planning (ERP) systems emerged, promising a systemic management of the businesses. Nevertheless, even by providing an adjustment in the inventories, mainly driven by the optimization of the internal processes and by the reduction in lead time, this system did not provide a significant contribution so that Supply Chain Management (SCM) could reach a desired level of inventory and of service by the more competitive businesses. This is because ERP, which originated from the evolution of Material Requirement Planning (MRP) and Manufacturing Resource Planning (MRPII) systems, limits itself to the internal analysis of the business organization. In order for the more competitive businesses to reach the desired level of service, it is essential to study the supply and demand of the market, a fact which is limiting to the ERP integration system (Silva Neto, 2002; Corrêa; Gianesi; Caon, 2001; Souza; Saccol, 2003).
Therefore, beginning in the 1990’s, the focus was placed on the external relationships of the business (Freitas, 2001). At that time, all efforts were directed at the study of the relationship of the business with their stakeholders, their players in the productive chain, and especially, with their end consumers (Soroor; Tarokh; Shemshadi, 2009). Thus, the implementation of systems for the integration of information, in real time, through the chain has been increasing due to the needs of the market itself to adequate its inventories. Commercially, this system is known as e-SCM or ERPII.
The e-SCM may assist the players in the supply chain in solving problems related to the logistics, the sales or in the study of the customers’ habits, as is the case of the Customer Relationship Management (CRM) (Salama et al., 2009). A concept that will be given emphasis and dealt with in this research is the relationship of the e-SCM with the adjustment of the demand forecast. Today, this partnership is essential for the synchronization between supply and demand, that is, between the links of the supply chain and, consequently, for the adequate levels of inventory (Salgado Junior et al.,
370 Salgado Junior, A. P., Novi, J. C., Pacagnella Junior, A. C.
Vol.8, No. 2, 2011, p. 367-388
2009). This is due to the fact there is a need for an adequate pace of purchases, production, distribution and provision of the supply chains which has to adjust to the speed of the final consumption. This avoids the lack or excess of merchandises, not only in retail, but in the entire supply chain. These adjustments in the chain are only possible if the information flows in real time. This is only possible through the e-SCM, for the demand forecast is done in longer periods like weeks, by-weekly or months (Lo et AL., 2008). It is worth remembering that e-SCM and forecast are not excluders, but in fact, they complement each other.
The study of demand forecast is not something new. It has been done in several sectors and bases itself on qualitative methods, like the ones related to the experiences of salespersons, and quantitative, like the ones based on statistical analysis of time series (Chen; Xiao, 2009). Nonetheless, with the increase in the number of products, suppliers and points of sale, the traditional demand forecasting models have become inefficient for the more competitive businesses. This is due to the gap between forecasts. With a turbulent and constantly changing market, it is necessary an adjustment, in real time, of this forecast to reduce the uncertainties and, consequently, the lack or excess of products. All these factors have a direct impact on the improvement of the levels of the inventory, of the interruptions and of the level of service provided to the end consumer. This is the case of the large department stores in Brazil, the case study of this manuscript.
In this context, the present article aims to analyze how the e-SCM may complement the traditional demand forecasting models and contribute to the adequate levels of inventory and interruptions of the supply chains of department stores.
2 THEORETICAL FRAMEWORK
2.1 Supply Chain Management (SCM), Information Technology (IT) and e-SCM
With the increase in competitiveness, the improvement in the management of the level of services delivered to the end consumer in the chain is a determining factor for the success of any entrepreneurship. According to Ching (199, p. 67), “supply chain management is all the effort involved in the different entrepreneurial processes that create value in the form of products and services for the end consumer”. Thus, the quest for criteria such as: a better final price of the product, reduction in the levels of interruptions and inventory, quick distribution or better methods of payment is essential for the maintenance of the business. For this to happen, it is necessary for the chain to manage in the best way possible its resources, its logistics, its inventory and its information (Gunasekaran; Ngai, 2009).
An efficient management of the chain is initiated with the administration of the inventory. Nevertheless, they represent tied up working capital and may deteriorate, be stolen or simply become obsolete. On the other hand, they represent security to the business like, for example, in the case of oscillating demand and in problems related to interruptions. According to Arnold (1999), p. 271), “the inventory helps to maximize
E-SCM and Inventory Management: a Study of Multiple Cases in a Segment of the Department Store Chain 371
R. Gest. Tecn. Sist. Inf. /JISTEM Journal of Information Systems and Technology Management, Brazil
the service to the customers, protecting the business from uncertainties”. The volume of the inventory is a strategy defined by each business organization. Nonetheless, when there is a need to reduce it, this process is complex and demands time and investment by the organizations (Bowersox, 2001).
The inventory will always occur when there is uncertainty between supply and demand. If there is a perfect synchronization between the links in the productive chain, the maintenance of the inventory becomes unnecessary (Ballou, 2001). According to Bayraktar et al. (2008, p.193), “the sources of uncertainties are found in the processes in which there is a need to synchronize the demand with the supply”. Therefore, the inventory exists to compensate the possible incapacities to manage the productive links making it necessary to adjust it to maintain it competitive. For this to happen it is necessary to comprehend what the demand is composed of.
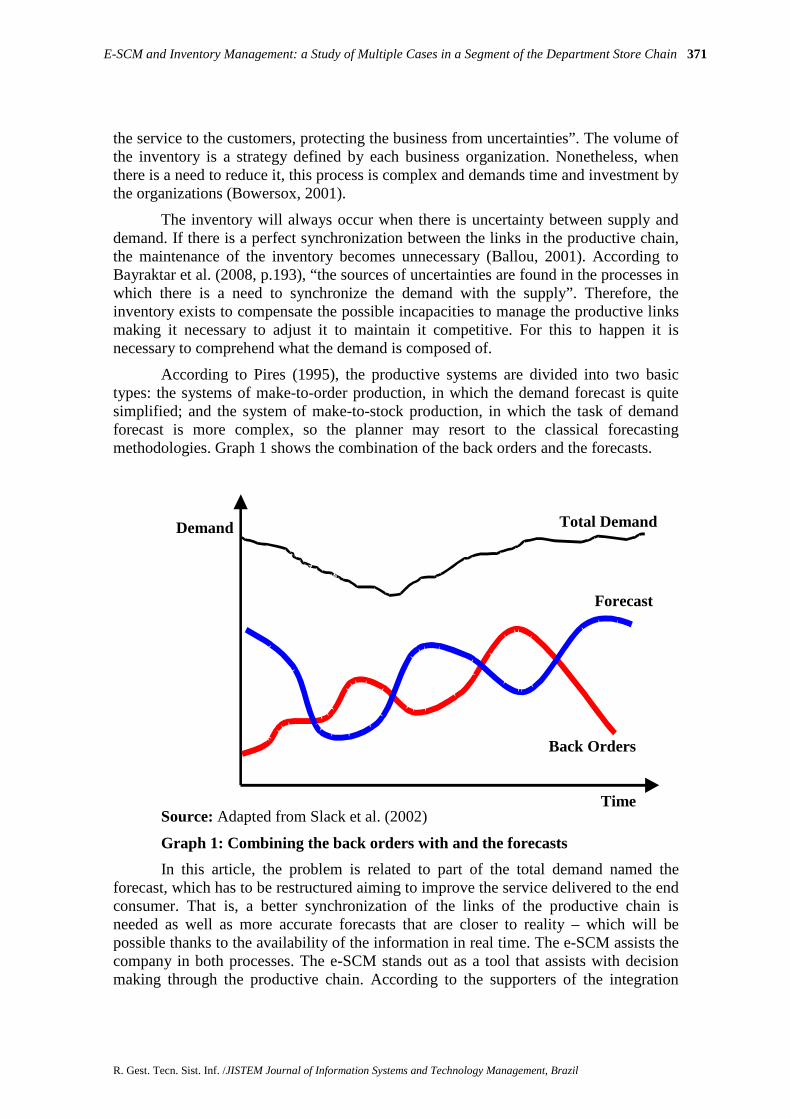
According to Pires (1995), the productive systems are divided into two basic types: the systems of make-to-order production, in which the demand forecast is quite simplified; and the system of make-to-stock production, in which the task of demand forecast is more complex, so the planner may resort to the classical forecasting methodologies. Graph 1 shows the combination of the back orders and the forecasts.
Source: Adapted from Slack et al. (2002)
Graph 1: Combining the back orders with and the forecasts
In this article, the problem is related to part of the total demand named the forecast, which has to be restructured aiming to improve the service delivered to the end consumer. That is, a better synchronization of the links of the productive chain is needed as well as more accurate forecasts that are closer to reality – which will be possible thanks to the availability of the information in real time. The e-SCM assists the company in both processes. The e-SCM stands out as a tool that assists with decision making through the productive chain. According to the supporters of the integration
Demand
Back Orders
Forecast
Total Demand
Time
372 Salgado Junior, A. P., Novi, J. C., Pacagnella Junior, A. C.
Vol.8, No. 2, 2011, p. 367-388
concept, ERP controls only the internal processes of the business, whereas the e-SCM allows a company to monitor its business in all of its productive chain, from the initial suppliers to the end customers, all interconnected by means of IT. This technology is assisting the chains in making their levels of service more adequate (Hendricks; Singhal; Stratman, 2007).
This occurs because the sale information to the end consumer is made available, in real time, to all links in the chain. According to Bose, Raktim and Alex (2008, p. 233), “the integration allows for an improvement in the adaptability of the business to the fluctuations that occur in the chain. There is an improvement in the planning capacity, in real time, and the possibility of the businesses to react quickly to the changes in supply and demand”. Consequently, the suppliers may alter their pace of production to monitor, in real time, any unexpected behavior from the demand avoiding excess (inventory) and the lack of products (interruption).
According to Koh and Gunasekaran (2008, p.253), “in the e-SCM the resources are better controlled and the decision making and the planning are emphasized not only because of the intrinsic advantages of ERP, but also because the resources of the entire chain are now available”. The same happens to the second-tier suppliers and so on. According to Chang et al. (2008, p.1809), “when applying the e-SCM, the orders can be forecasted efficiently and correctly, the costs of the inventory for the members of the supply chain may be reduced, and a scheduled production may be adjusted to optimize time”. As commented earlier, being limited to the internal environment of the business, ERP cannot assist in reducing the uncertainties of the chain.
For Themistocleous, Irani and Love (2004), the e-SCM also modifies the productive system of the value chain from “pushed” to “pulled”. This allows for an adequate level of the inventory in relation to the sales, even with the increase in the product mix.
2.2 Economic Order Quantity Model
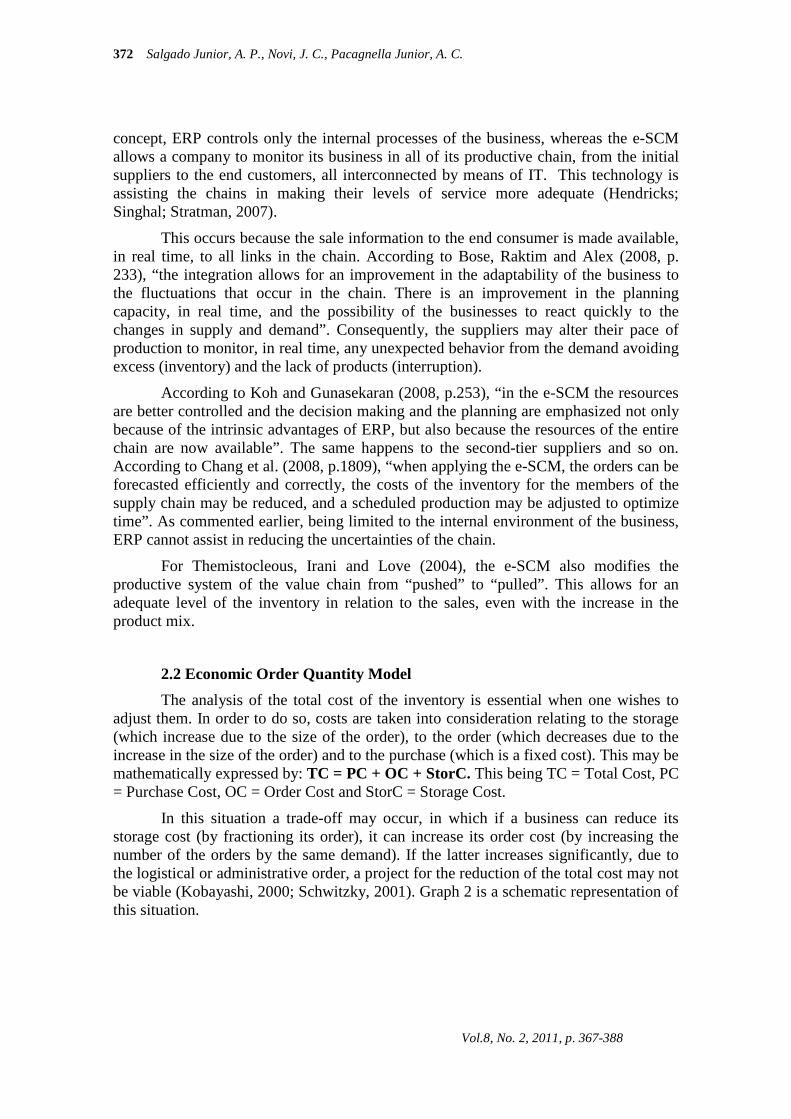
The analysis of the total cost of the inventory is essential when one wishes to adjust them. In order to do so, costs are taken into consideration relating to the storage (which increase due to the size of the order), to the order (which decreases due to the increase in the size of the order) and to the purchase (which is a fixed cost). This may be mathematically expressed by: TC = PC + OC + StorC. This being TC = Total Cost, PC = Purchase Cost, OC = Order Cost and StorC = Storage Cost.
In this situation a trade-off may occur, in which if a business can reduce its storage cost (by fractioning its order), it can increase its order cost (by increasing the number of the orders by the same demand). If the latter increases significantly, due to the logistical or administrative order, a project for the reduction of the total cost may not be viable (Kobayashi, 2000; Schwitzky, 2001). Graph 2 is a schematic representation of this situation.
E-SCM and Inventory Management: a Study of Multiple Cases in a Segment of the Department Store Chain 373
R. Gest. Tecn. Sist. Inf. /JISTEM Journal of Information Systems and Technology Management, Brazil
Source: Adapted from Francischini and Gurgel (2002)
Graph 2: Economic Order Quantity Model
2.3 Demand Forecast
The demand forecasts are the base for the planning process, being one of the most important activities in the production system. All inventory studies, in their beginning, are based on the forecasts of consumption of materials. This process establishes future estimates of the end products commercialized by the businesses. They also define which, how many and when certain products will be bought by the customers. For Christopher (1997, p. 173), “forecasting is a methodological process for determining the future data based on statistical, mathematical or econometric models, or also in subjective models supported by a clear and previously defined methodology of work.”
Sales forecasting is used by various departments of the business. However, it is difficult to be measured, because it is based on uncertainty. If it is lower than the demand, a shortage of products may occur, and if it is higher, excessive inventory may occur (Kotler, 2000). According to Bayraktar et al. (2008, p. 195), “demand forecasts, in practice, are rarely precise and become even less accurate in more complex levels of the supply chain”. According to Arnold (1999, p. 235), “the forecasts are more precise for shorter periods of time. The near future poses fewer uncertainties than the distant future”.
There are vast techniques and models (statistical, operational and strategic) described in literatures like, for example, those based on the time series that analyze in detail ways to forecast demand.. In spite of the evolution of these methods, demand forecast is not a purely exact science. It involves the experience and the personal judgment of the planner, the opinion of the managers, salespersons and buyers, aside
Cost
Q -
OrderCost
Q 0
Minimum Cost
Q - Ordered Quantity
Total CostStorage Cost
Q 0 Quantity of Lowest Cost
Purchasing Cost
374 Salgado Junior, A. P., Novi, J. C., Pacagnella Junior, A. C.
Vol.8, No. 2, 2011, p. 367-388
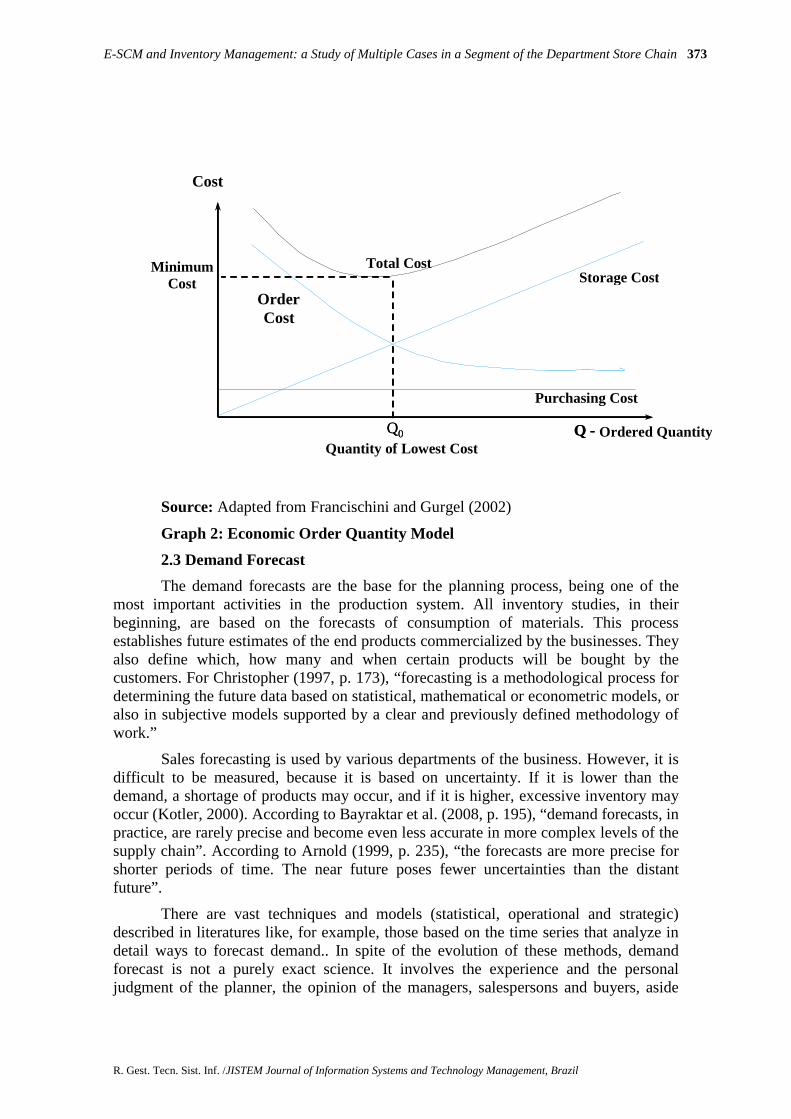
from the market research. Notwithstanding, even with all the resources available to do a good forecast, if compared to the back orders, this percentage of the sales is much more difficult to manage, it being responsible for the existence of the largest part of the inventory. For Corrêa and Gianesi (1996, p. 234), “the uncertainties of the forecasts and their corresponding errors come from two distinct forms: the first corresponds to the market itself, being of low predictability; the second corresponds to the forecasting system”. Another problem is that the constant growth in the oscillation of the demand of a growing number of products increases, , the need for rescheduling of the production increases proportionally, in addition to the fact that, with these oscillations the forecasts become less inaccurate as the horizon increases according to graph 3.
Source: Bowersox (2001)
Graph 3 - Uncertainties of forecast increase along with the horizon
Therefore, one of the mechanisms to make inventory adequate would be the one that would be able to improve the forecasts or transform them in back orders, thus providing a larger synchronization between supply and demand. Many companies have sought to transform a large part of their forecast into back orders by means of an increase in the number of technical visits or by offering discounts to those customers that purchase in advance. Nonetheless, there are segments in which this procedure is not possible. Thus, these companies overlook forecasts in order to anticipate the demand and plan what, how much and when to produce (Ching, 1999).
There are several techniques in which to work the forecast. According to Shingo (1996), these techniques may be classified into three groups:
• projection: admit that the future will be a repetition of the past or that the sales will evolve over time. A technique of an essentially quantitative nature;
• explanation: aims to relate past sales with other variables, whose evolution is known or predictable. Basically, it is the application of the techniques of regression and correlation;
previsão
tempo
As incertezas das previsõesaumentam com o horizonte
Forecast
time
The uncertainties of the forecast increase along with the horizon
E-SCM and Inventory Management: a Study of Multiple Cases in a Segment of the Department Store Chain 375
R. Gest. Tecn. Sist. Inf. /JISTEM Journal of Information Systems and Technology Management, Brazil
• preference: experienced employees and people with knowledge of influential factors in sales and in the market establish the evolution of future sales.
In practice, there may be combinations of several models of the evolution of the consumption. According to Arnold (1999), there are two ways to estimate the consumption:
• after the placement of the order. This is only possible in the cases where the delivery times are sufficiently long.
• through statistical methods. It is the most used method. The forecasts are calculated through the historical values. Among these models there are: the previous period method, the moving average method, the weighted moving average method, the exponentially weighted average method and the least square method.
It is worth noting that it depends on each chain to adequately use the method that best suits its segment, product or demand.
Therefore, studies made on the integration of the supply chain, aiming to reduce the degree of uncertainty in itself, may improve the sales forecasts, the reliability of the delivery from suppliers and the management of the lead time of the production processes. Those are of essential importance so that companies may reduce the uncertainties regarding the internal and external environments and, consequently have a more adequate level of inventory, improve their level of service and reduce supply interruptions.. Thus, new solutions have been developed and applied to the most diverse segments, aiming to improve even more the levels of services delivered to the end consumer.
2.4 The large department store segment in Brazil
In Brazil, the department store segment is characterized by the high competitiveness and by highly demanding consumers. Without mentioning the numerous suppliers, products and points of sale that make the management of this segment even more difficult. In this context, the study of the level of the logistic services and of the integration with their suppliers is justified by its relevance and its compliance/addressing in all social classes, including the less economically favored.
Another important factor is the level of the logistical services. It directly affects the very survival of the business and its partners. For Jiménez and Muñoz (2006), this activity is the mechanism that brings together the industries, the retailers and the customers, involving important elements that are generally taken into consideration by the customers at the moment of deciding which business they will become partners with. Structuring these services is fundamental for any value chain and this is not any different from the department store segment. For Giacobo, Estrada and Ceretta (2005), with the evolution of the market and with the preoccupation of the businesses about the level of services offered to their customers, there was an attempt to identify and quantify the necessary factors in order to create new levels of services, such as: execution time and the respective level of reliability; task processing time; personnel and requested equipment availability; quickness in solving errors and failures; agility and precision in providing information of ongoing services; agility and precision in
376 Salgado Junior, A. P., Novi, J. C., Pacagnella Junior, A. C.
Vol.8, No. 2, 2011, p. 367-388
tracking the shipment under process or in transit; agility in dealing with complaints and in the provision of solutions. All these services are necessary in retail.
3 METHODOLOGY
Due to the initial phase of the development, in which there are studies related to the impact the e-SCM has on inventory and on interruptions in the department store chains, there is a deficiency in the structuring of this knowledge, which generates difficulty when raising the data that could be treated as statistics. Thus, this research was of the qualitative type and of an exploratory nature. For Malhorta (2001), the exploratory qualitative research provides a better vision and comprehension of the context of the problem. For Mattar (2005), although there may be restrictions to this type of study, the exploratory studies show to be adequate when the critical bulk of the knowledge of a subject is neither extensive nor important, when the initial stages are constituted for further and more structured studies such as the causal and descriptive ones.
The method used was the multiple case study method. According to Yin (2001), the case study is the preferred strategy when the questions are put forth as the “how” and the “why”, which is the aim for this present case. The case study allows for an investigation to obtain the most significant and holistic characteristics.. Still, according to the author, six sources of evidence should be used, as much as possible, so that a good case study is obtained, as follows: (1) documentation; (2) archival records; (3) interviews; (4) direct observation; (5) participant observation; (6) physical artifacts.
3.1 Research Protocol
The protocol contains the procedures, the instruments and the general rules that must be followed when applying and using these instruments and it is a tactic to increase the authenticity of the research. According to Yin (1990), this protocol or manual should contain:
• a general vision of the project of the case study: objectives, assistance, questions about the case study and relevant readings about the topics to be investigated;
• the field procedures;
• the questions about the case study that the investigator should keep in mind, the locations, the sources of information, the forms for registering the data and the potential sources of information for each question;
• a guide for the report of the case study.
3.2 The Case´s Choices
The companies studied are part of the same segment of the supply chain, involving retail (department store), Distribution Center (DC) and industry. . They were chosen according to their relevance and convenience. A multiple case analysis was opted for in one single segment of the chain since it is a recent phenomenon in Brazil and the fact that the data cannot be statistically extrapolated. In a case study the depth of
E-SCM and Inventory Management: a Study of Multiple Cases in a Segment of the Department Store Chain 377
R. Gest. Tecn. Sist. Inf. /JISTEM Journal of Information Systems and Technology Management, Brazil
the analysis is more important than the volume of information. All the companies are of large-scale and are located in the State of São Paulo.
3.3 Key personnel for the interviews
The individuals of interest to the interviews, whose knowledge and atitudes, relating to ERP management system and the integration through the e-SCM, and who brought the most contribution to the case study were:
1. manager and/or supervisor in the area of operations and/or logistics graduated in and/or with knowledge of the management of integrated systems. Both were present in the three interviewed companies
2. manager in the area of information technology. This person was interviewed in retail and in industry;
3. manager responsible for the implementation of ERP and/or the process of business collaboration by means of the e-SCM. Also in the three companies.
Within each of these groups, essential personnel for the interview was identified, whose knowledge and opinions were complementary.
3.4 Collection and Analysis of the Data
For the current study, all primary and secondary data were used, obtained through structured interviews and visits to the companies (retail, distribution center (DC) and industry).. Structured interviews were held in each link of the studied chain segment. The direct observations of the property’s different activities allowed for the follow up of the data, as well as a more detailed and accurate perception of the objects of the research. According to Selltiz, Wrightsman and Cook (1987), the interview technique is a situation where a social interaction is developed in order to obtain information, as it is more adequate for the revelation of complex subjects, emotionally charged or to verify the feelings underlying a certain given opinion.
In order to better and further analyze the data, the following variables were defined that served to build a sequence of interviews:
Group 1: related to the organization’s data (size, scale, history, location);
Group 2: related to the measurement of the level of services (lead time, supply interruptions, product availability, inventory levels);
Group 3: related to the financial gains obtained by the integration (turnover, net current assets );
Group 4: related to the opinion of the managers about the benefits and challenges of this integration.
After the conclusion of the interviews, the data were analyzed initially, on an individual basis, and afterwards in the form of a comparative analysis between the studied companies. For this purpose, the content analysis was used, which enabled the codification, categorization and quantification of the collected data. This technique allows for the treatment of the information with a qualitative code to reach its classification and treatment. In all companies there was the preoccupation to analyze
378 Salgado Junior, A. P., Novi, J. C., Pacagnella Junior, A. C.
Vol.8, No. 2, 2011, p. 367-388
each variable’s situation, before and after the integration by means of the e-SCM aiming to analyze the changes generated after the integration.
4 CASE PRESENTATION AND DISCUSSION
The purpose of this topic is to present a multiple case study involving a group of companies that belong to the same segment in the supply chain that presented limitations relating to the sales forecast, management of suppliers, logistics, inventory management and supply interruptions.
The project of integration by the e-SCM was assisted by a software consulting and development company. This took four years, and passed through all the departments and had the involvement of all areas relating to the supply chain. The absolute values were not disclosed by the company; however, the investment in the project was amortized by nearly 16 months in the case of the retail and by nearly 24 months in the case of the industry.
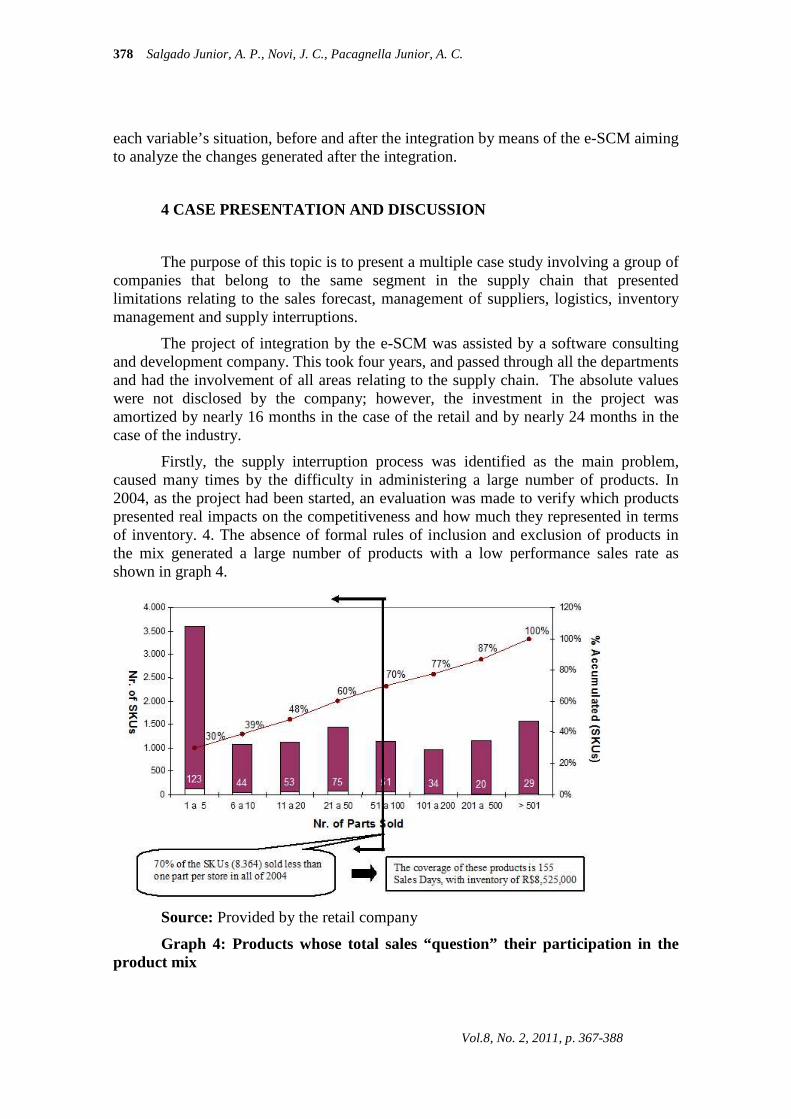
Firstly, the supply interruption process was identified as the main problem, caused many times by the difficulty in administering a large number of products. In 2004, as the project had been started, an evaluation was made to verify which products presented real impacts on the competitiveness and how much they represented in terms of inventory. 4. The absence of formal rules of inclusion and exclusion of products in the mix generated a large number of products with a low performance sales rate as shown in graph 4.
Source: Provided by the retail company
Graph 4: Products whose total sales “question” their participation in the product mix
E-SCM and Inventory Management: a Study of Multiple Cases in a Segment of the Department Store Chain 379
R. Gest. Tecn. Sist. Inf. /JISTEM Journal of Information Systems and Technology Management, Brazil
In 2004, the company had 98 points of distribution, of which the 11.948 existing SKUs (Stock Keeping Units), 70% (8.364 SKUs) sold less than 100 parts per year (graph 4).
This data verifies that the number of retail points presented sales of less than one part per year per store. These figures are very low, thus not justifying the existence of these products to be in the product mix of the company, other than for strategic reasons, which was not the case in the majority of the products.
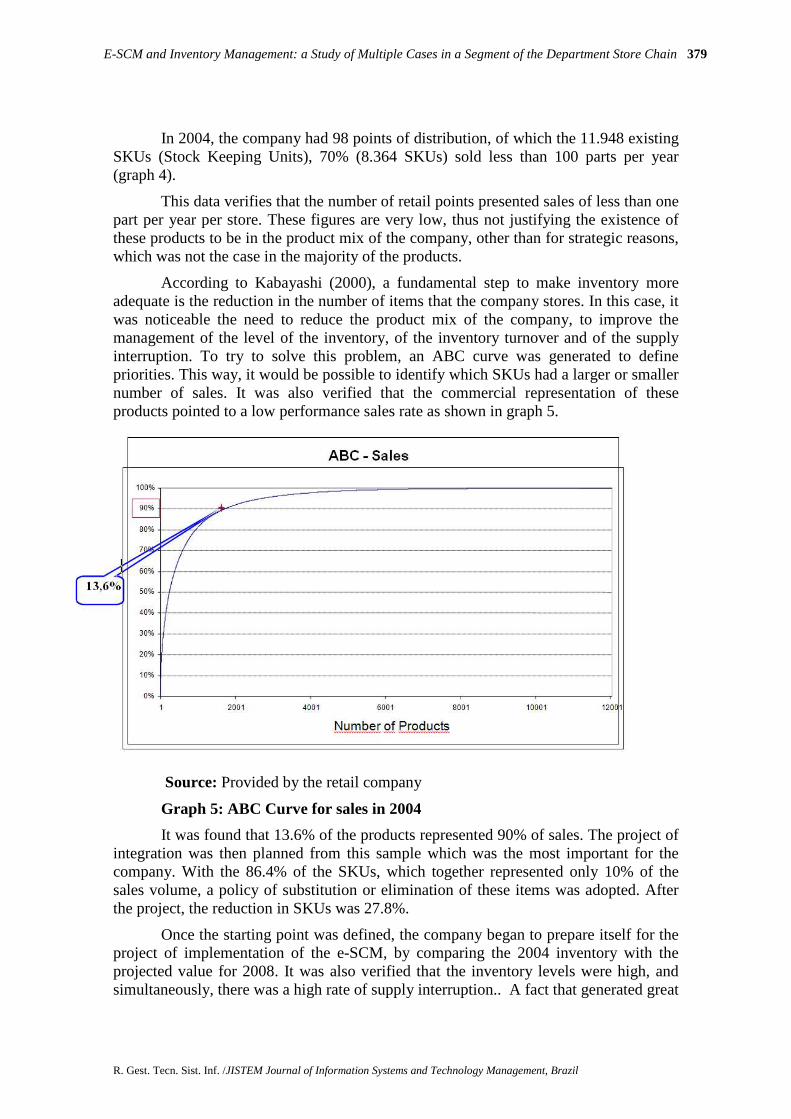
According to Kabayashi (2000), a fundamental step to make inventory more adequate is the reduction in the number of items that the company stores. In this case, it was noticeable the need to reduce the product mix of the company, to improve the management of the level of the inventory, of the inventory turnover and of the supply interruption. To try to solve this problem, an ABC curve was generated to define priorities. This way, it would be possible to identify which SKUs had a larger or smaller number of sales. It was also verified that the commercial representation of these products pointed to a low performance sales rate as shown in graph 5.
Source: Provided by the retail company
Graph 5: ABC Curve for sales in 2004
It was found that 13.6% of the products represented 90% of sales. The project of integration was then planned from this sample which was the most important for the company. With the 86.4% of the SKUs, which together represented only 10% of the sales volume, a policy of substitution or elimination of these items was adopted. After the project, the reduction in SKUs was 27.8%.
Once the starting point was defined, the company began to prepare itself for the project of implementation of the e-SCM, by comparing the 2004 inventory with the projected value for 2008. It was also verified that the inventory levels were high, and simultaneously, there was a high rate of supply interruption.. A fact that generated great
380 Salgado Junior, A. P., Novi, J. C., Pacagnella Junior, A. C.
Vol.8, No. 2, 2011, p. 367-388
dissatisfaction for the end consumer, as they ended up not finding the desired product, which then reduced the quality of the services delivered.As already discussed, this phenomenon may occur due to the lack of available information, in real time, through the chain.
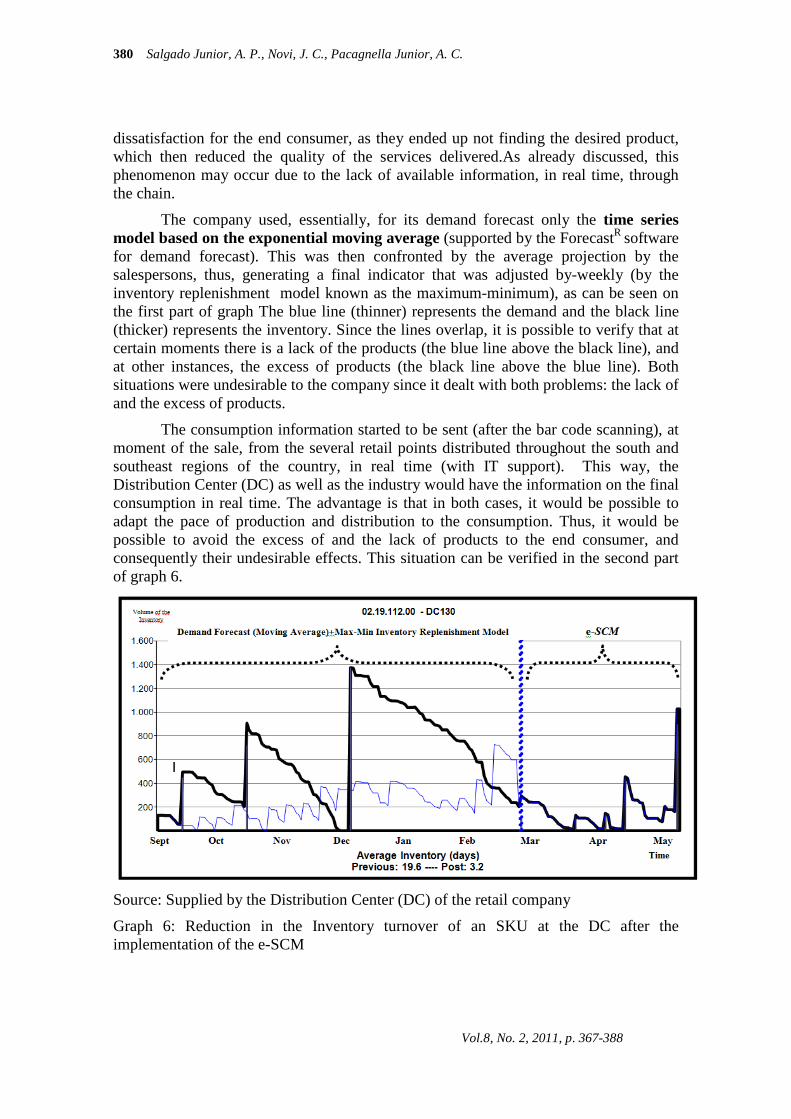
The company used, essentially, for its demand forecast only the time series model based on the exponential moving average (supported by the ForecastR software for demand forecast). This was then confronted by the average projection by the salespersons, thus, generating a final indicator that was adjusted by-weekly (by the inventory replenishment model known as the maximum-minimum), as can be seen on the first part of graph The blue line (thinner) represents the demand and the black line (thicker) represents the inventory. Since the lines overlap, it is possible to verify that at certain moments there is a lack of the products (the blue line above the black line), and at other instances, the excess of products (the black line above the blue line). Both situations were undesirable to the company since it dealt with both problems: the lack of and the excess of products.
The consumption information started to be sent (after the bar code scanning), at moment of the sale, from the several retail points distributed throughout the south and southeast regions of the country, in real time (with IT support). This way, the Distribution Center (DC) as well as the industry would have the information on the final consumption in real time. The advantage is that in both cases, it would be possible to adapt the pace of production and distribution to the consumption. Thus, it would be possible to avoid the excess of and the lack of products to the end consumer, and consequently their undesirable effects. This situation can be verified in the second part of graph 6.
Source: Supplied by the Distribution Center (DC) of the retail company
Graph 6: Reduction in the Inventory turnover of an SKU at the DC after the implementation of the e-SCM
E-SCM and Inventory Management: a Study of Multiple Cases in a Segment of the Department Store Chain 381
R. Gest. Tecn. Sist. Inf. /JISTEM Journal of Information Systems and Technology Management, Brazil
In graph 6, it is important to verify that before the integration, the inventory level of this SKU (which is between the 13.6% of the products of more relevance) was around 6 times higher. After the integration, the average inventory of the product shows a significant reduction, from 19.6 to 3.2 days. Another important factor is the existence of a reduction in the supply interruption of this product. Thus, the DC’s response to retail improved even further. Also, a significant reduction in the level of interruption of the inventory was observed.
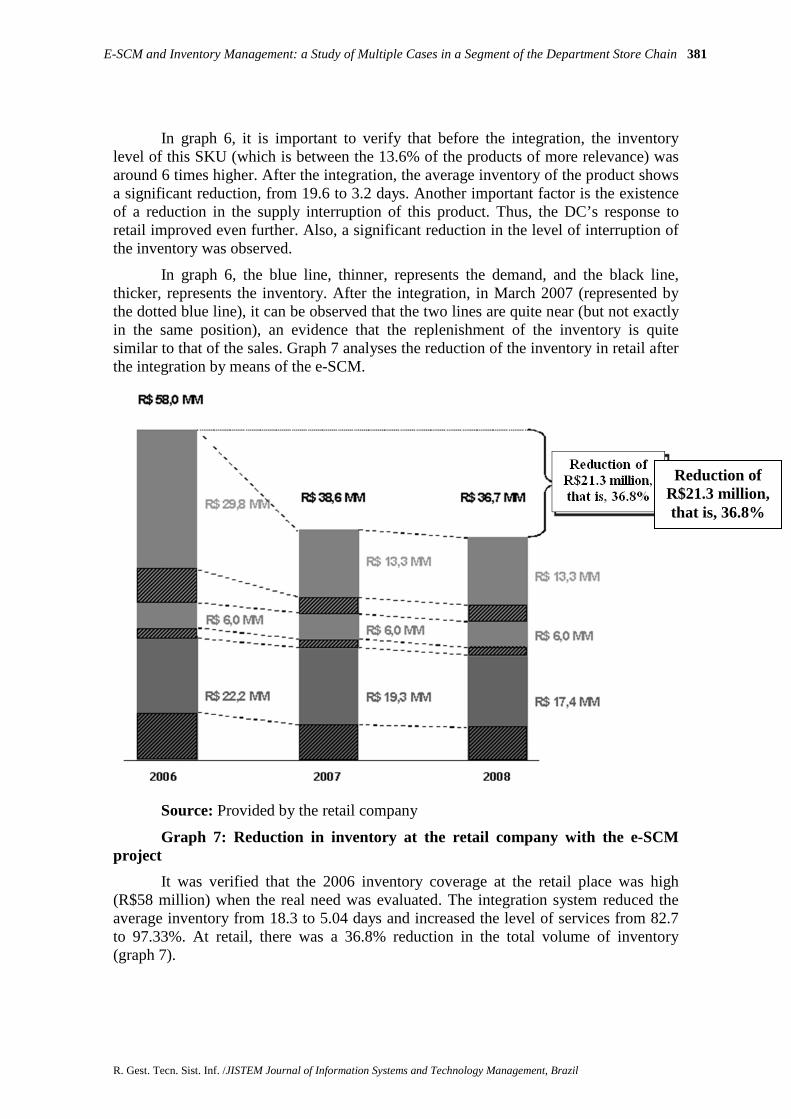
In graph 6, the blue line, thinner, represents the demand, and the black line, thicker, represents the inventory. After the integration, in March 2007 (represented by the dotted blue line), it can be observed that the two lines are quite near (but not exactly in the same position), an evidence that the replenishment of the inventory is quite similar to that of the sales. Graph 7 analyses the reduction of the inventory in retail after the integration by means of the e-SCM.
Source: Provided by the retail company
Graph 7: Reduction in inventory at the retail company with the e-SCM project
It was verified that the 2006 inventory coverage at the retail place was high (R$58 million) when the real need was evaluated. The integration system reduced the average inventory from 18.3 to 5.04 days and increased the level of services from 82.7 to 97.33%. At retail, there was a 36.8% reduction in the total volume of inventory (graph 7).
Reduction of R$21.3 million, that is, 36.8%
382 Salgado Junior, A. P., Novi, J. C., Pacagnella Junior, A. C.
Vol.8, No. 2, 2011, p. 367-388
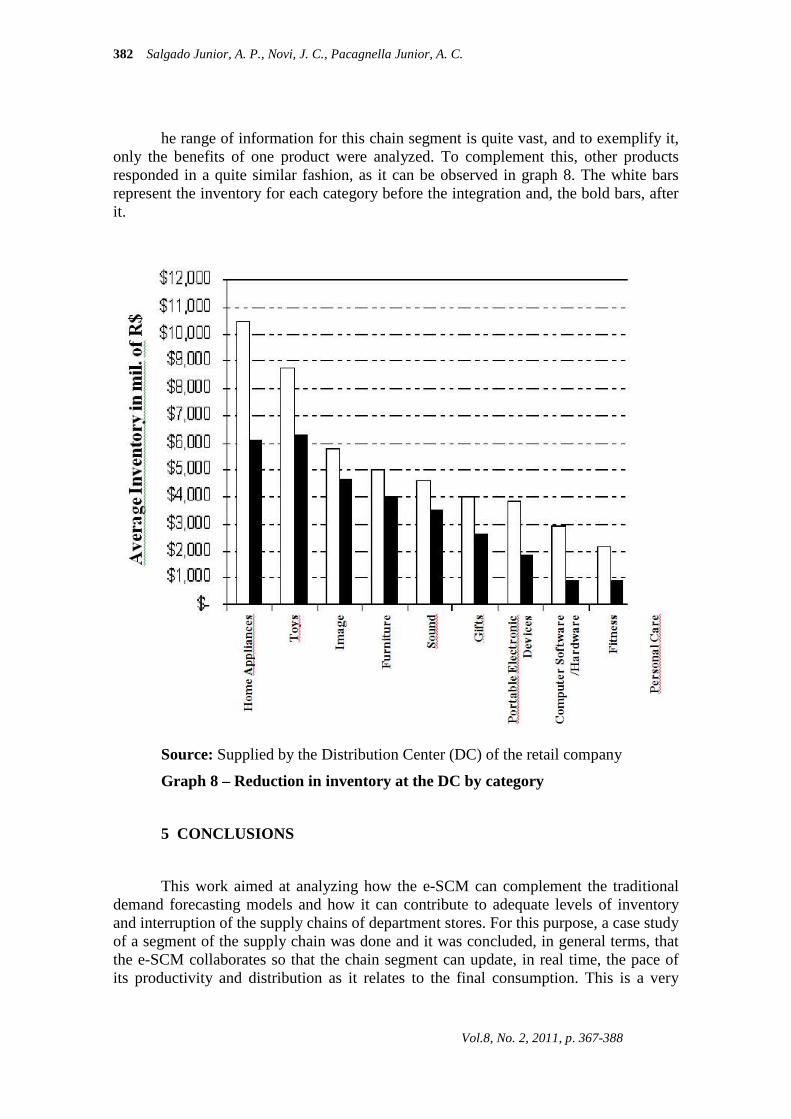
he range of information for this chain segment is quite vast, and to exemplify it, only the benefits of one product were analyzed. To complement this, other products responded in a quite similar fashion, as it can be observed in graph 8. The white bars represent the inventory for each category before the integration and, the bold bars, after it.
Source: Supplied by the Distribution Center (DC) of the retail company
Graph 8 – Reduction in inventory at the DC by category
5 CONCLUSIONS
This work aimed at analyzing how the e-SCM can complement the traditional demand forecasting models and how it can contribute to adequate levels of inventory and interruption of the supply chains of department stores. For this purpose, a case study of a segment of the supply chain was done and it was concluded, in general terms, that the e-SCM collaborates so that the chain segment can update, in real time, the pace of its productivity and distribution as it relates to the final consumption. This is a very
E-SCM and Inventory Management: a Study of Multiple Cases in a Segment of the Department Store Chain 383
R. Gest. Tecn. Sist. Inf. /JISTEM Journal of Information Systems and Technology Management, Brazil
important fact, for if the links of the supply chain synchronize the production / the supply / the consumption, undesired inventory and supply interruptions are avoided..
Compared to the traditional demand forecasting models, the e-SCM alone or otherwise, is much more efficient. This is because the forecast is normally done monthly or by-weekly, making it much slower to update the information (in terms of quality and quantity). Without this agility the links of the chain end up “guessing” the optimal supply chain values. In general, there is an inaccuracy between what is consumed and what is produced. This inaccuracy is obtained through the forecast system, and it affects the interruptions and the excess of inventory. In the e-SCM, this adjustment counts on the IT systems that update the information in real time.
Since this is a case study, the data cannot be extrapolated, that is, nothing can be said about the functioning of the other chains. However, the data provide strong information to conclude that there is a tendency that the observed phenomena in this study may repeat themselves in similar supply chains.
Another important data is that the researched retailer represented only 3.6% of the industry’s sales.. Nonetheless, it was considered a representative sample of the total market in this segment due to the location of their 98 points of sale distributed throughout the entire southeast region of the country. Thus, the behavior of the integrated retail sales was extrapolated for the entire population with which the researched industry maintained commercial relationships.
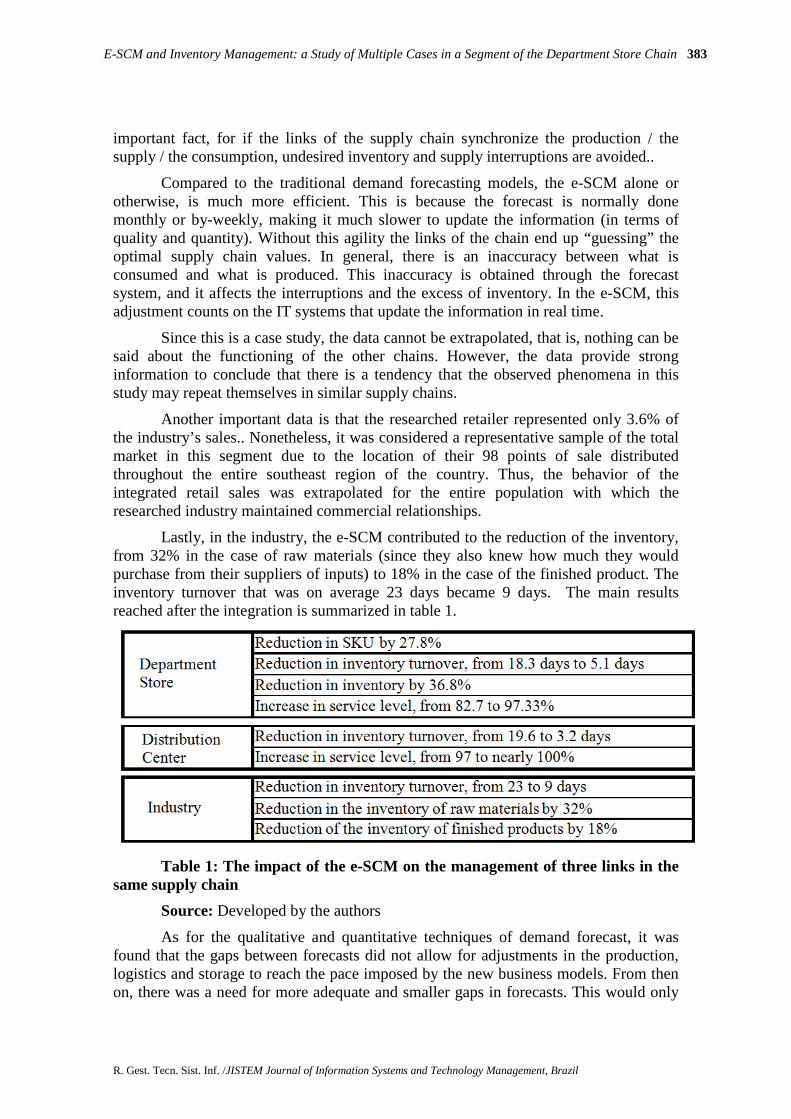
Lastly, in the industry, the e-SCM contributed to the reduction of the inventory, from 32% in the case of raw materials (since they also knew how much they would purchase from their suppliers of inputs) to 18% in the case of the finished product. The inventory turnover that was on average 23 days became 9 days. The main results reached after the integration is summarized in table 1.
Table 1: The impact of the e-SCM on the management of three links in the same supply chain
Source: Developed by the authors
As for the qualitative and quantitative techniques of demand forecast, it was found that the gaps between forecasts did not allow for adjustments in the production, logistics and storage to reach the pace imposed by the new business models. From then on, there was a need for more adequate and smaller gaps in forecasts. This would only

384 Salgado Junior, A. P., Novi, J. C., Pacagnella Junior, A. C.
Vol.8, No. 2, 2011, p. 367-388
be possible after the availability of the information on the oscillations of the sales in real time. Therefore, the indicators from table 1 were only reached when the retail, the Distribution Center and the industry, acting together, decided to discuss their external relations by means of the e-SCM. This process is helping to improve the level of satisfaction of the end customer, reducing the inventory and the supply interruption and consequently, boosting sales. The results of each individual links will be discussed in further detail below.
Firstly, the department store had a significant reduction in its level of inventory after the integration by means of the e-SCM (around 36.8). This is a very expressive figure and it represented an absolute reduction of R$21.3 million. Now the company may use its net current assets to invest in other areas or to avoid the acquisition of loans, mainly when credit becomes expensive and scarce. Furthermore, the turnover of the inventory changed from 18.3 to 5.1 days. Its level of service went from 82.7 to 97.33%. This data is also very significant, for it means a reduction in the probability of a lack of the product (supply interruption), thus minimizing the need to search for the product at the competitor.
The mix of the products at the department store came into question (the ABC curve showed that 13.6% of the products represented 90% of the revenue and 70% of the products were sold less than once a year). The company focused its sales on the most important products (A) and tried to eliminate the ones that were of low turnover. The number of SKUs was reduced by 27.8% which improved its management. Furthermore, the cultural barriers used in the exchange of information between the links of the chain were also questioned, enabling therefore, the realization of new businesses.
Further on, advantages in the DC were also identified. By itself, the turnover of a product went from 19.6 to 3.2 days, and furthermore, the level of service improved, from 97 to nearly 100%. Graph 5 presents data that corroborate that this same type of benefit was extended to other categories of products.
In the case of the home appliances supplier, the turnover changed radically from 23 to nearly 9 days and there was a 32% reduction in the inventory of raw material and 18% in finished products. Another important factor is that the retailer (which represents only 3.6% of the volume of the business in the industry) served as a representative model of the segment, due to the distribution of their 98 points of sale. This allowed the industry to treat all their demand according to the oscillations of the retail group integrated into it by means of the e-SCM.
And finally, as a contribution, it is hoped that this study may assist in the decision of the chains or the segments of the department store chains that desire to integrate by means of the e-SCM.
6 LIMITATIONS AND RECOMMENDATIONS FOR FUTURE STUDIE S
The collaborative process still presents a series of barriers, the majority related to the cultural questions. Among them, emphasis on the exchange of the information between the companies, reliability, the search for a long term win-win negotiation and
E-SCM and Inventory Management: a Study of Multiple Cases in a Segment of the Department Store Chain 385
R. Gest. Tecn. Sist. Inf. /JISTEM Journal of Information Systems and Technology Management, Brazil
the sponsorship of the project by the upper management. Therefore, the main limitations of the study are:
• the need for the strategic data of the company whose access is difficult. This hindered the volume of the data that would allow for a more deep statistical analysis of the situation;
• new technology which limits the number of companies to be visited and studied, mainly in what relates to the collaboration by means of the e-SCM;
• omission of the data by the specialists;
• excessive protection of ERP and the e-SCM by the developers who may be interested in promoting them in a positive manner;
• typical limitations of the cause and effect relationship were observed. According to Cooper and Schindler (2003, p.137),
“empirically, we may never demonstrate a causation between A and B for certain. This is because we do not demonstrate such a causal association in a deductive manner neither do we use this manner nor validate these premises that the deduction demands in order to be conclusive. Contrary to the deductive syllogisms, the empirical conclusions are inferences – inductive conclusions. Therefore, they are probably conclusions based on what we observe and measure. But we cannot observe nor measure all the processes that may answer for the relationship between A and B”;
• The impossibility of studying the more distant links of the retail’s supply chain.
Considering the limitation of the research, referring to the size of the researched sampling, due to the number of chains that have already been integrated by means of the e-SCM, more comprehensive studies could be done. It is possible to hold further studies, considering the impact of the bullwhip effect on the level of services of more distant suppliers from the end consumer. As a suggestion, there is also the possibility of studying another specific segment, isolate it and analyze it in more depth. Some of the information present in this study may be used as an analogy in other chains, although there is peculiar information in each chain that may only be obtained by means of an exploratory research.
REFERENCES
ARNOLD, J. R. T. Administração de materiais. São Paulo: Atlas, 1999.
BALLOU, R. H. Gerenciamento da cadeia de suprimentos: planejamento, organização e logística empresarial. 4. ed. Porto Alegre: Bookman, 2001.
BANNERMAN, P. L. Risk and risk management in software projects: a reassessment. Journal of Systems and Software, v. 81, p. 2118-2133, Dec. 2008.

386 Salgado Junior, A. P., Novi, J. C., Pacagnella Junior, A. C.
Vol.8, No. 2, 2011, p. 367-388
BAYRAKTAR, E.; KOH, S. C. L.; SARI, K.; TATOGLU, E. The role of forecasting on bullwhip effect for E-SCM applications. International Journal of Production Economics, v. 113, p. 193-204, May 2008.
BOSE, I.; RAKTIM, P.; ALEX, Y. ERP and SCM systems integration: The case of a valve manufacturer in China. Information & Management, v. 45, p. 233-241, Jun. 2008.
BOWERSOX, D. J. Logística empresarial: o processo de integração da cadeia de suprimento. São Paulo: Atlas, 2001.
CHANG, I-C.; HWANG, Hsin-G.; LIAW, Hsueh-C.; CHEN, Sing-L.; YEN, D. C. A neural network evaluation model for ERP performance from SCM perspective to enhance enterprise competitive advantage. Expert Systems with Applications, v. 35, p. 1809-1816, Nov. 2008.
CHEN, K.; XIAO, T. Demand disruption and coordination of the supply chain with a dominant retailer. European Journal of Operational Research, v. 197, p. 225-234, Aug. 2009.
CHING, H. Y. Gestão de estoques na cadeia de logística integrada: supply chain. São Paulo: Atlas, 1999.
CHRISTOPHER, M. Logística e gerenciamento da cadeia de abastecimento: estratégias para a redução de custos e melhoria dos serviços. São Paulo: Pioneira, 1997.
COOPER, D. R.; SCHINDLER, P. S. Métodos de Pesquisa em Administração. 7a Edição. Porto Alegre: Bookman, 2003.
CORRÊA, H. L.; GIANESI, I. G. N. Just in time, MRP II e OPT: um enfoque estratégico. São Paulo: Atlas, 1996.
CORRÊA, H. L.; GIANESI, I. G. N.; CAON, M. Planejamento, programação e controle da produção MRPII e ERP: conceitos, uso e implantação. São Paulo: Atlas, 2001.
FRANCISCHINI, P. G.; GURGEL, F. A. Administração de Materiais e do Patrimônio. São Paulo: Thomson, 2002.
FREITAS, L. Metodologia para avaliação e implantação de uma camada de conhecimento baseada em prototipagem em empresas que possuam sistemas de ERP. 2001. Dissertação (Mestrado em Engenharia de Produção) - UFSC, Florianópolis, 2001.
GIACOBO, F.; ESTRADA, R. S.; CERETTA, P. S. Logística reversa: a satisfação do cliente no pós-venda. Revista Eletrônica de Administração (REAd/UFRGS), Porto Alegre, v. 9, n. 5, p. 01-17, 2005.
GUNASEKARAN, A.; NGAI, E.W.T. Modeling and analysis of build-to-order supply chains. European Journal of Operational Research, v. 195, p. 319-334, Jun. 2009.
HENDRICKS, K. B.; SINGHAL, V. R.; STRATMAN, J. K. The impact of enterprise systems on corporate performance: A study of ERP, SCM, and CRM system implementations. Journal of Operations Management, v. 25, p. 65-82, Jan. 2007.
JIMÉNEZ, L.; MUÑOZ, R. Integration of supply chain management and logistics: development of an electronic data interchange for SAP servers. Computer Aided Chemical Engineering, v. 21, p. 2201-2206, 2006.
E-SCM and Inventory Management: a Study of Multiple Cases in a Segment of the Department Store Chain 387
R. Gest. Tecn. Sist. Inf. /JISTEM Journal of Information Systems and Technology Management, Brazil
KOBAYASHI, S. Renovação da logística: como definir as estratégias de distribuição física global. São Paulo: Atlas, 2000.
KOH, A.; GUNASEKARAN, D. R. ERP II: The involvement, benefits and impediments of collaborative information sharing. International Journal of Production Economics, v. 113, p. 245-268, May 2008.
KOTLER, P. Administração de marketing: a edição do novo milênio. São Paulo: Prentice Hall, 2000.
LAUDON, K. C.; LAUDON, J. P. Sistemas de Informação Gerenciais. São Paulo: Prentice Hall, 2004. 562 p.
LO, W.; HONG, T.; JENG, R. A framework of E-SCM multi-agent systems in the fashion industry. International Journal of Production Economics, v. 114, p. 594-614, Aug 2008. MALHOTRA, N. K. Pesquisa de marketing: uma orientação aplicada. 3. ed. Porto Alegre: Bookman, 2001.
MATTAR, F. N. Pesquisa de marketing: metodologia, planejamento. 6. ed. São Paulo: Atlas, 2005. v. 1. 347 p.
O’BRIEN, J. A. Sistemas de informação e as decisões gerenciais na era da Internet. 2. ed. São Paulo: Saraiva, 2004.
PIRES, S. R. I. Gestão estratégica da produção. Piracicaba: Unimep, 1995.
PORTER, M. E. Vantagem competitiva: criando e sustentando um desempenho superior. Rio de janeiro: Campus, 1996.
SALAMA, K. F.; LUZZATTO, D.; SIANESI, A.; TOWILL, D. R. The value of auditing supply chains. International Journal of Production Economics, v. 128, Jan., 2009.
SALGADO JUNIOR, A. P., SEGATTO, M., FIOROTTO, J. A., BERTON, L. T., PADUA, S. I. D. O e-SCM como Suplemento aos Modelos de Séries Temporais para Previsão da Demanda: um Estudo de Caso em uma Empresa de Bebidas Carbonatadas na Região Nordeste do Estado de São Paulo. In: Enanpad, 2009, São Paulo. 2009.
SCHWITZKY, M. Acuracidade dos métodos de previsão e a sua relação com o dimensionamento dos estoques de produtos acabados. 2001. Dissertação (Mestrado em Engenharia de Produção) - UFSC, Florianópolis, 2001.
SELLTIZ, C.; WRIGHTSMAN, L. S.; COOK, S. W. Métodos de pesquisa nas relações sociais. São Paulo: EPU, 1987.
SHINGO, S. Sistemas de produção com estoque zero: o sistema shingeo para melhorias contínuas. Porto Alegre: Artes Médicas, 1996.
SILVA NETO, M. C. A utilização do ERP como ferramenta de geração de vantagens competitivas na cadeia de valor: um estudo de caso numa empresa siderúrgica. 2002. Dissertação (Mestrado em Economia) - Faculdade de Ciências Econômicas da UFMG, Belo Horizonte, 2002.
SLACK, N.; CHAMBERS; S.; JOHNSTON; R. Administração da produção. 2. ed. São Paulo: Atlas, 2002.
388 Salgado Junior, A. P., Novi, J. C., Pacagnella Junior, A. C.
Vol.8, No. 2, 2011, p. 367-388
SOUZA, C. A.; SACCOL, A. Z. (org). Sistemas ERP no Brasil: teoria e casos. São Paulo: Atlas, 2003.
SOROOR, J.; TAROKH, M. J.; SHEMSHADI, A. Initiating a state of the art system for real-time SCM coordination. European Journal of Operational Research, v. 196, p. 635-650, Jul., 2009.
THEMISTOCLEOUS, M.; IRANI, Z.; LOVE, P. E. D. Evaluating the integration of supply chain information systems: A case study. European Journal of Operational Research, v. 159, p. 393-405, Dec. 2004.
YIN, R. K. Case study research: design and methods. USA: Sage Publications Inc., 2001.