Embed Size (px)
Citation preview

E-RSC WORKING GROUP
Response of: Entergy Services, Inc. on behalf of the Entergy Operating Companies (collectively Entergy)
To the E-RSC Working Group Request Dated April 14, 2010 Question No.: E-RSC 2-1 Part No.: Addendum: Question: What is the total merchant generation currently interconnected to the Entergy transmission system? Please provide as a list with the location of the generators.
Response:
Entergy has assumed that the term “merchant generation” is intended to include independent power producers and qualifying facilities. There is approximately 14,000 MW of independent power producer generation and approximately 8,000 MW of qualifying facility generation currently interconnected to the Entergy transmission system. A list with the location of the generators is attached.
1

GENERATOR NAME LOCATIONTenaska Frontier Grimes County, TXLSP Energy Batesville, MSPine Bluff Energy Pine Bluff, ARDuke Energy Southaven Southaven, MSSouthaven Power, LLC Southaven, MSTPS Dell Mississippi, ARAcadia Power Partners Acadia Parish, LAKGen Hot Springs (f/k/a Duke Energy Hot Spring) Malvern, ARKGen Southaven LLC f/k/a Duke Energy Southaven, LLC (restated and amended) Compliance Filing Southaven, MSReliant Energy Wholesale Generation (f/k/a Reliant Energy Choctaw County) Choctaw County, MSKGen Hinds (f/k/a Duke Energy Hinds) Jackson, MSHot Spring Power (Tractebel) Hot Spring County, ARCottonwood Entergy Newton County, TXPlum Point Energy Mississippi, ARUnion Power Partners, L.P. El Dorado, AR

PLANT NAME LOCATIONPlant 31 Paper Mill West Monroe, LAColonial Sugar Refinery Gramercy, LALouisiana 1 Baton Rouge, LALaO Energy Systems Plaquemine, LAInternational Paper Louisiana Mill Bastrop, LAGeorgia Pacific Crossett Crossett, ARIMC Phosphates Company Uncle Sam Uncle Sam, LAGramercy Alumina LLC Gramercy, LAPort Arthur Refinery Port Arthur, TXPort Arthur Refinery Port Arthur, TXPPG Powerhouse C Lake Charles, LAExxonMobil Beaumont Refinery Beaumont, TXTerra Mississippi Nitrogen Yazoo City, MSNew Orleans New Orleans, LASt Francisville Mill Francisville, LAGeismar Geismar, LAFormosa Plastics Baton Rouge, LAPPG Plant C Caustic Lake Charles, LAPCS Nitrogen Fertilizer LP Geismar, LAGeorgia Pacific Port Hudson Zachary, LASabine River Works Orange, TXPort Arthur Texas Refinery Port Arthur, TXPort Allen Port Allen, LAExxonMobil Baton Rouge Turbine Generator Baton Rouge, LAPotlatch Southern Wood Products Warren, ARJCO Oxides Olefins Plant Port Neeches, TXPort Neches Plant Port Neches, TXErgon Refining Vicksburg Vicksburg, MSDow St Charles Operations Taft, LAGeorgia Gulf Plaquemine Plaquemine, LAOak Point Cogen Belle Chasse, LAGaylord Container Bogalusa Bogalusa, LAGeismar Cogen Geismar, LASabine Cogen Orange, TXAir Products Port Arthur Port Arthur, TXPine Bluff Energy Center Pine Bluff, ARShell Chemical Geismar, LARS Cogen Lake Charles, LATaft Cogeneration Facility Hahnville, LACarville Energy LLC St Gabriel, LAPlaquemine Cogeneration Plant Plaquemine, LA
E-RSC WORKING GROUP
Response of: Entergy Services, Inc. on behalf of the Entergy Operating Companies (collectively Entergy)
To the E-RSC Working Group Request Dated April 14, 2010 Question No.: E-RSC 2-3 Part No.: Addendum: Question: How often in 2007, 2008, and 2009 did merchant generators overgenerate?
Response:
See the attached.

IPP Overgeneration 2007-2009Percent of online hours that were overgenerated *
GENERATOR CODE Y2007 Y2008 Y2009A 97%B 83% 79% 73%C - D 85% 84% 82%E 100% 100%F 70% 80% 85%G 53%H 61% 72% 64%I 86% 77% 79%J 69%K - - L 58% 73% 74%M - - - N 10% 9%O 76% 69% 66%P - 100%
* Overgeneration of Startup/Shutdown and Test hours are not included in calculation

E-RSC WORKING GROUP
Response of: Entergy Services, Inc. on behalf of the Entergy Operating Companies (collectively Entergy)
To the E-RSC Working Group Request Dated April 14, 2010 Question No.: E-RSC 4 Part No.: Addendum: Question: Does Entergy for[e]cast QF puts? If so, describe the methodology.
Response:
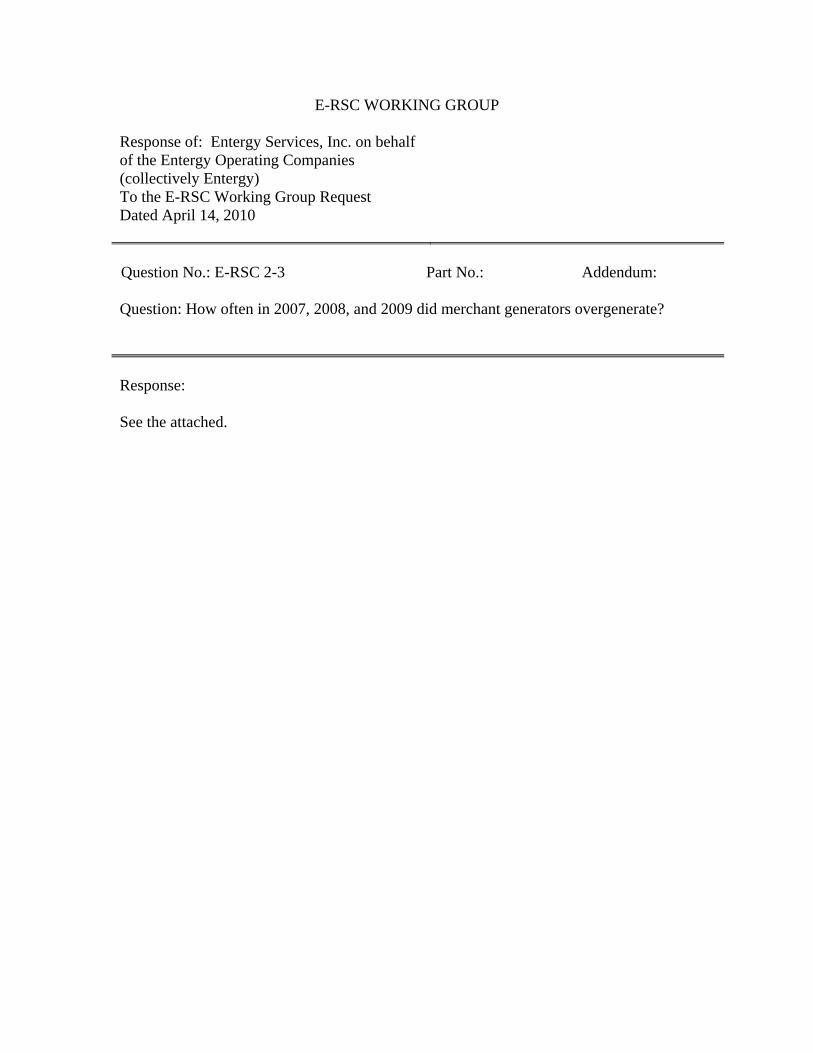
Yes. Entergy’s System Planning and Operations (SPO) group forecasts QF puts for use in its production planning processes. See the attached document for a high level description of the approaches used by SPO over the various production planning horizons. In general, the methodology relies on the historical QF put data adjusted for any known changes. Additionally, Entergy’s Transmission Business Unit (TBU) forecasts QF puts for next-day reliability and outage coordination studies. For the next-day reliability studies, QF put is modeled based on information provided by the QF’s to TBU. If no information is provided, the QF put is modeled based on run levels for the previous seven days. For outage coordination studies, QF put is modeled at maximum for one iteration and offline for another iteration to identify worst-case scenarios. Finally, Entergy’s Weekly Operations Group is in the process of developing a forecast methodology with the ICT for use in the WPP. No final methodology has been established for the WPP.
Description of QF Put Forecasting By SPO
Next Day/Next Week Monthly Annual and Longer
Time frame Focus on tomorrow – but also for next week
Developed in the first week of current month for next month
Up to 5 years
Use of Forecast For WPP flex requirement (next week forecast)
For next-day commitment schedules (next day forecast)
Monthly Energy Plan (for fuel purchases, wholesale energy purchases month-ahead)
Resource planning and long-term procurements.
Granularity 168 hours Hourly for 31 days Hourly with weekly profile, same week used for 3 months of each season
Geographic/Electrical Location
Four zones - North, South, WOTAB and Amite South
Four zones - North, South, WOTAB and Amite South
23 QFs forecast for and modeled individually.

Description of QF Put Forecasting By SPO
Components/adjustments Historical data source:
- Injection (total)
- Sell-off (third-parties)
- Bi-laterals (EMO)
Leaves put-quantity
Adjust for next-week load forecast to recent similar weeks
Adjust for QF outages (if known) – usually only units under contract, or if QFs request maintenance or standby power
Historical data source:
Same month for prior 3 years – weighting given to most recent year’s data.
- Weather normalized
- May also adjust for recent months/events – e.g. long-term outages on QFs.
Adjust for long-term contracts with EMO (e.g. Occidental QF),
Historical data from Intra-System Billing
- Up to 5 years of data may be used to develop the forecast
- Simple “average” of the hourly values by day and by season (i.e. repeat 1 week for 3 months of each season)
- Adjusted for long-term contracts between EMO and the QF
- No adjustments for weather, load, fuel or energy prices
Sources of Data Energy Management System
Major accounts billing
Expected outages from Contracts group
Same data uses as monthly forecast.
ISB billing data.

E-RSC WORKING GROUP
Response of: Entergy Services, Inc. on behalf of the Entergy Operating Companies (collectively Entergy)
To the E-RSC Working Group Request Dated April 14, 2010 Question No.: E-RSC 2-5 Part No.: Addendum: Question: Describe and provide the amount of energy due to imbalance energy as a result of IPP ramping that occurred in 2007, 2008 and 2009.
Response: Imbalance energy created as a result of ramping is a subset of imbalance energy generally. Entergy does not separately track, or have a readily available means to calculate, the amount of imbalance energy that is due to ramping as opposed to other causes.
1

E-RSC WORKING GROUP
Response of: Entergy Services, Inc. on behalf of the Entergy Operating Companies (collectively Entergy)
To the E-RSC Working Group Request Dated April 14, 2010 Question No.: E-RSC 2-6 Part No.: Addendum: Question: What were the costs associated with merchant overgeneration and IPP ramping? How were these costs recovered?
Response: Costs associated with merchant overgeneration and IPP ramping are a subset of imbalance and regulation costs that are recovered through generator imbalance and generator regulation services under Attachment P to the Entergy OATT. The methodology used to calculate overall imbalance and regulation costs does not include a means for separating out the costs associated just with ramping. Because Entergy does not separately track the amount of imbalance energy that is due solely to ramping as opposed to other causes, there is no readily available means to separately calculate the costs associated just with ramping.
1

E-RSC WORKING GROUP
Response of: Entergy Services, Inc. on behalf of the Entergy Operating Companies (collectively Entergy)
To the E-RSC Working Group Request Dated April 14, 2010 Question No.: E-RSC 2-8 Part No.: Addendum: Question: On page 46, lines 5-12 (Hurstell Testimony), John discusses the dispatcher not knowing whether imbalance energy would increase or decrease during the remainder of the hour. Why is this the case? What are the purpose of the schedules? What information is included in the schedules?
Response:
The purpose of a schedule is to provide information regarding the expected deliveries of energy associated with the transmission of energy. In addition to general transaction information, a schedule includes before-the fact information regarding the expected quantity of energy to be transmitted and the planned timing of the delivery. Energy Imbalances occur when, in actual real-time operations, the output of a generator does not match its schedules, either by over- or under-delivering. Although the Entergy Services dispatcher is fully aware of the sum of the schedules into and out of the Entergy System Balancing authority, the dispatcher has no means of determining which generators will not be delivering per their schedules, and has no means to be able to anticipate by how much or in which direction those imbalances will be.

E-RSC WORKING GROUP
Response of: Entergy Services, Inc. on behalf of the Entergy Operating Companies (collectively Entergy)
To the E-RSC Working Group Request Dated April 14, 2010 Question No.: E-RSC 2-10 Part No.: Addendum: Question: What are the ramp up/down rates for all units used to meet flexible capability requirements? Is demand response used to help meet these requirements?
Response:
See Entergy’s Response to Question 2-7 for the ramp rates. In general, any unit that is operating can contribute to meeting a portion of the flexible capability requirements. As noted in the response to Question 2-7, nuclear units are very seldom called upon to change load to help meet flexible capability requirements. The Entergy Operating Companies have no retail tariffs that provide for “demand response” to meet the flexible capability requirements of the Entergy System.

E-RSC WORKING GROUP
Response of: Entergy Services, Inc. on behalf of the Entergy Operating Companies (collectively Entergy)
To the E-RSC Working Group Request Dated April 14, 2010 Question No.: E-RSC 2-12 Part No.: Addendum: Question: Provide the cost-allocation percentages for each Operating Company by function (generation, transmission, distribution, administration)
Response:
Entergy Services understands this request to be related to the plant ratios and labor ratios that may be used for allocation of general and intangible plant as well as administrative and general expenses. Plant ratios would be a reasonable mechanism for allocating general plant and determines as follows:
Production Plant Ratio = Total Production Plant / (Total Production Plant + Total Transmission Plant + Total Distribution Plant) Transmission Plant Ratio = Total Transmission Plant / (Total Production Plant + Total Transmission Plant + Total Distribution Plant) Distribution Plant Ratio = Total Distribution Plant / (Total Production Plant + Total Transmission Plant + Total Distribution Plant)
Labor ratios would be a reasonable mechanism for allocating administrative and general expense and are determined as follows:
Production Labor Ratio = Production Labor / (Production Labor + Transmission Labor + Distribution Labor + Customer Accounts Labor + Customer Service and Informational Labor) Transmission Labor Ratio = Transmission Labor / (Production Labor + Transmission Labor + Distribution Labor + Customer Accounts Labor + Customer Service and Informational Labor) Distribution & Customer Labor Ratio = (Distribution Labor + Customer Accounts Labor + Customer Service and Informational Labor) / (Production Labor + Transmission Labor + Distribution Labor + Customer Accounts Labor + Customer Service and Informational Labor)
A calculation of these allocation percentages based upon the Entergy Operating Companies FERC Form 1 for 2008 is attached.

Page No.
Line No.
FERC FORM 1 Title of Account
Acct No.
Entergy Arkansas,
Inc.
Entergy Gulf States
Louisiana, L.L.C.
Entergy Louisiana,
LLC
Entergy Mississippi,
Inc.
Entergy New
Orleans, Inc.
Entergy Texas, Inc.
12/31/09 12/31/09 12/31/09 12/31/09 12/31/09 12/31/09 Utility Plant - Total Company
204 7 A. Steam Production Plant 204 16g TOTAL Steam Production Plant (Enter totals of line 8 thru 15) 850,376 975,229 719,700 721,869 177,497 866,698 204 17 B. Nuclear Production Plant 204 25g TOTAL Nuclear Production Plant (Enter totals of line 18 thru 24) 2,327,929 3,385,454 2,811,126 0 0 0 204 26 C. Hydraulic Production Plant 204 35g TOTAL Hydraulic Production Plant (Enter total of lines 27 thru 34) 34,689 0 0 0 0 256 204 36 D. Other Production Plant 206 45g TOTAL Other Production Plant (Enter total of lines 37 thru 44) 294,952 259,952 344,939 94,904 0 0
TOTAL PRODUCTION PLANT TOTAL Production Plant 3,507,946 4,620,635 3,875,765 816,773 177,497 866,954
200 4c Property Under Capital Leases 1,364 0 262,111 6,418 0 0 TOTAL Production Plant plus Pro Under Cap Lease 3,509,310 4,620,635 4,137,876 823,191 177,497 866,954 TRANSMISSION PLANT
207 58g TOTAL Transmission Plant (Enter total of lines 48 thru 57) 1,193,074 791,015 995,341 697,345 83,624 792,373 DISTRIBUTION PLANT
207 75g TOTAL Distribution Plant (Enter total of lines 60 thru 74) 2,389,264 1,187,103 2,010,814 1,249,914 415,865 1,172,974 PLANT RATIOS PPLT = TOTAL Production Plant plus Pro Under Cap Lease 3,509,310 4,620,635 4,137,876 823,191 177,497 866,954 TPLT = TOTAL Transmission Plant 1,193,074 791,015 995,341 697,345 83,624 792,373 DPLT = TOTAL Distribution Plant 2,389,264 1,187,103 2,010,814 1,249,914 415,865 1,172,974 PPR = Production Plant Ratio = PPLT / (PPLT + TPLT + DPLT) 0.4949 0.7002 0.5792 0.2971 0.2622 0.3061 TPR = Transmission Plant Ratio = TPLT / (PPLT + TPLT + DPLT) 0.1682 0.1199 0.1393 0.2517 0.1235 0.2798 DPR = Distribution Plant Ratio = DPLT / (PPLT + TPLT + DPLT) 0.3369 0.1799 0.2815 0.4512 0.6143 0.4141 LABOR RATIOS
354 20 Production (Lines 3 and 13) 8,825 6,707 14,803 11,802 3,337 9,488 354 21 Transmission (Lines 4 and 14) 4,856 2,399 3,742 2,857 13 1,996 354 22 Regional Market (Lines 5 and 15) 0 0 0 0 0 0 354 23 Distribution (Lines 6 and 16) 19,166 7,510 13,490 10,099 3,483 11,349 354 24 Customer Accounts (Transcribe Line 7) 5,474 1,366 2,359 3,206 1,113 2,244 354 25 Customer Service and Informational (Transcribe Line 8) 2,956 151 197 1,955 447 2,924
PLR = Production Labor Ratio = Line 20 / (Line 20 thru 25) 0.2138 0.3699 0.4279 0.3945 0.3976 0.3388 TLR = Transmission Labor Ratio = Line 21 / (Line 20 thru 25) 0.1176 0.1323 0.1082 0.0955 0.0015 0.0713 DLR = Distribution & Customer Labor Ratio = Line 20 / (Line 20 thru 25) 0.6686 0.4978 0.4639 0.5100 0.6009 0.5899

ENTERGY SERVICES, INC.
ENTERGY REGIONAL STATE COMMITTEE AND E-RSC WORKING GROUP
Response of: Entergy Services, Inc. on behalf of the Entergy Operating Companies (collectively Entergy)
to the Second Set of Data Requests of Requesting Party: E-RSC Working Group Question No.: E-RSC 2-12 Part No.: Addendum: 1 Question: Provide the cost-allocation percentages for each Operating Company by function (generation, transmission, distribution, administration.) Addendum 1: Question: Please provide the transmission responsibility ratios between operating companies. Response: Entergy Services understands this request to be related to the plant ratios and labor ratios that may be used for allocation of general and intangible plant as well as administrative and general expenses. Plant ratios would be a reasonable mechanism for allocation general plant and determines as follows: Production Plant Ration = Total Production Plant / (Total Production Plant +
Total Transmission Plant + Total Distribution Plant) Transmission Plant Ratio = Total Transmission Plant / (Total Production Plant +
Total Transmission Plant + Total Distribution Plant) Distribution Plant Ratio = Total Distribution Plant / (Total Production Plant + Total Transmission Plant + Total Distribution Plant)
Labor ratios would be a reasonable mechanism for allocating administrative and general expense and are determined as follows: Production Labor ratio = Production Labor / (Production Labor + Transmission
Labor + Distribution Labor + Customer Accounts Labor + Customer Service and Informational Labor)
E-RSC SMF 1

Transmission Labor Ratio = Transmission Labor / (Production Labor + Transmission Labor + Distribution Labor + Customer Accounts Labor + Customer Service and Informational Labor)
Distribution & Customer Labor Ratio = (Distribution Labor + Customer Accounts Labor + Customer Service and Information Labor) / (Production Labor + Transmission Labor + Distribution Labor + Customer Accounts Labor + Customer Service and Informational Labor)
A calculation of these allocation percentages based upon the Entergy Operating Companies FERC Form 1 for 2008 is attached. Addendum 1: Response:
Coincident Peaks
Year Month Day Hour System AR LA MS NO EGSL ETI 2009 1 16 8 16,506,157 3,708,603 4,247,480 2,239,637 713,157 3,208,939 2,388,341 2009 2 5 7 15,763,644 3,439,228 4,130,020 2,149,734 678,920 3,121,869 2,243,873 2009 3 2 8 14,672,935 3,398,604 3,767,288 1,932,508 645,077 2,761,626 2,167,832 2009 4 29 17 14,485,370 2,949,760 4,120,804 1,945,509 626,400 2,674,106 2,168,791 2009 5 13 17 16,881,585 3,263,841 4,558,353 2,325,774 779,773 3,241,979 2,711,865 2009 6 24 16 21,009,300 4,489,240 5,251,990 3,074,364 997,806 4,039,763 3,156,137 2009 7 2 16 20,315,591 4,076,863 5,207,245 2,960,579 960,099 3,864,056 3,246,749 2009 8 4 16 20,101,486 4,324,354 4,993,599 2,920,060 905,162 3,857,302 3,101,009 2009 9 8 16 17,862,153 3,869,835 4,425,476 2,654,407 762,423 3,416,029 2,733,983 2009 10 8 17 17,406,013 3,253,529 4,712,385 2,334,233 855,957 3,496,835 2,753,074 2009 11 30 19 13,169,522 2,882,481 3,459,065 1,773,006 537,250 2,423,272 2,094,448 2009 12 4 19 15,579,240 3,136,412 4,106,363 1,991,290 704,067 3,021,809 2,619,299
Total 42,792,750 52,980,068 28,301,101 9,166,091 39,127,585 31,385,401 12-Month Average 3,566,062 4,415,005 2,358,425 763,840 3,260,632 2,615,450 Responsibility Ratio 0.2100 0.2600 0.1389 0.0450 0.1920 0.1541
E-RSC SMF 2
E-RSC WORKING GROUP
Response of: Entergy Services, Inc. on behalf of the Entergy Operating Companies (collectively Entergy)
To the E-RSC Working Group Request Dated April 14, 2010 Question No.: E-RSC 2-13 Part No.: Addendum: Question: Provide three paper copies of all the Entergy Operating Company FERC Form 1s for 2007, 2008 and 2009.
Response:
Copies of FERC Form 1s for 2007 and 2008 have been mailed to Sam Loudenslager. The 2009 FERC Form 1s has not been completed and thus is not available.