Embed Size (px)
Citation preview
Research Article Open Access
Gaye et al., J Material Sci Eng 2016, 6:1DOI: 10.4172/2169-0022.1000309
Research Article OMICS International
Journal of Material Sciences & Engineering Jo
urna
l of M
aterial Sciences & Engineering
ISSN: 2169-0022
Volume 6 • Issue 1 • 1000309J Material Sci Eng, an open access journalISSN: 2169-0022
Study and Optimization of a Photovoltaic Mill System Functioning on the Course of the SunGaye TA1, Dieng B1*, Sow O2, Mbodji S1 and Sissoko G3
1Department of Physics, UFR Applied Sciences and Information and Communication Technologies, Alioune Diop University of Bambey, Senegal2University of Thies, Senegal 3Department of Physics, Faculty of Science and Technology, Cheikh Anta Diop University of Dakar, Senegal
AbstractThis communication is centered on the optimization of a photovoltaic mill system performance operating on the
sun race. According to the character of the alimented charge which is a DC motor that is running a cereal mill and the meteorological conditions (temperature and light), we can find a big difference between the potential maximal power and the other on which is really transferred to the charge. In order to ameliorate the global output of the system, we use an adapted circuit composed of a boost converter remoted by Pulse Width Modulation (PWM) with a MPPT command (Maximum Power Point Tracking). With the Perturb and Observe ((P&O) algorithm, the MPPT control measure the current and the pressure of the photovoltaic generator field to calculate the power released by this one. According to the result obtained, the MPPT control will adjust the cyclical report of the converter to bring the system to the optimal functioning point. The modelisation then simulation of the system (PV generator, boost converter, Pulse Width Modulation which the MPPT algorithm as for as the direct current charge) are after done with the Matlab/Simulink software.
*Corresponding author: Dieng B, Department of Physics, UFR Applied Sciences and Information and Communication Technologies, Alioune Diop University of Bambey, Senegal, Tel: 221339733086; E-mail: [email protected]
Received August 29, 2016; Accepted December 14, 2016; Published December 24, 2016
Citation: Gaye TA, Dieng B, Sow O, Mbodji S, Sissoko G (2016) Study and Optimization of a Photovoltaic Mill System Functioning on the Course of the Sun. J Material Sci Eng 6: 309. doi: 10.4172/2169-0022.1000309
Copyright: © 2016 Gaye TA, et al. This is an open-access article distributed under the terms of the Creative Commons Attribution License, which permits unrestricted use, distribution, and reproduction in any medium, provided the original author and source are credited.
Keywords: PV system; PV generator; Boost converter; PWM signal; MPPT control; Perturbation and observation; DC motor; Mill; Matlab/Simulink
IntroductionCurrently, solar photovoltaic is no longer limited to light of the
bright spots or of powering home devices, but also to power income generating productive equipment, particularly grain mills [1]. Unfortunately, the solar panels offered by manufacturers are still expensive, despite the many efforts by researchers to improve the efficiency of photovoltaic cells [2]. Thus, the use of a solar mill can be considered only in remote areas of the grid. In these circumstances, the use of a photovoltaic generator (PVG) must be subjected to certain requirements:
• The system should be as simple as possible
• The efficiency of the photovoltaic generator must be optimized
• The system must operate automatically and reliably
In this study, we are interested in solar system operating mill "over the sun" to avoid the use of expensive storage batteries and often of mediocre performance. The simplest system, we can have in this case is to directly couple of the PV generator to a DC load (DC motor-mill group for example). But generally, the operating point of the DC load does not match the optimum operating point of the PVG [3-5]. This means that all the energy produced by the PVG is not transmitted to the load.
In order to optimize the system performances, we use a matching circuit composed of a boost converter. This circuit can extract every moment the maximum power available at the terminals of the photovoltaic field and transfer that on the load. This thanks to an order by pulse width modulation (PWM) with a maximum power point tracking (MPPT) strategy.
In this paper, we propose a study of modellization and simulation under Matlab/Simulink of the various components of the PV system and we present the simulation results and discussions for direct connection and the connection optimized by the MPPT technology.
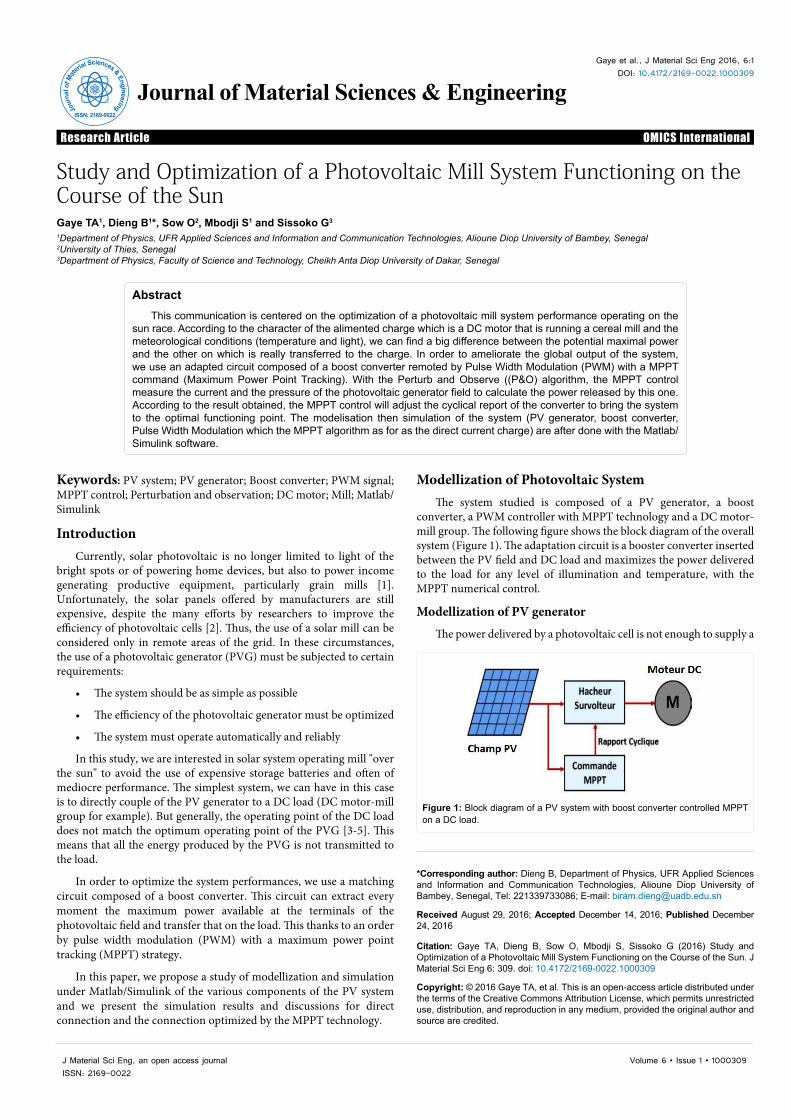
Modellization of Photovoltaic SystemThe system studied is composed of a PV generator, a boost
converter, a PWM controller with MPPT technology and a DC motor-mill group. The following figure shows the block diagram of the overall system (Figure 1). The adaptation circuit is a booster converter inserted between the PV field and DC load and maximizes the power delivered to the load for any level of illumination and temperature, with the MPPT numerical control.
Modellization of PV generator
The power delivered by a photovoltaic cell is not enough to supply a
Figure 1: Block diagram of a PV system with boost converter controlled MPPT on a DC load.
Citation: Gaye TA, Dieng B, Sow O, Mbodji S, Sissoko G (2016) Study and Optimization of a Photovoltaic Mill System Functioning on the Course of the Sun. J Material Sci Eng 6: 309. doi: 10.4172/2169-0022.1000309
Page 2 of 6
Volume 6 • Issue 1 • 1000309J Material Sci Eng, an open access journalISSN: 2169-0022
DC load of the size of a motor-mill group. We need to combine multiple cells in series and in parallel to form a module and attain the desired power. Similarly, the interconnection of multiple modules together in series and in parallel provides an even higher power, hence the concept of the photovoltaic generator (PVG) [6].
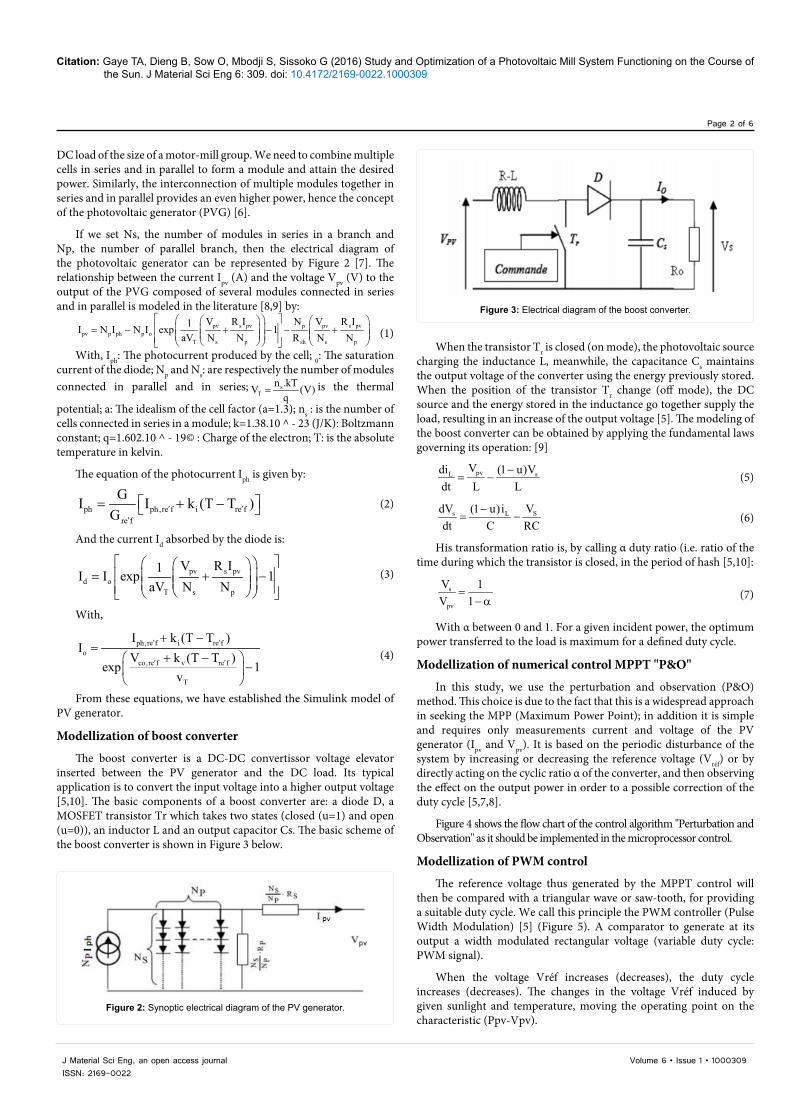
If we set Ns, the number of modules in series in a branch and Np, the number of parallel branch, then the electrical diagram of the photovoltaic generator can be represented by Figure 2 [7]. The relationship between the current Ipv (A) and the voltage Vpv (V) to the output of the PVG composed of several modules connected in series and in parallel is modeled in the literature [8,9] by:
pv s pv p pv s pvpv p ph p o
T s p sh s p
V R I N V R I1I N I N I exp 1aV N N R N N
= − + − − +
(1)
With, Iph: The photocurrent produced by the cell; 0: The saturation current of the diode; Np and Ns: are respectively the number of modules connected in parallel and in series; s
Tn .kTV (V)
q= is the thermal
potential; a: The idealism of the cell factor (a=1.3); ns : is the number of cells connected in series in a module; k=1.38.10 - 23 (J/K): Boltzmann constant; q=1.602.10 ^ - 19© : Charge of the electron; T: is the absolute temperature in kelvin.
The equation of the photocurrent Iph is given by:
ph ph,re f i re fre f
GI I k (T T )G ′ ′
′
= + − (2)
And the current Id absorbed by the diode is:
pv s pvd o
T s p
V R I1I I exp 1aV N N
= + −
(3)
With,
ph,re f i re fo
co,re f v re f
T
I k (T T )I
V k (T T )exp 1
v
′ ′
′ ′
+ −=
+ − −
(4)
From these equations, we have established the Simulink model of PV generator.
Modellization of boost converter
The boost converter is a DC-DC convertissor voltage elevator inserted between the PV generator and the DC load. Its typical application is to convert the input voltage into a higher output voltage [5,10]. The basic components of a boost converter are: a diode D, a MOSFET transistor Tr which takes two states (closed (u=1) and open (u=0)), an inductor L and an output capacitor Cs. The basic scheme of the boost converter is shown in Figure 3 below.
When the transistor Tr is closed (on mode), the photovoltaic source charging the inductance L, meanwhile, the capacitance Cs maintains the output voltage of the converter using the energy previously stored. When the position of the transistor Tr change (off mode), the DC source and the energy stored in the inductance go together supply the load, resulting in an increase of the output voltage [5]. The modeling of the boost converter can be obtained by applying the fundamental laws governing its operation: [9]
pvL sVdi (1 u)Vdt L L
−= − (5)
s L SdV (1 u)i Vdt C RC
−= − (6)
His transformation ratio is, by calling α duty ratio (i.e. ratio of the time during which the transistor is closed, in the period of hash [5,10]:
s
pv
V 1V 1
=− α (7)
With α between 0 and 1. For a given incident power, the optimum power transferred to the load is maximum for a defined duty cycle.
Modellization of numerical control MPPT "P&O"
In this study, we use the perturbation and observation (P&O) method. This choice is due to the fact that this is a widespread approach in seeking the MPP (Maximum Power Point); in addition it is simple and requires only measurements current and voltage of the PV generator (Ipv and Vpv). It is based on the periodic disturbance of the system by increasing or decreasing the reference voltage (Vréf) or by directly acting on the cyclic ratio α of the converter, and then observing the effect on the output power in order to a possible correction of the duty cycle [5,7,8].
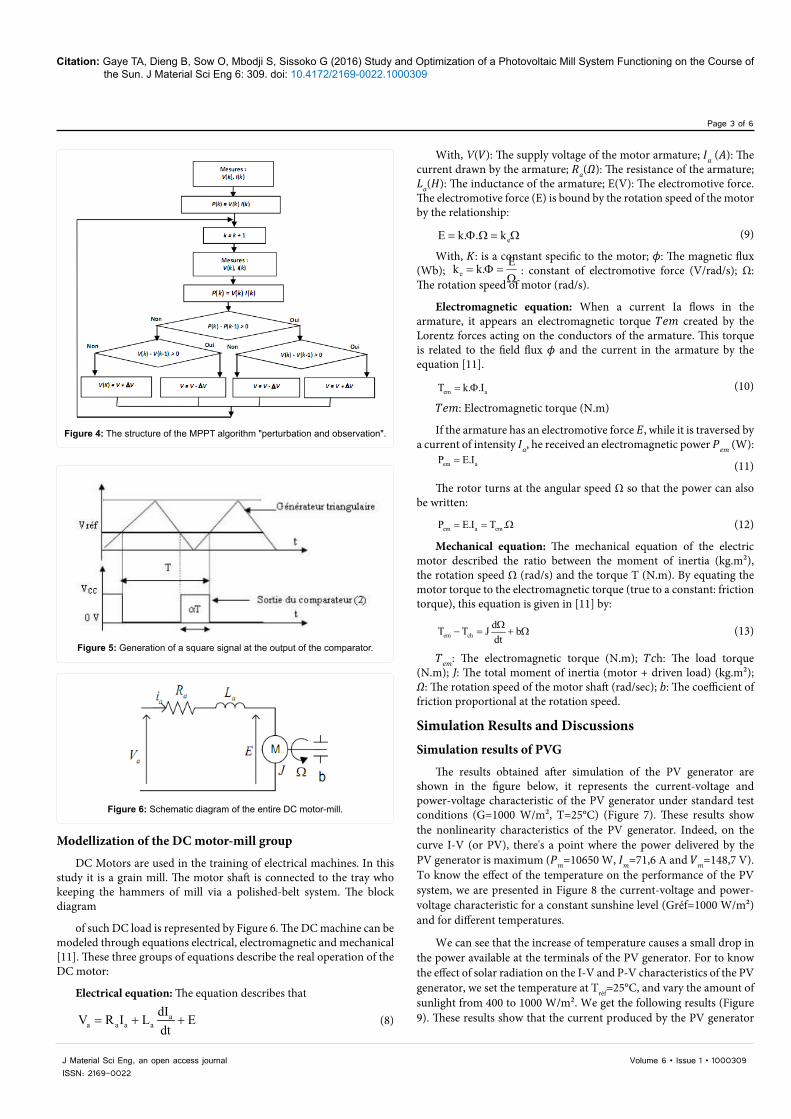
Figure 4 shows the flow chart of the control algorithm "Perturbation and Observation" as it should be implemented in the microprocessor control.
Modellization of PWM control
The reference voltage thus generated by the MPPT control will then be compared with a triangular wave or saw-tooth, for providing a suitable duty cycle. We call this principle the PWM controller (Pulse Width Modulation) [5] (Figure 5). A comparator to generate at its output a width modulated rectangular voltage (variable duty cycle: PWM signal).
When the voltage Vréf increases (decreases), the duty cycle increases (decreases). The changes in the voltage Vréf induced by given sunlight and temperature, moving the operating point on the characteristic (Ppv-Vpv).
Figure 2: Synoptic electrical diagram of the PV generator.
Figure 3: Electrical diagram of the boost converter.
Citation: Gaye TA, Dieng B, Sow O, Mbodji S, Sissoko G (2016) Study and Optimization of a Photovoltaic Mill System Functioning on the Course of the Sun. J Material Sci Eng 6: 309. doi: 10.4172/2169-0022.1000309
Page 3 of 6
Volume 6 • Issue 1 • 1000309J Material Sci Eng, an open access journalISSN: 2169-0022
Modellization of the DC motor-mill group
DC Motors are used in the training of electrical machines. In this study it is a grain mill. The motor shaft is connected to the tray who keeping the hammers of mill via a polished-belt system. The block diagram
of such DC load is represented by Figure 6. The DC machine can be modeled through equations electrical, electromagnetic and mechanical [11]. These three groups of equations describe the real operation of the DC motor:
Electrical equation: The equation describes that
aa a a a
dIV R I L Edt
= + + (8)
With, V(𝑉): The supply voltage of the motor armature; 𝐼𝑎 (𝐴): The current drawn by the armature; 𝑅𝑎(𝛺): The resistance of the armature; 𝐿𝑎(𝐻): The inductance of the armature; E(V): The electromotive force. The electromotive force (E) is bound by the rotation speed of the motor by the relationship:
eE k. . k= Φ Ω = Ω (9)
With, 𝐾: is a constant specific to the motor; 𝜙: The magnetic flux (Wb); e
Ek k.= Φ =Ω
: constant of electromotive force (V/rad/s); Ω: The rotation speed of motor (rad/s).
Electromagnetic equation: When a current Ia flows in the armature, it appears an electromagnetic torque 𝑇𝑒𝑚 created by the Lorentz forces acting on the conductors of the armature. This torque is related to the field flux 𝜙 and the current in the armature by the equation [11].
em aT k. .I= Φ (10)
𝑇𝑒𝑚: Electromagnetic torque (N.m)
If the armature has an electromotive force 𝐸, while it is traversed by a current of intensity 𝐼𝑎, he received an electromagnetic power 𝑃𝑒𝑚 (W):
em aP E.I= (11)
The rotor turns at the angular speed Ω so that the power can also be written:
em a emP E.I T .= = Ω (12)
Mechanical equation: The mechanical equation of the electric motor described the ratio between the moment of inertia (kg.m²), the rotation speed Ω (rad/s) and the torque T (N.m). By equating the motor torque to the electromagnetic torque (true to a constant: friction torque), this equation is given in [11] by:
em chdT T J bdtΩ
− = + Ω (13)
𝑇𝑒𝑚: The electromagnetic torque (N.m); 𝑇𝑐h: The load torque (N.m); J: The total moment of inertia (motor + driven load) (kg.m²); 𝛺: The rotation speed of the motor shaft (rad/sec); 𝑏: The coefficient of friction proportional at the rotation speed.
Simulation Results and DiscussionsSimulation results of PVG
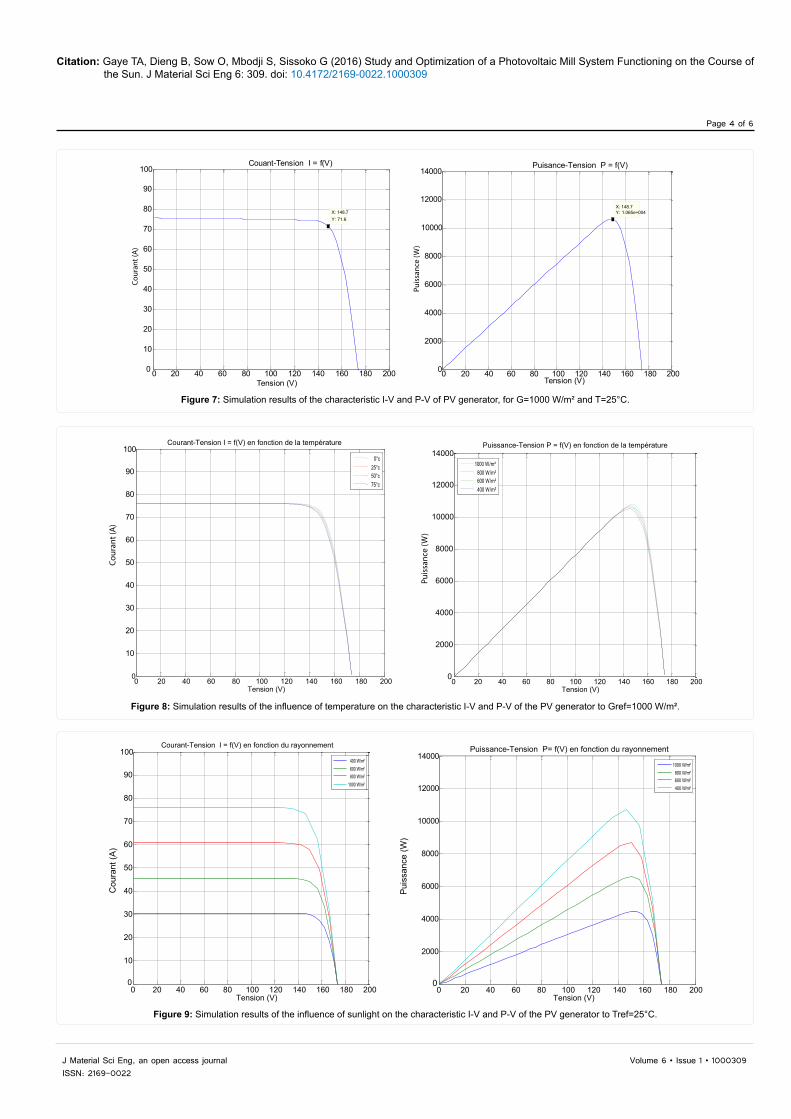
The results obtained after simulation of the PV generator are shown in the figure below, it represents the current-voltage and power-voltage characteristic of the PV generator under standard test conditions (G=1000 W/m², T=25°C) (Figure 7). These results show the nonlinearity characteristics of the PV generator. Indeed, on the curve I-V (or PV), there's a point where the power delivered by the PV generator is maximum (𝑃𝑚=10650 W, 𝐼𝑚=71,6 A and 𝑉𝑚=148,7 V). To know the effect of the temperature on the performance of the PV system, we are presented in Figure 8 the current-voltage and power-voltage characteristic for a constant sunshine level (Gréf=1000 W/m²) and for different temperatures.
We can see that the increase of temperature causes a small drop in the power available at the terminals of the PV generator. For to know the effect of solar radiation on the I-V and P-V characteristics of the PV generator, we set the temperature at Tréf=25°C, and vary the amount of sunlight from 400 to 1000 W/m². We get the following results (Figure 9). These results show that the current produced by the PV generator
Figure 4: The structure of the MPPT algorithm "perturbation and observation".
Figure 5: Generation of a square signal at the output of the comparator.
Figure 6: Schematic diagram of the entire DC motor-mill.
Citation: Gaye TA, Dieng B, Sow O, Mbodji S, Sissoko G (2016) Study and Optimization of a Photovoltaic Mill System Functioning on the Course of the Sun. J Material Sci Eng 6: 309. doi: 10.4172/2169-0022.1000309
Page 4 of 6
Volume 6 • Issue 1 • 1000309J Material Sci Eng, an open access journalISSN: 2169-0022
0 20 40 60 80 100 120 140 160 180 2000
10
20
30
40
50
60
70
80
90
100
X: 148.7Y: 71.6
Tension (V)
Couant-Tension I = f(V)
0 20 40 60 80 100 120 140 160 180 2000
2000
4000
6000
8000
10000
12000
14000
X: 148.7Y: 1.065e+004
Tension (V)
Puisance-Tension P = f(V)
Puis
sanc
e (W
)
Cour
ant (
A)
Figure 7: Simulation results of the characteristic I-V and P-V of PV generator, for G=1000 W/m² and T=25°C.
0 20 40 60 80 100 120 140 160 180 2000
10
20
30
40
50
60
70
80
90
100
Tension (V)
Courant-Tension I = f(V) en fonction de la température
0°c 25°c 50°c 75°c
0 20 40 60 80 100 120 140 160 180 2000
2000
4000
6000
8000
10000
12000
14000
Tension (V)
Puissance-Tension P = f(V) en fonction de la température
1000 W/m² 800 W/m² 600 W/m² 400 W/m²
Puis
sanc
e (W
)
Cour
ant (
A)
Figure 8: Simulation results of the influence of temperature on the characteristic I-V and P-V of the PV generator to Gref=1000 W/m².
0 20 40 60 80 100 120 140 160 180 2000
10
20
30
40
50
60
70
80
90
100
Tension (V)
Courant-Tension I = f(V) en fonction du rayonnement
400 W/m² 600 W/m² 800 W/m²1000 W/m²
0 20 40 60 80 100 120 140 160 180 2000
2000
4000
6000
8000
10000
12000
14000
Tension (V)
Puissance-Tension P= f(V) en fonction du rayonnement
1000 W/m² 800 W/m² 600 W/m² 400 W/m²
Pui
ssan
ce (W
)
Cou
rant
(A)
Figure 9: Simulation results of the influence of sunlight on the characteristic I-V and P-V of the PV generator to Tref=25°C.
Citation: Gaye TA, Dieng B, Sow O, Mbodji S, Sissoko G (2016) Study and Optimization of a Photovoltaic Mill System Functioning on the Course of the Sun. J Material Sci Eng 6: 309. doi: 10.4172/2169-0022.1000309
Page 5 of 6
Volume 6 • Issue 1 • 1000309J Material Sci Eng, an open access journalISSN: 2169-0022
is highly dependent on solar radiation, but against the voltage varies slightly. Then the maximum power point (MPP) of PV generator varies with decreasing sunlight.
Simulation results of the boost converter
The training Matlab/Simulink of the boost converter has to have very interesting results. Figure 10 shows the signal applied to the gate of the transistor corresponds to a switching frequency set at 50%.The below Figure 11 shows the input and output voltage of the boost converter after simulation. These results show that the voltage at the output of the converter is greater than the input. So the DCDC converter performs its role properly.
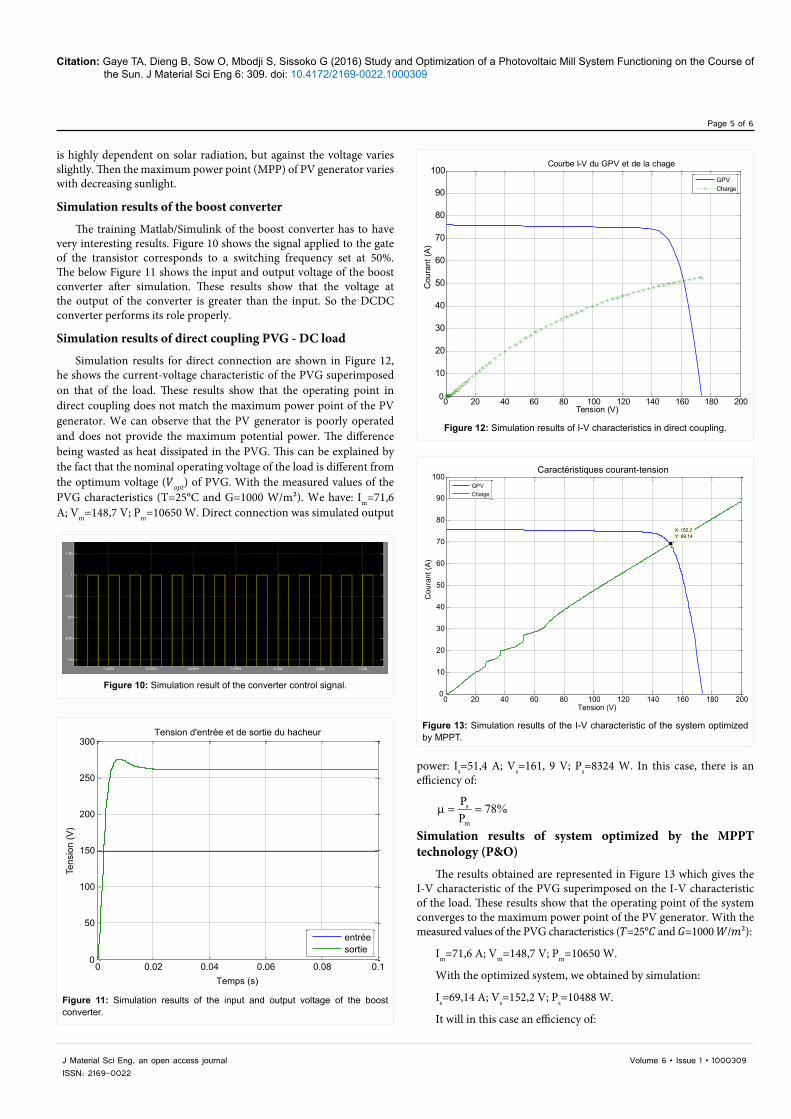
Simulation results of direct coupling PVG - DC load
Simulation results for direct connection are shown in Figure 12, he shows the current-voltage characteristic of the PVG superimposed on that of the load. These results show that the operating point in direct coupling does not match the maximum power point of the PV generator. We can observe that the PV generator is poorly operated and does not provide the maximum potential power. The difference being wasted as heat dissipated in the PVG. This can be explained by the fact that the nominal operating voltage of the load is different from the optimum voltage (𝑉𝑜𝑝𝑡) of PVG. With the measured values of the PVG characteristics (T=25°C and G=1000 W/m²). We have: Im=71,6 A; Vm=148,7 V; Pm=10650 W. Direct connection was simulated output
power: Is=51,4 A; Vs=161, 9 V; Ps=8324 W. In this case, there is an efficiency of:
s
m
P 78%P
µ = =
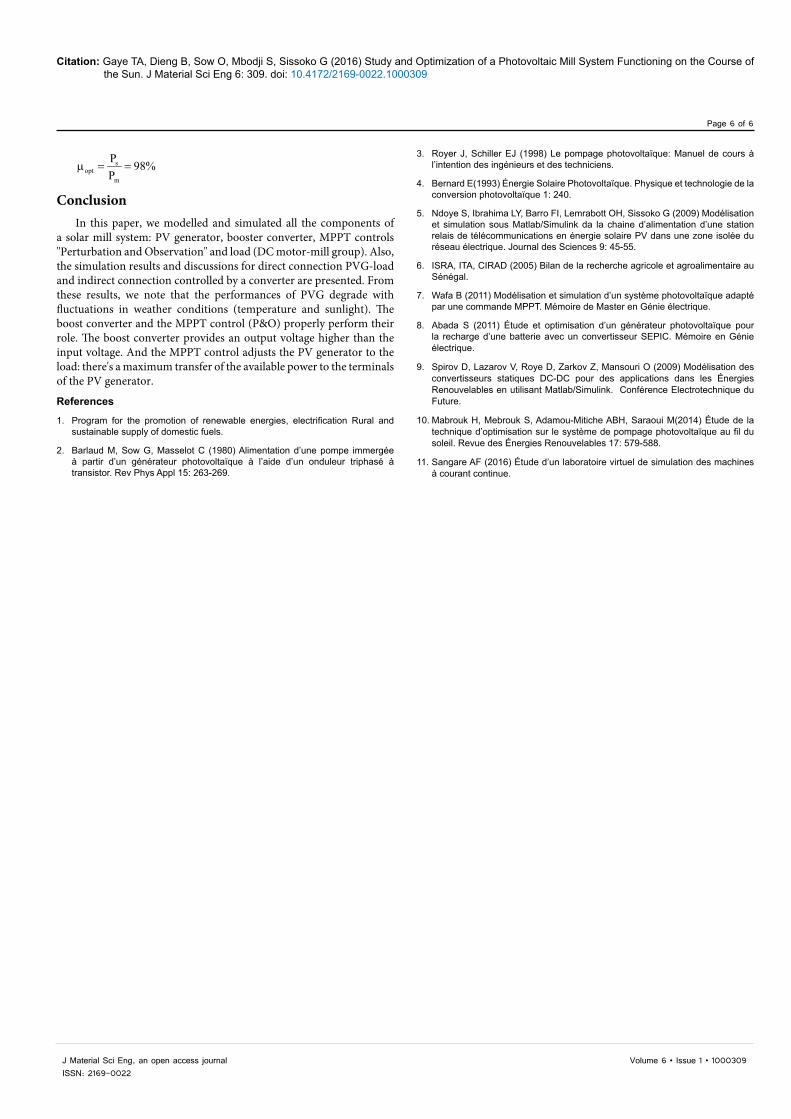
Simulation results of system optimized by the MPPT technology (P&O)
The results obtained are represented in Figure 13 which gives the I-V characteristic of the PVG superimposed on the I-V characteristic of the load. These results show that the operating point of the system converges to the maximum power point of the PV generator. With the measured values of the PVG characteristics (𝑇=25°𝐶 and 𝐺=1000 𝑊/𝑚²):
Im=71,6 A; Vm=148,7 V; Pm=10650 W.
With the optimized system, we obtained by simulation:
Is=69,14 A; Vs=152,2 V; Ps=10488 W.
It will in this case an efficiency of:
Figure 10: Simulation result of the converter control signal.
0 0.02 0.04 0.06 0.08 0.10
50
100
150
200
250
300
Temps (s)
Tension d'entrée et de sortie du hacheur
entréesortie
Tens
ion
(V)
Figure 11: Simulation results of the input and output voltage of the boost converter.
0 20 40 60 80 100 120 140 160 180 2000
10
20
30
40
50
60
70
80
90
100
Tension (V)
Courbe I-V du GPV et de la chage
GPVCharge
Cou
rant
(A)
Figure 12: Simulation results of I-V characteristics in direct coupling.
0 20 40 60 80 100 120 140 160 180 2000
10
20
30
40
50
60
70
80
90
100
X: 152.2Y: 69.14
Tension (V)
Caractéristiques courant-tension
GPVCharge
Cou
rant
(A)
Figure 13: Simulation results of the I-V characteristic of the system optimized by MPPT.
Citation: Gaye TA, Dieng B, Sow O, Mbodji S, Sissoko G (2016) Study and Optimization of a Photovoltaic Mill System Functioning on the Course of the Sun. J Material Sci Eng 6: 309. doi: 10.4172/2169-0022.1000309
Page 6 of 6
Volume 6 • Issue 1 • 1000309J Material Sci Eng, an open access journalISSN: 2169-0022
sopt
m
P 98%P
µ = =
ConclusionIn this paper, we modelled and simulated all the components of
a solar mill system: PV generator, booster converter, MPPT controls "Perturbation and Observation" and load (DC motor-mill group). Also, the simulation results and discussions for direct connection PVG-load and indirect connection controlled by a converter are presented. From these results, we note that the performances of PVG degrade with fluctuations in weather conditions (temperature and sunlight). The boost converter and the MPPT control (P&O) properly perform their role. The boost converter provides an output voltage higher than the input voltage. And the MPPT control adjusts the PV generator to the load: there's a maximum transfer of the available power to the terminals of the PV generator.
References
1. Program for the promotion of renewable energies, electrification Rural and sustainable supply of domestic fuels.
2. Barlaud M, Sow G, Masselot C (1980) Alimentation d’une pompe immergée à partir d’un générateur photovoltaïque à l’aide d’un onduleur triphasé à transistor. Rev Phys Appl 15: 263-269.
3. Royer J, Schiller EJ (1998) Le pompage photovoltaïque: Manuel de cours à l’intention des ingénieurs et des techniciens.
4. Bernard E(1993) Énergie Solaire Photovoltaïque. Physique et technologie de la conversion photovoltaïque 1: 240.
5. Ndoye S, Ibrahima LY, Barro FI, Lemrabott OH, Sissoko G (2009) Modélisation et simulation sous Matlab/Simulink da la chaine d’alimentation d’une station relais de télécommunications en énergie solaire PV dans une zone isolée du réseau électrique. Journal des Sciences 9: 45-55.
6. ISRA, ITA, CIRAD (2005) Bilan de la recherche agricole et agroalimentaire au Sénégal.
7. Wafa B (2011) Modélisation et simulation d’un système photovoltaïque adapté par une commande MPPT. Mémoire de Master en Génie électrique.
8. Abada S (2011) Étude et optimisation d’un générateur photovoltaïque pour la recharge d’une batterie avec un convertisseur SEPIC. Mémoire en Génie électrique.
9. Spirov D, Lazarov V, Roye D, Zarkov Z, Mansouri O (2009) Modélisation des convertisseurs statiques DC-DC pour des applications dans les Énergies Renouvelables en utilisant Matlab/Simulink. Conférence Electrotechnique du Future.
10. Mabrouk H, Mebrouk S, Adamou-Mitiche ABH, Saraoui M(2014) Étude de la technique d’optimisation sur le système de pompage photovoltaïque au fil du soleil. Revue des Énergies Renouvelables 17: 579-588.
11. Sangare AF (2016) Étude d’un laboratoire virtuel de simulation des machines à courant continue.