Embed Size (px)
Citation preview

1
Cross Cutting Capacity Development (3cd) Program Megacity Indicators System
Report on the Metro Manila Implementation Process
egacity
indicators
istem
September, 2006
Earthquakes and
Megacities Initiative
M IE
2
Participating Agencies and Organizations
Earthquakes and Megacities Initiative, EMI
Ms. Shirley Mattingly, 3cd Program Director Dr. Fouad Bendimerad, Chairman Dr. Antonio Fernandez, Principal Scientist Dr. Marqueza Reyes, Researcher Ms. Tara Ledesma, Researcher
National University of Colombia - Technical University of Catalonia, Barcelona Team
Dr. Omar D. Cardona, Researcher (IDEA, UNC) Dr. Martha-Liliana Carreño, Researcher (CIMNE, UPC) Dr. Alex H. Barbat, Researcher, (CIMNE, UPC)
Pacific Disaster Center, PDC
Mr. Jim Buika, 3cd Principal Investigator Ms. Jeannette Fernandez, Project Manager (EMI/PDC)
ProVention Consortium
Dr. Khalid Bouzina, Project Manager (EMI/ProVention) Report prepared by Jeannette Fernandez, Shirley Mattingly, Fouad Bendimerad, and Omar D. Cardona
3
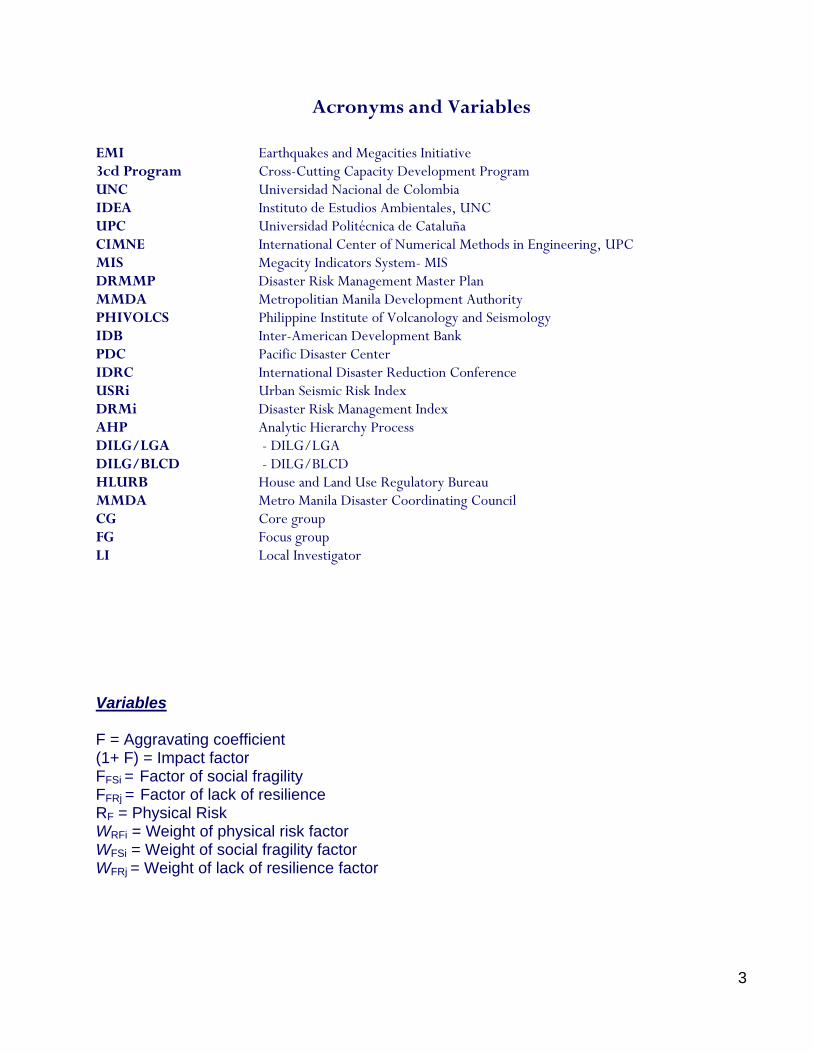
Acronyms and Variables
EMI Earthquakes and Megacities Initiative 3cd Program Cross-Cutting Capacity Development Program UNC Universidad Nacional de Colombia IDEA Instituto de Estudios Ambientales, UNC UPC Universidad Politécnica de Cataluña CIMNE International Center of Numerical Methods in Engineering, UPC MIS Megacity Indicators System- MIS DRMMP Disaster Risk Management Master Plan MMDA Metropolitian Manila Development Authority PHIVOLCS Philippine Institute of Volcanology and Seismology IDB Inter-American Development Bank PDC Pacific Disaster Center IDRC International Disaster Reduction Conference USRi Urban Seismic Risk Index DRMi Disaster Risk Management Index AHP Analytic Hierarchy Process DILG/LGA - DILG/LGA DILG/BLCD - DILG/BLCD HLURB House and Land Use Regulatory Bureau MMDA Metro Manila Disaster Coordinating Council CG Core group FG Focus group LI Local Investigator Variables F = Aggravating coefficient (1+ F) = Impact factor FFSi = Factor of social fragility FFRj = Factor of lack of resilience RF = Physical Risk WRFi = Weight of physical risk factor WFSi = Weight of social fragility factor WFRj = Weight of lack of resilience factor

4
3cd Program
Megacity Indicators System (MIS) Implementation in Metro Manila
Background The main objective of EMI’s Cross-Cutting Capacity Development (3cd) Program1 is to
empower local governments, local institutions and communities to incorporate risk reduction
options in their daily activities. Most often local governments and city stakeholders do not
have a clear understanding of available risk reduction and risk management options or the
process that will lead to a successful implementation of these options. The missing link
between available knowledge and its application in real situations is the lack of appropriate
mechanisms to communicate and transfer this knowledge between the scientific community
and the end users or practitioners in the different sectors, for example government officials,
the private sector and the community in general.
In the context of the 3cd Program, EMI is devising several risk communication and risk
reduction monitoring tools. One of the most promising is the use of a “Megacity Indicators
System - MIS”. Together with its partners at the National University of Colombia, Manizales,
and the International Center of Numerical Methods in Engineering (CIMNE) of the
Technical University of Catalonia, a pilot application to investigate, develop and test a MIS
tool2 was initiated in Metro Manila on March 2006. The following provides some general
background on this topic.
The Megacity Indicators System (MIS) is a tool to communicate risk and promote discussion
around appropriate strategies and concrete actions that cities can devise for risk reduction
and management. The MIS helps enhance ownership within city stakeholders and assists in
policy development, decision-making, and monitoring effectiveness of specific options
adopted.
1 See 3cd Program definition and other relevant documents related to its implementation in Metro Manila, Kathmandu and Mumbai at www.earthquakesandmegacities.org or www.pdc.org/emi 2 This project is partially funded by UNDP and ProVention Consortium under a strategic cooperative program for megaci-ties disaster risk reduction.
5
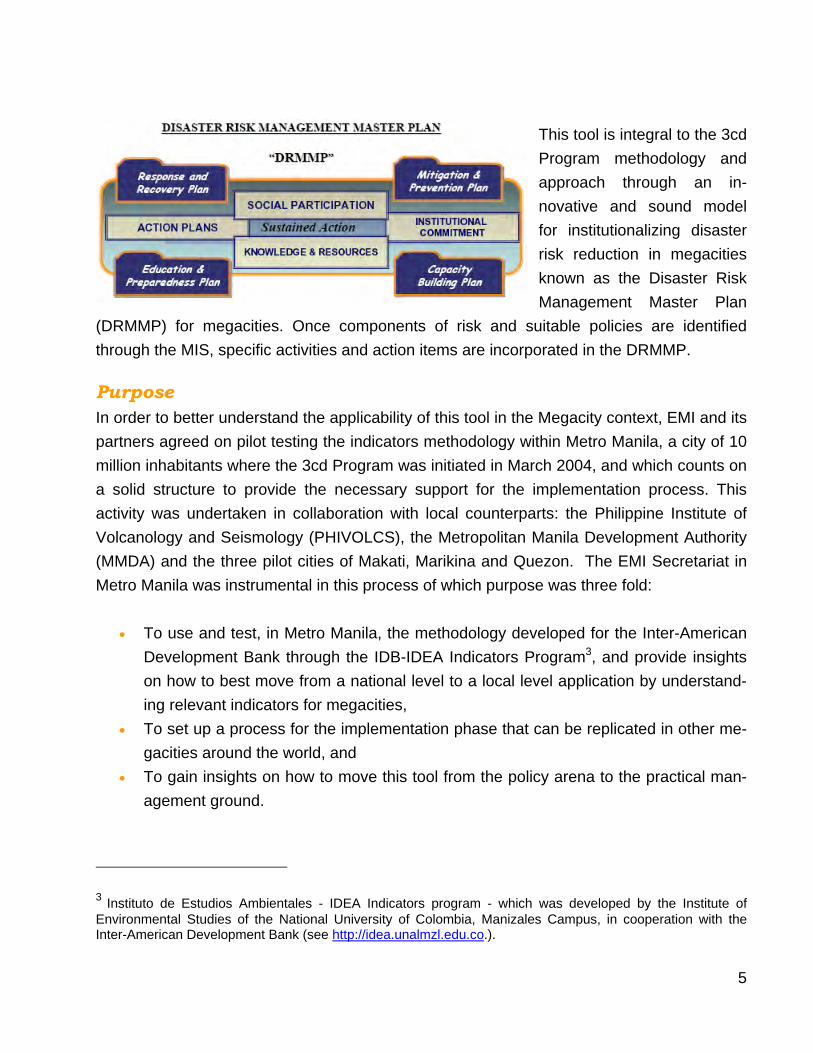
This tool is integral to the 3cd
Program methodology and
approach through an in-
novative and sound model
for institutionalizing disaster
risk reduction in megacities
known as the Disaster Risk
Management Master Plan
(DRMMP) for megacities. Once components of risk and suitable policies are identified
through the MIS, specific activities and action items are incorporated in the DRMMP. Purpose In order to better understand the applicability of this tool in the Megacity context, EMI and its
partners agreed on pilot testing the indicators methodology within Metro Manila, a city of 10
million inhabitants where the 3cd Program was initiated in March 2004, and which counts on
a solid structure to provide the necessary support for the implementation process. This
activity was undertaken in collaboration with local counterparts: the Philippine Institute of
Volcanology and Seismology (PHIVOLCS), the Metropolitan Manila Development Authority
(MMDA) and the three pilot cities of Makati, Marikina and Quezon. The EMI Secretariat in
Metro Manila was instrumental in this process of which purpose was three fold:
To use and test, in Metro Manila, the methodology developed for the Inter-American
Development Bank through the IDB-IDEA Indicators Program3, and provide insights
on how to best move from a national level to a local level application by understand-
ing relevant indicators for megacities,
To set up a process for the implementation phase that can be replicated in other me-
gacities around the world, and
To gain insights on how to move this tool from the policy arena to the practical man-
agement ground.
3 Instituto de Estudios Ambientales - IDEA Indicators program - which was developed by the Institute of Environmental Studies of the National University of Colombia, Manizales Campus, in cooperation with the Inter-American Development Bank (see http://idea.unalmzl.edu.co.).
6
Organization This initial implementation phase was organized in such a way that two different but
complementary teams were looking simultaneously at the methodology itself and its
application at the urban level, with the second team in charge of local implementation.
These two groups had the possibility to interact and exchange not only via email, but were
also able to engage in direct discussions through workshops and special meetings.
Three methodological workshops were carried out between February and September 2006.
The kick-off event took place in Seeheim, Germany, in February 2006, including the
Barcelona Team and delegates from the 3cd Program Implementation Team. The second
one took place at the Blume Center at Stanford University, Palo Alto, California, in April
2006, and the third one in Davos, Switzerland on the occasion of the International Disaster
Reduction Conference (IDRC) in August 2006.
Three different activities were planned locally in Metro Manila: an initial workshop in March
2006 followed by a data collection process undertaken by colleagues at the EMI secretariat
and also at PDC, and a second workshop in May 2006. A third workshop is being tentatively
scheduled for mid October 2006, where the results of the whole exercise will be presented
to the local authorities and stakeholders.
7
Application of the Indicators System to Mega-Urban Areas4
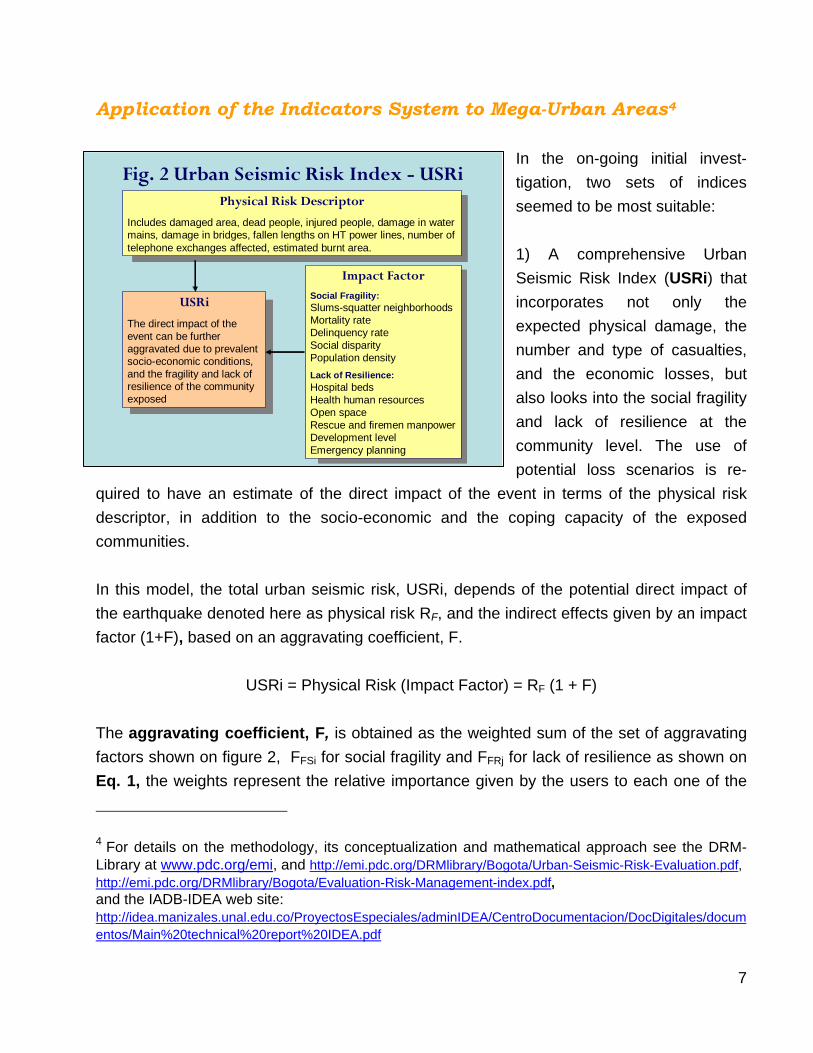
In the on-going initial invest-
tigation, two sets of indices
seemed to be most suitable:
1) A comprehensive Urban
Seismic Risk Index (USRi) that
incorporates not only the
expected physical damage, the
number and type of casualties,
and the economic losses, but
also looks into the social fragility
and lack of resilience at the
community level. The use of
potential loss scenarios is re-
quired to have an estimate of the direct impact of the event in terms of the physical risk
descriptor, in addition to the socio-economic and the coping capacity of the exposed
communities.
In this model, the total urban seismic risk, USRi, depends of the potential direct impact of
the earthquake denoted here as physical risk RF, and the indirect effects given by an impact
factor (1+F), based on an aggravating coefficient, F.
USRi = Physical Risk (Impact Factor) = RF (1 + F)
The aggravating coefficient, F, is obtained as the weighted sum of the set of aggravating
factors shown on figure 2, FFSi for social fragility and FFRj for lack of resilience as shown on
Eq. 1, the weights represent the relative importance given by the users to each one of the
4 For details on the methodology, its conceptualization and mathematical approach see the DRM-Library at www.pdc.org/emi, and http://emi.pdc.org/DRMlibrary/Bogota/Urban-Seismic-Risk-Evaluation.pdf, http://emi.pdc.org/DRMlibrary/Bogota/Evaluation-Risk-Management-index.pdf, and the IADB-IDEA web site: http://idea.manizales.unal.edu.co/ProyectosEspeciales/adminIDEA/CentroDocumentacion/DocDigitales/documentos/Main%20technical%20report%20IDEA.pdf
Physical Risk Descriptor
Includes damaged area, dead people, injured people, damage in water mains, damage in bridges, fallen lengths on HT power lines, number of telephone exchanges affected, estimated burnt area.
Impact FactorSocial Fragility:Slums-squatter neighborhoods Mortality rateDelinquency rateSocial disparityPopulation density
Lack of Resilience:Hospital bedsHealth human resourcesOpen spaceRescue and firemen manpowerDevelopment levelEmergency planning
USRi
The direct impact of the event can be further aggravated due to prevalent socio-economic conditions, and the fragility and lack of resilience of the community exposed
Fig. 2 Urban Seismic Risk Index - USRi
8
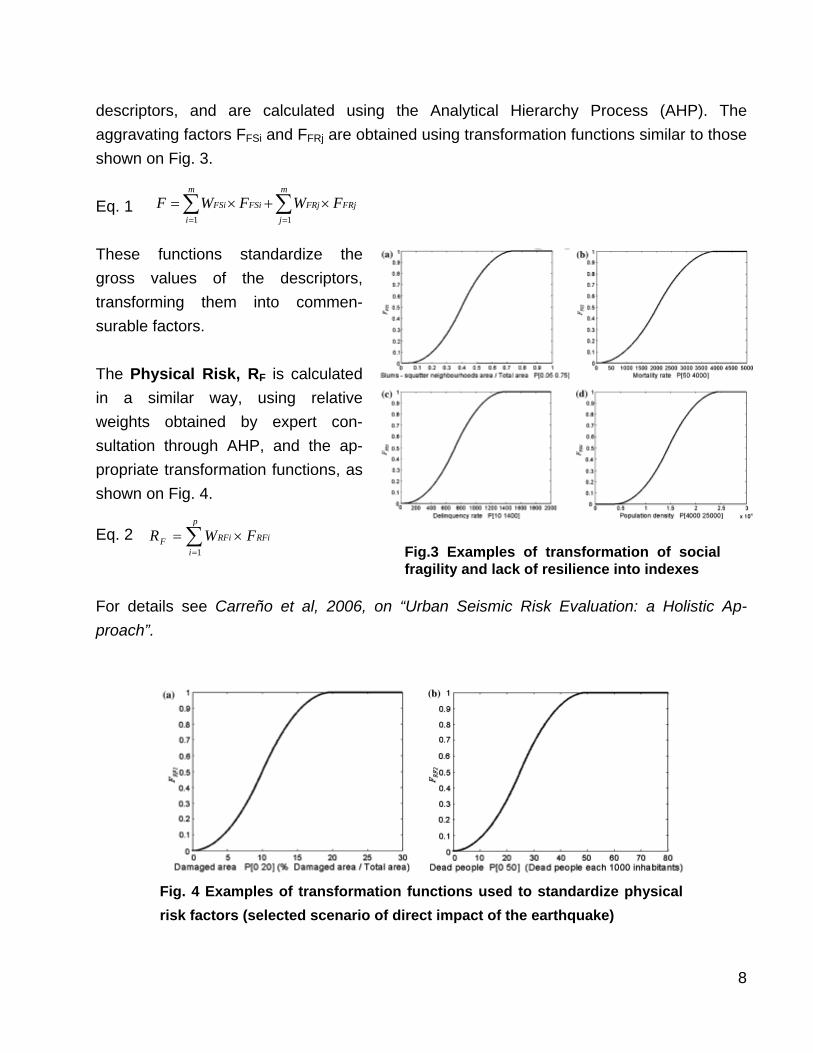
descriptors, and are calculated using the Analytical Hierarchy Process (AHP). The
aggravating factors FFSi and FFRj are obtained using transformation functions similar to those
shown on Fig. 3.
Eq. 1
These functions standardize the
gross values of the descriptors,
transforming them into commen-
surable factors.
The Physical Risk, RF is calculated
in a similar way, using relative
weights obtained by expert con-
sultation through AHP, and the ap-
propriate transformation functions, as
shown on Fig. 4.
Eq. 2
For details see Carreño et al, 2006, on “Urban Seismic Risk Evaluation: a Holistic Ap-
proach”.
Fig. 4 Examples of transformation functions used to standardize physical
risk factors (selected scenario of direct impact of the earthquake)
Fig.3 Examples of transformation of social fragility and lack of resilience into indexes
RFi
p
i
RFiF FWR 1
m
j
FRjFRjFSi
m
i
FSi FWFWF11
9
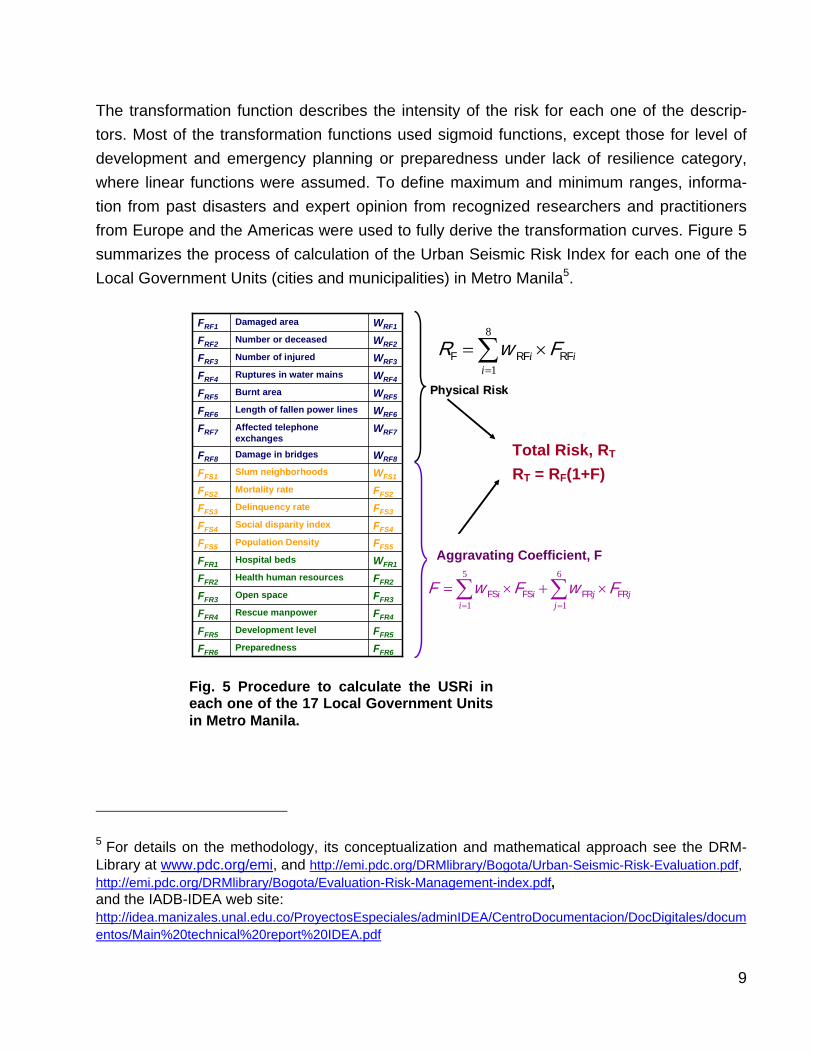
The transformation function describes the intensity of the risk for each one of the descrip-
tors. Most of the transformation functions used sigmoid functions, except those for level of
development and emergency planning or preparedness under lack of resilience category,
where linear functions were assumed. To define maximum and minimum ranges, informa-
tion from past disasters and expert opinion from recognized researchers and practitioners
from Europe and the Americas were used to fully derive the transformation curves. Figure 5
summarizes the process of calculation of the Urban Seismic Risk Index for each one of the
Local Government Units (cities and municipalities) in Metro Manila5.
FFR6PreparednessFFR6
FFR5Development levelFFR5
FFR4Rescue manpowerFFR4
FFR3Open spaceFFR3
FFR2Health human resourcesFFR2
WFR1Hospital bedsFFR1
FFS5Population DensityFFS5
FFS4Social disparity indexFFS4
FFS3Delinquency rateFFS3
FFS2Mortality rateFFS2
WFS1Slum neighborhoodsFFS1
WRF8Damage in bridgesFRF8
WRF7Affected telephone exchanges
FRF7
WRF6Length of fallen power linesFRF6
WRF5Burnt areaFRF5
WRF4Ruptures in water mainsFRF4
WRF3Number of injuredFRF3
WRF2Number or deceasedFRF2
WRF1Damaged areaFRF1
6
1
5
1 jjj
iii FRFRFSFS FwFwF
8
1iii RFRFF FwR
Physical Risk or Direct ImpactPhysical Risk or Direct Impact
ImpactImpact factor, factor, FF
Urban Seismic Risk Index, USRiUrban Seismic Risk Index, USRi
USRi = RUSRi = RF F (1+F)(1+F)
5 For details on the methodology, its conceptualization and mathematical approach see the DRM-Library at www.pdc.org/emi, and http://emi.pdc.org/DRMlibrary/Bogota/Urban-Seismic-Risk-Evaluation.pdf, http://emi.pdc.org/DRMlibrary/Bogota/Evaluation-Risk-Management-index.pdf, and the IADB-IDEA web site: http://idea.manizales.unal.edu.co/ProyectosEspeciales/adminIDEA/CentroDocumentacion/DocDigitales/documentos/Main%20technical%20report%20IDEA.pdf
Aggravating Coefficient, F
Fig. 5 Procedure to calculate the USRi in each one of the 17 Local Government Units in Metro Manila.
Total Risk, RT
RT = RF(1+F)

10
2) A Disaster Risk Management Index (DRMi) to measure performance and effectiveness,
looks into four public policies: risk identification, risk reduction, disaster management, and
governance and financial pro-
tection. This index provides a
qualitative measure of manage-
ment based on predefined
benchmarks. Each one of the
policies contains 6 different
targets which stakeholders can
look at to improve the current
condition.
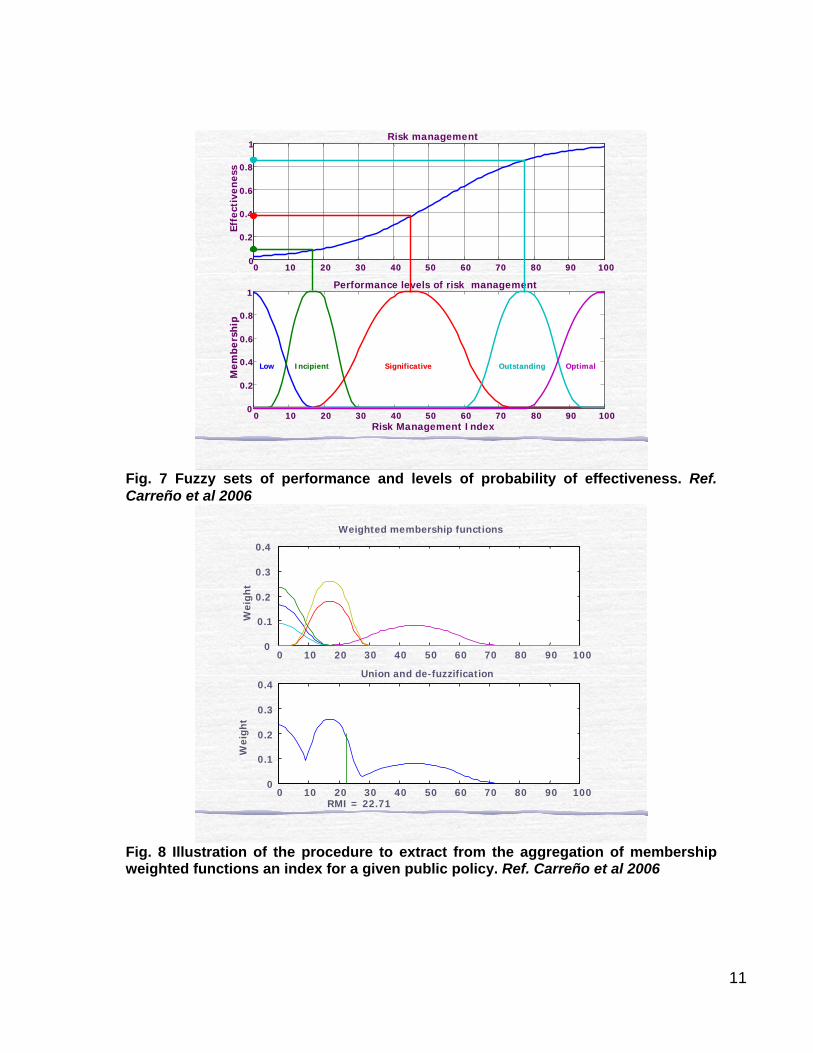
Following the performance evaluation of risk management method proposed by Carreño et
al, 2004, the valuation of each public policy (Risk Identification, Risk Reduction, Disaster
Management and Financial Protection) is estimated based on five performance levels (low,
incipient, significant, outstanding, and optimal) that correspond to a range from 1 (low) to 5
(optimal). This methodological approach permits the use of each reference level
simultaneously as a “performance target” and allows for comparison and identification of
results or achievements. Local government efforts at formulating, implementing, and
evaluating policies should bear these performance targets in mind.
In addition to qualifying each one of the policies, local experts are asked to assign impor-
tance factors or weights to each one of the six benchmarks comprising each one of the indi-
vidual policies. The Analytic Hierarchy Process (AHP) is also used in this case. Once both
the weights and performance factors are obtained, fuzzy sets theory is used to extract a
“concentrated” or crisp value, which will represent an index for each individual public policy.
Finally the overall DRMi is obtained as an average of the four indexes, thus assigning equal
relative importance to each one of the public policies evaluated. The following graphs are
schematic representations of both the relationship between performance level and probabili-
ty of effectiveness and the calculation of the index for one public policy. The relative weights
of the sub-indicators are calculated using the AHP. One of the advantages of this method is
that it allows checking the consistency of the comparison matrix through the calculation of
its eigenvalues and of a consistency index.
Fig. 6 Schematic representation of the Disaster Risk Management Index
11
00 1010 2020 3030 4040 5050 6060 7070 8080 9090 10010000
0.20.2
0.40.4
0.60.6
0.80.8
11Performance levels of risk management
Risk Management Index
Mem
ber
ship
Mem
ber
ship
00 1010 2020 3030 4040 5050 6060 7070 8080 9090 10010000
0.20.2
0.40.4
0.60.6
0.80.8
11Risk management
Effe
ctiv
enes
s
LowLow IncipientIncipient SignificativeSignificative OutstandingOutstanding OptimalOptimal
Fig. 7 Fuzzy sets of performance and levels of probability of effectiveness. Ref. Carreño et al 2006
0 10 20 30 40 50 60 70 80 90 1000
0.1
0.2
0.3
0.4
Weighted membership functions
Wei
ght
0 10 20 30 40 50 60 70 80 90 1000
0.1
0.2
0.3
0.4Union and de-fuzzification
RMI = 22.71
Wei
ght
Fig. 8 Illustration of the procedure to extract from the aggregation of membership weighted functions an index for a given public policy. Ref. Carreño et al 2006
12
Summary of the Implementation Process in Metro Manila
Kickoff Workshop
Thirteen participants from the Metropolitan Manila Development Authority (MMDA),
DILG/LGA, DILG/BLCD, House and Land Use Regulatory Bureau (HLURB), the Philippine
Institute of Volcanology and Seismology (PHIVOLCS), Makati City and Social Weather
Station (a private research institution conducting poll surveys) attended the March 2006
kickoff workshop.
The purpose of this initial activity was to introduce the concept of indicators in general, focus
on the USRi and DRMi, and evaluate the availability of the descriptors suggested in the
methodology. It also emphasized the need to suggest alternate descriptors that could
capture similar conditions in case that specific ones were not available for the city level.
Further, the participants in this initial workshop were asked to apply the analytical
hierarchical process (AHP) to understand the relative importance of one descriptor to the
other, know as weights in the methodology.
Below are some important remarks from the workshop:
a. It was observed that some participants had difficulty in understanding the concept of in-
dicators. Some individuals resisted the idea of indices.
b. Pair wise comparison was found relatively easy by the participants, nevertheless when
the forms were analyzed, they showed important inconsistencies, and incomplete forms,
as will be discussed later.
c. The participants were requested to fill out individual forms; it seems that a work group
with the assistance of a facilitator could make the process easier.
d. Most participants found the forms easy to use; however the translations of a few terms
from Spanish to English required additional interpretation in accordance with local usage
and practice.
e. The forms take time to be filled out; it is desired that the survey is done in steps or stag-
es so that the participants don’t lose concentration.
f. The participants were able to identify alternate indicators or variables for physical risk
and aggravating factors; however it is important for the implementation team to verify lo-
cal information prior to making the survey.
g. Looking into specific events or milestones proved to help the participants to think of per-
formance levels of disaster risk management for different years.
13
Evaluation of the data collection process and first run of the model
Colleagues from Barcelona and Bogotá (Barcelona Team), used this initial information to
perform a first run of the model and understand the difficulties in the data collection process.
Major concerns included:
a. Most of the surveys were either incomplete, included errors/omissions, or were inconsis-
tent; this clearly showed difficulty in understanding the AHP process
b. Some of the descriptors were not available or were presented in a different manner,
among them mortality rate, delinquency rate, social disparity index, development level
and emergency planning, per LGU were missing or needed to be reassessed based on
similar information available.
c. It seemed that the group selected for this first exercise was not the appropriate one, and
it was recommended to make a second attempt during the next workshop scheduled for
May 2006.
d. A preliminary run of the USRi was made using weights derived for other environments in
order to have an initial sense of the application in Metro Manila; nevertheless it was de-
cided not to present these results to avoid any type of confusion.
e. In general the forms to evaluate Disaster Risk Management in Metro Manila produced
better results and thus the results seemed to be appropriate for the whole metropolitan
region.
Second round, improving the data collection process
One more attempt to improve the definition of weights for USRi was done through a second
local workshop in May 2006. A selected group of participants was invited to fill out the forms,
the facilitators had gained more experience in the process, and the exercise counted on the
assistance of one of the creators of the methodology, Dr. Martha-Liliana Carreño, making
the whole process more interactive.
At the same time, the three 3cd Program pilot cities of Quezon, Makati and Marikina were
invited to discuss and assess their own DRM system. In this case forms and weights were
obtained by filling out only one set of forms by consensus per city. This exercise showed
that the group discussions and reaching agreements was more useful and productive than
having each participant filling out individual forms.
Overall, the second attempt produced better results; nevertheless some inconsistencies in
the matrices were still there, as reported by the Barcelona Team. On a general observation,
14
when looking into the aggravating factors, the participants showed a preference to look into
improving response and operational capabilities, instead of looking into more structural as-
pects such as social fragility or low level of development. The number of deaths and number
of injured showed very high importance factors as compared to any physical risk descriptor
when evaluating Physical Risk or Direct Impact of the Earthquake.
A final exercise was suggested by the Barcelona Team to improve the qualification of rela-
tive importance of the descriptors and better understand the common tendencies. A new set
of forms was prepared containing separately the physical risk descriptors, social fragility and
lack of resilience. A group of participants was asked to directly distribute 100 points among
the individual sets of descriptors; this is known as budget allocation technique and allows al-
locating weights directly.
The weights estimated by this later procedure produced results similar to those used in pre-
vious exercises in Bogotá and Barcelona, and therefore a final run was made using these
values.
15
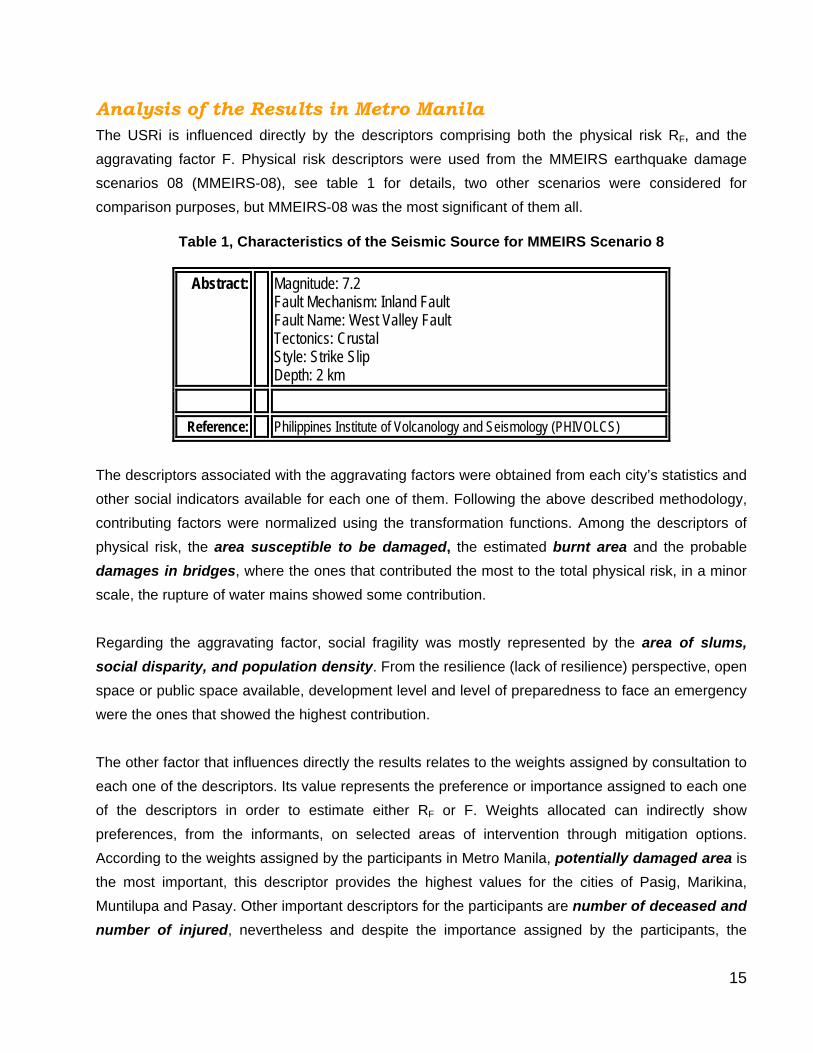
Analysis of the Results in Metro Manila The USRi is influenced directly by the descriptors comprising both the physical risk RF, and the
aggravating factor F. Physical risk descriptors were used from the MMEIRS earthquake damage
scenarios 08 (MMEIRS-08), see table 1 for details, two other scenarios were considered for
comparison purposes, but MMEIRS-08 was the most significant of them all.
Table 1, Characteristics of the Seismic Source for MMEIRS Scenario 8
Abstract:
Magnitude: 7.2 Fault Mechanism: Inland Fault Fault Name: West Valley Fault Tectonics: Crustal Style: Strike Slip Depth: 2 km
Reference: Philippines Institute of Volcanology and Seismology (PHIVOLCS)
The descriptors associated with the aggravating factors were obtained from each city’s statistics and
other social indicators available for each one of them. Following the above described methodology,
contributing factors were normalized using the transformation functions. Among the descriptors of
physical risk, the area susceptible to be damaged, the estimated burnt area and the probable
damages in bridges, where the ones that contributed the most to the total physical risk, in a minor
scale, the rupture of water mains showed some contribution.
Regarding the aggravating factor, social fragility was mostly represented by the area of slums,
social disparity, and population density. From the resilience (lack of resilience) perspective, open
space or public space available, development level and level of preparedness to face an emergency
were the ones that showed the highest contribution.
The other factor that influences directly the results relates to the weights assigned by consultation to
each one of the descriptors. Its value represents the preference or importance assigned to each one
of the descriptors in order to estimate either RF or F. Weights allocated can indirectly show
preferences, from the informants, on selected areas of intervention through mitigation options.
According to the weights assigned by the participants in Metro Manila, potentially damaged area is
the most important, this descriptor provides the highest values for the cities of Pasig, Marikina,
Muntilupa and Pasay. Other important descriptors for the participants are number of deceased and
number of injured, nevertheless and despite the importance assigned by the participants, the

16
influence of these two factors on the overall RF is relatively low, as compared to damage in bridges
which is also relevant for the participants. The Cities of Pasig and Pasay show very high values
associated with damage in bridges, which is a determinant factor when ranking the cities according
to physical risk.
Regarding the aggravating coefficient, heights weights were given by far to population density
followed by slums areas and social disparity. This Illustrates the interest of local stakeholders
consider aspects such as reducing concentration in specific areas and poverty alleviation and key
elements to reduce the overall risk, which is also linked to urban planning and long term efforts to
improve socio-economic development.
The cities of Kalookan, Malabon, Navotas, San Juan and Pasay are the ones that show notable high
figures associated with population density descriptor. When looking at resilience (lack of resilience),
the descriptor that got the highest participants interest was preparedness level to handle an
emergency, followed by rescue manpower, level of development and public or open space.
Nevertheless, level of development and public space are the ones that contribute the most to the
resilience factor since preparedness and rescue manpower show similarities in every city.
Valenzuela, Navotas and Malabon are the cities that present the most adverse situation regarding
level of development, and Navotas, Pateros and San Juan are the worst off when dealing with public
space. The above discussion illustrates the importance of institutional strengthening and improved
coordination so the cities comprising Metro Manila can enhance their capabilities for emergency
response, governance and institutional organization for disaster risk management. It also shows the
need of explore some options to provide with public or open space where temporary shelters in case
of a disaster, this should be also handled as part land use and urban planning efforts in the cities.
Cities in Metro Manila were clustered according to their level of risk in four different arrays according
to the total USRi and its components, physical risk and aggravating factor (social fragility + lack of
resilience), this grouping is show, on Table 2.
17
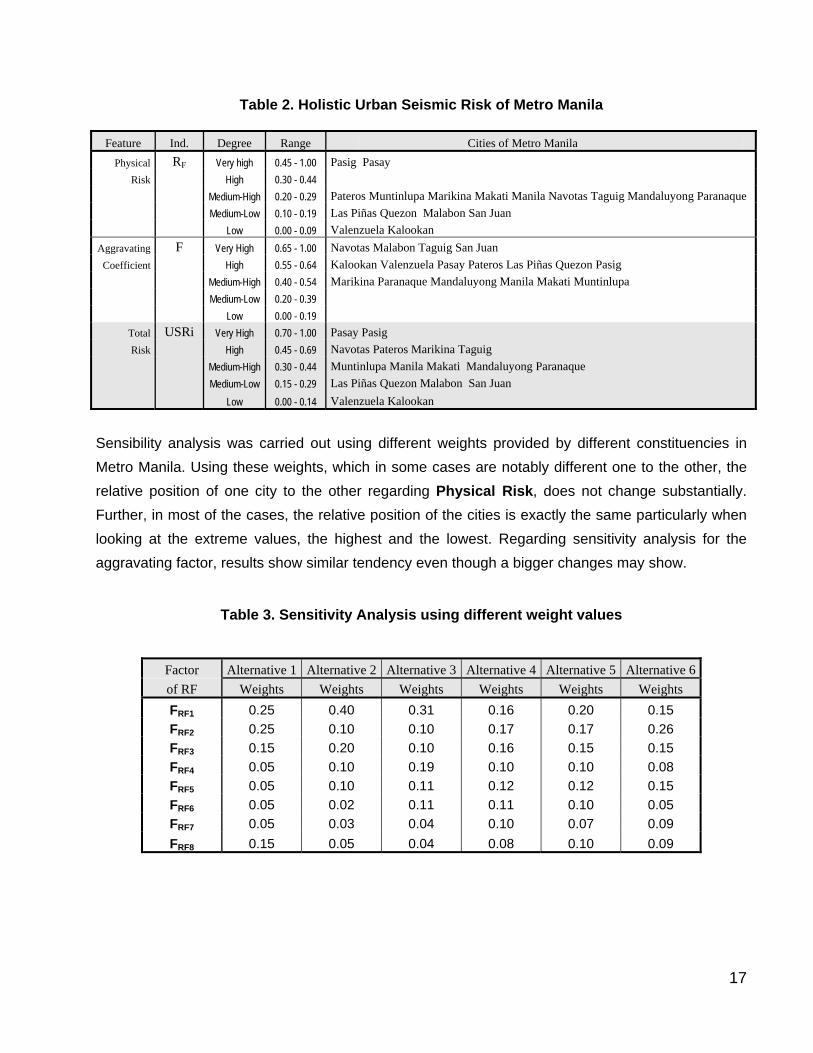
Table 2. Holistic Urban Seismic Risk of Metro Manila
Feature Ind. Degree Range Cities of Metro Manila
Physical RF Very high 0.45 - 1.00 Pasig Pasay
Risk High 0.30 - 0.44
Medium-High 0.20 - 0.29 Pateros Muntinlupa Marikina Makati Manila Navotas Taguig Mandaluyong Paranaque
Medium-Low 0.10 - 0.19 Las Piñas Quezon Malabon San Juan
Low 0.00 - 0.09 Valenzuela Kalookan
Aggravating F Very High 0.65 - 1.00 Navotas Malabon Taguig San Juan
Coefficient High 0.55 - 0.64 Kalookan Valenzuela Pasay Pateros Las Piñas Quezon Pasig
Medium-High 0.40 - 0.54 Marikina Paranaque Mandaluyong Manila Makati Muntinlupa
Medium-Low 0.20 - 0.39
Low 0.00 - 0.19
Total USRi Very High 0.70 - 1.00 Pasay Pasig
Risk High 0.45 - 0.69 Navotas Pateros Marikina Taguig
Medium-High 0.30 - 0.44 Muntinlupa Manila Makati Mandaluyong Paranaque
Medium-Low 0.15 - 0.29 Las Piñas Quezon Malabon San Juan
Low 0.00 - 0.14 Valenzuela Kalookan
Sensibility analysis was carried out using different weights provided by different constituencies in
Metro Manila. Using these weights, which in some cases are notably different one to the other, the
relative position of one city to the other regarding Physical Risk, does not change substantially.
Further, in most of the cases, the relative position of the cities is exactly the same particularly when
looking at the extreme values, the highest and the lowest. Regarding sensitivity analysis for the
aggravating factor, results show similar tendency even though a bigger changes may show.
Table 3. Sensitivity Analysis using different weight values
Factor Alternative 1 Alternative 2 Alternative 3 Alternative 4 Alternative 5 Alternative 6
of RF Weights Weights Weights Weights Weights Weights
FRF1 0.25 0.40 0.31 0.16 0.20 0.15
FRF2 0.25 0.10 0.10 0.17 0.17 0.26
FRF3 0.15 0.20 0.10 0.16 0.15 0.15
FRF4 0.05 0.10 0.19 0.10 0.10 0.08
FRF5 0.05 0.10 0.11 0.12 0.12 0.15
FRF6 0.05 0.02 0.11 0.11 0.10 0.05
FRF7 0.05 0.03 0.04 0.10 0.07 0.09
FRF8 0.15 0.05 0.04 0.08 0.10 0.09
18
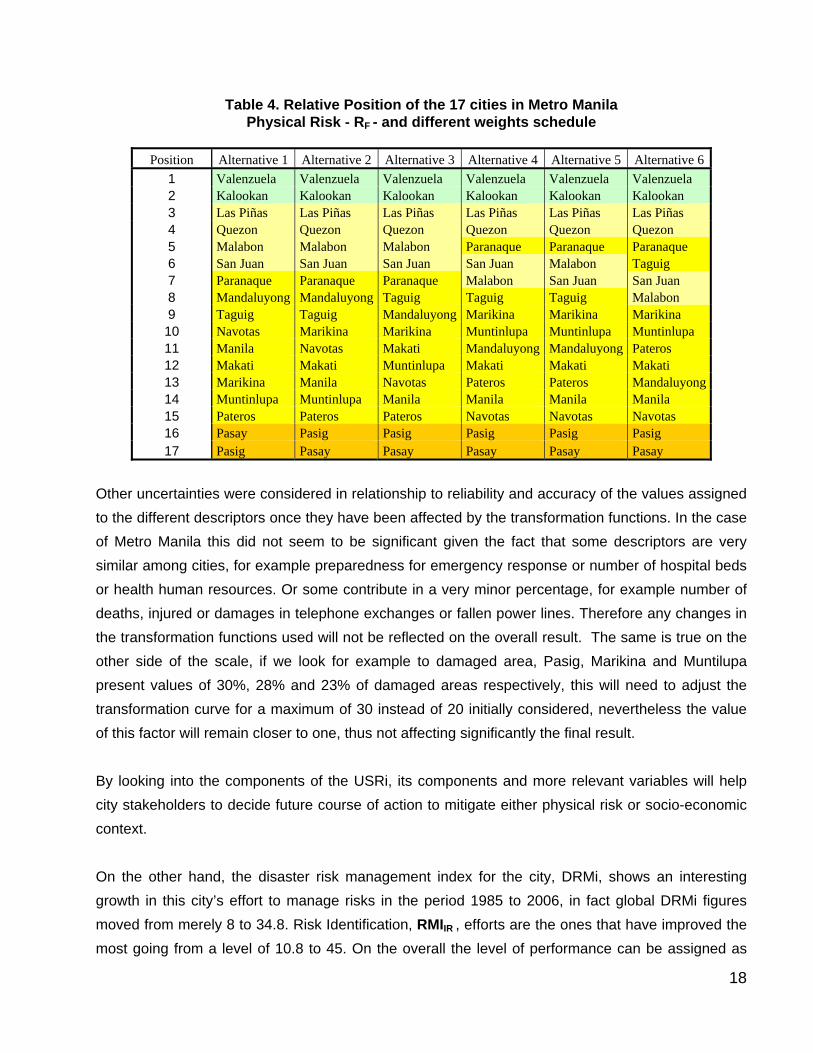
Table 4. Relative Position of the 17 cities in Metro Manila Physical Risk - RF - and different weights schedule
Position Alternative 1 Alternative 2 Alternative 3 Alternative 4 Alternative 5 Alternative 6
1 Valenzuela Valenzuela Valenzuela Valenzuela Valenzuela Valenzuela 2 Kalookan Kalookan Kalookan Kalookan Kalookan Kalookan 3 Las Piñas Las Piñas Las Piñas Las Piñas Las Piñas Las Piñas 4 Quezon Quezon Quezon Quezon Quezon Quezon 5 Malabon Malabon Malabon Paranaque Paranaque Paranaque 6 San Juan San Juan San Juan San Juan Malabon Taguig 7 Paranaque Paranaque Paranaque Malabon San Juan San Juan 8 Mandaluyong Mandaluyong Taguig Taguig Taguig Malabon 9 Taguig Taguig Mandaluyong Marikina Marikina Marikina 10 Navotas Marikina Marikina Muntinlupa Muntinlupa Muntinlupa 11 Manila Navotas Makati Mandaluyong Mandaluyong Pateros 12 Makati Makati Muntinlupa Makati Makati Makati 13 Marikina Manila Navotas Pateros Pateros Mandaluyong14 Muntinlupa Muntinlupa Manila Manila Manila Manila 15 Pateros Pateros Pateros Navotas Navotas Navotas 16 Pasay Pasig Pasig Pasig Pasig Pasig 17 Pasig Pasay Pasay Pasay Pasay Pasay
Other uncertainties were considered in relationship to reliability and accuracy of the values assigned
to the different descriptors once they have been affected by the transformation functions. In the case
of Metro Manila this did not seem to be significant given the fact that some descriptors are very
similar among cities, for example preparedness for emergency response or number of hospital beds
or health human resources. Or some contribute in a very minor percentage, for example number of
deaths, injured or damages in telephone exchanges or fallen power lines. Therefore any changes in
the transformation functions used will not be reflected on the overall result. The same is true on the
other side of the scale, if we look for example to damaged area, Pasig, Marikina and Muntilupa
present values of 30%, 28% and 23% of damaged areas respectively, this will need to adjust the
transformation curve for a maximum of 30 instead of 20 initially considered, nevertheless the value
of this factor will remain closer to one, thus not affecting significantly the final result.
By looking into the components of the USRi, its components and more relevant variables will help
city stakeholders to decide future course of action to mitigate either physical risk or socio-economic
context.
On the other hand, the disaster risk management index for the city, DRMi, shows an interesting
growth in this city’s effort to manage risks in the period 1985 to 2006, in fact global DRMi figures
moved from merely 8 to 34.8. Risk Identification, RMIIR , efforts are the ones that have improved the
most going from a level of 10.8 to 45. On the overall the level of performance can be assigned as
19
“outstanding” when looking at inventory of natural disasters and loss estimates, monitoring,
forecasting, hazard evaluation and mapping, risk and vulnerability assessment, as well as public
information, education and training. In order to improve risk identification it would be necessary to
consolidate a detailed data base of disasters at the local level, carry out additional hazards studies
and microzonation with a higher resolution. In addition, carry on more detailed studies related to
vulnerability assessment including social and environmental aspects. Other relevant programs for
Metro Manila should incorporate detailed vulnerability studies in lifelines and key buildings such as
hospitals and schools, increase or create community security networks, engage the active
participation of NGOs and CBOs in prevention and mitigation; and enhance elementary and high
school curricula on issues related to disaster risk reduction and preparedness concepts.
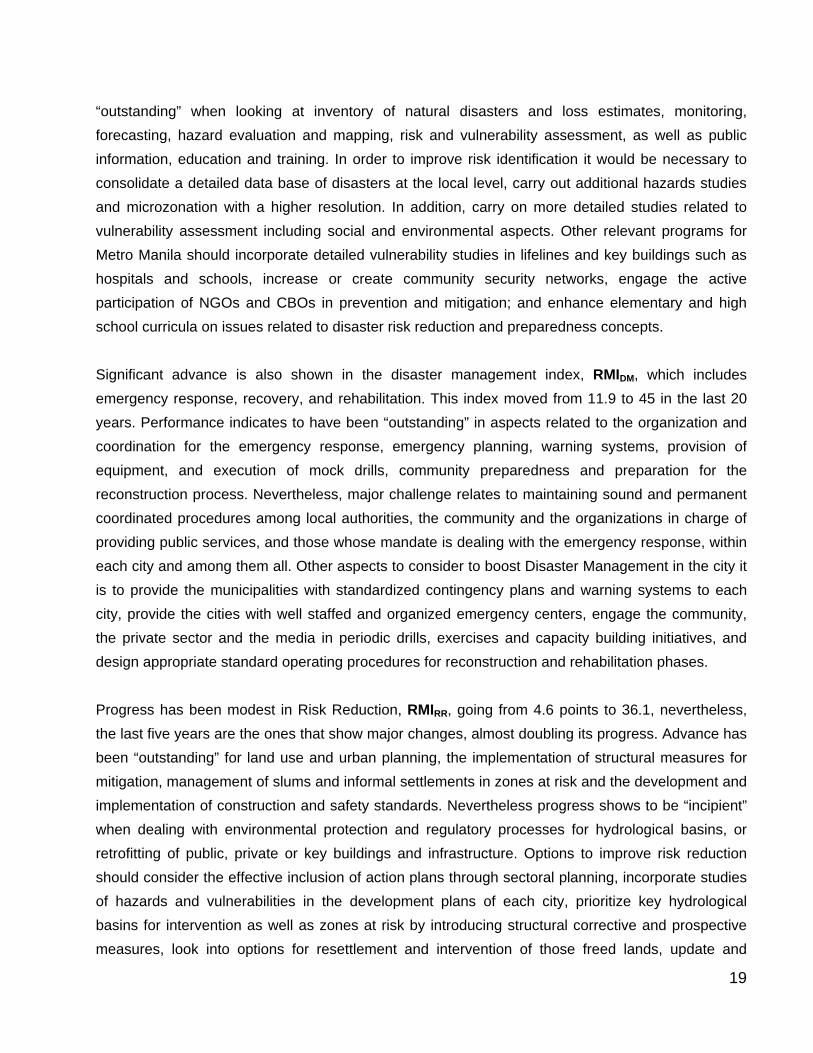
Significant advance is also shown in the disaster management index, RMIDM, which includes
emergency response, recovery, and rehabilitation. This index moved from 11.9 to 45 in the last 20
years. Performance indicates to have been “outstanding” in aspects related to the organization and
coordination for the emergency response, emergency planning, warning systems, provision of
equipment, and execution of mock drills, community preparedness and preparation for the
reconstruction process. Nevertheless, major challenge relates to maintaining sound and permanent
coordinated procedures among local authorities, the community and the organizations in charge of
providing public services, and those whose mandate is dealing with the emergency response, within
each city and among them all. Other aspects to consider to boost Disaster Management in the city it
is to provide the municipalities with standardized contingency plans and warning systems to each
city, provide the cities with well staffed and organized emergency centers, engage the community,
the private sector and the media in periodic drills, exercises and capacity building initiatives, and
design appropriate standard operating procedures for reconstruction and rehabilitation phases.
Progress has been modest in Risk Reduction, RMIRR, going from 4.6 points to 36.1, nevertheless,
the last five years are the ones that show major changes, almost doubling its progress. Advance has
been “outstanding” for land use and urban planning, the implementation of structural measures for
mitigation, management of slums and informal settlements in zones at risk and the development and
implementation of construction and safety standards. Nevertheless progress shows to be “incipient”
when dealing with environmental protection and regulatory processes for hydrological basins, or
retrofitting of public, private or key buildings and infrastructure. Options to improve risk reduction
should consider the effective inclusion of action plans through sectoral planning, incorporate studies
of hazards and vulnerabilities in the development plans of each city, prioritize key hydrological
basins for intervention as well as zones at risk by introducing structural corrective and prospective
measures, look into options for resettlement and intervention of those freed lands, update and
20
improve enforcing mechanisms of building codes and construction standards, and promote
retrofitting of key public and private buildings.
Governance and financial protection linked to disaster risk management is the area that shows the
least progress, going from 4.6 points to only 13. Progress has been “incipient” for inter-institutional
and multi-sectoral organization, the use of calamity funds or the provision of budget for prevention
and mitigation including institutional strengthening. The implementation of social networks and social
security funds as well as insurance for the private sector does not show major progress either.
Performance level regarding public insurance, financial protection and strategies for risk transfer
have been “low”, which is basically due to the fact that insurance is mostly a responsibility of the
national government and not that of the local or municipal administrations. All in all, lack of
availability of resources for disaster risk management has a direct impact in the little progress shown.
Therefore, it would be necessary to look for higher and more permanent budgetary allocation of
funds, improve community-based social protection networks, promote obligatory insurance for public
assets and propose incentives to stimulate insurance in the private sector.
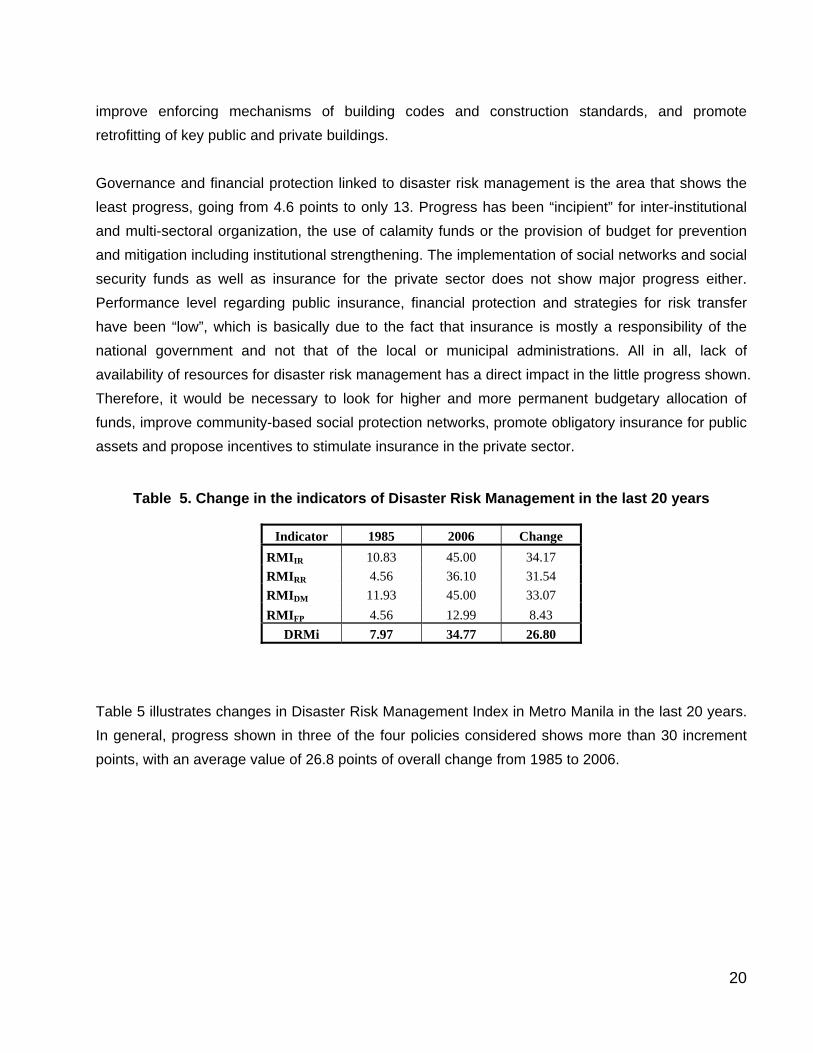
Table 5. Change in the indicators of Disaster Risk Management in the last 20 years
Indicator 1985 2006 Change
RMIIR 10.83 45.00 34.17
RMIRR 4.56 36.10 31.54
RMIDM 11.93 45.00 33.07
RMIFP 4.56 12.99 8.43
DRMi 7.97 34.77 26.80
Table 5 illustrates changes in Disaster Risk Management Index in Metro Manila in the last 20 years.
In general, progress shown in three of the four policies considered shows more than 30 increment
points, with an average value of 26.8 points of overall change from 1985 to 2006.
21
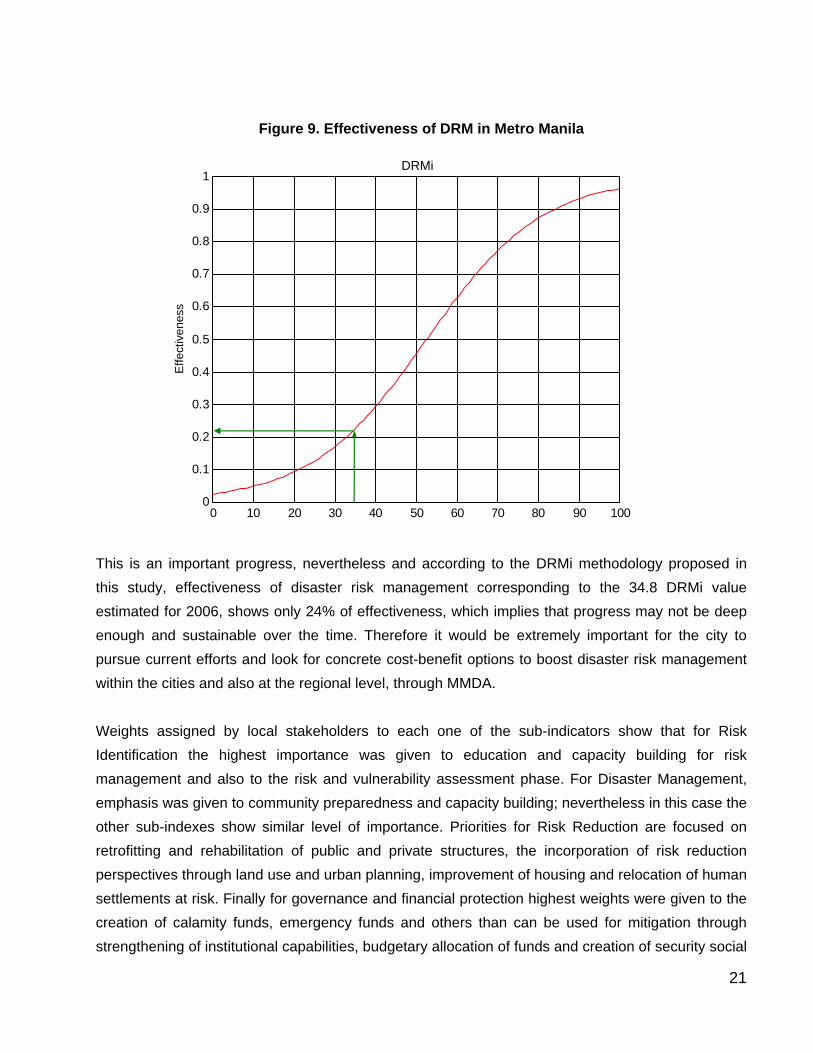
Figure 9. Effectiveness of DRM in Metro Manila
This is an important progress, nevertheless and according to the DRMi methodology proposed in
this study, effectiveness of disaster risk management corresponding to the 34.8 DRMi value
estimated for 2006, shows only 24% of effectiveness, which implies that progress may not be deep
enough and sustainable over the time. Therefore it would be extremely important for the city to
pursue current efforts and look for concrete cost-benefit options to boost disaster risk management
within the cities and also at the regional level, through MMDA.
Weights assigned by local stakeholders to each one of the sub-indicators show that for Risk
Identification the highest importance was given to education and capacity building for risk
management and also to the risk and vulnerability assessment phase. For Disaster Management,
emphasis was given to community preparedness and capacity building; nevertheless in this case the
other sub-indexes show similar level of importance. Priorities for Risk Reduction are focused on
retrofitting and rehabilitation of public and private structures, the incorporation of risk reduction
perspectives through land use and urban planning, improvement of housing and relocation of human
settlements at risk. Finally for governance and financial protection highest weights were given to the
creation of calamity funds, emergency funds and others than can be used for mitigation through
strengthening of institutional capabilities, budgetary allocation of funds and creation of security social
0 10 20 30 40 50 60 70 80 90 1000
0.1
0.2
0.3
0.4
0.5
0.6
0.7
0.8
0.9
1Índice de Gestión de Riesgos
Efe
ctiv
idad
DRMiE
ffec
tiven
ess
0 10 20 30 40 50 60 70 80 90 1000
0.1
0.2
0.3
0.4
0.5
0.6
0.7
0.8
0.9
1Índice de Gestión de Riesgos
Efe
ctiv
idad
DRMiE
ffec
tiven
ess
22
networks for protection.
Attachment 1 shows all the graphs that were used to derive this analysis; they should be seen along
with the methodological definition documents and power point presentations that are also attached
to this report.
Evaluation of the pilot process in Metro Manila
After the introduction of the MIS in March 2006 at a small workshop, the First Seismic Risk
Reduction and Risk Management Indicators Workshop in Metro Manila was held in May 22,
2006. One of the aims of the workshop was to engage the pilot cities of Makati, Marikina
and Quezon in assessing their own disaster risk management system. The MIS was
received favorably as shown by the results of the workshop evaluation survey conducted at
the end of the workshop.
Out of the 51 participants, 29 responded (or a response rate of 56.9%). All except one (who
was indifferent) felt that the workshop was relevant to his/her work and that he/she plans to
work together towards the adoption and use of the risk indicators.
The MIS was seen as a tool to monitor the progress of disaster risk management in a city.
Ramon Santiago, head of special projects at MMDA, responded very positively to the MIS
during the preparatory meeting and debriefing of the week-long activities in May 2006. Mr.
Santiago and the EMI local investigator Dr. Renato Solidum suggested that the Technical
Working Group of the Metropolitan Manila Disaster Coordinating Council (MMDCC) be
directly involved in the MIS application in Metro Manila.
These two examples make it clear that there is a great interest among city officials and
stakeholders in Metro Manila and its pilot cities to understand and make use of the MIS
methodology in the future. Further, the potential of using the MIS in Manila for decision
making appears to be high.
Lessons from the experience in Metro Manila will be used when implementing the model in
other cities and have been used in this report to propose a revised implementation
procedure.
23
Findings and recommendations
Three aspects will be discussed in this section:
Implementation Process
Further investigation of the methodology for megacities, and the use of descriptors
/indicators
Presentation of the results
Implementation Process, step by step checklist
In order to ensure a smother process of application of the methodology in an urban
environment, it is recommended that the implementation team look into the following
recommendations prior to initiating the implementation process in a given city:
a. Constitute a “core group” (CG) to prepare implementation phase under the 3cd Program
Local Investigator. This group will be integrated by no more than 4 persons with
adequate knowledge of at least one of the DRM fields.
b. Train members of the CG on the application of the methodology and its key elements,
such as data collection and methods to estimate weights for the different descriptors.
c. Define the terms used in the methodology. Carry out background studies to avoid
misinterpretation of terms by respondents in the pilot city.
d. The CG will investigate availability of the descriptors and their proxies within local condi-
tions. The questionnaires will be pre-tested before using them with a larger group.
e. The CG will identify agencies/institutions which are in charge of data collection both at
the national and city level.
f. The LI and the CG will identify and put together a “Focus Group” (FG) constituted by a
selected group of key city stakeholders who will test, monitor, and validate the results of
the implementation phase.
g. The optimum number of members of the FG will be decided by the CG, in any case it
should have at least three members and a maximum of 10 so that the group is easier to
handle.
h. It is also expected that the FG will count on representatives from academia, particularly
someone who has been working on decision science and risk management, local
officials, and other organized groups of the society.
i. The CG will review and suggest changes to improve the translation of the technical
documents on the methodology and adopt local terminology whenever possible, to
24
facilitate its comprehension.
j. Whenever possible the forms for data collection and evaluation of weights will be made
more “user friendly”, or consider other options such as staging the survey process in two
half-day sessions, for example.
Further investigation of the methodology for megacities
a. There is a need to further investigate, understand, and select different sets of scenarios,
for example what makes more sense for a city, using the worst case scenario? Or the
most probable one? Use of probabilistic versus deterministic approaches to estimate
human and material losses? How about using “envelope” risk?
b. It would be interesting to move from earthquake hazard only to a multi-hazard approach,
and see if this makes more sense for cities, as some of them suffer huge flooding losses
every year.
c. Explore how to work out this methodology in cities with little hazard/risk analysis; would it
be enough to start with rough or low resolution data or would it make more sense to
promote detailed RVA analysis for cities?
d. The estimation of weights is something that needs to be simplified or better understood
by end users in order to make the implementation process more manageable.
It is suggested to initiate the process by using existing or “borrowed” weights in order
to provide a comprehensive sense of the purpose of the MIS application, estimate
certain results, and motivate the target group.
In this regard, the implementation team suggests using both “budget allocation”
procedures or direct weight allocation to divide tendencies and possible weights, in
addition to using “borrowed weights” for a first trial.
AHP should be done within the above described core group if necessary to get them
familiar with the methodology.
e. Regarding the descriptors or variables, some important observations and suggestions
are made:
Need to perform sensitivity analysis to understand variability of the results to various
descriptors; however, it is important to keep in mind that those most relevant for the
purpose of risk communication should be preserved.
Need to review the descriptors for USRi and DRMi to identify those most relevant to
the Megacity context.
Need to look with more detail at issues related to variability of the results
(spread/dispersion); for example, the results generated for the urban seismic risk in
Metro Manila show a big variability from one city to the other.
25
It is necessary to look at relevant ways to relate the descriptors of USRi and DRMi to
the DRMMP in the cities or other specific goals that the cities need to achieve, in
order to mainstream risk communication. Develop means to institutionalize the use of
indicators.
Presentation of the results
a. It is important to document the DRM context of each one of the cities to better
understand its culture and how to best present the results of the MIS to gain local
ownership and actual use of the indicators.
b. It is important to decide what types of results are worth presenting, which is the
appropriate format, what kind of maps and exhibits make sense for the cities.
c. It is important to decide on a strategy to gain the acceptance of the methodology by a
wide range of city stakeholders.
d. Find appropriate ways to relate MIS to the DRMMP concept.
e. Disaggregate the indicators to link them to specific risk management activities.
References 1. National University of Colombia-Manizales, Institute of Environmental Studies, Inter-American
Development Bank, “Indicators of Disaster Risk and Risk Management, Main Technical Report”, August, 2005
2. Carreño ML., Cardona OD., Barbat A., “Urban Seismic Risk Evaluation: A Holistic Approach”, Natural Hazards Journal, in press, 2006
3. Carreño ML., Cardona OD., Barbat A., “Evaluation of the Risk Management Performance”, Proceedings of the 250th Anniversary of the 1755 Lisbon Earthquake, 2005
4. Carreño, M.L., (2006). Técnicas innovadoras para la evaluación del riesgo sísmico y su gestión en centros urbanos: Acciones ex ante y ex post, Doctoral Thesis, Technical Universitity of Catalonia, Barcelona.
5. Carreño ML., Cardona OD., Barbat A., Checklists and Forms for USRi in Metro Manila, March 2006
6. Carreño ML., Cardona OD., Barbat A., Measurement of Risk Management Performance in Metro Manila, general description and forms, March, 2006
7. Cardona OD., Carreño M.L., Barbat A., Resumen del proceso de aplicación del USRi in Metro Manila, August, 2006
8. Cardona OD., Carreño M.L., Barbat A., Resumen del proceso de aplicación del DRMi in Metro Manila, August, 2006
9. Fernandez AL., Piloting of risk indicators in Metro Manila: an evaluation note, August, 2006 10. Fernandez AL., A report on the disaster risk indicators workshop held to initiate the “Megacity
Indicators System” for Metro Manila, April, 2006 11. Bendimerad F., Comments on the Megacity Indicators Process in Metro Manila, August, 2006 12. Fernandez J., MIS in Metro Manila: Lessons Learned from the implementation Process, August
2006

![Understanding Form 3CD - Rajkot ICAI1).pdf · Understanding Form 3CD amendments [vide notification No. 33/2018 dt. 20 th July, 2018] CA. Deepak M. Rindani drindani@rindani.in (assisted](https://img.pdfslide.us/doc/110x75/5e86b19a213c8a6cc352a4a9/understanding-form-3cd-rajkot-1pdf-understanding-form-3cd-amendments-vide.jpg)
![Form 3CD for uploading - Taxguru.In · FORM NO. 3CD [See rule 6 G(2)] Statement of particulars required to be furnished under section 44AB of the Income-tax Act, 1961 PART - A 1](https://img.pdfslide.us/doc/110x75/5fa5b288383c497eb212b903/form-3cd-for-uploading-form-no-3cd-see-rule-6-g2-statement-of-particulars.jpg)


![FORM NO. 3CD PART - A - CAClub · 2020-01-27 · FORM NO. 3CD [See rule 6G(2)] Statement of particulars required to be furnished under section 44AB of the Income-tax Act, 1961 PART](https://img.pdfslide.us/doc/110x75/5e9585a4756df4090616e037/form-no-3cd-part-a-caclub-2020-01-27-form-no-3cd-see-rule-6g2-statement.jpg)

![SE R VICE MAN U AL MODEL 3CD CHANGER DVD KARAOKE …archive.espec.ws/files/lg_lm-u1350a_[ET].pdf · 3cd changer dvd karaoke system service manual model: lm-u1350a, lm-u1350d, lm-u1350x,](https://img.pdfslide.us/doc/110x75/608a678dbd4b825df3709e6f/se-r-vice-man-u-al-model-3cd-changer-dvd-karaoke-etpdf-3cd-changer-dvd-karaoke.jpg)


![FORM NO. 3CD [See rule 6 G(2)] Statement of particulars required](https://img.pdfslide.us/doc/110x75/58a017a71a28ab5c788b46c7/form-no-3cd-see-rule-6-g2-statement-of-particulars-required-.jpg)