Embed Size (px)
Citation preview

© HCL Technologies – Proprietary and Confidential
HCL Global Capability and Case Studies
© HCL Japan Ltd. All rights reserved.
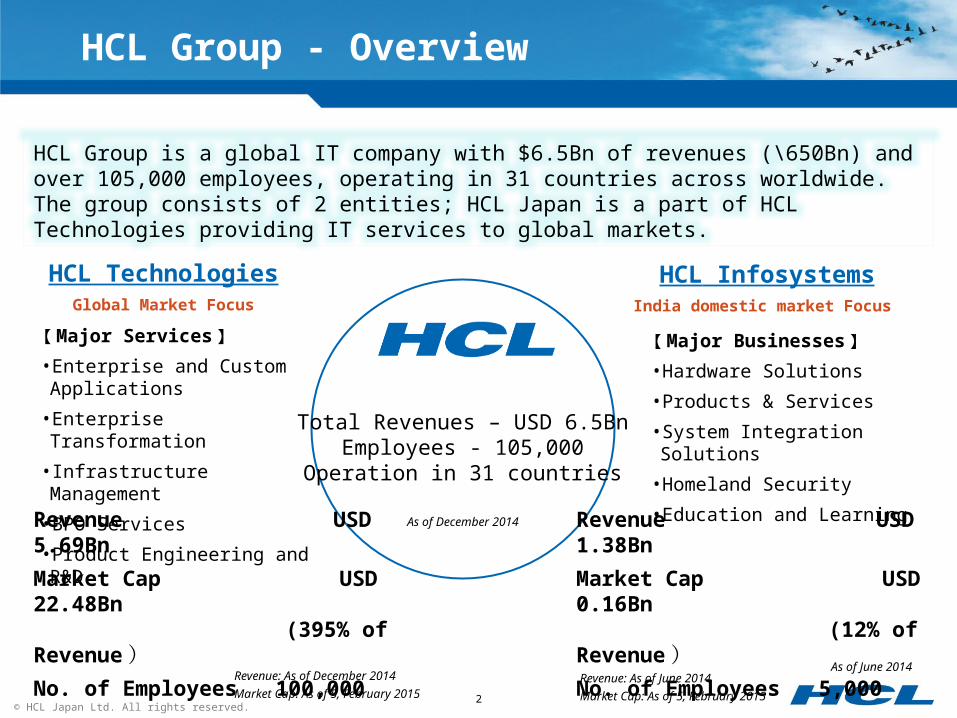
HCL Group is a global IT company with $6.5Bn of revenues (\650Bn) and over 105,000 employees, operating in 31 countries across worldwide. The group consists of 2 entities; HCL Japan is a part of HCL Technologies providing IT services to global markets.
Total Revenues – USD 6.5BnEmployees - 105,000
Operation in 31 countries
As of December 2014
HCL InfosystemsIndia domestic market Focus
2
HCL TechnologiesGlobal Market Focus
Revenue USD 5.69Bn Market Cap USD 22.48Bn
(395% of Revenue )No. of Employees 100,000
【 Major Services 】•Enterprise and Custom Applications
•Enterprise Transformation
• Infrastructure Management
•BPO Services
•Product Engineering and R&D
【 Major Businesses 】•Hardware Solutions
•Products & Services
•System Integration Solutions
•Homeland Security
•Education and Learning
HCL Group - Overview
Revenue USD 1.38Bn Market Cap USD 0.16Bn
(12% of Revenue )No. of Employees 5,000
As of June 2014Revenue: As of December 2014
Market Cap: As of 5, February 2015Revenue: As of June 2014
Market Cap: As of 5, February 2015
© HCL Japan Ltd. All rights reserved.
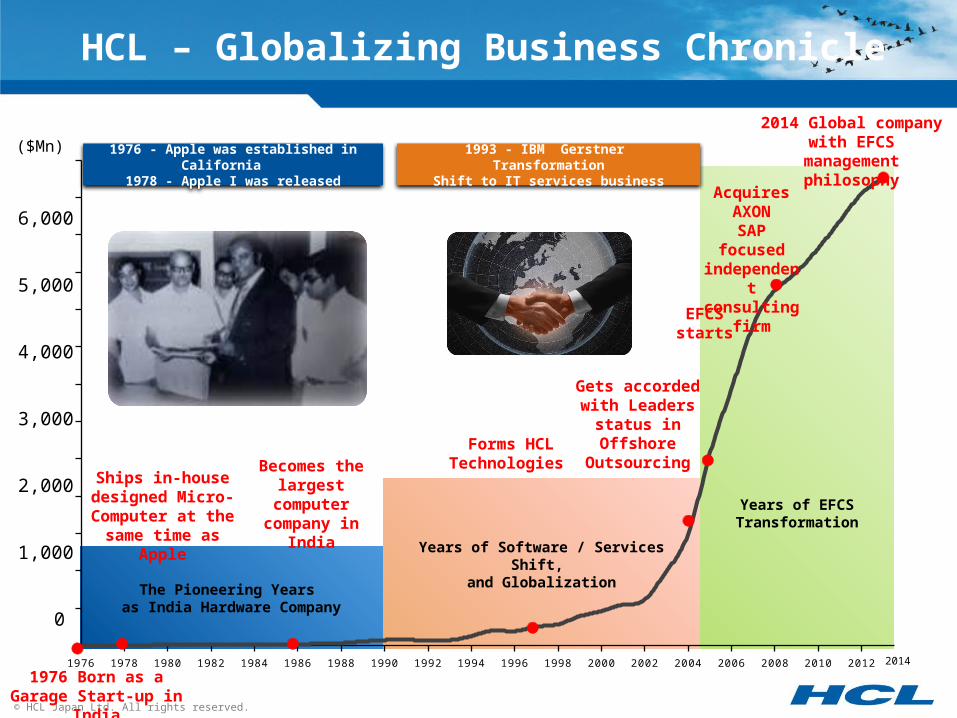
The Pioneering Years as India Hardware Company
Years of Software / Services Shift, and Globalization
Years of EFCS Transformation
1976 1978 1980 1982 1984 1986 1988 1990 1992 1994 1996 1998 2000 2002 2004 2006 2008 2010 2012
1,000
2,000
0
6,000
5,000
3,000
4,000
($Mn)
HCL – Globalizing Business Chronicle
1976 Born as a Garage Start-up in India
2014 Global company with EFCS management
philosophy
Ships in-house designed Micro-Computer at the
same time as Apple
Becomes the largest computer company in India
Forms HCL Technologies
EFCSstarts
Acquires AXON
SAP focused independent consulting
firm
1976 - Apple was established in California 1978 - Apple I was released
1993 - IBM Gerstner TransformationShift to IT services business
Gets accorded with Leaders
status in Offshore
Outsourcing
2014
© HCL Japan Ltd. All rights reserved.
JFM
09
AMJ0
9
JAS09
OND09
JFM
10
AMJ1
0
JAS10
OND10
JFM
11
AMJ1
1
JAS11
OND11
JFM
12
AMJ1
2
JAS12
OND12
JFM
13
AMJ1
3
18%21%
26%29%
21% 21%
28%
33% 33%31%
25%
18%
15%12% 11%
13% 14% 14%
-2% -3% -4%
6%
15%
20%
27% 27% 26% 26%
20%
16%13%
9%8%
9% 10%13%
HCL Average - India Top 3 Average - Global Top 3
2009 2010 2011 2012 2013
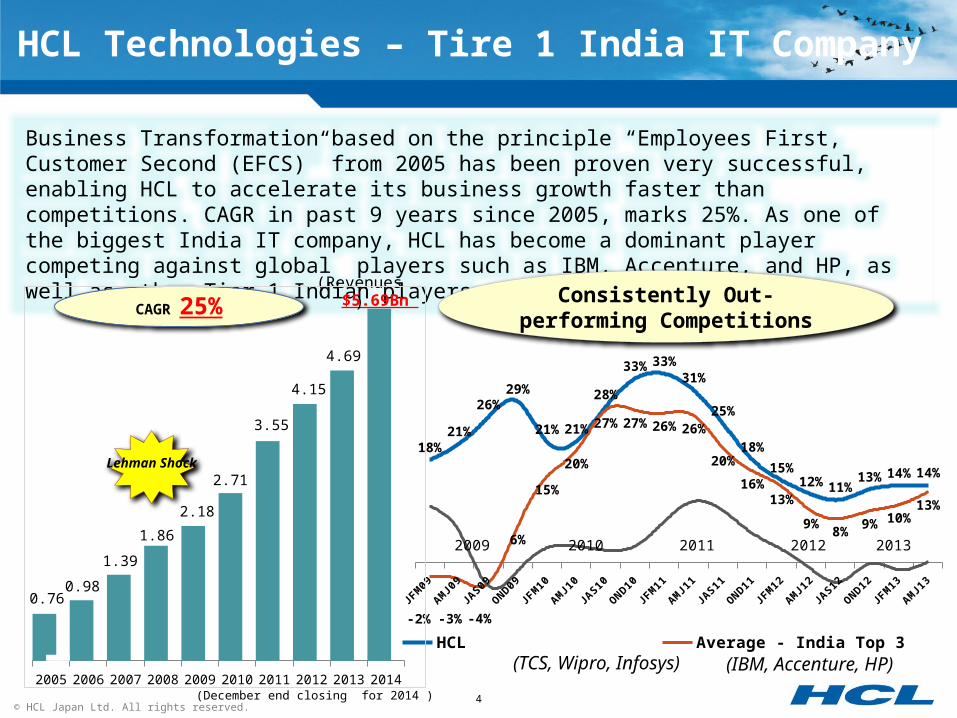
Business Transformation based on the principle “Employees First, Customer Second (EFCS)” from 2005 has been proven very successful, enabling HCL to accelerate its business growth faster than competitions. CAGR in past 9 years since 2005, marks 25%. As one of the biggest India IT company, HCL has become a dominant player competing against global players such as IBM, Accenture, and HP, as well as other Tier 1 Indian players.
HCL Technologies – Tire 1 India IT Company
4
$5.69Bn Consistently Out-performing Competitions
CAGR 25%
(TCS, Wipro, Infosys) (IBM, Accenture, HP)
(December end closing for 2014 )
(Revenues)
Lehman Shock
2005 2006 2007 2008 2009 2010 2011 2012 2013 2014
4.69
4.15
3.55
2.71
2.18
1.86
1.39
0.980.76

© HCL Japan Ltd. All rights reserved.
HCL Technologies has gone through the business transformation since 2005 with Principle - 『 Employees First, Customers Second(EFCS) 』HCL provides customers with value created by empowered front-line employees who interact with our customers.
“Employees First, Customers Second” written by HCL Technologies CEO Vineet
Nayar, is translated in various languages and widely read. Japanese translation was published in 2012, and rankled in the 3rd place of “Company transformation” section of Amazon Japan.
Employees First, Customers Second (EFCS)
The impact of “Employees First and Customers Second” management, written by the CEO of global company from India, HCL Technologies.Revenues triples, profit triples, the number of customers increased by 5 times, retention rate down to half, all in 4 years,
Draws the attention of business magazines, business schools, management philosopher and Japanese companies
5
” Empowering high-performance teams re-ignites growth and prosperity”
”Example for Business Model
Transformation”

© HCL Japan Ltd. All rights reserved.
Employees Transformation – Before and After
2014(Calendar Year)
100,000EMPLOYEES
$5.6 BnREVENUES
OPERATIONS
IN 31 COUNTRIES
ANNUALCAST SCORES
58.5
MARKETCAP AT
$22.4 BnATTRITION
AT 14.2%
REVENUE PEREMPLOYEE AT
56K
754%Growth
646%increase
51.3%Improvement
316%Head count
increase
24,000EMPLOYEES
$750MnREVENUES
OPERATIONS
IN 15 COUNTRIES
ANNUALCAST
SCORES
27.7
ATTRITION
AT 18.3%REVENUE PEREMPLOYEE AT
37KMARKETCAP AT
$2.62 Bn
2005(Fiscal Year)
© HCL Japan Ltd. All rights reserved.
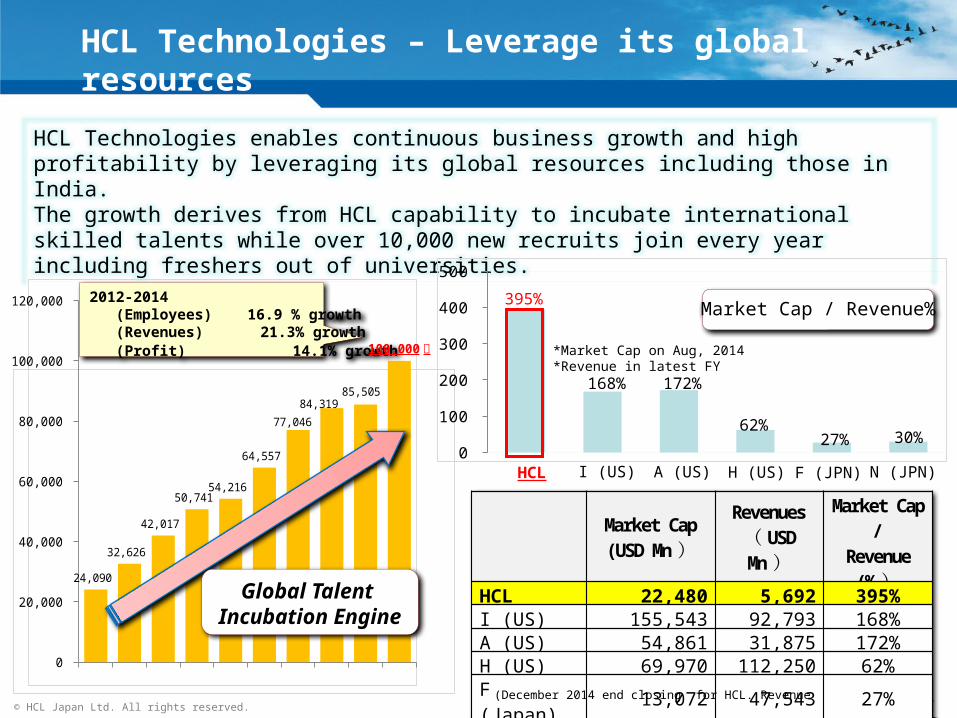
HCL Technologies enables continuous business growth and high profitability by leveraging its global resources including those in India. The growth derives from HCL capability to incubate international skilled talents while over 10,000 new recruits join every year including freshers out of universities.
HCL Technologies – Leverage its global resources
7
HCL I (US) A (US) H (US) F (JPN) N (JPN)
Market Cap / Revenue%2012-2014 (Employees) 16.9 % growth (Revenues) 21.3% growth (Profit) 14.1% growth *Market Cap on Aug, 2014
*Revenue in latest FY
2005 2006 2007 2008 2009 2010 2011 2012 2013 20140
20,000
40,000
60,000
80,000
100,000
120,000
24,090
32,626
42,017
50,741 54,216
64,557
77,046
84,319 85,505
100,000 人
0 50
100 150 200 250 300 350 400 450
395%
168% 172%
62%27% 30%
Market Cap(USD Mn )
Revenues( USD Mn )
Market Cap /
Revenue (% )
HCL 22,480 5,692 395%I (US) 155,543 92,793 168%A (US) 54,861 31,875 172%H (US) 69,970 112,250 62%F (Japan) 13,072 47,543 27%N (Japan) 9,207 30,431 30%
Global Talent Incubation Engine
(December 2014 end closing for HCL. Revenue in latest FY and its Market Cap for other companies)

© HCL Japan Ltd. All rights reserved.
The top 20 companies in global IT services industry are ranked by market capitalization, followed by the ratio of company’s revenues to market capitalization. The last column indicates HCL’s stock performance in the last decade – over 900% returns ranked No.1 by far in the industry. ( Source: FactSet on 4, Feb 2015)
Benchmarking Global IT Companies
8
First Place
Second Place
ThirdPlace
2015/2/4 Market Cap Net Sales MktVal/Sales Invested on J an 1, 2005
Company Name Country M USD M USD ratio Investment Return (%)
IBM USA 155,547 92,793 168% 89.8
Tata Consultancy Services Limited INDIA 80,999 13,537 598% 541.7
Accenture Plc USA 54,861 31,875 172% 290.8
Infosys Limited INDIA 40,825 8,295 492% 245.1
Cognizant Technology Solutions Corporation Class AUSA 35,244 10,263 343% 444.6
Wipro Limited INDIA 25,497 7,186 355% 149.8
HCL Technologies Limited INDIA 22,449 5,232 429% 938.8
SAMSUNG SDS CO.LTD SOUTH KOREA 18,441 6,437 286% #N/A
富士通 J APAN 13,072 47,543 27% 10.7
Cap Gemini SA FRANCE 12,239 13,398 91% 191.5
CGI Group Inc. Class A CANADA 11,425 9,698 118% 513.5
Tech Mahindra Limited INDIA 11,187 3,111 360% #N/A
エヌ・ティ・ティ・データ J APAN 11,044 13,415 82% 42.8
Vmware, Inc. Class A USA 10,523 6,035 174% #N/A
Citrix Systems, Inc. USA 9,848 3,143 313% 152.1
Computer Sciences Corporation USA 8,799 12,998 68% 23.3
Atos SE FRANCE 7,769 11,437 68% 19.6
野村総合研究所 J APAN 7,671 3,853 199% 124.2
Amdocs Limited USA 7,660 3,563 215% 97.6
Teradata Corporation USA 7,188 2,732 263% #N/A

© HCL Japan Ltd. All rights reserved.
Market Cap among Japanese IT Enterprises is relatively small due to low growth and profit.Japan’s IT Industry’s unique [Multi-Layered Subcontracting Structure] goes against global sourcing trends of the world and suffers from lack of Economies of Scales. Such structures, initially built during Mainframe era, is now facing malfunctions in new IT Industry with diverse platforms with fast dynamic changes.
【 Appendix 】 Comparison with Japanese IT Services Companies
9
2015/2/4 J apaese Companies OnlyMarket Cap Net Sales MktVal/Sales Invested on J an 1, 2005
Symbol Company Name Country M USD M USD ratio Investment Return (%)6702 富士通 J APAN 13,072 47,543 27% 10.79613 エヌ・ティ・ティ・データ J APAN 11,044 13,415 82% 42.84307 野村総合研究所 J APAN 7,671 3,853 199% 124.24768 大塚商会 J APAN 3,692 5,783 64% 146.34739 伊藤忠テクノソリューションズ J APAN 2,237 3,489 64% 18.73626 ITホールディングス J APAN 1,492 3,461 43% #N/A2327 新日鉄住金ソリューションズ J APAN 1,399 1,796 78% 16.31973 NECネッツエスアイ J APAN 1,010 2,699 37% 175.17518 ネットワンシステムズ J APAN 559 1,422 39% -60.19682 DTS J APAN 523 641 82% 129.28096 兼松エレクトロニクス J APAN 436 638 68% 197.23636 三菱総合研究所 J APAN 406 854 48% #N/A
© HCL Japan Ltd. All rights reserved.
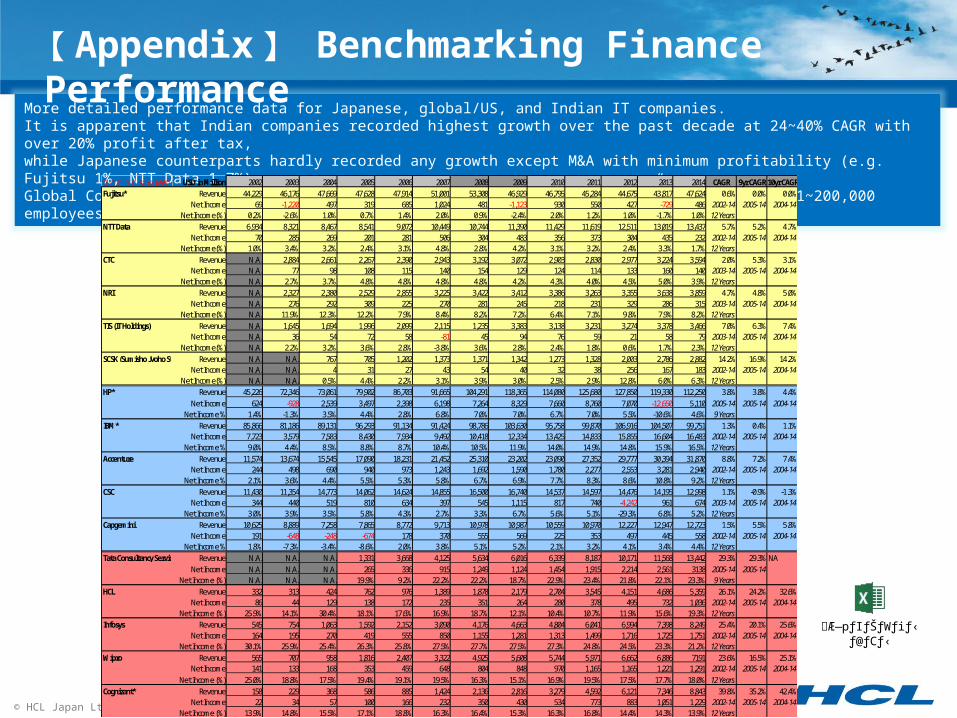
More detailed performance data for Japanese, global/US, and Indian IT companies. It is apparent that Indian companies recorded highest growth over the past decade at 24~40% CAGR with over 20% profit after tax, while Japanese counterparts hardly recorded any growth except M&A with minimum profitability (e.g. Fujitsu 1%, NTT Data 1.7%)Global Companies such as Accenture and IBM are now nearly “Half Indians” with each over 1~200,000 employees in India.
【 Appendix 】 Benchmarking Finance Performance
10
$1=\100日本企業は 計算 USD in Million 2002 2003 2004 2005 2006 2007 2008 2009 2010 2011 2012 2013 2014 CAGR 9yr CAGR 10yr CAGRFujitsu* Revenue 44,229 46,176 47,669 47,628 47,914 51,001 53,308 46,929 46,795 45,284 44,675 43,817 47,624 0.6% 0.0% 0.0%
Net Income 69 -1,220 497 319 685 1,024 481 -1,123 930 550 427 -729 486 2002-14 2005-14 2004-14Net Income(%) 0.2% -2.6% 1.0% 0.7% 1.4% 2.0% 0.9% -2.4% 2.0% 1.2% 1.0% -1.7% 1.0% 12 Years
NTT Data Revenue 6,934 8,321 8,467 8,541 9,072 10,449 10,744 11,390 11,429 11,619 12,511 13,019 13,437 5.7% 5.2% 4.7%Net Income 70 285 269 201 281 506 304 483 356 373 304 435 232 2002-14 2005-14 2004-14
Net Income(%) 1.0% 3.4% 3.2% 2.4% 3.1% 4.8% 2.8% 4.2% 3.1% 3.2% 2.4% 3.3% 1.7% 12 YearsCTC Revenue N.A. 2,884 2,661 2,267 2,390 2,943 3,192 3,072 2,903 2,830 2,977 3,224 3,594 2.0% 5.3% 3.1%
Net Income N.A. 77 98 108 115 140 154 129 124 114 133 160 140 2003-14 2005-14 2004-14Net Income(%) N.A. 2.7% 3.7% 4.8% 4.8% 4.8% 4.8% 4.2% 4.3% 4.0% 4.5% 5.0% 3.9% 12 Years
NRI Revenue N.A. 2,327 2,380 2,529 2,855 3,225 3,422 3,412 3,386 3,263 3,355 3,638 3,859 4.7% 4.8% 5.0%Net Income N.A. 276 292 309 225 270 281 245 218 231 329 286 315 2003-14 2005-14 2004-14
Net Income(%) N.A. 11.9% 12.3% 12.2% 7.9% 8.4% 8.2% 7.2% 6.4% 7.1% 9.8% 7.9% 8.2% 12 YearsTIS (IT Holdings) Revenue N.A. 1,645 1,694 1,996 2,099 2,115 1,235 3,383 3,138 3,231 3,274 3,378 3,466 7.0% 6.3% 7.4%
Net Income N.A. 36 54 72 58 -81 45 94 76 59 21 58 79 2003-14 2005-14 2004-14Net Income(%) N.A. 2.2% 3.2% 3.6% 2.8% -3.8% 3.6% 2.8% 2.4% 1.8% 0.6% 1.7% 2.3% 12 Years
SCSK (Sumisho Jyoho System) Revenue N.A. N.A. 767 705 1,202 1,373 1,371 1,342 1,273 1,328 2,003 2,786 2,882 14.2% 16.9% 14.2%Net Income N.A. N.A. 4 31 27 43 54 40 32 38 256 167 183 2002-14 2005-14 2004-14
Net Income(%) N.A. N.A. 0.5% 4.4% 2.2% 3.1% 3.9% 3.0% 2.5% 2.9% 12.8% 6.0% 6.3% 12 YearsHP* Revenue 45,226 72,346 73,061 79,902 86,703 91,665 104,291 118,365 114,080 125,680 127,850 119,330 112,250 3.8% 3.8% 4.4%
Net Income 624 -928 2,539 3,497 2,398 6,198 7,264 8,329 7,660 8,760 7,070 -12,650 5,110 2005-14 2005-14 2004-14Net Income % 1.4% -1.3% 3.5% 4.4% 2.8% 6.8% 7.0% 7.0% 6.7% 7.0% 5.5% -10.6% 4.6% 9 Years
IBM* Revenue 85,866 81,186 89,131 96,293 91,134 91,424 98,786 103,630 95,758 99,870 106,916 104,507 99,751 1.3% 0.4% 1.1%Net Income 7,723 3,579 7,583 8,430 7,934 9,492 10,418 12,334 13,425 14,833 15,855 16,604 16,483 2002-14 2005-14 2004-14
Net Income % 9.0% 4.4% 8.5% 8.8% 8.7% 10.4% 10.5% 11.9% 14.0% 14.9% 14.8% 15.9% 16.5% 12 YearsAccenture Revenue 11,574 13,674 15,545 17,090 18,231 21,452 25,310 23,202 23,090 27,352 29,777 30,394 31,870 8.8% 7.2% 7.4%
Net Income 244 498 690 940 973 1,243 1,692 1,590 1,780 2,277 2,553 3,281 2,940 2002-14 2005-14 2004-14Net Income % 2.1% 3.6% 4.4% 5.5% 5.3% 5.8% 6.7% 6.9% 7.7% 8.3% 8.6% 10.8% 9.2% 12 Years
CSC Revenue 11,430 11,354 14,773 14,062 14,624 14,855 16,500 16,740 14,537 14,597 14,476 14,195 12,998 1.1% -0.9% -1.3%Net Income 344 440 519 810 634 397 545 1,115 817 740 -4,242 961 674 2003-14 2005-14 2004-14
Net Income % 3.0% 3.9% 3.5% 5.8% 4.3% 2.7% 3.3% 6.7% 5.6% 5.1% -29.3% 6.8% 5.2% 12 YearsCapgemini Revenue 10,625 8,889 7,258 7,865 8,772 9,713 10,978 10,987 10,559 10,970 12,227 12,947 12,723 1.5% 5.5% 5.8%
Net Income 191 -648 -248 -674 178 370 555 569 225 353 497 445 558 2002-14 2005-14 2004-14Net Income % 1.8% -7.3% -3.4% -8.6% 2.0% 3.8% 5.1% 5.2% 2.1% 3.2% 4.1% 3.4% 4.4% 12 Years
Tata Consultancy Service Revenue N.A. N.A. N.A. 1,331 3,668 4,125 5,634 6,016 6,339 8,187 10,171 11,568 13,442 29.3% 29.3% NANet Income N.A. N.A. N.A. 265 336 915 1,249 1,124 1,454 1,915 2,214 2,561 3138 2005-14 2005-14
Net Income (%) N.A. N.A. N.A. 19.9% 9.2% 22.2% 22.2% 18.7% 22.9% 23.4% 21.8% 22.1% 23.3% 9 YearsHCL Revenue 332 313 424 762 976 1,389 1,878 2,179 2,704 3,545 4,151 4,686 5,359 26.1% 24.2% 32.6%
Net Income 86 44 129 138 172 235 351 264 280 378 495 732 1,036 2002-14 2005-14 2004-14Net Income (%) 25.9% 14.1% 30.4% 18.1% 17.6% 16.9% 18.7% 12.1% 10.4% 10.7% 11.9% 15.6% 19.3% 12 Years
Infosys Revenue 545 754 1,063 1,592 2,152 3,090 4,176 4,663 4,804 6,041 6,994 7,398 8,249 25.4% 20.1% 25.6%Net Income 164 195 270 419 555 850 1,155 1,281 1,313 1,499 1,716 1,725 1,751 2002-14 2005-14 2004-14
Net Income (%) 30.1% 25.9% 25.4% 26.3% 25.8% 27.5% 27.7% 27.5% 27.3% 24.8% 24.5% 23.3% 21.2% 12 YearsWipro Revenue 565 707 958 1,816 2,407 3,322 4,925 5,608 5,744 5,971 6,662 6,886 7191 23.6% 16.5% 25.1%
Net Income 141 133 168 353 459 648 804 848 970 1,165 1,165 1,221 1,291 2002-14 2005-14 2004-14Net Income (%) 25.0% 18.8% 17.5% 19.4% 19.1% 19.5% 16.3% 15.1% 16.9% 19.5% 17.5% 17.7% 18.0% 12 Years
Cognizant* Revenue 158 229 368 586 885 1,424 2,136 2,816 3,279 4,592 6,121 7,346 8,843 39.8% 35.2% 42.4%Net Income 22 34 57 100 166 232 350 430 534 773 883 1,051 1,229 2002-14 2005-14 2004-14
Net Income (%) 13.9% 14.8% 15.5% 17.1% 18.8% 16.3% 16.4% 15.3% 16.3% 16.8% 14.4% 14.3% 13.9% 12 Years
ŽQÆ—pƒIƒŠƒWƒiƒ‹ƒtƒ@ƒCƒ‹

© HCL Japan Ltd. All rights reserved.
HCL – アプリケーションサービスに強み80% of business are in IT Services in both Application and Infrastructure Layers. With computer manufacturing DNAs from our foundation in 1976, we also have strong presence in Engineering Services (Incl. Embedded Software).
HCL Technologies – 80% is IT Services
Service Lines
11
Industry Verticals
Application Service 44.9%
Infrastructure Services Application Services Product/Engineering R&D Services
BPO4.5%Infrastructure Service 34.4%
34.4% 44.9% 16.1%
Manufacturing Financial Services
Health Care
Energy, Public Sector
33.3% 26.9% 10.10% 10.4% 8.5% 8.4%
Retail/Consumer Products
Media/Publishing/Entertainment

© HCL Japan Ltd. All rights reserved.
HCL Technologies relies on business model of high customer royalty as 95% of our revenues are from existing customers. Once we become partner, with repeating quality deliveries at competitive pricing, account growth automatically occur in my many cases!
John McDermott Former CIO Xerox” We want partners that share that ambition with us and help make IT a highly valued partner in organizational leadership and strategy development””
It’s good to do
business with HCL
1234567
Can effectively work with our IT team
Conform with budget and due
Accommodate organizational or local culture
Highly specialized knowledge
• From HCL Annual Customer Satisfaction Survey2013• Average point in 7 stage assessment from “Do not agree at all” to “Very much
agree”• Number of answers: 2,326
|||||
|||||
|||||
|||||
HCL Technologies – Business Partner for Customers
12
Boing 787 System Vice President
”HCL can provide us the highest values, highest services, and highest functions”

© HCL Japan Ltd. All rights reserved.
Largest among India vendors in Japan
2,300 are dedicated to Japan projects (300 are in Japan)
Established delivery with high offshore usage, that contributes to cost down for customers
13
”HCL Technologies is top offshore vendor in Japan ” - IDC *IDC Report: The Business Situation of Major India Vendors in the Japan IT Service Market 2012 ,
Doc # JP2578611U, Issued on December, 2012
HCL Technologies has its business deeply rooted in Japan. We gained high reputation from customers in Japan for our quality services.Our organic business grew and has been ranked as No.1 among India vendors in Japan.
TCS inorganic acquisition of Mitsubishi IT Frontier happened in July 2014. ⇒
HCL Technologies– Business rooted in Japan
Grew at CAGR 20% during recent 5 years
© HCL Japan Ltd. All rights reserved.
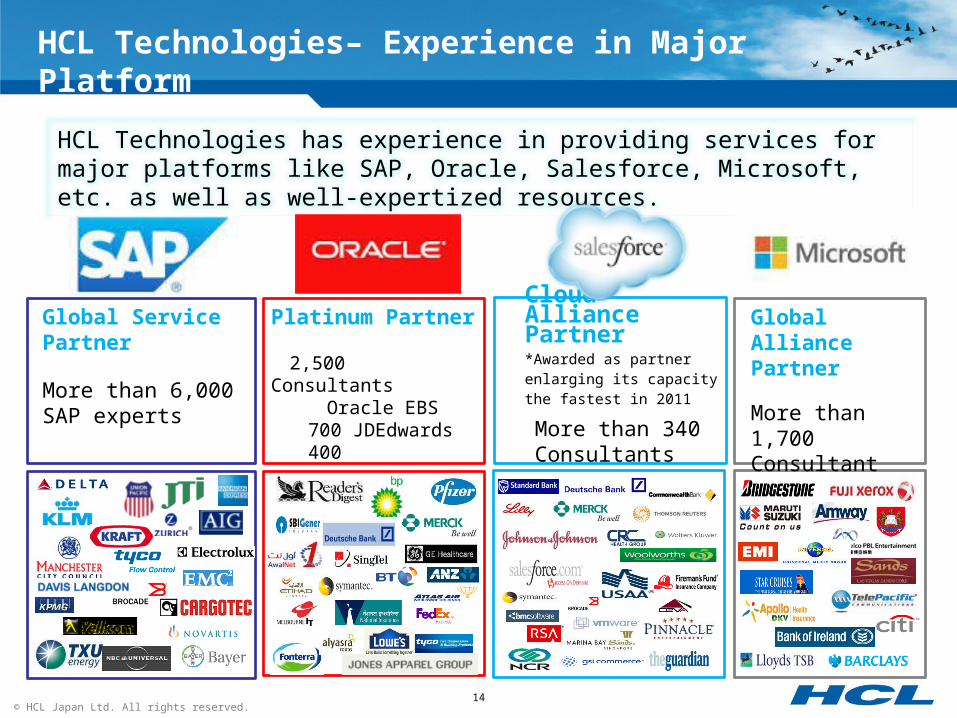
HCL Technologies has experience in providing services for major platforms like SAP, Oracle, Salesforce, Microsoft, etc. as well as well-expertized resources.
Platinum Partner
2,500 ConsultantsOracle EBS 700
JDEdwards 400
Cloud Alliance Partner*Awarded as partner enlarging its capacity the fastest in 2011
More than 340 Consultants
Global Service Partner
More than 6,000 SAP experts
Global Alliance Partner
More than 1,700 Consultant
HCL Technologies– Experience in Major Platform
14
© HCL Japan Ltd. All rights reserved.
Case Studies - Global IT Implementation
15
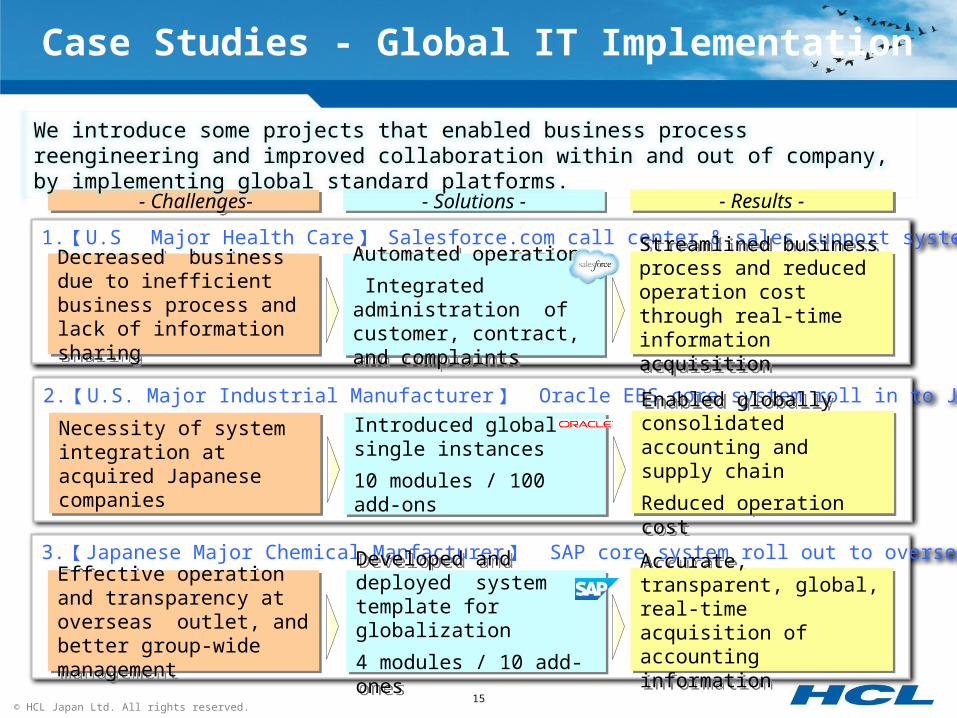
1. 【 U.S Major Health Care 】 Salesforce.com call center & sales support system implementation Decreased business due to
inefficient business process and lack of information sharing
Decreased business due to inefficient business process and lack of information sharing
Automated operation
Integrated administration of customer, contract, and complaints
Automated operation
Integrated administration of customer, contract, and complaints
Streamlined business process and reduced operation cost through real-time information acquisition
Streamlined business process and reduced operation cost through real-time information acquisition
3. 【 Japanese Major Chemical Manfacturer 】 SAP core system roll out to overseas
Effective operation and transparency at overseas outlet, and better group-wide management
Effective operation and transparency at overseas outlet, and better group-wide management
Developed and deployed system template for globalization
4 modules / 10 add-ones
Developed and deployed system template for globalization
4 modules / 10 add-ones
Accurate, transparent, global, real-time acquisition of accounting information
Accurate, transparent, global, real-time acquisition of accounting information
2. 【 U.S. Major Industrial Manufacturer 】 Oracle EBS core system roll in to Japan
Necessity of system integration at acquired Japanese companies
Necessity of system integration at acquired Japanese companies
Introduced global single instances
10 modules / 100 add-ons
Introduced global single instances
10 modules / 100 add-ons
Enabled globally consolidated accounting and supply chain
Reduced operation cost
Enabled globally consolidated accounting and supply chain
Reduced operation cost
- Challenges- - Challenges- - Solutions -- Solutions - - Results -- Results -
We introduce some projects that enabled business process reengineering and improved collaboration within and out of company, by implementing global standard platforms.

© HCL Japan Ltd. All rights reserved.
We introduce some projects that enabled business process reengineering and improved collaboration within and out of company, by implementing global standard platforms.
- Challenges- - Challenges- - Solutions -- Solutions - - Results -- Results -
Reasonable cost and high speed
1. 【 U.S Major Health Care 】 Salesforce.com call center & sales support system implementation Decreased business due to
inefficient business process and lack of information sharing
Decreased business due to inefficient business process and lack of information sharing
Automated operation
Integrated administration of customer, contract, and complaints
Automated operation
Integrated administration of customer, contract, and complaints
Streamlined business process and reduced operation cost through real-time information acquisition
Streamlined business process and reduced operation cost through real-time information acquisition
3. 【 Japanese Major Chemical Manfacturer 】 SAP core system roll out to overseas
Effective operation and transparency at overseas outlet, and better group-wide management
Effective operation and transparency at overseas outlet, and better group-wide management
Developed and deployed system template for globalization
4 modules / 10 add-ones
Developed and deployed system template for globalization
4 modules / 10 add-ones
Accurate, transparent, global, real-time acquisition of accounting information
Accurate, transparent, global, real-time acquisition of accounting information
2. 【 U.S. Major Industrial Manufacturer 】 Oracle EBS core system roll in to Japan
Necessity of system integration at acquired Japanese companies
Necessity of system integration at acquired Japanese companies
Introduced global single instances
10 modules / 100 add-ons
Introduced global single instances
10 modules / 100 add-ons
Enabled globally consolidated accounting and supply chain
Reduced operation cost
Enabled globally consolidated accounting and supply chain
Reduced operation cost
SFA20 million yen
(4 months )
45 million yen ( 4 months)
Call Center1 5 million yen
(4 months )

© HCL Japan Ltd. All rights reserved.
Canada
North America
Brazil, Argentina, Chile, Peru, Puerto Rico, Venezuela, Colombia, Mexico
Spain, Germany, Italy, Belgium, Austria, Portugal, Turkey, UK
Asia
Japan
India, China, Philippines, Australia, Singapore, Malaysia, Indonesia, Thailand, Taiwan.
50
100
100
30
1400
Europe 150
South America
Global IT Management - Goal
We provide support to leading global company which develops, imports, manufactures and sells various products in 140 countries. Among all 550 support resources, 400 are India-based offshore. (75% Offshore Usage)
17
We established and introduced India based hub and spoke model, i.e. global shared service model, that optimizes IT operation and maintenance resources, and consolidates process knowledge. Prompt action enabled higher productivity and drastic cost-down in IT management.
• SFDC• Oracle CRM-On
Demand• Oracle EBS• JDE• PeopleSoft
and others
Applications in the scope
Offshore 75%
<Location supported>28 countries
<No. of applications>More than1800
© HCL Japan Ltd. All rights reserved.18
HOW CAN I HELP YOU?