Embed Size (px)
Citation preview
e–Government initiatives:
analysing success
Doctor of Business Administration (DBA)
Henley Business School
Panagiotis (Panos) Hahamis
2016

Declaration
I confirm that this is my own work and the use of all material from other sources has been properly
and fully acknowledged.
Name: .........................................................................................................................................................
Date: ...........................................................................................................................................................
Signature: ...................................................................................................................................................
i
ABSTRACT
e-Government is an increasingly important strategy to enable the public sector to realise the benefits of
the Internet and a shift to digital technologies. This research reports on and addresses the challenges
faced by e-government initiatives that are intended to facilitate efficient and effective service delivery
and meet citizens’ expectations. Specifically, e-government in the UK and the Republic of Ireland is
claimed on the whole to be successful, yet this and prior research identifies significant challenges.
Studies of IT alignment with strategic objectives have been conducted mainly in the private sector and
there is a shortage of research focusing on the public sector. Given this and the mismatch of
expectations and results, an exploratory research methodology has been adopted, within a conceptual
framework derived from prior studies. As a result, this research was conducted from an interpretive
stance utilising case studies and qualitative data sources such as semi-structured interviews, milestone
documents and archival records. The scope comprises two substantial public-sector IT projects,
namely the Directgov Portal (UK) and Revenue-on-Line (ROI), offering a longitudinal perspective
covering a period of over ten years.
One key finding has been that e-government is often overly concerned with technical delivery and
efficiency savings, and not as much with the required organisational and business change.
Furthermore, initiatives fail to engage sufficiently the multiple stakeholders and intended users.
Larger, complex projects are more likely to fail for reasons such as over-ambition in the planning
process and overstating the benefits of the intended system. Lack of understanding by the
commissioning bodies as to the intricacies of IT projects can also inhibit success and thus the
attainment of best ‘value for money’. Many of these points can be categorised as alignment issues.
The conclusions, and new issues that emerge from the study, help to conceptualise the successful
strategic alignment of the adoption of e-government services. The resulting conceptual framework,
along with recommendations, adds value to the existing body of academic knowledge with regard
e-government projects, and offers insights for further research. In addition, the results are intended to
introduce practitioners and policy-makers supporting the evolution and implementation of such
systems to an efficient, effective, and citizen-centric design paradigm that yields public value.

ii
ACKNOWLEDGEMENTS
First of all, I would like to thank my supervisors at Henley Business School, Professors Sharm
Manwani, Yinshan Tang and Dan Remenyi, for their help, and for the support, patience and useful
insights they have provided over the years of this journey. Had it not been for their experience,
guidance, constructive feedback, encouragement and assurance, I would not have been able to
complete. At Henley, I am also grateful to Dr Claire Collins, Dr Richard McBain, Ms Veronica Clarke
and Ms Louise Hillier for their valuable support.
I would also like to thank my family, both in the UK and Greece, for their unconditional support,
patience and understanding. My wife Kate, son Joseph and daughter Emilia in particular, deserve a
Nobel Prize as they have not only seen me throughout this journey, but put up with me during endless
years of studying for various degrees.
I should not fail to mention my organisation, Westminster Business School, for the financial support I
received and in particular Professor Len Shackleton, the former Dean, who believed in me and gave
me the opportunity to pursue this DBA.
I am grateful to many public servants, consultants, academics and experts who gave me their time, co-
operation and provided me with insights which allowed the development of the case studies that form
the backbone of this research. Special thanks must go to Finn de Brie from the Irish Revenue
Commissioners in Dublin for organising the interviews and for going above and beyond, in order to
help me accomplish that part of the research during my short time there, as well as his warm
hospitality.
Last but not least, I need to thank a number of colleagues and all of my friends who stood by me
patiently during that time, offering moral support, encouragement and guidance.
iii
TABLE OF CONTENTS
Abstract ..................................................................................................................................................... i
Acknowledgements .................................................................................................................................. ii
Table of Contents ................................................................................................................................... iii
List of Figures ........................................................................................................................................ vii
List of Tables .......................................................................................................................................... ix
Chapter 1: Introduction ............................................................................................................................ 1
1.1 Overview ............................................................................................................................. 1
1.2 Background .......................................................................................................................... 1
1.2.1 Computerisation of Public Administration ............................................................. 1
1.2.2 The Emergence of e-Government ........................................................................... 1
1.2.3 e-Government Initiatives in the UK........................................................................ 3
1.2.4 Success and Failure of Public IT Projects .............................................................. 4
1.3 Frame of Reference ............................................................................................................. 4
1.4 Aim of the Research ............................................................................................................ 5
1.5 Rationale .............................................................................................................................. 5
1.6 Thesis Structure ................................................................................................................... 6
Chapter 2: Literature Review ................................................................................................................... 8
2.1 Overview ............................................................................................................................. 8
2.1.1 Scope of the Review ............................................................................................... 8
2.1.2 Literature Review Structure .................................................................................... 8
2.2 Government Modernisation and e-Government .................................................................. 9
2.2.1 Improving Civil Service Efficiency ........................................................................ 9
2.2.2 The Evolution of Computerisation in Government .............................................. 10
2.2.3 Bureaucracy and Government .............................................................................. 13
2.2.4 The New Public Service Management.................................................................. 14
2.2.5 The Post-NPM Era ................................................................................................ 15
2.2.6 e-Government ....................................................................................................... 15
2.2.7 e-Government Maturity and Growth Models ....................................................... 16
2.2.8 Beyond e-Government .......................................................................................... 20
2.3 Strategy and ICT-Enabled Business Change ..................................................................... 22
2.3.1 Strategy and Business Process Change (BPC) ..................................................... 22
2.3.2 The ITEBC Model ................................................................................................ 24
2.3.3 IT-enabled Business Change in Government ....................................................... 25
2.3.4 Business/Strategy IT Alignment Models .............................................................. 26
2.3.5 Assessing IT/Business Alignment ........................................................................ 29
2.3.6 Public Sector IT Alignment Models: The Conception-Reality Gap ..................... 31
2.3.7 Citizen-Centricity: Rhetoric or Reality? ............................................................... 33
iv
2.3.8 Ensuring Project Success ...................................................................................... 34
2.4 System Design and Business Process Re-engineering ...................................................... 36
2.4.1 BPR Concepts and Approaches ............................................................................ 36
2.4.2 BPR in the Public Sector ...................................................................................... 40
2.4.3 Bringing Down Silos ............................................................................................ 41
2.5 Implementation and Change Management ........................................................................ 41
2.5.1 Stakeholder Involvement ...................................................................................... 43
2.6 Benefits Realisation and IT/IS Projects Evaluation ........................................................... 44
2.6.1 Benefits Realisation Concept Overview ............................................................... 44
2.6.2 Value for Money (VFM) ...................................................................................... 45
2.6.3 BRM Approaches, Models and Frameworks ........................................................ 46
2.6.4 Public Sector BRM Methodologies ...................................................................... 48
2.6.5 IT/IS Projects Evaluation and Benchmarking ...................................................... 51
2.6.6 Evaluation and Organisational Learning .............................................................. 52
2.6.7 The DeLone & McLean Model of IS Success ...................................................... 53
2.6.8 Public Sector IS Evaluation .................................................................................. 54
2.6.9 International e-Government Benchmarking ......................................................... 56
2.6.10 e-Government Services Quality Evaluation ......................................................... 57
2.6.11 ‘Formal’ Public Value Measuring Methodologies ............................................... 57
2.7 IT and e-Government Projects Challenges ........................................................................ 63
2.7.1 Defining Success and Failure ............................................................................... 63
2.7.2 The Standish Group CHAOS Reports .................................................................. 64
2.7.3 Why Projects Falter .............................................................................................. 66
2.7.4 Agile for Success .................................................................................................. 69
2.7.5 UK Public Sector IT Projects: Failure and Success Indicators ............................. 70
2.8 Conceptual Framework...................................................................................................... 75
Chapter 3: Research Methodology ......................................................................................................... 78
3.1 Introduction ....................................................................................................................... 78
3.2 The Research Process ........................................................................................................ 78
3.3 Research Philosophy.......................................................................................................... 80
3.3.1 Research Paradigms: Positivism vs Interpretivism ............................................... 80
3.3.2 Philosophical Stance: Rationale ........................................................................... 81
3.4 Research Design ................................................................................................................ 81
3.4.1 Case Study ............................................................................................................ 86
3.4.2 Grounded Theory .................................................................................................. 88
3.4.3 Grounded Case Research ...................................................................................... 91
3.4.4 The Structured-Case Approach ............................................................................. 92
3.4.5 The Evolutionary Case Approach ......................................................................... 94
3.4.6 Chosen Approach: Rationale ................................................................................ 94
v
3.5 Validity .............................................................................................................................. 97
3.6 Case Studies Selection ..................................................................................................... 100
3.7 Instrumentation ................................................................................................................ 101
3.7.1 Data Sources ....................................................................................................... 101
3.7.2 Interviews ........................................................................................................... 102
3.7.3 Interview Schedule and Protocol ........................................................................ 104
3.7.4 Sampling Methods .............................................................................................. 108
3.7.5 Sample Selection and Interview Frame .............................................................. 109
3.7.6 Instrumentation Validity ..................................................................................... 113
3.8 Research Governance and Ethics .................................................................................... 114
3.9 Data Analysis Process ..................................................................................................... 115
3.10 Qualitative Data Analysis ................................................................................................ 118
3.11 Computer Assisted Qualitative Data Analysis ................................................................ 118
3.12 Use of NVivo: Rationale ................................................................................................. 120
3.12.1 Efficiency/Scope of Enquiry ............................................................................... 121
3.12.2 Transparency/Audit Trail .................................................................................... 121
3.13 Summary and Reflections ................................................................................................ 121
Chapter 4: Case Descriptions and Thematic Findings ......................................................................... 123
4.1 Overview ......................................................................................................................... 123
4.2 Case Structure: Identifying Themes ................................................................................ 123
4.3 Case Study 1 – Directgov ................................................................................................ 124
4.3.1 Case Background ................................................................................................ 124
4.3.2 Theme A: Areas of Responsibility – Public Servants and Expert
Consultants ......................................................................................................... 127
4.3.3 Theme B: System Design – The Processes for Creating Objectives for
e-Government Systems ....................................................................................... 128
4.3.4 Theme C: System Implementation ..................................................................... 142
4.3.5 Theme D: Evaluation and Future Development ................................................. 148
4.4 Case Study 2 – ROS ........................................................................................................ 164
4.4.1 Case Background ................................................................................................ 164
4.4.2 Theme A: Areas of Responsibility – Public Servants and
Experts/Consultants ............................................................................................ 166
4.4.3 Theme B: System Design – The Processes for Creating Objectives for
e-Government Systems ....................................................................................... 167
4.4.4 Theme C: System Implementation ..................................................................... 182
4.4.5 Theme D: Evaluation and Future Development ................................................. 188
4.5 Summary of Thematic Findings ...................................................................................... 198
4.5.1 Case Study 1 ....................................................................................................... 198
4.5.2 Case Study 2 ....................................................................................................... 200
4.6 Summary .......................................................................................................................... 203
vi
Chapter 5: Cross–Case Analysis .......................................................................................................... 204
5.1 Introduction ..................................................................................................................... 204
5.2 Cross–Case Analysis ....................................................................................................... 204
5.3 Cross–Case Analysis Issues............................................................................................. 205
5.3.1 Project Similarities.............................................................................................. 205
5.3.2 Project Differences ............................................................................................. 205
5.3.3 Method of Comparison ....................................................................................... 205
5.3.4 Key Issues ........................................................................................................... 212
5.3.5 Cross-life-cycleissues ......................................................................................... 227
5.4 Summary .......................................................................................................................... 233
Chapter 6: Summary and Conclusions ................................................................................................. 234
6.1 Introduction ..................................................................................................................... 234
6.2 Overview of the Research................................................................................................ 234
6.3 Research Questions ......................................................................................................... 234
6.4 Validation of Findings ..................................................................................................... 236
6.5 Research Contribution ..................................................................................................... 237
6.5.1 Theoretical and Applied Contribution ................................................................ 237
6.5.2 Methodological Contribution .............................................................................. 246
6.6 Limitations ....................................................................................................................... 247
6.7 Future Research ............................................................................................................... 249
6.8 Final Note ........................................................................................................................ 249
REFERENCES..................................................................................................................................... 250
Appendix 1: Interview Schedule Examples ......................................................................................... 279
Appendix 2: Invitation to Research Participants .................................................................................. 281
Appendix 3: Letter of Consent ............................................................................................................. 282
Appendix 4: Research Participants’ Information Document ............................................................... 283
Appendix 5: Service and Confidentiality/Non-Disclosure Agreement ................................................ 286
Appendix 6: NVIVO Database Design and Compilation ...................................................................... 288
Appendix 7: Analytical Strategy and Coding Framework ................................................................... 295
Appendix 8: Cross-Case NVIVO Analysis Findings ............................................................................ 307
vii
LIST OF FIGURES
Figure 2.1: Literature Review Structure ................................................................................................... 9
Figure 2.2: Dimensions and Stages of e-Government Development ..................................................... 17
Figure 2.3: The PPR Maturity Model .................................................................................................... 19
Figure 2.4: IS Terminology .................................................................................................................... 23
Figure 2.5: The ITEBC Model ............................................................................................................... 24
Figure 2.6: The MIT90s Framework ...................................................................................................... 27
Figure 2.7: General Model of Technology and Performance ................................................................. 28
Figure 2.8: Strategic Alignment Model (SAM) ..................................................................................... 29
Figure 2.9: Strategic Alignment Maturity Summary ............................................................................. 30
Figure 2.10: The ITPOSMO dimensions of e-government project design-reality gaps ........................ 31
Figure 2.11: Aligning Public Sector IS Success Variables and Characteristics ..................................... 33
Figure 2.12: A Citizen-Centric IT Value Model .................................................................................... 34
Figure 2.13: The Iron Triangle ............................................................................................................... 35
Figure 2.14: The Reengineering Concept .............................................................................................. 37
Figure 2.15: Five Steps in Process Redesign ......................................................................................... 38
Figure 2.16: Process Improvement Vs Process Innovation .................................................................... 38
Figure 2.17: Dynamic Improvement Model ........................................................................................... 39
Figure 2.18: Five levels of IT-induced reconfiguration ......................................................................... 40
Figure 2.19: The Prosci Change Management Maturity Model ............................................................. 43
Figure 2.20: The Value for Money (VFM) Model ................................................................................. 45
Figure 2.21: Gateway Review Stages .................................................................................................... 50
Figure 2.22: The Updated D&M IS Success Model .............................................................................. 53
Figure 2.23: Framework for Public Sector IS evaluation ....................................................................... 55
Figure 2.24: eGEP Measurement Framework Analytical Model ........................................................... 59
Figure 2.25: The CJS IT Value Chain Methodology & Social Value Pyramid ..................................... 61
Figure 2.26: CHAOS Summary for 2010 .............................................................................................. 65
Figure 2.27: Conceptual Framework ...................................................................................................... 76
Figure 3.1: A ‘what, why, and how’ framework for crafting research ................................................... 79
Figure 3.2: Research Designs ................................................................................................................. 82
Figure 3.3: Case Study Design Variants ................................................................................................ 87
Figure 3.4: The Structured-Case Research Method ............................................................................... 93
Figure 3.5: The Customised Structured-Case Method ........................................................................... 96
Figure 3.6: Interview Frame ................................................................................................................. 113
Figure 4.1: Case Study Structure Logic ............................................................................................... 124
Figure 4.2: Directgov ........................................................................................................................... 126
Figure 4.3: Evolution & Drivers of Objectives for e-Government Services ........................................ 129
Figure 4.4: Revenue Online Service (ROS) ......................................................................................... 166
viii
Figure 5.1: ROS’ Ex-ante Strategic Plan ............................................................................................. 213
Figure 5.2: Direct(ionless)gov ............................................................................................................. 219
Figure 5.3: Design Rules for Alpha.gov.uk ......................................................................................... 222
Figure 5.4: Old Development Process ................................................................................................. 222
Figure 5.5: New Development Process ................................................................................................ 223
Figure 5.6: ROS’ Development Approach ........................................................................................... 223
Figure 5.7: Directgov TV Campaign Research Results ....................................................................... 226
Figure 5.8: Income Tax Returns – Form 11s filed through ROS (2002-2011) .................................... 227
Figure 6.1: IT/Digital Business Strategic Alignment ........................................................................... 239
Figure 6.2: Development Process ........................................................................................................ 240
Figure 6.3: A New Strategic Alignment Framework for the Adoption of e-Government
Services .......................................................................................................................................... 244
Figure A6.1: Cases and demographics recorded table ......................................................................... 288
Figure A6.2: Example of folder hierarchy and naming convention to track sources in
nodes/themes .................................................................................................................................. 289
Figure A6.3: Example of integration between participants’ words and their profiles for tracking
purposes (case nodes) .................................................................................................................... 290
Figure A6.4: Example of a Memo from the field ................................................................................. 291
Figure A6.5: Each node was labelled and defined to ensure consistency of coding of units of
meaning .......................................................................................................................................... 292
Figure A6.6: Example of digital data included in the NVivo database ................................................ 293
Figure A6.7: Example of integration of literature and primary sources so as to set each in
dialogue with the other................................................................................................................... 294
Figure A7.1: Example of relationship nodes ........................................................................................ 296
Figure A7.2: Example of coding table for categorisation phase .......................................................... 299
Figure A7.3: Example of table of codes for sub-themes developed under each category ................... 300
Figure A7.4: Example of conceptual map of relationship nodes ......................................................... 304
Figure A7.5: Boolean Logic ................................................................................................................. 305
Figure A7.6: NVivo cross-case analysis using a coding frequency query ........................................... 306
ix
LIST OF TABLES
Table 2.1: BRM Approaches/Models/Frameworks ............................................................................... 47
Table 2.2: ‘Formal’ Public Value Measurement Frameworks ............................................................... 59
Table 2.3: CHAOS Reports Success Factors 1994-2012 ....................................................................... 65
Table 2.4: UK Public Sector IT Failed Projects ..................................................................................... 71
Table 3.1: Validity Procedures Within Qualitative Lens and Paradigm Assumptions .......................... 98
Table 3.2: Case Study Data Sources ...................................................................................................... 99
Table 3.3: Mapped Interview Questions .............................................................................................. 106
Table 3.4: Research Participants – Directgov ...................................................................................... 110
Table 3.5: Research Participants – Expert/Consultants ....................................................................... 110
Table 3.6: Research Participants – Expert/Consultants (Fringe Interviews) ........................................ 111
Table 3.7: Research Participants – ROS .............................................................................................. 112
Table 3.8: Research Participants – GOV.UK ....................................................................................... 113
Table 4.1: Evolution and Drivers of Objectives for e-Government Services ...................................... 128
Table 4.2: Objectives Formulation and Success Criteria ..................................................................... 133
Table 4.3: Main Identified Objectives of e-Government Services ....................................................... 139
Table 4.4: Requisite Implementation Processes for e-Government Services ...................................... 142
Table 4.5: Technological Challenges, Barriers and Facilitators .......................................................... 146
Table 4.6: Methods for Evaluation of e-Government Services ............................................................ 149
Table 4.7: Attitudinal Changes ............................................................................................................ 157
Table 4.8: Ameliorating the Digital Divide ......................................................................................... 159
Table 4.9: Vision of the Future ............................................................................................................ 161
Table 4.10: Evolution and Drivers of Objectives for e-Government Services .................................... 167
Table 4.11: Objectives Formulation and Success Criteria ................................................................... 175
Table 4.12: Main Identified Objectives of e-Government Services ..................................................... 181
Table 4.13: Requisite Implementation Processes for e-Government Services .................................... 182
Table 4.14: Technological Challenges, Barriers and Facilitators ........................................................ 185
Table 4.15: Methods for Evaluation of e-Government Services .......................................................... 189
Table 4.16: Ameliorating the Digital Divide ....................................................................................... 194
Table 4.17: Vision of the Future .......................................................................................................... 195
Table 5.1: Cross-Case Analysis Coded Themes .................................................................................. 207
Table A7.1: Example of coding table for open codes .......................................................................... 297
1
CHAPTER 1: INTRODUCTION
1.1 Overview
This chapter presents the research background and, by identifying key gaps in the body of knowledge,
justifies the need for the research. To fill the identified gaps, it introduces the frame of reference, the
aim of the research, and establishes the academic and management rationale for this inquiry. The final
section provides a content and structure overview of the thesis.
1.2 Background
1.2.1 Computerisation of Public Administration
Although the computerisation of organisations began over five decades ago, it is only since the
evolution of information and communication technologies (ICTs) and, later on, their convergence with
Internet technologies, that dramatic change was brought into the way business was conducted. Whilst
early proponents of the Internet tried to predict its likely technological evolution, Angehrn (1997b)
argued that “The Internet may accelerate certain trends whilst revoking others.” Porter (2001, p. 64)
suggested that the Internet is “an enabling technology – a powerful set of tools that can be used wisely
or unwisely, in almost any industry and as part of almost any strategy” and always as a complement to
traditional ways of conducting business.
The advent of the Internet provided greater opportunities to the private, and later the public sectors for
outreach and the gaining of competitive advantage through the enhancement of efficiency and
effectiveness, than did previous generations of ICTs. This enabled both sectors to establish better
strategic positions and compete within their respective domains (Porter, 2001). In contrast to the
private sector nonetheless, the public sector is not in pursuit of profit or subject to competitive
pressure (Elpez & Fink, 2006; Rosacker & Olson, 2008). The public sector’s main objective is to
increase effectiveness and efficiency. Computerisation in government to increase efficiency and
effectiveness is not new however. The automation of counting, sorting and summarising has been in
use in the delivery of government activities since a young engineer called Herman Hollerith won the
US Census Office competition to develop a system which would improve counting and tabulation for
the 1890 census. The previous census had taken nine years to complete. The punched card machine
that Hollerith developed and employed was suitable for large volume data processing and was used
successfully for both the US and Austrian censuses which took place in 1890 (Blodgett & Schultz,
1969; Kistermann, 2005).
1.2.2 The Emergence of e-Government
The Internet brought new dimensions and consequently new terminology to the use of technology by
organisations. Two concepts, those of e-commerce and e-business, entered everyday business language
and have remained prominent. According to Earl (2000, p. 33), “It was in about 1994/95 that the cry
2
‘let’s have a home page’ began to ring out across corporations.” The prospect that utilisation of the
Internet and web technologies could increase their market presence and share sounded very attractive
to organisations, and thus they embarked upon e-commerce and e-business initiatives. Although the
term e-commerce literally refers to “the conduct of commerce or business electronically – essentially
using Internet technologies” (Ward & Peppard, 2002, p. 5), it had emerged before the Internet, notably
in the 1980s, with the use of Electronic Data Interchange (EDI) in the financial sector. Initially
developed for intra-company trading, EDI was consequently used for the exchange of documents and
other forms of data (Swatman, 1993). e-Commerce is a key component of e-business which includes
“not just the buying and selling of goods and services, but also servicing customers, collaborating with
business partners, and conducting electronic transactions within an organisation” (Turban, King, Lee
& Viehland, 2006, p. 4). e-Business has also come to refer to the automation of an organisation’s
internal business processes using web-based technologies and interfaces (Ward & Peppard, 2002).
During the same period, governments began to change with the realisation that the public are entitled
to expect competent service without undue delays. Long delays in obtaining licences, certificates and
other documents occurred partly due to the lack of effective and efficient systems. Another reason was
the increasing population, which in the West had a higher per capita income and thus became more
demanding. Hence, when dot-com mania emerged in the early nineties, public service leaders were
able to perceive applications of this type of technology in the working environment. Despite the
antecedents of the dot-com boom and subsequent crash, there is no ‘Chinese wall’ between the private
and public sectors preventing stakeholders’ expectations in one from informing their attitudes and
behaviour in another (Hahamis, 2011). In the name of efficiency and effectiveness – the most
perceptible and intangible benefits – along with the aim of cost cutting, governments started to realise
the potential of developing an online presence. Consequently, governments soon followed suit and a
new term was born: ‘e-government’. There are many interpretations and definitions of the term offered
by various scholars (Curtain, Sommer & Vis-Sommer, 2004; Lapsley, 2009; West, 2005). The term
e-government however, is often and mainly used to refer to “the application of specific Internet-related
technologies inside and around governments” to reduce corruption, increase transparency, improve
service delivery, support revenue growth and cost reductions (Homburg, 2008, p. 750). “With many
buzzwords such as electronic presence, e-auction, and accompanying stories of success, failure, and
new business models from their counterparts in the commercial world… it is very difficult not to
participate in the e-government movement,” (Layne & Lee, 2001, p. 123). However, the culture within
government agencies is extremely risk-averse, especially with regard to the enforcement of change and
the development of innovative projects (Bannister, 2001b; Rosacker & Olson, 2008). Besides, as
aforementioned, unlike profit-making firms, public organisations do not seek to capture and hold onto
a significant share of the market. Instead, they are competing with respect to cost reduction, for
funding, and for better ways of providing their services, thus delivering value for money.
3
Bannister (2004) argues that one should also not ignore the historical use of ICTs in public
administration, as many aspects of e-government would then be overlooked. As with e-business in the
private sector that goes back to the beginning of the 1950s and the first business computer called LEO,
so does e-government. It goes back to 1960s with the first uses of mainframe computers and later PCs,
in public administration (Bannister, 2004; de Brí & Bannister, 2010; Lips, 2007). The uses of ICTs in
government were primarily looking ‘inwards’ and were administration-focused. The emergence of
e-government, and prior to that of New Public Management (NPM), had turned its uses outward-
looking and service-focused (Connolly & Bannister, 2008; Hood & Lodge, 2004). The latter concept
of NPM, coined as a term by Hood (1991) in the late 1980s, envisaged an ‘entrepreneurial
government’, marketising government, empowering its employees to pursue results, improving quality
and at the same time being customer-focused. Another characteristic was the devolution of
responsibility downward and outward in organisations (Carroll, 1998; Lynn, 2001).
1.2.3 e-Government Initiatives in the UK
In the UK, e-government was an important element in the general modernisation of government
processes. This started in 1999 with the White Papers, Modernizing Government (Cabinet Office,
1999) which put an emphasis on “Information Age Government”, and e-Government: A Strategic
Framework for Public Services in the Information Age (Cabinet Office, 2000), which spelt out the
strategy. The second phase of modernisation, introduced by the Reforming our Public Services:
Principles into Practice Paper (The Prime Minister’s Office of Public Reform, 2002, p. 14), referred
to the “huge opportunity to harness new technologies to raise standards in public services”. Since then,
many other initiatives by the various governments of the day, including the present one, were
introduced. Consequently, the UK government was keen to invest in IT, Internet and web
technologies, spending a considerable amount of money on e-government initiatives. A little more
than ten years later however, the majority of the UK’s e-government major IT projects had failed
repeatedly or stalled (Lapsley, 2009; Stephen et al., 2010; The Standish Group, 1995; Wheeler-
Carmichael, 2000). Only 30 percent of public IT projects appear to be successful, the majority of
which are of a small scale (Brown, 2001; Jenner, 2009b; Lapsley, 2009). An example is the world’s
largest ever IT project, the National Programme for IT (NPfIT), for computerising the National Health
Service (NHS), or NHS IT, which was announced in 2002. It was swamped with cost over-runs and a
four-year delay, and the £12.7 billion programme effectively collapsed in 2011, after missing a string
of deadlines and the realisation that the money spent so far did not represent value for money (Bowers,
2010; National Audit Office, 2011c; PAC, 2007b). The Department of Health’s answer to that was to
localise NHS IT and, whilst retaining a national infrastructure, not to be managed centrally
(Department of Health, 2010).
4
1.2.4 Success and Failure of Public IT Projects
While being dependent upon definitions of success and failure, large IT projects are prone to cost
escalations and/or major delays (Fortune & Peters, 2005; Manwani, 2008). It is generally agreed, as
Manwani (2008, p. 5) points out, that this is partly due to the complexity of the many different IT
components in such projects, but “Much of the difficulty in large projects relates to deciding what
business change is needed and dealing with people issues such as engagement and training.” M.
Thomas (2008, p. 32) shares this view as he reiterates the IT sector panel (ITSP) of the Institution of
Engineering and Technology’s (IET) recommendation that “Every IT project is really a business
change project that happens to need IT.” On the issue of the complexity of large projects, he claims
that: “Every engineer knows that trying to build the first or the biggest of anything is a risk, and that
reliable large systems have usually evolved from reliable small systems.” (p. 32) There is also
optimism bias and strategic misrepresentation as there is a tendency to exaggerate the benefits to
justify investment for such projects, “to an extent that verges on benefits fraud” (Jenner, 2009b, p. 2).
This claim is premised on the fact that business case writers and project sponsors overestimate the
benefits deliberately in the hope of getting the funding required despite knowing in advance that some,
if not all, benefits claimed will not be realised (Jenner, 2009b). Other factors that contribute to the
failure of public IT projects are software development, project management and procurement
problems (Bowers, 2010; Lapsley, 2009; National Audit Office, 2006b, 2008).
Even though there is a consensus in the literature that e-government is not only about managing
technological projects, in reality this is rarely the case. Lips (2007) suggests that e-government is
about aligning government with the emerging information society by sharing information across
agencies to arrive at more citizen-centric policy solutions. Nonetheless, “Although strategy documents
are overtly citizen-centric, by and large, e-government projects have been planned with minimal user
consultation.” (Kolsaker & Lee-Kelley, 2008, p. 725) Cross (2007) concurs by asserting that while
e-government investments were aiming at modernising and transforming government by providing
joined-up services online, as critics point out, this has taken place without citizen consultation or
Parliamentary debate. Furthermore, research has shown that those who are likely to make the most use
of government services are often the least equipped and skilled to undertake transactions online; this
led to the government’s ‘digital inclusion’ initiatives (Cross, 2010).
1.3 Frame of Reference
The problems outlined above lead to the issue of IT alignment with strategic objectives that does not
materialise, partly due to over-reliance on the technological aspects of e-government projects. Most IT
projects focus on the IT aspects of change, and not on what business change and improvement actually
needs to be achieved in the organisation. Furthermore, they fail to consult with and involve the various
stakeholders and intended users. The latter highlights how these investments, though intended to be
citizen-centric, often fail to be so. Other issues that arise are the conceptualisation of success by
5
matching objectives and outcomes, and the size of e-government projects. Larger and complex
projects are more likely to fail for various reasons such as over-ambition in the planning process and
over-stating the benefits of the intended system. Lack of understanding by the commissioning bodies
as to the intricacies of IT projects in general, exacerbated by the way the public sector operates, inhibit
success and thus the attainment of best ‘value for money’.
1.4 Aim of the Research
Although e-government in the UK is claimed to be on the whole successful, with many projects
having received a number of accolades and awards (Bennett, 2010; Capgemini, 2008; Jackson, 2009;
Shift Media, 2009), the reality is that e-government projects often fail. Hence, the aim of this research
is to identify the factors that affect the success of e-government projects and conceptualise the process
of achieving strategic alignment of the adoption of e-government services . Initially, the extant
literature on IT projects failure will be explored, to identify known issues that affect the life-cycle of
the said projects by developing a conceptual model. This model, in conjunction with case studies of
e-government projects will then be used to identify additional issues and factors that could affect their
success. The resulting conceptual framework or model will convey a greater understanding on how to
improve the strategic alignment of the adoption of e-government services , which in its turn can
facilitate improvements in the way that government delivers services to citizens in terms of efficiency
and effectiveness while at the same time meeting their expectations. Overall, it is intended that the
outcomes of this research will be of value not only to policy- and decision-makers in government and
e-government practitioners, but also to academics and researchers whilst adding something of value to
the body of theoretical knowledge.
1.5 Rationale
In exploring these issues, it has become evident that, with regard to prescribed frameworks and the
factors contributing to the success or failure of similar projects in the public sector, limited
fundamental new research perspectives were introduced with the emergence of e-government.
Nevertheless, in the last decade or so, there appears to have been an impetus and mass of researchers
breaking new ground in studying the new face of government, which saw a rapid growth in the volume
of research output on the topic (Andersen & Henriksen, 2006; Elpez & Fink, 2006; Heeks & Bailur,
2007).
Whilst the potential benefits of e-government are immense, many scholars and practitioners would
argue that e-government has yet to reach its full potential or promise (Bekkers & Homburg, 2005;
Fudge, 2013). Although IT initiatives in general face multiple and complex challenges, what might
distinguish e-government projects is the consideration of the political dimension in their development
and the way that different stakeholders in a project relate to one another via political processes (Heeks
& Stanforth, 2007; Melin & Axelsson, 2008). Apart from politics, other differences such as legal
frameworks, privacy concerns, intra-departmental turf, and other institutional arrangements are factors
6
that have been identified as important elements to take into consideration in the design and
development of e-government initiatives (Gil-Garcia & Pardo, 2005). A few years later, Gil-Garcia
(2012) extended his ideas by looking at technical, political and organisational benefits, and similarly to
the previous study, he identified the influence of three factors for the successful enactment of
e-government initiatives: different organisational characteristics, institutional arrangements and
environmental conditions, whilst focusing on the relationship between information technologies and
social structures (Bannister, 2015; Fudge, 2013).
As has been discussed above, unlike the private sector, the public sector’s main objective is to increase
effectiveness and efficiency and attain value for money (Codagnone, 2008; Cordella & Bonina, 2012;
HM Treasury, 2004; National Audit Office, 2011b). Nonetheless, Gil-Garcia (2012, p. xiii) argues
that e-government initiatives are “not only about efficiency and cost-saving; they are now also
designed to realise other important benefits for the public sector such as transparency, openness,
policy effectiveness, service quality, and citizen participation”. In his seminal contribution, Creating
Public Value: Strategic Management in Government, Moore (1995) introduced the notion of public
value, advocating that public value would necessarily extend beyond narrow monetary outcomes to
include which benefits are valued by the citizens themselves more generally. Hence, in the case of
ICT-enabled public sector reforms, this calls for a better understanding of the role that ICT can play in
the production of public value – and not only as a means to achieve better financial outcomes
(Bannister & Connolly, 2011; Cordella & Bonina, 2012).
1.6 Thesis Structure
The purpose of this introductory chapter is to set the scene for the thesis, by giving a brief introduction
to the research, outline the research problem, the aims of the research and its rationale, and to identify
to whom it is important and why. Chapter 2 details the scope and explores the relevant literature,
identifying strengths and weaknesses and gaps pertaining to the research in the area. A conceptual
framework that depicts the issues that emerge, the research question and subsidiary questions that
would guide the study, are also presented. In Chapter 3, a number of methodological considerations
are discussed. The researcher’s philosophical stance, along with the research design choice and
rationale are presented. The rationale of the case selection along with the instrumentation adopted for
the data collection process is discussed. The data analysis process is also detailed in this chapter, along
with the tools used to support the analysis. Chapter 4 details the two cases used in this research. A
brief introduction to the cases is given, together with the individual case analysis, using the data
gathered under the key themes and sub-themes that emerged, following an analytical strategy and
coding framework. The process was assisted through the use of NVivo qualitative analysis software.
The cross-case analysis is included in Chapter 5. A description of the process and results of cross-case
analysis carried out encompasses comparing and contrasting similarities and differences and
identifying the key issues that emerge. Chapter 6 details the discussion, conclusions and implications
of this research. That chapter highlights the research contribution in the form of a proposed revised

7
conceptual framework alongside practitioner guidelines. It also considers the limitations, and areas for
future research.
8
CHAPTER 2: LITERATURE REVIEW
2.1 Overview
2.1.1 Scope of the Review
A number of issues emerged in the introductory chapter, and hence the purpose of this chapter is to
explore the extant body of literature that is relevant to this research, critically examine it, and
synthesise previous research concepts, writings and experiences into a conceptual model. The
conceptual model in its turn will be used to inform and guide the research design. Hence, this chapter
is likewise intended to familiarise the reader with the dominant themes of the research question and its
conjectures which contributed into the design of this research, and guide the interpretation of the
results. Its objective also is, as Toncich (2006, p. 138) puts it, to “demonstrate a firm grasp of existing
knowledge and its implications and then, having evaluated the current boundaries, seek to use, extend
or enhance that knowledge”. This is by no means an exhaustive review of the literature. The
interdisciplinary nature of the thesis and the inclusion of a large number of concepts, models,
frameworks and methodologies have resulted in some of those not being reviewed extensively. A
literature review of this kind can only deal with a modest fraction of this material and an element of
selectivity of the most important contributions in the field was applied.
2.1.2 Literature Review Structure
The themes contained in this literature review have been selected from a range of disciplines because
of their relevance to different aspects of this thesis. In what follows, an attempt was made to
summarise the most important themes, ideas, concepts, thinking and writings as reflected particularly
in the more recently published and most widely referenced academic peer-reviewed research. Previous
research drawn from other sources relevant to this area, was also reviewed; government publications
and archives, professional bodies’ publications, and independently commissioned research work
carried out by private consultancies, as well as commercial research conducted by the latter.
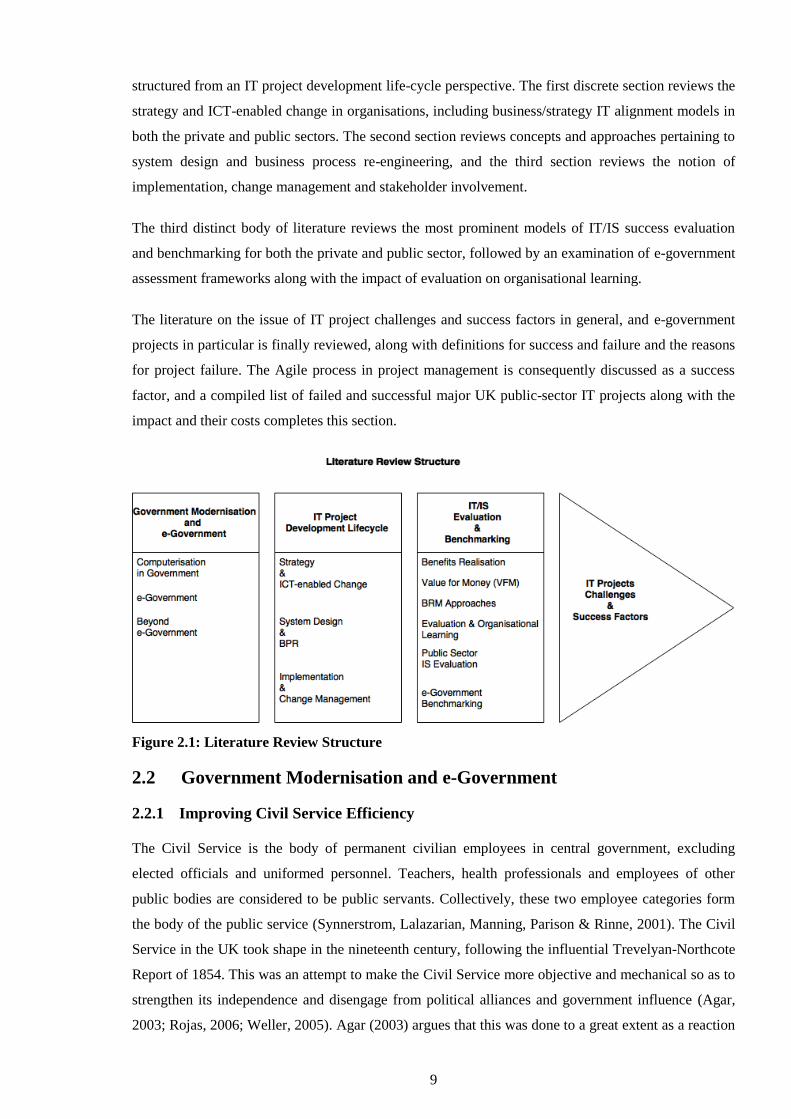
In order to provide a useful structure and logical flow, the literature was divided into four broad
categories (see Figure 2.1 below). Learning from past history and experiences in the role
computerisation played in government modernisation, the emergence of e-government and the stages
of its growth and maturity to date, and the most recent technological developments since, is the first
major body of literature explored.
Information systems (IS) development, whether in the private or public sector, is commonly faced
with the same complexity and risk factors. Heeks (2006) Figure claims that success in e-government
comes from ‘hybrid thinking’ and from action on design/reality gaps rather than from slavish
adherence to a particular methodology” (p. 157). Since e-government projects are regarded as a special
case of IS development (Heeks, 2006; Melin & Axelsson, 2008), the second body of literature is
9
structured from an IT project development life-cycle perspective. The first discrete section reviews the
strategy and ICT-enabled change in organisations, including business/strategy IT alignment models in
both the private and public sectors. The second section reviews concepts and approaches pertaining to
system design and business process re-engineering, and the third section reviews the notion of
implementation, change management and stakeholder involvement.
The third distinct body of literature reviews the most prominent models of IT/IS success evaluation
and benchmarking for both the private and public sector, followed by an examination of e-government
assessment frameworks along with the impact of evaluation on organisational learning.
The literature on the issue of IT project challenges and success factors in general, and e-government
projects in particular is finally reviewed, along with definitions for success and failure and the reasons
for project failure. The Agile process in project management is consequently discussed as a success
factor, and a compiled list of failed and successful major UK public-sector IT projects along with the
impact and their costs completes this section.
Figure 2.1: Literature Review Structure
2.2 Government Modernisation and e-Government
2.2.1 Improving Civil Service Efficiency
The Civil Service is the body of permanent civilian employees in central government, excluding
elected officials and uniformed personnel. Teachers, health professionals and employees of other
public bodies are considered to be public servants. Collectively, these two employee categories form
the body of the public service (Synnerstrom, Lalazarian, Manning, Parison & Rinne, 2001). The Civil
Service in the UK took shape in the nineteenth century, following the influential Trevelyan-Northcote
Report of 1854. This was an attempt to make the Civil Service more objective and mechanical so as to
strengthen its independence and disengage from political alliances and government influence (Agar,
2003; Rojas, 2006; Weller, 2005). Agar (2003) argues that this was done to a great extent as a reaction
10
against the growing public distrust which had developed against an ineffective Civil Service and
bureaucracy.
In a conscious effort to reform the public sector, to strengthen objectivity and independence, it was
deemed necessary to introduce a machine-like state (Agar, 2003; Bellamy, 2005; Rojas, 2006; Weller,
2005). According to Weller (2005, p. 454), “by using the ideology of an impartial, efficient, machine-
like Civil Service, it was more likely to encourage trust in the state’s objectivity and rationality”.
In addition, leading up to the turn of the twentieth century, an increasing and demanding population
challenged the effectiveness of government as it did not have any up-to-date information on its
citizens, especially as the First World War was approaching (Weller, 2005). As the need for
information processing grew, this era saw the rise of statisticians as professionals on the one hand, and
the introduction of the punched card machine on the other (Bellamy, 2005; Campbell-Kelly & Aspray,
2004; Rojas, 2006; Sharma, 2006; Weller, 2005).
2.2.2 The Evolution of Computerisation in Government
The punched card machine was developed first on the other side of the Atlantic by Herman Hollerith,
to enable the US government to analyse the 1890 census data, and was subsequently introduced to the
UK during the early twentieth century. For nearly fifty years the punched card machine dominated
large-scale information processing, initially in government and consequently in business (IEEE
Spectrum, 2000).
The punched card machine was inspired from the punched card system developed by J. M. Jacquard in
the early eighteenth century to regulate the weaving of patterned fabrics (Marculescu et al., 2003). The
Jacquard Weaving Machine or Jacquard Loom led to the concept of mechanised binary information
processing and served as an inspiration for another important development, Charles Babbage’s
Analytical Engine (Autor, Levy & Murnane, 2003; Marculescu et al., 2003). Charles Babbage, a
British mathematician, created the first mechanical device that could undertake calculations and in the
plans for his Analytical Engine, c. 1837, he originated the fundamental idea of program-controlled
computing (Aspray, 1990; Campbell-Kelly, 2009).
Hollerith went on and founded the Tabulating Machine Company in 1896, which in 1911 became part
of the Computing-Tabulating-Recording Company, and later hired Thomas J. Watson Sr as president
and general manager (Blodgett & Schultz, 1969; Jones, 2003; Kistermann, 2005). Hollerith remained
as a consultant for ten years but he and Watson had conflicting ideas (Blodgett & Schultz, 1969).
Their main differences centred upon Hollerith’s idea that tabulating machines should continue to be
used for statistical purposes whilst Watson steered development towards their use in the accounting
field (Jones, 2003). In 1924 the Computing-Tabulating-Recording Company changed its name to the
International Business Machines Corporation, or IBM, and under Watson’s stewardship the company
grew beyond the dreams of its original founder.
11
Such devices were used by government to collect, store, manipulate and retrieve large quantities of
data. Thus, in the period from the late nineteenth century until the 1950s, government was a
substantial consumer of accounting punched card machines (IEEE Spectrum, 2000; Kistermann,
2005). The early 1950s saw the entry into the industry of IBM – then a major punched card and
tabulating machinery company, but with significant capabilities in electronic computing owed in good
part to government contracts – and the rest of the “Bunch” (Burrows, UNIVAC Rand, NCR, Control
Data, Honeywell) as well as GE and RCA (Malerba, Nelson, Orsenigo & Winter, 1999, p. 7).
Warfare had also made an impact on the development of scientific computing (Campbell-Kelly, 2009;
Sharma, 2006; Weller, 2005). From the population register utilising the punched card machine before
and during the First World War, to the development of various projects during World War II such as
the Enigma machine, the Manhattan project and radar in the Massachusetts Institute of Technology
(MIT) to mention a few. However, mechanical and electromechanical calculators were too slow to
solve cryptanalytic and ballistic table-making problems (Aspray, 1990; Campbell-Kelly, 2009). These
problems were met by the first serious attempts to develop electronic calculating equipment, notably
the ENIAC (Electronic Numerical Integrator And Computer) in the US, which began development in
1943, and the British Colossus at Bletchley Park which was completed the same year (Aspray, 1990).
In the UK, the Manchester Baby and the Cambridge Electronic Delay Storage Automatic Calculator
(EDSAC) came into use in 1948 and 1949 respectively (Clark, 2010). Another interesting
development in the US was the Universal Automatic Computer (UNIVAC) which “should be
considered as the computer that set into motion the business of predicting election results” but which
failed to capitalise on its prediction of the election of Eisenhower as a President in 1951 (Sharma,
2006, p. 85). The Eckert-Mauchly Computer Corporation, which was found by the two designers and
developers of both ENIAC and UNIVAC, was later acquired by the Remington Rand Corporation
(Campbell-Kelly & Aspray, 2004; Sharma, 2006).
It is noteworthy that one of the first modern stored-program computers, the Naval Ordnance Research
Calculator (NORC) built by IBM, was in a government department and went into service in 1954. “In
the 1950s, the largest computers, built for research and government purposes, were unavailable to the
public.” (Gillmor, 2007, p. 75) In the mid-1950s for example, UK universities were granted funding to
acquire commercially produced computers, a milestone decision which facilitated an important
increase in computing resources for scientific and engineering research. Until then, it was only
Cambridge and Manchester Universities who were pioneers in that field with the development and
building of the EDSAC and Baby. At the same time, the National Science Foundation (NSF) in the US
was central to the expansion of university computing (Clark, 2010).
Business industry leaders foresaw the new machines as successors to punched card machines but left it
to the military and scientific research communities to develop them in the era between 1945 and 1950.
Costs outweighed the benefits of modernisation by speeding up processes and reducing errors;
12
however, once costs began to decline, research and development in the industry was again resumed
(Clark, 2010; Cortada, 1996; Edwards, 1998). A notable example is the building, use, and later
manufacturing for sale, of a computer called LEO by Lyons, a family firm of British teashops and
grocers, in the early 1950s. The firm’s core competencies might not have been based upon business
computer development but they were innovative enough to envisage the commercial opportunities
behind it (Ferry, 2003; Powell, 2003). While LEO was not the first computer in the world, it was the
first to become a business computer (Ferry, 2003). In short, this period saw the beginning of work on
the electronic, stored-program computers and their large-scale commercialisation (Aspray, 1990;
Campbell-Kelly, 2009; Campbell-Kelly & Aspray, 2004).
From the 1950s through to the 1980s, government remained a large consumer of this technology. For
example, in the case of the most commercially successful and relatively affordable machine of the
1950s, the IBM 650 or ‘Model-T of computing’, the US government purchased fifty out of some 250
initially projected for sale. Government procurement was crucial and this influenced IBM to initiate
the IBM 650 project and consequently propelled it into industry leadership (Gillmor, 2007; Mowery &
Langlois, 1996). It was alleged by Kraemer & King (2003, p. 7) that by the mid-to-late 1980s, the US
federal government had “over 20,000 mainframes and minicomputers, and even in those early days of
the microcomputer, had over 200,000 installed. Federal agencies alone employed more than 100,000
IT specialists, and spent over fifteen billion dollars annually on computerisation”. Although one can
conclude that the US public administration was an enthusiastic supporter of IT in government, this
statement clearly does not make sense when taking into account the analogy of two computers for
every IT specialist. In the UK, on the other hand, the public sector was at the cutting edge of
information technology during the 1960s and 1970s, but during the late 1970s it ceded that role and
has been behind ever since (Bannister, 2001b).
Although analogue and hybrid digital-analogue computers were being built until the late 1960s, they
were overtaken by digital computers, mainly because of the latter’s processing speed, precision and
programming flexibility (Aspray, 1990; Campbell-Kelly, 2009; Campbell-Kelly & Aspray, 2004).
IBM and its competitors such as Remington Rand dominated the market for some thirty years with the
development of mainframes, in particular the System/360 in 1964 by IBM. Nevertheless, by the 1970s
minicomputers soon followed and non-proprietary operating systems such as Unix provided much
more flexibility (Campbell-Kelly & Aspray, 2004; Sharma, 2006). The minicomputer phenomenon
marked a new era and signalled the beginning of cost reduction. In the US, new firms like the Digital
Equipment Corporation (DEC) were the first to get into the minicomputer market; IBM lagged behind
in getting into the minicomputer market and never achieved the dominance in this area as it did with
the mainframe market (Malerba et al., 1999). However, although “many predicted the demise of
mainframe systems, that did not happen because of the need to support legacy systems and some
newer approaches to mainframe computing that IBM developed” (Sharma, 2006, p. 85). By the late
1970s, “the Unix operating system, developed at Bell Labs, had become the system of choice because
13
it ran on DEC’s inexpensive (relative to other systems) VAX computers” (Hughes & Sheehan, 1999,
p. 36).
The arrival of personal computers (PCs) during the 1980s changed the scene irrevocably. As in the
case of minicomputers, new US firms which prominently designed and manufactured PCs entered the
market, namely Tandy, Commodore PET, Apple and Compaq (Malerba et al., 1999). The reaction of
mainframe manufacturers was again slow, and in 1981 the IBM PC arrived. By itself it made a very
little impact on the market as the idea of PCs became so prevalent and it was cloned widely. Thus,
IBM was never as dominant as it had been in mainframes and its share of the PC market eroded
significantly (Malerba et al., 1999). On the evolution of PCs, Campbell-Kelly (2009, p. 69) claims
that: “No one knows what the computers of fifty years hence will look like. Perhaps their abilities will
surpass even the powers of the minds that created them.” Besides, the emergence of the Internet, ‘the
network of networks’, initially as a defence research project more than forty years ago and of web
technologies more recently, has had long-term impacts that it is still too early to comprehend,
according to Campbell-Kelly & Aspray (2004). The US Defense Advanced Research Projects Agency
(DARPA) initiated a research programme in the late 1960s to investigate techniques and technologies
for interlinking packet networks which later became the ARPA Network or ARPAnet (B. Kearns,
2004). It was the ARPAnet programme that gave birth to the global Internet, as it is known today.
Another important contribution was made by Sir Tim Berners-Lee, who developed the first program
for the original idea of the World Wide Web (WWW) in 1990 and released it in 1991 while he was
working at CERN, the high-energy physics laboratory in Geneva. The invention of the Web and its
technologies, such as the HyperText Markup Language (HTML) document format and a new Internet
protocol, the HyperText Transfer Protocol (HTTP), catapulted the Internet to mass popularity almost
overnight (Hughes & Sheehan, 1999; Moon, 2002).
2.2.3 Bureaucracy and Government
At the time when attempts were being made to reform the Civil Service in the second half of the
nineteenth century, Max Weber described a new type of organisational form. The ‘bureaucratic
organisation’ is described in his seminal work, Theory of Bureaucracy (Weber, 1978). The term
‘bureaucracy’ itself derives from the French word bureau, which means office or desk. It also denotes
a specific form of organisation: usually large, with full-time employees who are hired according to
their skills and training, compensated by a salary and producing outputs which cannot be evaluated in
the market. The main traits of this kind of organisation are that it is hierarchical, impersonal, governed
by rules and maintains a division of labour by employing specialists (Downs, 1967; Jain, 2004). The
most notable feature of bureaucracy is to rationalise systems and functions, especially of the public
service administrations that grew larger following reorganisation. It aims to improve efficiency and
effectiveness and reduce corruption and nepotism. Drucker (1974) defined efficiency as “doing things
right” and effectiveness as “doing the right things” (Ika, 2009; Rämö, 2002). Moreover, the Weberian
bureaucracy theory focused on the separation of the functions of the two sets of actors: namely
14
politicians and public managers (Blaug, Horner & Lekhi, 2006; Lynn, 2001). Hence, a bureaucratic
structure enables the Civil Service to execute policy impartially but it also has advantages for
politicians as it allows for power to be concentrated at the top (Bannister, 2001a).
Although Weber regarded bureaucracy as an efficient organisational form, in more recent times to
label an organisation ‘bureaucratic’ bears negative connotations (Jain, 2004). In addition, this
organisational form generated the paradox that lies in the fact that a professional bureaucracy is not a
democratic organisation (Ferraro, 2009; Vigoda-Gadot, 2009). “Members of the bureaucracy are
neither voted by the people nor appointed by elected public officials. They are designated on the basis
of merit,” and although this should not be a problem, it often is for the public as the process is not
transparent (Ferraro, 2009, p. 506).
It is worth noting that another important author who referred to the dichotomy between public
administration and politics prior to Weber was Woodrow Wilson, the twenty-eighth President of the
United States. Similarly to Weber, in his 1887 essay (Wilson, 1887) Wilson proposed two separate
spheres – the legislature and the administrative states – in order to prevent interference and corruption
(Blaug et al., 2006; Lynn, 2001). Lynn (2001, p. 144) found that “Wilson saw administration as
reform, a solution to the governmental problems of the day.” He had also regarded public
administration as a field of business and paved the way for the ‘organisation’ and ‘management’ [of
the bureaucratic state] concepts to emerge (Denhardt & Denhardt, 2009; Lynn, 2001).
2.2.4 The New Public Service Management
To run the state like a business is the predominant notion of the New Public Management (NPM)
concept, also known as Neo-Managerialism. Its doctrine entails treating the citizens as clients, while
not allowing for civic participation (Ferraro, 2009; Homburg, 2008; Vigoda-Gadot, 2009), as it is
certain that “any serious increase in participation by the public would quickly generate new pressures
on both politicians and public managers” (Blaug et al., 2006, p. 19). While some regard NPM as a new
paradigm for reforming government institutions, other scholars regard it as the ‘new old’ (Dunleavy,
Margetts, Bastow & Tinkler, 2006; Lynn, 2001). It first appeared in the 1980s, although the actual
term New Public Management was coined by Hood (1991) a decade or so later. Consequently, it
dominated the bureaucratic reform agenda in many of the Organisation for Economic Cooperation and
Development (OECD) countries in the 1980s and 1990s (Dunleavy et al., 2006; Homburg, 2008;
Hood, 1991; Hood & Peters, 2004). Since then, it has been widely adopted internationally by
developed economies, and increasingly by developing countries. The UK government’s adoption of
NPM happened in 1980 when the Prime Minister, Margaret Thatcher, set out to transform the mining
and coal industries. Reform of the management of the National Health Service (NHS) in 1983 and
British universities in 1985 followed suit with various industrialists being tasked to generate
recommendations that mimicked big business practices (Lapsley, 2009).
15
2.2.5 The Post-NPM Era
Since 1997 however, the New Labour government in the UK embarked on drawing up non-NPM,
modernising strategies, which have encouraged greater partnership among public service agencies
towards a ‘joined-up’ government (Dunleavy et al., 2006; Martin, 2003; Pollitt & Bouckaert, 2000).
This, Pollitt (2009) argues, falls within the concept of Public Service Network (PSN), which emerged
as a reaction to NPM adopted by many post-bureaucratic organisations. “The central idea is that more
and more policies and programmes are not (and cannot) be run from within single organisations.
Instead, they are evolved and delivered by more than one organisation, linked in networks or
partnerships.” (p. 201)
The NPM has been criticised since its inception. Lapsley (2009, p. 1) termed it a “cruel
disappointment for governments”, whilst Dunleavy et al. (2006) ascertain that parts of this wave have
been stalled amid policy disasters. In addition, Pollitt (2009) alleges that post-bureaucratic
organisations, as compared to traditional bureaucratic ones, lost their organisational memory and
ability to learn from experience. Hence, since NPM lost its amplitude nearly two decades after its
birth, Osborne (2006, 2010) argues that prominence has been given to the “next new thing”: the New
Public Governance (NPG). Unlike NPM, which emphasised markets, NPG emphasises networks and
is possibly transformative. From an intellectual perspective, NPG “corrects the theoretical and
practical shortcomings of its predecessors, encompassing the contemporary complexities and realities
of governing by drawing on organisational sociology and network theory rather on political science or
public-choice economics in order to overcome the fragmentation and uncoordinated character of
twentieth-century managerial practice” (Osborne, 2010, p. 110). NPG focuses very much upon inter-
organisational relationships and the governance of processes, stressing service effectiveness and
outcomes as “it posits both a ‘plural state’, where multiple inter-dependent actors contribute to the
delivery of public services and a ‘pluralist state’, where multiple processes inform the policy making
system” (Osborne, 2006, p. 384).
2.2.6 e-Government
In the post-NPM and NPG era, Dunleavy et al. (2006) argue that information technology (IT)- and
information systems (IS)-based changes are central to the current and future wave of reforms. They
propose “reintegration, needs-based holism and digitisation changes”, instead of the themes on which
the NPM was founded: those of “dissagregation, competition and incentivisation” (Dunleavy et al.,
2006, p. 467). While they place this collection of ideas and reform changes under the wider umbrella
term of Digital Governance (DEG), technological innovations in public administrations go by the
name of e-government (Homburg, 2008; Lapsley, 2009). A definition of e-government is offered by
West (2004, p. 16): “e-Government refers to the delivery of government information and services
online through the Internet or other digital means.” Curtain et al. (2004), however, argue that
e-government is far more than simply making certain information and services for citizens available
16
publicly online; it is a transforming agent for all layers of government, each providing a variety of
different services. Hence, since electronic services, management, democracy and policy intersect, Gil-
Garcia (2012) offers an all-encompassing definition of e-government, which simplifies a complex and
multidimensional concept. He defines e-government as, “the selection, design, implementation and use
of ICTs in government to provide public services, improve managerial effectiveness, and promote
democratic values and participation mechanisms, as well as the development of a legal and regulatory
framework that facilitates information intensive initiatives and fosters the knowledge society” (p. 17).
Bannister (2015) finds the last element of this definition strange, and argues that a much simpler
definition might be that e-government is about “the use of ICT by and in government” (p. 74).
Nonetheless, in earlier work, Bannister (2007, p. 172), elucidates that “There is more to e-government
than the Web, but at the same time, including the Civil Service payroll under the heading
e-government does not make much sense.”
2.2.7 e-Government Maturity and Growth Models
Much has been written about both the benefits and drawbacks brought by this evolution for the
organisations that invested in ICT. With the emergence of the Internet in particular, and its impact on
business and the public sector, various models have been developed in order to facilitate an
understanding of the changes caused to organisations in both the private and public domains by the
adoption of these technologies. Remenyi, Williams, Money, and Swartz (1998, p. 285) define a model
as “a representation of an artefact, a construction, a system or an event or a sequence of events” which
could consist of a picture or drawing, symbols, numbers, words or a combination of these depictions.
McKay, Marshall, and Prananto (2000) argue that in order to improve understanding, these ‘stages of
growth’ models could be useful in the description and evaluation of an organisation’s maturity and
level of sophistication in its utilisation and management of ICT resources.
Theories of growth, which describe the maturing of the implementation and use of information
systems in organisations, first emerged in the mid-1970s, well before the evolution of the Internet (C.
Chan & Swatman, 2004; Ghachem, 2006; McKay et al., 2000; Prananto, McKay & Marshall, 2001;
Ward & Peppard, 2002). Computerisation prompted scholars such as Nolan (1973) to study the
evolution of computing within organisations. He developed a four-stage model to “determine the
degree of computing maturity of a company by taking into account the evolution of information
technologies as an organisational learning process”. He is also the first to have presented a “theoretical
description of the phases dealing with the planning, the organisation and the control of activities in
association with the management of computer resources in the organisation” (Ghachem, 2006, p. 1).
With regard to the impact of IT on the public sector, it is widely understood that it is under-researched
in comparison to its impact on the private sector (Bannister, 2001b; Heeks & Bailur, 2007). It was
only after the advancement of the Internet, when the concept of e-government had emerged, that
practitioners and scholars started studying “the new face of government” (Andersen & Henriksen,
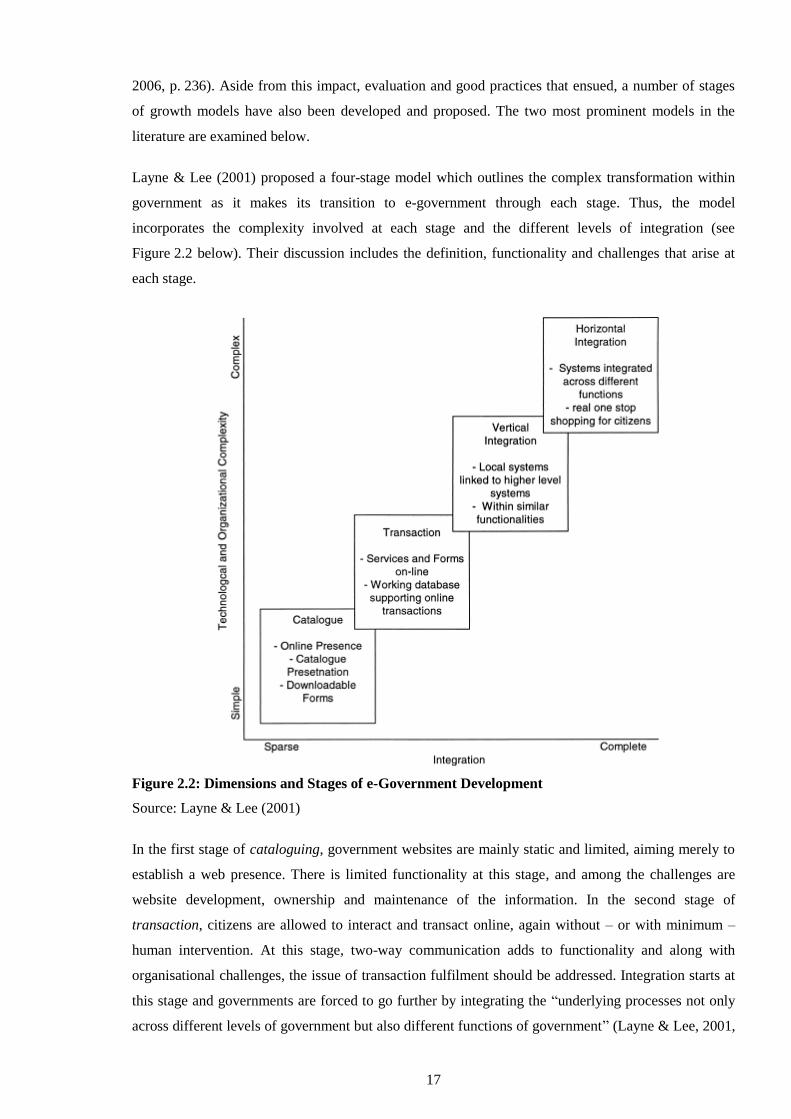
17
2006, p. 236). Aside from this impact, evaluation and good practices that ensued, a number of stages
of growth models have also been developed and proposed. The two most prominent models in the
literature are examined below.
Layne & Lee (2001) proposed a four-stage model which outlines the complex transformation within
government as it makes its transition to e-government through each stage. Thus, the model
incorporates the complexity involved at each stage and the different levels of integration (see
Figure 2.2 below). Their discussion includes the definition, functionality and challenges that arise at
each stage.
Figure 2.2: Dimensions and Stages of e-Government Development
Source: Layne & Lee (2001)
In the first stage of cataloguing, government websites are mainly static and limited, aiming merely to
establish a web presence. There is limited functionality at this stage, and among the challenges are
website development, ownership and maintenance of the information. In the second stage of
transaction, citizens are allowed to interact and transact online, again without – or with minimum –
human intervention. At this stage, two-way communication adds to functionality and along with
organisational challenges, the issue of transaction fulfilment should be addressed. Integration starts at
this stage and governments are forced to go further by integrating the “underlying processes not only
across different levels of government but also different functions of government” (Layne & Lee, 2001,
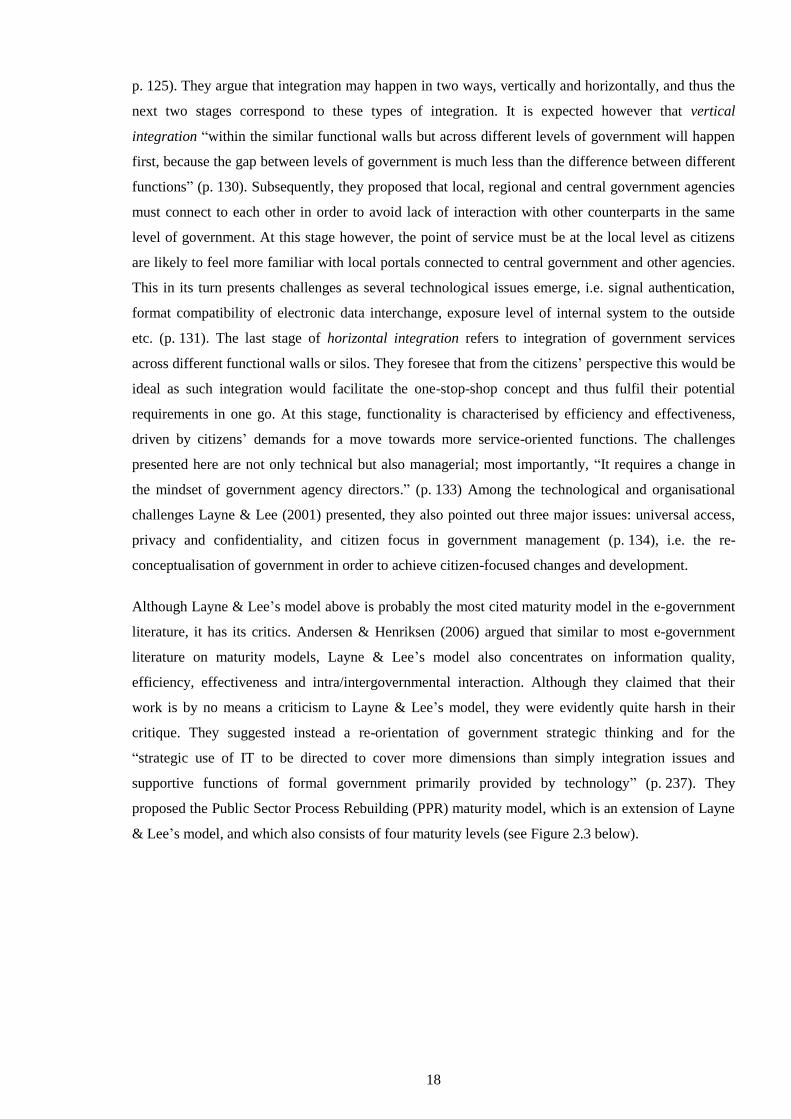
18
p. 125). They argue that integration may happen in two ways, vertically and horizontally, and thus the
next two stages correspond to these types of integration. It is expected however that vertical
integration “within the similar functional walls but across different levels of government will happen
first, because the gap between levels of government is much less than the difference between different
functions” (p. 130). Subsequently, they proposed that local, regional and central government agencies
must connect to each other in order to avoid lack of interaction with other counterparts in the same
level of government. At this stage however, the point of service must be at the local level as citizens
are likely to feel more familiar with local portals connected to central government and other agencies.
This in its turn presents challenges as several technological issues emerge, i.e. signal authentication,
format compatibility of electronic data interchange, exposure level of internal system to the outside
etc. (p. 131). The last stage of horizontal integration refers to integration of government services
across different functional walls or silos. They foresee that from the citizens’ perspective this would be
ideal as such integration would facilitate the one-stop-shop concept and thus fulfil their potential
requirements in one go. At this stage, functionality is characterised by efficiency and effectiveness,
driven by citizens’ demands for a move towards more service-oriented functions. The challenges
presented here are not only technical but also managerial; most importantly, “It requires a change in
the mindset of government agency directors.” (p. 133) Among the technological and organisational
challenges Layne & Lee (2001) presented, they also pointed out three major issues: universal access,
privacy and confidentiality, and citizen focus in government management (p. 134), i.e. the re-
conceptualisation of government in order to achieve citizen-focused changes and development.
Although Layne & Lee’s model above is probably the most cited maturity model in the e-government
literature, it has its critics. Andersen & Henriksen (2006) argued that similar to most e-government
literature on maturity models, Layne & Lee’s model also concentrates on information quality,
efficiency, effectiveness and intra/intergovernmental interaction. Although they claimed that their
work is by no means a criticism to Layne & Lee’s model, they were evidently quite harsh in their
critique. They suggested instead a re-orientation of government strategic thinking and for the
“strategic use of IT to be directed to cover more dimensions than simply integration issues and
supportive functions of formal government primarily provided by technology” (p. 237). They
proposed the Public Sector Process Rebuilding (PPR) maturity model, which is an extension of Layne
& Lee’s model, and which also consists of four maturity levels (see Figure 2.3 below).
19
Figure 2.3: The PPR Maturity Model
Source: Andersen & Henriksen (2006)
Andersen & Henriksen (2006) regard the four stages of their model not as distinct, but rather as
discrete points in the continuous development process in the organisation, acting as indicators in
positioning it in the e-government arena. Rather than focusing on the front-end, they emphasise the
“digitalisation of the core activities not from the perspective of what is technologically feasible but
from what is beneficial for the end-users regardless of the possible internal changes caused by the
digitalisation” (p. 246). The general idea is to give end users, and particularly citizens, data ownership
and control but it is not clear from their discussion how this could be achieved. In addition, some of
the points they suggested seem utopic; perhaps in an ideal world full integration of processes and
technology would make citizens’ lives easier, but it seems there is a long way to go in order to achieve
this seamless access and utilisation of information to the end users’ benefit.
The combination of relationships and stages in e-government are more complex than in e-commerce in
general. For example, when government services are aggregated and can all be accessed through a
single portal, extra measures to ensure privacy and security for its citizens should be implemented
(Hiller & Belanger, 2001). The e-government models examined here incorporate similar stages of
growth. Layne & Lee (2001) suggested both vertical and horizontal integration in addition to portals,
bringing to the fore back-office and front-end processes, and the issue of bringing down the silos.
Andersen & Henriksen (2006) argued that strategic use of IT should cover more dimensions than
integration issues, and hence e-government growth models should capture the future use of IT
applications with the external users. Furthermore intranets are discussed and the concept of the one-
stop-shop, or one-stop-government, emerges as crucial to providing services to the citizen (Andersen
20
& Henriksen, 2006; Layne & Lee, 2001). They also both attempt to map at each stage the challenges,
both technological and organisational, that the transition from government to e-government presents.
It is worth noting that a recent review of fifty-one IS maturity models that were published between
1973 and 2013, including e-government stages of growth models by de Bri & Bannister (2015) found
that the latter failed adequately to take into account factors such as politics and technology and the
tendency of such models to be normative. The authors also noted that many of these e-government
maturity models are “hybrids between behavioural science and design science models, i.e. many of the
models’ initial stages have been observed empirically, but the later stages are aspirational” (p. 4). They
concluded that e-government stages of growth models need to be based on a broader conceptualisation
of what e-government is, take into account the mechanism of change, and be grounded in good
practical theory, beyond the mix of description and speculation thus far, in order to make an impact.
In the Internet era, maturity models were influenced by the Capability Maturity Model (CMM)
developed by the Carnegie Mellon’s Software Engineering Institute in a project sponsored by the US
Department of Defense (CMMI Product Team, 2002). The CMM is a framework which “describes a
path for process improvement in the software development industry and as such is more accurately
described as a computer science than an IS model”. The path has five levels where an organization has
goals to meet at one level before it can progress to the next level. The stages are named Initial,
Repeatable, Defined, Controlled and Optimised (de Bri & Bannister, 2015, p. 3). The Capability
Maturity Model Integrated (CMMI), released in 2002, is an extension of the original model and
focuses on process improvement and not just ICT or IS. More than a decade later, an initiative led by
IBM and the Innovation Value Institute (IVI) in the Republic of Ireland, resulted in the IT Capability
Maturity Framework (IT-CMF) (Harris, 2012). The IT-CMF provides a toolset that “contains maturity
profiles, assessment methods and organizational improvement roadmaps, which collectively target
improved delivery of value and innovation” (Inovation Value Institute, 2012, p. 1). de Bri & Bannister
(2015) argue that the implicit assumption of both CMMI and IT-CMF is that management intervention
is the primary change mechanism for organisational growth. Similar to CMMI, the IT-CMF has a five-
level maturity ladder, but unlike the CMMI is not grounded in software development; instead, it refers
to IT management (Donnellan & Helfert, 2010) and is gaining a fair amount of traction in the market.
With regard to impact mentioned above, when governments look to models for guidance, it is not to
the e-government models that they turn, but benchmark stage models and (in Ireland’s case) the
IT-CMF, such as the Revenue in Ireland, through post-development of ROS – Revenue Online Service
(de Bri & Bannister, 2015).
2.2.8 Beyond e-Government
Whilst Internet technologies allowed some kind of two-way interaction, most e-government services
and systems never achieved the ‘horizontal integration’ as prescribed by Layne & Lee (2001) and
others (Andersen & Henriksen, 2006; Grant & Chau, 2006). This type of e-government is called by
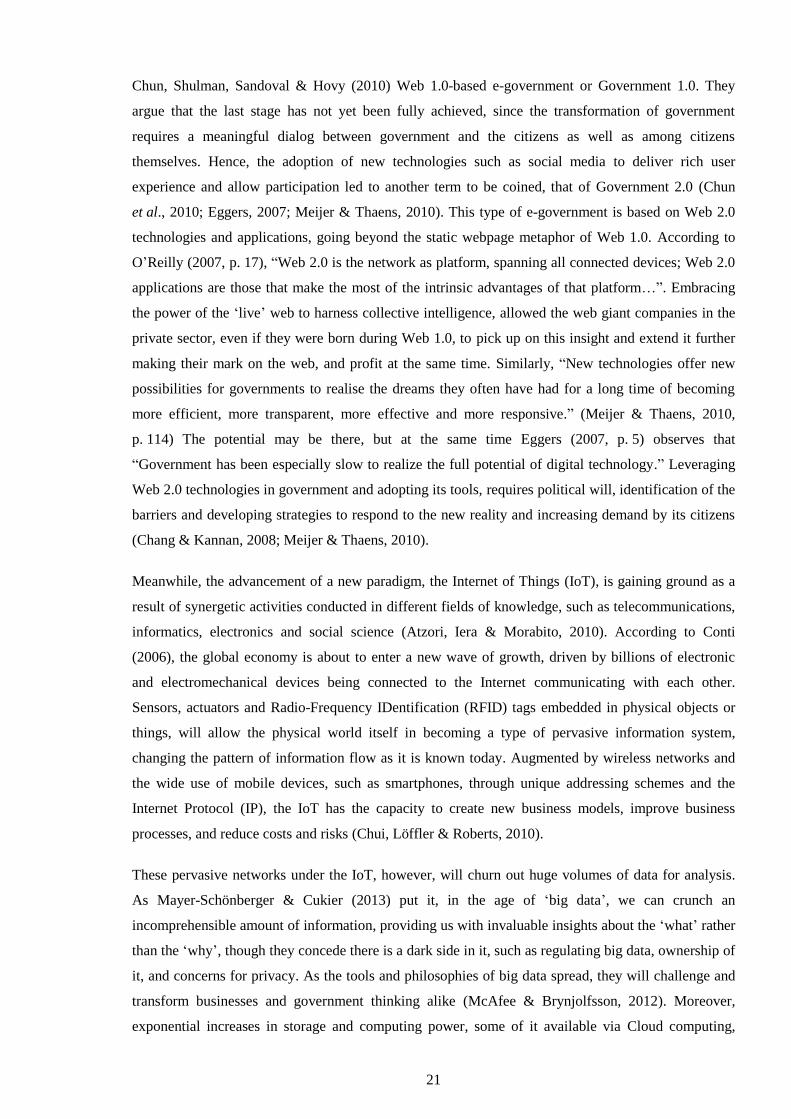
21
Chun, Shulman, Sandoval & Hovy (2010) Web 1.0-based e-government or Government 1.0. They
argue that the last stage has not yet been fully achieved, since the transformation of government
requires a meaningful dialog between government and the citizens as well as among citizens
themselves. Hence, the adoption of new technologies such as social media to deliver rich user
experience and allow participation led to another term to be coined, that of Government 2.0 (Chun
et al., 2010; Eggers, 2007; Meijer & Thaens, 2010). This type of e-government is based on Web 2.0
technologies and applications, going beyond the static webpage metaphor of Web 1.0. According to
O’Reilly (2007, p. 17), “Web 2.0 is the network as platform, spanning all connected devices; Web 2.0
applications are those that make the most of the intrinsic advantages of that platform…”. Embracing
the power of the ‘live’ web to harness collective intelligence, allowed the web giant companies in the
private sector, even if they were born during Web 1.0, to pick up on this insight and extend it further
making their mark on the web, and profit at the same time. Similarly, “New technologies offer new
possibilities for governments to realise the dreams they often have had for a long time of becoming
more efficient, more transparent, more effective and more responsive.” (Meijer & Thaens, 2010,
p. 114) The potential may be there, but at the same time Eggers (2007, p. 5) observes that
“Government has been especially slow to realize the full potential of digital technology.” Leveraging
Web 2.0 technologies in government and adopting its tools, requires political will, identification of the
barriers and developing strategies to respond to the new reality and increasing demand by its citizens
(Chang & Kannan, 2008; Meijer & Thaens, 2010).
Meanwhile, the advancement of a new paradigm, the Internet of Things (IoT), is gaining ground as a
result of synergetic activities conducted in different fields of knowledge, such as telecommunications,
informatics, electronics and social science (Atzori, Iera & Morabito, 2010). According to Conti
(2006), the global economy is about to enter a new wave of growth, driven by billions of electronic
and electromechanical devices being connected to the Internet communicating with each other.
Sensors, actuators and Radio-Frequency IDentification (RFID) tags embedded in physical objects or
things, will allow the physical world itself in becoming a type of pervasive information system,
changing the pattern of information flow as it is known today. Augmented by wireless networks and
the wide use of mobile devices, such as smartphones, through unique addressing schemes and the
Internet Protocol (IP), the IoT has the capacity to create new business models, improve business
processes, and reduce costs and risks (Chui, Löffler & Roberts, 2010).
These pervasive networks under the IoT, however, will churn out huge volumes of data for analysis.
As Mayer-Schönberger & Cukier (2013) put it, in the age of ‘big data’, we can crunch an
incomprehensible amount of information, providing us with invaluable insights about the ‘what’ rather
than the ‘why’, though they concede there is a dark side in it, such as regulating big data, ownership of
it, and concerns for privacy. As the tools and philosophies of big data spread, they will challenge and
transform businesses and government thinking alike (McAfee & Brynjolfsson, 2012). Moreover,
exponential increases in storage and computing power, some of it available via Cloud computing,
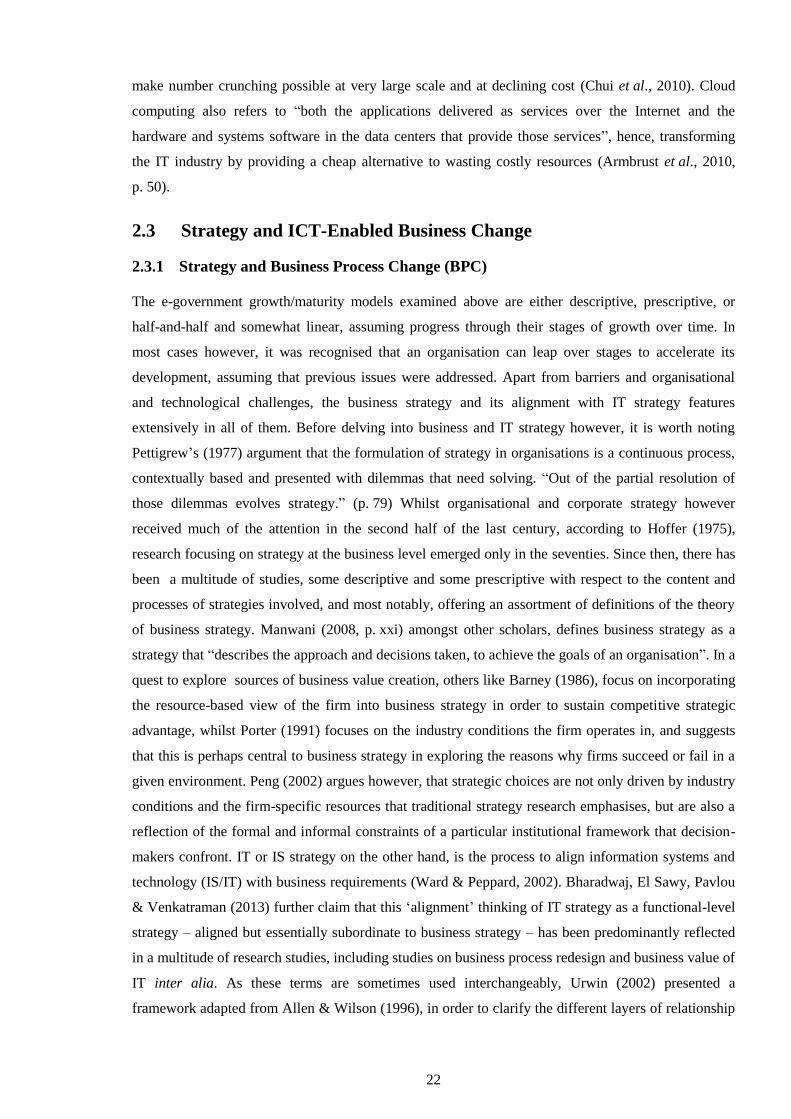
22
make number crunching possible at very large scale and at declining cost (Chui et al., 2010). Cloud
computing also refers to “both the applications delivered as services over the Internet and the
hardware and systems software in the data centers that provide those services”, hence, transforming
the IT industry by providing a cheap alternative to wasting costly resources (Armbrust et al., 2010,
p. 50).
2.3 Strategy and ICT-Enabled Business Change
2.3.1 Strategy and Business Process Change (BPC)
The e-government growth/maturity models examined above are either descriptive, prescriptive, or
half-and-half and somewhat linear, assuming progress through their stages of growth over time. In
most cases however, it was recognised that an organisation can leap over stages to accelerate its
development, assuming that previous issues were addressed. Apart from barriers and organisational
and technological challenges, the business strategy and its alignment with IT strategy features
extensively in all of them. Before delving into business and IT strategy however, it is worth noting
Pettigrew’s (1977) argument that the formulation of strategy in organisations is a continuous process,
contextually based and presented with dilemmas that need solving. “Out of the partial resolution of
those dilemmas evolves strategy.” (p. 79) Whilst organisational and corporate strategy however
received much of the attention in the second half of the last century, according to Hoffer (1975),
research focusing on strategy at the business level emerged only in the seventies. Since then, there has
been a multitude of studies, some descriptive and some prescriptive with respect to the content and
processes of strategies involved, and most notably, offering an assortment of definitions of the theory
of business strategy. Manwani (2008, p. xxi) amongst other scholars, defines business strategy as a
strategy that “describes the approach and decisions taken, to achieve the goals of an organisation”. In a
quest to explore sources of business value creation, others like Barney (1986), focus on incorporating
the resource-based view of the firm into business strategy in order to sustain competitive strategic
advantage, whilst Porter (1991) focuses on the industry conditions the firm operates in, and suggests
that this is perhaps central to business strategy in exploring the reasons why firms succeed or fail in a
given environment. Peng (2002) argues however, that strategic choices are not only driven by industry
conditions and the firm-specific resources that traditional strategy research emphasises, but are also a
reflection of the formal and informal constraints of a particular institutional framework that decision-
makers confront. IT or IS strategy on the other hand, is the process to align information systems and
technology (IS/IT) with business requirements (Ward & Peppard, 2002). Bharadwaj, El Sawy, Pavlou
& Venkatraman (2013) further claim that this ‘alignment’ thinking of IT strategy as a functional-level
strategy – aligned but essentially subordinate to business strategy – has been predominantly reflected
in a multitude of research studies, including studies on business process redesign and business value of
IT inter alia. As these terms are sometimes used interchangeably, Urwin (2002) presented a
framework adapted from Allen & Wilson (1996), in order to clarify the different layers of relationship
23
between the components of IS strategy, their interrelation with business strategy and the wider
environment (see Figure 2.4 below):
Figure 2.4: IS Terminology
Source: Urwin (2002)
Moreover, integration, transition and transformation are fundamental for both business and
government, in order to adapt and adopt ICTs and the latest Web technologies to their advancement.
An important issue that transpires after examining all these e-government growth/maturity models, is
that IT investment requires business process re-engineering and redesign, conducive to achieving
efficiency and effectiveness. The stage in each model where this is required varies. The first stage
(cataloguing), for example in the Layne & Lee (2001) model (see Figure 2.2), does not yet require any
business process change, but it becomes imperative in the subsequent stages. Such business process
change (BPC), Scholl (2003) argues, is induced and enabled by ICTs.
It has already been well established in the literature that IT is an enabler and there are few IT projects
today that do not cause business change (Venkatraman, 1994; Ward & Elvin, 1999). In their turn, IT-
focused change interventions are related to IT investments, benefits realisation and benefits
management (Gardner & Ash, 2003; Ward & Elvin, 1999). Nonetheless, with the hyperbole of
business process re-engineering (BPR), BPC and Enterprise Resource Systems (ERPs) in the 1990s,
many such costly change interventions had failed (Gardner & Ash, 2003). Prior to that, Zuboff (1988)
coined the concept ‘informating’ the organisation, in that there are revolutionary changes in job roles
and processes in organisations that take full advantage of IT implementation. There are benefits
associated with employees having access to all information in the organisation, empowering them to
informed and timely decision-making, which results in better performance (Benjamin & Levinson,
1993; Remenyi & Sherwood-Smith, 1998). The fact, however, that individuals would or might
24
perform tasks previously carried out by their supervisors, led to managerial resistance to change
efforts (Benjamin & Levinson, 1993).
2.3.2 The ITEBC Model
According to Manwani (2008), the term ‘IT-enabled business change’ connotes the mix of two
different components – those of IT (Project) and Business Change, reflecting a hybrid type of change.
Contrary to Venkatraman (1994) and Ward & Elvin (1999) who use the term ‘IT projects’ as discussed
above, Manwani (2008) argues that many IT-enabled business change initiatives are incorrectly
labelled as IT projects, on the premise that “these days much of the change in organisations is enabled
by IT” (p. 3). Hence, Manwani (2008) claims that most IT projects should be viewed as IT-enabled
business change projects as this changes the way they are approached and increases the benefit they
bring to the organisation.
Besides, IT-enabled business change has a life-cycle, and the first stage should be that of strategic
alignment, which should define and bring together the business and IT objectives of the organisation
(Manwani, 2008). Hence, Manwani (2008) proposed an IT-enabled business change (ITEBC) life-
cycle model (see Figure 2.5 below) that depicts all the stages of such change in organisations.
Figure 2.5: The ITEBC Model
Source: As adapted from Manwani (2008)
Manwani (2008) suggests that once you align business and IT goals (first stage), the subsequent stage
of the ITEBC model is to define the business improvement and support the need for change by
developing a business case (p. 14). The third stage should deliver the design of elements required for
the business change and these could include revised business processes, IT software and so on. The
concept of ‘fit’ between technology and other dimensions is also being introduced at that stage (p. 14).
The implementation of business change stage is next, with an emphasis on the stakeholders and how
are they affected. Other factors that should be taken into account at that stage, are managing risk and
the avoidance of disruption and data redundancy as appropriate (p. 14). The ensuing and final stage of
a business change life-cycle is “when the benefits from the change have been delivered or assured”
(p. 13). This stage requires recognition that it is the business managers who should deliver these
benefits, but at the same time “a different perspective on the planning and running of projects
involving IT investment” needs to be adopted (p. 14). Moreover, at this stage, best practice demands
25
that an ex-post review of the implementation of any IT system is carried out. Manwani (2010) claims
that these stages are often iterative (hence the double arrows in the model), as learning from one stage
uncovers the need to revise the outputs of a prior stage since organisations need to adapt their planning
and align their decisions with a project’s emergent design uncertainty. Manwani & Beaven (2009)
note that although for simplicity the iteration is shown between each stage in the model, in practice, an
issue identified in for example the design stage, may require a review of the alignment results. The
business change life-cycle has structural commonality with other life-cycles, yet there are three
significant differences with its closest method, which is systems development: “Firstly, the start of the
life-cycle is an earlier and less certain phase of strategic alignment than the start of systems
development. Secondly, the end stage relates to delivery of the benefits rather than delivery of the
system. The third major difference is that the IT enabled life-cycle focuses on process, people,
information and technology rather than solely on systems” (Manwani & Beaven, 2009, p. 7).
2.3.3 IT-enabled Business Change in Government
The emergence of e-government had an impact and implications on the way government works, and
the business processes and workflows in the public sector. Scholl (2003, p. 1) argues that “Electronic
government must be seen as a special case of ICT-enabled business process change”. Furthermore, the
use of modern ICTs within public management, and especially the Internet, prompted scholars to
discuss the concept of ‘re-inventing government’ (Osborne & Gaebler, 1992) or how to achieve ‘ICT-
supported reforms in public administration and management’ (Bekkers, 2003; Heeks & Bhatnagar,
2001).
It was recognised that the successful delivery of IT-enabled projects is essential to the effective
functioning of government and has a direct effect on departments’ capabilities to deliver improved
public services (House of Commons, 2007; National Audit Office, 2004, 2006a, 2006b). Experience in
the public sector in Britain, however, showed that “achieving such change is particularly complex and
challenging in terms of the scale of the changes required, the cross-government co-ordination needed,
and the technical issues around joining new and old systems” (National Audit Office, 2006b, p. 10).
In November 2005, the Transformational Government: Enabled by Technology report set out the UK
government’s strategy for delivering IT-enabled public services in the twenty-first century (Cabinet
Office, 2005). “Alongside a clear drive for greater efficiency in the way services are provided, the
strategy called for public services to be designed and co-ordinated more around the needs of the
citizen or customer, not the provider” (National Audit Office, 2006b, p. 24). Other prerequisites were
the need to re-design business processes, work across departments and converge the new technology
with legacy systems. In 2006/7, a House of Commons Committee of Public Accounts, found that
“where IT-enabled programmes and projects have succeeded, the organisations concerned were clear
about the business process they wanted to change and the outcome they wanted to achieve” (House of
Commons, 2007, p. 6).
26
2.3.4 Business/Strategy IT Alignment Models
With regard the strategy/IT alignment literature, an important scholar is Scott Morton (1991) who was
the programme director for the Management in the 1990s School-wide Research Programme at the
MIT Sloan School of Management. The Programme was charged with the task of investigating the
impact of the new information technologies on organisations at the time and beyond. The fundamental
premise was that the business logic of the 1970s and 1980s had changed and may be inadequate for the
future as the emerging business environment called for strategy-based deployment of new systems and
applications. In addition, the role of IT within organisations had evolved from its principal focus on
efficiency enhancements to that of a fundamental enabler in creating and maintaining a flexible and
extended business space (Venkatraman, 1991, 1994). Thus, the new challenge for business strategists
was how best to re-conceptualise the role of IT, identify applications relevant to their operations and
transform the business not only to fully utilise IT capabilities, but also to differentiate. According to
Venkatraman (1991, p. 126), “It is no longer a question of whether IT has a strategic role but how to
exploit IT in strategic management or, more precisely, how to develop strategy/IT alignment.”
The overall framework of alignment was well presented by the MIT90s framework (see Figure 2.6
below), which emerged as a result of the MIT’s Management in the 1990s (MIT90s) research
programme. It reflects the theory that there are five elements within the organisation, namely strategy,
technology, structure, management processes and individuals and roles. These key elements are
interdependent and need to be in balance in order to achieve revolutionary change involving IT
investment and consequently transform the organisation (Chan & Reich, 2007; Heine, Grover &
Malhotra, 2003; Macredie, Sandom & Paul, 1998; Scott Morton, 1995). The MIT90s study concluded
that “The benefits of IT are not generally being realised by organisations because investment is biased
towards technology and not towards managing changes in organisational processes, structure and
culture.”(Macredie et al., 1998, p. 8). Hence, the model focuses on the alignment of IT and the
organisation, critical to the successful management of IT-enabled organisational change. The
alignment of IT and the organisation has been the top concern of IT managers for nearly thirty years,
according to Society for Information Management (SIM) surveys conducted every year since 1980. It
only dropped to second in the 2009 survey (Luftman & Ben-Zvi, 2010). To put it simply, Luftman &
Brier (1999, p. 109) suggest, that IT alignment is: “applying IT in an appropriate and timely way and
in harmony with business strategies, goals, and needs”.
Chan & Reich (2007) argue that the MIT90s model has also served as an initial attempt to harness the
strategic power of IT. Implementing IT strategically, however, requires transformation of the
organisation by reaching a balance between its internal dimensions and external forces. Such dynamic
tension between the forces could result in stakeholders receiving an appropriate return over time (Scott
Morton, 1995).
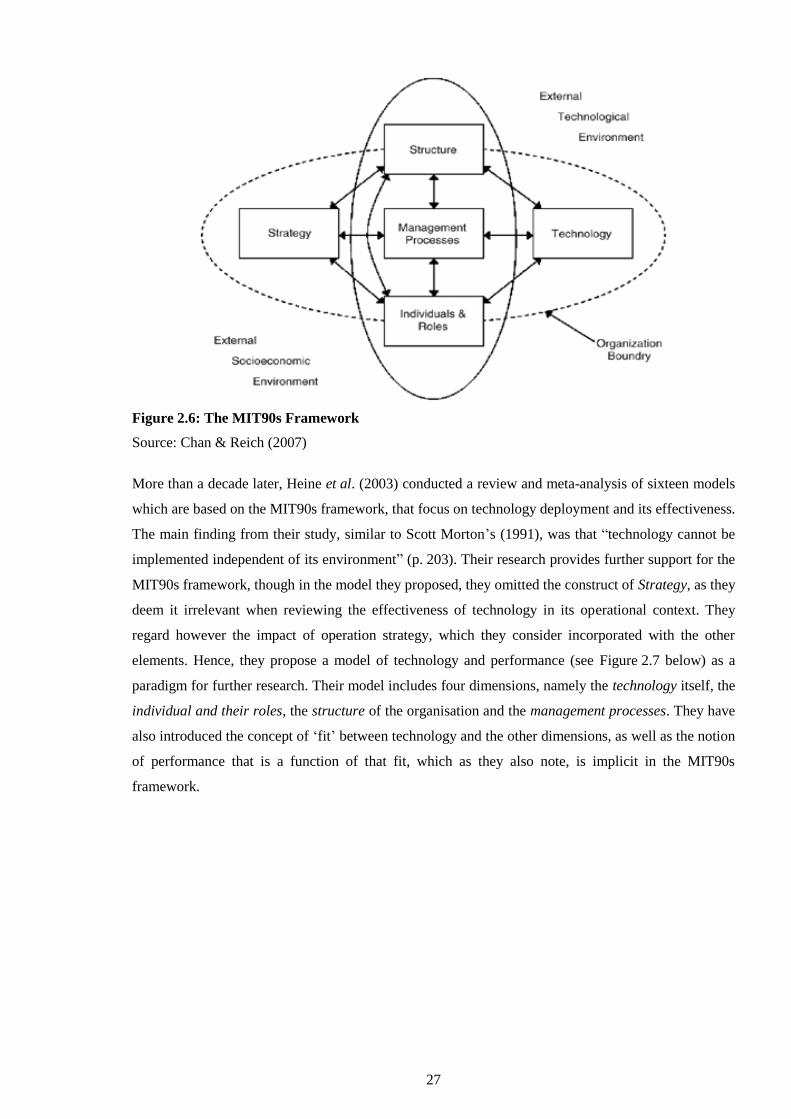
27
Figure 2.6: The MIT90s Framework
Source: Chan & Reich (2007)
More than a decade later, Heine et al. (2003) conducted a review and meta-analysis of sixteen models
which are based on the MIT90s framework, that focus on technology deployment and its effectiveness.
The main finding from their study, similar to Scott Morton’s (1991), was that “technology cannot be
implemented independent of its environment” (p. 203). Their research provides further support for the
MIT90s framework, though in the model they proposed, they omitted the construct of Strategy, as they
deem it irrelevant when reviewing the effectiveness of technology in its operational context. They
regard however the impact of operation strategy, which they consider incorporated with the other
elements. Hence, they propose a model of technology and performance (see Figure 2.7 below) as a
paradigm for further research. Their model includes four dimensions, namely the technology itself, the
individual and their roles, the structure of the organisation and the management processes. They have
also introduced the concept of ‘fit’ between technology and the other dimensions, as well as the notion
of performance that is a function of that fit, which as they also note, is implicit in the MIT90s
framework.
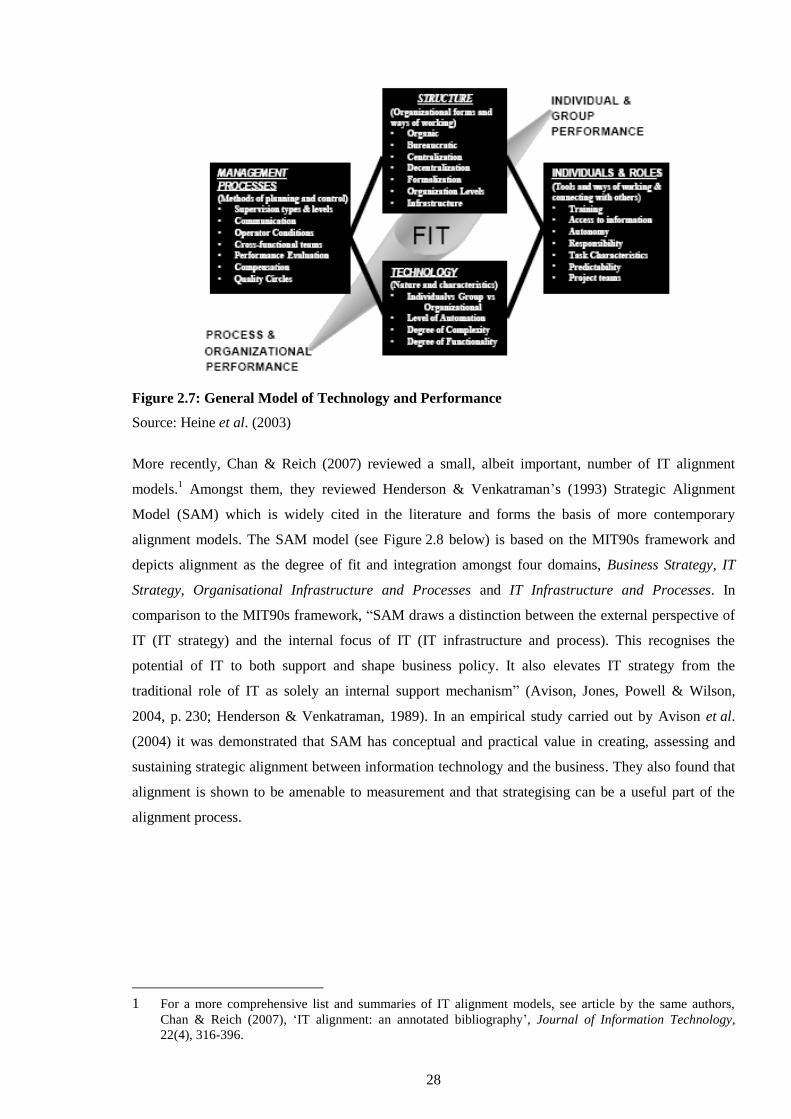
28
Figure 2.7: General Model of Technology and Performance
Source: Heine et al. (2003)
More recently, Chan & Reich (2007) reviewed a small, albeit important, number of IT alignment
models.1 Amongst them, they reviewed Henderson & Venkatraman’s (1993) Strategic Alignment
Model (SAM) which is widely cited in the literature and forms the basis of more contemporary
alignment models. The SAM model (see Figure 2.8 below) is based on the MIT90s framework and
depicts alignment as the degree of fit and integration amongst four domains, Business Strategy, IT
Strategy, Organisational Infrastructure and Processes and IT Infrastructure and Processes. In
comparison to the MIT90s framework, “SAM draws a distinction between the external perspective of
IT (IT strategy) and the internal focus of IT (IT infrastructure and process). This recognises the
potential of IT to both support and shape business policy. It also elevates IT strategy from the
traditional role of IT as solely an internal support mechanism” (Avison, Jones, Powell & Wilson,
2004, p. 230; Henderson & Venkatraman, 1989). In an empirical study carried out by Avison et al.
(2004) it was demonstrated that SAM has conceptual and practical value in creating, assessing and
sustaining strategic alignment between information technology and the business. They also found that
alignment is shown to be amenable to measurement and that strategising can be a useful part of the
alignment process.
1 For a more comprehensive list and summaries of IT alignment models, see article by the same authors,
Chan & Reich (2007), ‘IT alignment: an annotated bibliography’, Journal of Information Technology,
22(4), 316-396.
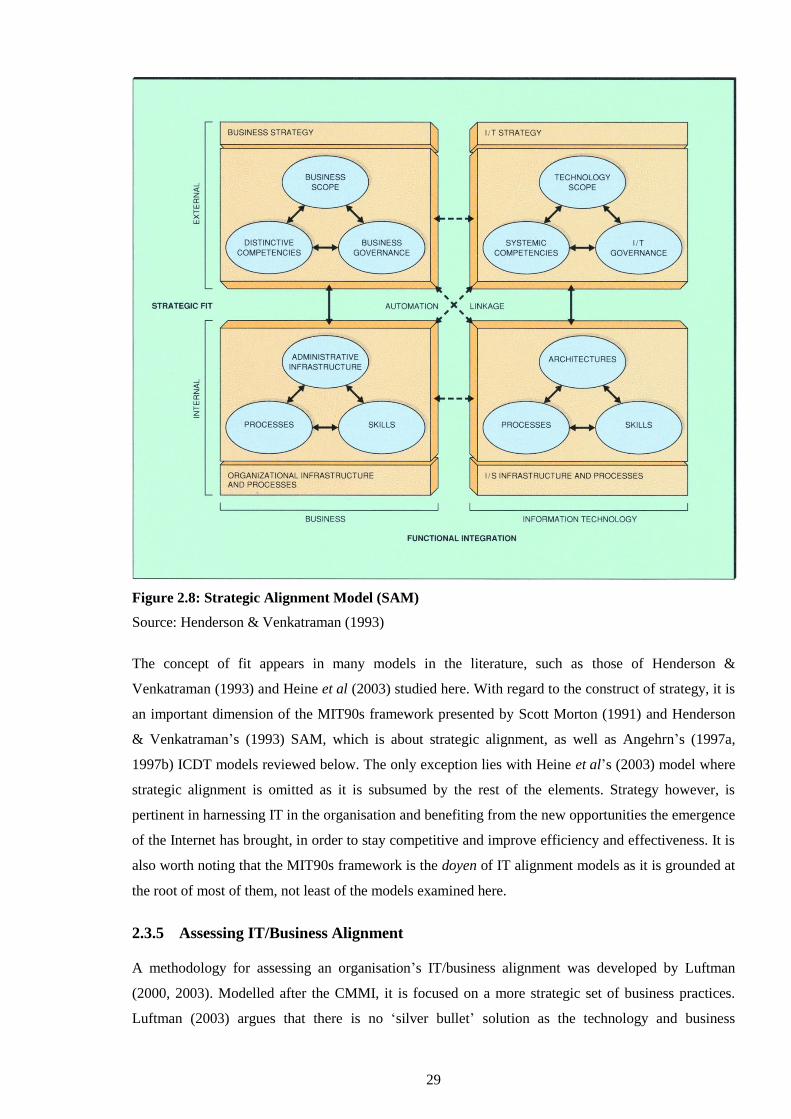
29
Figure 2.8: Strategic Alignment Model (SAM)
Source: Henderson & Venkatraman (1993)
The concept of fit appears in many models in the literature, such as those of Henderson &
Venkatraman (1993) and Heine et al (2003) studied here. With regard to the construct of strategy, it is
an important dimension of the MIT90s framework presented by Scott Morton (1991) and Henderson
& Venkatraman’s (1993) SAM, which is about strategic alignment, as well as Angehrn’s (1997a,
1997b) ICDT models reviewed below. The only exception lies with Heine et al’s (2003) model where
strategic alignment is omitted as it is subsumed by the rest of the elements. Strategy however, is
pertinent in harnessing IT in the organisation and benefiting from the new opportunities the emergence
of the Internet has brought, in order to stay competitive and improve efficiency and effectiveness. It is
also worth noting that the MIT90s framework is the doyen of IT alignment models as it is grounded at
the root of most of them, not least of the models examined here.
2.3.5 Assessing IT/Business Alignment
A methodology for assessing an organisation’s IT/business alignment was developed by Luftman
(2000, 2003). Modelled after the CMMI, it is focused on a more strategic set of business practices.
Luftman (2003) argues that there is no ‘silver bullet’ solution as the technology and business
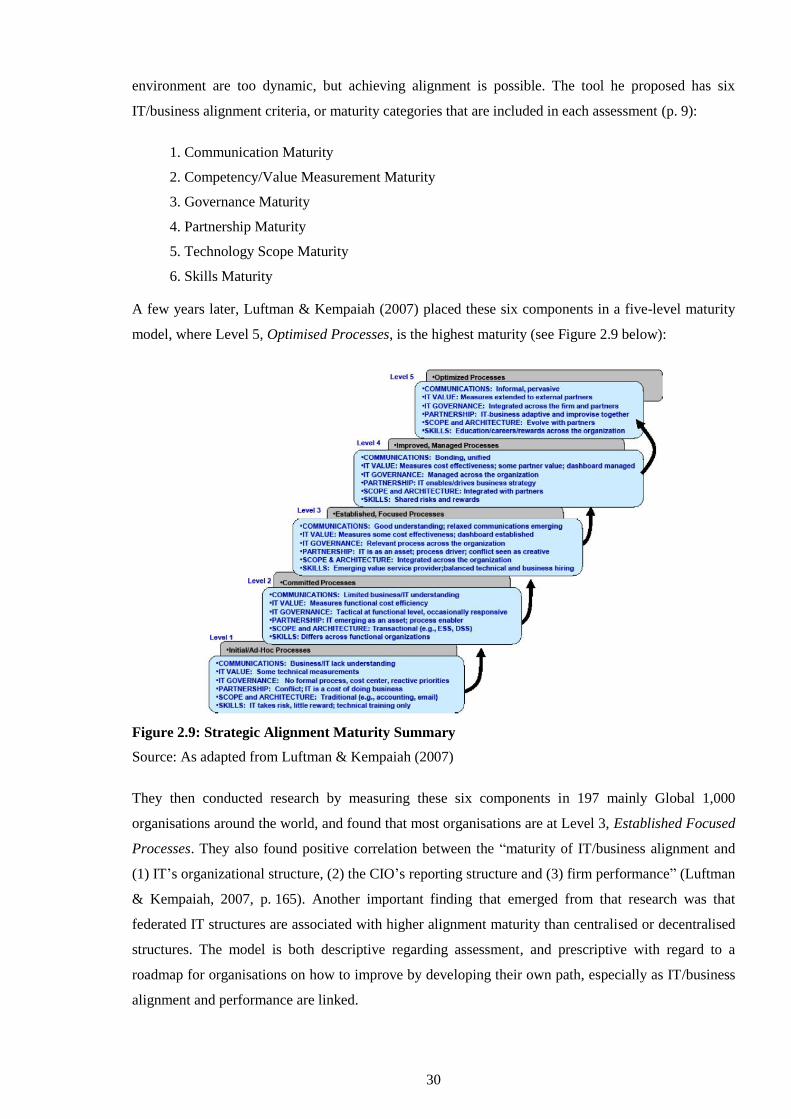
30
environment are too dynamic, but achieving alignment is possible. The tool he proposed has six
IT/business alignment criteria, or maturity categories that are included in each assessment (p. 9):
1. Communication Maturity
2. Competency/Value Measurement Maturity
3. Governance Maturity
4. Partnership Maturity
5. Technology Scope Maturity
6. Skills Maturity
A few years later, Luftman & Kempaiah (2007) placed these six components in a five-level maturity
model, where Level 5, Optimised Processes, is the highest maturity (see Figure 2.9 below):
Figure 2.9: Strategic Alignment Maturity Summary
Source: As adapted from Luftman & Kempaiah (2007)
They then conducted research by measuring these six components in 197 mainly Global 1,000
organisations around the world, and found that most organisations are at Level 3, Established Focused
Processes. They also found positive correlation between the “maturity of IT/business alignment and
(1) IT’s organizational structure, (2) the CIO’s reporting structure and (3) firm performance” (Luftman
& Kempaiah, 2007, p. 165). Another important finding that emerged from that research was that
federated IT structures are associated with higher alignment maturity than centralised or decentralised
structures. The model is both descriptive regarding assessment, and prescriptive with regard to a
roadmap for organisations on how to improve by developing their own path, especially as IT/business
alignment and performance are linked.
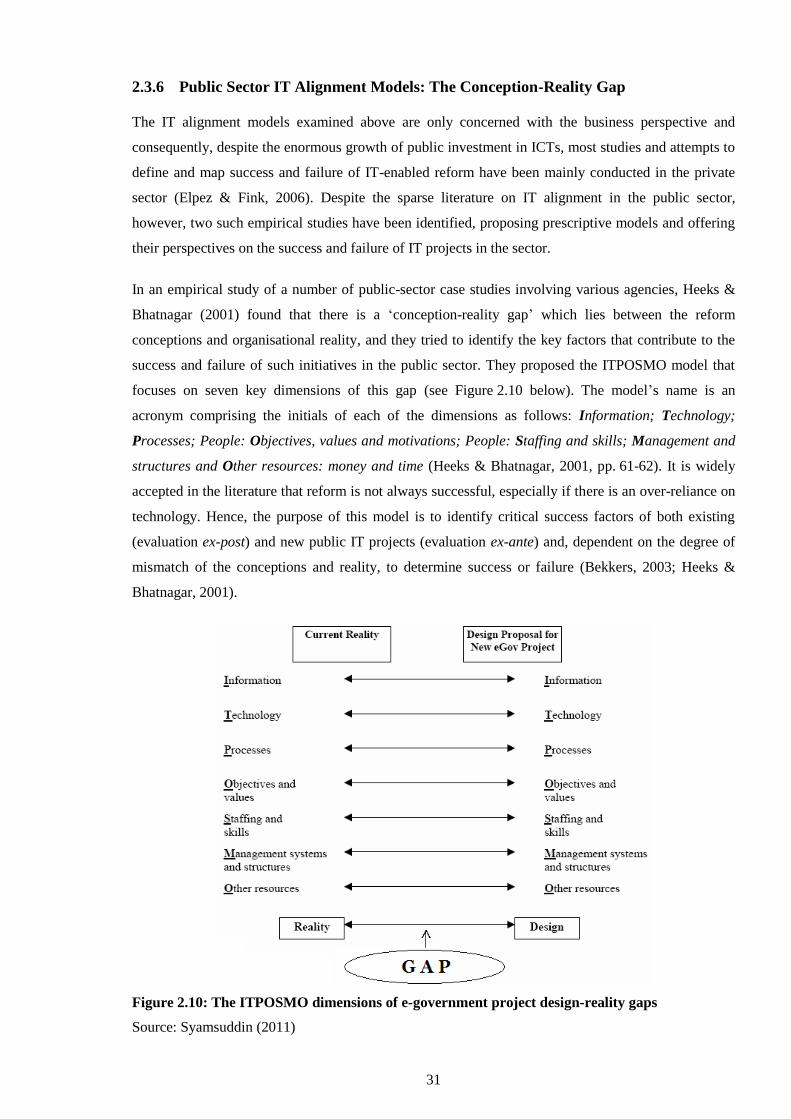
31
2.3.6 Public Sector IT Alignment Models: The Conception-Reality Gap
The IT alignment models examined above are only concerned with the business perspective and
consequently, despite the enormous growth of public investment in ICTs, most studies and attempts to
define and map success and failure of IT-enabled reform have been mainly conducted in the private
sector (Elpez & Fink, 2006). Despite the sparse literature on IT alignment in the public sector,
however, two such empirical studies have been identified, proposing prescriptive models and offering
their perspectives on the success and failure of IT projects in the sector.
In an empirical study of a number of public-sector case studies involving various agencies, Heeks &
Bhatnagar (2001) found that there is a ‘conception-reality gap’ which lies between the reform
conceptions and organisational reality, and they tried to identify the key factors that contribute to the
success and failure of such initiatives in the public sector. They proposed the ITPOSMO model that
focuses on seven key dimensions of this gap (see Figure 2.10 below). The model’s name is an
acronym comprising the initials of each of the dimensions as follows: Information; Technology;
Processes; People: Objectives, values and motivations; People: Staffing and skills; Management and
structures and Other resources: money and time (Heeks & Bhatnagar, 2001, pp. 61-62). It is widely
accepted in the literature that reform is not always successful, especially if there is an over-reliance on
technology. Hence, the purpose of this model is to identify critical success factors of both existing
(evaluation ex-post) and new public IT projects (evaluation ex-ante) and, dependent on the degree of
mismatch of the conceptions and reality, to determine success or failure (Bekkers, 2003; Heeks &
Bhatnagar, 2001).
Figure 2.10: The ITPOSMO dimensions of e-government project design-reality gaps
Source: Syamsuddin (2011)
32
The ITPOSMO model uses a rating score to indicate the size of the reality-design gap on each of the
dimensions aforementioned, and depending on the score it uses this knowledge to determine whether
to revive an existing e-government project and turn it from failure to success, or to assist future
e-government projects to reduce the risk of failure. Dimensions such as objectives and values,
information and staffing, for example, are key to this research and would be explored later
accordingly.
The line of reasoning behind the model is that the efficacy of ICT project management in the public
sector can be increased if factors beyond the technological and informational domain are taken into
account. Nevertheless, Bekkers (2003) argues that it is also important to look at other factors. These
factors include how the reform project is managed as a change process, and what is the quality and
progress of this change process itself. This factor-based approach however had its critics. Stanforth
(2010, p. 5) found that although factor-based studies are the most widely-used diagnostic approach to
the evaluation of IS projects, “the inter-relationship between the factors and the various analytical
groups are just as important as the individual factors themselves, and the critical factor approach does
not provide an adequate mechanism for taking account of the complexity of these inter-relationships”.
In addition, the fact that the ITPOSMO model could be understood as a means to assess fit between
system design and various contextual realities led Fortune & Peters (2005) to suggest that Heeks &
Bhatnagar (2001) are adopting ‘a composite approach’ to the analysis of e-government project failure
involving both the factoral and systems approaches (Stanforth, 2010).
Another empirical study of three large IS projects in major Western Australian government agencies
by Elpez & Fink (2006) yielded an emerging public sector alignment model (see Figure 2.11 below).
They identified key success variables relevant to the public sector and the characteristics that
distinguish it from the private sector. Furthermore, they adopted the stakeholder’s perspective in their
study, “since it was argued that success of an IS project is what stakeholders perceive it to be”
(p. 220). Their model attempts to align key IS success factors with public sector characteristics. The
central variable is Use which is influenced by System usability and performance, Information quality
and User acceptance and IS ownership. Furthermore, it is influenced by the Meeting user
requirements, which was the highest ranked variable outlined in their study. Whilst the above
variables reflect the user’s perspective, they argue that use by civil servants in turn, facilitates
Accountability and Expenditure control. The Interaction with IT infrastructure implies interaction with
other agencies, improving use and at the same time fulfilling a Long term perspective, i.e. meeting
long-term needs.
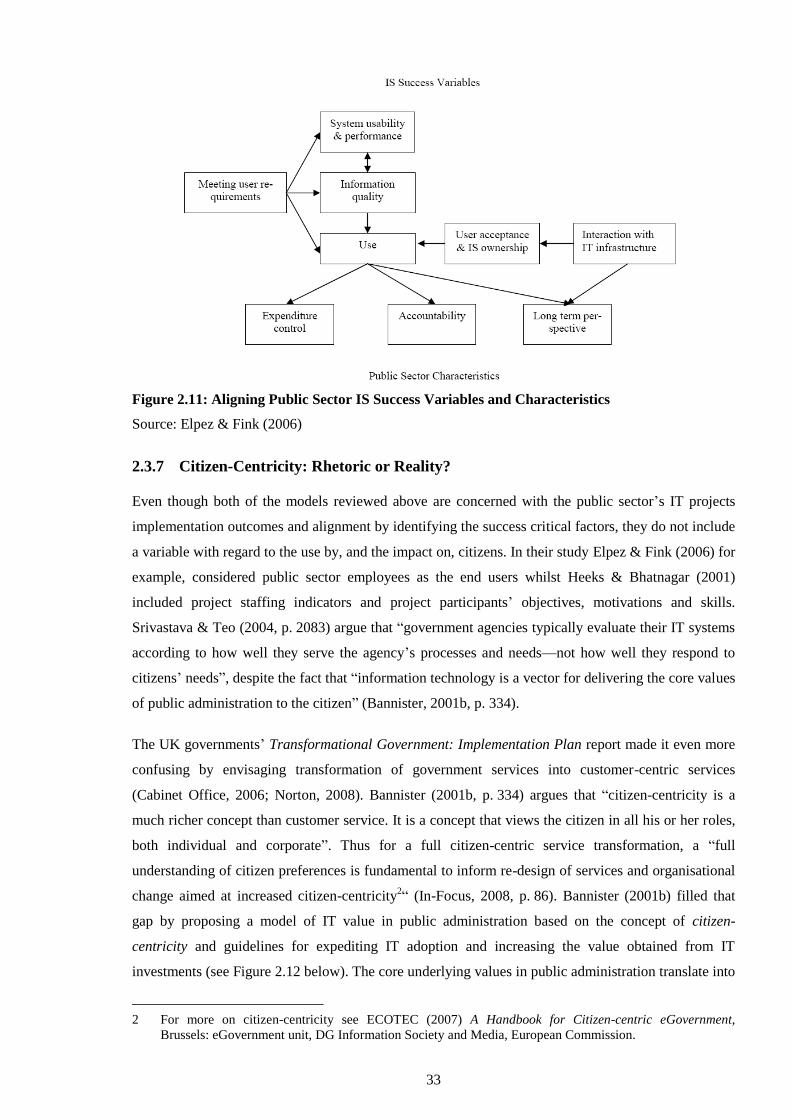
33
Figure 2.11: Aligning Public Sector IS Success Variables and Characteristics
Source: Elpez & Fink (2006)
2.3.7 Citizen-Centricity: Rhetoric or Reality?
Even though both of the models reviewed above are concerned with the public sector’s IT projects
implementation outcomes and alignment by identifying the success critical factors, they do not include
a variable with regard to the use by, and the impact on, citizens. In their study Elpez & Fink (2006) for
example, considered public sector employees as the end users whilst Heeks & Bhatnagar (2001)
included project staffing indicators and project participants’ objectives, motivations and skills.
Srivastava & Teo (2004, p. 2083) argue that “government agencies typically evaluate their IT systems
according to how well they serve the agency’s processes and needs—not how well they respond to
citizens’ needs”, despite the fact that “information technology is a vector for delivering the core values
of public administration to the citizen” (Bannister, 2001b, p. 334).
The UK governments’ Transformational Government: Implementation Plan report made it even more
confusing by envisaging transformation of government services into customer-centric services
(Cabinet Office, 2006; Norton, 2008). Bannister (2001b, p. 334) argues that “citizen-centricity is a
much richer concept than customer service. It is a concept that views the citizen in all his or her roles,
both individual and corporate”. Thus for a full citizen-centric service transformation, a “full
understanding of citizen preferences is fundamental to inform re-design of services and organisational
change aimed at increased citizen-centricity2“ (In-Focus, 2008, p. 86). Bannister (2001b) filled that
gap by proposing a model of IT value in public administration based on the concept of citizen-
centricity and guidelines for expediting IT adoption and increasing the value obtained from IT
investments (see Figure 2.12 below). The core underlying values in public administration translate into
2 For more on citizen-centricity see ECOTEC (2007) A Handbook for Citizen-centric eGovernment,
Brussels: eGovernment unit, DG Information Society and Media, European Commission.
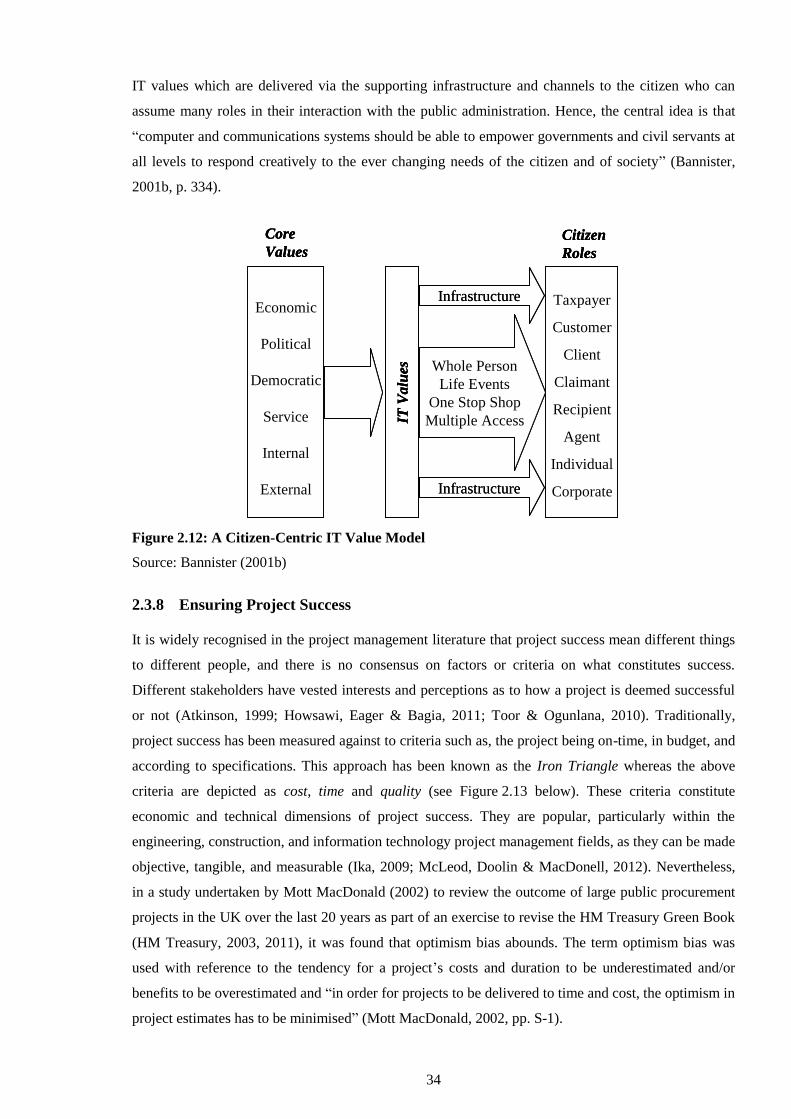
34
IT values which are delivered via the supporting infrastructure and channels to the citizen who can
assume many roles in their interaction with the public administration. Hence, the central idea is that
“computer and communications systems should be able to empower governments and civil servants at
all levels to respond creatively to the ever changing needs of the citizen and of society” (Bannister,
2001b, p. 334).
Economic
Political
Democratic
Service
Internal
External
Whole Person
Life Events
One Stop Shop
Multiple Access
Taxpayer
Customer
Client
Claimant
Recipient
Agent
Individual
Corporate
IT V
alu
es
Core
ValuesCitizen
Roles
Infrastructure
Infrastructure
Economic
Political
Democratic
Service
Internal
External
Whole Person
Life Events
One Stop Shop
Multiple Access
Taxpayer
Customer
Client
Claimant
Recipient
Agent
Individual
Corporate
IT V
alu
es
Core
ValuesCitizen
Roles
Economic
Political
Democratic
Service
Internal
External
Whole Person
Life Events
One Stop Shop
Multiple Access
Taxpayer
Customer
Client
Claimant
Recipient
Agent
Individual
Corporate
IT V
alu
es
Core
ValuesCitizen
Roles
Infrastructure
Infrastructure
Figure 2.12: A Citizen-Centric IT Value Model
Source: Bannister (2001b)
2.3.8 Ensuring Project Success
It is widely recognised in the project management literature that project success mean different things
to different people, and there is no consensus on factors or criteria on what constitutes success.
Different stakeholders have vested interests and perceptions as to how a project is deemed successful
or not (Atkinson, 1999; Howsawi, Eager & Bagia, 2011; Toor & Ogunlana, 2010). Traditionally,
project success has been measured against to criteria such as, the project being on-time, in budget, and
according to specifications. This approach has been known as the Iron Triangle whereas the above
criteria are depicted as cost, time and quality (see Figure 2.13 below). These criteria constitute
economic and technical dimensions of project success. They are popular, particularly within the
engineering, construction, and information technology project management fields, as they can be made
objective, tangible, and measurable (Ika, 2009; McLeod, Doolin & MacDonell, 2012). Nevertheless,
in a study undertaken by Mott MacDonald (2002) to review the outcome of large public procurement
projects in the UK over the last 20 years as part of an exercise to revise the HM Treasury Green Book
(HM Treasury, 2003, 2011), it was found that optimism bias abounds. The term optimism bias was
used with reference to the tendency for a project’s costs and duration to be underestimated and/or
benefits to be overestimated and “in order for projects to be delivered to time and cost, the optimism in
project estimates has to be minimised” (Mott MacDonald, 2002, pp. S-1).
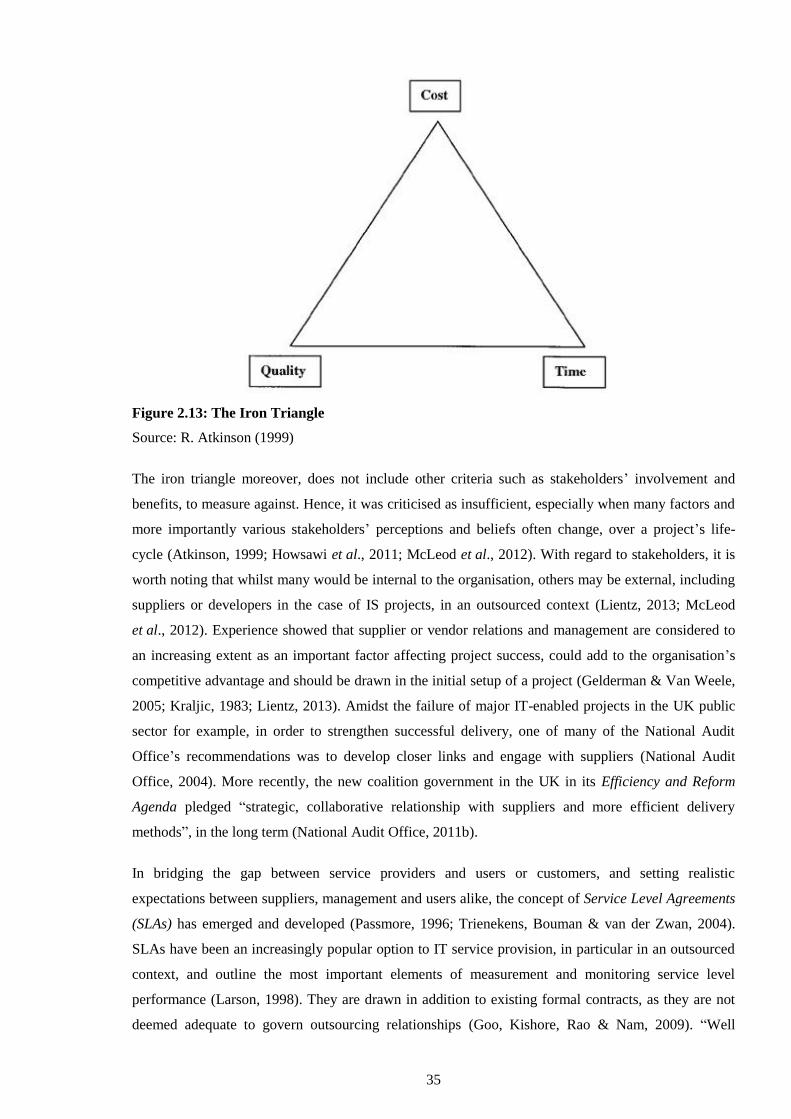
35
Figure 2.13: The Iron Triangle
Source: R. Atkinson (1999)
The iron triangle moreover, does not include other criteria such as stakeholders’ involvement and
benefits, to measure against. Hence, it was criticised as insufficient, especially when many factors and
more importantly various stakeholders’ perceptions and beliefs often change, over a project’s life-
cycle (Atkinson, 1999; Howsawi et al., 2011; McLeod et al., 2012). With regard to stakeholders, it is
worth noting that whilst many would be internal to the organisation, others may be external, including
suppliers or developers in the case of IS projects, in an outsourced context (Lientz, 2013; McLeod
et al., 2012). Experience showed that supplier or vendor relations and management are considered to
an increasing extent as an important factor affecting project success, could add to the organisation’s
competitive advantage and should be drawn in the initial setup of a project (Gelderman & Van Weele,
2005; Kraljic, 1983; Lientz, 2013). Amidst the failure of major IT-enabled projects in the UK public
sector for example, in order to strengthen successful delivery, one of many of the National Audit
Office’s recommendations was to develop closer links and engage with suppliers (National Audit
Office, 2004). More recently, the new coalition government in the UK in its Efficiency and Reform
Agenda pledged “strategic, collaborative relationship with suppliers and more efficient delivery
methods”, in the long term (National Audit Office, 2011b).
In bridging the gap between service providers and users or customers, and setting realistic
expectations between suppliers, management and users alike, the concept of Service Level Agreements
(SLAs) has emerged and developed (Passmore, 1996; Trienekens, Bouman & van der Zwan, 2004).
SLAs have been an increasingly popular option to IT service provision, in particular in an outsourced
context, and outline the most important elements of measurement and monitoring service level
performance (Larson, 1998). They are drawn in addition to existing formal contracts, as they are not
deemed adequate to govern outsourcing relationships (Goo, Kishore, Rao & Nam, 2009). “Well
36
defined services and their associated service levels are fundamental components of any successful
outsourcing contract for the management or operation of part, or all, of an organisation’s services by
an external source, particularly information technology services” (Larson, 1998, p. 128).
2.4 System Design and Business Process Re-engineering
2.4.1 BPR Concepts and Approaches
The process of changing strategy, organisational processes, structure and culture in order to realise the
maximum benefits of their IT investments, in particular in the private sector, is called business process
re-engineering (BPR). Several scholars and practitioners alike however, defined BPR in different
ways. Other similar terms that are found in the literature as aforementioned in the previous sections
are, business process redesign and business process change (BPC) and sometimes are used
interchangeably. Another term used to describe the approach that looks across business functions, in
other words, processes that define an organisation’s strategic competitive advantage is core process
redesign (Kaplan & Murdock, 1991).
Business process re-engineering was an important trend of the 1990s and went on to become the
subject of extensive academic research and analysis and much professional hyperbole (Bannister,
2004). Prior to that, in the 1970s and 1980s, organisations tried to improve their processes with total
quality management (TQM) (Davenport, 2005). Business processes are defined by Davenport & Short
(1990, p. 12) as a “set of logically-related tasks performed to achieve a defined business outcome” and
consequently, a set of processes form a business system. In addition, they bear two characteristics:
they have internal or external customers and they cross organisational boundaries. Nevertheless,
although they cross organisational boundaries, they are independent of formal organisational structure
(Davenport & Short, 1990).
Remenyi & Whittaker (1994, p. 51) define business process reengineering as “a new managerial
initiative which combines the transforming power of information technology, with a process-based
view of the organization”. Hammer & Champy (1993) define BPR as the fundamental rethink and
radical redesign of business processes to generate dramatic improvements in critical performance
measures – such as cost, quality, service and speed (see Figure 2.14 below).
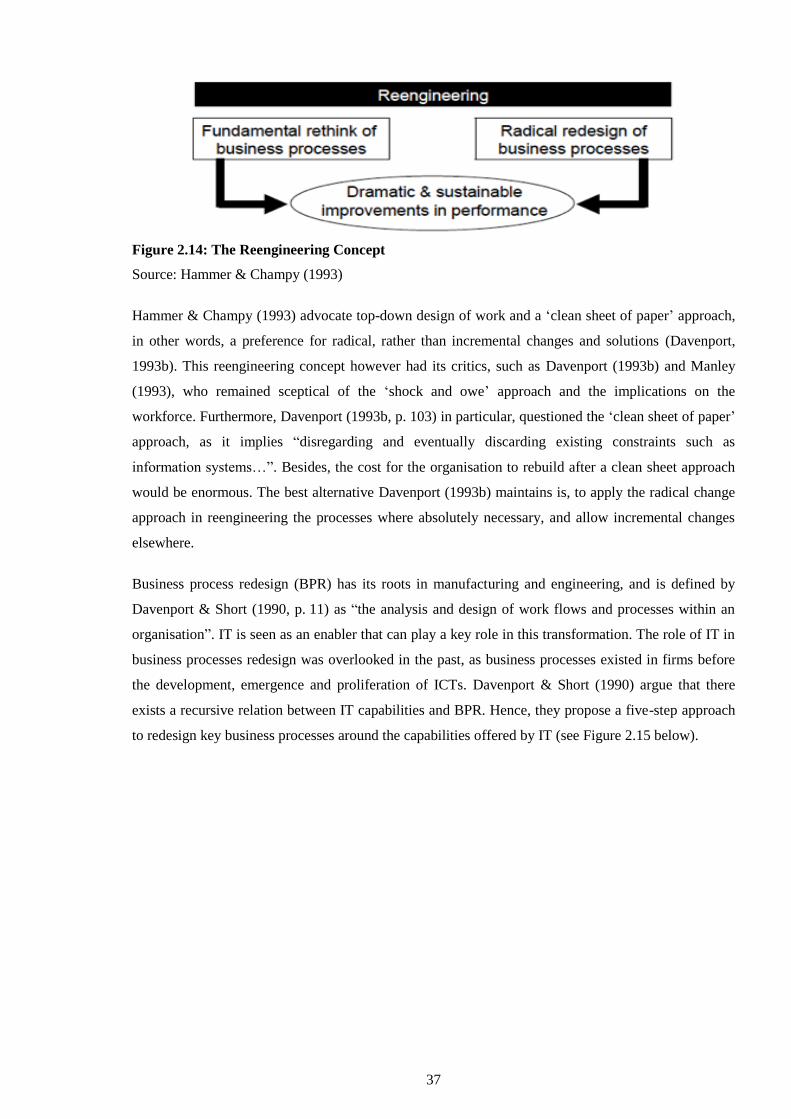
37
Figure 2.14: The Reengineering Concept
Source: Hammer & Champy (1993)
Hammer & Champy (1993) advocate top-down design of work and a ‘clean sheet of paper’ approach,
in other words, a preference for radical, rather than incremental changes and solutions (Davenport,
1993b). This reengineering concept however had its critics, such as Davenport (1993b) and Manley
(1993), who remained sceptical of the ‘shock and owe’ approach and the implications on the
workforce. Furthermore, Davenport (1993b, p. 103) in particular, questioned the ‘clean sheet of paper’
approach, as it implies “disregarding and eventually discarding existing constraints such as
information systems…”. Besides, the cost for the organisation to rebuild after a clean sheet approach
would be enormous. The best alternative Davenport (1993b) maintains is, to apply the radical change
approach in reengineering the processes where absolutely necessary, and allow incremental changes
elsewhere.
Business process redesign (BPR) has its roots in manufacturing and engineering, and is defined by
Davenport & Short (1990, p. 11) as “the analysis and design of work flows and processes within an
organisation”. IT is seen as an enabler that can play a key role in this transformation. The role of IT in
business processes redesign was overlooked in the past, as business processes existed in firms before
the development, emergence and proliferation of ICTs. Davenport & Short (1990) argue that there
exists a recursive relation between IT capabilities and BPR. Hence, they propose a five-step approach
to redesign key business processes around the capabilities offered by IT (see Figure 2.15 below).
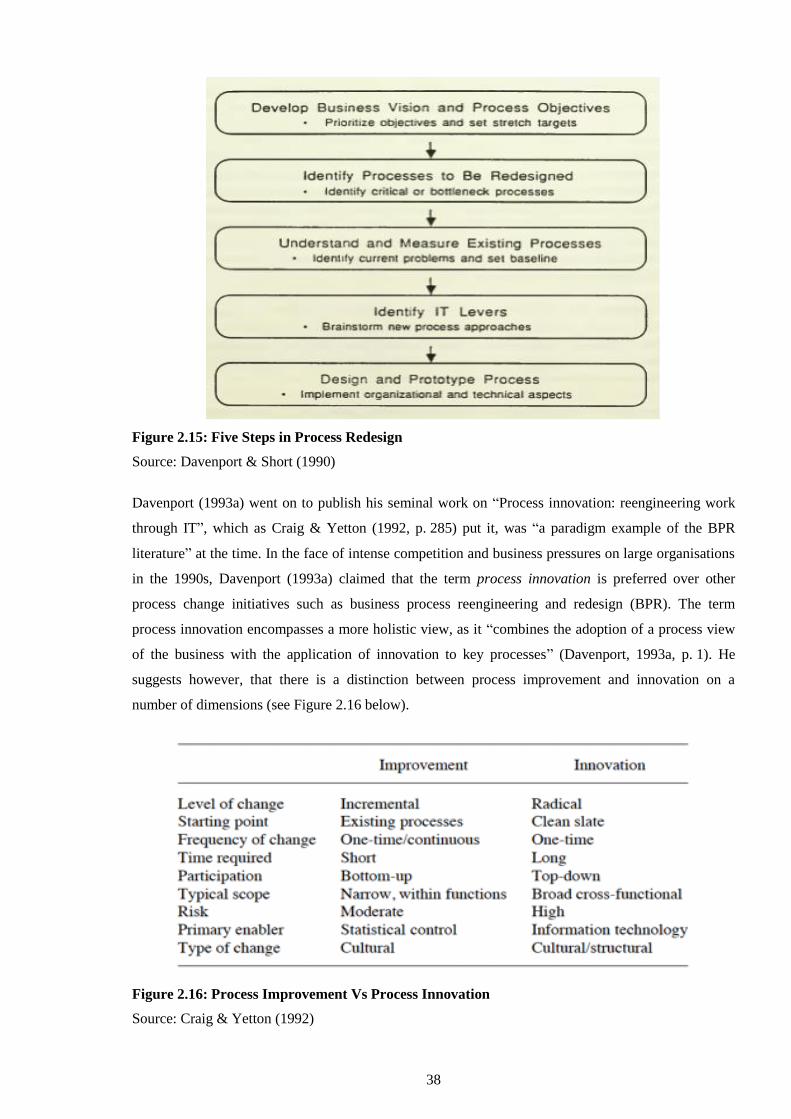
38
Figure 2.15: Five Steps in Process Redesign
Source: Davenport & Short (1990)
Davenport (1993a) went on to publish his seminal work on “Process innovation: reengineering work
through IT”, which as Craig & Yetton (1992, p. 285) put it, was “a paradigm example of the BPR
literature” at the time. In the face of intense competition and business pressures on large organisations
in the 1990s, Davenport (1993a) claimed that the term process innovation is preferred over other
process change initiatives such as business process reengineering and redesign (BPR). The term
process innovation encompasses a more holistic view, as it “combines the adoption of a process view
of the business with the application of innovation to key processes” (Davenport, 1993a, p. 1). He
suggests however, that there is a distinction between process improvement and innovation on a
number of dimensions (see Figure 2.16 below).
Figure 2.16: Process Improvement Vs Process Innovation
Source: Craig & Yetton (1992)
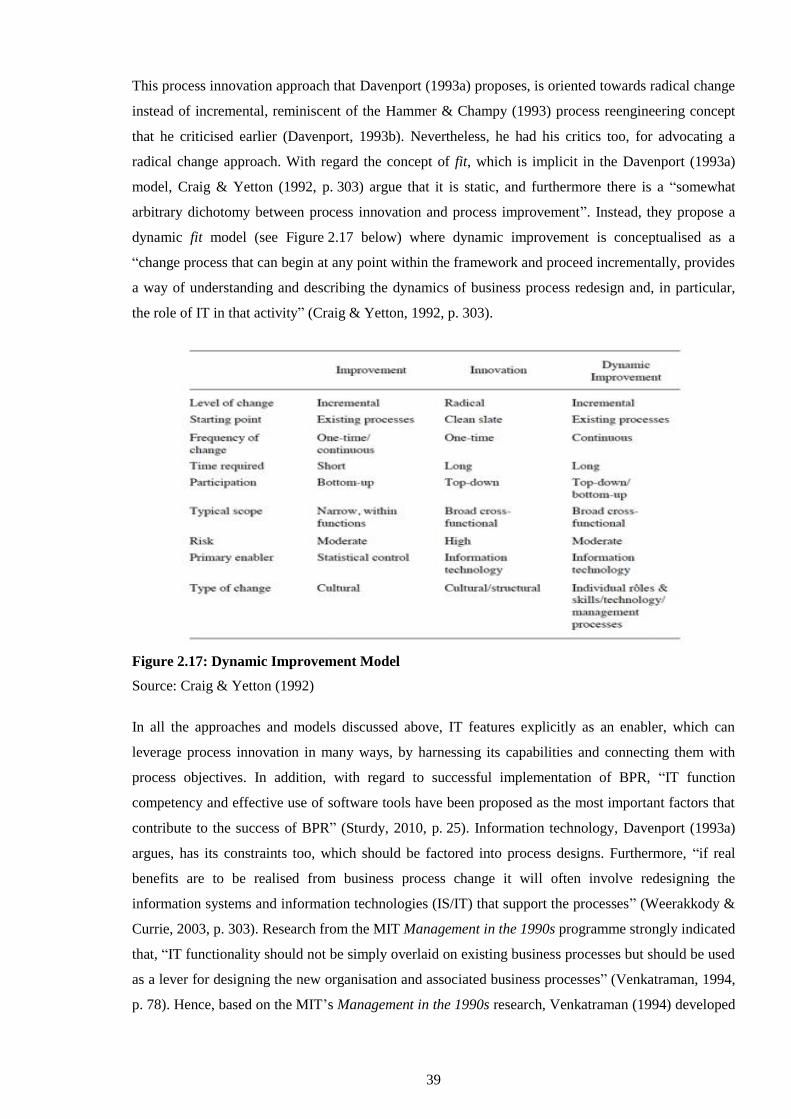
39
This process innovation approach that Davenport (1993a) proposes, is oriented towards radical change
instead of incremental, reminiscent of the Hammer & Champy (1993) process reengineering concept
that he criticised earlier (Davenport, 1993b). Nevertheless, he had his critics too, for advocating a
radical change approach. With regard the concept of fit, which is implicit in the Davenport (1993a)
model, Craig & Yetton (1992, p. 303) argue that it is static, and furthermore there is a “somewhat
arbitrary dichotomy between process innovation and process improvement”. Instead, they propose a
dynamic fit model (see Figure 2.17 below) where dynamic improvement is conceptualised as a
“change process that can begin at any point within the framework and proceed incrementally, provides
a way of understanding and describing the dynamics of business process redesign and, in particular,
the role of IT in that activity” (Craig & Yetton, 1992, p. 303).
Figure 2.17: Dynamic Improvement Model
Source: Craig & Yetton (1992)
In all the approaches and models discussed above, IT features explicitly as an enabler, which can
leverage process innovation in many ways, by harnessing its capabilities and connecting them with
process objectives. In addition, with regard to successful implementation of BPR, “IT function
competency and effective use of software tools have been proposed as the most important factors that
contribute to the success of BPR” (Sturdy, 2010, p. 25). Information technology, Davenport (1993a)
argues, has its constraints too, which should be factored into process designs. Furthermore, “if real
benefits are to be realised from business process change it will often involve redesigning the
information systems and information technologies (IS/IT) that support the processes” (Weerakkody &
Currie, 2003, p. 303). Research from the MIT Management in the 1990s programme strongly indicated
that, “IT functionality should not be simply overlaid on existing business processes but should be used
as a lever for designing the new organisation and associated business processes” (Venkatraman, 1994,
p. 78). Hence, based on the MIT’s Management in the 1990s research, Venkatraman (1994) developed
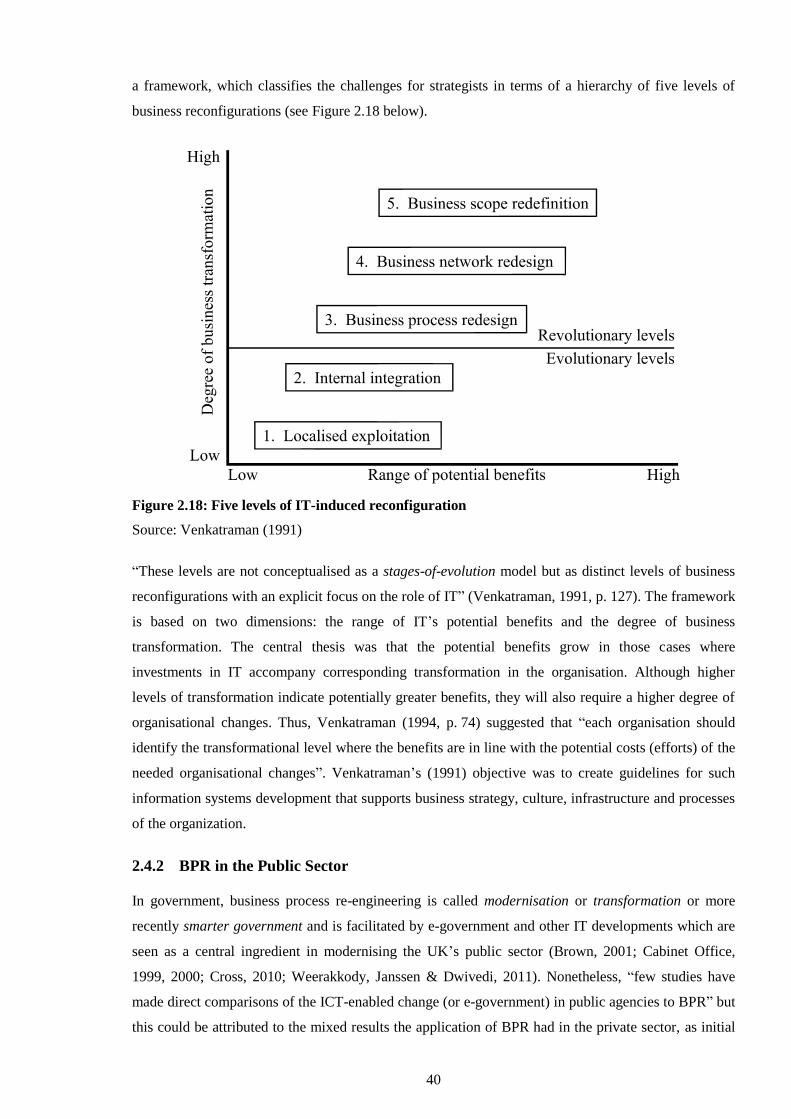
40
a framework, which classifies the challenges for strategists in terms of a hierarchy of five levels of
business reconfigurations (see Figure 2.18 below).
Figure 2.18: Five levels of IT-induced reconfiguration
Source: Venkatraman (1991)
“These levels are not conceptualised as a stages-of-evolution model but as distinct levels of business
reconfigurations with an explicit focus on the role of IT” (Venkatraman, 1991, p. 127). The framework
is based on two dimensions: the range of IT’s potential benefits and the degree of business
transformation. The central thesis was that the potential benefits grow in those cases where
investments in IT accompany corresponding transformation in the organisation. Although higher
levels of transformation indicate potentially greater benefits, they will also require a higher degree of
organisational changes. Thus, Venkatraman (1994, p. 74) suggested that “each organisation should
identify the transformational level where the benefits are in line with the potential costs (efforts) of the
needed organisational changes”. Venkatraman’s (1991) objective was to create guidelines for such
information systems development that supports business strategy, culture, infrastructure and processes
of the organization.
2.4.2 BPR in the Public Sector
In government, business process re-engineering is called modernisation or transformation or more
recently smarter government and is facilitated by e-government and other IT developments which are
seen as a central ingredient in modernising the UK’s public sector (Brown, 2001; Cabinet Office,
1999, 2000; Cross, 2010; Weerakkody, Janssen & Dwivedi, 2011). Nonetheless, “few studies have
made direct comparisons of the ICT-enabled change (or e-government) in public agencies to BPR” but
this could be attributed to the mixed results the application of BPR had in the private sector, as initial
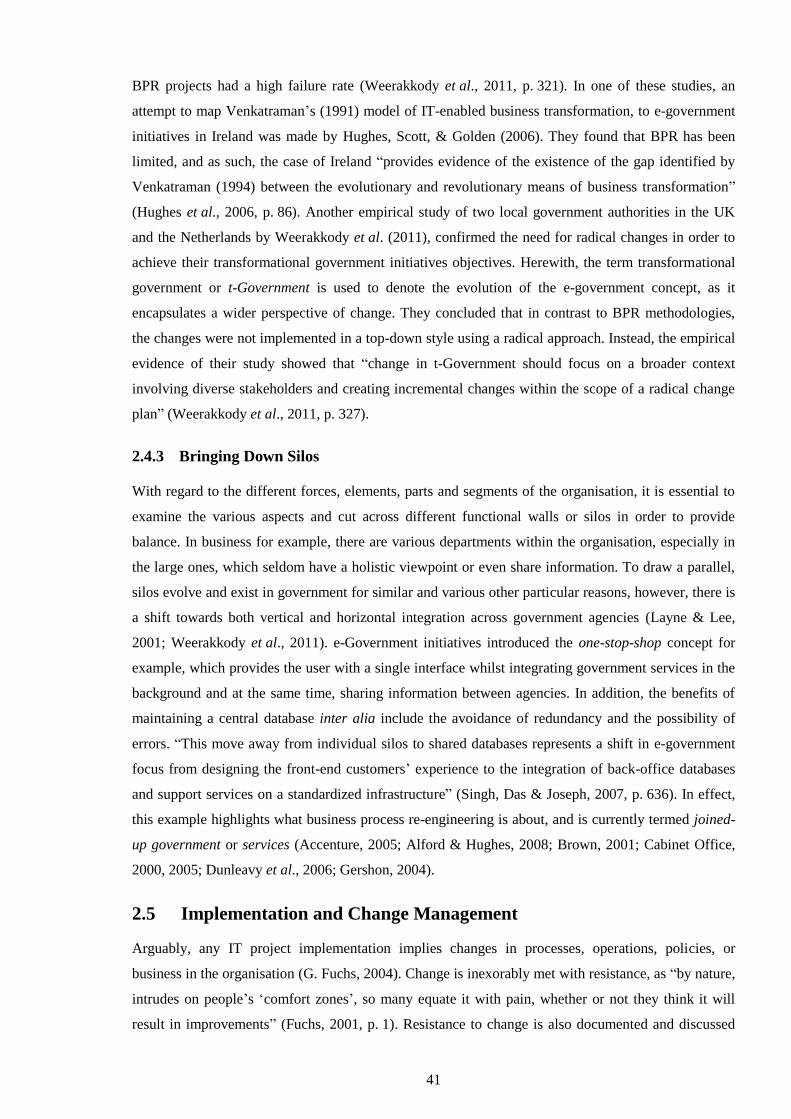
41
BPR projects had a high failure rate (Weerakkody et al., 2011, p. 321). In one of these studies, an
attempt to map Venkatraman’s (1991) model of IT-enabled business transformation, to e-government
initiatives in Ireland was made by Hughes, Scott, & Golden (2006). They found that BPR has been
limited, and as such, the case of Ireland “provides evidence of the existence of the gap identified by
Venkatraman (1994) between the evolutionary and revolutionary means of business transformation”
(Hughes et al., 2006, p. 86). Another empirical study of two local government authorities in the UK
and the Netherlands by Weerakkody et al. (2011), confirmed the need for radical changes in order to
achieve their transformational government initiatives objectives. Herewith, the term transformational
government or t-Government is used to denote the evolution of the e-government concept, as it
encapsulates a wider perspective of change. They concluded that in contrast to BPR methodologies,
the changes were not implemented in a top-down style using a radical approach. Instead, the empirical
evidence of their study showed that “change in t-Government should focus on a broader context
involving diverse stakeholders and creating incremental changes within the scope of a radical change
plan” (Weerakkody et al., 2011, p. 327).
2.4.3 Bringing Down Silos
With regard to the different forces, elements, parts and segments of the organisation, it is essential to
examine the various aspects and cut across different functional walls or silos in order to provide
balance. In business for example, there are various departments within the organisation, especially in
the large ones, which seldom have a holistic viewpoint or even share information. To draw a parallel,
silos evolve and exist in government for similar and various other particular reasons, however, there is
a shift towards both vertical and horizontal integration across government agencies (Layne & Lee,
2001; Weerakkody et al., 2011). e-Government initiatives introduced the one-stop-shop concept for
example, which provides the user with a single interface whilst integrating government services in the
background and at the same time, sharing information between agencies. In addition, the benefits of
maintaining a central database inter alia include the avoidance of redundancy and the possibility of
errors. “This move away from individual silos to shared databases represents a shift in e-government
focus from designing the front-end customers’ experience to the integration of back-office databases
and support services on a standardized infrastructure” (Singh, Das & Joseph, 2007, p. 636). In effect,
this example highlights what business process re-engineering is about, and is currently termed joined-
up government or services (Accenture, 2005; Alford & Hughes, 2008; Brown, 2001; Cabinet Office,
2000, 2005; Dunleavy et al., 2006; Gershon, 2004).
2.5 Implementation and Change Management
Arguably, any IT project implementation implies changes in processes, operations, policies, or
business in the organisation (G. Fuchs, 2004). Change is inexorably met with resistance, as “by nature,
intrudes on people’s ‘comfort zones’, so many equate it with pain, whether or not they think it will
result in improvements” (Fuchs, 2001, p. 1). Resistance to change is also documented and discussed
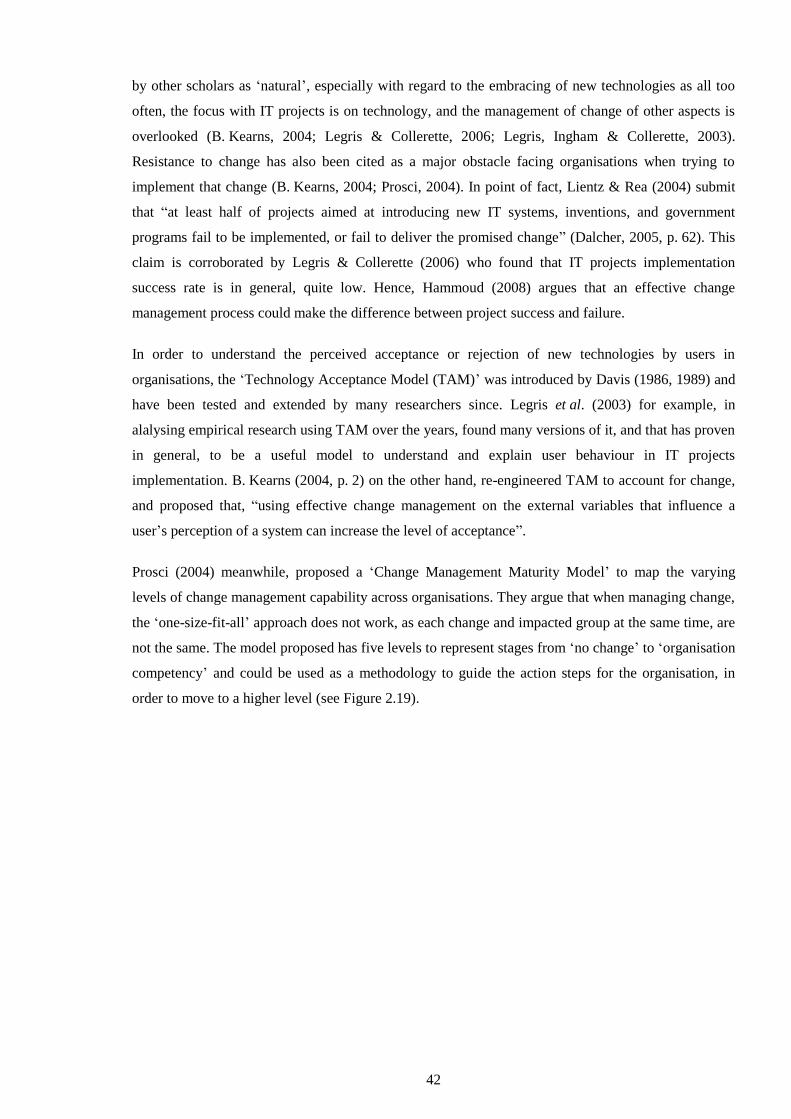
42
by other scholars as ‘natural’, especially with regard to the embracing of new technologies as all too
often, the focus with IT projects is on technology, and the management of change of other aspects is
overlooked (B. Kearns, 2004; Legris & Collerette, 2006; Legris, Ingham & Collerette, 2003).
Resistance to change has also been cited as a major obstacle facing organisations when trying to
implement that change (B. Kearns, 2004; Prosci, 2004). In point of fact, Lientz & Rea (2004) submit
that “at least half of projects aimed at introducing new IT systems, inventions, and government
programs fail to be implemented, or fail to deliver the promised change” (Dalcher, 2005, p. 62). This
claim is corroborated by Legris & Collerette (2006) who found that IT projects implementation
success rate is in general, quite low. Hence, Hammoud (2008) argues that an effective change
management process could make the difference between project success and failure.
In order to understand the perceived acceptance or rejection of new technologies by users in
organisations, the ‘Technology Acceptance Model (TAM)’ was introduced by Davis (1986, 1989) and
have been tested and extended by many researchers since. Legris et al. (2003) for example, in
alalysing empirical research using TAM over the years, found many versions of it, and that has proven
in general, to be a useful model to understand and explain user behaviour in IT projects
implementation. B. Kearns (2004, p. 2) on the other hand, re-engineered TAM to account for change,
and proposed that, “using effective change management on the external variables that influence a
user’s perception of a system can increase the level of acceptance”.
Prosci (2004) meanwhile, proposed a ‘Change Management Maturity Model’ to map the varying
levels of change management capability across organisations. They argue that when managing change,
the ‘one-size-fit-all’ approach does not work, as each change and impacted group at the same time, are
not the same. The model proposed has five levels to represent stages from ‘no change’ to ‘organisation
competency’ and could be used as a methodology to guide the action steps for the organisation, in
order to move to a higher level (see Figure 2.19).
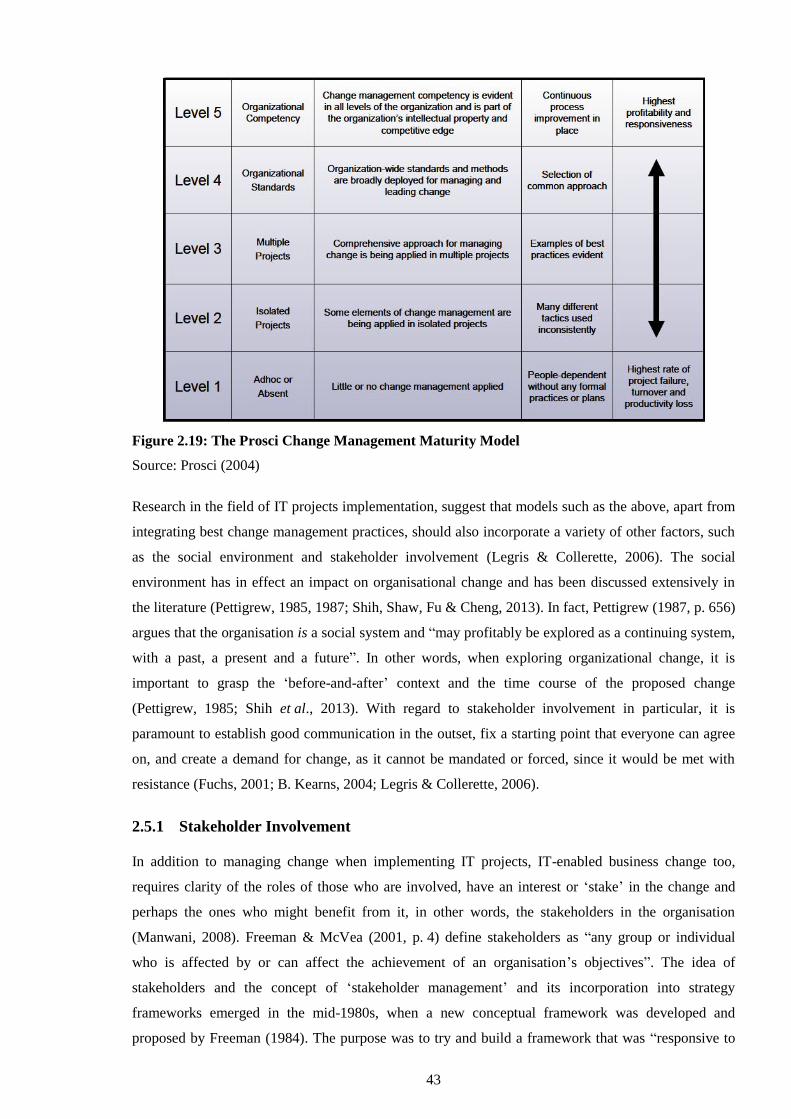
43
Figure 2.19: The Prosci Change Management Maturity Model
Source: Prosci (2004)
Research in the field of IT projects implementation, suggest that models such as the above, apart from
integrating best change management practices, should also incorporate a variety of other factors, such
as the social environment and stakeholder involvement (Legris & Collerette, 2006). The social
environment has in effect an impact on organisational change and has been discussed extensively in
the literature (Pettigrew, 1985, 1987; Shih, Shaw, Fu & Cheng, 2013). In fact, Pettigrew (1987, p. 656)
argues that the organisation is a social system and “may profitably be explored as a continuing system,
with a past, a present and a future”. In other words, when exploring organizational change, it is
important to grasp the ‘before-and-after’ context and the time course of the proposed change
(Pettigrew, 1985; Shih et al., 2013). With regard to stakeholder involvement in particular, it is
paramount to establish good communication in the outset, fix a starting point that everyone can agree
on, and create a demand for change, as it cannot be mandated or forced, since it would be met with
resistance (Fuchs, 2001; B. Kearns, 2004; Legris & Collerette, 2006).
2.5.1 Stakeholder Involvement
In addition to managing change when implementing IT projects, IT-enabled business change too,
requires clarity of the roles of those who are involved, have an interest or ‘stake’ in the change and
perhaps the ones who might benefit from it, in other words, the stakeholders in the organisation
(Manwani, 2008). Freeman & McVea (2001, p. 4) define stakeholders as “any group or individual
who is affected by or can affect the achievement of an organisation’s objectives”. The idea of
stakeholders and the concept of ‘stakeholder management’ and its incorporation into strategy
frameworks emerged in the mid-1980s, when a new conceptual framework was developed and
proposed by Freeman (1984). The purpose was to try and build a framework that was “responsive to
44
the concerns of managers who were being buffeted by unprecedented levels of environmental
turbulence and change” (Freeman & McVea, 2001, p. 3). Since then, academic interest has grown and
the stakeholder concept has being explored widely, in conjunction to corporate governance,
organizational theory and strategic management inter alia. Moreover, business and organisational
changes that had been dictated by globalisation and the effect the information technology had on
organisations, make it imperative to adopt a stakeholder approach (Freeman, 2004).
Amongst various internal and external stakeholders, Manwani (2008, p. 20) identifies the key
stakeholders and their roles that are critical in IT-enabled change:
I. Sponsor – this role oversees the change and the delivery of benefits
II. Business analysts – these ensure a business-driven approach to the change
III. Programme manager – this role plans and ensures delivery of the change
IV. Business change manager – this role manages the change in the business
V. Business actors – these provide knowledge of key business areas
2.6 Benefits Realisation and IT/IS Projects Evaluation
2.6.1 Benefits Realisation Concept Overview
IT/IS investment by organisations has grown exponentially over the years and continues to do so, in
order to increase their competitive advantage and improve their performance, especially with the
advent of the Internet and the proliferation of Web technologies. The investment in projects and
programmes, whether IT/IS or elsewhere, should yield or realise certain anticipated benefits in order
for the owner organisation to obtain value from this investment. Sapountzis, Harris & Kagioglou
(2008, p. 10) argue that, “the word ‘benefit’ that is used widely in everyday life, is very poorly defined
and can simply be introduced as ‘a measurable improvement’. Yates, Sapountzis, Lou & Kagioglou
(2009, p. 224) define benefit as “an outcome whose nature and value are considered advantageous by
an organisation”. Benefits could be tangible or intangible and in the case of IT/IS investments should
be linked to business change, hence, benefits should relate to outcome of such change (Manwani,
2008). Ashurst & Doherty (2003) and Ward & Peppard (2002) claim that investment in large and
complex IT/IS projects typically fails to deliver and realise any benefits, as the focus is usually on the
technology and not the business benefits that should be realised by an IT-enabled change in the
organisation.
The need therefore, to identify, monitor and manage benefits throughout a programme/project’s life-
cycle, is “being accepted as a way to ensure the success of that programme or project” (Yates et al.,
2009, p. 223). Traditionally however, IT/IS programmes/projects in both the private and public sector
are usually measured against their tangible outputs such as cost, quality and time of delivery, hence
using predominantly IT/IS investment evaluation methodologies (Lin, Huang & Cheng, 2007; Yates
et al., 2009).
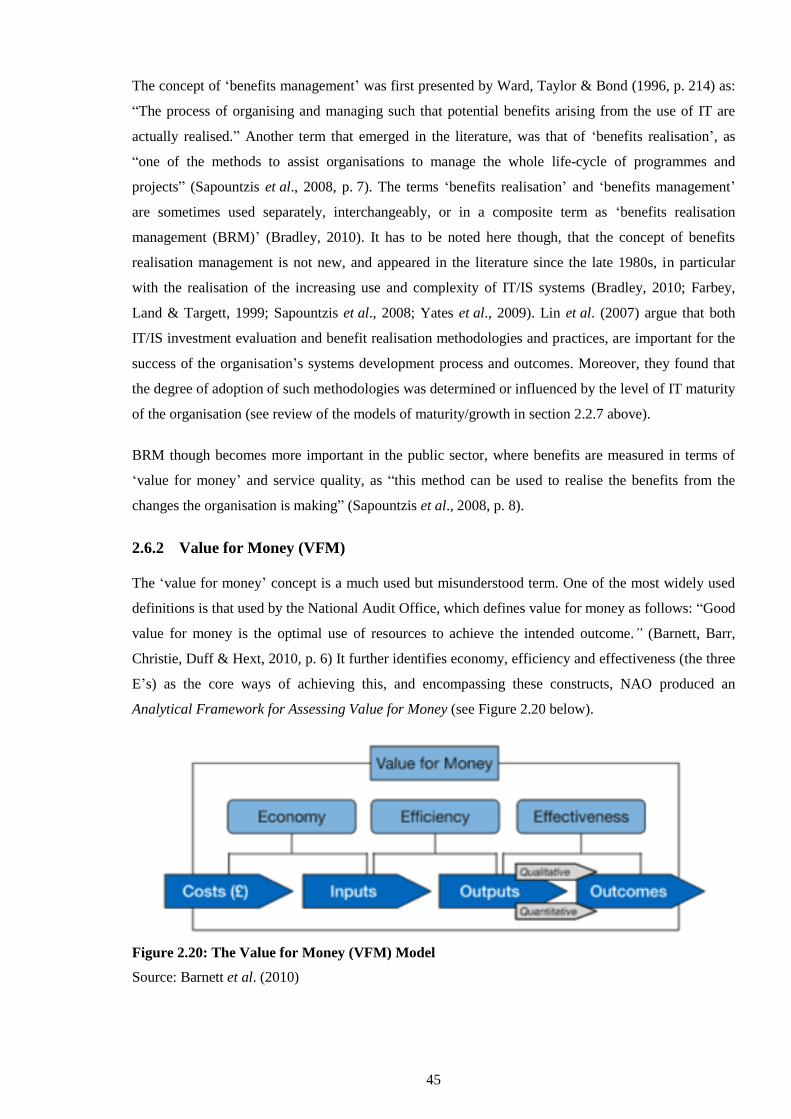
45
The concept of ‘benefits management’ was first presented by Ward, Taylor & Bond (1996, p. 214) as:
“The process of organising and managing such that potential benefits arising from the use of IT are
actually realised.” Another term that emerged in the literature, was that of ‘benefits realisation’, as
“one of the methods to assist organisations to manage the whole life-cycle of programmes and
projects” (Sapountzis et al., 2008, p. 7). The terms ‘benefits realisation’ and ‘benefits management’
are sometimes used separately, interchangeably, or in a composite term as ‘benefits realisation
management (BRM)’ (Bradley, 2010). It has to be noted here though, that the concept of benefits
realisation management is not new, and appeared in the literature since the late 1980s, in particular
with the realisation of the increasing use and complexity of IT/IS systems (Bradley, 2010; Farbey,
Land & Targett, 1999; Sapountzis et al., 2008; Yates et al., 2009). Lin et al. (2007) argue that both
IT/IS investment evaluation and benefit realisation methodologies and practices, are important for the
success of the organisation’s systems development process and outcomes. Moreover, they found that
the degree of adoption of such methodologies was determined or influenced by the level of IT maturity
of the organisation (see review of the models of maturity/growth in section 2.2.7 above).
BRM though becomes more important in the public sector, where benefits are measured in terms of
‘value for money’ and service quality, as “this method can be used to realise the benefits from the
changes the organisation is making” (Sapountzis et al., 2008, p. 8).
2.6.2 Value for Money (VFM)
The ‘value for money’ concept is a much used but misunderstood term. One of the most widely used
definitions is that used by the National Audit Office, which defines value for money as follows: “Good
value for money is the optimal use of resources to achieve the intended outcome.” (Barnett, Barr,
Christie, Duff & Hext, 2010, p. 6) It further identifies economy, efficiency and effectiveness (the three
E’s) as the core ways of achieving this, and encompassing these constructs, NAO produced an
Analytical Framework for Assessing Value for Money (see Figure 2.20 below).
Figure 2.20: The Value for Money (VFM) Model
Source: Barnett et al. (2010)
46
The VFM framework above shows the relationships between resources, inputs, outputs and outcomes
to the three E’s: Economy, Efficiency and Effectiveness. According to Barnett et al. (2010, p. 6), the
following definitions of elements apply:
Economy: ‘a measure of what goes into providing a service’. This costs inputs. Unit costs are
typically used as an economy measure. ‘The whole life costs of inputs such as the direct and
indirect costs of acquiring, running and disposing of assets or resources should be
considered’.
Efficiency: ‘a measure of productivity, in other words how much you get out in relation to
what is put in’. This examines the relationship between inputs and outputs; for example,
planned versus actual delivery of milestones by service providers, or benchmarked
comparison among programmes working to same or similar outcomes but using different
pathways to achieve intended outcomes.
Effectiveness: Qualitative and quantitative measures of increase or decrease in outcomes that
show that a programme ‘is effective in delivering its intended objectives’. This examines the
relationship between outputs and outcomes.
Furthermore, “Value for money is not about achieving the lowest initial price: it is defined as the
optimum combination of whole life costs and quality” and all public procurement of goods and
services, including works, should be based on value for money (HM Treasury, 2004, p. 17). It is
widely accepted that, when it comes to public sector performance evaluation, the ‘three Es’ key
criteria as they are often called prevail, and in theory, when combined optimally should deliver ‘value
for money’ (Bannister, 2001a).
2.6.3 BRM Approaches, Models and Frameworks
Since the mid-1990s, the significance of benefits realisation and management within different sectors
gained momentum and hence, various approaches, frameworks and models have been developed to
help organisations identify, monitor and ultimately achieve the benefits they anticipated (Yates et al.,
2009, p. 224). The most prominent ‘benefits realisation/management’ approaches/models or
frameworks in the literature, mainly in the private sector, are summarised in Table 2.1 below:
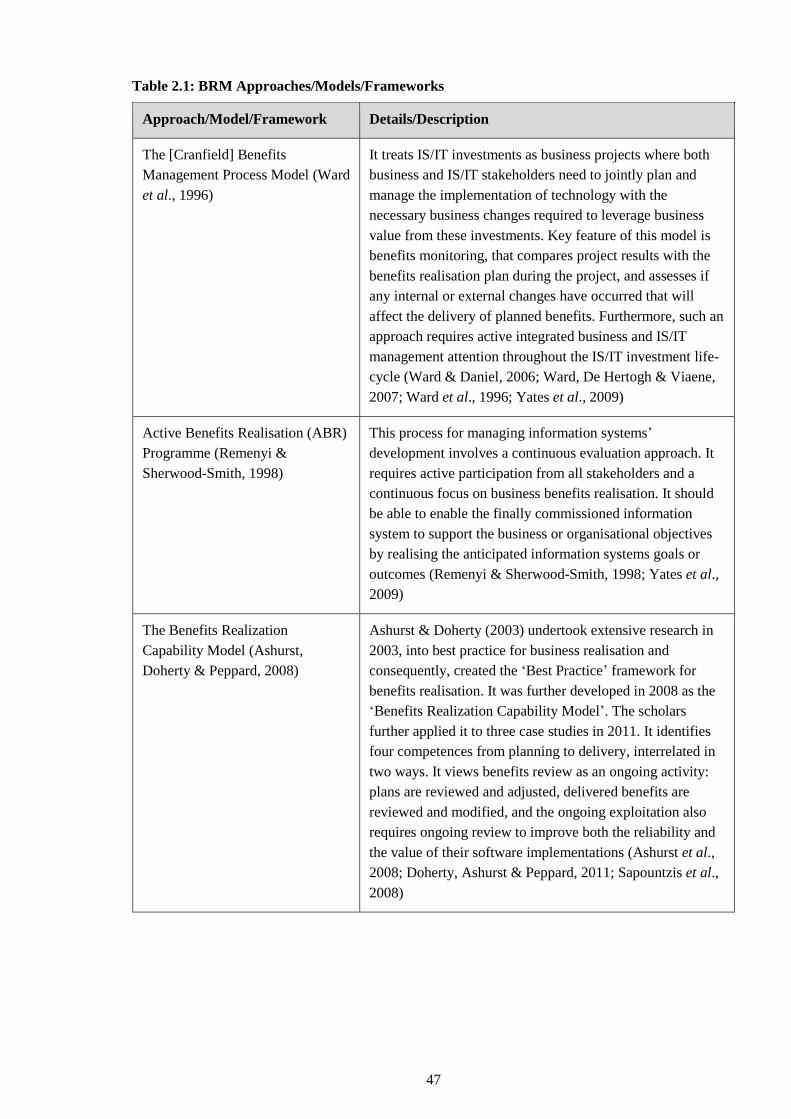
47
Table 2.1: BRM Approaches/Models/Frameworks
Approach/Model/Framework Details/Description
The [Cranfield] Benefits
Management Process Model (Ward
et al., 1996)
It treats IS/IT investments as business projects where both
business and IS/IT stakeholders need to jointly plan and
manage the implementation of technology with the
necessary business changes required to leverage business
value from these investments. Key feature of this model is
benefits monitoring, that compares project results with the
benefits realisation plan during the project, and assesses if
any internal or external changes have occurred that will
affect the delivery of planned benefits. Furthermore, such an
approach requires active integrated business and IS/IT
management attention throughout the IS/IT investment life-
cycle (Ward & Daniel, 2006; Ward, De Hertogh & Viaene,
2007; Ward et al., 1996; Yates et al., 2009)
Active Benefits Realisation (ABR)
Programme (Remenyi &
Sherwood-Smith, 1998)
This process for managing information systems’
development involves a continuous evaluation approach. It
requires active participation from all stakeholders and a
continuous focus on business benefits realisation. It should
be able to enable the finally commissioned information
system to support the business or organisational objectives
by realising the anticipated information systems goals or
outcomes (Remenyi & Sherwood-Smith, 1998; Yates et al.,
2009)
The Benefits Realization
Capability Model (Ashurst,
Doherty & Peppard, 2008)
Ashurst & Doherty (2003) undertook extensive research in
2003, into best practice for business realisation and
consequently, created the ‘Best Practice’ framework for
benefits realisation. It was further developed in 2008 as the
‘Benefits Realization Capability Model’. The scholars
further applied it to three case studies in 2011. It identifies
four competences from planning to delivery, interrelated in
two ways. It views benefits review as an ongoing activity:
plans are reviewed and adjusted, delivered benefits are
reviewed and modified, and the ongoing exploitation also
requires ongoing review to improve both the reliability and
the value of their software implementations (Ashurst et al.,
2008; Doherty, Ashurst & Peppard, 2011; Sapountzis et al.,
2008)
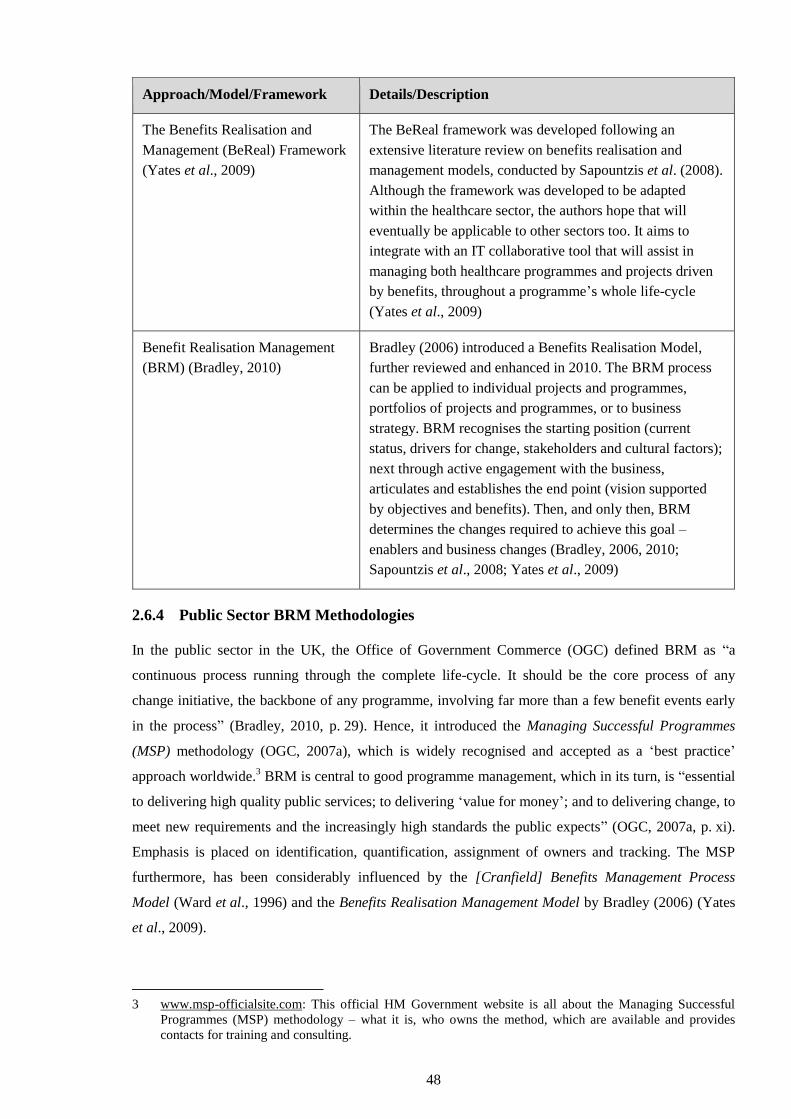
48
Approach/Model/Framework Details/Description
The Benefits Realisation and
Management (BeReal) Framework
(Yates et al., 2009)
The BeReal framework was developed following an
extensive literature review on benefits realisation and
management models, conducted by Sapountzis et al. (2008).
Although the framework was developed to be adapted
within the healthcare sector, the authors hope that will
eventually be applicable to other sectors too. It aims to
integrate with an IT collaborative tool that will assist in
managing both healthcare programmes and projects driven
by benefits, throughout a programme’s whole life-cycle
(Yates et al., 2009)
Benefit Realisation Management
(BRM) (Bradley, 2010)
Bradley (2006) introduced a Benefits Realisation Model,
further reviewed and enhanced in 2010. The BRM process
can be applied to individual projects and programmes,
portfolios of projects and programmes, or to business
strategy. BRM recognises the starting position (current
status, drivers for change, stakeholders and cultural factors);
next through active engagement with the business,
articulates and establishes the end point (vision supported
by objectives and benefits). Then, and only then, BRM
determines the changes required to achieve this goal –
enablers and business changes (Bradley, 2006, 2010;
Sapountzis et al., 2008; Yates et al., 2009)
2.6.4 Public Sector BRM Methodologies
In the public sector in the UK, the Office of Government Commerce (OGC) defined BRM as “a
continuous process running through the complete life-cycle. It should be the core process of any
change initiative, the backbone of any programme, involving far more than a few benefit events early
in the process” (Bradley, 2010, p. 29). Hence, it introduced the Managing Successful Programmes
(MSP) methodology (OGC, 2007a), which is widely recognised and accepted as a ‘best practice’
approach worldwide.3 BRM is central to good programme management, which in its turn, is “essential
to delivering high quality public services; to delivering ‘value for money’; and to delivering change, to
meet new requirements and the increasingly high standards the public expects” (OGC, 2007a, p. xi).
Emphasis is placed on identification, quantification, assignment of owners and tracking. The MSP
furthermore, has been considerably influenced by the [Cranfield] Benefits Management Process
Model (Ward et al., 1996) and the Benefits Realisation Management Model by Bradley (2006) (Yates
et al., 2009).
3 www.msp-officialsite.com: This official HM Government website is all about the Managing Successful
Programmes (MSP) methodology – what it is, who owns the method, which are available and provides
contacts for training and consulting.
49
The OGC was established in April 2000, to work with departments in order to improve their
procurement capability in areas such as major IT-enabled projects. Prior to that, HM Treasury, the
National Audit Office (NAO) and the Audit Commission, along with the House of Commons Select
Public Accounts Committees (PACs), had a long-standing responsibility to safeguard the effectiveness
and efficiency of public spending by scrutinising programmes and project initiatives (National Audit
Office & Audit Commission, 2006). With regard to ‘value for money’ assessments, their remit was,
and continues to be, the auditing of performance management and measurement systems which is the
first form of assessment, followed by the second stage of economic appraisals as set in HM Treasury’s
Green Book (Barnett et al., 2010; HM Treasury, 2003).
The OGC was the main Treasury actor involved in IT and had several relevant competences (not all
specific to IT) such as Gateway Reviews4 for major projects, which are mandatory in central civil
government (Hallsworth, Nellis & Brass, 2009). Introduced in February 2001, the Gateway Reviews
by a team of experienced peers examine the projects at key decision points in their life-cycle. A review
report is then written, for the attention of the Senior Responsible Owner (SRO), the owner/sponsor of
the relevant government department to address problems, if any. Nonetheless, the recommendations of
these reports are not compulsory and furthermore, are not being made public, hence it is difficult to
assess their impact (Hallsworth et al., 2009; Parliamentary Office of Science and Technology, 2003).
Projects are given red, amber or green status as follows (Parliamentary Office of Science and
Technology, 2003, p. 18):
Red – to achieve success the project should take remedial action immediately.
Amber – the project should go forward with actions on recommendations to be carried out
before the next OGC Gateway review.
Green – the project is on target to succeed but may benefit from the uptake of the
recommendations.
The Gateway Review process involves six Gateways or interventions (see Figure 2.21 below).
Gateway Review 0 however, is a programme-only review that is repeated throughout the programme’s
life-cycle; “it can be applied to policy implementation, business change or other types of delivery
programme involving acquisition” (National Audit Office, 2006b, p. 7). The remaining five Gateway
Reviews take place during the programme as follows; three before contract award and two looking at
service implementation and confirmation of the operational benefits (Manwani, 2008, p. 17):
Gateway 0 Strategic Assessment
Gateway 1 Business Justification
Gateway 2 Procurement Strategy
4 Similar processes exist in departments exempt from the Gateway Review Process, for example the Ministry
of Defence’s ‘Smart Acquisition’ arrangements. Departments that are exempt should periodically review
their monitoring procedures to ensure compliance with the Green Book methodology (ECOTEC, 2007).
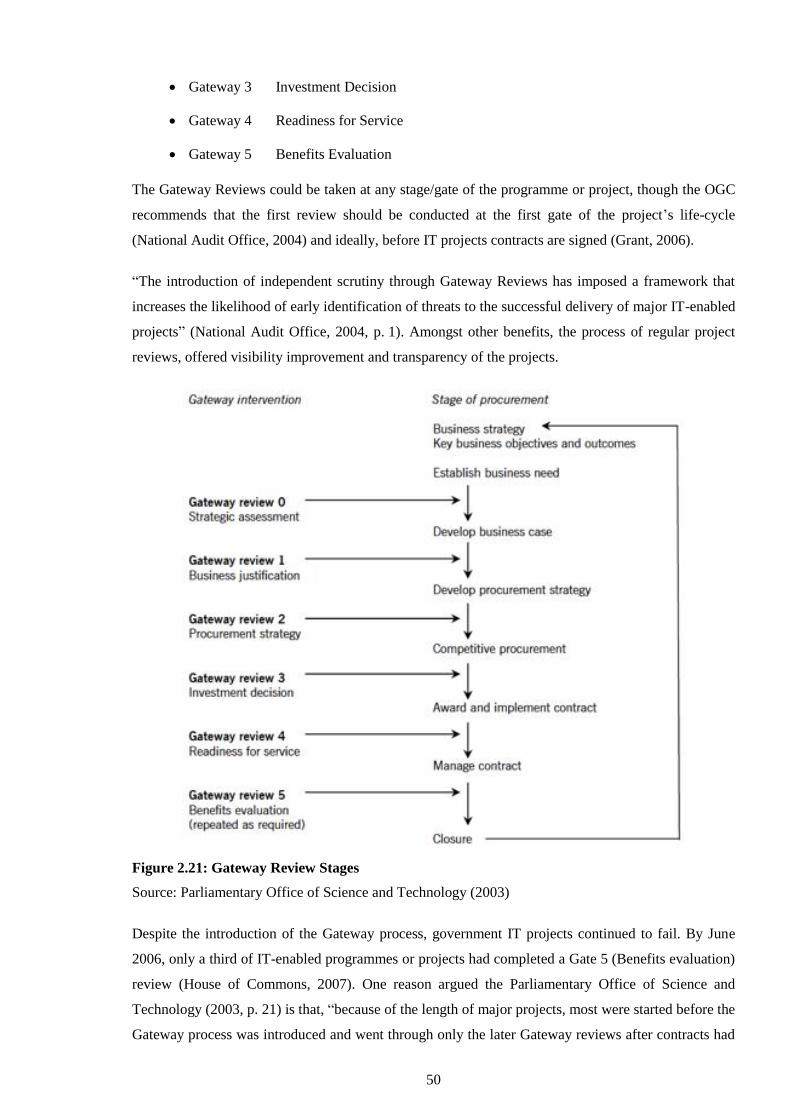
50
Gateway 3 Investment Decision
Gateway 4 Readiness for Service
Gateway 5 Benefits Evaluation
The Gateway Reviews could be taken at any stage/gate of the programme or project, though the OGC
recommends that the first review should be conducted at the first gate of the project’s life-cycle
(National Audit Office, 2004) and ideally, before IT projects contracts are signed (Grant, 2006).
“The introduction of independent scrutiny through Gateway Reviews has imposed a framework that
increases the likelihood of early identification of threats to the successful delivery of major IT-enabled
projects” (National Audit Office, 2004, p. 1). Amongst other benefits, the process of regular project
reviews, offered visibility improvement and transparency of the projects.
Figure 2.21: Gateway Review Stages
Source: Parliamentary Office of Science and Technology (2003)
Despite the introduction of the Gateway process, government IT projects continued to fail. By June
2006, only a third of IT-enabled programmes or projects had completed a Gate 5 (Benefits evaluation)
review (House of Commons, 2007). One reason argued the Parliamentary Office of Science and
Technology (2003, p. 21) is that, “because of the length of major projects, most were started before the
Gateway process was introduced and went through only the later Gateway reviews after contracts had
51
been agreed”. Hence, it becomes more difficult to correct fundamental problems as projects develop.
In the case of NHS NPfIT programme for example, the Depatment of Health (DH) failed to pay
attention to warnings and negative reports from thirty-one Gateway Reviews, including two for the
whole programme. This particular case’s explicit failure to comply highlighted the need to strengthen
governance for IT-enabled projects. Moreover, OGC only carried Gateway Reviews when requested
by the departments, and that put the power leverage by government departments and the role of the
centre respectively, under the microscope (Hallsworth et al., 2009). Concerns raised in Gateway
Reviews have remained generally the same since their introduction in 2001, and lack of evidence to
address weaknesses identified, had reduced confidence in the ability of OGC and various departments
to generate a step change in the performance of projects (National Audit Office, 2004).
2.6.5 IT/IS Projects Evaluation and Benchmarking
Bannister (2007) argues that benchmarking is as old as history. Benchmarks were originally used in
topography, to mark the spots for intermediate points in a survey of an area. They could be found on a
permanent object (e.g. in walls and pillars), as a mark indicating elevation and serving as a reference
in topographic surveys and tidal observations. (Jansen, 2005).
The IT/IS evaluation research is contradicting and vast; back in 2000, Andresen et al. (2000) identified
at least thirty such IT/IS benefits evaluation methodologies, and this number has increased
considerably since (Jenner, 2009b). Nonetheless, at the same time, there is very scarce research that
has been conducted in the public sector. The IT/IS evaluation research revolves around four broad
categories, though financial appraisal techniques prevail:
Cost focused
Benefits & value focused
Methodology focused
Holistic
These types of evaluation could be classified as follows:
Formal
Informal
Media reports
International organisations’ studies
Commissioned studies (by consultancy companies)
52
2.6.6 Evaluation and Organisational Learning
Whilst many studies have focused how to measure IT project failure, only a “few studies have
examined how project success is defined in practice, and, more to the point, the implications of
defining and measuring project success on project outcomes” (G. Thomas & Fernández, 2008, p. 734).
This in its turn, had a negative effect with regard to especially ex-post evaluations, which were
perceived as they are conducted with the sole aim of finding failures, and hence result in negative
outcomes such as embarrassment for managers, rather than being seen as a learning opportunity for the
organisation (Standing, Guilfoyle, Lin & Love, 2006; G. Thomas & Fernández, 2008). Remenyi,
Sherwood-Smith & White (1997, p. 47) proposed a definition for evaluation which is, “process based
and it directly supports management decision-making and its primary objective is the maximisation of
benefits potentially available from an information system’s investment” and which is the working
definition adopted in this thesis. Evaluations performed to forecast future impacts and support systems
justification are referred as ex-ante evaluations, whilst post-implementation evaluations that assess the
value of implementing systems, are referred to as ex-post evaluations (Remenyi et al., 1997).
With regard to organisational learning, Fortune & Peters (2005) submit that although some failures
will always occur, the vast majority is avoidable, and whilst there may be many reasons for these
failures, a major one is the inability to learn from mistakes. Hence, every single project failure must be
seen here as a learning opportunity for the organisation, which should have in place “improved
mechanisms for disseminating project experiences such that design, planning, and management
procedures” that may benefit from a continual learning process (Baldry, 1998, p. 40). In their research,
Suwardy, Ratnatunga, Sohal & Speight (2003) found that, “lessons learned collectively from ‘most
successful’ and ‘least successful’ projects can help an organisation navigate the complexity and risks
associated with IT investments” (pp. 325-326). The term ‘organisational learning’ was coined for the
first time in 1978 by Argyris & Schön (1978), and the main drive of their argument is that
organisational learning involves the detection and correction of error (Argyris & Schön, 1999; Fortune
& Peters, 2005). The potential of the organisation to learn through feedback on the consequences of its
own actions derived from cybernetics and was propagated by Argyris & Schön (1978) through the
concepts of single-and double-loop learning. “These refer first to the correction of error within a given
set of governing variables, and second to the process of changing the governing variables themselves.”
(Easterby-Smith, 1997, p. 1090) On explaining development and implementing change in
organisations, proponents of the teleology theory view organisational development as a “repetitive
sequence of goal formulation, implementation, evaluation, and modification of goals based on what
was learned or intended by the entity” (Van de Ven & Poole, 1995, p. 516). According to Van de Ven
& Sun (2011), learning is ‘short-circuited’ when either actions or reflections are missing and indeed,
“the action and reflection strategies are highly related, for they represent the core activities in a
cyclical process of trial-and-error learning while implementing change” (p. 59).
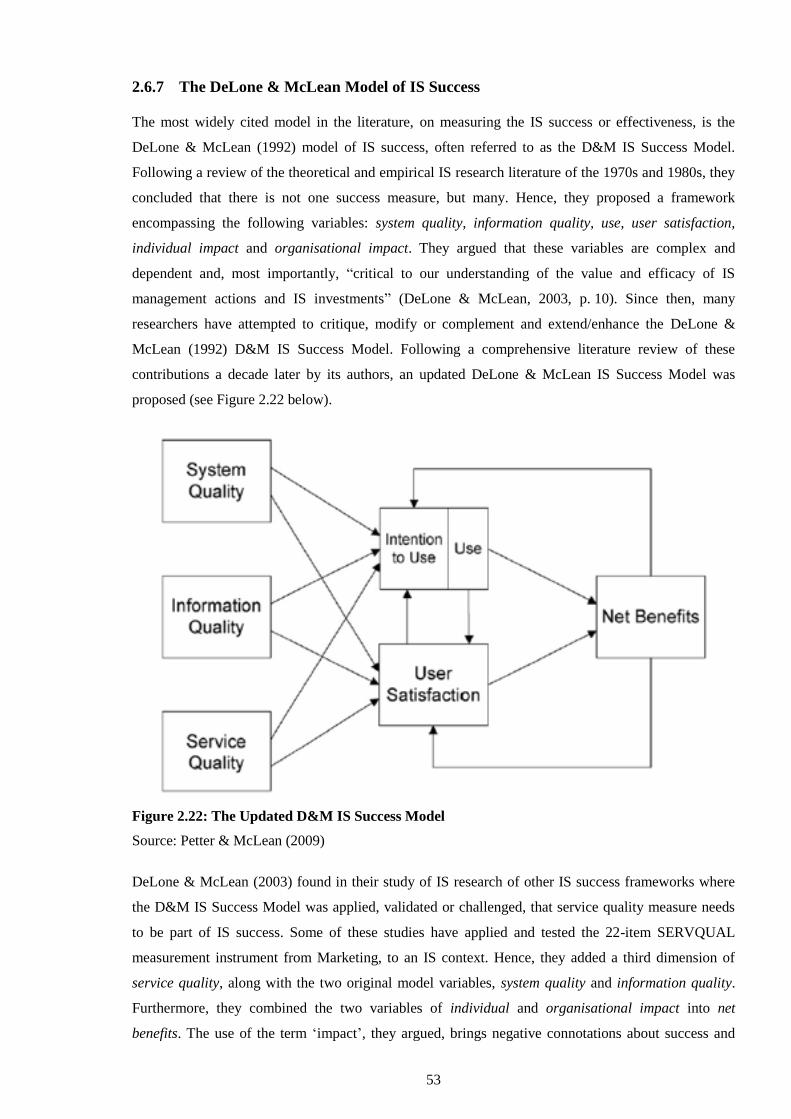
53
2.6.7 The DeLone & McLean Model of IS Success
The most widely cited model in the literature, on measuring the IS success or effectiveness, is the
DeLone & McLean (1992) model of IS success, often referred to as the D&M IS Success Model.
Following a review of the theoretical and empirical IS research literature of the 1970s and 1980s, they
concluded that there is not one success measure, but many. Hence, they proposed a framework
encompassing the following variables: system quality, information quality, use, user satisfaction,
individual impact and organisational impact. They argued that these variables are complex and
dependent and, most importantly, “critical to our understanding of the value and efficacy of IS
management actions and IS investments” (DeLone & McLean, 2003, p. 10). Since then, many
researchers have attempted to critique, modify or complement and extend/enhance the DeLone &
McLean (1992) D&M IS Success Model. Following a comprehensive literature review of these
contributions a decade later by its authors, an updated DeLone & McLean IS Success Model was
proposed (see Figure 2.22 below).
Figure 2.22: The Updated D&M IS Success Model
Source: Petter & McLean (2009)
DeLone & McLean (2003) found in their study of IS research of other IS success frameworks where
the D&M IS Success Model was applied, validated or challenged, that service quality measure needs
to be part of IS success. Some of these studies have applied and tested the 22-item SERVQUAL
measurement instrument from Marketing, to an IS context. Hence, they added a third dimension of
service quality, along with the two original model variables, system quality and information quality.
Furthermore, they combined the two variables of individual and organisational impact into net
benefits. The use of the term ‘impact’, they argued, brings negative connotations about success and
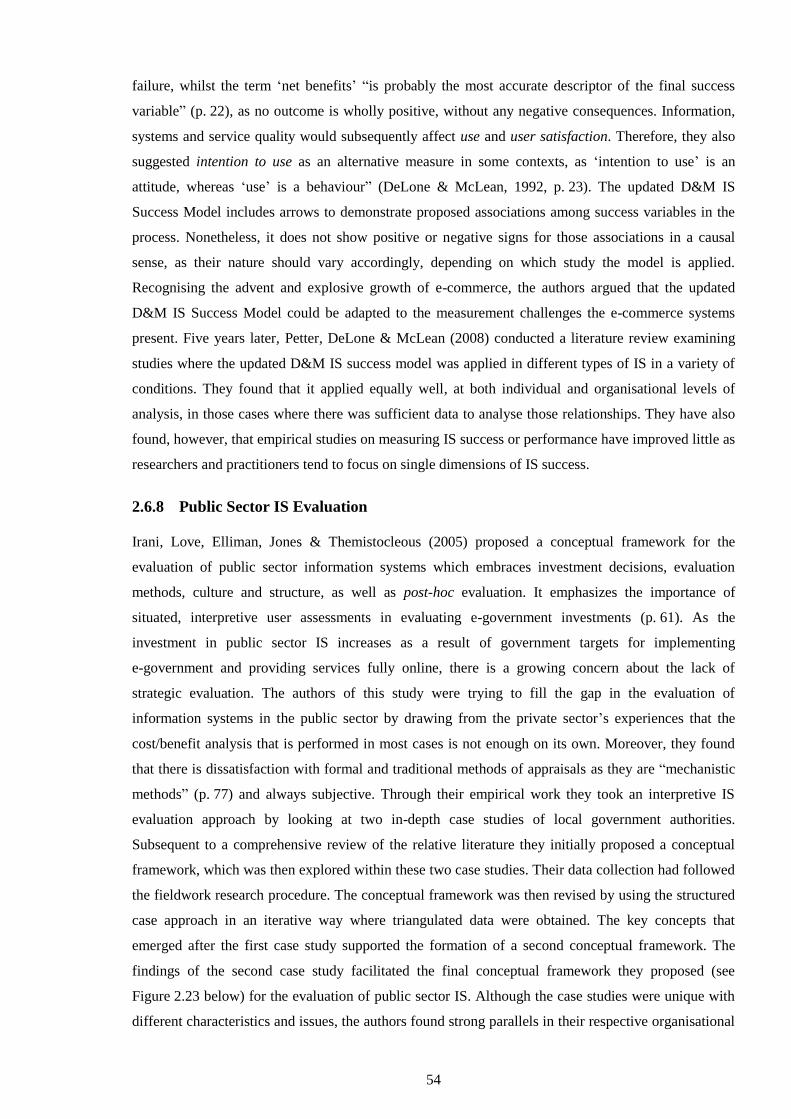
54
failure, whilst the term ‘net benefits’ “is probably the most accurate descriptor of the final success
variable” (p. 22), as no outcome is wholly positive, without any negative consequences. Information,
systems and service quality would subsequently affect use and user satisfaction. Therefore, they also
suggested intention to use as an alternative measure in some contexts, as ‘intention to use’ is an
attitude, whereas ‘use’ is a behaviour” (DeLone & McLean, 1992, p. 23). The updated D&M IS
Success Model includes arrows to demonstrate proposed associations among success variables in the
process. Nonetheless, it does not show positive or negative signs for those associations in a causal
sense, as their nature should vary accordingly, depending on which study the model is applied.
Recognising the advent and explosive growth of e-commerce, the authors argued that the updated
D&M IS Success Model could be adapted to the measurement challenges the e-commerce systems
present. Five years later, Petter, DeLone & McLean (2008) conducted a literature review examining
studies where the updated D&M IS success model was applied in different types of IS in a variety of
conditions. They found that it applied equally well, at both individual and organisational levels of
analysis, in those cases where there was sufficient data to analyse those relationships. They have also
found, however, that empirical studies on measuring IS success or performance have improved little as
researchers and practitioners tend to focus on single dimensions of IS success.
2.6.8 Public Sector IS Evaluation
Irani, Love, Elliman, Jones & Themistocleous (2005) proposed a conceptual framework for the
evaluation of public sector information systems which embraces investment decisions, evaluation
methods, culture and structure, as well as post-hoc evaluation. It emphasizes the importance of
situated, interpretive user assessments in evaluating e-government investments (p. 61). As the
investment in public sector IS increases as a result of government targets for implementing
e-government and providing services fully online, there is a growing concern about the lack of
strategic evaluation. The authors of this study were trying to fill the gap in the evaluation of
information systems in the public sector by drawing from the private sector’s experiences that the
cost/benefit analysis that is performed in most cases is not enough on its own. Moreover, they found
that there is dissatisfaction with formal and traditional methods of appraisals as they are “mechanistic
methods” (p. 77) and always subjective. Through their empirical work they took an interpretive IS
evaluation approach by looking at two in-depth case studies of local government authorities.
Subsequent to a comprehensive review of the relative literature they initially proposed a conceptual
framework, which was then explored within these two case studies. Their data collection had followed
the fieldwork research procedure. The conceptual framework was then revised by using the structured
case approach in an iterative way where triangulated data were obtained. The key concepts that
emerged after the first case study supported the formation of a second conceptual framework. The
findings of the second case study facilitated the final conceptual framework they proposed (see
Figure 2.23 below) for the evaluation of public sector IS. Although the case studies were unique with
different characteristics and issues, the authors found strong parallels in their respective organisational
55
views. These experiences led to their conclusion that “information systems evaluation in the public
sector is a process of experiential and subjective judgement, which is grounded in opinion and world
views” (p. 61).
Figure 2.23: Framework for Public Sector IS evaluation
Source: Irani et al. (2005)
The purpose of adopting a structured case approach was “to discover and discuss relationships
between concepts, so as to build a ‘web of meaning’ and learning in this instance, with respect to the
human and organisational issues of information systems evaluation” (p. 66). The building of a series
of conceptual frameworks in this applied research study demonstrated a process of knowledge creation
and understanding of the various issues that surround the phenomena. The authors also exhibited a
series of lessons learned and discussed the limitations of the generalisation of the framework
proposed, made recommendations of its application in a wider stakeholder community as the public
sector encompasses a number of diverse agencies, and implications for further research.
In contrast to the conceptual framework above, Frisk, Bannister & Lindgren (2015) proposed most
recently an ex ante IS investment evaluation approach fit for the public sector in particular, “by
changing perspective from a focus on traditional analytic tools towards a design attitude that seeks to
develop multi-criteria IS evaluation approach based on contextual experience and prior knowledge”
(p. 276). Their approach enables organisations to design and develop a value case by using value dials
as a common language that defines what comprises the value of a particular IS investment for a
specific context. According to Arviansyah (2015, p. 56), “context relates to the organisational
multilevel systems and structures, such as the social, political, economic environment, cultural
characteristics, or any related methodologies and processes”. These complex characteristics make this
approach particularly valuable in the public sector, where also profit is rarely a factor as mentioned
elsewhere in this research and hence, difficult to assess (Córdoba-Pachón, 2015; Frisk et al., 2015). By
using a multilevel dialogical action research project within a Swedish public organisation, Frisk et al.
(2015) found that their proposed approach aided managers in this organisation to significantly improve
the effectiveness of their evaluation of IS investments.
56
2.6.9 International e-Government Benchmarking
It is widely claimed that providing an effective e-government assessment framework is a necessary
condition for advancing e-government. Bhatnagar (2004) argues that many successful applications
demonstrate that it is important to identify measurable benefits. Likewise, the post-implementation
audit of benefits, particularly feedback from clients, allows for improvements that add value and
expand the client base. Various benchmarks for evaluating, measuring and assessing e-government
proposals and projects have been explored over time and new ones are being published every year by
the private sector, government and scholars alike. “In addition to e-government benchmarks, there is
also a large and growing body of related activities including benchmarks of phenomena like the
information society and e-readiness as well as many e-government evaluation exercises” (p. 172).
With regard to international comparisons and benchmarking, the United Nations (UN) publishes
regularly global e-Government Readiness and e-Participation indices every couple of years. The
e-Government Readiness Index in particular, was developed in order to take specific account of all
countries including developing nations, many of which have only recently embarked on e-government
programmes, as opposed to impact measurement approaches (Millard, 2007). For example, in 2008,
the UK was ranked 10th in the United Nations e-Government Readiness Index (compared to 4th in
2005), and 25th in the UN’s e-Participation Index (1st in 2005) (Hallsworth et al., 2009). The latest
UN e-Government Survey was published in 2012 where the UK comes third in the world on
e-government readiness, following South Korea and the Netherlands at first and second place
respectively. Denmark, the USA, France and Sweden follow close behind among the global leaders
(United Nations, 2012). The Organisation for Economic Co-operation and Development (OECD) also
conducts and publishes e -government surveys and country reports with regard the sophistication – and
the citizens’ take-up – of e-services (OECD, 2008, 2010, 2011). Meanwhile, the European
Commission (EC) conducts and publishes its own surveys for European countries, the latest of which
was published in 2011, in conjunction with CapGemini. Similar to the findings of the aforementioned
UN survey, the UK, the Netherlands and Denmark are leaders when it comes to the number of people
and their preference of using online channels in contacting government (European Commission,
2013).
The aim of these international surveys and reports are to highlight best practices in e-government,
changes in technology and other factors for government leaders and e-government policy makers to
learn from each other. Nonetheless, Bannister (2007) argues that there is always the question of scope
and scale. With regard to scope for example, some benchmarking surveys are global and some are
regional covering specific countries, like the member states in the European Union, “set to meet the
specific purpose of monitoring progress in certain aspects of e-government” (p. 177). When it comes
to the dimension of scale, some benchmarking exercises, such as the ones carried out regularly by
Accenture between 2000 and 2006 (Accenture, 2005), select a number of countries, whilst the UN
surveys cover the entire world. In their assessment of eighteen international e-government
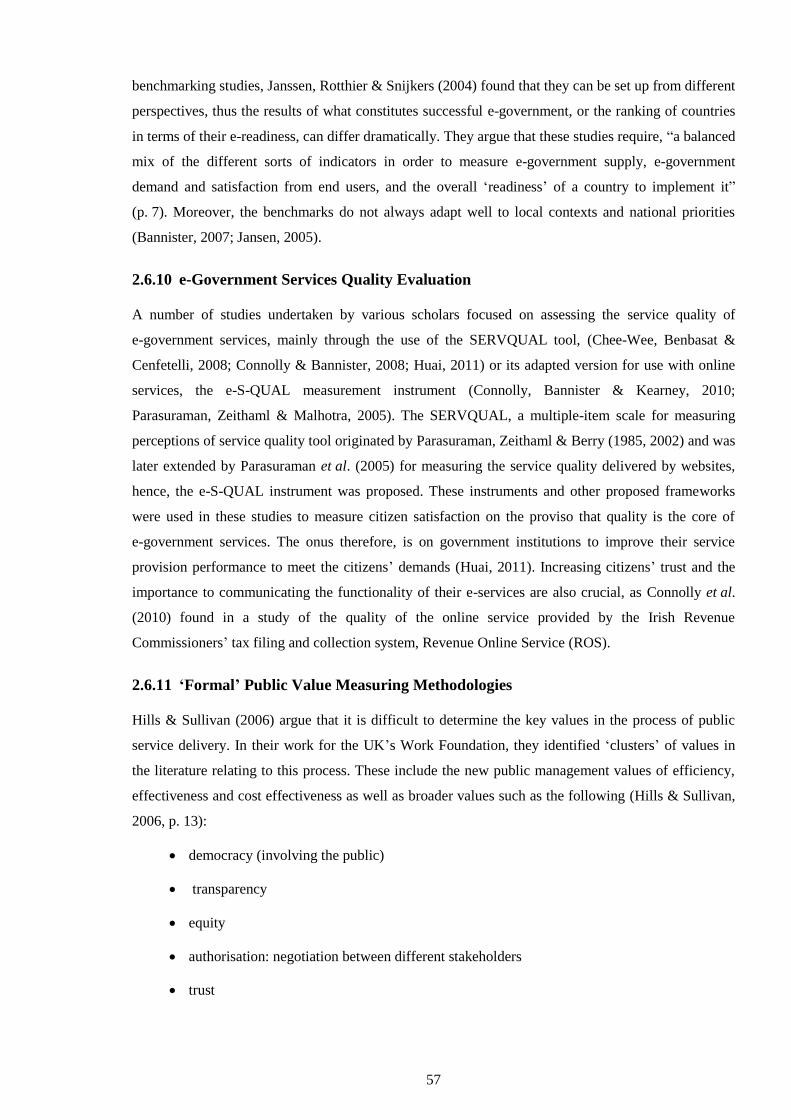
57
benchmarking studies, Janssen, Rotthier & Snijkers (2004) found that they can be set up from different
perspectives, thus the results of what constitutes successful e-government, or the ranking of countries
in terms of their e-readiness, can differ dramatically. They argue that these studies require, “a balanced
mix of the different sorts of indicators in order to measure e-government supply, e-government
demand and satisfaction from end users, and the overall ‘readiness’ of a country to implement it”
(p. 7). Moreover, the benchmarks do not always adapt well to local contexts and national priorities
(Bannister, 2007; Jansen, 2005).
2.6.10 e-Government Services Quality Evaluation
A number of studies undertaken by various scholars focused on assessing the service quality of
e-government services, mainly through the use of the SERVQUAL tool, (Chee-Wee, Benbasat &
Cenfetelli, 2008; Connolly & Bannister, 2008; Huai, 2011) or its adapted version for use with online
services, the e-S-QUAL measurement instrument (Connolly, Bannister & Kearney, 2010;
Parasuraman, Zeithaml & Malhotra, 2005). The SERVQUAL, a multiple-item scale for measuring
perceptions of service quality tool originated by Parasuraman, Zeithaml & Berry (1985, 2002) and was
later extended by Parasuraman et al. (2005) for measuring the service quality delivered by websites,
hence, the e-S-QUAL instrument was proposed. These instruments and other proposed frameworks
were used in these studies to measure citizen satisfaction on the proviso that quality is the core of
e-government services. The onus therefore, is on government institutions to improve their service
provision performance to meet the citizens’ demands (Huai, 2011). Increasing citizens’ trust and the
importance to communicating the functionality of their e-services are also crucial, as Connolly et al.
(2010) found in a study of the quality of the online service provided by the Irish Revenue
Commissioners’ tax filing and collection system, Revenue Online Service (ROS).
2.6.11 ‘Formal’ Public Value Measuring Methodologies
Hills & Sullivan (2006) argue that it is difficult to determine the key values in the process of public
service delivery. In their work for the UK’s Work Foundation, they identified ‘clusters’ of values in
the literature relating to this process. These include the new public management values of efficiency,
effectiveness and cost effectiveness as well as broader values such as the following (Hills & Sullivan,
2006, p. 13):
democracy (involving the public)
transparency
equity
authorisation: negotiation between different stakeholders
trust
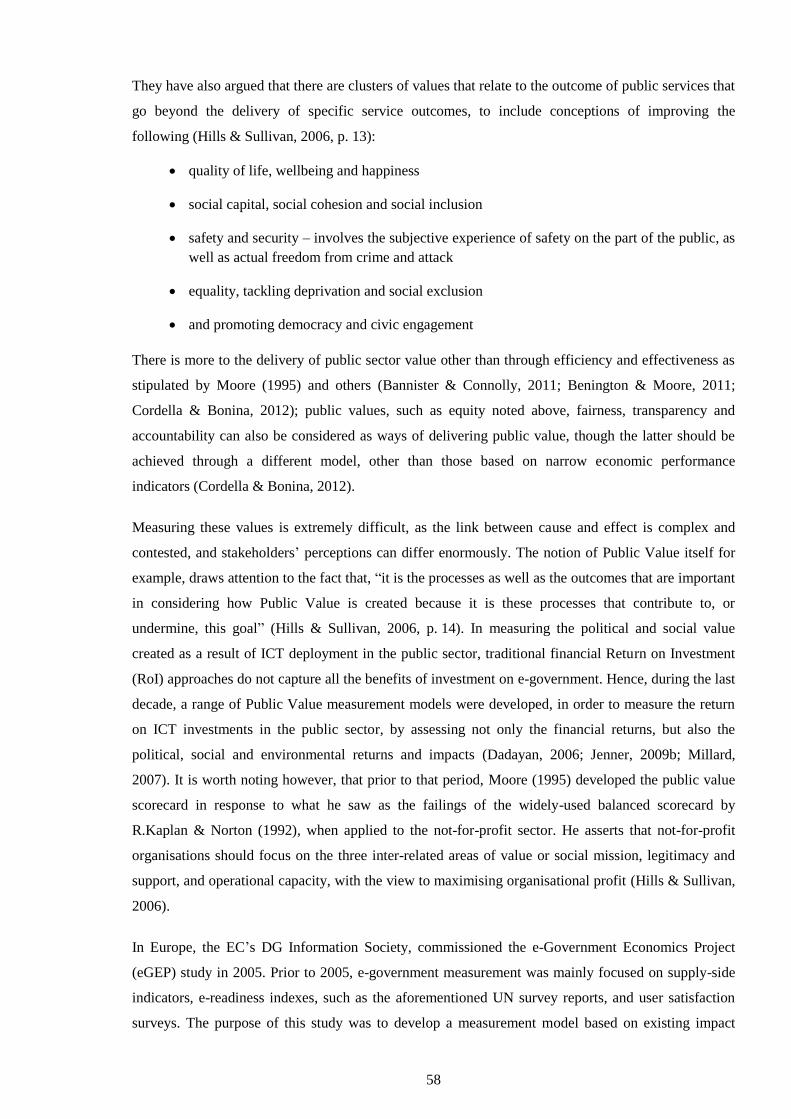
58
They have also argued that there are clusters of values that relate to the outcome of public services that
go beyond the delivery of specific service outcomes, to include conceptions of improving the
following (Hills & Sullivan, 2006, p. 13):
quality of life, wellbeing and happiness
social capital, social cohesion and social inclusion
safety and security – involves the subjective experience of safety on the part of the public, as
well as actual freedom from crime and attack
equality, tackling deprivation and social exclusion
and promoting democracy and civic engagement
There is more to the delivery of public sector value other than through efficiency and effectiveness as
stipulated by Moore (1995) and others (Bannister & Connolly, 2011; Benington & Moore, 2011;
Cordella & Bonina, 2012); public values, such as equity noted above, fairness, transparency and
accountability can also be considered as ways of delivering public value, though the latter should be
achieved through a different model, other than those based on narrow economic performance
indicators (Cordella & Bonina, 2012).
Measuring these values is extremely difficult, as the link between cause and effect is complex and
contested, and stakeholders’ perceptions can differ enormously. The notion of Public Value itself for
example, draws attention to the fact that, “it is the processes as well as the outcomes that are important
in considering how Public Value is created because it is these processes that contribute to, or
undermine, this goal” (Hills & Sullivan, 2006, p. 14). In measuring the political and social value
created as a result of ICT deployment in the public sector, traditional financial Return on Investment
(RoI) approaches do not capture all the benefits of investment on e-government. Hence, during the last
decade, a range of Public Value measurement models were developed, in order to measure the return
on ICT investments in the public sector, by assessing not only the financial returns, but also the
political, social and environmental returns and impacts (Dadayan, 2006; Jenner, 2009b; Millard,
2007). It is worth noting however, that prior to that period, Moore (1995) developed the public value
scorecard in response to what he saw as the failings of the widely-used balanced scorecard by
R.Kaplan & Norton (1992), when applied to the not-for-profit sector. He asserts that not-for-profit
organisations should focus on the three inter-related areas of value or social mission, legitimacy and
support, and operational capacity, with the view to maximising organisational profit (Hills & Sullivan,
2006).
In Europe, the EC’s DG Information Society, commissioned the e-Government Economics Project
(eGEP) study in 2005. Prior to 2005, e-government measurement was mainly focused on supply-side
indicators, e-readiness indexes, such as the aforementioned UN survey reports, and user satisfaction
surveys. The purpose of this study was to develop a measurement model based on existing impact
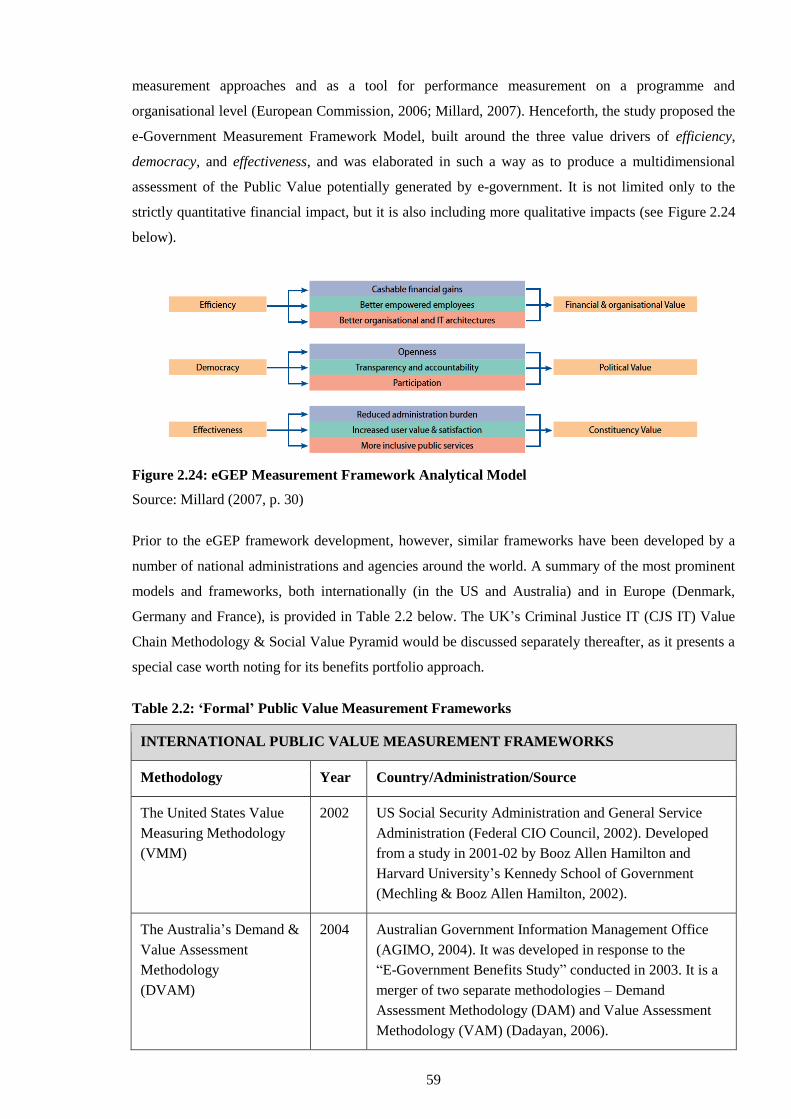
59
measurement approaches and as a tool for performance measurement on a programme and
organisational level (European Commission, 2006; Millard, 2007). Henceforth, the study proposed the
e-Government Measurement Framework Model, built around the three value drivers of efficiency,
democracy, and effectiveness, and was elaborated in such a way as to produce a multidimensional
assessment of the Public Value potentially generated by e-government. It is not limited only to the
strictly quantitative financial impact, but it is also including more qualitative impacts (see Figure 2.24
below).
Figure 2.24: eGEP Measurement Framework Analytical Model
Source: Millard (2007, p. 30)
Prior to the eGEP framework development, however, similar frameworks have been developed by a
number of national administrations and agencies around the world. A summary of the most prominent
models and frameworks, both internationally (in the US and Australia) and in Europe (Denmark,
Germany and France), is provided in Table 2.2 below. The UK’s Criminal Justice IT (CJS IT) Value
Chain Methodology & Social Value Pyramid would be discussed separately thereafter, as it presents a
special case worth noting for its benefits portfolio approach.
Table 2.2: ‘Formal’ Public Value Measurement Frameworks
INTERNATIONAL PUBLIC VALUE MEASUREMENT FRAMEWORKS
Methodology Year Country/Administration/Source
The United States Value
Measuring Methodology
(VMM)
2002 US Social Security Administration and General Service
Administration (Federal CIO Council, 2002). Developed
from a study in 2001-02 by Booz Allen Hamilton and
Harvard University’s Kennedy School of Government
(Mechling & Booz Allen Hamilton, 2002).
The Australia’s Demand &
Value Assessment
Methodology
(DVAM)
2004 Australian Government Information Management Office
(AGIMO, 2004). It was developed in response to the
“E-Government Benefits Study” conducted in 2003. It is a
merger of two separate methodologies – Demand
Assessment Methodology (DAM) and Value Assessment
Methodology (VAM) (Dadayan, 2006).
60
EUROPEAN PUBLIC VALUE MEASUREMENT FRAMEWORKS
Methodology Year Country/Administration/ Source
The Danish ‘eGovernment
signposts’ methodology
2004 Danish Digital Task Force (Danish Digital Task Force,
2004). It relies on a series of Key Performance Indicators
(KPIs) and takes into account the dimension of impact as a
secondary analytical element (CJIT, 2007; Millard, 2007).
The German WiBe
Measurement Framework
2004 German Federal Ministry of the Interior (German Federal
Ministry of the Interior, 2004). It seeks to map both
monetisable and non-monetisable efficiency gains, not only
for public administrations but also for their constituencies
(CJIT, 2007; Millard, 2007).
The French MAREVA
Measurement Framework
2005 Agency for the Development of Electronic Administration
(ADAE, 2005). Like MAREVA, it seeks to map both
monetisable and non-monetisable efficiency gains, not only
for public administrations but also for their constituencies
(CJIT, 2007; Millard, 2007).
In the case of the UK, the business model methodology CJIT (2007), “breaks down benefits clearly
between different actors, thereby distinguishing two separate measurement categories for service users
on the one hand and for the society/country as a whole on the other. In addition, it includes a third
category, mapping the internal benefits achieved by the government and public services, thus
monitoring the impact of e-government on each of these three actors” (Millard, 2007, p. 29).
The UK government has invested an “unparalleled” £2.24 billion in the Criminal Justice System
Information Technology (CJIT) programme, with the aim to reduce unnecessary paperwork and speed
up processes, by harnessing IT to join up the criminal system (Sutton, 2005, p. iv). The bodies
involved include the Crown Prosecution Service, the courts, probation service, youth offending teams,
the police and prisons inter alia (Davies, 2005). The CJIT programme was part of the U.K. Office for
Criminal Justice Reform (OCJR), a cross-departmental team covering the Home Office, the
Department for Constitutional Affairs and the Attorney General’s Office (Di Maio, 2005). It was
established by the 2002 Spending Review with a range of targets to meet, leading up to 2008, at the
cost of initially £1.2 billion (e-Gov Unit/CJIT, 2006). Nonetheless, after two years roll-on, costs were
escalating with no benefits to show. Hence, a portfolio approach was established by creating an
Independent Portfolio Unit to conduct a proper investment appraisal by evaluating business cases for
projects against their investment principles. This process used an appraisal tool called the Proving
Model, which emerged from a two-year study by Cranfield University into the causes of project
failure, “which concluded that on most occasions crucial flaws were obvious before the projects were
authorised” (Jenner, 2006, p. 20). The benefits realisation management approach adopted by CJIT
covers the entire life-cycle, from business case submission to actual benefit realisation assessment, and
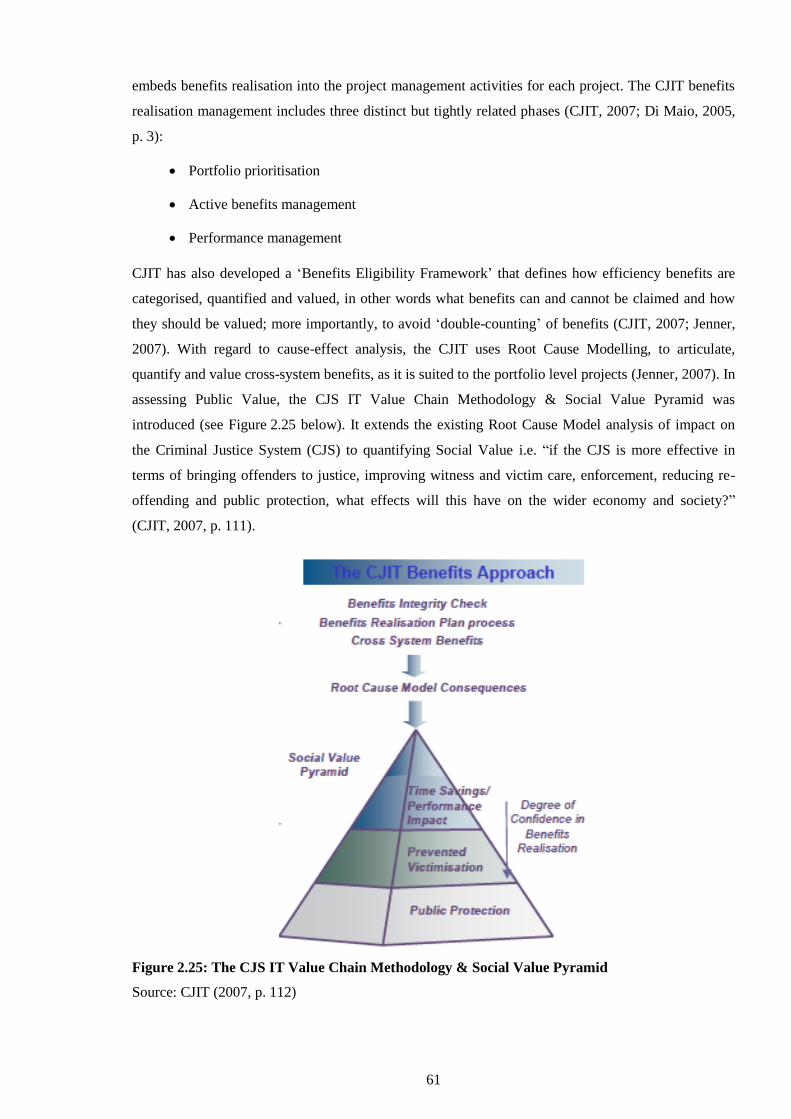
61
embeds benefits realisation into the project management activities for each project. The CJIT benefits
realisation management includes three distinct but tightly related phases (CJIT, 2007; Di Maio, 2005,
p. 3):
Portfolio prioritisation
Active benefits management
Performance management
CJIT has also developed a ‘Benefits Eligibility Framework’ that defines how efficiency benefits are
categorised, quantified and valued, in other words what benefits can and cannot be claimed and how
they should be valued; more importantly, to avoid ‘double-counting’ of benefits (CJIT, 2007; Jenner,
2007). With regard to cause-effect analysis, the CJIT uses Root Cause Modelling, to articulate,
quantify and value cross-system benefits, as it is suited to the portfolio level projects (Jenner, 2007). In
assessing Public Value, the CJS IT Value Chain Methodology & Social Value Pyramid was
introduced (see Figure 2.25 below). It extends the existing Root Cause Model analysis of impact on
the Criminal Justice System (CJS) to quantifying Social Value i.e. “if the CJS is more effective in
terms of bringing offenders to justice, improving witness and victim care, enforcement, reducing re-
offending and public protection, what effects will this have on the wider economy and society?”
(CJIT, 2007, p. 111).
Figure 2.25: The CJS IT Value Chain Methodology & Social Value Pyramid
Source: CJIT (2007, p. 112)
62
Social impacts of projects and of policymaking cannot be ignored, and the HM Treasury’s Green Book
is clear that wider social and environmental impacts must be brought into the assessment as far as
possible (Fujiwara & Campbell, 2011; HM Treasury, 2003, 2011). Social cost-benefit analysis still
relies on economics techniques to elicit values, and a full evaluation methodology is still being
developed according to a study by Fujiwara & Campbell (2011) that was commissioned by HM
Treasury and the DWP in 2011. Hence, the HM Treasury Green Book was updated accordingly to
include the evaluation of non-market goods.
The CJIT was one of the largest IT-enabled business change programmes in Europe and the guidebook
Managing the Portfolio, Realising the Benefits which outlines the approach that was adopted to
manage the CJS IT portfolio has won many accolades, including the 2007 Civil Service award. It is
considered a best practice case in the UK, has attracted interest internationally, and contributed to the
UK’s approach to the appraisal and evaluation of e-government projects and benefits realisation.
Although all of the public value methodologies reviewed above vary widely in terms of variables used
and their specification, they have similarities in that they identify three sources of Public Value (CJIT,
2007, p. 107):
Outcomes (Effectiveness)
Services (Efficiency) and,
Public trust/legitimacy (Political & Social Value)
They also take into consideration, “a package of both tangible and intangible factors when assessing
investments in the public sector – cost (analysis of both financial and non-financial investment cost),
benefit/value (assessment of both financial and non-financial benefits and value), and risk (assessment
of potential risks)” (Dadayan, 2006, p. 9). That shows that e-government benchmarking has shifted
dramatically over the last decade to include service use and take-up rather than just availability. Most
importantly, the issues of efficiency and effectiveness take centre stage as it is observed by the wide
variety of strategic and operational approaches employed by the various nations examined herewith.
By synthesising this variety of approaches, a number of key points can be drawn (Millard, 2007,
p. 29):
The existence of a consistent national Efficiency and Effectiveness policy
The existence of a national e-government measurement framework
The results obtained through the introduction of a national Efficiency and Effectiveness
policy and/or of a measurement tool
The existence of a national policy promoting the exchange of good practices among
administrations
63
Nevertheless, whilst there is normative guidance on best practice, there are relatively few
comprehensive case studies, and little up-to-date empirical evidence of ‘what works’. There is also the
case of the current state of play in terms of practical application of recommended practice, and its
impact, in terms of improved benefits realisation in the public sector.
2.7 IT and e-Government Projects Challenges
2.7.1 Defining Success and Failure
The management of IT projects is a challenging task, with many of them being documented as failing
to achieve their intended objectives. A number of projects never materialise, others are running late
and/or over budget, and those that are implemented, often fail to deliver (Fortune & Peters, 2005;
Standing et al., 2006). Nonetheless, there is still no concise, widely accepted definition of IT project
failure in the literature (Standing et al., 2006; Thomas & Fernández, 2008), and very often success and
failure are seen as ‘black and white’ (Wateridge, 1998). Hence, success and failure are difficult to
define and measure as they mean different things to different people (G. Thomas & Fernández, 2008).
In an attempt to define failure, Standing et al. (2006) found that the key reasons for project failure in
the literature include ineffective leadership, lack of support from the IT department, changed user
requirements, and the project size and complexity. In addition, for effective project outcomes, the
major project risks have to be managed during the project life-cycle.
Similarly, what constitutes project success is as complex to define as failure (Standing et al., 2006).
By examining closer a few cases where failure was said to have occurred, Fortune & Peters (2005)
offer a common sense, simpler definition of what something that is not a failure, i.e. a success, might
look like (p. 13):
The system achieved what was intended of it; it was operational at the time and cost that
were planned; the project team and the users are pleased with the result and they continue
to be satisfied afterwards.
The above definition could be complemented by the one offered by Pather, Remenyi & Remenyi
(2011, p. 5) on what constitutes IS success:
A successful IS favourably accomplishes the aims which underpin its conceptualisation
and design. In a business context, this implies that it should be able to consistently fulfil
the business goals and objectives for which it was designed or purchased. Furthermore, a
successful IS facilitates the accrual of both tangible and intangible benefits to the
business.
The criteria for success are much wider, argues Wateridge (1998), and not all of them would be
appropriate for all projects. Furthermore, incorporating the views of all stakeholders such as the users,
sponsors and the project team members, and agreeing the criteria with them, is equally important.
Nevertheless, this is hardly the case; in most projects, meeting time and budget targets are more
important than meeting other long-term criteria such as delivering a quality system to users (Fortune &
64
Peters, 2005; Standing et al., 2006; Wateridge, 1998). There is also the case that our understanding of
project success has evolved over the past forty years, “from definitions that were limited to the
implementation phase of the project life-cycle to definitions that reflect an appreciation of success
over the project and product life-cycle” (Jugdev & Muller, 2005, p. 19). Jugdev & Muller (2005)
identified four periods in that time, each widening the various definitions of success, and noted that
since the 1980s in particular, Critical Success Factors (CSFs) lists and later frameworks, became
popular (Turner & Müller, 2005). In addition, Remenyi et al. (1997, p. xiii) argue it has become clear
that: “The difference between success and failure with information systems and thus, the level of
return which they produce, lies to a large extent in the way the systems are developed and
implemented.”
2.7.2 The Standish Group CHAOS Reports
In an attempt to analyse how to manage successful IT projects, the Standish Group has published its
famous CHAOS report every two years since 1994, and has studied over 70,000 projects in more than
sixteen years (The Standish Group, 2010). These reports have attracted attention and been cited
widely, whilst at the same time creating controversy. These reports are often used to indicate problems
in application software development project management and in particular, to identify the following
(The Standish Group, 1995, p. 1):
The scope of software project failures
The major factors that cause software projects to fail
The key ingredients that can reduce project failures
The Standish Group research in their first report in 1994 showed that 31.1 percent of projects were
cancelled before they were ever got completed, and 52.7 percent of projects would have cost 189
percent of their original estimates. On the success side, they reported that 16.2 percent of software
projects were completed on time and on budget, with a staggering figure of only 9 percent when it
came to large projects (Eveleens & Verhoef, 2010; The Standish Group, 1995). These figures have not
seen a dramatic fluctuation over the years, and remained problematic as can be seen by the 2010
CHAOS summary report for the years 2000 to 2008 in Figure 2.26 below. Nonetheless, in reviewing
the 2006 report, Rubinstein (2007) argued that there was a marked improvement compared to the first
one in 1994, citing three reasons for the improvement in software quality – better project management,
iterative development and the emerging Web infrastructure.
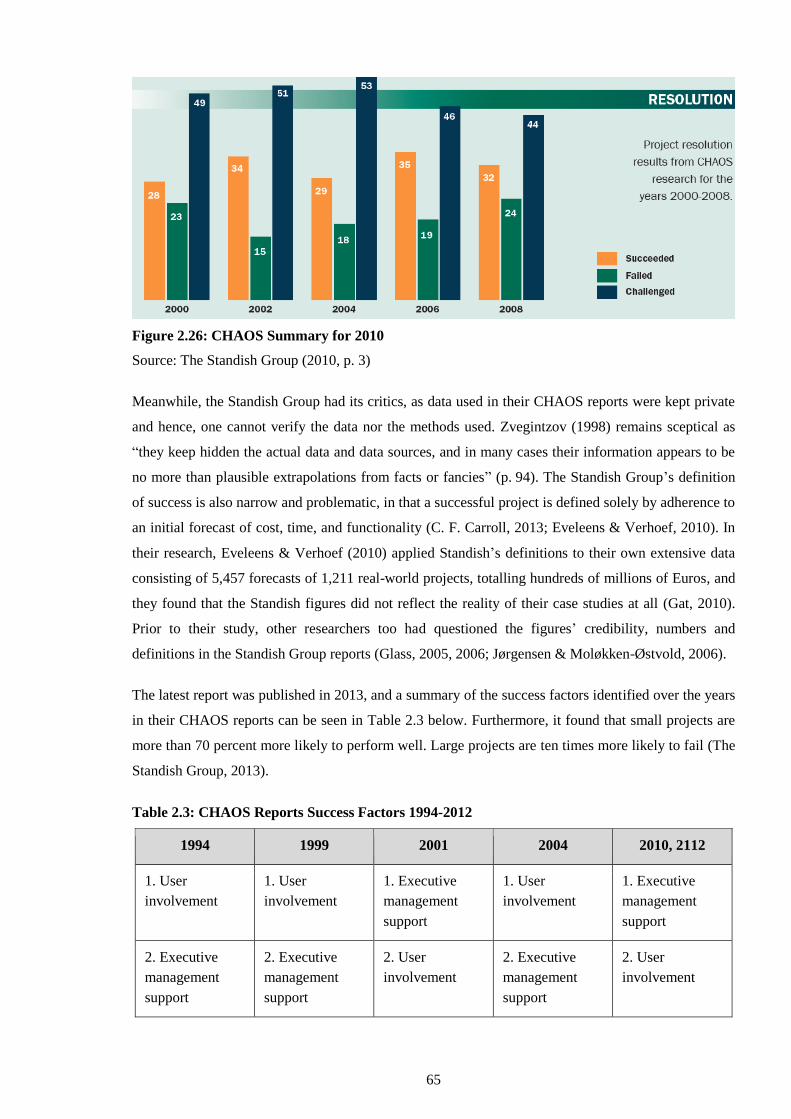
65
Figure 2.26: CHAOS Summary for 2010
Source: The Standish Group (2010, p. 3)
Meanwhile, the Standish Group had its critics, as data used in their CHAOS reports were kept private
and hence, one cannot verify the data nor the methods used. Zvegintzov (1998) remains sceptical as
“they keep hidden the actual data and data sources, and in many cases their information appears to be
no more than plausible extrapolations from facts or fancies” (p. 94). The Standish Group’s definition
of success is also narrow and problematic, in that a successful project is defined solely by adherence to
an initial forecast of cost, time, and functionality (C. F. Carroll, 2013; Eveleens & Verhoef, 2010). In
their research, Eveleens & Verhoef (2010) applied Standish’s definitions to their own extensive data
consisting of 5,457 forecasts of 1,211 real-world projects, totalling hundreds of millions of Euros, and
they found that the Standish figures did not reflect the reality of their case studies at all (Gat, 2010).
Prior to their study, other researchers too had questioned the figures’ credibility, numbers and
definitions in the Standish Group reports (Glass, 2005, 2006; Jørgensen & Moløkken-Østvold, 2006).
The latest report was published in 2013, and a summary of the success factors identified over the years
in their CHAOS reports can be seen in Table 2.3 below. Furthermore, it found that small projects are
more than 70 percent more likely to perform well. Large projects are ten times more likely to fail (The
Standish Group, 2013).
Table 2.3: CHAOS Reports Success Factors 1994-2012
1994 1999 2001 2004 2010, 2112
1. User
involvement
1. User
involvement
1. Executive
management
support
1. User
involvement
1. Executive
management
support
2. Executive
management
support
2. Executive
management
support
2. User
involvement
2. Executive
management
support
2. User
involvement
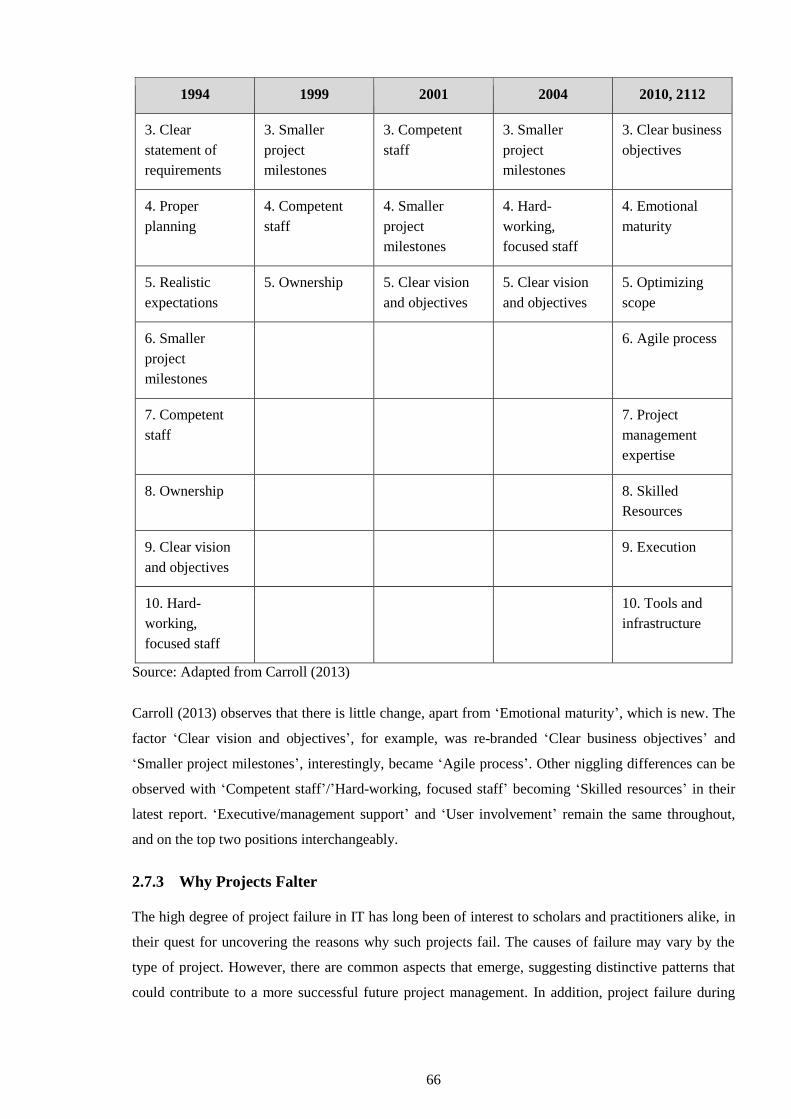
66
1994 1999 2001 2004 2010, 2112
3. Clear
statement of
requirements
3. Smaller
project
milestones
3. Competent
staff
3. Smaller
project
milestones
3. Clear business
objectives
4. Proper
planning
4. Competent
staff
4. Smaller
project
milestones
4. Hard-
working,
focused staff
4. Emotional
maturity
5. Realistic
expectations
5. Ownership 5. Clear vision
and objectives
5. Clear vision
and objectives
5. Optimizing
scope
6. Smaller
project
milestones
6. Agile process
7. Competent
staff
7. Project
management
expertise
8. Ownership 8. Skilled
Resources
9. Clear vision
and objectives
9. Execution
10. Hard-
working,
focused staff
10. Tools and
infrastructure
Source: Adapted from Carroll (2013)
Carroll (2013) observes that there is little change, apart from ‘Emotional maturity’, which is new. The
factor ‘Clear vision and objectives’, for example, was re-branded ‘Clear business objectives’ and
‘Smaller project milestones’, interestingly, became ‘Agile process’. Other niggling differences can be
observed with ‘Competent staff’/’Hard-working, focused staff’ becoming ‘Skilled resources’ in their
latest report. ‘Executive/management support’ and ‘User involvement’ remain the same throughout,
and on the top two positions interchangeably.
2.7.3 Why Projects Falter
The high degree of project failure in IT has long been of interest to scholars and practitioners alike, in
their quest for uncovering the reasons why such projects fail. The causes of failure may vary by the
type of project. However, there are common aspects that emerge, suggesting distinctive patterns that
could contribute to a more successful future project management. In addition, project failure during
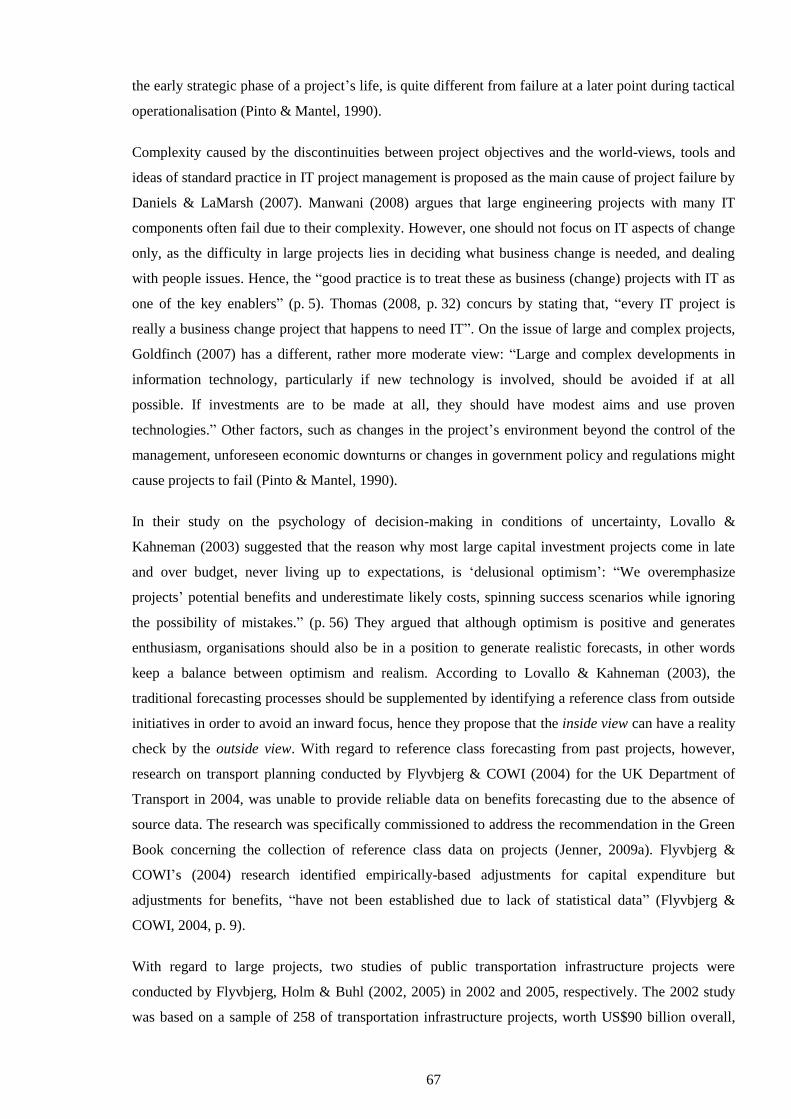
67
the early strategic phase of a project’s life, is quite different from failure at a later point during tactical
operationalisation (Pinto & Mantel, 1990).
Complexity caused by the discontinuities between project objectives and the world-views, tools and
ideas of standard practice in IT project management is proposed as the main cause of project failure by
Daniels & LaMarsh (2007). Manwani (2008) argues that large engineering projects with many IT
components often fail due to their complexity. However, one should not focus on IT aspects of change
only, as the difficulty in large projects lies in deciding what business change is needed, and dealing
with people issues. Hence, the “good practice is to treat these as business (change) projects with IT as
one of the key enablers” (p. 5). Thomas (2008, p. 32) concurs by stating that, “every IT project is
really a business change project that happens to need IT”. On the issue of large and complex projects,
Goldfinch (2007) has a different, rather more moderate view: “Large and complex developments in
information technology, particularly if new technology is involved, should be avoided if at all
possible. If investments are to be made at all, they should have modest aims and use proven
technologies.” Other factors, such as changes in the project’s environment beyond the control of the
management, unforeseen economic downturns or changes in government policy and regulations might
cause projects to fail (Pinto & Mantel, 1990).
In their study on the psychology of decision-making in conditions of uncertainty, Lovallo &
Kahneman (2003) suggested that the reason why most large capital investment projects come in late
and over budget, never living up to expectations, is ‘delusional optimism’: “We overemphasize
projects’ potential benefits and underestimate likely costs, spinning success scenarios while ignoring
the possibility of mistakes.” (p. 56) They argued that although optimism is positive and generates
enthusiasm, organisations should also be in a position to generate realistic forecasts, in other words
keep a balance between optimism and realism. According to Lovallo & Kahneman (2003), the
traditional forecasting processes should be supplemented by identifying a reference class from outside
initiatives in order to avoid an inward focus, hence they propose that the inside view can have a reality
check by the outside view. With regard to reference class forecasting from past projects, however,
research on transport planning conducted by Flyvbjerg & COWI (2004) for the UK Department of
Transport in 2004, was unable to provide reliable data on benefits forecasting due to the absence of
source data. The research was specifically commissioned to address the recommendation in the Green
Book concerning the collection of reference class data on projects (Jenner, 2009a). Flyvbjerg &
COWI’s (2004) research identified empirically-based adjustments for capital expenditure but
adjustments for benefits, “have not been established due to lack of statistical data” (Flyvbjerg &
COWI, 2004, p. 9).
With regard to large projects, two studies of public transportation infrastructure projects were
conducted by Flyvbjerg, Holm & Buhl (2002, 2005) in 2002 and 2005, respectively. The 2002 study
was based on a sample of 258 of transportation infrastructure projects, worth US$90 billion overall,
68
and representing different project types, as well as different regions and historical periods (Flyvbjerg
et al., 2002). The 2005 study covered 210 road and rail projects in fourteen countries worth US$59
billion overall (2004 prices), the largest of its kind (Flyvbjerg et al., 2005). The studies showed with
very high statistical significance that the cost estimates used to decide whether such projects should be
built are highly and systematically misleading. In addition, they showed that forecasters generally do a
poor job of estimating the demand for transportation infrastructure projects; in general, nine out of ten
project forecasts are overestimated. Hence, the result is large benefit shortfalls. Furthermore, their
research also found that forecasts have not become more accurate over the thirty-year period studied
(Flyvbjerg et al., 2002, 2005; Jenner, 2009a). Following the latter study by Flyvbjerg et al. (2005), the
American Planning Association officially endorsed the ‘reference class forecasting method’, which is
based on theories of decision-making under uncertainty, that won psychologist Daniel Kahneman the
Nobel Prize in Economics in 2002 (Flyvbjerg, 2006).
A review of large public procurement projects in the UK undertaken by Mott MacDonald (2002) in
2002, included a review of fifty projects over twenty years, costing more than £40m each at 2001
prices (Jenner, 2009a). The study demonstrated that there is, “a high level of optimism in project
estimates arising from underestimating project costs and duration or overestimating project benefits”
(Mott MacDonald, 2002, pp. S-1). Furthermore, the study was not able to provide reliable data on
benefits shortfalls for use as reference class data (Jenner, 2009a). Data on “benefits shortfall was
broadly unavailable and… determining benefits shortfall was based on personal interpretation as
benefits estimated at business case were not clearly defined” (Mott MacDonald, 2002, p. 18).
To what Lovallo & Kahneman (2003) refer to as ‘delusional optimism’, or cognitive bias contributing
to optimism bias offering psychological explanations, Flyvbjerg (2006) adds that there is also the issue
of ‘strategic misrepresentation’ based on political and organisational explanations, i.e. pressures.
When competition for project funding is fierce, “managers tend to deliberately and strategically
overestimate benefits and underestimate costs in order to increase the likelihood that it is their
projects, and not the competition’s, that gain approval and funding” (p. 6). In other words, in order to
justify investment for such projects, benefits are exaggerated “to an extent that verges on benefits
fraud” (Jenner, 2009b, p. 2). The HM Treasury Green Book re-issued in 2003 and updated in 2011 as
above, in its attempt to offer guidance with regard to adjusting for bias and risks, concludes as follows:
“There is a demonstrated, systematic, tendency for project appraisers to be overly optimistic. This is a
worldwide phenomenon that affects both the private and public sectors. Many project parameters are
affected by optimism – appraisers tend to overstate benefits, and understate timings and costs, both
capital and operational.” (HM Treasury, 2003, p. 29; 2011, p. 29) The new edition of the Green Book
also includes for the first time, an explicit adjustment procedure to redress the systematic optimism or
‘optimism bias’ that historically has afflicted the appraisal process (HM Treasury, 2011).
69
2.7.4 Agile for Success
With reference to large-scale projects, Thomas (2008, p. 32) claims that: “Every engineer knows that
trying to build the first or the biggest of anything is a risk, and that reliable large systems have usually
evolved from reliable small systems.” The latest Standish Group CHAOS report discussed above notes
that Agile process is one of the success factors when it comes to project success. It has however
evolved from ‘smaller project milestones’, which actually means Agile is ‘olde 1990 language’ in
software development, according to Carroll (2013). Agile practices were developed in response to
traditional project management and software development methods that attempt to fix cost, time and
scope, when in reality it only seemed to making the problems even worse. The actual term ‘Agile’ is
fairly a broad one, encompassing a range of process frameworks and methodologies, such as eXtreme
Programming (XP), Scrum, Dynamic System Development Methodology (DSDM), Kanban & Lean,
to mention a few, all developed at different stages since 1985. (Coram & Bohner, 2005; ITNow,
2013b). Lots of businesses, notes Dolman-Darrall (2013), by wanting their project to be a success,
usually focus on the wrong outcomes. Success in that case is usually measured as “on time, on budget
and on spec”, outcomes that form the ‘iron triangle’ in software development (p. 12). Cost does
matter, but value is far more important, as it is to deliver this value more effectively across the
organisation. Hence, increasing the flow, and instead of setting scope in advance, using feedback on a
continuous loop re-iteratively, adapting as needed to achieving quality, are central to Agile. This
approach is summed up in three fundamental interconnected themes, value, flow and quality (VFQ),
forming the basis of the Agile Manifesto (Dolman-Darrall, 2013). The British Computer Society
(BCS) defines Agile as follows: “It is a project methodology that can be used to deliver high-quality
projects against rapidly changing requirements utilising cross-departmental teams. Through
collaboration and communication, Agile enables you to assess and adjust any development aspects
throughout the project life-cycle to keep projects on track, minimise risk and maximise ROI.” (ITNow,
2013a, p. 18)
In contrast to the Waterfall and Spiral models and the Unified Process (UP) life-cycle that were
employed in traditional project management, all Agile methods share a common goal of enabling
teams to respond more rapidly to change. “As changes are costly to accommodate later in the project,
the ability to respond rapidly to change reduces project risks and their costs.” (Coram & Bohner, 2005,
p. 1) Although Agile software development might represent a major departure from traditional, plan-
based approaches to software engineering, trying to address the challenge of an unpredictable world
by relying on competent people instead of process, there are a few empirical studies to support its
acclaimed benefits (Awad, 2005; Dybå & Dingsøyr, 2008, 2009). There is also a dichotomy in the
literature, with regard to Agile methods being suitable for large and complex projects. Some scholars
and practitioners suggest that agile methods are not necessarily the best choice (Dybå & Dingsøyr,
2008, 2009), whilst others suggest they have been shown to be effective and were used for decades in
organisations, large and small, long even before they were called Agile (ITNow, 2013c; Yau &
70
Murphy, 2013). Moreover, with many organisations moving into e-commerce (and e-government),
Agile methodologies, such as XP, “have been touted as the programming methodologies of choice for
the high-speed, volatile world of Internet and Web software development” (Paulk, 2002, p. 15).
2.7.5 UK Public Sector IT Projects: Failure and Success Indicators
The world’s largest ever IT project, the National Programme for IT (NPfIT), for computerising the
National Health Service (NHS), or NHS IT, that was announced in 2002 at a cost of more than £12
billion, “has been much commented on, not least because of its ambition, delivery record and cost”
CJIT (2007). Following three damning reports which were published by the NAO on NPfIT
(Cruickshank, 2010, p. 9), the PAC made evident its concern for the programme’s progress (National
Audit Office, 2006c, 2008, 2011c). In its second report, PAC (2007b, 2011a) branded it a failure
overall with £6.4 billion spent so far not representing value for money, and recommended that local
NHS Trusts take over responsibility of the system. It is worth noting here that in its report, PAC
(2011a) reiterated what the National Audit Office recommended in 2006, that “the NHS needs to see
the Programme as a business change programme with clear goals and benefits rather than an IT
project” (National Audit Office, 2006c, p. 43). Furthermore, it should have been taken into account
that a program of this size is bound to experience challenges (Manwani, 2008).
More recently, a leaked internal survey of Department for Work and Pensions (DWP) employees,
working on the flagship Universal Credit (UC) Programme, a huge IT project, revealed lack of
leadership, poor decision-making and a divisive culture of secrecy. More importantly, it drew attention
to the fact that the UC programme has been hit with a number of setbacks throughout (Coiera, 2007).
The DWP is the largest of UK government departments, and the UC programme aims to streamline
and integrate claimants’ benefits payments in a huge shake-up of the UK’s welfare system. The UC
programme was introduced in a White Paper in November 2010, passed in a Welfare Reform Bill in
February 2011 and was due to begin in October 2013 (Malik & Wintour, 2013). The initial cost was
reported to be initially £2 billion overall, with £300 million invested on the IT system behind it, which
is now deemed ‘not fit for purpose’ and it looks like it would be scrapped and redesigned (Brewer,
Browne & Wenchao, 2011; Royston, 2012). Moreover, the UC project was criticised for its over-
reliance on the Internet and web-based services which would not be accessible by all affected by it,
and needing to use it (Collins, 2013). Besides, its forecasted inability to resolve all claimants’
problems will most certainly generate a ‘failure demand’, a term coined by (Seddon, 2013; Watling,
2011) as the ‘demand caused by a failure to do something or do something right for the customer’
(Seddon, 1992). The Public Accounts Committee raised concerns in 2011 about the potential
technology risk threatening the government’s Universal Credit system and the planned cost reductions,
which could spiral instead into amassing costs (Seddon, 2013). The DWP is no stranger to failed large
and complex computerisation projects like the Camelot and the Operational Strategy in the 1980s
(PAC, 2011b), and as Gauld & Goldfinch (2006) point out, the vast majority of large-scale computer
systems fail.
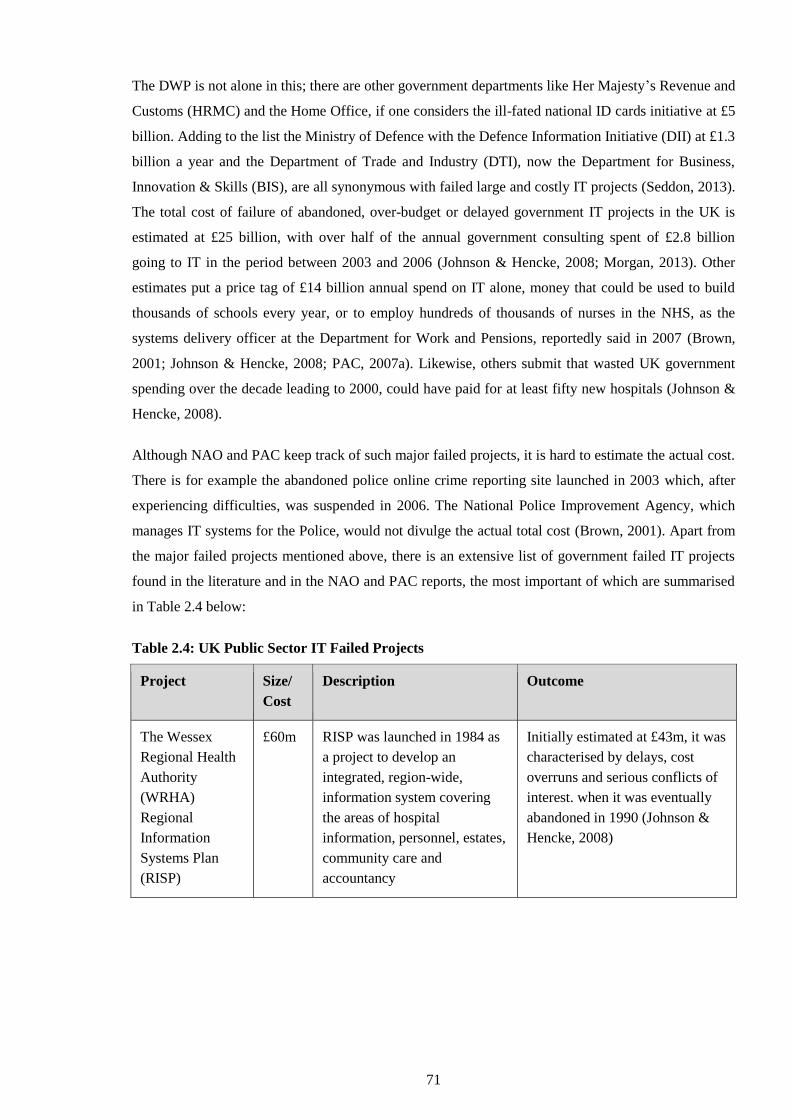
71
The DWP is not alone in this; there are other government departments like Her Majesty’s Revenue and
Customs (HRMC) and the Home Office, if one considers the ill-fated national ID cards initiative at £5
billion. Adding to the list the Ministry of Defence with the Defence Information Initiative (DII) at £1.3
billion a year and the Department of Trade and Industry (DTI), now the Department for Business,
Innovation & Skills (BIS), are all synonymous with failed large and costly IT projects (Seddon, 2013).
The total cost of failure of abandoned, over-budget or delayed government IT projects in the UK is
estimated at £25 billion, with over half of the annual government consulting spent of £2.8 billion
going to IT in the period between 2003 and 2006 (Johnson & Hencke, 2008; Morgan, 2013). Other
estimates put a price tag of £14 billion annual spend on IT alone, money that could be used to build
thousands of schools every year, or to employ hundreds of thousands of nurses in the NHS, as the
systems delivery officer at the Department for Work and Pensions, reportedly said in 2007 (Brown,
2001; Johnson & Hencke, 2008; PAC, 2007a). Likewise, others submit that wasted UK government
spending over the decade leading to 2000, could have paid for at least fifty new hospitals (Johnson &
Hencke, 2008).
Although NAO and PAC keep track of such major failed projects, it is hard to estimate the actual cost.
There is for example the abandoned police online crime reporting site launched in 2003 which, after
experiencing difficulties, was suspended in 2006. The National Police Improvement Agency, which
manages IT systems for the Police, would not divulge the actual total cost (Brown, 2001). Apart from
the major failed projects mentioned above, there is an extensive list of government failed IT projects
found in the literature and in the NAO and PAC reports, the most important of which are summarised
in Table 2.4 below:
Table 2.4: UK Public Sector IT Failed Projects
Project Size/
Cost
Description Outcome
The Wessex
Regional Health
Authority
(WRHA)
Regional
Information
Systems Plan
(RISP)
£60m RISP was launched in 1984 as
a project to develop an
integrated, region-wide,
information system covering
the areas of hospital
information, personnel, estates,
community care and
accountancy
Initially estimated at £43m, it was
characterised by delays, cost
overruns and serious conflicts of
interest. when it was eventually
abandoned in 1990 (Johnson &
Hencke, 2008)
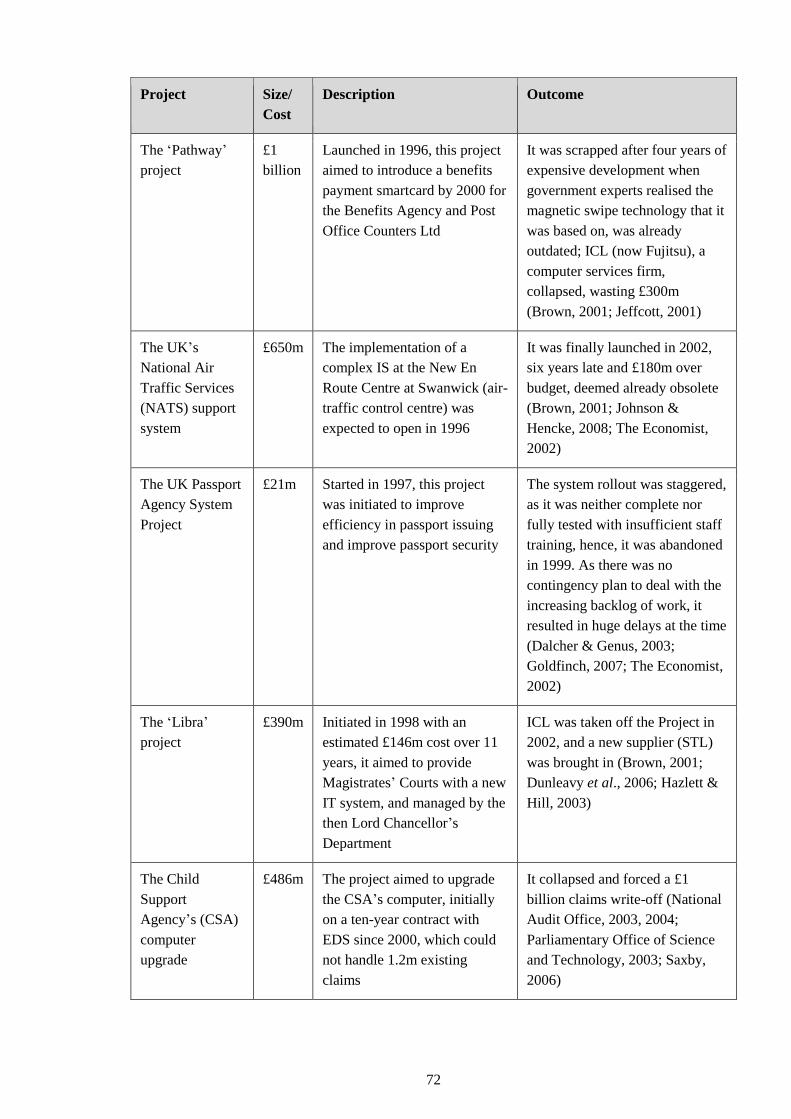
72
Project Size/
Cost
Description Outcome
The ‘Pathway’
project
£1
billion
Launched in 1996, this project
aimed to introduce a benefits
payment smartcard by 2000 for
the Benefits Agency and Post
Office Counters Ltd
It was scrapped after four years of
expensive development when
government experts realised the
magnetic swipe technology that it
was based on, was already
outdated; ICL (now Fujitsu), a
computer services firm,
collapsed, wasting £300m
(Brown, 2001; Jeffcott, 2001)
The UK’s
National Air
Traffic Services
(NATS) support
system
£650m The implementation of a
complex IS at the New En
Route Centre at Swanwick (air-
traffic control centre) was
expected to open in 1996
It was finally launched in 2002,
six years late and £180m over
budget, deemed already obsolete
(Brown, 2001; Johnson &
Hencke, 2008; The Economist,
2002)
The UK Passport
Agency System
Project
£21m Started in 1997, this project
was initiated to improve
efficiency in passport issuing
and improve passport security
The system rollout was staggered,
as it was neither complete nor
fully tested with insufficient staff
training, hence, it was abandoned
in 1999. As there was no
contingency plan to deal with the
increasing backlog of work, it
resulted in huge delays at the time
(Dalcher & Genus, 2003;
Goldfinch, 2007; The Economist,
2002)
The ‘Libra’
project
£390m Initiated in 1998 with an
estimated £146m cost over 11
years, it aimed to provide
Magistrates’ Courts with a new
IT system, and managed by the
then Lord Chancellor’s
Department
ICL was taken off the Project in
2002, and a new supplier (STL)
was brought in (Brown, 2001;
Dunleavy et al., 2006; Hazlett &
Hill, 2003)
The Child
Support
Agency’s (CSA)
computer
upgrade
£486m The project aimed to upgrade
the CSA’s computer, initially
on a ten-year contract with
EDS since 2000, which could
not handle 1.2m existing
claims
It collapsed and forced a £1
billion claims write-off (National
Audit Office, 2003, 2004;
Parliamentary Office of Science
and Technology, 2003; Saxby,
2006)
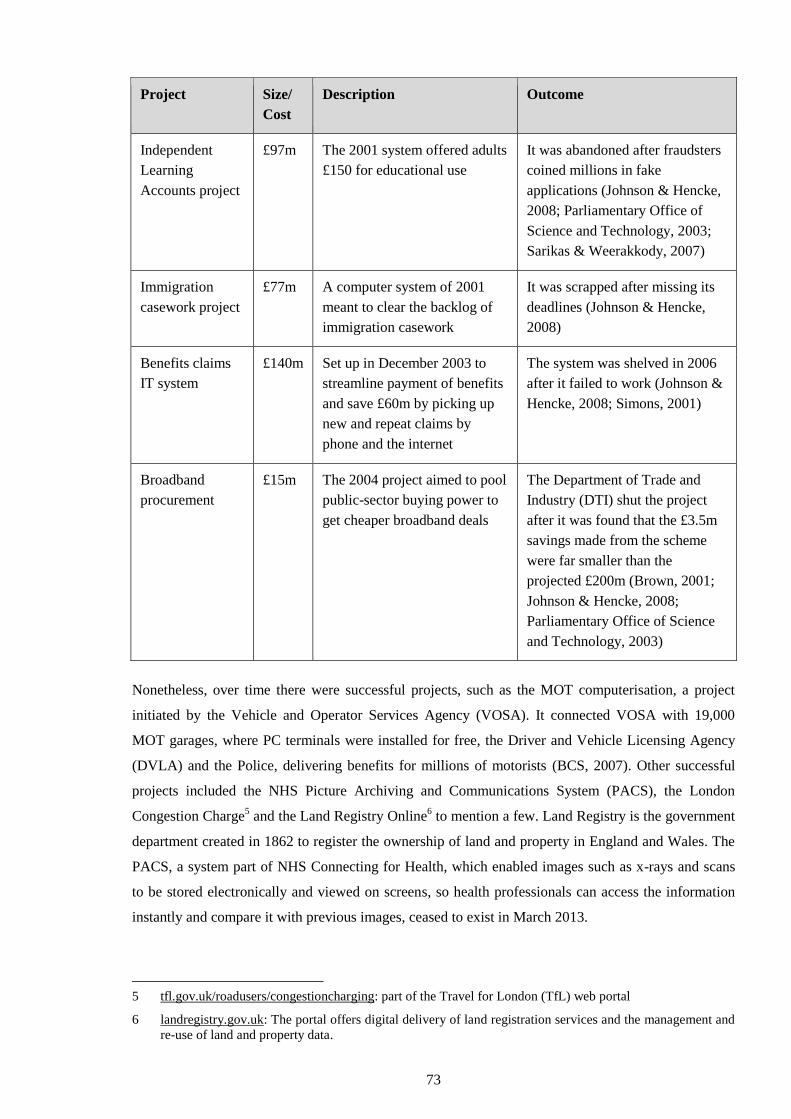
73
Project Size/
Cost
Description Outcome
Independent
Learning
Accounts project
£97m The 2001 system offered adults
£150 for educational use
It was abandoned after fraudsters
coined millions in fake
applications (Johnson & Hencke,
2008; Parliamentary Office of
Science and Technology, 2003;
Sarikas & Weerakkody, 2007)
Immigration
casework project
£77m A computer system of 2001
meant to clear the backlog of
immigration casework
It was scrapped after missing its
deadlines (Johnson & Hencke,
2008)
Benefits claims
IT system
£140m Set up in December 2003 to
streamline payment of benefits
and save £60m by picking up
new and repeat claims by
phone and the internet
The system was shelved in 2006
after it failed to work (Johnson &
Hencke, 2008; Simons, 2001)
Broadband
procurement
£15m The 2004 project aimed to pool
public-sector buying power to
get cheaper broadband deals
The Department of Trade and
Industry (DTI) shut the project
after it was found that the £3.5m
savings made from the scheme
were far smaller than the
projected £200m (Brown, 2001;
Johnson & Hencke, 2008;
Parliamentary Office of Science
and Technology, 2003)
Nonetheless, over time there were successful projects, such as the MOT computerisation, a project
initiated by the Vehicle and Operator Services Agency (VOSA). It connected VOSA with 19,000
MOT garages, where PC terminals were installed for free, the Driver and Vehicle Licensing Agency
(DVLA) and the Police, delivering benefits for millions of motorists (BCS, 2007). Other successful
projects included the NHS Picture Archiving and Communications System (PACS), the London
Congestion Charge5 and the Land Registry Online
6 to mention a few. Land Registry is the government
department created in 1862 to register the ownership of land and property in England and Wales. The
PACS, a system part of NHS Connecting for Health, which enabled images such as x-rays and scans
to be stored electronically and viewed on screens, so health professionals can access the information
instantly and compare it with previous images, ceased to exist in March 2013.
5 tfl.gov.uk/roadusers/congestioncharging: part of the Travel for London (TfL) web portal
6 landregistry.gov.uk: The portal offers digital delivery of land registration services and the management and
re-use of land and property data.
74
All too often however, the focus was on high-profile public IT project failures, prompting OGC to
issue the infamous list of ‘Common Causes of Project Failure’ (OGC, 2007b, p. 2):
1. Lack of clear links between the project and the organisation’s key strategic priorities,
including agreed measures of success.
2. Lack of clear senior management and Ministerial ownership and leadership.
3. Lack of effective engagement with stakeholders.
4. Lack of skills and proven approach to project management and risk management.
5. Too little attention to breaking development and implementation into manageable steps.
6. Evaluation of proposals driven by initial price rather than long-term value for money
(especially securing delivery of business benefits).
7. Lack of understanding of, and contact with the supply industry at senior levels in the
organisation.
8. Lack of effective project team integration between clients, the supplier team and the supply
chain.
The OGC finally advised: “If the answers to the above questions are unsatisfactory, projects should
not be allowed to proceed until the appropriate assurances are obtained.” (OGC, 2007b, p. 7) Despite
this advice, however, along with scrutiny and guidance by HM Treasury, NAO and the Audit
Commission, the House of Commons PACs, and the introduction of the Gateway process, government
IT projects continued to fail.
By late 2010, it was widely recognised that the government’s past performance on major projects has
been poor, with around a third being delivered on time and on budget (HM Government, 2012).
Hence, as previous government projects have had a poor delivery record, the new coalition
government ended OGC and transferred it to the all-powerful Efficiency and Reform Group (ERG) at
the Cabinet Office in June 2010, by setting up the Government Procurement Service (GPS).
Meanwhile, following the Major Projects Review in 2010 and in consultation with NAO, it launched
the Major Projects Authority (MPA) in March 2011. The MPA was launched as a partnership between
the Cabinet Office and HM Treasury, reporting jointly to the Minister for the Cabinet Office and the
Chief Secretary to the Treasury (National Audit Office, 2012). It now oversees (in 2012 figures) the
government’s “208 highest risk and highest value projects – with a total value of £368 billion,
enabling delivery issues and failing programmes to be exposed early, so that remedial action can be
taken before problems crystallise” (HM Government, 2012, p. 19). Transparency is also a key part of
this government’s Efficiency and Reform Agenda (National Audit Office, 2011b). It made a
75
commitment to ‘opening up government’ by publishing all data on spending,7 especially on high-
profile areas such as the government’s Major Projects Portfolio. In addition, it launched the G-Cloud
Programme, introducing Cloud ICT services into government departments, local authorities and the
wider public sector via the CloudStore Portal,8 whilst at the same time encouraging Small and Medium
Enterprise (SME) suppliers.
2.8 Conceptual Framework
The high degree of project failure in IT has long been of interest to researchers, especially in the
private sector, attempting to map these failures, and/or prescribe various theoretical or applied models
or frameworks to be utilised by the firms evolving their business and aligning IT with business change
and strategy. In e-government research, Heeks & Bailur (2007, p. 255) argue that despite a rapid
growth the “e-government literature has not yet been a generator or source of frameworks, let alone
theories: it currently provides other researchers with just models or lists, particularly with the four-
stage Web model of e-government”.
The overall research question that emerges from the literature review and which is addressed in this
study is:
How can the strategic alignment of the adoption of e-government services be improved?
It also becomes clear from the literature that a life-cycle occurs. The life-cycle of an IS development
begins with its creation and ends with its termination. Along this process, it goes through various
stages, which have been discussed to some extent in the extant literature, although the number of
stages proposed differs (Heeks, 2006; Isaias & Issa, 2015; Manwani, 2008; National Audit Office,
2004). Cohen et al. (2010, p. 21) outline “requirements, analysis, design, construction (or coding),
testing (validation), installation, operation, maintenance, and the less emphasized retirement” as the
key components of the development process. Similarly, on aligning IT with business change and
strategy, the IT-enabled Business Change Lifecycle (ITEBC) model proposed by Manwani (2008)
recognises that the start and end points of the change need to respectively focus on the business goals
and benefits. “In the first stage, the goal is that strategic alignment clarifies both the business and the
IT goals of the organisation. During the intermediate stages, the focus is more on delivery. The final
stage is when the benefits from the change have been delivered or assured” (Manwani, 2010, p. 9). In
addition, in achieving government modernisation, e-government development objectives are being
constantly formed, evolved, implemented and evaluated whilst aiming for efficiency and effectiveness
amongst other public values, such as citizen-centricity. Hence, a conceptual framework that depicts the
7 data.gov.uk: The Government is releasing public data to help people understand how government works
and how policies are made. Some of this data is already available, but data.gov.uk brings it together in one
searchable website.
8 gcloud.civilservice.gov.uk/cloudstore: This site is the portal to the G-Cloud Programme’s CloudStore.
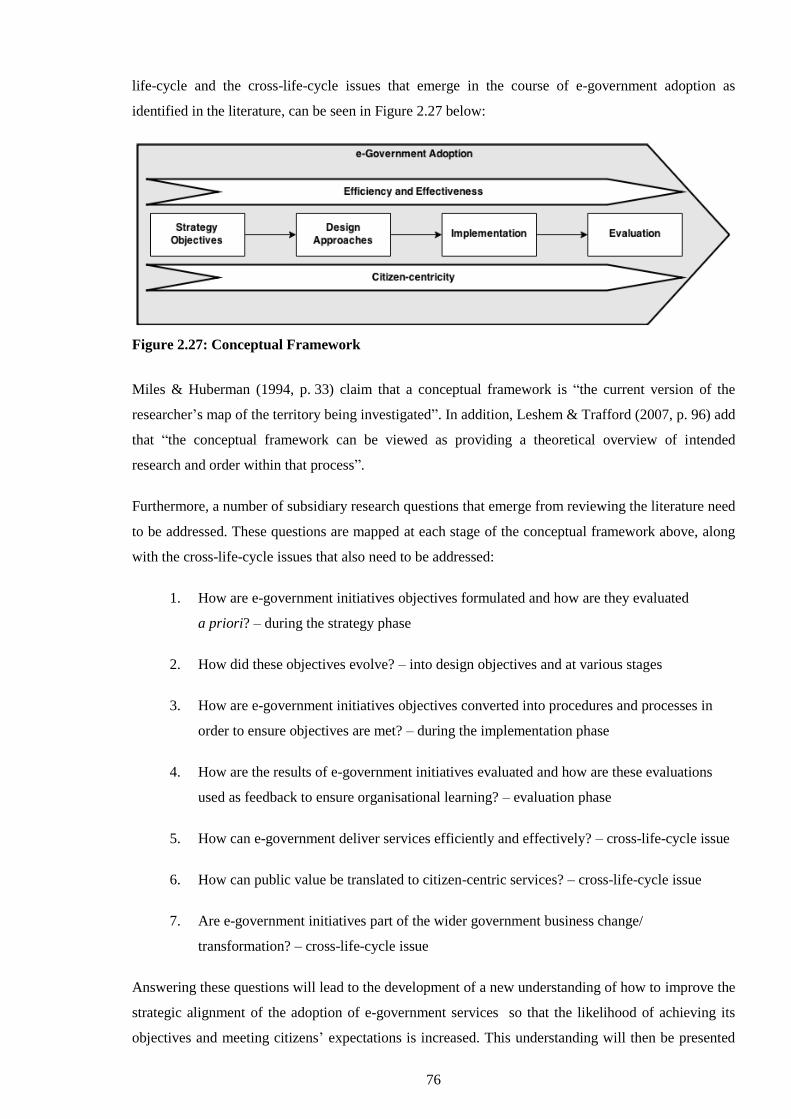
76
life-cycle and the cross-life-cycle issues that emerge in the course of e-government adoption as
identified in the literature, can be seen in Figure 2.27 below:
Figure 2.27: Conceptual Framework
Miles & Huberman (1994, p. 33) claim that a conceptual framework is “the current version of the
researcher’s map of the territory being investigated”. In addition, Leshem & Trafford (2007, p. 96) add
that “the conceptual framework can be viewed as providing a theoretical overview of intended
research and order within that process”.
Furthermore, a number of subsidiary research questions that emerge from reviewing the literature need
to be addressed. These questions are mapped at each stage of the conceptual framework above, along
with the cross-life-cycle issues that also need to be addressed:
1. How are e-government initiatives objectives formulated and how are they evaluated
a priori? – during the strategy phase
2. How did these objectives evolve? – into design objectives and at various stages
3. How are e-government initiatives objectives converted into procedures and processes in
order to ensure objectives are met? – during the implementation phase
4. How are the results of e-government initiatives evaluated and how are these evaluations
used as feedback to ensure organisational learning? – evaluation phase
5. How can e-government deliver services efficiently and effectively? – cross-life-cycle issue
6. How can public value be translated to citizen-centric services? – cross-life-cycle issue
7. Are e-government initiatives part of the wider government business change/
transformation? – cross-life-cycle issue
Answering these questions will lead to the development of a new understanding of how to improve the
strategic alignment of the adoption of e-government services so that the likelihood of achieving its
objectives and meeting citizens’ expectations is increased. This understanding will then be presented

77
in terms of conceptual framework or model, which may be used by government to guide its initiatives’
decisions and planning, development and implementation of such systems, in a way that can yield
citizen and public value.
This provides us with sufficient structure to guide the next stage of the research, and gives direction in
the data gathering (Miles & Huberman, 1994).
78
CHAPTER 3: RESEARCH METHODOLOGY
3.1 Introduction
The research objectives of this inquiry, the research question and subsidiary research questions that
emerge, have been discussed in the previous chapters. This chapter outlines how this research is
operationalised, firstly by discussing the research process and the philosophy it subscribes to in
relation to other philosophies. It then expounds on the research design adopted for this study, and the
arguments for establishing validity by following this approach. The chapter then presents the rationale
behind the selection of the case studies and moves on to the introduction of the instrumentation
utilised. It subsequently deliberates on the sampling methods and the choice of the sample as well as
the nature of the data collected. It then discusses research ethics and governance, before delving into
the data analysis process, methods and tools used.
3.2 The Research Process
The importance of social issues related to the fields of business and management and information
systems in particular, has been increasingly recognised. Research of this kind tends to be
multidisciplinary, challenging the conventional norms of knowledge production amongst scholars
(Klein & Myers, 1999; Pettigrew, 2001; Walsham, 1995b). Furthermore, research without scholarly
quality will satisfy no-one, but at the same time in the context of academic research, the question of
relevance to practitioners, by closing the gap, is being raised (Benbasat & Zmud, 1999; Pettigrew,
2001).
Pettigrew (2001, p. S61) maintains that: “One of the lessons from the natural history of development
of the social sciences is that there can be no one best way of framing, producing, disseminating and
using knowledge.” Nonetheless, whether one embarks on a research project of any kind, or a research
degree, there is a process that needs to be followed. This process is not usually a single, discrete event,
and it typically evolves through a number of phases (Mingers, 2001). “The cycle can start with
experience of a problem; a theory or hypothesis; or a question; a fascination with trying to see how,
why, if, in what ways, why not, what if?” (Wisker, 2008, p. 51) According to Blaxter, Hughes & Tight
(2001) the research process is a spiral, which:
is cyclical
can be entered at almost any point
is a never-ending process
will cause you to reconsider your practice
will return you to a different starting place
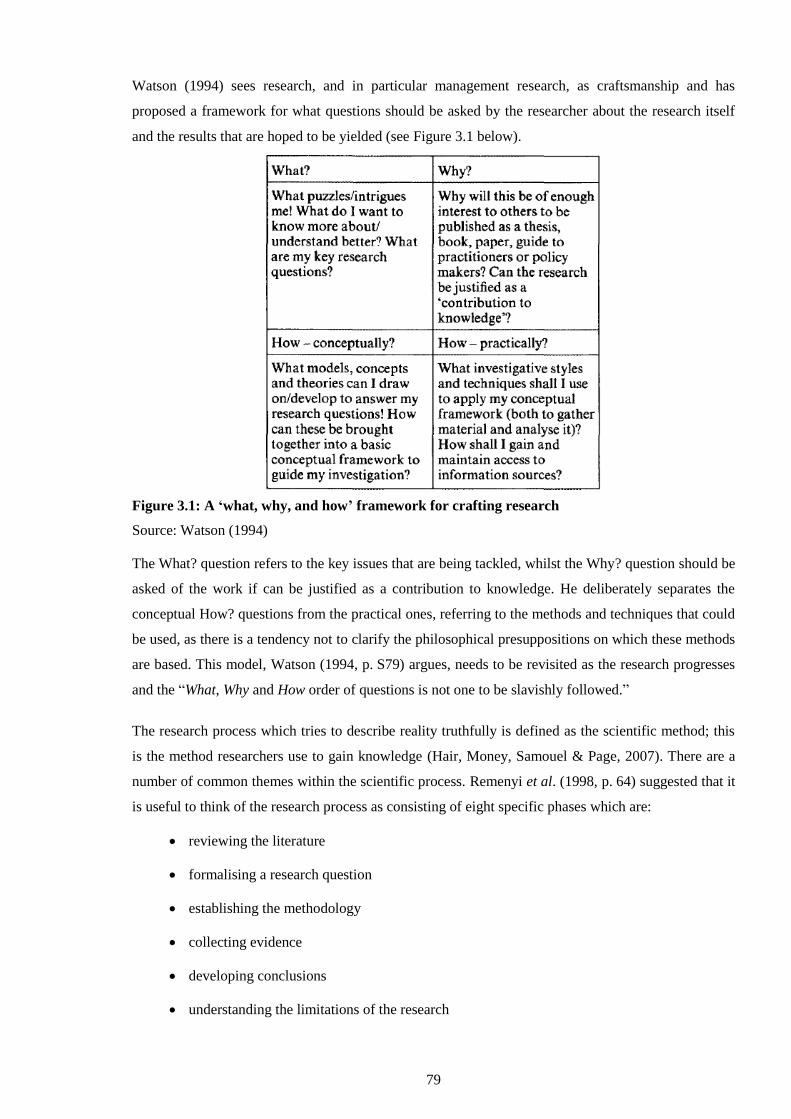
79
Watson (1994) sees research, and in particular management research, as craftsmanship and has
proposed a framework for what questions should be asked by the researcher about the research itself
and the results that are hoped to be yielded (see Figure 3.1 below).
Figure 3.1: A ‘what, why, and how’ framework for crafting research
Source: Watson (1994)
The What? question refers to the key issues that are being tackled, whilst the Why? question should be
asked of the work if can be justified as a contribution to knowledge. He deliberately separates the
conceptual How? questions from the practical ones, referring to the methods and techniques that could
be used, as there is a tendency not to clarify the philosophical presuppositions on which these methods
are based. This model, Watson (1994, p. S79) argues, needs to be revisited as the research progresses
and the “What, Why and How order of questions is not one to be slavishly followed.”
The research process which tries to describe reality truthfully is defined as the scientific method; this
is the method researchers use to gain knowledge (Hair, Money, Samouel & Page, 2007). There are a
number of common themes within the scientific process. Remenyi et al. (1998, p. 64) suggested that it
is useful to think of the research process as consisting of eight specific phases which are:
reviewing the literature
formalising a research question
establishing the methodology
collecting evidence
developing conclusions
understanding the limitations of the research
80
producing guidelines or recommendations
The researcher should also be aware of the philosophical issues that underpin research and the
available research options, which are examined below.
3.3 Research Philosophy
A research philosophy is a belief about the way in which data about a phenomenon should be
gathered, analysed and used. The ancient Greeks believed that science is the process of inquiry, which
transformed doxa (what is believed to be true) to episteme (what is known to be true). Since the
Sophists questioned how, and even if, this could be done, the argument had centred on whether
knowledge can ever be ‘proven’ (Goles & Hirschheim, 2000; Hirschheim, 1985). The What?, Why?
and How? questions discussed above, are underlined by fundamental ontological and epistemological
beliefs or assumptions made by the actors who are involved in an inquiry (Hirschheim & Klein, 1989).
Ontology refers to assumptions we make about the nature of reality we are trying to discover
(Easterby-Smith, Thorpe & Lowe, 2002). “The most pertinent philosophical assumptions are those
which relate to the underlying epistemology which guides the research. Epistemology refers to the
assumptions about knowledge and how it can be obtained.” (Myers, 1997, p. 241) Simply put, it refers
to the “set of assumptions about how one should gather data about the world” (Heeks & Bailur, 2007,
p. 249). Typically, a research topic will express something of the researcher’s ontological or
epistemological position encapsulated in the research, and grounded within the specific context of the
research problem (J. Mason, 2002).
3.3.1 Research Paradigms: Positivism vs Interpretivism
Considering matters of ontology and epistemology when undertaking research, leads in its turn to the
different research paradigms available to the researcher to choose from. The various approaches to
research can be classified under different taxonomies: empirical and theoretical. Empirical research is
often associated with a positivist view although it can be either positivist or phenomenological/
interpretivist in nature (Remenyi et al., 1998). In the Western tradition of science, positivist
philosophy is also referred to as scientific, whilst interpretivist as anti-positivist (Easterby-Smith et al.,
2002). The major differences between positivism and interpretivism concerning research are threefold:
ontological, epistemological and methodological (Chen & Hirschheim, 2004). The positivist
epistemology relies on a host of scientific methods that produce numerical and alphanumeric data
(quantitative) whilst the phenomenological or interpretative epistemology relies on methods such as
action research, case study research and ethnography (qualitative), to mention a few, which aid the
researcher in understanding and interpreting various phenomena (Easterby-Smith et al., 2002;
Remenyi et al., 1998). Within the broad tradition of qualitative research, rather than collecting
information to test a hypothesis, the explanation should arise from the findings of the research.
Quantitative research on the other hand, is characterised by the process of deductive reasoning, with
81
theory guiding the process of data collection and analysis in order to test a predefined hypothesis
(Draper, 2004).
3.3.2 Philosophical Stance: Rationale
This focus of this study is how to improve e-government initiatives, and hence, it is imperative to
understand the way the actors behind these think in terms of decision rationale, viewpoint and
perceptions. The objectives of the research are to understand not only why the public sector invests in
e-government projects, but also how these initiatives can be improved. In order to achieve this, it is
paramount to understand what the actors behind these projects perceive to be the rationale of
formulation of e-government initiatives objectives; in addition, what they perceive of the evolution of
these objectives, the procedures to meet these and their evaluation, in achieving efficiency and
effectiveness, including citizen-centricity, as part of the wider government business transformation. As
this study is concerned with understanding individuals’ behaviour in their natural setting, and in the
wider context it takes place, this research is conducted from an interpretive stance, and hence draws on
interpretive methodological approaches, as discussed in the section below.
3.4 Research Design
The research design is about organising research activity, including the collection of data, in ways that
are most likely to achieve the research aims depending on the philosophical stance of the researcher
(Easterby-Smith et al., 2002; Remenyi et al., 1998). Nevertheless, there are many philosophical
debates underlining research approaches in the social sciences, which have implications for both
management and IS research. Hirschheim (1985, p. 9) argues, for example, that “IS epistemology
draws heavily from the social sciences because information systems are, fundamentally, social rather
than technical”. The nature and the field of IS is broad and multidisciplinary, as it involves many
actors both internal and external to the organisations concerned. It has to draw upon a very broad
range of disciplines – technology, psychology, economics, sociology, mathematics, linguistics and
semiotics – which embrace diverse research traditions (Goles & Hirschheim, 2000; Mingers, 2001;
Myers, 1997). As Klein & Myers (1999, p. 67) put it, “Interpretive research can help IS researchers to
understand human thought and action in social and organizational contexts…” Nevertheless, it is only
in the last two decades that interpretivism gained ground in IS research, as it was dominated by
positivist approaches (Orlikowski & Baroudi, 1991; Walsham, 1995a). Despite the ‘battle of research
paradigms’, interpretive research today is now a well-established part of the field, more than it was say
in the 1990s (Walsham, 2006). Yet, in an empirical analysis of 1,983 articles published in major IS
journals between 1991 and 2001, Chen & Hirschheim (2004) found that positivist research still
dominated 81 percent of published empirical research. Similarly, in business and management
research, it was suggested by Cassell & Symon (2006, p. 5) that, “qualitative researchers sometimes
grow tired of defending their methodologies against what can be seen as a potentially hostile audience
committed to quantitative methodologies informed by a positivist epistemology”. As with IS,
82
management is not a sole discipline, but represents a confluence of different fields and strands of
inquiry, which gets further complicated by the fact that it has a series of sub-fields. Apart from the
pressure to become a practically oriented social science, this fragmented field needs also to meet the
dual demands of theory and practice (Pettigrew, 2001).
Every type of empirical research has an implicit, if not explicit, research design, which is much more
than a work plan, to help to avoid the situation in which the evidence does not answer the initial
research question. It also “deals with a logical problem and not a logistical problem” (Yin, 2009,
p. 27). Research designs are often equated with quantitative or qualitative research methods, and
sometimes are used interchangeably. The fact that certain methods in both research paradigms, are
equated to specific research designs – for example, “equating cross-sectional designs with
questionnaires, or case studies with participant observation” (de Vaus, 2001, p. 9) – leads to confusion.
Failure to distinguish between design and method, however, leads to poor evaluation designs. Hence,
it is wrong to equate a particular research design with either quantitative or qualitative methods. Yin
(2009), for example, suggests that one should not subscribe to a particular research design or data
collection strategy from the outset, even for a case study, as it might be subject to both qualitative and
quantitative inquiry and analysis. There are a number of research designs that meet the philosophical
assumptions of each paradigm. As one of the early proponents of choosing appropriate IS research
approaches, Galliers (1991) compiled a list of fourteen research designs indicating accordingly
whether they typically conform to the positivist or interpretivist paradigms. Easterby-Smith et al.
(2002) drew a similar list of fourteen indicative research designs, noting that the worldview held by a
researcher is clearly an important factor which affects the choice of research methods. This list of
some of the possible research designs, some of which are adaptable for use under either paradigm, is
exhibited in Figure 3.2 below. Before introducing the methodologies employed in this research, the
key features of the research designs depicted in the table are summarised, identifying their respective
strengths and weaknesses, and how they can interoperate when combined.
Figure 3.2: Research Designs
Source: Easterby-Smith et al. (2002)
Action research aims to solve current practical problems while expanding scientific knowledge
through direct intervention (Baskerville & Myers, 2004). The action researcher and the research
subject(s) collaborate in the diagnosis of a problem and in the development of a solution based in the
83
diagnosis, whilst at the same time developing theoretical knowledge (Bryman & Bell, 2011).
Typically, it is “an iterative research process that capitalizes on learning by both researchers and
subjects within the context of the subjects’ social system” (Baskerville & Myers, 2004, p. 330).
Although it is possible to collect both quantitative and qualitative data, action research in most
respects derives from ideas that are alien to positivism, and hence there is scepticism as to its value
from that perspective (Easterby-Smith et al., 2002). The involvement of the researcher is taken a stage
further in what has come to be known as co-operative inquiry (Heron, 1996), or participatory inquiry
(Heron & Reason, 1997). The co-operative inquiry involves “two or more people researching a topic
through their own experience of it, using a series of cycles in which they move between this
experience and reflecting together on it” (Heron, 1996, p. 1). It rejects traditional positivist methods
where people are studied as there were objects under the influence of external factors and forces, and
involves them in deciding what questions and issues are worth researching (Easterby-Smith et al.,
2002). The outcome of this kind of research, is grounded by the researchers in their own experiential
knowledge, where the researchers are also the subjects, and at the same time, the subjects are also the
researchers (Heron & Reason, 1997).
Critical inquiry can be thought of, not so much as a research method or group of research methods, but
as a distinct research paradigm with its own worldview and set of beliefs about the nature of
knowledge and truth, and may be positioned within the three broadly recognised paradigms of
research (Clear, 2005; Orlikowski & Baroudi, 1991). It concentrates on “a particular aspect of the
benefit to mankind dimension of research, as opposed to simply adding to our stock of knowledge”
(Clear, 2005, p. 2). An important distinction of the critical research philosophy is its evaluative
dimension. “More than either the positivist or the interpretive research perspectives, the critical
researcher attempts to critically evaluate and transform the social reality under investigation.”
(Orlikowski & Baroudi, 1991, p. 18) This method, while basically interpretivist, often combines some
positivist approaches.
Ethnography, according to Van Maanen (2006, p. 13), is a practice “concerned with the study and
representation of culture (with a distinctly small c). It is a field many claim to be the most scientific of
the humanities and the most humanistic of the sciences”. It is an interpretive craft, focused more on
‘how’ and ‘why’ than on ‘how much’ or ‘how many’ (Van Maanen, 2011). Similar to participant
observation, the researcher “joins the group, community or organisation to be studied, as either a full
or partial member, and both participates in and observes activities, asks questions, takes part in
conversations, and reads relevant documents” (Watson, 2011, p. 207). It is this kind of fieldwork that
gives rise to ethnography, and for this practice to serve any significant ethnographic purpose, the
observation has to occur over a period of time. Ethnography is both a methodological approach to, and
an analytic perspective on social research (Van Maanen, 2011).
84
The narrative methods are concerned with the view that the verbal medium is crucial to understanding
behaviour within organisations and hence, the researcher’s aim should be to collect stories about what
takes place. This approach too, may involve participant observation, or simply asking people for their
stories about particular events or phenomena (Easterby-Smith et al., 2002). The defining
characteristics of narrative are “chronology (unfolding over time); emplotment (the literary
juxtaposing of actions and events in an implicitly causal sequence); trouble (that is, harm or the risk of
harm); and embeddedness (the personal story nests within a particular social, historical and
organisational context)” (Greenhalgh, Russell & Swinglehurst, 2005, p. 443).
The experimental and quasi-experimental research designs involve an intervention, the effects of
which are the main focus of the research and it is always about hypothesis testing. Experimental
studies permit causal relationships to be identified and the experiments are conducted in a systematic
way in a laboratory or in the field (Collis & Hussey, 2014). Experiments are characterised by the
following: “(1) manipulation of one or more independent variables; (2) use of controls such as
randomly assigning participants or experimental units to one or more independent variables; and
(3) careful observation or measurement of one or more dependent variables” (Kirk, 2014, p. 23). The
first and second characteristics distinguish experiments from other research strategies. There are many
natural social settings however, where the researcher does not have full experimental control, with
regard to “(the when and to whom of exposure and the ability to randomize exposures), which makes a
true experiment possible” (Campbell & Stanley, 1963, p. 34). Collectively, such situations can be
regarded as quasi-experimental designs.
In survey research, the main purpose is to obtain information about practices, behaviour and views
from a defined sample, or population. Questionnaires and structured interviews are used extensively in
surveys, though occasionally tests and observations can be included (Easterby-Smith et al., 2002).
Quantitative analytical techniques are then used to draw inferences from this data regarding existing
relationships or patterns, and generalise the results to a population. Hackett (1981, p. 599) submits
that, “survey research is perhaps the most widely employed and best known research method in the
social sciences; it is certainly one of the oldest”, dating back to ancient Egypt. A key weakness of
survey research is that it is very difficult to realise insights relating to the causes of, or processes
involved in, the phenomena measured. Additionally, other limitations include the reactive nature of the
assessment, the difficulty in obtaining a truly random sample of many populations, and the problem of
low response rates that plagues all surveys (Hackett, 1981).
The case study is one of several ways of conducting social research and is used to explore a
phenomenon in a natural setting using a variety of methods to obtain in-depth knowledge (Collis &
Hussey, 2014; Yin, 2009). The phenomenon is the case, occurring in a bounded context, and studies
could comprise of a single case or of several (Miles, Huberman & Saldaña, 2014). Notwithstanding,
there is no standard definition of what constitutes a case study, and there is an ongoing debate on
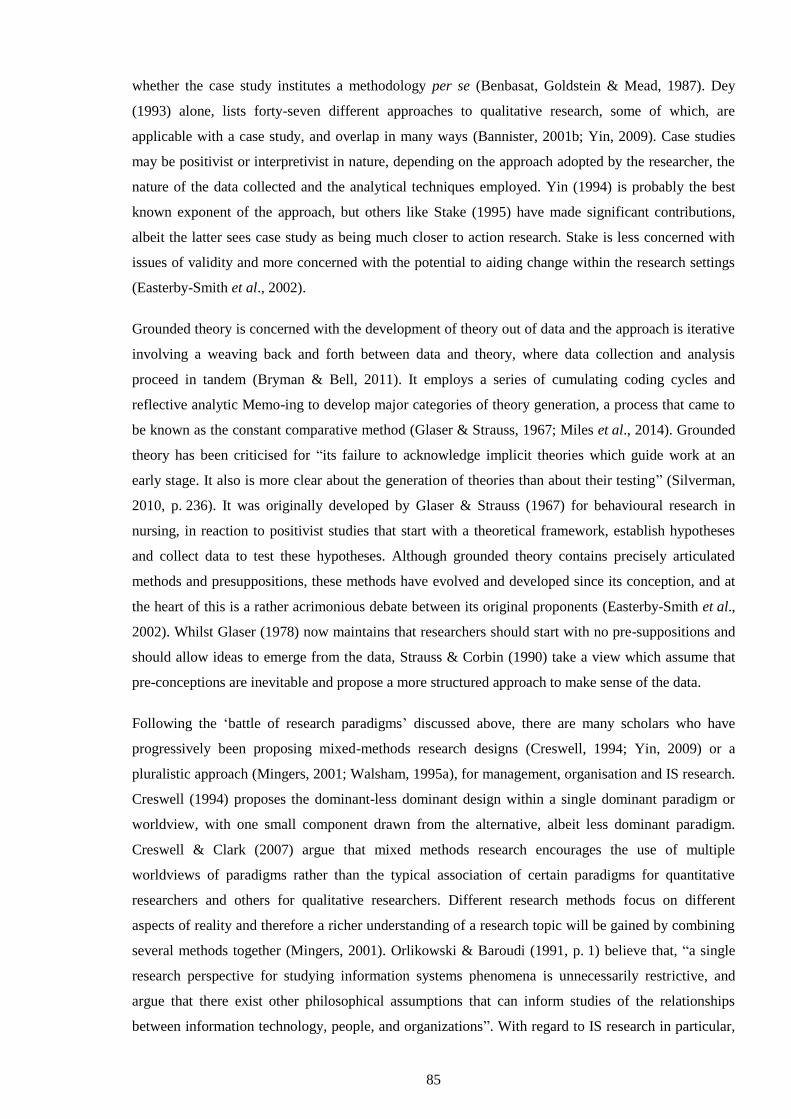
85
whether the case study institutes a methodology per se (Benbasat, Goldstein & Mead, 1987). Dey
(1993) alone, lists forty-seven different approaches to qualitative research, some of which, are
applicable with a case study, and overlap in many ways (Bannister, 2001b; Yin, 2009). Case studies
may be positivist or interpretivist in nature, depending on the approach adopted by the researcher, the
nature of the data collected and the analytical techniques employed. Yin (1994) is probably the best
known exponent of the approach, but others like Stake (1995) have made significant contributions,
albeit the latter sees case study as being much closer to action research. Stake is less concerned with
issues of validity and more concerned with the potential to aiding change within the research settings
(Easterby-Smith et al., 2002).
Grounded theory is concerned with the development of theory out of data and the approach is iterative
involving a weaving back and forth between data and theory, where data collection and analysis
proceed in tandem (Bryman & Bell, 2011). It employs a series of cumulating coding cycles and
reflective analytic Memo-ing to develop major categories of theory generation, a process that came to
be known as the constant comparative method (Glaser & Strauss, 1967; Miles et al., 2014). Grounded
theory has been criticised for “its failure to acknowledge implicit theories which guide work at an
early stage. It also is more clear about the generation of theories than about their testing” (Silverman,
2010, p. 236). It was originally developed by Glaser & Strauss (1967) for behavioural research in
nursing, in reaction to positivist studies that start with a theoretical framework, establish hypotheses
and collect data to test these hypotheses. Although grounded theory contains precisely articulated
methods and presuppositions, these methods have evolved and developed since its conception, and at
the heart of this is a rather acrimonious debate between its original proponents (Easterby-Smith et al.,
2002). Whilst Glaser (1978) now maintains that researchers should start with no pre-suppositions and
should allow ideas to emerge from the data, Strauss & Corbin (1990) take a view which assume that
pre-conceptions are inevitable and propose a more structured approach to make sense of the data.
Following the ‘battle of research paradigms’ discussed above, there are many scholars who have
progressively been proposing mixed-methods research designs (Creswell, 1994; Yin, 2009) or a
pluralistic approach (Mingers, 2001; Walsham, 1995a), for management, organisation and IS research.
Creswell (1994) proposes the dominant-less dominant design within a single dominant paradigm or
worldview, with one small component drawn from the alternative, albeit less dominant paradigm.
Creswell & Clark (2007) argue that mixed methods research encourages the use of multiple
worldviews of paradigms rather than the typical association of certain paradigms for quantitative
researchers and others for qualitative researchers. Different research methods focus on different
aspects of reality and therefore a richer understanding of a research topic will be gained by combining
several methods together (Mingers, 2001). Orlikowski & Baroudi (1991, p. 1) believe that, “a single
research perspective for studying information systems phenomena is unnecessarily restrictive, and
argue that there exist other philosophical assumptions that can inform studies of the relationships
between information technology, people, and organizations”. With regard to IS research in particular,
86
Walsham (1995a) found that an investigation of editorials and journal contents from 1992 onwards,
indicated a growth of pluralist perspective. Likewise, in management research: “An activity charged
with creative aims, intellectual diversity of fields and pluralism of theoretical development and
method, must be a plus.” (Pettigrew, 2001, p. S64)
For the purposes of this research the emphasis is clearly on interpretive approaches, for reasons based
on the researcher’s philosophical standpoint discussed in Section 3.3.2 above. More importantly so,
because of the nature of the research topic, which is rich in its outset; a well-defined problem, where
the state of knowledge is not predefined, despite many issues surrounding it being well covered in the
literature. Predominant positivist methodologies, such as survey research, experimental and quasi-
experimental designs discussed above, are therefore discounted. Critical enquiry and action research
seek to transform social reality and solve current problems through involvement and direct
intervention respectively, aims which are beyond the scope of this research. This research is not
grounded by the researcher in his own experiential knowledge only and hence, a co-operative inquiry
cannot be employed either. Narratives alone are not sufficient in this instance, and certainly this study
is not of ethnographic nature. In order to achieve its aims, this research was undertaken by studying
two public-sector e-government projects in the UK and the Republic of Ireland. Therefore, the case
study approach was chosen for this study, as it can accommodate a variety of different philosophies
and techniques, and is very popular in IS research (Walsham, 1995b). Furthermore, the use of multiple
sources of information, which is inherent to the case study approach, helps in establishing validity and
triangulation (Yin, 2003). In addition, grounded theory was used in part in this research in the form of
the constant comparative method as a data coding technique, supplementing the case study approach
with grounded analysis of the data collected.
Before discussing the theoretical underpinnings of, and the rationale for, the research approach chosen
and its claims for validity, a review of the methodologies used in this research follows in the sections
below. Approaches that combine the chosen methodologies in a synergistic fusion are also discussed,
exploring how they can be applied in this research, adding to a rigorous and reliable theory building
process.
3.4.1 Case Study
To understand the nature of case study research, it is useful to conceptualise that it is an approach,
rather than a methodology in its own right, and “the methods used in case study research are
pragmatically – rather than paradigmatically – driven” (Rosenberg & Yates, 2007, p. 448). Mason
(2002, p. 166) suggests that you do not have to see yourself as “doing ‘case study research’ to be able
nevertheless to identify case studies, contexts or ‘wholes’ within your data set for analytical purposes”.
The case study is a “convenient frame of reference and within this frame, the most appropriate
research methodology will be determined by a number of factors including the research question,
accessibility and the philosophical stance taken by the researcher” (Bannister, 2001b, p. 105).
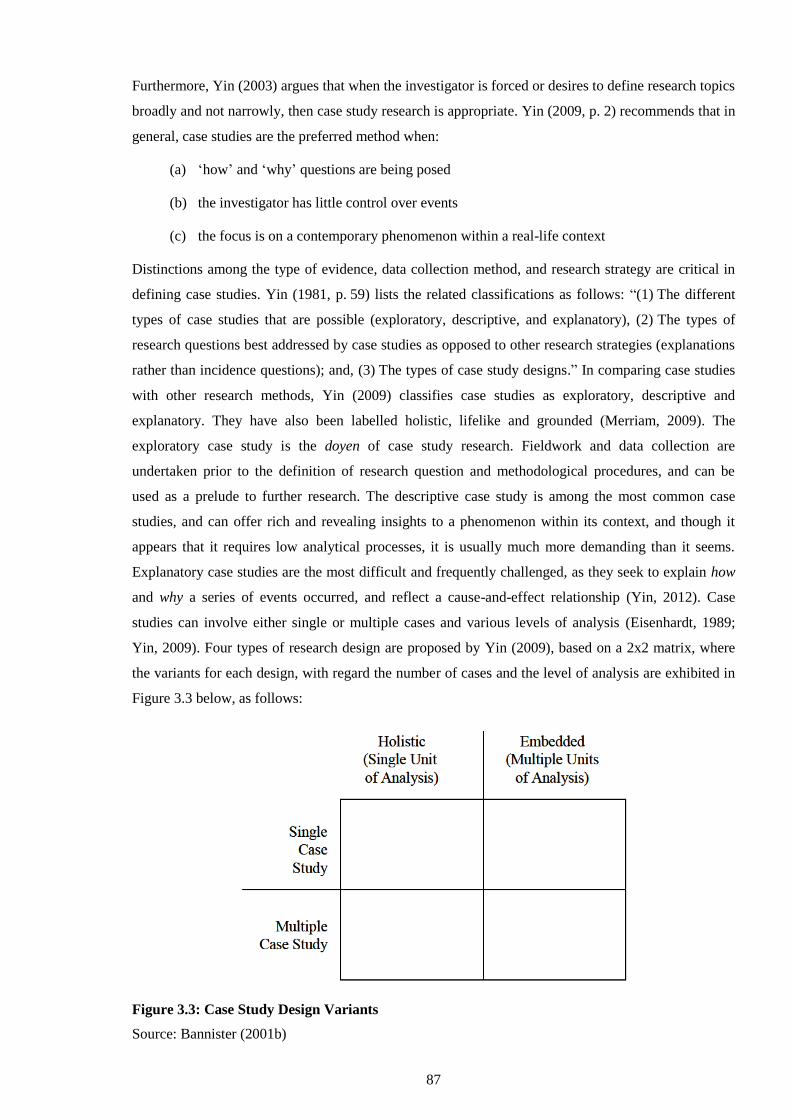
87
Furthermore, Yin (2003) argues that when the investigator is forced or desires to define research topics
broadly and not narrowly, then case study research is appropriate. Yin (2009, p. 2) recommends that in
general, case studies are the preferred method when:
(a) ‘how’ and ‘why’ questions are being posed
(b) the investigator has little control over events
(c) the focus is on a contemporary phenomenon within a real-life context
Distinctions among the type of evidence, data collection method, and research strategy are critical in
defining case studies. Yin (1981, p. 59) lists the related classifications as follows: “(1) The different
types of case studies that are possible (exploratory, descriptive, and explanatory), (2) The types of
research questions best addressed by case studies as opposed to other research strategies (explanations
rather than incidence questions); and, (3) The types of case study designs.” In comparing case studies
with other research methods, Yin (2009) classifies case studies as exploratory, descriptive and
explanatory. They have also been labelled holistic, lifelike and grounded (Merriam, 2009). The
exploratory case study is the doyen of case study research. Fieldwork and data collection are
undertaken prior to the definition of research question and methodological procedures, and can be
used as a prelude to further research. The descriptive case study is among the most common case
studies, and can offer rich and revealing insights to a phenomenon within its context, and though it
appears that it requires low analytical processes, it is usually much more demanding than it seems.
Explanatory case studies are the most difficult and frequently challenged, as they seek to explain how
and why a series of events occurred, and reflect a cause-and-effect relationship (Yin, 2012). Case
studies can involve either single or multiple cases and various levels of analysis (Eisenhardt, 1989;
Yin, 2009). Four types of research design are proposed by Yin (2009), based on a 2x2 matrix, where
the variants for each design, with regard the number of cases and the level of analysis are exhibited in
Figure 3.3 below, as follows:
Figure 3.3: Case Study Design Variants
Source: Bannister (2001b)
88
The distinction between holistic and embedded according to Yin (2009), lies in that a single case
might involve more than one unit of analysis, in which case, the resulted design would be called an
embedded case study design. Holistic design is used when only one aspect of the case is been
examined. Furthermore, based on the matrix above, Yin (2009, p. 47) offers five rationales for a single
case design; these are:
the critical case, when testing a well-formulated theory
the extreme or unique case, when the case is unique and is mainly used in clinical studies
the representative or typical case, that captures the circumstances and conditions of an
occurring, everyday situation, i.e. in an organisation
the revelatory case, where the researcher has the opportunity to investigate a phenomenon
previously inaccessible to social science inquiry
the longitudinal case, where the type of case is concerned with how the phenomenon or the
situation changes over time
Bryman & Bell (2011), however, argue that Yin’s categorisation is still rather narrow as it submits to
the positivist tradition, and that this research design has an effect on the external validity for its
inability to generalise to other cases or populations beyond the case. Stake (1995), another proponent
of case study research, is less concerned with issues of validity, and more concerned with the potential
to aiding change within the research setting, bringing the case study approach closer to action research
(Easterby-Smith et al., 2002). Furthermore, Stake (1995, 2000) sees the case study approach as the
‘study of the particular’, and this quest for particularity, competes with the search for generalisation. In
the three types of case study research Stake (1995) identified for example, with the first being that of
intrinsic case study, the researcher is undertaking it because of an intrinsic interest in the case, and
thus unable to contribute to generalisation. The second type of case study research is the instrumental
case study, where the case is examined to understand related issues or to redraw a generalisation.
Finally, the third type of case study research identified by Stake (1995) is the collective case study,
where the single case is extended to include many cases. Similarly, as discussed above, Yin (2009)
proposes the multiple or comparative case study design, holistic or embedded, which he argues
strengthens the case of the replication of the findings. Overall, Yin (2009) presents a much more
structured approach to case study research than Stake (1995), who advocates the use of a flexible
conceptual framework to guide the collection and analysis of data. Hence, critics of Yin’s work have
suggested that his research approach has been situated within a post-positivist paradigm, whereas
Stake’s has been a constructivist (Boblin, Ireland, Kirkpatrick & Robertson, 2013).
3.4.2 Grounded Theory
Prior to the seminal work of Glaser and Strauss (1967) titled The Discovery of Grounded Theory,
various publications on social research focused mainly on how to verify theories, and hence the desire
to generate theory often became secondary (Glaser & Strauss, 1999). It has been more than forty years
89
since, and their views on theory construction as well as shifting the discussion from data collection
methods to strategies for data analysis, provided qualitative researchers with ready justifications for
carrying out inductive qualitative studies. This resulted in grounded theory becoming the most cited
qualitative research method across disciplines and practices (Charmaz, 2008; Urquhart, 2000). Central
to grounded theory is the belief that contribution to knowledge may be increased by generating new
theories rather than analysing data within existing ones (Heath & Cowley, 2004). Hence, the best
approach is an initial systematic discovery of the theory from the data, that will fit and work, and then
illustrated by characteristic examples of data (Glaser & Strauss, 1967, 1999). Grounded theory is
based on an emergent logic, whereas it begins with the empirical world, and builds an inductive
understanding of it as events unfold and knowledge accrues (Charmaz, 2000, 2008). Fundamental
canons of the grounded theory method include: “(1) minimizing preconceived ideas about the research
problem and the data, (2) using simultaneous data collection and analysis to inform each other,
(3) remaining open to varied explanations and/or understandings of the data, and (4) focusing data
analysis to construct middle-range theories” (Charmaz, 2008, p. 155). What makes this approach to
analysis of qualitative data different to other approaches are the two key features of grounded theory
highlighted by Urquhart (2000) as the building blocks for this approach: ‘the researcher has to set
aside theoretical ideas’ and the ‘concepts are developed through constant comparison’. The former
tenet raised questions and created confusion initially, as the researcher cannot engage in any kind of
research without preconceptions. Urquhart (2000) argues that this idea implies that the researcher does
not examine the extant literature a priori, though the original position of Glaser & Strauss (1967) is far
more subtle than contemporary interpretations; it is prescribed to ensure that the researcher takes an
inductive rather than a deductive approach. The concept of constant comparison is at the heart of
grounded theory as a method, and without it grounded theory cannot be developed (Fernández, 2012;
Urquhart, 2000). Although the constant comparative method predated grounded theory (Glaser &
Strauss, 1967), Glaser & Strauss’ contribution was to emphasise the ongoing reflection and analysis
formalised in coding procedures, generation of categories and theoretical Memo-writing. Ideas, which
were generated through reflection and analysis, are subject to further comparisons (Heath & Cowley,
2004). Nonetheless, “verifying as much as possible with as accurate evidence as possible is requisite
while one discovers and generates his theory – but not to the point where verification becomes
paramount as to curb generation” (Glaser & Strauss, 1999, p. 28). The constant comparative method
requires only saturation of data in contrast to analytical induction, which requires consideration of all
available data, nor are the data restricted to one kind of clearly defined case (Glaser & Strauss, 1967,
1999). Theoretical saturation is achieved when the main concern of the research can be accounted for,
and further sampling fails to add significant value to the study through adding new categories or
properties. Sampling in its turn in grounded theory, is limited by theoretical saturation, and driven by
conceptual emergence, not by design (Fernández, 2012). As Glaser & Strauss (1999, p. 45) put it,
theoretical sampling is the process of data collection for generating theory, whereby, “the analyst
jointly collects, codes and analyses his data and decides what data to collect next and where to find
90
them, in order to develop his theory as it emerges”. In short, this process of data collection is
controlled by the emerging theory, whether substantive or formal (Glaser & Strauss, 1967, 1999).
Grounded theory has evolved and diversified, with the most important variations noted between the
founders of grounded theory themselves (Charmaz, 2000, 2008; Heath & Cowley, 2004). With the
major proponents of grounded theory moving the method in somewhat conflicting directions, Charmaz
(2000) argues that Glaser’s (1978) position often comes closer to traditional positivism, whilst Strauss
and Corbin’s (1990) to post-positivism. Charmaz (2000) has also added another position to the mix,
that of constructivist grounded theory, which takes middle ground between postmodernism and
positivism. Glaser (1978) remained loyal to classic grounded theory, extending it to include more
detailed concepts such as theoretical sampling, theoretical coding and use of theoretical Memos.
Strauss and Corbin (1990) meanwhile, in their reformulation of grounded theory, focused on
developing the analytic techniques and providing detailed guidance (Heath & Cowley, 2004). Hence,
Glaser (1992) views the Straussian approach as a ‘full conceptual description’ that departed from the
grounded theory process (Charmaz, 2000; Heath & Cowley, 2004). Other differences that lie between
the Glaser and Strauss approaches to grounded theory, is the role they see for the literature, and the
distinctive prominence of induction, deduction and verification on theory generation (Heath &
Cowley, 2004). Nevertheless, as grounded theory roots derive from interactionism, Atkinson &
Delamont (2008) argue that grounded theory captures the ‘abductive’ logic, a compromise between the
arid philosophy of purely deductive logic and purely inductive logic. “Grounded theory starts with an
inductive logic but moves into abductive reasoning as the researcher seeks to understand emergent
empirical findings.” (Charmaz, 2008, p. 157) Through the abductive logic, analysts “explore the social
or natural world through practical engagements with it, derive working models and provisional
understandings, and use such emergent ideas to guide further empirical explorations” (Atkinson &
Delamont, 2008, p. 300). Furthermore, the role of emergence remains central to Glaser’s grounded
theory approach, whilst the Straussian approach relies less on emergence as they view other
influences, such as personal and professional experiences and ideas of the researcher that may spark
inquiry (Charmaz, 2008).
The constructivist grounded theory approach propositioned by Charmaz (2000), on the other hand,
remains focused on the concept of emergence, but also takes into account the conditions of the
research, and views the researcher as embedded in the research process. This position contradicts the
view held by Glaser (1978) that they should remove themselves from the influences of their discipline
and conditions of their research. It also departs from the rigid and prescriptive nature of grounded
theory as proposed by Strauss & Corbin (1990). In the constructivist grounded theory, the researcher
and subjects frame the interaction and confer meaning upon it, whilst causality is suggestive,
incomplete and indeterminate, hence grounded theory remains open to refinement (Charmaz, 2000).
Constructivists view the emergent nature of the method itself “as rising from researchers’ questions,
91
choices, and specific strategies and thus remain inseparable from their earlier and evolving
perspectives” (Charmaz, 2008).
3.4.3 Grounded Case Research
Generating theory grounded in case study data, an approach that has been tested and detailed by
Eisenhardt (1989), could be rewarding for both IS and management researchers (Fernández, 2012). In
addition, although both methodologies support research conducted within the interpretive research
paradigm, they do not imply the use of a particular type of evidence. Yin (1981) suggests that case
study research can be carried out by using either qualitative or quantitative evidence. Similarly, Glaser
(1999) argues that the grounded theory method can be used on any data or combination of data, as this
method was developed initially using quantitative data.
Mäkelä & Turcan (2007) regard methodologies as partly overlapping viewpoints to the study of social
reality. They do not consider case study as a distinct methodology, but instead they conceptualise
cases as a choice of object of study, which is common in research following the grounded theory
methodology (de Vaus, 2001; Yin, 1994). On the other hand, Urquhart (2000) raises the question of
whether grounded theory is being used primarily as a technique for analysing data, or as a research
philosophy in its own right, owing to the growing trend of IS research that is undertaken by combining
methodologies. Fernández (2012) calls for caution when combining methods like case study and
grounded theory, in that the prerequisites of case study research do not distort true emergence for
theory generation (Glaser, 1998). For case studies, “theory development as part of the design phase is
essential, whether the ensuing case study’s purpose is to develop or to test theory”, in contrast to other
methods like ethnography or grounded theory (Yin, 2009, p. 35). Hence, in order to avoid conflict
when combining these two methodologies, the researcher must clearly specify which one is driving the
investigation (Fernández, 2012).
The grounded case research approach is increasingly adopted in many studies in IS research (Arshad,
Ahlan & Ibrahim, 2013; Fernández, 2012; Halaweh, 2012; Laws & McLeod, 2004; Mäkelä & Turcan,
2007). Fernández (2012), for example, used grounded theory as the overarching methodology to study
data from an exploratory IS case study to drive data-gathering activities within and outside the case
study. The researcher experienced a high degree of stimulation by interacting with both the
participants who were positive to the research, and the rich data generated. In an empirical research on
e-commerce security perceptions, Halaweh (2012) used Straussian grounded theory in conjunction
with case study research, under interpretive assumptions as a methodology. The study concluded that
by combining these approaches, it added more rigour to the research, and strengthened triangulation.
In an IT outsourcing study in Malaysia, Arshad et al. (2013) found that the application of both case
study and grounded theory methods added to rigour, and regard it as an innovative and reliable theory
building approach. Whilst Fernández (2012) used the Glaserian grounded theory approach, Halaweh
(2012) used the Straussian approach. The Straussian approach to grounded theory is considered a
92
qualitative research method, not a methodology, whereas the Glaserian approach considers grounded
theory as a complete research methodology that can be used entirely on its own (Fernández, 2012;
Halaweh, 2012; Urquhart, 2000). Arshad et al. (2013) on the other hand, did not make a distinction,
and used the grounded theory approach as prescribed by Glaser & Strauss (1999), before they parted
their ways.
3.4.4 The Structured-Case Approach
There have been many attempts to roadmap theory-building in interpretive, and in particular case
study research (Carroll & Swatman, 2000; Eisenhardt, 1989) as discussed in Section 3.4.3 above.
Nevertheless, although strategies for performing case research (Stake, 1995; Yin, 1994), and building
theory from case studies (Eisenhardt, 1989; Meredith, 1998) have been proposed and are well
documented, Carroll & Swatman (2000) argue that they do not adequately describe the theory building
process. They propose instead a methodological framework, structured-case, that assists IS researchers
to undertake and assess theory building research within the interpretive paradigm, whilst achieving
high-quality qualitative research. Miles & Huberman (1994) have already proposed a similar
approach, or rather a template, the pre-structured case, prescribed when time is limited and research
questions well specified, for a ‘quick and clean’ data collection and analysis. The structured-case
approach proposed by Carroll & Swatman (2000, p. 236), refers to the following:
‘structured’, in reference to the use of a formal process model comprising three structural
components: a conceptual framework, a pre-defined research cycle and a literature-based
scrutiny of the research findings, to assist the researcher in theory building. The
conceptual framework represents the researcher’s aims, understanding and theoretical
foundations and the research cycle guides data collection, analysis and interpretation;
together, these structures make the research process visible, record its dynamics and
document the process by which theory is induced from field data. The literature-based
scrutiny compares and contrasts the outcomes of the research process with a broad range
of literature to support or challenge the theory built
‘case’, used in the broad sense of what is being studied, rather than the narrower sense of
the case study research method. A case may be a person, group of people, organization,
process or information system
Structured-case has three main elements: the conceptual framework, the research cycle and the
literature-based scrutiny of theory built as depicted in Figure 3.4 below:
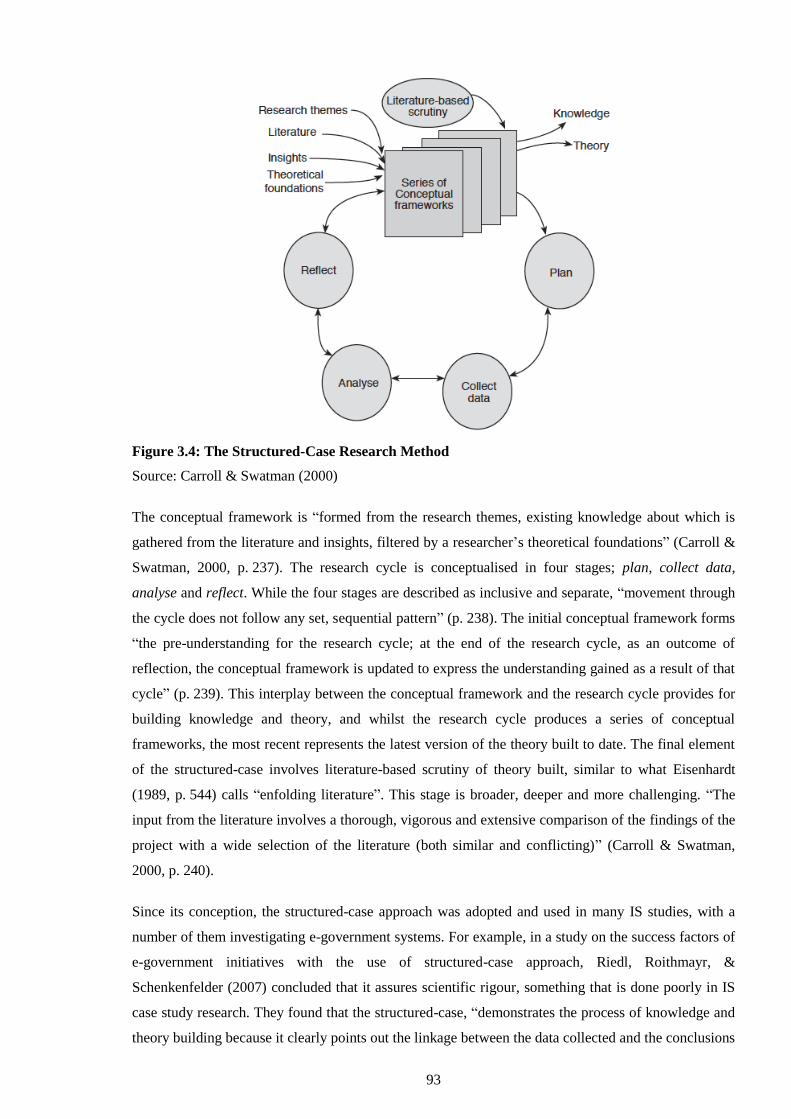
93
Figure 3.4: The Structured-Case Research Method
Source: Carroll & Swatman (2000)
The conceptual framework is “formed from the research themes, existing knowledge about which is
gathered from the literature and insights, filtered by a researcher’s theoretical foundations” (Carroll &
Swatman, 2000, p. 237). The research cycle is conceptualised in four stages; plan, collect data,
analyse and reflect. While the four stages are described as inclusive and separate, “movement through
the cycle does not follow any set, sequential pattern” (p. 238). The initial conceptual framework forms
“the pre-understanding for the research cycle; at the end of the research cycle, as an outcome of
reflection, the conceptual framework is updated to express the understanding gained as a result of that
cycle” (p. 239). This interplay between the conceptual framework and the research cycle provides for
building knowledge and theory, and whilst the research cycle produces a series of conceptual
frameworks, the most recent represents the latest version of the theory built to date. The final element
of the structured-case involves literature-based scrutiny of theory built, similar to what Eisenhardt
(1989, p. 544) calls “enfolding literature”. This stage is broader, deeper and more challenging. “The
input from the literature involves a thorough, vigorous and extensive comparison of the findings of the
project with a wide selection of the literature (both similar and conflicting)” (Carroll & Swatman,
2000, p. 240).
Since its conception, the structured-case approach was adopted and used in many IS studies, with a
number of them investigating e-government systems. For example, in a study on the success factors of
e-government initiatives with the use of structured-case approach, Riedl, Roithmayr, &
Schenkenfelder (2007) concluded that it assures scientific rigour, something that is done poorly in IS
case study research. They found that the structured-case, “demonstrates the process of knowledge and
theory building because it clearly points out the linkage between the data collected and the conclusions
94
drawn” (p. 1). The structured-case approach was adopted in another study by Irani et al. (2005), on
whether public sector organisations might benefit from the use of established ex-ante evaluation
techniques. The approach aimed to “discover and discuss relationships between concepts, so as to
build a ‘web of meaning’ and learning in this instance, with respect to the human and organizational
issues of information systems evaluation” (p. 66). The structured-case was also used as a theory-
building approach using action research (AR) interventions as part of a larger program of research in
information systems (Koeglreiter, Smith & Torlina, 2012). The researchers found that the use of the
structured-case, in combination with AR, made up for shortcomings that derive from using AR alone,
which in its turn poses challenges to theory building. Last but not least, in a study on health
informatics, Plummer (2001) endorsed the structured-case methodological framework for health care
information systems research, that goes beyond description to build theory. The researcher noted its
ability to “produce high quality case study research to gain deep knowledge and understanding about
the organizational issues of information systems and their relationship to performance and outcomes”
(p. 1).
3.4.5 The Evolutionary Case Approach
Similar to the structured-case methodological framework, the evolutionary case proposed by Dawson
(2008), is an iterative, theory-building approach, based on refining a conceptual framework or
theoretical model. It differs however from the structured-case, in that it is designed to “explicitly
explore emerging concepts in an evolving theoretical model based on reinforcement, revelation,
reflection and re-examination, in order to understand the relationship between theory and practice”.
Moreover, there is no literature-based scrutiny of the research findings, since this can be considered to
be theory-testing, rather than theory-building (Dawson, 2008, p. 29).
3.4.6 Chosen Approach: Rationale
Since this research comprises two cases, it employs the multiple or comparative case study design
(holistic, where each case does not consist of multiple embedded cases), in line with Yin’s (2009)
recommendations. Yin considers this choice as one of the research designs under the case study
method, which can then draw a single set of ‘cross-case’ conclusions. Miles et al. (2014, p. 30)
advocate that “multiple cases offer the researcher an ever deeper understanding of the processes and
outcomes of the cases, the chance to test (not just develop) hypotheses, and a good picture of locally
grounded causation”. They further argue that each case always occurs in a specified social and
physical setting, the ‘site’, and one cannot study individual cases devoid of their context. However, the
sampling of cases from the chosen population is unusual when building theory from case studies. The
cases for this research were chosen for theoretical, not statistical purposes. Thus, “the goal of
theoretical sampling is to choose cases, which are likely to replicate or extend the emergent theory”
(Eisenhardt, 1989, p. 537).
95
Qualitative data collection involving case studies can be intense and laborious for the researcher
(Lincoln & Guba, 1985; Miles, 1979; Yin, 1981). Although the data collected would be multifaceted,
rich in nature and offer a deep insight, it tends to overwhelm the researcher at almost every stage. The
big problem with qualitative data, Easterby-Smith et al. (2002, p. 117) concur, is “how to condense
highly complex and context-bound information into a format which tells a story in a way that is fully
convincing to the reader”. Grounded analysis provides a more open approach to qualitative data
analysis, which is closely linked to the idea of grounded theory. Contrary to the quantitative data
analysis where a structure is imposed on the data, in qualitative data analysis has to be derived from
the data, systematically teasing themes, patterns and categories. (Easterby-Smith et al., 2002).
Collected data from the cases in this study were analysed using the constant comparative method
which lies at the heart of grounded theory (Glaser & Strauss, 1967; Strauss & Corbin, 1990), as a
means of identifying and analysing categories and their relatedness, a process that facilitates the
researcher to develop theoretical perspectives that are grounded in the data (Lincoln & Guba, 1985;
Maykut & Morehouse, 1994). Miles et al. (2014) see the constant comparative method as ‘subsuming
particulars into more general classes’, which is a conceptual and theoretical activity. Similar to
theoretical sensitivity, iteration between first-level data and more general categories that evolve and
develop occurs until the category is saturated. On the whole, grounded theory is seen by Urquhart
(2000) and others (Hekkala, 2007; Hughes & Jones, 2003), primarily as a method of data analysis,
which can be used comfortably in most paradigms and sometimes can be set against other analyses
(Orlikowski, 1993). Similarly, Charmaz (2008) views grounded theory strategies as flexible, so
researchers may adapt them to the requirements of their studies. Charmaz further maintains:
“Grounded theory consists of transparent analytic guidelines; the transparency of the method enables
researchers to make transparent analytic choices and constructions.” (p. 162) Seeking to generate
theory grounded in case study data in this research required the use of grounded theory as a data
analysis method in a manner compatible with the case study strategy. Hence, the overarching approach
is the case study design, which was consistent with the reasons suggested by Benbasat et al. (1987,
p. 372) and Fernández (2012, p. 47), as adapted accordingly by the latter:
Case methodology is clearly useful when a natural setting or a focus on contemporary events
is needed
The researcher can answer the questions that lead to an understanding of the nature and
complexity of the processes taking place
Research phenomena not supported by a strong theoretical base may be fruitfully pursued
through case research
Conversely, when subjects or events must be controlled or manipulated in the course of a
research project, the case approach is not suitable
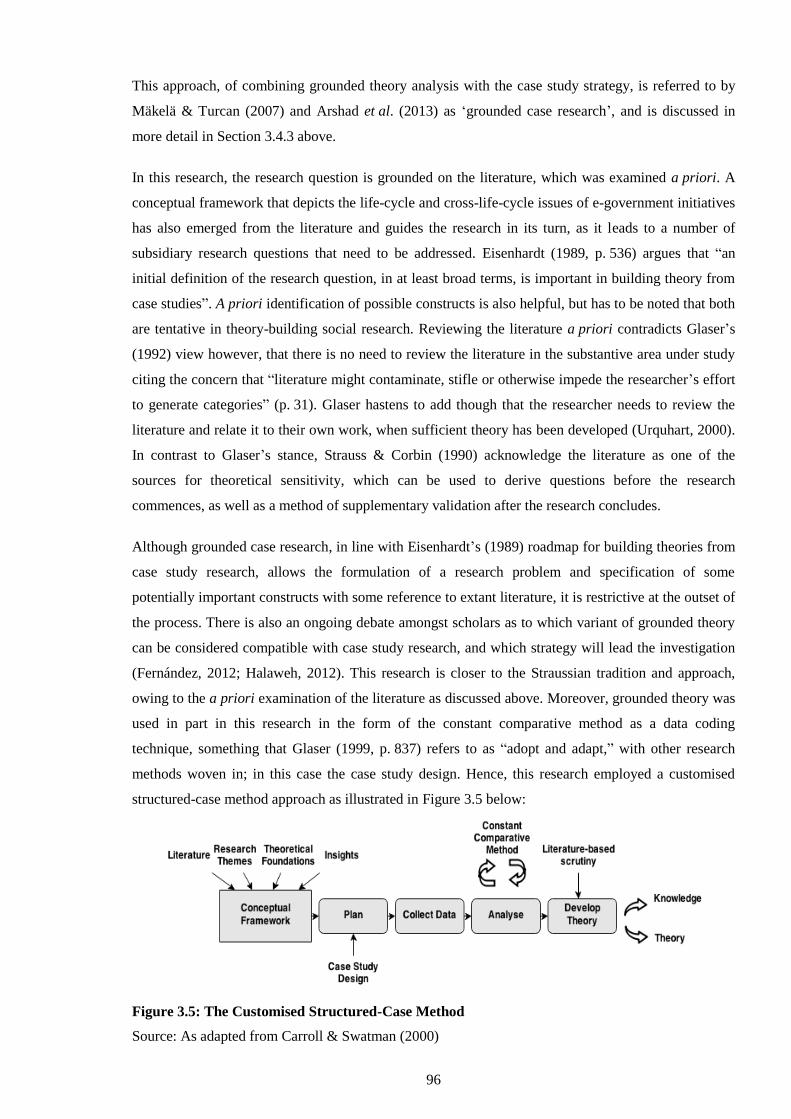
96
This approach, of combining grounded theory analysis with the case study strategy, is referred to by
Mäkelä & Turcan (2007) and Arshad et al. (2013) as ‘grounded case research’, and is discussed in
more detail in Section 3.4.3 above.
In this research, the research question is grounded on the literature, which was examined a priori. A
conceptual framework that depicts the life-cycle and cross-life-cycle issues of e-government initiatives
has also emerged from the literature and guides the research in its turn, as it leads to a number of
subsidiary research questions that need to be addressed. Eisenhardt (1989, p. 536) argues that “an
initial definition of the research question, in at least broad terms, is important in building theory from
case studies”. A priori identification of possible constructs is also helpful, but has to be noted that both
are tentative in theory-building social research. Reviewing the literature a priori contradicts Glaser’s
(1992) view however, that there is no need to review the literature in the substantive area under study
citing the concern that “literature might contaminate, stifle or otherwise impede the researcher’s effort
to generate categories” (p. 31). Glaser hastens to add though that the researcher needs to review the
literature and relate it to their own work, when sufficient theory has been developed (Urquhart, 2000).
In contrast to Glaser’s stance, Strauss & Corbin (1990) acknowledge the literature as one of the
sources for theoretical sensitivity, which can be used to derive questions before the research
commences, as well as a method of supplementary validation after the research concludes.
Although grounded case research, in line with Eisenhardt’s (1989) roadmap for building theories from
case study research, allows the formulation of a research problem and specification of some
potentially important constructs with some reference to extant literature, it is restrictive at the outset of
the process. There is also an ongoing debate amongst scholars as to which variant of grounded theory
can be considered compatible with case study research, and which strategy will lead the investigation
(Fernández, 2012; Halaweh, 2012). This research is closer to the Straussian tradition and approach,
owing to the a priori examination of the literature as discussed above. Moreover, grounded theory was
used in part in this research in the form of the constant comparative method as a data coding
technique, something that Glaser (1999, p. 837) refers to as “adopt and adapt,” with other research
methods woven in; in this case the case study design. Hence, this research employed a customised
structured-case method approach as illustrated in Figure 3.5 below:
Figure 3.5: The Customised Structured-Case Method
Source: As adapted from Carroll & Swatman (2000)
97
The structured-case approach has been promoted as a means of supporting theory building as part of
case study research (Carroll & Swatman, 2000; Koeglreiter et al., 2012), and thus, was found
particularly suitable for this study. Nevertheless, it had to be adapted from the original methodological
framework as proposed by Carroll & Swatman (2000) and discussed in Section 3.4.4 above, since it
does not follow the cyclical approach producing a series of conceptual frameworks. The customised
methodological framework retains loosely the three main elements: the conceptual framework, the
research cycle and the literature-based scrutiny of theory built, whilst the phase of reflection becomes
that of theory building. The conceptual framework for this research derives from the literature, and
represents the researcher’s views and aims. It is based on preconceived notions and a conceptual
structure that can underpin the research, grounded on available, but possibly scarce resources
(Orlikowski & Baroudi (1991) cited in Koeglreiter et al. (2012)). In the first phase of ‘plan’, the case
study design was applied, as “the research paradigm and the concepts and relationships in the
conceptual framework are used to select a research design” (Carroll & Swatman, 2000, p. 238). The
appropriate cases were selected and ways of gaining access to the organisations concerned and the
participants, as well as methods for collecting, recording, processing and analysing data (and related
criteria for rigour and validity) were planned. In the second stage, data were collected and the
researcher’s impressions and interpretations were recorded in Field Notes, as guided initially by the
plan outlined in the previous stage. This stage was flexible enough to allow for additional adjustments
to data collection instruments, such as adding or amending questions as appropriate, to the interview
schedule (Carroll & Swatman, 2000; Eisenhardt, 1989). Contrary to Carroll & Swatman’s (2000)
structured-case approach, the data analysis did not overlap with data collection. The data analysis
phase employed the constant comparative method as discussed in Section 3.4.2 above, querying the
data and making constant comparisons to advance theoretical development, via a computer-assisted
qualitative data analysis software program. The themes in the conceptual framework were used as
initial codes to guide the analysis, along with ‘any other’ codes to incorporate new themes. The
circular, iterative and reflective nature of constant comparative method counterbalanced the iterations
back and forth between the data, the tentative findings and the inputs to the conceptual framework,
followed by its iterative updates, as prescribed by Carroll & Swatman (2000). The theory development
phase in this research involved a literature-based scrutiny for both the in-case and cross-case findings,
before developing applicable theoretical perspectives.
3.5 Validity
There is a general consensus that qualitative researchers have to persuade themselves and others as to
the validity and reliability of their findings (Bannister, 2001b; Creswell & Miller, 2000; Denzin &
Lincoln, 2008b; Silverman, 2010). The challenges to validity however are not confined to qualitative
research; quantitative researchers who examine natural phenomena have no magic solution either.
There are various procedures to validate the findings of a study and these can be perplexing in many
ways (Silverman, 2010). In discussing the issue of validity, Remenyi et al. (1998) note that the criteria
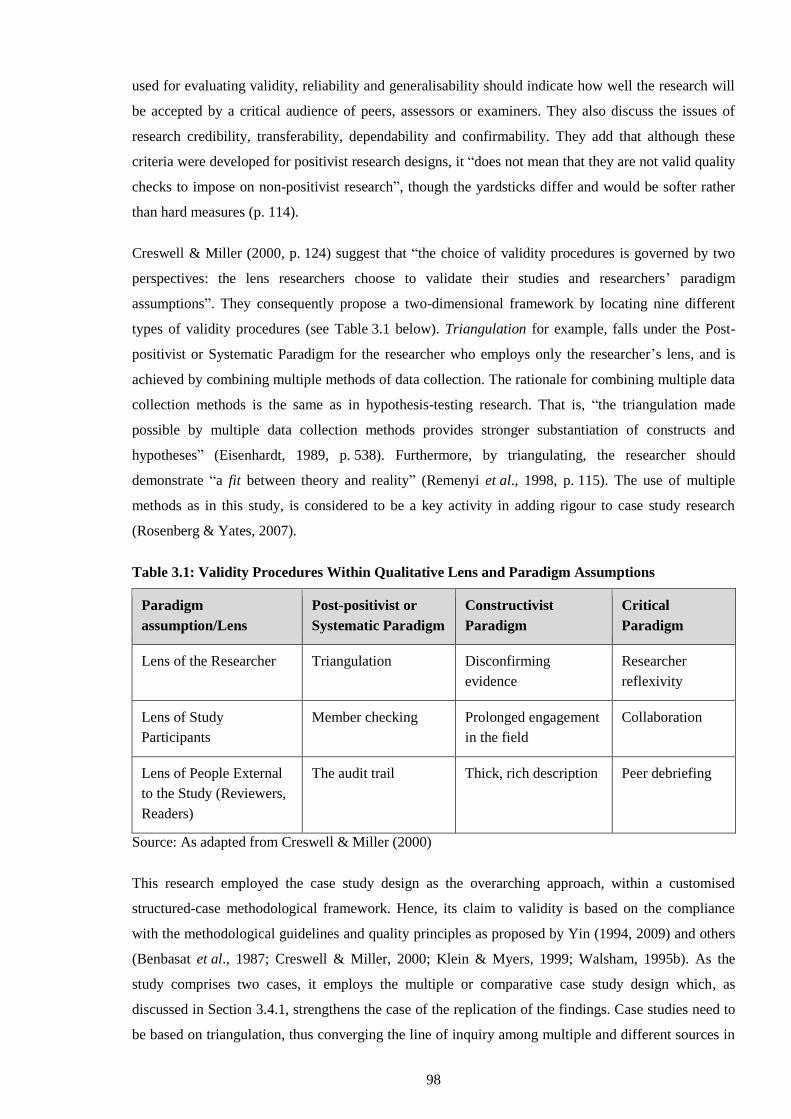
98
used for evaluating validity, reliability and generalisability should indicate how well the research will
be accepted by a critical audience of peers, assessors or examiners. They also discuss the issues of
research credibility, transferability, dependability and confirmability. They add that although these
criteria were developed for positivist research designs, it “does not mean that they are not valid quality
checks to impose on non-positivist research”, though the yardsticks differ and would be softer rather
than hard measures (p. 114).
Creswell & Miller (2000, p. 124) suggest that “the choice of validity procedures is governed by two
perspectives: the lens researchers choose to validate their studies and researchers’ paradigm
assumptions”. They consequently propose a two-dimensional framework by locating nine different
types of validity procedures (see Table 3.1 below). Triangulation for example, falls under the Post-
positivist or Systematic Paradigm for the researcher who employs only the researcher’s lens, and is
achieved by combining multiple methods of data collection. The rationale for combining multiple data
collection methods is the same as in hypothesis-testing research. That is, “the triangulation made
possible by multiple data collection methods provides stronger substantiation of constructs and
hypotheses” (Eisenhardt, 1989, p. 538). Furthermore, by triangulating, the researcher should
demonstrate “a fit between theory and reality” (Remenyi et al., 1998, p. 115). The use of multiple
methods as in this study, is considered to be a key activity in adding rigour to case study research
(Rosenberg & Yates, 2007).
Table 3.1: Validity Procedures Within Qualitative Lens and Paradigm Assumptions
Paradigm
assumption/Lens
Post-positivist or
Systematic Paradigm
Constructivist
Paradigm
Critical
Paradigm
Lens of the Researcher Triangulation Disconfirming
evidence
Researcher
reflexivity
Lens of Study
Participants
Member checking Prolonged engagement
in the field
Collaboration
Lens of People External
to the Study (Reviewers,
Readers)
The audit trail Thick, rich description Peer debriefing
Source: As adapted from Creswell & Miller (2000)
This research employed the case study design as the overarching approach, within a customised
structured-case methodological framework. Hence, its claim to validity is based on the compliance
with the methodological guidelines and quality principles as proposed by Yin (1994, 2009) and others
(Benbasat et al., 1987; Creswell & Miller, 2000; Klein & Myers, 1999; Walsham, 1995b). As the
study comprises two cases, it employs the multiple or comparative case study design which, as
discussed in Section 3.4.1, strengthens the case of the replication of the findings. Case studies need to
be based on triangulation, thus converging the line of inquiry among multiple and different sources in
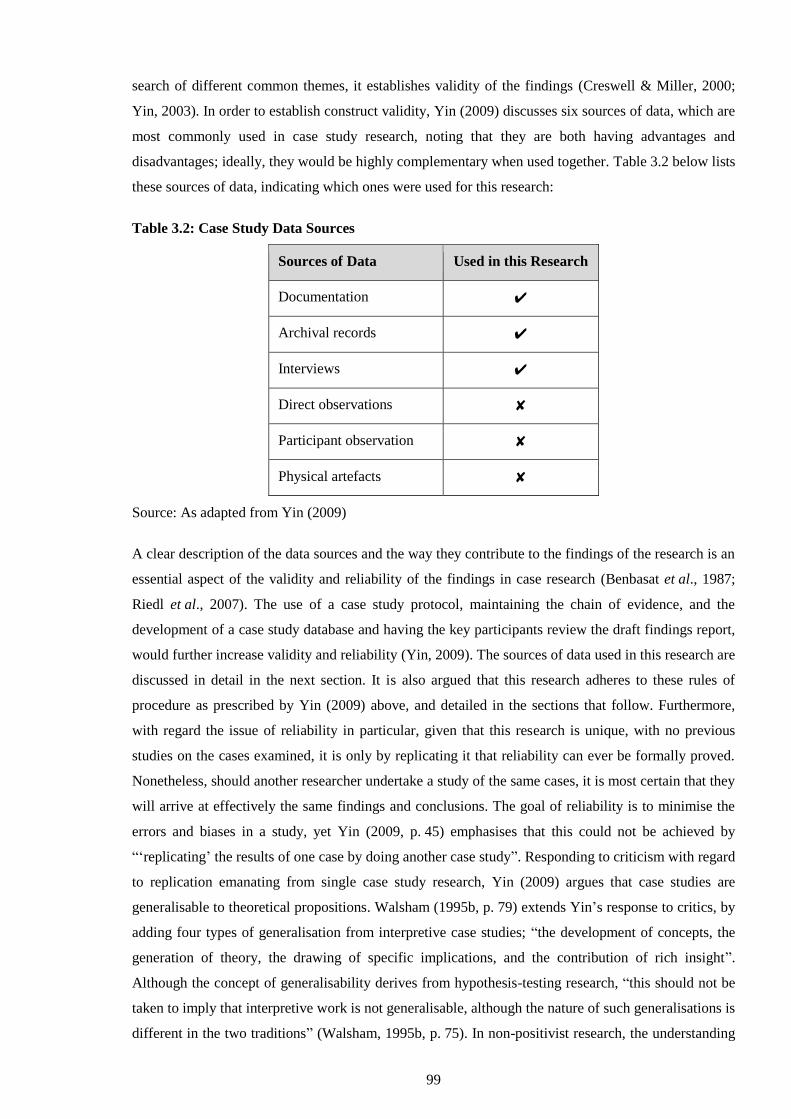
99
search of different common themes, it establishes validity of the findings (Creswell & Miller, 2000;
Yin, 2003). In order to establish construct validity, Yin (2009) discusses six sources of data, which are
most commonly used in case study research, noting that they are both having advantages and
disadvantages; ideally, they would be highly complementary when used together. Table 3.2 below lists
these sources of data, indicating which ones were used for this research:
Table 3.2: Case Study Data Sources
Sources of Data Used in this Research
Documentation ✔
Archival records ✔
Interviews ✔
Direct observations ✘
Participant observation ✘
Physical artefacts ✘
Source: As adapted from Yin (2009)
A clear description of the data sources and the way they contribute to the findings of the research is an
essential aspect of the validity and reliability of the findings in case research (Benbasat et al., 1987;
Riedl et al., 2007). The use of a case study protocol, maintaining the chain of evidence, and the
development of a case study database and having the key participants review the draft findings report,
would further increase validity and reliability (Yin, 2009). The sources of data used in this research are
discussed in detail in the next section. It is also argued that this research adheres to these rules of
procedure as prescribed by Yin (2009) above, and detailed in the sections that follow. Furthermore,
with regard the issue of reliability in particular, given that this research is unique, with no previous
studies on the cases examined, it is only by replicating it that reliability can ever be formally proved.
Nonetheless, should another researcher undertake a study of the same cases, it is most certain that they
will arrive at effectively the same findings and conclusions. The goal of reliability is to minimise the
errors and biases in a study, yet Yin (2009, p. 45) emphasises that this could not be achieved by
“‘replicating’ the results of one case by doing another case study”. Responding to criticism with regard
to replication emanating from single case study research, Yin (2009) argues that case studies are
generalisable to theoretical propositions. Walsham (1995b, p. 79) extends Yin’s response to critics, by
adding four types of generalisation from interpretive case studies; “the development of concepts, the
generation of theory, the drawing of specific implications, and the contribution of rich insight”.
Although the concept of generalisability derives from hypothesis-testing research, “this should not be
taken to imply that interpretive work is not generalisable, although the nature of such generalisations is
different in the two traditions” (Walsham, 1995b, p. 75). In non-positivist research, the understanding
100
gained of a process in one setting can form the basis on which such processes are understood in other
similar context (Remenyi et al., 1998). This research is concerned with how to improve e-government
initiatives, by studying two public-sector e-government projects in the UK and the Republic of Ireland.
Hence, there are many patterns and generalisations that derive from this study that could apply in other
public-sector e-government and IT projects alike, in the aforementioned countries or elsewhere.
Furthermore, by using the constant comparative method to analyse the data via a computer-assisted
qualitative data analysis software program, the risk of bias-induced distortions was reduced. The
constant comparison of incidents validates, modifies, or rejects the expert researcher’s observations
(Fernández, 2012). Regardless of whether a computer program is used to assist in the process, the
researcher is the main tool for analysis (Denzin & Lincoln, 2005). Hence, the reliability, or
trustworthiness, of results obtained depends on the skill of the user in both executing method and
using software (Bazeley, 2007). The use of qualitative data analysis software such as NVivo in this
research, “can facilitate many aspects of the iterative process associated with grounded theory and can
help provide a transparent account of this, which should ultimately enhance study validity”
(Hutchison, Johnston & Breckon, 2010, p. 285). Data analysis software (skilfully used) supports more
rigorously and fluidly the research processes, and gives more confidence that the data analysis was
transparent and thorough (Richards, 2002; Welsh, 2002). For example, “excerpts from the program
can be included in written reports to demonstrate rigour and allow others to more accurately evaluate
the research”, (Bringer, Johnston & Brackenridge, 2006, p. 247). Another benefit of the consistent use
of such software, is that it doubles as an audit trail of how those conclusions were reached, as validity
arises through data saturation – when no new concepts emerge (Bazeley, 2009; Jones, 2011).
In conclusion, it is claimed that this research meets the criteria of validity, reliability and, within the
constraints of qualitative research of this nature, generalisability. It has also followed good practice
overall, and complied with the methodological guidelines and principles of quality interpretive
research as outlined above.
3.6 Case Studies Selection
In order to achieve its aims, this research was undertaken by studying two public sector e-government
projects in the UK and the Republic of Ireland, namely the UK government Directgov Portal and the
Irish Revenue Online Service (ROS) Portal. The rationale behind the selection of these cases was two-
fold. In broad terms, each project can be considered as a ‘case’ in the sense that a government
department owns each, for at least the past ten years. Furthermore, they are both considered successful
e-government projects having had received many accolades and awards over that period. The second
reason for the selection of these two case studies was a matter of access.
At around the end of Stage I of the Doctor of Business Administration (DBA) Programme at Henley
Business School, two preliminary interviews were conducted with key players in the field of public-
101
sector e-government and IT projects in UK central government. These were to serve as pilot in order
to determine the research questions, test a draft interview schedule, and also ask the research
participants to recommend further relevant contacts in the public-sector organisations behind the
Directgov case. Pilot testing the questions also allowed the researcher to gain important insider
information that made the interview protocol work better, without squandering the population intended
to interview. It has to be noted here that Directgov was the only case selected at the time, and the quest
for identifying a second case was still ongoing, although the Criminal Justice Information Technology
(CJIT) project at the UK’s Department of Justice was briefly considered.
In the quest to select another case, the researcher’s academic background proved invaluable. Whilst
attending an e-government conference in the Republic of Ireland, he was briefed on ROS, which was
eventually chosen as the second case. Furthermore, establishing a principal contact at the Revenue
Commissioners, the government department behind ROS, enabled access to relevant research
participants in the organisation who had first-hand experience and knowledge about the case.
A brief introduction and background to each of the case studies is contained in the next chapter, which
describes the case studies.
3.7 Instrumentation
Knowing what you want to find out, at least initially, leads inevitably to the question of how you will
get that information (Miles & Huberman, 1994; Miles et al., 2014). The question of how you will get
that information, leads to the choice of instruments you will design and use to collect data.
Instrumentation comprises specific methods for collecting data, whether these are interviews, field and
participant observation, textual analysis or focus groups to mention a few examples in qualitative
research. The instrumentation of choice, could even be modified progressively to explore new leads
(Miles et al., 2014).
3.7.1 Data Sources
Gathering data for this research started with consulting public sources with information available on
the chosen cases. Nevertheless, most were secondary sources, and most appropriate to give only an
idea of the current situation and developments surrounding the cases. Mason, McKenney & Copeland
(1997), cited in Bannister (2001b), use the term “espousing theory” to describe the bias that can be
induced by this form of research, and thus secondary sources of that type are not generally adequate
for good research. In this research, the sources of data used, in order of importance, were therefore:
case stakeholders and experts, documentation (publicly available and internal), and other material,
such as archival records mentioned above. Archival records used in this research consisted of letters
and reports (Cabinet Office, 2010; Fox, 2010; Transform, 2010), as well as historical versions (or
102
‘snapshots’) of the Directgov website were accessed via the Discovery engine9 and the UK
Government Web Archive,10
both run by the National Archives Agency in the UK.
The case stakeholders and experts were the most important primary source, and it was fortunate that
the researcher interviewed a number of them who were involved with the cases since their conception.
As one would expect, however, at the time the interviews took place some of the research participants
had moved on or moved up the ranks, becoming senior public servants, thus not involved directly with
the cases anymore. Documentation, such as auditing or evaluation reports that was available publicly
or provided internally, served mainly as a backup to the data collected from primary sources and to
cross-check factual details. Where one of these documents or archival records is referenced in the
body of this thesis, it is also included in the references. Research participants at the ROS case were
more forthright in providing internal documentation, whilst those in Directgov were more conservative
in doing so. The same applied with other material, such as government-commissioned surveys,
internal statistics and charts, which served mainly to visualise the timeline or progress of the cases
over the years, and build a wider picture. In addition, the research respondents in ROS were much
more accommodating and appreciated the effort made by the researcher to travel to the Republic of
Ireland for the purpose of interviewing them, as well as the logistics involved. Notwithstanding being
public servants, they offered their insights readily and candidly, to the degree that they could be
classified under the category of what King (2004) describes as the ‘over-communicative interviewee’,
but without the long-winded digressions that go with that type.
3.7.2 Interviews
Most people will have a familiarity with interviews derived from their experience with employment,
appraisal, or even marketing and media broadcasting interviews, and hence will feel at ease with that
method. Nevertheless, the objective of an academic research interview is, “not to have an interesting
dialogue with the informant, but to collect insightful evidence”, which subsequently will be produced
in the form of an interview transcript that will be processed in answering the research question
(Remenyi, 2011, p. 2). Besides, Myers & Newman (2007) call for caution by noting that the interview
is a very artificial situation; it usually involves a researcher talking to someone who is a complete
stranger, and could be intrusive upon the social setting, potentially interfering with people’s behaviour.
Kvale (2002, p. 16) concurs by stating: “Research interviews are in line with a pervasive interview
culture of making the private public, with individual confessions and a stabilisation of vulnerable
selves through the interview production of narratives of the self.” Nonetheless, qualitative research
interviews have grown popular in the qualitative inquiry as the most common method of data
gathering. Two to three decades ago, “qualitative research interviews hardly existed in textbooks on
social science methodology” (Kvale, 2002, p. 9).
9 http://discovery.nationalarchives.gov.uk
10 https://www.nationalarchives.gov.uk/webarchive
103
Whilst interviews have both strengths and weaknesses, on balance, they can tackle different types of
research questions in organisations, making it the most flexible method available. King (2004, p. 21)
suggests, “Most people like talking about their work – whether to share enthusiasm or to air
complaints – but rarely have the opportunity to do so with interested outsiders.” It could also be
argued that human actions are significantly influenced by the setting in which they occur. Therefore,
the researcher should interview and observe on site (Marshall & Rossman, 2006), as only through
face-to-face interaction a deeper understanding of perspective can be captured (Yin, 2003). Since
beliefs, values, thoughts and assumptions are involved, this could not have been realised by
quantitative methods such as questionnaires. As Myers & Newman (2007, p. 12) put it, “The entire
qualitative interview can be seen as a drama with a stage, props, actors, an audience, a script, and a
performance.”
Owing to their epistemological positions, King (2004) identified two approaches to qualitative
interview methodologies: the ‘realist’ and the ‘radical constructionist’ approaches. The former
approach treats participants’ accounts as having a direct relationship with their ‘real’ experiences in
the world beyond the interview setting, whilst the latter makes no attempts to associate with the
participants’ personal experiences. Other approaches include the ‘phenomenological’ and the ‘social
constructionist’. In terms of epistemological positions, the phenomenological approach tends to
occupy the middle-ground, whereas the social constructionists see the interview as an interaction,
constructed in the particular context (King, 2004). Interviewing includes a wide variety of forms and a
multiplicity of uses. Although the most common form of interviewing involves individual, face-to-face
interaction, it could also take the form of a face-to-face group interview or focus group, as it is most
commonly referred to in marketing research. Other forms include mailed or self-administered
questionnaires, and telephone surveys (Fontana & Frey, 2000, 2008). Furthermore, there are various
types of qualitative interviews: structured, semi-structured, and unstructured. In a structured interview,
there is a complete script that is prepared beforehand and hence there is no room for improvisation. It
could involve the research participant completing a questionnaire in the presence of the researcher or
not, and is commonly used in survey research quantifying and coding the responses for further
quantitative analysis. In a semi-structured interview, the researcher may have prepared some questions
beforehand, but there is a need for improvisation. These questions usually take the form of an
interview guide or schedule, as discussed in the next section. An example of a semi-structured
interview is a media interview of a journalist with a political figure, where certain questions would be
asked allowing the interviewee to follow their thoughts, but probing to evoke additional information
would be required. In an unstructured interview, the researcher does not use specific questions but
simply asks the research participant to talk about the subject of interest. For example, if the researcher
needs to create an account of people’s lives in a given group, the interview needs to be at length and
in-depth, in an unstructured way (Fontana & Frey, 2000, 2008; Myers & Newman, 2007; Remenyi,
2011). Both semi-structured and unstructured interviews are very common in qualitative research, and
are thus often called qualitative interviews.
104
In this research, the interviews were the data collection instrument of choice, for their ability to
address focused questions about organisations, for instance questions about decision-making
processes. Other advantages that this method offers that weighed towards its selection are that it is
ideally suited to examine topics in which different levels of meaning needed to be explored, and it is
the method that most research participants accept straightforwardly. Semi-structured interviews were
designed, as they are most commonly used in exploratory studies gaining insights and detecting
meanings research participants attach to phenomena. Furthermore, the flexibility – depending on the
course of conversation, follow-up, new questions raised, and most importantly, learning the research
respondent’s viewpoint regarding situations relevant to the broader research problem – was also a
deciding factor.
3.7.3 Interview Schedule and Protocol
In the ‘battle of research paradigms’, the academic and disciplinary resistance to qualitative research
illustrates the need for further rigour and strengthening of the procedural issues in this field of
discourse (Denzin & Lincoln, 2008a; Glaser & Strauss, 1999). The controversies surrounding the
evidence-based research movement were reviewed by Denzin (2009), who favours flexible quality and
standards guidelines in qualitative inquiry that are not driven by quantitative criteria. However, the
various sets of guidelines and checklists are all applying a ‘post-positivist’ soft quantitative grid
(confirmability, hypotheses, credibility) on conducting qualitative research (Denzin, 2009). Systematic
data collection for example, should follow the definition of a research question and a priori
specification of constructs which, although tentative, could guide the researcher on what questions to
ask (Eisenhardt, 1989; Mintzberg, 1979).
Before commencing an interview, the researcher should have developed an interview guide or
schedule, which incorporates the questions, to put to the research participants. Krauss et al. (2009,
p. 245) argue that, “The development of the interview guide is an integral aspect of the process of
conducting qualitative research, yet one that receives little attention in the literature.” The interview
schedule questions should focus on the actual research question and sub-questions of the study, and
the issues on which the researcher wishes to obtain data and information. Remenyi (2011) advises
against a lengthy list of questions and that normally, six to eight questions or topics should suffice for
a one-hour interview. Moreover, the interview schedule does not end at the start of the first interview.
It can be modified through use, adding or re-formulating questions for issues and topics that emerged
during the interview, or even dropping questions that did not elicit a response (King, 2004; Remenyi,
2011).
Apart from the interview schedule, the detailed plan that would be needed for an interview, or a series
of interviews, is referred to as interview protocol (Remenyi, 2011). Turner (2010) suggests that the
interview protocol is one of the more popular areas of interest in qualitative research design as
effective implementation of its practical components, including interviews, would lead to a well-
105
rounded collection of in-depth information. According to Jacob & Furgerson (2012, p. 2), the
interview protocol is “more than a list of interview questions; it also extends to the procedural level of
interviewing”. The checklist includes how the research participants will be informed, and calls for the
researcher to collect informed consent before the interview commences. It also serves to remind the
researcher of the information that she or he is interested in collecting, what actions need to be taken
during the interview and, in case of using recording, that permission needs to be sought. Further, it
dictates what the researcher will say at the conclusion of the interview (Halaweh, 2012; Jacob &
Furgerson, 2012).
Early arrival at the interview site aids the researcher to assimilate the atmosphere and the environment.
Likewise, it gives plenty of time to put the interviewee at ease, establishing a rapport before
commencing the interview. Permission to record the interview using electronic means, such as an
audio-recorder, should always be sought from the research participant. Should confidential or sensitive
information surface during the discussion, the researcher should offer to switch the recorder off, whilst
seeking permission to continue taking notes manually (Collis & Hussey, 2014; Remenyi, 2011). Other
formalities that concern interviewing include research of the organisation prior to the interview taking
place, and appropriate dress code for the researcher. Impression management is very important, but
not to the extent of creating a ‘false impression’ of the researcher’s background and experience. The
key point is to make the research participant feel comfortable, and to minimise social dissonance
(Myers & Newman, 2007).
In this research, an interview schedule was developed by initially reflecting on what questions to ask,
and how these questions may be put to the research participants, avoiding leading questions and using
a language that could be understood. The next step was to map the thesis research question and sub-
questions to the interview schedule questions, and determine the logical order (see Table 3.3 below).
The interview schedule comprised ten core questions, with three of the questions containing up to
three sub-questions. Furthermore, two opening questions were added, resulting in twelve questions
overall. The interview schedule was further modified slightly to fit each sample category and hence,
three interview schedules with minor disparities were initially used. For the interview schedules that
were used for interviewing public servants in Directgov, one of the cases, and for expert/consultants
with knowledge of the case for example, see Appendix 1. The order in which the questions were asked
was flexible, and the research participants in some cases did not need to answer all the questions on
the schedule, since they had provided the relevant information when answering another question. This
is one of the advantages of conducting qualitative research, as under the positivist paradigm,
interviews are structured with pre-planned questions, and each interviewee is asked the questions in
the same order. In addition, it has to be noted, where the research participant’s expertise did not match
some of the questions, those were omitted, merged or were put to the participant in a different form.
For instance, research participants in both cases, i.e. senior managers responsible for strategy or
marketing/outreach who were not familiar with technology, were asked a merged question covering all
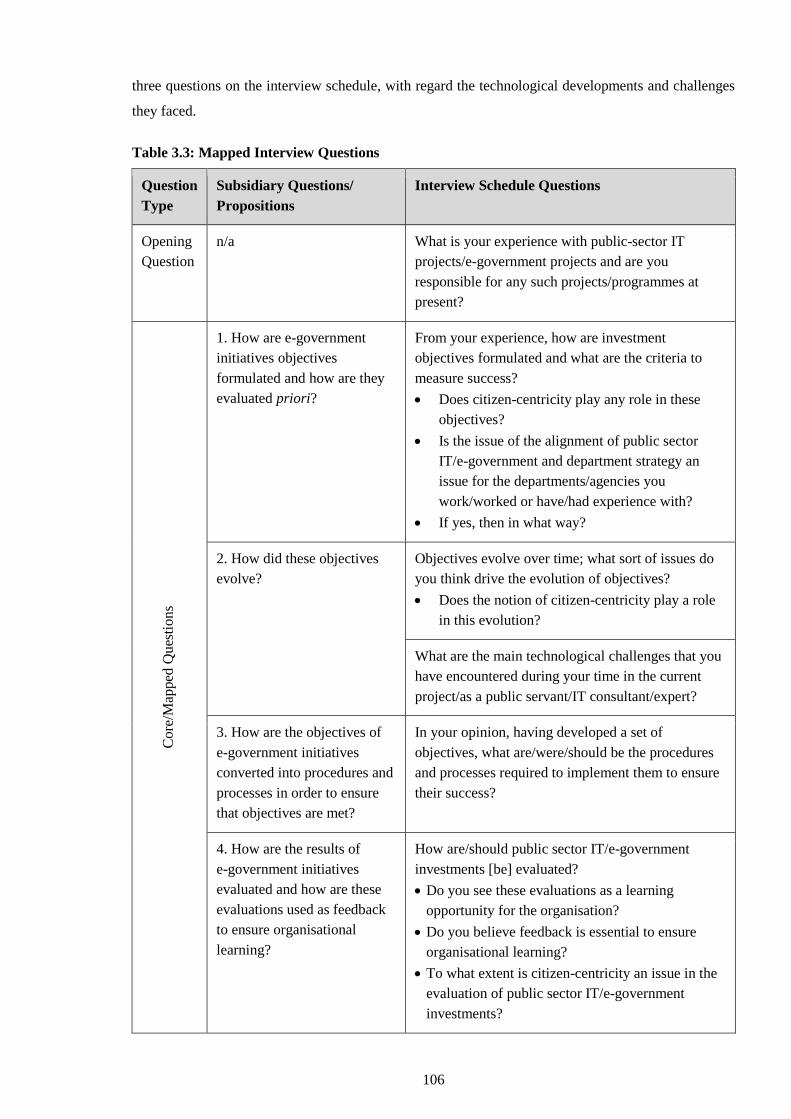
106
three questions on the interview schedule, with regard the technological developments and challenges
they faced.
Table 3.3: Mapped Interview Questions
Question
Type
Subsidiary Questions/
Propositions
Interview Schedule Questions
Opening
Question
n/a What is your experience with public-sector IT
projects/e-government projects and are you
responsible for any such projects/programmes at
present?
Core
/Map
ped
Ques
tions
1. How are e-government
initiatives objectives
formulated and how are they
evaluated priori?
From your experience, how are investment
objectives formulated and what are the criteria to
measure success?
Does citizen-centricity play any role in these
objectives?
Is the issue of the alignment of public sector
IT/e-government and department strategy an
issue for the departments/agencies you
work/worked or have/had experience with?
If yes, then in what way?
2. How did these objectives
evolve?
Objectives evolve over time; what sort of issues do
you think drive the evolution of objectives?
Does the notion of citizen-centricity play a role
in this evolution?
What are the main technological challenges that you
have encountered during your time in the current
project/as a public servant/IT consultant/expert?
3. How are the objectives of
e-government initiatives
converted into procedures and
processes in order to ensure
that objectives are met?
In your opinion, having developed a set of
objectives, what are/were/should be the procedures
and processes required to implement them to ensure
their success?
4. How are the results of
e-government initiatives
evaluated and how are these
evaluations used as feedback
to ensure organisational
learning?
How are/should public sector IT/e-government
investments [be] evaluated?
Do you see these evaluations as a learning
opportunity for the organisation?
Do you believe feedback is essential to ensure
organisational learning?
To what extent is citizen-centricity an issue in the
evaluation of public sector IT/e-government
investments?
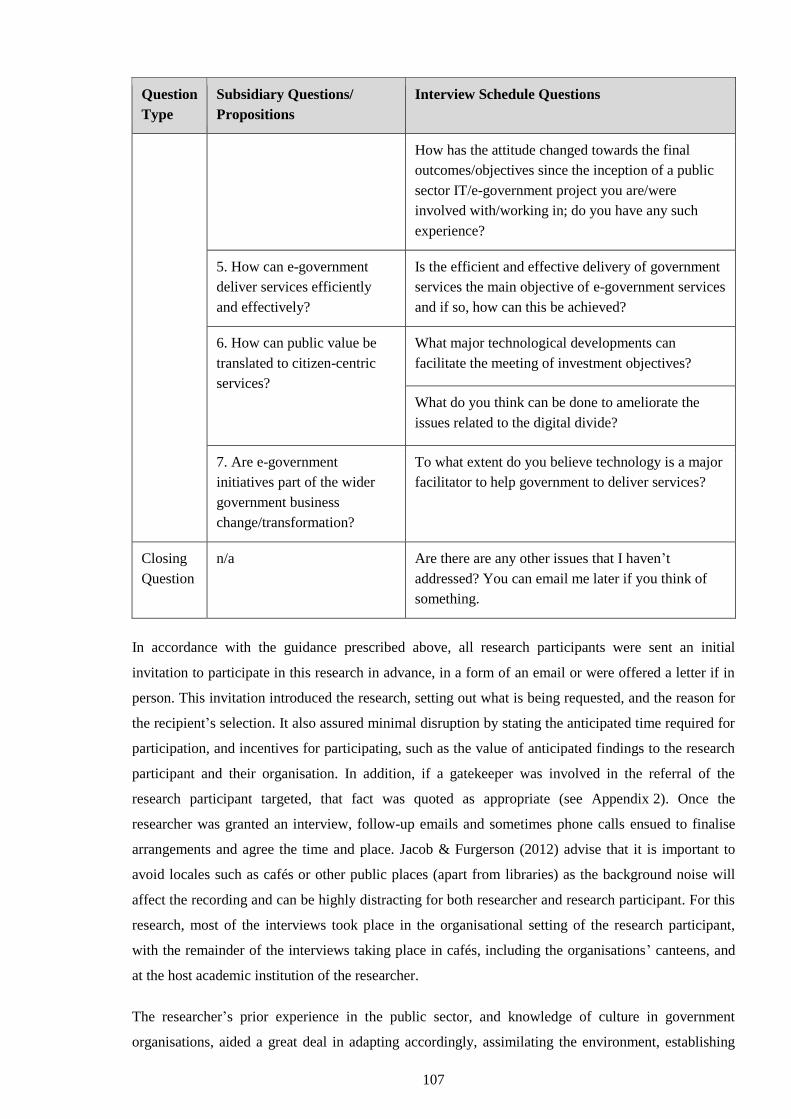
107
Question
Type
Subsidiary Questions/
Propositions
Interview Schedule Questions
How has the attitude changed towards the final
outcomes/objectives since the inception of a public
sector IT/e-government project you are/were
involved with/working in; do you have any such
experience?
5. How can e-government
deliver services efficiently
and effectively?
Is the efficient and effective delivery of government
services the main objective of e-government services
and if so, how can this be achieved?
6. How can public value be
translated to citizen-centric
services?
What major technological developments can
facilitate the meeting of investment objectives?
What do you think can be done to ameliorate the
issues related to the digital divide?
7. Are e-government
initiatives part of the wider
government business
change/transformation?
To what extent do you believe technology is a major
facilitator to help government to deliver services?
Closing
Question
n/a Are there are any other issues that I haven’t
addressed? You can email me later if you think of
something.
In accordance with the guidance prescribed above, all research participants were sent an initial
invitation to participate in this research in advance, in a form of an email or were offered a letter if in
person. This invitation introduced the research, setting out what is being requested, and the reason for
the recipient’s selection. It also assured minimal disruption by stating the anticipated time required for
participation, and incentives for participating, such as the value of anticipated findings to the research
participant and their organisation. In addition, if a gatekeeper was involved in the referral of the
research participant targeted, that fact was quoted as appropriate (see Appendix 2). Once the
researcher was granted an interview, follow-up emails and sometimes phone calls ensued to finalise
arrangements and agree the time and place. Jacob & Furgerson (2012) advise that it is important to
avoid locales such as cafés or other public places (apart from libraries) as the background noise will
affect the recording and can be highly distracting for both researcher and research participant. For this
research, most of the interviews took place in the organisational setting of the research participant,
with the remainder of the interviews taking place in cafés, including the organisations’ canteens, and
at the host academic institution of the researcher.
The researcher’s prior experience in the public sector, and knowledge of culture in government
organisations, aided a great deal in adapting accordingly, assimilating the environment, establishing
108
rapport and gaining trust with the research participants. This in its turn offered the opportunity more
often than not to ask who else the research participant might recommends to be interviewed, a
technique known as snowball sampling, discussed in the next section. By adhering to the guidelines
prescribed above, asking permission to use an electronic recorder before commencing the interviews
further aided establishing rapport and gaining trust, and most importantly encouraged frankness, as it
transpired. The interviews closed with thanking the research participants and asking for permission to
follow up, checking on factual matters if needed after transcription, as well as offering a summary of
the findings of the research once it had been completed. Impressions of each interview with regard the
researcher’s afterthoughts, the environment, the atmosphere, research participants’ behaviour and
attitude, were recorded immediately thereafter on Field Notes and Memos; the former were invaluable
in assisting the researcher in recalling impressions later, which were not part of the formal interview.
3.7.4 Sampling Methods
Contrary to quantitative studies where samples are large, a qualitative inquiry will require a much
smaller sample, seeking in-depth meanings, and where data, or theoretical saturation as by and large is
referred to in the literature, is reached (Guest, Bunce & Johnson, 2006; Mason, 2010; Miles et al.,
2014). Data saturation may be defined as, “the point when additional interviews are not uncovering
any new data or evidence” (Remenyi, 2011, p. 3). As Mason (2010) puts it, there is a point of
diminishing return to a qualitative sample – as the study goes on, more data does not necessarily lead
to more information. Qualitative samples tend to be purposive, rather than random and can evolve
once fieldwork begins (Miles et al., 2014). With regard to guidelines for determining the size in non-
probabilistic samples, Guest et al. (2006) argue that they are virtually non-existent, and the size of
purposive samples, which are the most commonly used form of non-probabilistic sampling, is
saturation. They define saturation too, as the “point at which no new information or themes are
observed in the data” (p. 59). A study of five hundred and sixty PhD studies by Mason (2010) showed
that the mean sample size was thirty one; nevertheless, the distribution was non-random, with a
statistically significant proportion of studies presenting sample sizes that were multiples of ten.
Remenyi (2011) implies that it is not unusual for a doctoral level study to require twenty-five
interviews or more, and that it has even been noted that some doctoral dissertations have included
between fifty to one hundred interviews.
Depending on the requirements of the different methodological positions adopted, there are many
issues to consider when deciding the sample size. A critical factor would be the amount of time and
resources available, which can be easily underestimated and that would have implications on data
processing, such as transcribing the interviews (King, 2004). Other compelling reasons for sampling,
according to Blumberg, Cooper & Schindler (2014, p. 174), include:
Lower cost
Greater accuracy of results
109
Greater speed of data collection
Availability of population elements
Miles et al. (2014, p. 32) suggest: “Admittedly, there are times when we select a case to study because
it is accessible to us geographically and immediately – a form of convenience sampling.” All the same,
purposive sampling demands that, “we think critically about the parameters of the population we are
studying and choose our sample case carefully on this basis” (Silverman, 2010, p. 193). With regard to
snowball sampling, Bryman & Bell (2011) observe that sampling is a form of convenience sample as
it is in no sense random. Snowball sampling is especially useful when sample subjects with experience
of the phenomenon being studied are difficult to identify, and thus the researcher should ask the
research participants to recommend if there is anyone else with the same experience with whom they
could put them in touch.
In this research, sampling tends to be more strategic and purposive, because it focuses on the cases’
unique contexts. Sampling for this study was also in the form of snowballing, where the researcher
made initial contact with the people who are the most relevant to the research topic, and then used
them to make contact with others. The referral effect was extremely useful in this research, as it
involved public-sector organisations, and access to the most appropriate individuals was difficult to
obtain. Hence, the initial purposive sampling targeted the ‘gatekeepers’ in these organisations, with the
ability to help gaining access to the right research participants with knowledge and experience of the
cases, and introduce the researcher. By using this approach, the researcher grew confident that the
people interviewed would give a representative picture of events and thinking, at the time.
3.7.5 Sample Selection and Interview Frame
Whereas no ceiling was set with regard to the number of interviews required for this study, initial
consultation with the supervisor indicated that thirty interviews would suffice. The rationale was to
conform to the minimum number of interviews required by the School for doctoral research, whilst
achieving triangulation and providing a multiplicity of perspectives at the same time.
Based on recommendations by the initial research participants at the pilot stage of this research, the
Chief Executive Officer (CEO) of the Directgov case was targeted firstly, and the list of other
potential research participants relevant to, or with knowledge of, the case grew longer using the
snowball sampling technique. Nonetheless, there were challenges along the way with research
participants’ availability, and sometimes reluctance, as they were public servants and hence conscious
of information sensitivity. Eleven interviews were conducted overall, involving research participants
belonging to the Directgov Agency and other public sector organisations, with experience of the case
(see Table 3.4 below):
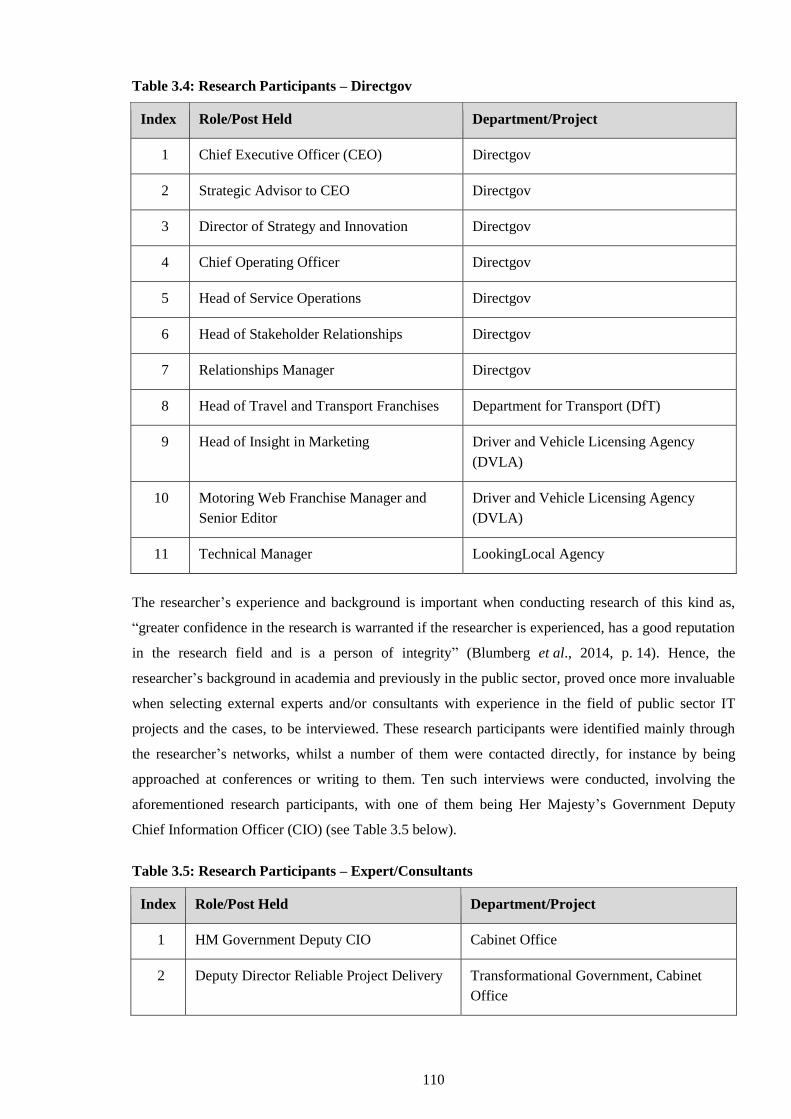
110
Table 3.4: Research Participants – Directgov
Index Role/Post Held Department/Project
1 Chief Executive Officer (CEO) Directgov
2 Strategic Advisor to CEO Directgov
3 Director of Strategy and Innovation Directgov
4 Chief Operating Officer Directgov
5 Head of Service Operations Directgov
6 Head of Stakeholder Relationships Directgov
7 Relationships Manager Directgov
8 Head of Travel and Transport Franchises Department for Transport (DfT)
9 Head of Insight in Marketing Driver and Vehicle Licensing Agency
(DVLA)
10 Motoring Web Franchise Manager and
Senior Editor
Driver and Vehicle Licensing Agency
(DVLA)
11 Technical Manager LookingLocal Agency
The researcher’s experience and background is important when conducting research of this kind as,
“greater confidence in the research is warranted if the researcher is experienced, has a good reputation
in the research field and is a person of integrity” (Blumberg et al., 2014, p. 14). Hence, the
researcher’s background in academia and previously in the public sector, proved once more invaluable
when selecting external experts and/or consultants with experience in the field of public sector IT
projects and the cases, to be interviewed. These research participants were identified mainly through
the researcher’s networks, whilst a number of them were contacted directly, for instance by being
approached at conferences or writing to them. Ten such interviews were conducted, involving the
aforementioned research participants, with one of them being Her Majesty’s Government Deputy
Chief Information Officer (CIO) (see Table 3.5 below).
Table 3.5: Research Participants – Expert/Consultants
Index Role/Post Held Department/Project
1 HM Government Deputy CIO Cabinet Office
2 Deputy Director Reliable Project Delivery Transformational Government, Cabinet
Office
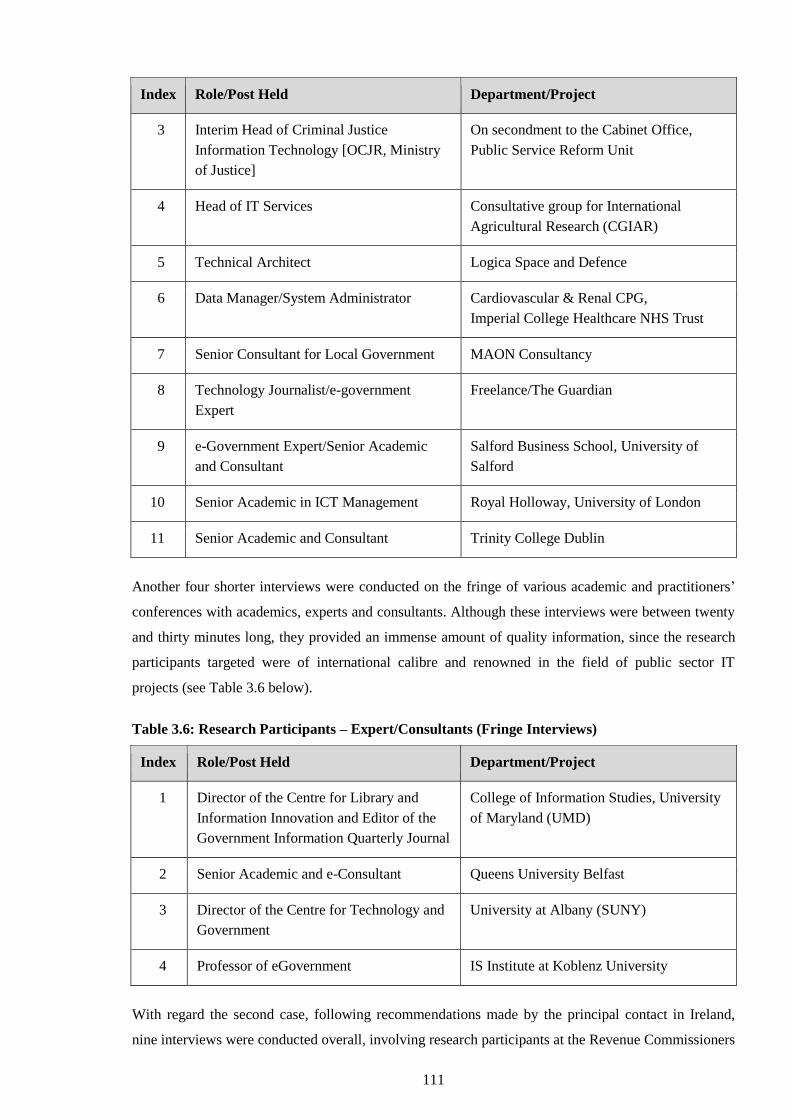
111
Index Role/Post Held Department/Project
3 Interim Head of Criminal Justice
Information Technology [OCJR, Ministry
of Justice]
On secondment to the Cabinet Office,
Public Service Reform Unit
4 Head of IT Services Consultative group for International
Agricultural Research (CGIAR)
5 Technical Architect Logica Space and Defence
6 Data Manager/System Administrator Cardiovascular & Renal CPG,
Imperial College Healthcare NHS Trust
7 Senior Consultant for Local Government MAON Consultancy
8 Technology Journalist/e-government
Expert
Freelance/The Guardian
9 e-Government Expert/Senior Academic
and Consultant
Salford Business School, University of
Salford
10 Senior Academic in ICT Management Royal Holloway, University of London
11 Senior Academic and Consultant Trinity College Dublin
Another four shorter interviews were conducted on the fringe of various academic and practitioners’
conferences with academics, experts and consultants. Although these interviews were between twenty
and thirty minutes long, they provided an immense amount of quality information, since the research
participants targeted were of international calibre and renowned in the field of public sector IT
projects (see Table 3.6 below).
Table 3.6: Research Participants – Expert/Consultants (Fringe Interviews)
Index Role/Post Held Department/Project
1 Director of the Centre for Library and
Information Innovation and Editor of the
Government Information Quarterly Journal
College of Information Studies, University
of Maryland (UMD)
2 Senior Academic and e-Consultant Queens University Belfast
3 Director of the Centre for Technology and
Government
University at Albany (SUNY)
4 Professor of eGovernment IS Institute at Koblenz University
With regard the second case, following recommendations made by the principal contact in Ireland,
nine interviews were conducted overall, involving research participants at the Revenue Commissioners
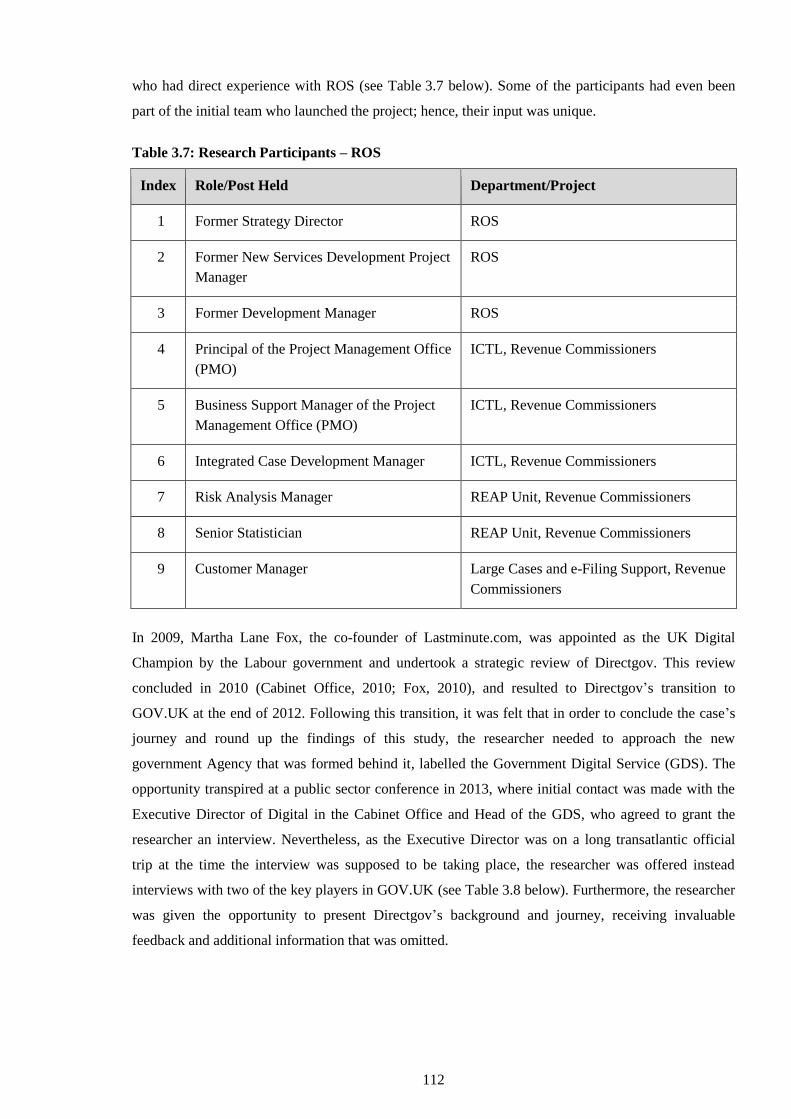
112
who had direct experience with ROS (see Table 3.7 below). Some of the participants had even been
part of the initial team who launched the project; hence, their input was unique.
Table 3.7: Research Participants – ROS
Index Role/Post Held Department/Project
1 Former Strategy Director ROS
2 Former New Services Development Project
Manager
ROS
3 Former Development Manager ROS
4 Principal of the Project Management Office
(PMO)
ICTL, Revenue Commissioners
5 Business Support Manager of the Project
Management Office (PMO)
ICTL, Revenue Commissioners
6 Integrated Case Development Manager ICTL, Revenue Commissioners
7 Risk Analysis Manager REAP Unit, Revenue Commissioners
8 Senior Statistician REAP Unit, Revenue Commissioners
9 Customer Manager Large Cases and e-Filing Support, Revenue
Commissioners
In 2009, Martha Lane Fox, the co-founder of Lastminute.com, was appointed as the UK Digital
Champion by the Labour government and undertook a strategic review of Directgov. This review
concluded in 2010 (Cabinet Office, 2010; Fox, 2010), and resulted to Directgov’s transition to
GOV.UK at the end of 2012. Following this transition, it was felt that in order to conclude the case’s
journey and round up the findings of this study, the researcher needed to approach the new
government Agency that was formed behind it, labelled the Government Digital Service (GDS). The
opportunity transpired at a public sector conference in 2013, where initial contact was made with the
Executive Director of Digital in the Cabinet Office and Head of the GDS, who agreed to grant the
researcher an interview. Nevertheless, as the Executive Director was on a long transatlantic official
trip at the time the interview was supposed to be taking place, the researcher was offered instead
interviews with two of the key players in GOV.UK (see Table 3.8 below). Furthermore, the researcher
was given the opportunity to present Directgov’s background and journey, receiving invaluable
feedback and additional information that was omitted.
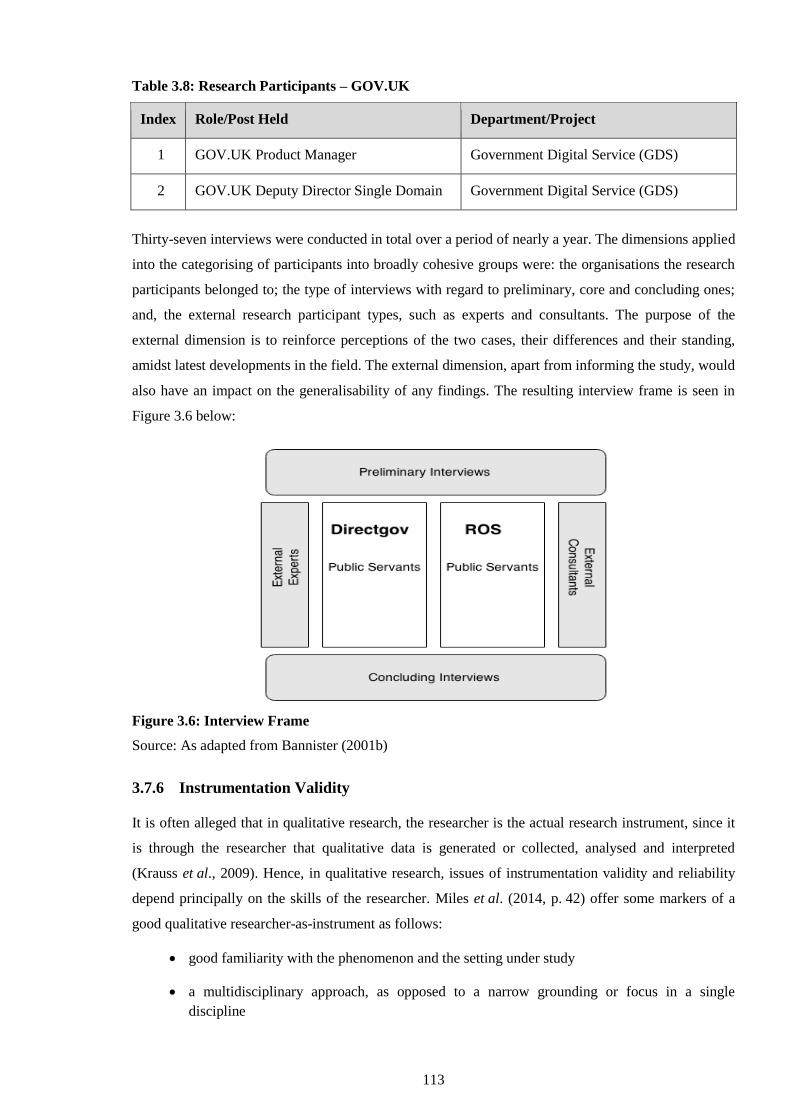
113
Table 3.8: Research Participants – GOV.UK
Index Role/Post Held Department/Project
1 GOV.UK Product Manager Government Digital Service (GDS)
2 GOV.UK Deputy Director Single Domain Government Digital Service (GDS)
Thirty-seven interviews were conducted in total over a period of nearly a year. The dimensions applied
into the categorising of participants into broadly cohesive groups were: the organisations the research
participants belonged to; the type of interviews with regard to preliminary, core and concluding ones;
and, the external research participant types, such as experts and consultants. The purpose of the
external dimension is to reinforce perceptions of the two cases, their differences and their standing,
amidst latest developments in the field. The external dimension, apart from informing the study, would
also have an impact on the generalisability of any findings. The resulting interview frame is seen in
Figure 3.6 below:
Figure 3.6: Interview Frame
Source: As adapted from Bannister (2001b)
3.7.6 Instrumentation Validity
It is often alleged that in qualitative research, the researcher is the actual research instrument, since it
is through the researcher that qualitative data is generated or collected, analysed and interpreted
(Krauss et al., 2009). Hence, in qualitative research, issues of instrumentation validity and reliability
depend principally on the skills of the researcher. Miles et al. (2014, p. 42) offer some markers of a
good qualitative researcher-as-instrument as follows:
good familiarity with the phenomenon and the setting under study
a multidisciplinary approach, as opposed to a narrow grounding or focus in a single
discipline
114
good investigative skills, the ability to draw people out, and meticulous attention to detail
being comfortable, resilient, and non-judgemental with participants in the setting
a heightened sense of empathetic engagement, balanced with a heightened sense of objective
awareness
3.8 Research Governance and Ethics
As in other aspects in business, anyone who is engaged in research should exhibit ethical behaviour
and ensure that the way you conduct it is morally defensible towards all parties involved (Blumberg
et al., 2014; Collis & Hussey, 2014). The definition of ethics in research that was adopted for this
thesis is the one offered by Blumberg et al. (2014, p. 121): “Ethics is the study of the ‘right behaviour’
and addresses the question of how to conduct research in a moral and responsible way.” This term of
ethics, however, should not be confused with that of business ethics, which is a separate field of study,
and well documented elsewhere by various scholars (Collis & Hussey, 2014).
Instances of unethical research in the past in the name of science, some famous and some infamous,
have led to the establishment of codes of research ethics by various bodies to inform research
practices, such as the British Economic and Social Research Council (ESRC) and the Academy of
Management (AoM), to mention a few (Bryman & Bell, 2011; Collis & Hussey, 2014). Nevertheless,
with an increase in regulatory mechanisms, from universities to state level, in other words
‘bureaucratising’ research ethics, there is the danger of ‘suffocating’ research, by imposing limitations
on the actual conduct of it (Bryman & Bell, 2011; Silverman, 2010). The researcher should find
instead, the middle ground between the two dominant philosophical standpoints on research ethics,
which are ‘deontology’ and ‘teleology’. In the first view, the ends never justify the means that might
be doubtful, whilst in the latter view, the morality of the means have to be judged by the ends served
(Blumberg et al., 2014).
Ethical issues are bound to arise at a variety of stages in business and management research, so it is
fundamental for the researcher to realise that research involves collecting data from people, about
people (Creswell, 2009). It is the researcher’s responsibility to assess the possibility of harm to
participants and to fulfil the obligation to protect them (Bryman & Bell, 2007, 2011). Confidentiality
of records, anonymity of accounts and anonymity of participants should be maintained throughout the
research; invasion of privacy and deception should likewise be avoided (Silverman, 2010). It is also
important that all participants gave their informed consent before they engaged in the research.
Creswell (2009) recommends that participants should be informed about the following:
The purpose of the research
The identity of the researcher
How participants were selected
115
The level and type of participants involvement
The guarantee of confidentiality to the participants
The assurance that the participant could withdraw at any time
A contact name if questions and issues arise
In short, participants should have explained to them the benefits of the study, their rights and
protection. They should be informed that their contribution is voluntary, and be offered the results of
the study in question (reciprocity) (Bell & Bryman, 2007; Kvale, 2002).
Consequently, for the purpose of this research, prior to undertaking data collection, the author applied
and was granted ethical approval by the Research Ethics Committee at Henley Business School,
University of Reading, which is the host academic institution. Upon completion of the thesis, and in
order to safeguard that the research was conducted in the approved manner, there is another part of the
Ethics Approval Process form that has to be completed and submitted, alongside the original
application. Informed consent was obtained from the research participants by their signing a Letter of
Consent (see Appendix 3) after they had been offered a Research Participants’ Information Document
(see Appendix 4) incorporating all the information prescribed above. The Letter of Consent guaranteed
anonymity and confidentiality to all research participants, and stressed in particular the voluntary
nature of their participation and their right to withdraw from the study at any time. This is known as
“process consent” and is a better way of safeguarding research participants than a once-and-for-all
informed consent (Silverman, 2010, p. 159). The Research Participants’ Information Document in its
turn, disclosed fully the procedure, and was constructed carefully in a language that the people
concerned would understand. Only two out of thirty-seven research participants interviewed did not
return the Letter of Consent signed. Jacob & Furgerson (2012, p. 7) recommend that “If your
respondent does not wish to sign the consent form, do not conduct the interview and do not attempt to
compel them to grant consent.” Nonetheless, as the interviews had already taken place, a polite
reminder was sent by email, and while the interviews were transcribed, having had no response from
the aforementioned participants, they were not used for this research.
3.9 Data Analysis Process
A large amount of data was collected during this research in the form of interviews, documents, Field
Notes and Memos. All interviews were taped and the audio files were kept and backed up securely,
‘under lock and key’, as promised to the participants (see Appendix 4). The analysis of these data was
undertaken in a number of steps as follows:
The first step was to transcribe all the taped interviews. For the early interviews, an attempt
was made to type the full transcript after listening and re-listening to the audio files. It was
soon realised that this was time-consuming, as a typical one-hour interview transcript was
running to twenty pages. Following suggestions from the doctoral researchers’ community, a
116
decision was made to procure voice recognition/speech-to-text software. The Dragon
NaturallySpeaking Premium software package was chosen, and although its setup routine to
‘learn’ one’s voice was quick, it eventually took a long time to ‘train’ it to recognise the
author’s voice. Furthermore, its accuracy was impeded by pronunciation and accent, as the
author in this case is not a native English speaker. Despite the steep learning curve for both the
software and the researcher, a small number of transcripts were produced. At that point,
funding for professional transcription was obtained from research funds at the researcher’s
academic institution. Following the selection of a preferred accredited provider, a ‘Non-
Disclosure/Confidentiality Agreement’ for handling sensitive data was requested and
provided, in order to safeguard initial promise to the participants and preserve data
confidentiality (see Appendix 5). The uploading of audio files and downloading of transcripts
were to and from a secure server site. It is estimated that around seventy percent of the
interviews were transcribed professionally.
Having received the finished transcripts, it was then noted that this time round, transcripts (for
a typical one-hour interview) were running to between twenty-five and thirty pages in some
instances. They contained not only what had been discussed in the interview but also
information irrelevant to the research. For example, phone calls taken during the interview, or
people walking in to the room speaking to the participant and thus interrupting, were all
transcribed verbatim. Hence, the next step was to ‘clean’ the professional transcripts. By
listening and re-listening to the audio files again, not only helped clean (and shorten) the
transcripts, but offered a better understanding of the participants’ views and stance.
Transcribed expressions of humour, irony, uncertainty and pauses were noted in a Memo, as
they reinforced observations made during the interview and recorded in Field Notes. In
addition, during this stage, where a single message or view was conveyed in an overly verbose
manner and/or repetitions were made in places, summaries were drafted. All interview
transcripts were returned to research participants as promised (see Appendix 3), for their
approval, comments and additional information. In a number of occasions however, that was
not possible, as some of the public servants in particular had retired mostly prematurely
following the 2008 financial crisis. Nonetheless, there were cases where the researcher was
invited to go back to research participants should there be the need for further information,
owing to the good relationship and rapport that had been established. In a number of instances,
research participants subsequently got in contact with additional information that they had
overlooked during the interviews or which they felt might be of value to this research.
The third step was to consider the use of qualitative data analysis software in order to organise
and manage the data. The main benefit that such software offers, according to Beekhuyzen,
Nielsen, and Von Hellens (2010), is the ability to manage and allow the organisation of large
amounts of data, alongside other features, such as search and retrieval. Extracting meaning
117
and theory from rich data and text, such as the transcriptions of a number of interviews and
archival documentation, could be a tedious task and inundate the researcher. This is the most
demanding aspect of the interpretative inquiry (Bannister, 2001b; Remenyi et al., 1998;
Silverman, 2010). Although qualitative research interpretation and analysis was traditionally
conducted manually, computers have been used for basic content analysis of text since the
1960s, and became very popular in the humanities (Silverman, 2010). Nowadays, there are
many software packages available which can aid the researcher not only to file and index text
but also to code and analyse it. Such software packages are for example, NVivo and Atlas.ti;
there is also the Computer Assisted Qualitative Data AnalysiS (CAQDAS) project, with a
wealth of various other software available online along with guidance on how to analyse such
data. The choice of software package in this case was NVivo, following good reviews by the
research community and owing to the fact that a licence and some training were provided by
the host institution. In addition, the author sought and received at an additional cost, extra
training provided by QSR, the company behind NVivo, and an NVivo Training Consultancy.
The decision to use NVivo was made on the basis of the sheer volume of data that had been
gathered. Nevertheless, as a novice apprentice, the researcher decided to use only ten of the
interviews initially as a pilot, to experiment and test the coding. The interview transcripts were
chosen selectively from each research participant category in order for the sample to represent
a broad spectrum of opinions, and attributes for each case (four public servants and one
external expert/consultant from each case). Meanwhile, whilst receiving training on the
software, the literature review, Field Notes, Memos, summaries drafted thus far and relevant
documentation collected, were input in NVivo for the purpose of organising the data, easy
retrieval and to aid reviewing the narrative against evidence collected (for a detailed account
on the NVivo database design and compilation, see Appendix 6). The question of triangulation
and validity is discussed in Section 3.5 above. A few iterations were attempted before
mastering adequately, at least for the aims of this research, the full cycle stages of coding and
analysis. Once it was felt that a narrative could be formulated, another ten interviews based on
the above selection strategy were added, to enable richer data and context to emerge. In
addition, during that reiteration of interrogating the new data, a few more new codes were
developed, as thematic connections were observed (for a full account detailing the analytical
strategy and coding framework, see Appendix 7).
Twenty interviews overall were analysed in NVivo and, along with the rest of the evidence,
provided the primary narrative and a degree of saturation. The remainder of interview
transcripts were summarised manually into thematic units of meaning, and were compared
against the primary narrative that was formed. In some instances, full transcripts were
preserved with regard important quotations or longer segments of the research participants’
accounts where facts were divulged, or where high experience levels of the cases under study
118
were observed. That stage aided forming an overarching narrative, which was re-examined by
re-visiting the data, ensuring its consistency by making additions and adjustments as
necessary. In some instances, research participants were re-visited and consulted, to tidy up
points of detail or clarify facts.
The final step was to analyse and synthesise the data for each case, before proceeding to
conduct a cross-case analysis. As field research in both cases was carried out over a period of
nearly a year, this synthesis evolved over time.
3.10 Qualitative Data Analysis
As Coffey & Atkinson (1996, p. 11) put it, data analysis is a “pervasive activity throughout the life of
a research project. Analysis is not simply one of the later stages of research, to be followed by an
equally separate phase of ‘writing up results’”. Ideally, data collection and consequent analysis should
start from day one. The transcription, say of the first interview, allows an early review of the data
against the set research question(s), and initial insights to be formed (Lincoln & Guba, 1985;
Silverman, 2010). After all, “research is a messy process and the stages and processes involved do not
simply follow one after the other” (Blaxter et al., 2001, p. 192). This is particularly true for a more
open approach such as grounded analysis when adopting an interpretive paradigm. In grounded
analysis, the structure, processes and outcomes of research are shaped from the data, rather than a pre-
selected external or pre-conceived theoretical framework (Easterby-Smith et al., 2002).
In this research, most of the data were analysed using the constant comparative method (Glaser &
Strauss, 1999; Lincoln & Guba, 1985), whereby sections of the transcribed interviews and Field Notes
were reviewed to decide what codes fit the concepts suggested by the data (Bowen, 2005). As Maykut
& Morehouse (1994) point out: “Words are the way that most people come to understand their
situations; we create our world with words; we explain ourselves with words; we defend and hide
ourselves with words.” Thus, in qualitative data analysis and presentation, the task of the researcher is
“to find patterns within those words and to present those patterns for others to inspect while at the
same time staying as close to the construction of the world as the participants originally experienced
it” (p. 18). In all, data were processed, reduced and analysed by means of thematic codes and concepts
in the process.
3.11 Computer Assisted Qualitative Data Analysis
Miles (1979, p. 590) describes qualitative data as an “attractive nuisance”, offering an account of its
difficulties: “the sheer range of phenomena to be observed, the recorded volume of notes, the time
required for write-up, coding, and analysis can all become overwhelming. But the most serious and
central difficulty in the use of qualitative data is that methods of analysis are not well formulated”.
Computer-assisted data processing since the late 1960s has indeed revolutionised quantitative data
analysis, but the impact it had on the qualitative data analysis was much more limited. In the last few
119
decades however, the advancement of technology and the development of new software has been
phenomenal (Miles & Huberman, 1994). The humble word processor application for example, which
comes with nearly every personal computer, and nowadays on handheld devices of any kind and size,
made typing, re-typing and amending much faster and easier. It had also transformed the way people
worked collaboratively, allowing annotating, sharing, reviewing, organising, storing and retrieving
documents inter alia. Nevertheless, as Miles & Huberman (1994) argue, it is reasonable to say that the
researcher who does not use any other software for their data management and analysis beyond a word
processor will be restricted and burdened in comparison to those who do.
Since the mid- tolate-1980s, several CAQDAS software packages, as they came to be commonly
known and discussed above, have been developed, initially by academics involved in analysis of large
qualitative datasets whilst working on collaborative projects, and later commercially by various
developers (Lewins, 2001; Mangabeira, Lee & Fielding, 2004). The term ‘CAQDAS’ refers to
“software packages designed to facilitate a qualitative approach to qualitative data”, though some
packages allow the incorporation of numeric data or a quantitative approach to qualitative data
(Lewins & Silver, 2006, p. 3). They are characterised as ‘Text Retrievers’ and ‘Text Managers’,
concerned with the quantitative ‘content’ of qualitative data, hence, they fall into the wider category of
‘content analysis’ software packages (Lewins, 2001). They must include nonetheless, at least one type
of qualitative data and have some of the following tools for managing and analysing it:
Content Searching tools
Linking tools
Coding tools
Query tools
Writing and annotation tools
Mapping or networking tools
(Lewins & Silver, 2006, p. 3)
Data management and data analysis are integrally related, and there is no firm boundary between them
(Miles & Huberman, 1994). The importance of data management is therefore imperative in order to
ease the complexity of the research process in both the quantitative and qualitative paradigms.
“Qualitative data can produce meaningful findings if they are managed properly.” (Ishak & Bakar,
2012, p. 94; Miles & Huberman, 1994) The number of packages currently in circulation in the market
could be more than a couple of dozen, including proprietary, free/open source and web-based
CAQDAS software. The most popular ones in use, and often cited in the literature, are the QSR NVivo
(former NUD*IST), Atlas.ti, HyperRESEARCH, MAXQDA and the Ethnograph, to mention a few.
Furthermore, the majority of these packages allow the incorporation and support of multimedia, such
as graphics, video and audio data and most recently direct access to the web, for greater project
120
integration and richer results. It is argued however, that the use of text transcripts, no matter how
lengthy, is considered as the best way to access large amounts of data quickly (Lewins, 2001; Lewins
& Silver, 2006).
Computers could assist only in the cleaning and processing and not the interpretative phases of data
analysis (Lincoln & Guba, 1985). It must be stressed that in using qualitative data analysis software,
the researcher does not capitulate the hermeneutic task to the logic of the computer; rather the
computer is used as a tool for efficiency and not as a tool which in itself conducts analysis and draws
conclusions. As Fielding & Lee (1998, p. 167) explain, qualitative researchers “want tools which
support analysis, but leave the analyst firmly in charge”. More importantly, such software also serves
as a tool for transparency. Arguably, the production of an audit trail is the key most important criterion
on which the trustworthiness and plausibility of a study can be established. Qualitative analysis
software’s logging of data movements, coding patterns, and mapping of conceptual categories and
thought progression, render all stages of the analytical process traceable and transparent., hence
facilitating the production of a more detailed and comprehensive audit trail than manual mapping of
this complex process can allow (QDATRAINING, 2012a). The danger, nevertheless, as Remenyi
et al. (1998) argue, is that by using these software packages researchers might distance themselves
from the process of analysis, not observing the purist attitude of closeness to evidence.
3.12 Use of NVivo: Rationale
NVivo is the latest in a popular line of software that started with the development of NUD*IST and its
full name is NUD*IST Vivo, NVivo for short (Gibbs, 2002). NUD*IST was developed in Australia
back in 1979 by Professor Tom Richards, to aid his wife Lyn Richards, who was faced with a very
large qualitative social research project (T. Richards, 2002). Although it started originally as a
university project, after ten years of development, its founders, the Richards, formed a software
company, the Qualitative Solutions and Research Pty Ltd, which was later renamed to QSR
International (Bazeley & Jackson, 2013; Gibbs, 2002; T. Richards, 2002). It has to be noted however,
that NVivo is not an upgrade to NUD*IST, but a complete rewrite, albeit built on the same principals
and ideas and bearing new features such as a full edit-while-you-code capability (Gibbs, 2002;
T. Richards, 2002). NUD*IST was marketed until 2002 as N6 (NUD*IST Version 6), in parallel with
NVivo, for the reason that NUD*IST is better at some things, while NVivo is better at others.
NUD*IST for example “excels in the broad-brush and large scale” projects, whilst NVivo supports the
kind of research that most social scientists are involved in (Gibbs, 2002, p. xxiii). In the data analysis
stage for this research, NVivo offered two principal benefits:
Efficiency/Scope of Enquiry
Transparency/Audit Trail
121
3.12.1 Efficiency/Scope of Enquiry
NVivo offered efficiency, as it allowed a thorough exploration of avenues of enquiry which, given
time constraints, would not have been possible to pursue with a manual system/mode of analysis. The
efficiency allowed the exclusion and inclusion of propositions or emerging patterns throughout the
analytical process. In addition, NVivo facilitated the automation of many administrative tasks
associated with qualitative data analysis, allowing time to reflect on the interpretive aspects of the
data. After all, amongst the advantages qualitative computing offers, apart from ease of management
of bulk data, is speed, efficiency and rigour (L. Richards, 2002).
3.12.2 Transparency/Audit Trail
There is a danger in qualitative research of being subjective and following ad-hoc approaches to
analysing data (Bourdon, 2002). NVivo ensured that a clear audit trail was maintained throughout the
analysis. All processes and stages of coding were tracked in such a way, as to facilitate an objective
and rigorous approach to the data analysis.
3.13 Summary and Reflections
In this chapter, a detailed account of the research philosophy, strategy and adopted methodological
approach according to which this research is conducted, was presented. This research is taking an
interpretive stance, and draws on qualitative methodological approaches from both the case study and
grounded theory literature, identifying their salient points, as well as illustrating the weaknesses
associated with earlier research. Approaches that combine the chosen methodologies in a synergistic
fusion have also been discussed, exploring how they can be applied in this research, adding to a
rigorous and reliable theory-building process. The rationale for adopting a customised structured-case
methodological approach, and claims for the validity, reliability and generalisability of this research,
have furthermore been deliberated. In addition to all the foregoing, this chapter recounts the rationale
behind the case studies selected, the instrumentation utilised, the sampling methods and the choice of
the sample, as well as the nature of the data collected; in other words, detailing the operationalisation
of the practical side of this research. Ultimately, research ethics and governance considerations were
discussed, before detailing the data analysis process, and justifying the use of software programs such
as NVivo, used in aiding the analysis of data.
On reflection, the process of gathering and extracting insight from rich data is not linear. It can spring
surprises and new discoveries which force the researcher to backtrack on preconceived ideas and
review data already gathered in a new light. It is inevitable that no matter how well one is accustomed
with the literature, face-to-face discourse with the actors who were or are engaged in a process, reveals
concepts, issues and facts of which the researcher was previously unaware or did not expect
(Bannister, 2001b).
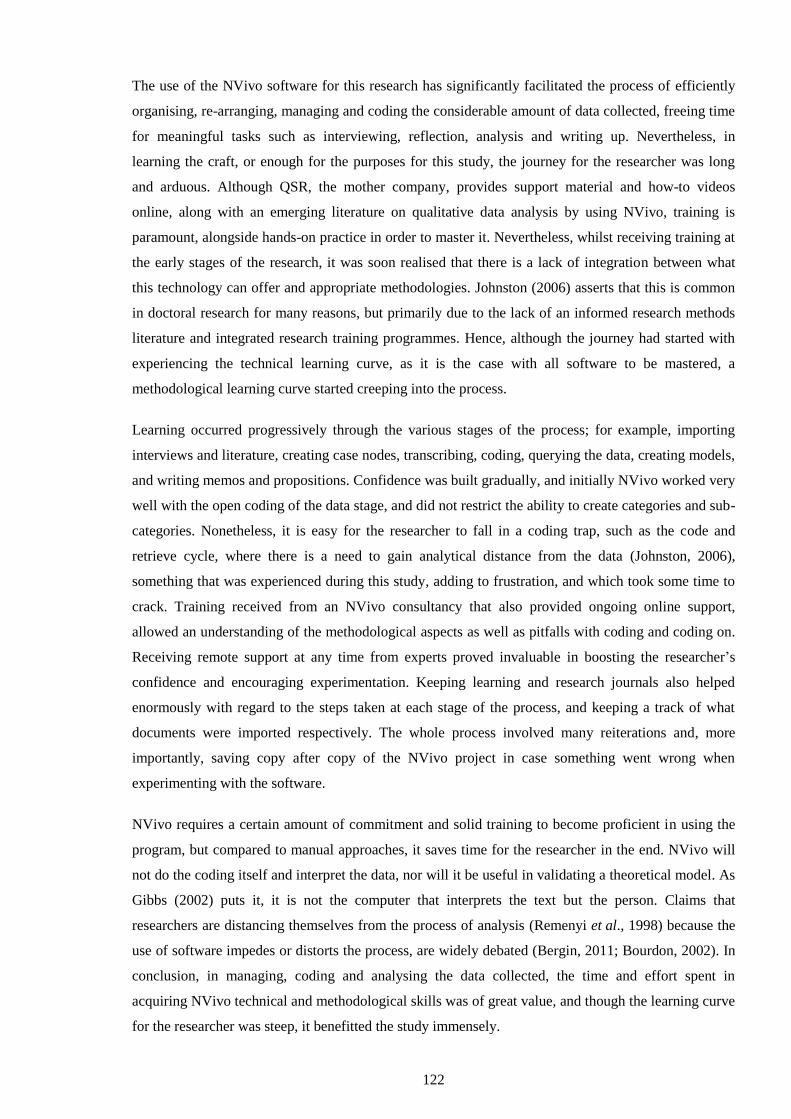
122
The use of the NVivo software for this research has significantly facilitated the process of efficiently
organising, re-arranging, managing and coding the considerable amount of data collected, freeing time
for meaningful tasks such as interviewing, reflection, analysis and writing up. Nevertheless, in
learning the craft, or enough for the purposes for this study, the journey for the researcher was long
and arduous. Although QSR, the mother company, provides support material and how-to videos
online, along with an emerging literature on qualitative data analysis by using NVivo, training is
paramount, alongside hands-on practice in order to master it. Nevertheless, whilst receiving training at
the early stages of the research, it was soon realised that there is a lack of integration between what
this technology can offer and appropriate methodologies. Johnston (2006) asserts that this is common
in doctoral research for many reasons, but primarily due to the lack of an informed research methods
literature and integrated research training programmes. Hence, although the journey had started with
experiencing the technical learning curve, as it is the case with all software to be mastered, a
methodological learning curve started creeping into the process.
Learning occurred progressively through the various stages of the process; for example, importing
interviews and literature, creating case nodes, transcribing, coding, querying the data, creating models,
and writing memos and propositions. Confidence was built gradually, and initially NVivo worked very
well with the open coding of the data stage, and did not restrict the ability to create categories and sub-
categories. Nonetheless, it is easy for the researcher to fall in a coding trap, such as the code and
retrieve cycle, where there is a need to gain analytical distance from the data (Johnston, 2006),
something that was experienced during this study, adding to frustration, and which took some time to
crack. Training received from an NVivo consultancy that also provided ongoing online support,
allowed an understanding of the methodological aspects as well as pitfalls with coding and coding on.
Receiving remote support at any time from experts proved invaluable in boosting the researcher’s
confidence and encouraging experimentation. Keeping learning and research journals also helped
enormously with regard to the steps taken at each stage of the process, and keeping a track of what
documents were imported respectively. The whole process involved many reiterations and, more
importantly, saving copy after copy of the NVivo project in case something went wrong when
experimenting with the software.
NVivo requires a certain amount of commitment and solid training to become proficient in using the
program, but compared to manual approaches, it saves time for the researcher in the end. NVivo will
not do the coding itself and interpret the data, nor will it be useful in validating a theoretical model. As
Gibbs (2002) puts it, it is not the computer that interprets the text but the person. Claims that
researchers are distancing themselves from the process of analysis (Remenyi et al., 1998) because the
use of software impedes or distorts the process, are widely debated (Bergin, 2011; Bourdon, 2002). In
conclusion, in managing, coding and analysing the data collected, the time and effort spent in
acquiring NVivo technical and methodological skills was of great value, and though the learning curve
for the researcher was steep, it benefitted the study immensely.
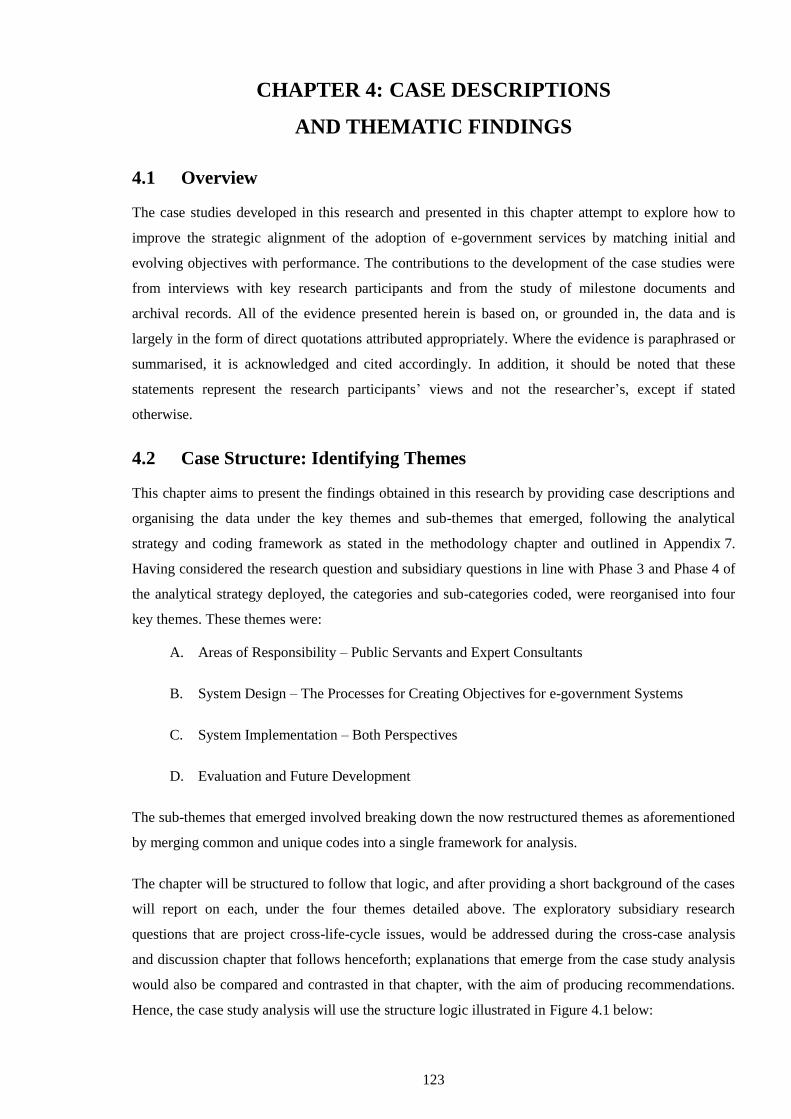
123
CHAPTER 4: CASE DESCRIPTIONS
AND THEMATIC FINDINGS
4.1 Overview
The case studies developed in this research and presented in this chapter attempt to explore how to
improve the strategic alignment of the adoption of e-government services by matching initial and
evolving objectives with performance. The contributions to the development of the case studies were
from interviews with key research participants and from the study of milestone documents and
archival records. All of the evidence presented herein is based on, or grounded in, the data and is
largely in the form of direct quotations attributed appropriately. Where the evidence is paraphrased or
summarised, it is acknowledged and cited accordingly. In addition, it should be noted that these
statements represent the research participants’ views and not the researcher’s, except if stated
otherwise.
4.2 Case Structure: Identifying Themes
This chapter aims to present the findings obtained in this research by providing case descriptions and
organising the data under the key themes and sub-themes that emerged, following the analytical
strategy and coding framework as stated in the methodology chapter and outlined in Appendix 7.
Having considered the research question and subsidiary questions in line with Phase 3 and Phase 4 of
the analytical strategy deployed, the categories and sub-categories coded, were reorganised into four
key themes. These themes were:
A. Areas of Responsibility – Public Servants and Expert Consultants
B. System Design – The Processes for Creating Objectives for e-government Systems
C. System Implementation – Both Perspectives
D. Evaluation and Future Development
The sub-themes that emerged involved breaking down the now restructured themes as aforementioned
by merging common and unique codes into a single framework for analysis.
The chapter will be structured to follow that logic, and after providing a short background of the cases
will report on each, under the four themes detailed above. The exploratory subsidiary research
questions that are project cross-life-cycle issues, would be addressed during the cross-case analysis
and discussion chapter that follows henceforth; explanations that emerge from the case study analysis
would also be compared and contrasted in that chapter, with the aim of producing recommendations.
Hence, the case study analysis will use the structure logic illustrated in Figure 4.1 below:
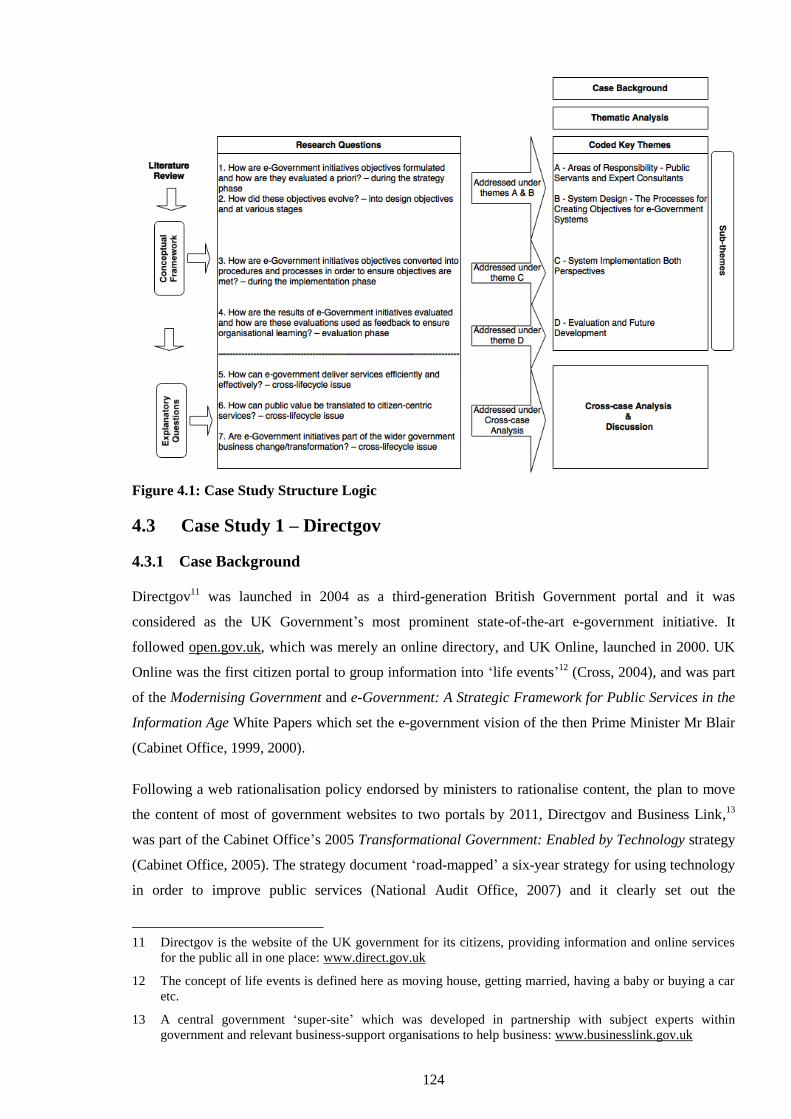
124
Figure 4.1: Case Study Structure Logic
4.3 Case Study 1 – Directgov
4.3.1 Case Background
Directgov11
was launched in 2004 as a third-generation British Government portal and it was
considered as the UK Government’s most prominent state-of-the-art e-government initiative. It
followed open.gov.uk, which was merely an online directory, and UK Online, launched in 2000. UK
Online was the first citizen portal to group information into ‘life events’12
(Cross, 2004), and was part
of the Modernising Government and e-Government: A Strategic Framework for Public Services in the
Information Age White Papers which set the e-government vision of the then Prime Minister Mr Blair
(Cabinet Office, 1999, 2000).
Following a web rationalisation policy endorsed by ministers to rationalise content, the plan to move
the content of most of government websites to two portals by 2011, Directgov and Business Link,13
was part of the Cabinet Office’s 2005 Transformational Government: Enabled by Technology strategy
(Cabinet Office, 2005). The strategy document ‘road-mapped’ a six-year strategy for using technology
in order to improve public services (National Audit Office, 2007) and it clearly set out the
11 Directgov is the website of the UK government for its citizens, providing information and online services
for the public all in one place: www.direct.gov.uk
12 The concept of life events is defined here as moving house, getting married, having a baby or buying a car
etc.
13 A central government ‘super-site’ which was developed in partnership with subject experts within
government and relevant business-support organisations to help business: www.businesslink.gov.uk
125
government’s aims and objectives for future e-government projects. The most important aim was “to
use IT to reconstitute services around citizens, rather than departments. A crucial first step towards
this goal was to improve ‘joining up’ through greater interoperability of systems and common
standards.” (Hallsworth et al., 2009, p. 10; Saxby, 2007a) In particular, the strategy was directed to
provide overall technology leadership in three key areas:
1. The transformation of public services for the benefit of citizens, businesses, taxpayers and
front-line staff
2. The efficiency of the corporate services and infrastructure of government organisations,
thus freeing resources for the front line
3. The steps necessary to achieve the effective delivery of technology for government
(Cabinet Office, 2005, p. 2)
Thus, this government strategy required implementation across three key areas:
1. Reforming public (corporate) services
2. Increasing customer-centricity
3. Reducing costs through increasing efficiency and effectiveness
The strategy document presented to Parliament, referred to Directgov as follows:
Customer-centred delivery: Directgov and Business Link have started to introduce a
different way of looking at online services, with the focus on customers rather than the
service provider. Innovative local authorities have implemented customer relationship
management systems, integrated contact centres and one-stop shops to provide a similar
focus on customers.
(Cabinet Office, 2005, p. 5)
The aforesaid strategy document was followed in 2006 by Sir David Varney’s report to HM Treasury,
Service Transformation: A better service for citizens and businesses, a better deal for the taxpayer
(Varney, 2006). Varney’s report, whilst recognising technological advancements and the new
economy, focused on the need for the public sector to understand better the different groups of citizens
and businesses and their needs, in order to improve its services. The report had also proposed the
rationalisation of citizen and business-facing government websites, reducing progressively their
number within a three-year period. It estimated that £400 million could be saved following the
aforesaid website rationalisation, channel shift and shared infrastructure, hence, resulting in the
provision of joined-up e-services. By 2009, Cabinet Office figures showed that 762 of the 1,649
targeted central government websites had been closed, and a further 599 were expected to close that
year (Grant, 2009). Varney’s report concluded with recommendations to include the “blueprint for
change” and other steps that need to be taken in the 2007 Comprehensive Spending Review (CSR)
126
delivery plans and the associated performance management framework (Varney, 2006, p. 83). A
significant recommendation included the funding framework behind these super-sites. In particular,
Varney (2006) recognised that Directgov’s management spent an excessive amount of time on fund-
raising from other government departments which were also “nervous about migrating websites when
the overall viability and sustainability of Directgov looks unstable” (p. 50). The Service
Transformation Agreement that followed in 2007, focused inter alia on the efficiency savings of the
migration, the improvement of return on investment of IT projects and the sharing of information
within and across departments (HM Treasury, 2007; Saxby, 2007b).
Directgov retained the ‘life event’ function of its predecessors in the form of ‘themes’ (HM Treasury,
2007; Varney, 2006), and offered the user fairly sophisticated administrative, legal, regulatory and
social public services, and a number of online tools (see Figure 4.2 below).
Figure 4.2: Directgov
Source: www.direct.gov.uk
Furthermore, its availability in the Welsh language and in many accessible formats, as well as via
other media such as digital television and mobile phones, enhanced communication and interactivity
with a wider audience and broadened accessibility (Directgov, 2009; Kolsaker & Lee-Kelley, 2008;
Norton, 2008; Pickering, 2009). The introduction of the ‘Connect to your Council’14
service offered
seamless access, acting as a single point of contact instead of going through many layers, directly to
the local council service the user required (Directgov, 2009; King & Cotterill, 2007; Kolsaker & Lee-
Kelley, 2008; Sarikas & Weerakkody, 2007). In addition, transactions would be strictly protected, as
14 A gateway through Directgov which provides access to over 300 local government services:
mycouncil.direct.gov.uk
127
they were planned to go through the Government Gateway15
web-based interface for authentication,
on a single sign-on basis (Grant, 2009). On the participation front, Directgov promoted public
consultation by linking directly to the online petitioning (e-petitions) section of the 10 Downing
Street16
website. In conclusion, Directgov was the government’s flagship digital service offering a
single point of entry for citizens to all key government services, information, tools and transactions
through digital TV, mobile and the web. As such, it was deemed successful at the time, constantly
evolving to reflect the changing demands of citizens, claiming to be an evidence-based and user-tested
solution to driving greater uptake of electronic transactions (OECD, 2009). The idea was that
improvements in services are led by public need, as opposed to technology’s capabilities. Coll (2009)
argues that in theory, that was supposed to be good for consumers with improved customer experience
and the creation of more responsive services with, presumably, cost savings. The team behind
Directgov had also received a commendation for central government excellence, in the 2008
e-Government National Awards, for aligning Directgov, Business Link and NHS Choices.
4.3.2 Theme A: Areas of Responsibility – Public Servants and Expert Consultants
This theme had just one category and two subcategories in Phase 3 of the analysis: ‘A1 – Levels of
Experience – Responsibilities – Knowledge of e-Government Projects’ was broken down into the
subcategories of ‘Experience’ and ‘Responsibilities’ of the participants who took part in the study.
4.3.2.1 Experience
The levels of experience were wide, and categorised into the following general categories:
Public Service Expertise
ICT Strategy Expertise
Operational Expertise
Technical Journalistic Expertise
4.3.2.2 Responsibilities
Responsibilities for delivering the project were categorised into four key areas:
Developing and Implementing Strategy
Cost Reduction
Operational Responsibilities
Evaluating the Project Outcomes
15 A government website that is used to register for online government services. It is an important part of the
government’s strategy for delivering ‘joined up’ government, enabling people to communicate and make
transactions with government from a single point of entry: www.gateway.gov.uk
16 Instead of petitioning the Prime Minister by post or have it delivered to the Number 10 door in person, the
public can now both create and sign petitions on this website: petitions.number10.gov.uk
128
Consequently, the key participants who contributed in earnest to this study were drawing on a wide
range of perspectives based on solid experience of the project under scrutiny.
4.3.3 Theme B: System Design – The Processes for Creating Objectives for
e-Government Systems
Three categories derived from theme B:
B1 Evolution and Drivers of Objectives for e-Government Services
B2 Objectives Formulation and Success Criteria
B3 Main Identified Objectives of e-Government Services
4.3.3.1 B1 – Evolution and Drivers of Objectives for e-Government Services
This category examined what participants viewed as the main drivers of objectives for e-government
services, particularly in the context of the Directgov project. Data coded under this category was
further broken down under several headings as seen in Table 4.1 below:
Table 4.1: Evolution and Drivers of Objectives for e-Government Services
Evolution and Drivers of Objectives for e-Government Services
Poorly Defined and Poorly Aligned Strategy
Customer- Centricity & Satisfaction
Costs Reduction
Need for Common Infrastructure
Clearly Defined Strategy
New Technologies
Being Modern
Single Domain – Integration of Strategies & Services
Inclusivity
The weighting of these contributions is graphically displayed in the chart in Figure 4.3 below, using
the units of meaning coded (Lincoln & Guba, 1985). The units of meaning coded is defined in the
methodology chapter as a segment of text from the transcript which is assigned to a code based on its
meaning. The codes are clearly labelled and each label is clearly defined (Taylor & Bogdan, 1984).
Henceforth, the most important units of meaning that represent research participants views under each
theme for both of the cases in this chapter, would be reported.
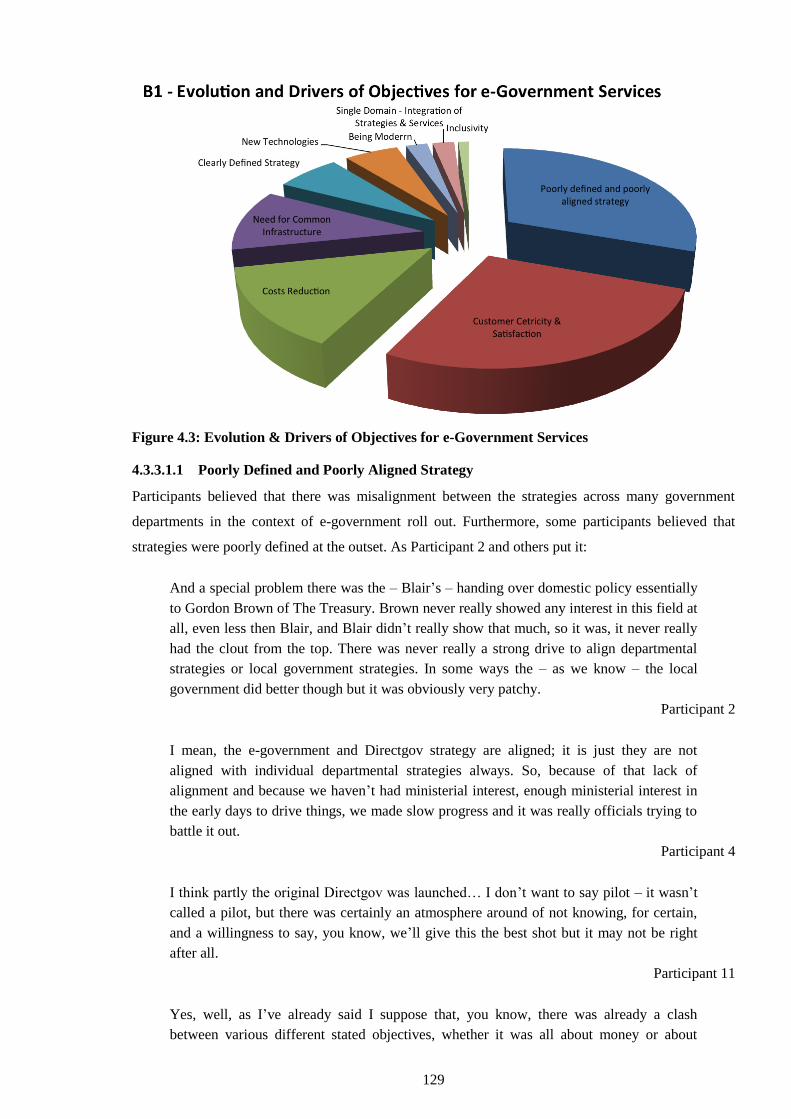
129
Figure 4.3: Evolution & Drivers of Objectives for e-Government Services
4.3.3.1.1 Poorly Defined and Poorly Aligned Strategy
Participants believed that there was misalignment between the strategies across many government
departments in the context of e-government roll out. Furthermore, some participants believed that
strategies were poorly defined at the outset. As Participant 2 and others put it:
And a special problem there was the – Blair’s – handing over domestic policy essentially
to Gordon Brown of The Treasury. Brown never really showed any interest in this field at
all, even less then Blair, and Blair didn’t really show that much, so it was, it never really
had the clout from the top. There was never really a strong drive to align departmental
strategies or local government strategies. In some ways the – as we know – the local
government did better though but it was obviously very patchy.
Participant 2
I mean, the e-government and Directgov strategy are aligned; it is just they are not
aligned with individual departmental strategies always. So, because of that lack of
alignment and because we haven’t had ministerial interest, enough ministerial interest in
the early days to drive things, we made slow progress and it was really officials trying to
battle it out.
Participant 4
I think partly the original Directgov was launched… I don’t want to say pilot – it wasn’t
called a pilot, but there was certainly an atmosphere around of not knowing, for certain,
and a willingness to say, you know, we’ll give this the best shot but it may not be right
after all.
Participant 11
Yes, well, as I’ve already said I suppose that, you know, there was already a clash
between various different stated objectives, whether it was all about money or about
130
better services whether, and then, you know, the fact that when it came down to the
augmentation there was a very bureaucratic approach to just doing it for the sake of it
because it had to be done by a certain date and I think that’s three different drivers that do
not necessarily align at all.
Participant 14
4.3.3.1.2 Customer-Centricity and Satisfaction
Participants believed that the 2005 Transformational Government: Enabled by Technology Strategy
Document’s assertion of the “transformation of public services for the benefit of citizens” (Cabinet
Office, 2005, p. 2) was reflected when formulating objectives for the Directgov project. They further
believed that the statement published in the document, that “Directgov and Business Link have started
to introduce a different way of looking at online services, with the focus on customers rather than the
service provider” (p. 5) with regard to customer-centred delivery, was a driver in the formulation of
project objectives:
If you look at the previous Transformational Government strategy which goes back to
2005, it was bedrocked around three principles, the ‘citizens’ centricity’, the ‘IT
profession’ and the ‘shared services’. And when you look at the Cabinet Office, we have
gone a great deal down the line of sponsoring and pushing Directgov which is a citizens’
service channel.
Participant 1
Yes, I think if citizens wanted to, then they should have the choice of having a one-stop
shop, one-stop notification. I mean there’s, here again is the problem; I mean, everyone
who’s had to deal with reporting a death in the family – and I’m old enough to have had
that experience many times – knows that you have to report it over and over again to
different people. No organisation will take another organisation’s word for it, you have to
keep doing it and this was the original – one of the original – aims of e-government…
Yes, they decided they wanted to make a one-stop death notification and every one who’s
ever – it’s something that citizens want.
Participant 2
I mean yes, citizen-centricity has been there since the start, as an objective for Directgov,
so that has always been; we have just have not had the teeth to actually make it happen
enough.
Participant 4
However, some participants believed that this objective could never be realised within the structures
under which Directgov had to operate:
Well, when Directgov was set up, the whole aim was to make it citizen-centric. I mean
this is my personal view, so some of the views I give now are my personal views… The
whole reason was that the predecessor to Directgov, UK Online, had not worked; because
it was just signposting so it was aiming to be a destination site with the structures, the
information architecture built around citizen need, and not government departmental
structures. That was the original aim. Now, we have struggled to achieve that because
131
departments have been very, it has been very difficult to get departments to not think
from a departmental basis, and to think from a citizen-centric view.
Participant 4
I think, is that whether you say our objective is to deliver great online customer services
what you mean is to maximise take-up to save money. On that scenario, these two go
hand-in-hand... So, I think the answer… my answer to your question will be, “No.
Prioritising customer-centricity is not now at the top of the list.”
Participant 13
4.3.3.1.3 Cost Reduction
Many participants believed that the Directgov project was principally about cost reduction and
benefits such as customer-centricity and reforming how government delivers services was a desirable
by-product of achieving cost savings:
Well, citizen-centricity was the ‘in’ thing under service transformation; that was the
Varney agenda. You know, there is only one show in town now and that is cost-cutting
obviously, what is called deficit reduction, you don’t cut cost now, it is deficit
reduction… I still argue this is about services; that is what it’s driven for, but in reality at
the centre people are looking for their money back.
Participant 3
I think that although, yes, the efficiency, it’s the delivery is something that is often talked
about right across the world, in certain places and in certain contexts I think the potential
for cost savings is stressed rather than greater efficiency or better delivery. The driving
force behind Tony Blair’s e-government drive in the late nineties, which put the UK
ahead of most of the rest of Europe for a period of time, was driven in part, by the
Gershon Report which tried to persuade everybody that this was going to enable us to
spend a lot less money on government services.
Participant 14
4.3.3.1.4 Need for Common Infrastructure
Participants were united in the belief that a common infrastructure was the right approach from all
stakeholders’ perspective and that the desire to streamline government websites was a key driver of
objectives for the Directgov project, coupled with cost reduction:
Common infrastructure and cost reduction leads to an improved capability to deliver this
sort of online services.
Participant 1
132
The original business case for Directgov was all built around that channel shift as being
the main business case driver for Directgov. There are other components of efficiency
such as re-use, so using something once and reusing it, such as not building multiple
resilient web infrastructures, you can reuse the same infrastructure and that does save
money. Then there are economies of scale in terms of citizen marketing, so the way you
advertise and so on, is more efficient when you have it under one umbrella.
Participant 4
So and I think in that case it’s now, you know, a foundation stone on which to build
further rather than kind of fundamentally change and that’s the new government’s digital
service strategy is to kind of continue to consolidate government websites to move to a
what they call a single government domain, which is everything – absolutely everything.
Participant 5
4.3.3.1.5 Clearly Defined Strategy
Not all participants agreed that the strategy which underpinned the Directgov project was poorly
defined and aligned. There was a belief among some participants that the strategy was well defined
and well aligned with other government strategies:
And when you look at the Cabinet Office, we have gone a great deal down the line of
sponsoring and pushing Directgov, which is a citizens’ service channel.
Participant 1
…So I wouldn’t say there was any particular tension between what Directgov is trying to
do and other strategies.
Participant 6
4.3.3.1.6 New Technologies
Many participants saw new technologies as a key driver of evolving objectives for the Directgov
project:
In terms of evolving over time, I mean the issues that have driven the evolution of our
objectives, such as how the web has developed, so when we started out there was, you
know, social networking was in its infancy, that has had a big effect on the role of how
people see the Directgov. We are just beginning to understand how government should
play in that space, because that will have a big impact.
Participant 4
Other drivers of objectives for rolling out e-government services included a general idea about being
modern, ideas concerning integration of services and inclusivity, as e-government sites develop and
grow:
I mean it’s, we should be increasing the effectiveness shouldn’t we, but I don’t think
that’s really the objective. I mean the objective is more to a sense of modernisation and
there’s also the feeling that obviously this agenda is being driven to some extent by the
133
ICT industry which wants to perhaps put a gloss on some of the things that it does in
government to add a bit of glamour to it.
Participant 2
The new G-Digital environment is looking at whether in fact we can deliver service
integrators rather than system integrators.
Participant 1
Yes, yes, you know, because again one of the problems Directgov faced was – with the
convergence programme and was certainly life sparing – the amount of content which is
run, I think that’s on our website, ten thousand pages on there at the moment, so people
can’t find what they want.
Participant 6
4.3.3.2 B1 – Summary
The principal drivers for objectives in rolling out the Directgov project were general and non-specific
in nature. This was caused by poorly aligned and poorly defined strategies particularly at the level of
government departments. Customer-centricity whilst set out in the government’s strategic documents
was aspirational, though the principal driver of objectives remained as cost reduction through greater
efficiencies derived from natural synergies that having a single web portal would produce. Other
general drivers of objectives included ideas about being modern and using the latest technologies. No
key informants cited the wider reform of service delivery by government as either an objective of the
project or indeed a by-product of its successful implementation. There was a clear difference of
opinion between participants’ ideas as to what would drive objectives and ideas put forward in the
government’s published strategy document delivered to parliament in 2005, which cited reforming
public services, increasing customer-centricity and reducing costs. Participants did aspire to improve
customer-centricity and reduce costs but did not believe that the project objectives would include
wider reform of public services.
4.3.3.3 B2 – Objectives Formulation and Success Criteria
This category examined how objectives for the Directgov project were formulated and how
participants in the study defined success criteria. Data coded under this category was further broken
down under several headings as seen in Table 4.2 below.
Table 4.2: Objectives Formulation and Success Criteria
Objectives Formulation and Success Criteria
e-Government and Wider Change – Transformation & Reform
Aligning Strategies
Following Policy
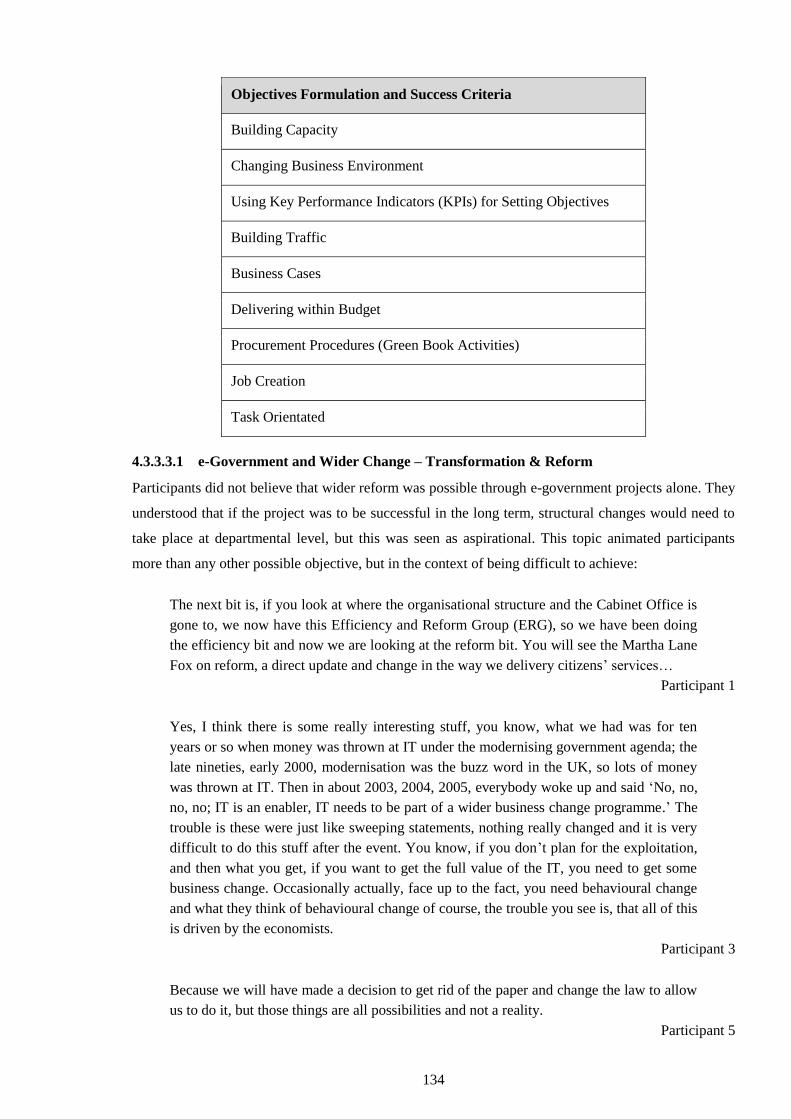
134
Objectives Formulation and Success Criteria
Building Capacity
Changing Business Environment
Using Key Performance Indicators (KPIs) for Setting Objectives
Building Traffic
Business Cases
Delivering within Budget
Procurement Procedures (Green Book Activities)
Job Creation
Task Orientated
4.3.3.3.1 e-Government and Wider Change – Transformation & Reform
Participants did not believe that wider reform was possible through e-government projects alone. They
understood that if the project was to be successful in the long term, structural changes would need to
take place at departmental level, but this was seen as aspirational. This topic animated participants
more than any other possible objective, but in the context of being difficult to achieve:
The next bit is, if you look at where the organisational structure and the Cabinet Office is
gone to, we now have this Efficiency and Reform Group (ERG), so we have been doing
the efficiency bit and now we are looking at the reform bit. You will see the Martha Lane
Fox on reform, a direct update and change in the way we delivery citizens’ services…
Participant 1
Yes, I think there is some really interesting stuff, you know, what we had was for ten
years or so when money was thrown at IT under the modernising government agenda; the
late nineties, early 2000, modernisation was the buzz word in the UK, so lots of money
was thrown at IT. Then in about 2003, 2004, 2005, everybody woke up and said ‘No, no,
no, no; IT is an enabler, IT needs to be part of a wider business change programme.’ The
trouble is these were just like sweeping statements, nothing really changed and it is very
difficult to do this stuff after the event. You know, if you don’t plan for the exploitation,
and then what you get, if you want to get the full value of the IT, you need to get some
business change. Occasionally actually, face up to the fact, you need behavioural change
and what they think of behavioural change of course, the trouble you see is, that all of this
is driven by the economists.
Participant 3
Because we will have made a decision to get rid of the paper and change the law to allow
us to do it, but those things are all possibilities and not a reality.
Participant 5
135
Yes. The main – it has changed quite considerably over the years because the original
drivers were around reducing – or it was more about the amount of content that it had and
also the number of visitors it attracted and it’s, certainly for the first couple of years it
was very, very much around how much traffic is coming to the site and that was really
what the main considerations were.
Participant 6
4.3.3.3.2 Aligning Strategies
In the same way as strategy alignment was a driver of objectives formulation, it was seen as
unattainable when it came to crystallising objectives for the Directgov project:
Well, this has been the complete failure hasn’t it? I mean you’ve had the, a small team in
the Cabinet Office producing these strategies; under the Blair era it was complicated
because he had so many internal think tank type organisations…
Participant 2
Well, it’s very difficult. I think what we had, the Labour government came into power in
‘97 with the view that we were all very ‘silo-based’ and now we were going to be joined
up… And of course what you get is, two or three years where people were very excited
by cross-government working and all that, and what I found eventually, was yes, people
were very excited about cross-government working if they thought they were going to
gain from it. But, no-one was willing to partake…
Participant 3
And different departments say things in different ways, have different objectives, and you
actually have potentially conflicting policy objectives, and when you join it all up that all
comes out so you have to deal with all of that before you show it to the public.
Participant 5
4.3.3.3.3 Following Policy
Following policy was a clear driver of formulated objectives for the Directgov project:
The Prime Minister is launching these at top level but departments are then coming in
with things, and they each have their own element around that programme for
government. We then ripple down from that, because we are infrastructure-supporting
mechanisms, technology is not an end in itself. I keep saying, ‘technology is not an end in
itself, it must deliver what the business actually wants’, what the business wants to do.
And our role is to help it do it quicker, help it do it in a simpler way, help it in a more cost
effective way.
Participant 1
Also I think we are constrained by government policy so our objective is government
policy, and that’s not necessarily the market place. So say if we were, thinking about a
company like Amazon, they deliver what the public want because the public if they don’t
want it, they won’t buy it okay? Whereas government’s a bit different, government has its
own policy.
Participant 12
136
4.3.3.3.4 Building Capacity
Building capacity and creating infrastructure that would facilitate changing technological and business
needs into the future categorically informed objective formulation in the Directgov project:
Well, what is happening now is we have been, we are building in a capability. Actually, I
would consider the UK, even though we get a lot of negative publicity, I would consider
the UK Government public sector to be really quite well respected around the world for
its project management and programme management methodologies.
Participant 1
We are paying out taxpayers’ money and we have to be able to justify that we’re doing
that in the most efficient way and so, you know, quite often, actually, seeing people, if
we’re paying benefits to people, has a specific, you know, added value to the service that
we… that we offer. But I think, you know, one of the things that we’ve got to do in
government is not look at digital as a means of delivering it. A digital service is not a
service that’s delivered online via a website. A digital service can be a digital telephony
service. It can be a service that’s delivered digitally into government but is delivered
through a third party. HMRC and PAYE is a very good example of that. There are tens of
software companies who offer PAYE processing which delivers the data straight into the
HMRC system.
Participant 5
4.3.3.3.5 Changing Business Environment
The changing business environment was a similar factor that influenced objective formulation, but in a
broader sense than just following policies that may change with new governments. Changes in
technology which may make it possible to deliver new automation or technologically-driven social
changes such as social networking, which in turn change the public’s demand for a new type of
interaction, were seen as pre-requisites for inclusion into objective formulation for the project. The
ability to change the website/portal, in line with wider political, social or technological change became
an objective in its own right:
I think there are a number of issues. The first one is a changing business requirement.
There is nothing wrong in a changing business requirement because the landscape in
business does not stay the same. People change, requirements change, needs change, so
business requirements change. And that is a very valued thing; once you fix a business
requirement it shouldn’t necessarily bind it into concrete, because actually it should
legitimately evolve over a period of time. Especially, if you are looking at large
programme timescales, so if you are looking at something that is delivering over say four
or five years, the business landscape is ultimately going to change over that period. So
there need to be some control measures, configuration control measures in a programme
to enable that, the business development and the business objectives to change.
Participant 1
You have to look at where technology is going, you have to look at where consumers are
going, what they want to do and where they want to be; they’re getting increasingly more
137
Internet savvy. The Internet has changed massively over the last twenty years with the
introduction of social media etc., so that’s a whole area you have to look at. You do have
to look at what’s possible. We had a look at e-government across the world to see what
people are doing. So those things drive a direction of travel so that’s how you sort of
starting to build your long-term objectives. Objectives evolve but some are still there.
Take for example the reason to join up things in order to make it easier for people to use
our services, which is still there, as a key thing. What you have to do is, to adapt it, to
what you are facing in your political environment or social environment etc.
Participant 21
The conception in terms of setting objectives was seen as dividing logically into three key areas:
1. Functional Drivers
2. Technical Drivers
3. Project Timelines
Participant 1, amongst others, for example, commented on the above key areas as follows:
Throughout there, if you have got the business drivers actually changing, the functional
requirements will also change, so then you have to turn around and say ‘Okay, what are
the functional requirements?’ I will give you an analogy, you know, a project; you have
decided to buy a house, you buy your house and you have got aging parents. And over a
two- to three-year period you decide that actually the business drivers are that you want to
look after your ageing parents, so you then have to add a granny flat or you have to
convert a garage or something on the house, i.e. bedrooms to accommodate that. That’s a
business driver, which is the fact that your family make-up has changed and you have to
take responsibility for looking after elderly parents or ageing parents. The functional
requirement is you have to have more rooms or bedrooms in the house and therefore you
have to convert things, a loft extension or something like that, so that’s the functional
requirements.
Then, you have to look at the technical implementation of that, which is what is it
that you have to put in this bedroom, what size is it going to have to be, you know, you
are going to have to put radiators, lights, rewire and all the rest of it, and how do you do
that in implementation terms. You then turn around and say ‘Okay, the implementation of
that will take you six months,’ so here’s the driving line of how soon you can get your
granny or your granddad or your uncle whatever it is into. If I make that analogy, it is
very similar to an IT environment where you have got a business driver changing, you
have a functional requirement that changes in the life-cycle of the project, you then have
to change the technical specification and then you have to turn around and say ‘How does
that affect my implementation timelines?’
Participant 1
Other, more general and less cited objective formulation and success criteria in this category, included
building traffic, having a business case to support costs, delivering within budget, supporting Green
Book activities (procurement processes), being task-orientated and creating jobs. Building traffic,
138
although a crude objective, was seen as essential in the early life of the project, while the business case
was seen as a more cynical exercise:
…or, it was more about the amount of content that it had and also the number of visitors
it attracted and it’s, certainly for the first couple of years it was very, very much around
how much traffic is coming to the site and that was really what the main considerations
were.
Participant 6
Those are the things that are built in the top end of the strategy in terms of government,
and below that obviously. We then take individual packages that say this is going to
deliver this bit and this is going to deliver this separate bit. You then work a business case
in terms of that…
Participant 1
What we are really doing is we are training people to write bad business cases better.
Participant 3
4.3.3.4 B2 – Summary
The misaligned strategies identified in category B1 generated cynicism amongst those responsible for
crystallising the wider environmental drivers of objectives into formulated objectives and success
criteria for the project. The project could not be part of wider government reform as the structural
prerequisites for successfully changing, attitudes beliefs and behaviours across government
departments were not in place. Even at this point in the Directgov project’s existence, the first of the
three objectives of the 2005 Transformational Government: Enabled by Technology Strategy, which
were “The transformation of public services for the benefit of citizens, businesses, taxpayers and front-
line staff” (Cabinet Office, 2005, p. 2) were clearly unattainable to those responsible for delivering the
project. It is noteworthy that as the project’s objectives formulation moved from the general (B1) to
the specific (B2), customer-centricity was lost along the way, and that the debate was now focused
squarely on strategic alignment between central government and its departments.
4.3.3.5 B3 – Main Identified Objectives of e-Government Services
The final set of objectives identified for the Directgov project as refined and articulated by the
research participants are set out in Table 4.3 below:
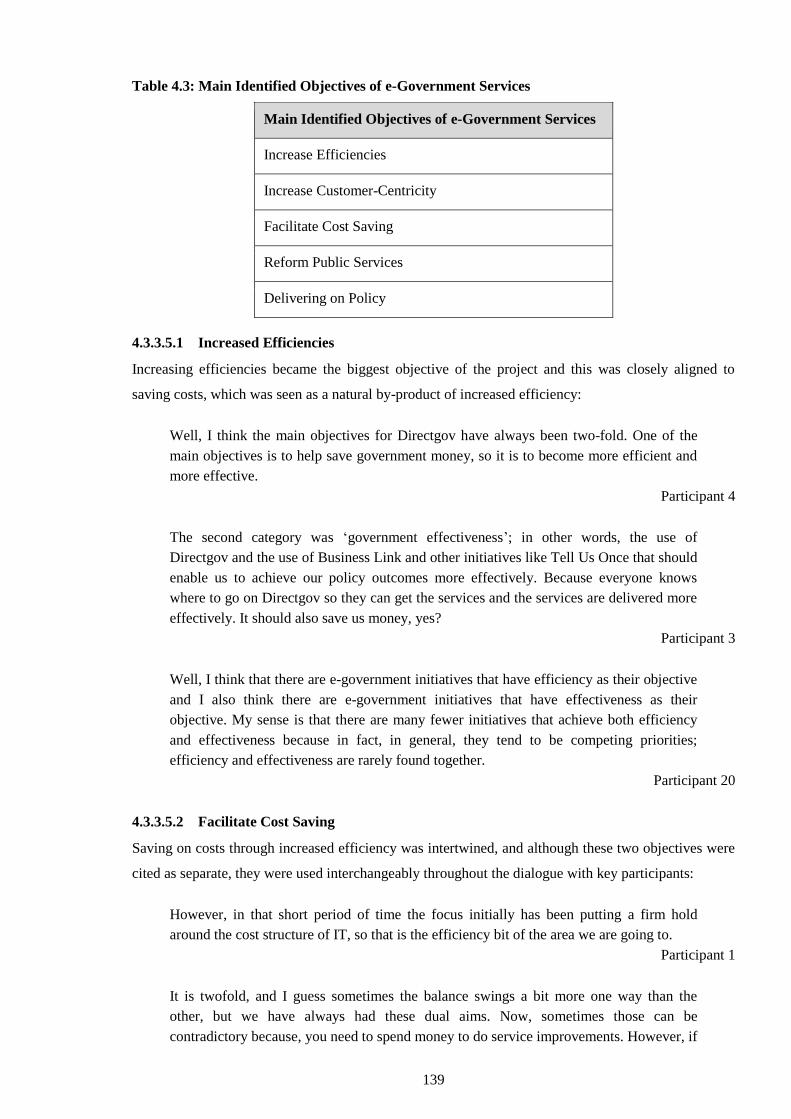
139
Table 4.3: Main Identified Objectives of e-Government Services
Main Identified Objectives of e-Government Services
Increase Efficiencies
Increase Customer-Centricity
Facilitate Cost Saving
Reform Public Services
Delivering on Policy
4.3.3.5.1 Increased Efficiencies
Increasing efficiencies became the biggest objective of the project and this was closely aligned to
saving costs, which was seen as a natural by-product of increased efficiency:
Well, I think the main objectives for Directgov have always been two-fold. One of the
main objectives is to help save government money, so it is to become more efficient and
more effective.
Participant 4
The second category was ‘government effectiveness’; in other words, the use of
Directgov and the use of Business Link and other initiatives like Tell Us Once that should
enable us to achieve our policy outcomes more effectively. Because everyone knows
where to go on Directgov so they can get the services and the services are delivered more
effectively. It should also save us money, yes?
Participant 3
Well, I think that there are e-government initiatives that have efficiency as their objective
and I also think there are e-government initiatives that have effectiveness as their
objective. My sense is that there are many fewer initiatives that achieve both efficiency
and effectiveness because in fact, in general, they tend to be competing priorities;
efficiency and effectiveness are rarely found together.
Participant 20
4.3.3.5.2 Facilitate Cost Saving
Saving on costs through increased efficiency was intertwined, and although these two objectives were
cited as separate, they were used interchangeably throughout the dialogue with key participants:
However, in that short period of time the focus initially has been putting a firm hold
around the cost structure of IT, so that is the efficiency bit of the area we are going to.
Participant 1
It is twofold, and I guess sometimes the balance swings a bit more one way than the
other, but we have always had these dual aims. Now, sometimes those can be
contradictory because, you need to spend money to do service improvements. However, if
140
you look at it in the round, the total picture of saving money, we know that if we can shift
a lot of the government contacts from the telephone and face-to-face channels to the
Internet, then we save a lot of money.
Participant 4
So the Martha Lane Fox review is part of several others. Obviously we’re part of, you
know, government efficiency drives and this wholesale looks at how, particularly in
today’s climate, government can make more efficient use, spend less money, get more for
it. It’s taxpayers’ money after all. Although that continues, the sort of bedrock, really, that
everything that we think about has to be tested against. You know?
Participant 11
4.3.3.5.3 Increased Customer-Centricity
Increased customer-centricity did make it through to being an objective of the Directgov project.
However, the language used by participants when discussing customer-centricity was still bound up in
efficiencies and cost savings as a benefit of being there, and less as a goal in its own right:
What I mean by benefits, would be efficiency and/or effectiveness. On service
transformation, which Directgov and Business Link at one point, had to report into, we
had a framework, we designed a framework for measuring efficiency and effectiveness.
What we said was there were four categories of benefits from service transformation.
There was, and you can check this out later on when I send you the material, basically
four categories. First of all, there was ‘user value’, primarily this is about improving the
value to the customer, so we said there are three sub-divisions there, it saves the user
time, it saves them money and it improves their experience of government. Better
services, more responsive services, more easy to access services, all that kind of stuff. So
it is about customer satisfaction, measurement and so on and so forth.
Participant 3
Well, so yes, that was really, again, one of the original concepts around, sort of why
Directgov was set up so, it, as well as making it easier for citizens. It also, you know, it
will sort of drive up efficiency checks… But, an equally important goal is to improve
service, provide service improvements for citizens so that they find it easier to transact
with government.
Participant 6
I think it, possibly, you know, you know the, in the era of cuts, the language would be,
you know, that it’s all about citizen-centricity that it’s all got to be about every service
being orientated towards satisfying citizen needs but the reality will be that people will be
concentrating on how on earth they can actually manage to do, you know, three fifths of
what they used to do with three fifths of the money that they used to have and it, I think
the whole kind of ethos of citizen-centricity will be overshadowed by the drive of
downscaling.
Participant 14
141
4.3.3.5.4 Reform Public Services
There is little evidence in the data to suggest anyone really believed that the Directgov project would
influence government-wide reform despite it being an objective of the project:
…if you look at where the organisational structure and the Cabinet Office is gone to, we
now have this Efficiency and Reform Group (ERG), so we have been doing the efficiency
bit and now we are looking at the reform bit.
Participant 1
So there are also, I think, issues in terms of service delivery, in terms of digital around
legislation. We are restricted by the laws that have been in place, for sometimes quite
literally, hundreds of years that affect the way that services are delivered. So there are
certainly a number of services that cannot be delivered without a change in legislation in
a digital way…
Participant 5
The challenge is when you have multiple changes all happening at the same time, so
we’ve had the Martha Lane Fox review, we’ve had the Efficiency Reform Group review,
then we’ll have a Directgov review; all those three all happening at once in a short time
frame. It’s very difficult to go and get people to buy into this; unless you know what your
strategy is, so you have to wait for the strategy, the vision, the sign-off before you can
really move forward.
Participant 12
4.3.3.5.5 Delivering on Policy
In the same way as reforming public services needed to be included in the final objectives for the
project, delivering on policy was also a common-sense inclusion for any government-funded project.
In particular, as the business environment in which Directgov would operate was essentially created
by government policy and subject to change, since governments changed over the life of the project:
The current document; you have got to remember that over the last six months we have
had a government change and therefore, from our perspective, the strategies and policies
of the previous Labour government are no longer a policy for the coalition. They can pick
up the mantel and run with them and there are sort of legally binding activities that they
still have to deliver, but from an ICT strategy and policy directive, obviously we are
working very closely. I think whenever we look at the policies and the strategies, we
published…
Participant 1
The internal objectives are driven by customers and customer needs. The external
objectives are driven by the government, they’re purely political. Political, as the
government says ‘There will be three websites serving the government, NHS Direct,
Business Link and Directgov.’ You have to do that and your corporate site becomes a
corporate site with a minimum of information on. That’s what we did, we followed
government policy basically. Is there a rationale behind it; would we do it if we didn’t
142
have to do it? No. So it’s political; it is the main driver. Have we saved money through
doing it? No. And it’s going to change again.
Participant 22
4.3.3.6 B3 – Summary
The principal objectives of the Directgov project, as articulated by the research participants were to
save money and increase efficiency. Customer-centricity was a desirable by-product that would crop
up to some limited extent as a natural consequence of the former two main objectives. Few believed
the Directgov project would engender reform of public services as articulated in the government’s
strategic document. Following government policy was narrowly cited as an objective, which would
probably appear in all government-funded projects.
4.3.4 Theme C: System Implementation
Theme C had two categories, which were:
C1 Requisite Implementation Processes for e-Government Services
C2 Technological – Challenges – Barriers and Facilitators
4.3.4.1 C1 – Requisite Implementation Processes for e-Government Services
This category contained data relevant to the requisite implementation processes for e-government
projects such as Directgov. The processes as articulated by the research participants are set out in
Table 4.4 below:
Table 4.4: Requisite Implementation Processes for e-Government Services
Requisite Implementation Processes for e-Government Services
Cross-Departmental Cooperation
Top-Down Leadership
Competency
Good Governance
Project Management Methodologies
Strong Management Structures
Accountability
Treasury Approval
143
4.3.4.1.1 Cross-Departmental Cooperation
It was obvious from the start, that the requisite cross-department cooperation was not forthcoming.
This strategic gap in planning the project became much more evident as the project moved to
implementation phases. This impediment was most evidenced by the fact that the project’s funding
was never properly put in place at the planning stage. Nowhere in the planning process was funding
even cited as an issue:
So, all our Chief Executive at that time did, was going round, talking to departments,
trying to get them to fund it – it was literally a full-time job… It made impossible to do
any forward strategic planning because you didn’t know what the funding is from one
year to the next and so on.
Participant 6
This management failure to secure cross-departmental cooperation at the planning stage resulted in
compromising the project to an extent. For a CEO to have to spend a full two years simply trying to
secure enough funding to stay in business represents an indictment of the entire strategic management
of the government-wide plan to deliver e-government services at that time. This failure to adequately
strategise at the outset manifested itself in poor cross-departmental cooperation, which in turn
impacted on other aspects of the project:
Directgov – I’m less sure about. I think, I suspect, the problems there were more to do
with the regular changes in ownership, the sponsoring department, you know, it went
from the Cabinet Office to the COI to the DWP and now it’s back in the Cabinet Office.
And, questions of establishing its authority with other departments I think, again, it’s not
immediate obvious why another government department should co-operate and invest
money in Directgov. It’s, you know, it’s… it’s always difficult.
Participant 2
There were then other groups and these are all across government groups; they are cross-
government editorial and cross-government marketing. This was a totally new way of
working, people in government were not used to working like this and the Directgov
really had to forge a new way of doing things and broker the discussions between
departments, bring them together on the editorial boards, forced them to have difficult
conversations. Unfortunately, sometimes in that process people would then accuse
Directgov as being dictatorial or heavy handed, so it has been quite a difficult journey to
try and say ‘look, we need to work together, we need to build things around the citizen’
when departments were sometimes still sometimes trying to pursue a silo-based view.
Participant 4
144
To implement… lots of cross-departmental negotiation and compromise and trying to get
everyone to agree on a common set of things that was actually achievable… the then
e-Envoy Andrew Pinder went round and made sure there was support from each of the
department secretaries so, you know, it’s almost as if he had to bully them into saying
‘You will fund Directgov, you will provide content, you will put these, sort of, franchise
things in place,’ and so on…
Participant 5
The very beginning was about setting up the franchise structure because it was about
cross-departmental structure and how you work together, was very new, it was not done
before, so we had to create ways of doing things across departments. We had to ask
departments to fund us at the beginning, so we literally went with cup-in-hand. That was
the way at that time and we hadn’t proven ourselves yet to be where the central funding
would come, so it was a test for us.
Participant 21
4.3.4.1.2 Top-Down Leadership
Not having cross-departmental management structures in place holed the Directgov project below the
waterline. It could easily have failed at this point and the fact that it did not, is more down to the
resilience of its champions than any form of strategic competency or leadership skills. Another key
requisite implementation process cited by research participants which failed to materialise in the
Directgov project implementation phase is top-down leadership:
You’ve got to know why you’re doing it, haven’t you? And you have to be ruthless in
achieving it – you have to make it more or less compulsory to – and this, this came about
very late… so, to achieve returns you really have to be ruthless and to mandate it. You
have to have clear leadership. I mean these are all obvious things…
Participant 2
The only way you’re going to get this success in government is you have to have the
support from the very, very top of the office. You will always see that through the three
different initiatives… when you then spoke to, you know, the Cabinet Office, no, it’s not
them, they only monitor, it’s departments who own those individual targets so, you know,
some of them put them in their own public service agreements and some didn’t, which is
why we’ve had, you know, a really tough time over the past three and half, four years in
driving that programme through, because there’s been no top of the office support… so, it
is that, you know, unless you’ve got that, you know, the one thing that I would say – the
critical success factor in all of this – is having that top of the office support across
government or you’ll fail.
Participant 6
Other cited requisite implementation processes included: good governance, competency, strong
management structures, good project management methodologies, accountability and Treasury
approval. All of these cited prerequisites to succeed during implementation are clearly related to
145
management issues and will inevitably follow on, should the right management and leadership
competencies are in place:
At the really big end, there is obviously the business case, the Treasury approvals, the
spending team activities, so when you get into multi-millions of pounds spends that are
above the local spend authority of accounting officers, you get into territory where you
have to be very circumspect about what you are delivering. You have to have a good
business case, you have to be approved by Treasury, you have to then enter a process of
controls, you have a Senior Responsible Owner (SRO) appointed, you have the
governance in place, you have the resources allocated, you have the objectives and the
milestones action plans, you have a series of what are considered to be ‘Managing
Successful Programmes Attributes’. And then, you go through a series of Gateway
activities where you have peer reviews and you do that through six stages. Then, you turn
around and have, maybe because it was a high risk programme, you might be subjected to
major programme review through the Treasury. That is a large group that is monitoring it,
the programme has to report through, so, those are the measures to control the big
programmes. The smaller programmes are still kept under the same sort of PRINCE 2
methodologies of programme deliverables and those sorts of things. So when you are
looking at this sort of activity, you have got some really good governance mechanisms,
some project management methodologies etc. in place.
Participant 1
According to some of the research participants however, this was not the case with the Directgov
project:
With website convergence it was a slightly different approach because, yes, there was a
big fanfare around Sir David Varney, when it came to implementation, though it was
always never really clear who is responsible for that target…
Participant 6
…you know, there’s a lot of turnover in senior management in government. There’s sort
of… and every time somebody leaves you know, you have to go around the same loop
again and of course any time there’s change in the administration, that happened and it’s
happened big time. Obviously the last twelve months. I think you have to start again. You
know? So why are you doing this?
Participant 13
4.3.4.2 C1 – Summary
A leadership failure at political and senior civil servant level resulted in a structural management
deficit whereby mission critical cross-departmental cooperation was not recognised in its importance,
and hence the requisite management structures were not put in place. This resulted in adverse
outcomes for the implementation of the Directgov project. Essential pillars to underpin the project
such as finance were not secured, and the consequences of this strategic level failure impacted on
almost every aspect of the project’s implementation.
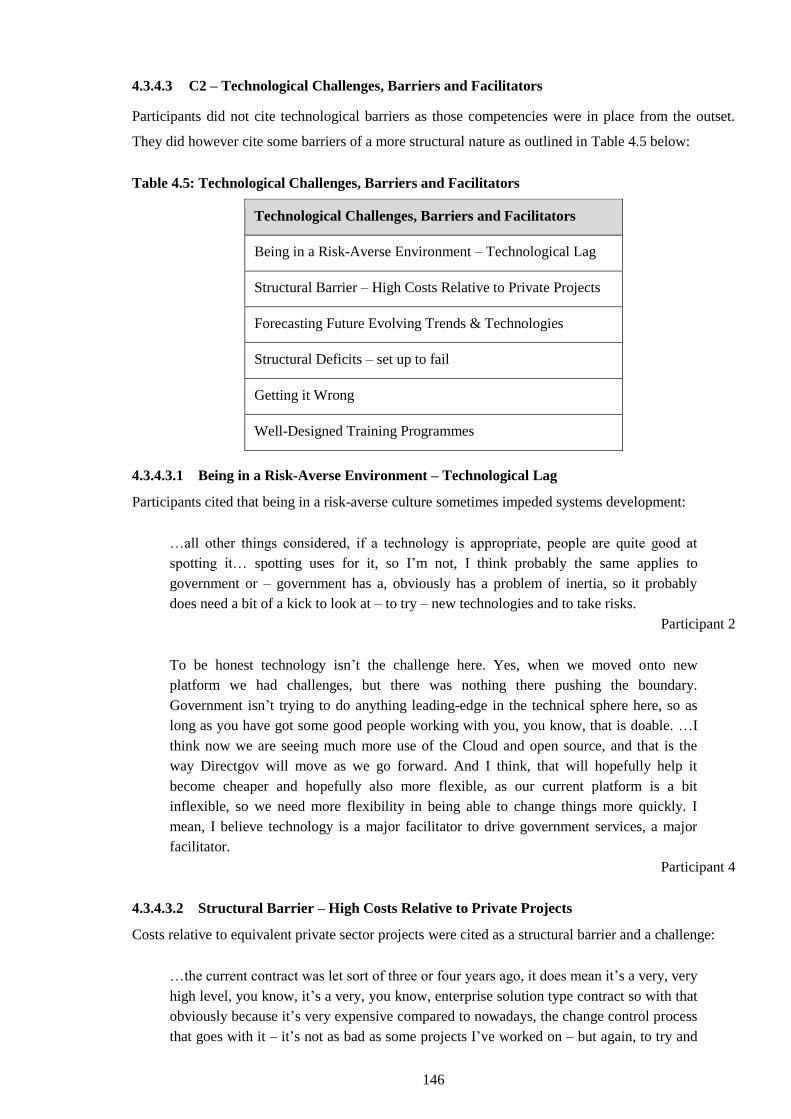
146
4.3.4.3 C2 – Technological Challenges, Barriers and Facilitators
Participants did not cite technological barriers as those competencies were in place from the outset.
They did however cite some barriers of a more structural nature as outlined in Table 4.5 below:
Table 4.5: Technological Challenges, Barriers and Facilitators
Technological Challenges, Barriers and Facilitators
Being in a Risk-Averse Environment – Technological Lag
Structural Barrier – High Costs Relative to Private Projects
Forecasting Future Evolving Trends & Technologies
Structural Deficits – set up to fail
Getting it Wrong
Well-Designed Training Programmes
4.3.4.3.1 Being in a Risk-Averse Environment – Technological Lag
Participants cited that being in a risk-averse culture sometimes impeded systems development:
…all other things considered, if a technology is appropriate, people are quite good at
spotting it… spotting uses for it, so I’m not, I think probably the same applies to
government or – government has a, obviously has a problem of inertia, so it probably
does need a bit of a kick to look at – to try – new technologies and to take risks.
Participant 2
To be honest technology isn’t the challenge here. Yes, when we moved onto new
platform we had challenges, but there was nothing there pushing the boundary.
Government isn’t trying to do anything leading-edge in the technical sphere here, so as
long as you have got some good people working with you, you know, that is doable. …I
think now we are seeing much more use of the Cloud and open source, and that is the
way Directgov will move as we go forward. And I think, that will hopefully help it
become cheaper and hopefully also more flexible, as our current platform is a bit
inflexible, so we need more flexibility in being able to change things more quickly. I
mean, I believe technology is a major facilitator to drive government services, a major
facilitator.
Participant 4
4.3.4.3.2 Structural Barrier – High Costs Relative to Private Projects
Costs relative to equivalent private sector projects were cited as a structural barrier and a challenge:
…the current contract was let sort of three or four years ago, it does mean it’s a very, very
high level, you know, it’s a very, you know, enterprise solution type contract so with that
obviously because it’s very expensive compared to nowadays, the change control process
that goes with it – it’s not as bad as some projects I’ve worked on – but again, to try and
147
get anything done or changed, takes a long time. That is the major problem that we’ve got
at the moment – it’s the cost and the amount of time it takes to change things. I mean
we’re not quite in the era – or the area – where you see some government sites where it’s
like £20,000 to change a word but it’s not far from it.
Participant 6
4.3.4.3.3 Getting it Wrong
There were real concerns from some participants as to the level of responsibly placed on their
shoulders:
We don’t. I mean the thing for me is, if you have a look, when I read Collins and
Bicknell’s book, Crash; that was published what, in 1998 I think. I got it last year and I
read it on holiday and it was like, you know, the cloud has been lifted. You read it and
you go ‘Holy cow!’ you know, because this is all about mainframes, but you read it and
it’s all there, all the mistakes. What happens today is there. And yet, we always think, you
know, the 1980s is ancient history you know, they didn’t have computers and they all
worked in the past and they all had quill pens. No! Every ten years we just reinvent the
wheel. We just go in circles. You know, the pendulum swings, there are different
environments in which these things occur but we don’t tend to learn you know.
Participant 3
It is a natural approach mechanism; there is a learning activity which says, ‘actually by
doing this, the result has been that’, so by imposing constraint/controls on things and the
moratoriums and reviews, we have released this value in terms of cash flow. On the other
hand, you are turning round saying ‘Well they are now interested in looking at us, so we
must make sure that we have got all of our paperwork, all of our processes, all of our
approaches documented so that we can prove that we have added value, we have saved
money etc.’ Transparency is a key element, so if you are looking at what happened on
Friday last week, you will see that we published the £25,000 plus contracts. Previously to
that, we had actually put out the COINS database (Combined Online Information System)
database which is a chart of accounts of the general ledger for government. Now we are
moving through a period of transparency activities where the information is put out there.
Now, it is not going to be all rosy, the information is going to have some warts in it, and
people are going to turn around and go ‘That’s wrong, why are you building two of
those?’ And that is the process of, sunlight is the best disinfectant; armchair auditors can
take a look at this. Those are the sorts of mechanisms that are being brought to bear in
terms of controlling this.
Participant 5
Other technological challenges, barriers and facilitators cited included structural deficits (set up to
fail), trying to forecast future and evolving trends, and having well-designed training programmes in
place:
You know, the way that we are set up, I think we are set up to fail. And we always look
back, every time there is a failure. I say it to people here, when we are talking about the
big projects. For example p-NOMIS still has got a lot of bad publicity and people go ‘Oh
what a disgrace,’ you know, and certain people get tarred with it, certain names. It’s like
148
‘hang on a minute, this wasn’t one person’s fault’, it is not a case of, how did we spend
£500 million, and can you blame one person; get real, get real you know? That’s it, so we
don’t learn, we look for scapegoats; I love that. There was an example; Collins is big on
that, he quotes, I think it was the Wessex Regional Health authority computer failure back
in the 80s where, and eventually everyone, avoided any blame apart from when this
woman took over and she took it all into the open. She held people to account, she held
herself to account and then they did, the government did what it always does with
someone who does this sort of thing, they paid her off, they made her redundant, you
know.
Participant 3
So, you know, and I think it’s really, as government tries to keep pace with general, you
know, trends with data online, you know, and we’re always behind the curve on that, and
we always will be – although at one time Directgov did say it was leading it but I’m not
sure it ever really was – certainly once tried to achieve it once, so, yes I think that is
something that has impact – in the case of our reviews, what is the answer? Impossible.
Participant 10
4.3.4.4 C2 – Summary
Technology did not present as problematic to participants in delivering the project. Participants
believed they had good competencies in this regard, and in general that technology could serve as an
enabler. However, there were concerns about working in a risk-averse culture whilst at the same time
worrying about the level of responsibilities placed on participants’ shoulders amidst concerns
regarding the consequences for them, and for Directgov, should the project fail. Some frustrations
were voiced in connection with the capabilities for change and the pace of such changes, along with
the difficulty of forecasting future technological advances.
4.3.5 Theme D: Evaluation and Future Development
Theme D had four categories, which were:
D1 Methods for Evaluation of e-Government Services
D2 Attitudinal Changes
D3 Ameliorating the Digital Divide
D4 Vision of the Future
4.3.5.1 D1 – Methods for Evaluation of e-Government Services
This category contained data relevant to methods of evaluating the success of the Directgov project.
The issues of concern to key research participants are set out in Table 4.6 below:
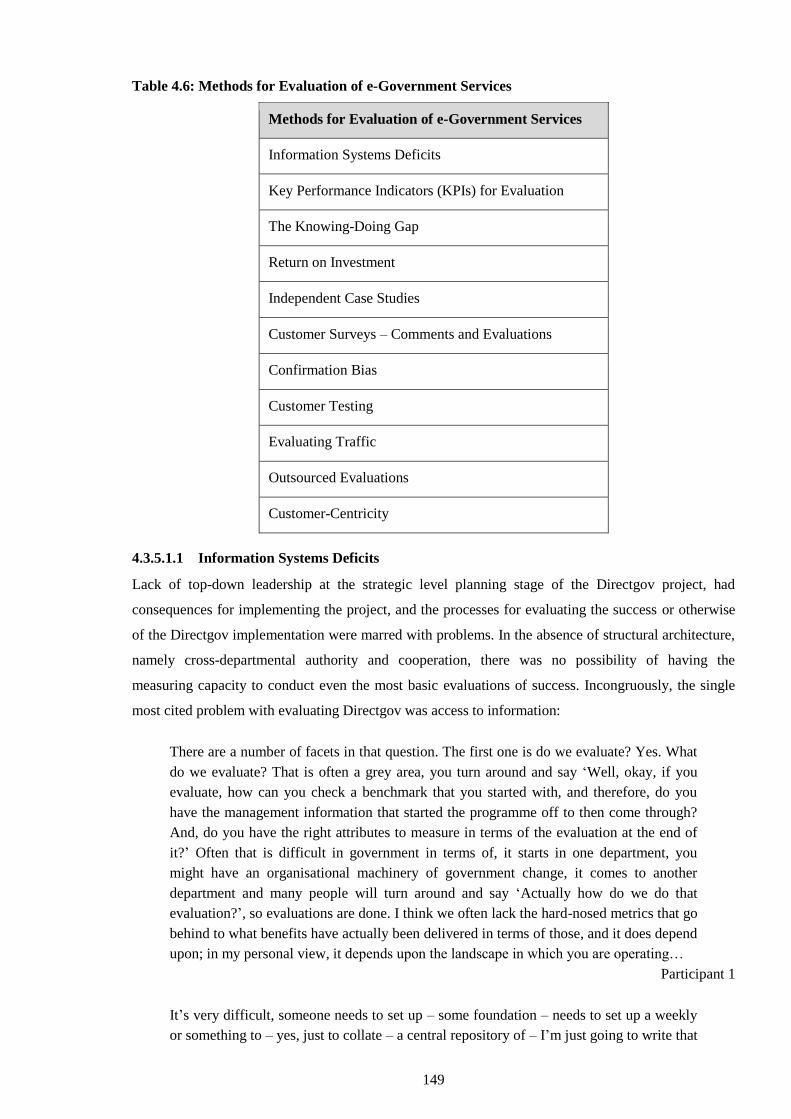
149
Table 4.6: Methods for Evaluation of e-Government Services
Methods for Evaluation of e-Government Services
Information Systems Deficits
Key Performance Indicators (KPIs) for Evaluation
The Knowing-Doing Gap
Return on Investment
Independent Case Studies
Customer Surveys – Comments and Evaluations
Confirmation Bias
Customer Testing
Evaluating Traffic
Outsourced Evaluations
Customer-Centricity
4.3.5.1.1 Information Systems Deficits
Lack of top-down leadership at the strategic level planning stage of the Directgov project, had
consequences for implementing the project, and the processes for evaluating the success or otherwise
of the Directgov implementation were marred with problems. In the absence of structural architecture,
namely cross-departmental authority and cooperation, there was no possibility of having the
measuring capacity to conduct even the most basic evaluations of success. Incongruously, the single
most cited problem with evaluating Directgov was access to information:
There are a number of facets in that question. The first one is do we evaluate? Yes. What
do we evaluate? That is often a grey area, you turn around and say ‘Well, okay, if you
evaluate, how can you check a benchmark that you started with, and therefore, do you
have the management information that started the programme off to then come through?
And, do you have the right attributes to measure in terms of the evaluation at the end of
it?’ Often that is difficult in government in terms of, it starts in one department, you
might have an organisational machinery of government change, it comes to another
department and many people will turn around and say ‘Actually how do we do that
evaluation?’, so evaluations are done. I think we often lack the hard-nosed metrics that go
behind to what benefits have actually been delivered in terms of those, and it does depend
upon; in my personal view, it depends upon the landscape in which you are operating…
Participant 1
It’s very difficult, someone needs to set up – some foundation – needs to set up a weekly
or something to – yes, just to collate – a central repository of – I’m just going to write that
150
down now, we think – we need an institutional memory… so quite a lot of big – quite a
lot, are quite big projects, never even get written about in the newspapers. That’s the
whole problem.
Participant 2
Because even in government, I work in government, even in my own department trying to
get information is very difficult and no-one wants to share information…
Participant 3
When you say organisation, I mean within Directgov we do do that feedback. I think it is
more about how do we make the government learn and understand how important it is to
actually measure some of these things, you know. Because a lot of government
departments don’t measure or have the baseline data to then be able to evaluate, so part of
our role is making them understand you truly do need to track some of these things…
that’s a tricky one. No, I don’t think anybody really has tried to. In government it is a
constant battle to get people to accept that actually, well, it does cost to drive some of the
service improvements, but to measure it in that way, I don’t think we have done very well
there.
Participant 4
The big, big problem Directgov has is that the, it’s impossible for us to measure benefits,
because we don’t own the transactions, so all the savings are being made by the
government departments. They’re very, very reluctant to share with us what those
benefits are and what those savings are, because then if we quote them and Treasury
come along and say ‘Right, fine, thank you, we’ll have that money,’ and it’s already been
sort of counted in their own… Yes, yes. So, but again, if you asked me now did you
achieve those savings? I could say I don’t know, because again, although we could, you
know, because at the outset we tried to build the baseline to say what does it cost you to
run your website and it’s impossible to get – it was then – it was impossible to get the
answers. So work has been done now, because there is the annual report, you know, that’s
published on the cost of our government website so those too bizarre, now have been
flushed out… So, it becomes impossible to know, to calculate, so what is the net benefit
of that digital transaction. It’s all very, very much estimated… Yes, it’s one of the things
that I don’t think government may have been particularly good at is with sort of benefits
realisation. Yes we’ve… write business cases so these are the benefits we’re going to
realise, but to go back and evaluate how successful has that been – it tends to still be
based very, very much on customers, so, you know, customer research, customer surveys
and so on, because, to be honest, we just don’t have the mechanisms and the accounting
systems…
Participant 6
4.3.5.1.2 Key Performance Indicators (KPIs) for Evaluation
In the absence of information flow from the government departments that benefited from Directgov
services, participants advised that they had created their own Key Performance Indicators (KPIs) to try
and evaluate their project.
151
Well, I mean Directgov evaluates itself against our own KPIs, the difficulty that we have
is that, going back to our original business case based on channelship, is departmental
channelship, but the department own that data. So, it is difficult for us in Directgov to do
a proper evaluation of the extent to which we have achieved the channelship, but we have
done that to some extent ourselves based on the data that we can get. And of course there
are learning opportunities, but the learning really is how difficult it is to get the data!
Participant 3
So again, the KPIs that we put in place around 2007, it was still very much around
visitors, it was also, it has included some measures around customer satisfaction – both of
citizens and of stakeholders – but one, but the key thing that we’ve never been able to do
– [colleague’s name] will also tell you departments themselves can’t do – is measure
through how many people go through a transaction from start to finish; how many people
drop out along the way and even in some cases they can’t even tell you how many people
bought their – and I can’t, you know… but I can’t say that – you know, online, as
opposed to in person. They know they sell ten million of these things a month but they
don’t know, but they can’t say, you know, five million were there and five million were
there.
Participant 6
4.3.5.1.3 The Knowing–Doing Gap
The ‘knowing-doing gap’ problem was cited by one participant to depict the times where people know
what they should be doing but do something else in any event:
Basically, what people do is, they decide they want something, and then they write a
business case to justify why they want it. That’s why I said most organisations don’t write
business cases that say don’t invest. So, the business case becomes a fraud because it is
what Flyvbjerg says at Oxford, you know, and Kahneman at Princeton talks about. And
then of course we say what we do is we then implement and evaluate, you know, ex-post
we evaluate the investment so we can learn, but no-one does.
Again, it comes down to what Pfeffer and Sutton talk about, ‘the knowing-doing
gap’. We know what we should do, but we just do something else. That’s why the gap is
so large, and that is the kind of stuff I am looking at, at the moment. Now the problem I
face in a way, I think the answer tends to be, people usually say the answer lies in
accountability; you have got to make people accountable, by which they mean threatening
them, yes? Hold them to account. John Thorpe, again, in his information paradox book,
this is in 1998 or something, he talked about activist accountability; by which he means
is, it is not accountability that you enforce on others, it is accountability you take upon
yourself. He says it is not the case that the buck stops here, the buck starts here, there
needs to be a change in the way that people approach the way they work.
Participant 3
So again, it’s only when you start explaining to people and start to use metrics to prove
what you’re saying that the penny suddenly drops, there’s ‘Oh!’. You just wonder how
many ‘oh’s is it going to take before, you know, before departments start doing
something about it, which again is why there, you know, why there is the Martha Lane
Fox, why there is the government digital service there. It is very, very big services as
152
they’ve designed it… working with departments on the developments, so it’s just
pointing out the obvious really, that’s what we’re doing.
Participant 6
4.3.5.1.4 Return on Investment (ROI)
Despite the absence of specific metrics in evaluating Directgov, some crude efforts were made to
measure return on investment (ROI):
The trouble is, you know, most of the time in projects and programmes and the way the
business case is written, it is written as absolute certainty. Because, no-one gets
promoted, no-one gets money for projects if they say ‘We don’t know,’ right? They get
the money by saying ‘We guarantee, trust me, I am the expert,’ and we play down the
risk, and therefore we don’t learn. This is because we don’t accept ignorance, we don’t
accept uncertainty and yet that’s the world we live in. The world is we are ignorant, the
world is we don’t know. We believe that we live in a linear world where you decide
where to invest, you make your investment, you deploy it, you reap the benefits, you
learn and then you go round and round but that is not the world we live in… It is worth
having a look at, NAO did a study last year called ‘Helping Government Learn’. It is on
the web, and it is really good. What it says of course is, if you look at a lot of examples
where people have tried to learn, what they have done, they have captured stuff and they
have put it into one of these knowledge management repositories online, but no-one ever
looks at it. It is good to capture the stuff, but how do you get people to use it, you know?
Participant 3
And what we kind of got to is that we kind of kept slicing away at the model and we said
that when you hit about 33 percent of customers successfully completing, you get to zero
on your benefits realisation, so you actually make no… you realise no benefit. And your
costs have gone up, so this kind of this trailing wheel, as this goes down, this kind of gets
bigger so you will have had, you know, with 80 percent you might have 5 percent cost
with… when you’re at 33 percent you might have an extra 80 percent cost over here.
Participant 5
4.3.5.1.5 Independent Case Studies
There were some independent case studies carried out on the Directgov website:
Yes, yes, yes, we’ve got various case studies that we’ve done. Up until now they’ve all
been anonymised. I think we should go one step further and start naming, because, you
know, because if we were saying across government, you know ‘this is what’s going
wrong and these are the services that are happening, go and speak to them’. It’s not a
blame thing, that’s what we’ve got to get away from, saying okay, you know, and again, I
think you used it in the outset – IT failures, you know, I mean – You’ve got to get away
from that, yes there have been, but they are normally around actual IT system failures but
that tends to reach across to absolutely everything, because, you know, and so to, so I
think it is very, very much being able to show departments that, you know, or any service
provider that going through that service, getting it right properly, this is the outcome, it
will get there. If you’re saying it’s seriously to save money, why wouldn’t you want to do
153
it this way? It’s not us coming in interfering, you know, if you think you know it all and
you know better that’s fine.
Participant 6
However, in the absence of a cross-departmental management structure, channelling the outcomes of
such studies can be no more than informal and ad hoc, as some participants had reported it:
Because, in terms of service transformation, the two mega-sites are Directgov and
Business Link. Now, with Business Link, I know there has been an independent
evaluation, and I think it is on the web. If it is not on the web, I should be able to get a
copy. The interesting thing about Business Link is they have outsourced the evaluation on
impact, and the provider SERCO actually provides the evaluation of effectiveness as
well. So, you have got that kind of, you know, when I first heard that, I was like wow, is
that not a conflict of interest?... I mean, I have to say, personally, I was more taken by
Business Link’s approach to impact measurement than Directgov, which kind of seems
strange, because for Business Link, as I said, most of the work was being done by the
supplier, not by the Department. But the Directgov guys were very secretive. Every time I
had a meeting it was kind of like, ‘Why are you asking this?’ and it was very strange.
Participant 3
Independent case studies can be valuable from a user perspective, but the information systems deficit,
already identified in sub-theme D1.1 above, restricted the efficacy of any independent report.
4.3.5.1.6 Customer Surveys – Comments and Evaluations
Collecting customer information to be parsed and analysed as part of a formal evaluation system only
featured in what could be described as elementary at best, as it is evident in the following dialogue
from the in-depth interview excerpt with Participant 5 and other participants’ responses:
Absolutely. I mean we had… we have ‘comment on this article’, so every article on
Directgov allows a user to rate the article as to how useful the information was, and
allows them to provide a sort of comment and we get 40,000 ratings a week and 10,000
comments a week. I think it’s a week. It might be a month. I need to check that… And a
lot of the feedback we get, it’s because the article stays open when a transaction is opened
in a new window. Somebody’s had a very bad experience of a service, you can tell that
they’ve come off that service and they’ve gone straight into the comment box and they’ve
gone, you know, rage, rage, rage, anger, anger, lots of capital letters, lots of punctuation
marks, and you can see it. You can see how frustrated they are. So it’s a slow process to
change services based on that but, you know, for that volume of comment time and time
again is hard to ignore no matter where you are, so it is about using that and making… I
think what we need to do in the future is make that more transparent… To fully open
everything up. And it will come. It took quite a significant amount of time to actually get
every department to agree to actually allow people to put comments in, let alone put them
in and have them published… On the whole, the ratings are very positive. So it’s about
64 percent positive ratings, which, considering a lot of what we’re talking about is,
a) incredibly boring and, b) you know, sometimes quite complicated and not necessarily
popular…
154
[Interviewer]: And how do you analyse all of this qualitative data?
As best we can. Erm…
[Interviewer]: Do you use software? Do you use a human intervention or…
It’s predominantly the rating stuff at the moment is all done manually… because we
didn’t anticipate the significant volume that we get, so we are putting in place tools to
look at it from an automated perspective. We have a number of… we have a special piece
of software that scans through for specific words like a bomb and… So we can find very
quickly things that are overtly dangerous or personal or whatever it is and we do that but
the rest of it is just, you know, we go through it fairly quickly but we actually… it’s
departmental content. It’s departmental information. It’s not ours… We’re kind of there
in as far as data protection, data commissioners, we are a place where people talk to
government, but we actually don’t have a role almost in our right to be… to act on that.
Participant 5
So it’s an interesting mechanism, and this government in particular, the new coalition
government is claiming that they are listening to people because they have lots of
consultations, and they use the Directgov portal to launch consultations and cross
consultations with… and… have seen Nick Clegg also going around and talking to
people, and that’s fine, that’s a consultation exercise; what comes after the consultation,
and I was saying… consultation and satisfaction…
Participant 15
Despite Directgov being a transactional website, there seems that there were no formal mechanisms in
place to record transactional information for evaluation purposes:
Yes. So Directgov, I think it’s customer expectation, and I think it’s also trends in the
web, the way content is consumed and syndicated and shared means that actually traffic is
no longer quite such a driver in terms of objectives as it was. Actually, what you need to
be measuring is far more what action people took based on that – much, much harder to
measure. Traffic is very easy to measure. It’s very easy to measure incorrectly, but it’s
very easy to measure… so it’s actually how… what were the outcomes of that? So in
terms of transactions, one of the things we want to put into place is not what we have
now, which is how many people got to the front door? How many people started a
service? But actually, how many people successfully completed it So, yes, understanding
where people… so that’s one of our biggest sort of success measures going forward and
objectives is actually getting to a certain percent of successful completion without
recourse to… which is where the model stuff comes in, without recourse to any other
channel. So it’s how many people complete a transaction. That can be completed fully
online because there are lots of government services that can be completed fully online,
like a passport. You have to, you know, you cannot benefit.
You have to have some kind of means testing. People have to go and check. You
have to come back.
And that’s… yes, and how high up can you get? So, you know, industry standards
are at about eighty… you know, services are designed to work at about 80 to 85 percent
successful completion; so should government services. In an ideal world.
Participant 5
155
4.3.5.1.7 Confirmation Bias
In the absence of a formal cross-departmental information flow and the requisite management
structure to act on the information received, evaluations are ad hoc and subjective, with variable and
sometimes arbitrary KPIs, consistent with confirmation bias:
The problem with evaluation is, you know, you are supposed to use customer satisfaction
and impact measurement as a means of insight, design the services; you are not supposed
to do it just to prove what a good investment it was, because if you go looking for
evidence you will find it (confirmation bias), that is the problem. What we do with Tell
Us Once, I mean it is an example of e-government, but this is the problem I had with
e-government; they were coming very much from an e-government perspective, but this
is no longer the agenda in the UK. This is not about e-government, it is about services
which can be enabled by e-government; e-government is part of the offering.
Yes, it is only by finding what is not working that you actually get improvement. If
we go looking for evidence that people love Tell Us Once, we will find them, and anyone
who doesn’t like it we will ignore, because that’s what you do. You get a piece of
evidence, oh he is an idiot, doesn’t know what he is talking about, and you get someone
that likes it and they know what they are talking about! So, what we are doing with Tell
Us Once is engaging local authorities and asking them to use the measures that make
sense to them.
Participant 3
Other methods of evaluation included: customer testing, measuring traffic and outsourced evaluations.
Customer testing was limited to observing customers navigating and using the system. Measuring
traffic was defined as counting visitors (30 million each year at the time the interviews taking place).
However, there was no reference to how many visitors were already visiting the departmental websites
before the Directgov project, or having mechanisms in place to record visitor behaviours:
Now, the customer/citizen-centricity issue in these evaluations is a good one. If the
franchise directors had a free hand, it would be customer-centric. But, the franchise
directors, and some of them are based in departments where they don’t get the freedom.
Or, they don’t get the drive from the business to be customer-centric, so they come with
the business needs which are not customer-centric necessarily. So it’s down again to the
politics of the organisation and they bring with them the politics of the organisation,
whereas, I know as individuals they really care about customers. So there’s compromise,
there’s always a compromise solution, and it’s not always perfect for customers.
Participant 22
There was evidence of some outsourced evaluations, usually for financial good governance:
Presumably, from NAO reports and FoI requests. You know, we don’t publicise, people
don’t generally publicise, I mean that for me is where transparency lies. You know, for
every project over a million, it has to have a short report on the web that says: this is what
we are doing, this is when it is going to be delivered, this is how much it is going to cost,
this is the person responsible and here are the benefits in quantifiable terms. And then,
there has to be an independent, it has to be an independent evaluation afterwards saying
156
how much did it cost, when was it delivered, what were the benefits, and whenever there
is a variance; this is not to say that is bad, it is just to say okay, so what have we learnt?
Participant 3
4.3.5.1.8 Evaluation of Transforming Government Initiatives
On the issue of evaluating the transformation of government initiatives in general, Participant 15 for
instance commented as follows:
e-Government could proceed in different fronts, should proceed in different fronts. Of
course you have to look at somehow a return investment, you have to look at how your
plans to transform government to make it more efficient have been achieved, that is one
part of the evaluation. So you also have to look at all this generation of restructures if
they are providing some value. I’m sure there won’t be a different notion of value here,
but some kind of process establishing maybe, yes… the cost of transactions is one of
those, the other one is the achievement of its economy, it’s off the scale, that could be one
part.
Participant 15
4.3.5.2 D1 – Summary
Given the lack of leadership at the strategic level planning stage of the Directgov project and its
consequences for implementing the project, it is hardly surprising that the processes for evaluating the
success or otherwise of the Directgov implementation failed. In the absence of the structural
architecture, namely cross-departmental authority and cooperation, there was no possibility of having
the measuring capacity to conduct even the most basic evaluations of success. Incidentally, the single
most cited problem with evaluating Directgov was access to information. Participants advised that
they had created their own Key Performance Indicators (KPIs) to try and evaluate their project.
Government bodies were adept at producing reports and identifying gaps in the project’s ability to
deliver, but there was little evidence of these reports being converted into actions. This phenomenon
of knowing what to do but not doing it, was expressed by one key informant as the “knowing-doing
gap”. Despite the absence of specific metrics in evaluating Directgov, some crude efforts were made
to measure return on investment (ROI). There were some independent case studies carried out on the
Directgov website. However, in the absence of a cross-departmental management structure,
channelling the outcomes of such studies can be no more than informal, and ad hoc. Independent case
studies can be valuable from a user perspective but the information systems deficit already identified
(D1.1), restricts the efficacy of any independent report. Collecting customer information to be parsed
and analysed as part of a formal evaluation system only featured in what could be described as an
elementary capacity. Despite Directgov being a transactional website, there were not many
mechanisms in place to record transactional information for evaluation purposes. In the absence of a
formal cross-departmental information flow and the requisite management structure to act on the
information received, evaluations were ad hoc, subjective with inconsistent and sometimes
inappropriate KPIs often used, which were occasionally consistent with confirmation bias.
157
4.3.5.3 D2 – Attitudinal Changes
This category contained data relevant to the extent to which research participants believed that
attitudes across government departments had changed over the life of the project. Their responses
were coded to three broad areas and are set out in Table 4.7 below:
Table 4.7: Attitudinal Changes
Attitudinal Changes
General Acceptance that Future Trends will be towards more e-Government Technologies
Slow Change – Traditional Approaches – Slower Behavioural Change
General Acceptance of Need to Exist
4.3.5.3.1 General Acceptance that Future Trends will be towards more e-Government
Technologies
Participants believed that there was now a more general acceptance that new technologies and those
underpinning Directgov were going to continue to develop:
And I think that’s probably the realisation that we have to move that way. That we just
now quite simply cannot afford to deliver things in the old way that we did, or to pay as
much attention, we have to kind of modernise and I think just, you know, probably just
watching… I don’t know whether everyone does it but I certainly sort of sat and watched
the way that social media has changed the world in things like in Egypt and in other
countries where, you know, incredible changes against the government were managed
through a very, very simple interface and really showed the power of what the public can
do if they are motivated to do so. I think, you know, it has lessons for us all just in terms
of, you know, it’s not quite the same here but, you know, if we decided to stop doing
something in a particular way, it’s fairly obvious. You can see how people would
instantly react and how they would, you know, sort of gather momentum around a
particular objective.
Participant 5
Yes. It’s interesting because it’s like Directgov has come to the end of a life-cycle so it’s
probably a bit unfair so I’m not going to answer that directly. So, when Directgov first
launched there was a lot of hostility against it, it was seen as a take-over bid. After the
first – and indeed the amount of funding we had for the first few years reduced year on
year. But then, I think the attitude did change and people have seen the value of
Directgov and website convergence.
Participant 6
There are huge, huge challenges. Well, challenges in social media in particular. I think
that social media is an individual-oriented technology, it’s about people, and now we
have government agencies trying to figure out how to be ‘people’ and how to be a
member of a network that is primarily for individuals and their organisations. So how do
government agencies enter into, and agreeing to the terms and conditions for Facebook?
158
A government agency has no authority; an individual acting within that agency has no
authority either to enter into an agreement on behalf of their agency.
Participant 20
4.3.5.3.2 Slow Change – Traditional Approaches – Slower Behavioural Change
However, there were still a significant number of people who would not move over to digital services,
at least at the point of delivery:
You know? And we see it right now. We see people who deliberately choose not to
access services online. People deliberately chose to fill in their census on paper, to be
inconvenient. They deliberately choose to tax their car in the Post Office because they
believe they will save the local Post Office that way. The problem is that most local Post
Offices don’t actually do car tax discs any more and so they’re not saving their local one
because it isn’t in there.
Participant 5
Gosh, well it’s difficult because, you know, I think it’s a generational thing – there are a
lot of people who are just not interested in mobile phones, smartphones, they don’t want
to… there, they don’t want it happening, you know. Don’t want to engage with it so I
think certainly for the government dealing with a wide range of people in [unclear] there
needs to be an acknowledgement that some of the old-style face-to-face… systems are
going to have to be kept, you know what I mean, if people who are not interested in
engaging in all of this high-tech stuff are not going to be completely left out.
Participant 14
4.3.5.3.3 General Acceptance of Need to Exist
Participants believed that there was now a belief system in place in government departments that
Directgov is here to stay:
Well you know, in government where we started out, I think most people hoped it would
go away. So, I think the big change is everybody now in government, they all realise that
there is a demand for something like Directgov, clearly with 30 million people visiting it
a month. I mean my view is, that the basic proposition was always right, people want to
know if I go to a certain place or brand that is the trusted official source of information.
That’s why I believe it has been successful. That is the fundamental reason, and it has
been successful against the odds.
Participant 4
…the new… executive director – went round and saw key stakeholders before the
ministerial committee meeting and we were very, very surprised the way – at the amount
of support there was – because we expected more departments to say ‘no, no, no’ which
is what would have happened years ago. And even when he went to the ministerial
committee meeting, again it was surprisingly yes, so, I think, yes, so it’s again, there has
been a change across government definitely. Going almost from no to yes over seven
years.
Participant 6
159
4.3.5.4 D2 – Summary
Participants believed that there was now a more general acceptance that technologies such as
Directgov were going to continue to develop. However, there was still a significant number of people
who would not move over to digital services at least at the point of delivery. Participants further
postulated that there was now a belief system in place in government departments that Directgov
needed to exist.
4.3.5.5 D3 – Ameliorating the Digital Divide
This category contained data relevant to participants’ beliefs as to how to address the problem of the
‘digital divide’ in advancing e-government services such as Directgov. The dialogue was coded and
the sub-categories are listed in Table 4.8 below:
Table 4.8: Ameliorating the Digital Divide
Ameliorating the Digital Divide
Different Channels but One Back End System
Designing the Transaction to be Inclusive
Educational Approaches
Age as a Digital Divide
Time will Ameliorate
Moving from Textual to Video Based Communication
Addressing Social Exclusion
4.3.5.5.1 Different Channels but One Back End System
Participants believed that for at least another generation, there would still be a significant cohort of
customers who for a variety of reasons will not be able to use web-based services exclusively. Wider
social issues such as literacy, inability to use technology and access to technology, are examples of
such social exclusion problems which would act as a barrier to fully digitising services. However,
participants believed, by using different channels such as libraries and Post Offices, customers could
use intermediaries to access a common back-end system which would still facilitate a high degree of
automation from the point of deliver on:
Are hugely restricted in terms of digital access. So I would go back to my point about the
Post Office and DVLA. You know? It’s about a digital service into government rather
than a digital service consumed by an individual… But if you’re sitting there filling out a
90-page benefits form, somebody can’t buy their stamps so how do you balance that
whole… that whole process? And that’s something that we’re working with the Post
Office on and with a whole range of government departments about, how do you move
160
your face-to-face service to being a digital delivery point rather than a… just a back-
office system? But it’s, you know, where we need to get to is that the same services being
used by all of the delivery channels. So it’s one back end system; not three or four, which
is what we’ll probably have at the moment in a lot of cases.
Participant 5
Yes, again, it’s no good having services online if people can’t access them because they
don’t have the Internet, they don’t want to have the Internet, they can’t afford the Internet
or whatever. So again, there is a programme we place around digital, working with Post
Offices and other departments to make those services available or accessible.
Participant 6
Our partnership strategies are largely around the digital divide in terms of trying to help
people using intermediaries so we work with the Citizens Advice Bureau (CAB) and we
work with various other people to try and get our services out to people through other
people (via a proxy in a way). We sort of partner with people to help that and we will
continue to do more of that so our partnerships will grow. The aim is to have people
finding their applications wherever they are by using different devices etc.
Participant 21
4.3.5.5.2 Designing the Transaction to be Inclusive
The Directgov portal had video-based information services which increased reach beyond those who
have the capacity to operate in a purely text-based environment:
The other one you have got to be very careful about is not always biasing it towards the
elderly or the rurally disadvantaged. There are thematics and there are sectors, so there
are themes, which are; there’s the elderly, there’s the disabled etc. There are also
environments such as the unemployed, the rural environment etc. There is also the young
and we shouldn’t forget that actually at the moment, the Internet is text-based, so if you
are illiterate or semi-illiterate, or find it difficult to get involved, you are unlikely to
appreciate a text-based environment that you go into. Now, the great thing about that is,
where YouTube comes into play because it is video-based. Therefore, when you go into
gaming, videos, you can pull people in there and you can start issuing, sorry, not issuing,
but enticing people who would otherwise, young kids and the young teenagers, who have
gone through a process of maybe not getting the educational progress that they deserve,
or taken advantage of. They then can be enticed in by a different type of experience,
which will then allow them to learn the language, which will then get them in a position
where they start to assimilate a textual-based environment.
Participant 1
So, that is the next big step, because so far, most departments have not thought about the
use of design in the transaction early enough in that design. And Directgov now, will play
a big role in helping early on to inform the design, so that what is then built and goes live
is going to be able to be used by novices.
Participant 4
161
Other approaches included education, age and specific solutions, which will decrease in necessity over
time, and addressing wider social exclusion issues:
And I think, to be honest, for some people, they never will. You know? They’re just
actively choosing. It’s not quite caught up with them, but some will choose not to do that.
Again, a good chunk of the Martha Lane Fox review sort of looks at this too, and there’s
a very active programme to get people engaged and to do lots of peer group handholding.
It’s not that this has never been done before, but I think the emphasis has hugely changed
and there are new ideas coming out on top of the old ones. So that’s important.
Participant 11
4.3.5.6 D3 – Summary
Participants believed that for at least another generation, there would still be a significant cohort of
customers who for a variety of reasons, will not be able to use web-based services exclusively. Wider
social issues such as literacy, inability to use technology and access to technology, are examples of
such social exclusion problems, which would act as a barrier to digitising services. However,
participants believed, by using different channels such as libraries and Post Offices, customers could
use intermediaries to access a common back-end system which would still facilitate a high degree of
automation from the point of delivery. Other approaches included education, age-specific solutions
which will decrease in necessity over time, and addressing wider social exclusion issues.
4.3.5.7 D4 – Vision of the Feature
This category contained data relevant to research participants’ vision for the future of e-government
projects such as Directgov. Responses were coded to sub-categories as set out in Table 4.9 below:
Table 4.9: Vision of the Future
Vision of the Feature
Greater System Integration
Greater Services Integration
Improving the Transaction – Customer Experience
Public Private Partnerships
Syndicating Content
Deploying Social Networking
Well Designed Common Platform – Infrastructure to Build on
162
4.3.5.7.1 Greater System Integration
Participants believed that greater systems integration is desirable and inevitable. However, it would
require a greater degree of cross-departmental planning and management to achieve systems
integration commensurate with aligning common processes:
Now they are still embedded in what we are doing, but we have moved on now to start
thinking about how do we build a common infrastructure environment, so it’s like, and I
have been explaining it recently: ‘Network services should be like a utility, you know.’
You don’t go into a building and turn around and say: ‘Excuse me, I have to worry about
whether I get 230 volts and 13 amps out of a plug in a wall.’ But, you do go in and say:
‘Well, excuse me, I don’t know if I can connect to various things, by plugging into an
RJ45 cable coming out of the wall if I have a laptop or a desktop.’ So, we have been
pushing very much on the Public Services Network (PSN) around the fact that actually,
we should be building this very large network environment, not a single network per se,
but a capability.
An analogy would be the electrical utility business. You can buy electricity in
London from Scottish Power; you can transition from Scottish Power to EDF at a low
transition cost, so therefore, you should be able to take telecommunications wrapped
around by a security layer in the same sort of fashion for 600,000 people in central
government. In fact, there are 5 million people working in the public sector as a whole
and making a utility is what we are after… The department can design what they like to
run; a benefits system, a passport system, a tax system, a vehicle licensing system over
the top of that, but that is actually the direction of travel. Very standardised, utility-based
common infrastructure components. It’s not easy to build and it doesn’t happen
overnight, but that is the direction of travel.
Participant 1
I think the problem is, and I am being very honest here, is now the next big step having
set up Directgov as a destination site, got the brand fairly well known, how do we
improve the transactions? Those are down to departmental investment cases, to make
those improvements, working with Directgov, and that’s the next big challenge… We
need a much more simple way, token or something, using a private sector credential
where you can log on to your government services, that’s the aim. And Directgov has
been incubating that idea for quite a while now, but we haven’t had the support across
government to make that happen.
Participant 4
4.3.5.7.2 Greater Services Integration
Participants did not underestimate the scale of the task of integrating services but nonetheless,
recognised that from the public’s perspective, it would be a desirable vision for the future and the
technology could play a key role in accomplishing it:
163
…because at one time, you know, the strapline for Directgov was, you know, ‘public
services all in one place’, because we do a terrific amount of customer research and that
was what people were wanting at the time, they didn’t, you know, the whole thing was
about joining up, people not caring which department do the services or wherever…
Participant 6
And how do you use government providers to do that? So how do you change, you know,
what’s the role of the Post Office? What’s the role of UK online centres? The role of local
authority, face-to-face delivery, the role of a whole range, you know, of intermediaries
who are specialists in particular areas. So, Citizens’ Advice, Age UK, Mumsnet. How do
you use other sources of interaction to provide a service and how do you work?…
Participant 5
Other ideas for the future of e-government services included improving the transaction/customer
experience, syndicating content, deploying social networking technologies, using public/private
partnerships and designing and building a common architecture/platform across government
departments, to underpin future systems and facilitate greater integration into the future:
…because, you know, if the citizens start to see Directgov as being old fashioned, the
content being available elsewhere, they’re going to go elsewhere and particularly now,
you know, the amount of users that there are there, one of the main things we’re doing
now is to try and meet that need is sort of syndicating content out, delivering services by,
you know, via partners…
Participant 6
4.3.5.7.3 Improving Organisational Learning
Participants reported on a variety of feedback mechanisms across departments to ensure organisational
learning:
If it’s some problem in a particular area of the site, then that will be an instant feed-out to
say, ooh, actually, people aren’t understanding that piece of content you’ve got over
there. If it’s feedback about a transaction, it will take longer to sort out because it may be
subject to a technical development cycle or whatever. It might have been obviously fed
out quickly, but it may not happen quite as quickly. So the publishing board and the
governance side on that score, is how you bind together the 20-ish departments of
government and all of the many sub-units of government including Non-Departmental
Public Bodies (NDPBs) and other arm’s length bodies. All stemming from the ‘citizen
says this’...
Participant 11
Well in our present governance, I mean again all of this is subject to change; in our
present governance, we have an operational board so you have franchise directors that
come to that, they will discuss key challenge issues that need to be taken and made. So
for instance, let’s take a comment on this article (COTA), when there were some key
areas there to look at and refresh, they will debate that and everything; they will see
opportunities where they can change things directly if it’s across the board, so things like
164
search, things like taxonomy, then that has to be agreed as a group so you’ve got multiple
layers there. There are also editorial meetings, project manager meetings, so different
parts of different levels of all these organisations do come together regularly to discuss
any challenges, issues, how to amend things, refresh them and also to plan ahead.
Participant 12
In terms of internal processes, we certainly get tested by our departmental stakeholders
because they will tell us if these internal processes are not working. So we got internal
process business change people, which is a very small team but they look at processes
that they need improving or they look at the capability model for Directgov and do what
it needs to be done. Obviously you pick them up when they go wrong or when they’re not
working as well as you can or when you think that things are being inefficient.
Participant 21
4.3.5.8 D4 – Summary
Participants believed that greater systems integration is desirable and inevitable. However, it would
require a greater degree of cross-departmental planning and management to achieve systems
integration commensurate with aligning common processes. Participants did not underestimate the
scale of the task of integrating services but nevertheless recognised that from the public’s perspective
it would be a desirable vision for the future and the technology could play a key role in enabling it.
4.4 Case Study 2 – ROS
4.4.1 Case Background
One of the most successful Irish e-government initiatives is the Revenue Online Service (ROS)17
project. The Revenue Commissioners in Ireland initiated ROS in 1998 and launched it in 2000, in
order to facilitate the provision of online tax services. The Revenue Commissioners, most commonly
referred to as ‘Revenue’, is the government body that collects taxes, equivalent to Her Majesty’s
Revenue and Customs (HRMC) in the UK. The computerisation of taxation around the world, even
before the advent of e-government, was high, since “…it is much easier to persuade governments in
general and Treasuries/Ministries of Finance in particular to part with taxpayers’ funds for investing in
ways to collect money…” as Connolly & Bannister (2009, p. 3) put it.
The history of computerisation in the Irish public sector, and in particular of the Revenue
(Commissioners), is certainly interesting. Bannister (2001b) found that for the period from 1969 until
2000, there was only a handful of in-depth studies and very little academic research with regard to
computerisation in government in Ireland, highlighting the relatively insignificant perceived role of IT
in the Irish public sector. Despite the sparse literature that could be found, however, the
computerisation of the Irish Civil Service even as early as 1969 was quite impressive (Devlin, 1969
cited in Bannister 2001). The Revenue, of all government departments in Ireland, was always in the
17 Revenue Online Service: www.ros.ie
165
forefront of IT developments in the Irish public sector, developing, implementing and using cutting-
edge technology. Bannister (2001b) submits that is likely to be different because it is a revenue
collecting, income-generating, rather than a spending department, and thus, is seen as a special case by
the State.18
Timonen & O’Donnell (2003) concur that the ‘best practice’ examples of online service
transactions developed by governments around the world, are usually found among revenue-collecting
services. Besides, contact with tax authorities is usually mandatory, and takes place at regular intervals
even over a calendar or tax year (OECD, 2008).
Meanwhile, in an attempt to improve public service delivery, the Strategic Management Initiative
(SMI) was launched in 1994 (epractice.eu, 2009), ‘road-mapping’ a process to achieve excellence of
service for the Irish government and the public, and the Delivering Better Government report was
published in 1996 (Department of the Taoiseach, 1996). The latter, along with the Public Service
Modernisation Act 1997, underpinned the modernisation of the Irish Civil Service and paved the way
for the delivery of quality services. As a result, the Quality Customer Service (QCS) initiative was also
launched in 1997 (Department of Public Expenditure & Reform, 1997). The QCS initiative contained
a set of nine principles (expanded to twelve later) for improving customer service in the public sector,
and played a key role to the developments that took place thereafter in the Irish Civil Service. For
example, in its Public Management Review of Ireland in 1998, OECD (2008, p. 230) recommended
that with regard to modernisation, the Irish government should, “reinforce and extend QCS efforts in
the e-government arena”.
During that period and at the dawn of the ‘information age’, the Irish government had become keenly
aware of the need to implement the necessary structures for an information economy and political
system. By recognising the potential of ICTs for transforming the economy and society of Ireland in
the future, an Information Society Committee was established in 1996 (McCaffery, 2007). In 1997, the
First Information Society Commission Report (Information Society Commission, 1997) was published,
and contained a wide range of recommendations to ensure that Ireland was ready to play its full part in
the ‘information age’. A significant recommendation was that, ‘self-service over the Internet should be
introduced by all government departments as a matter of urgency’ (Information Society Commission,
1997; Revenue, 2005). In response to the recommendations made by the Information Society
Commission, the Irish government published a report entitled Implementing the Information Society in
Ireland: An Action Plan (Department of the Taoiseach, 1999). It set out the framework for
implementing its strategy, including areas such as telecommunications infrastructure, legislative and
regulatory measures and ICTs inter alia, in the better delivery of public services. An Information
Society Fund (1999-2005) was also established, with the aim to facilitate progress of the objectives
set, and was available to all government departments. Item 51 in the government’s Information
18 For more information on how the Revenue is viewed by the government, see Value For Money (VFM),
(Report No. 56) issued by the Comptroller and Auditor General (2007).
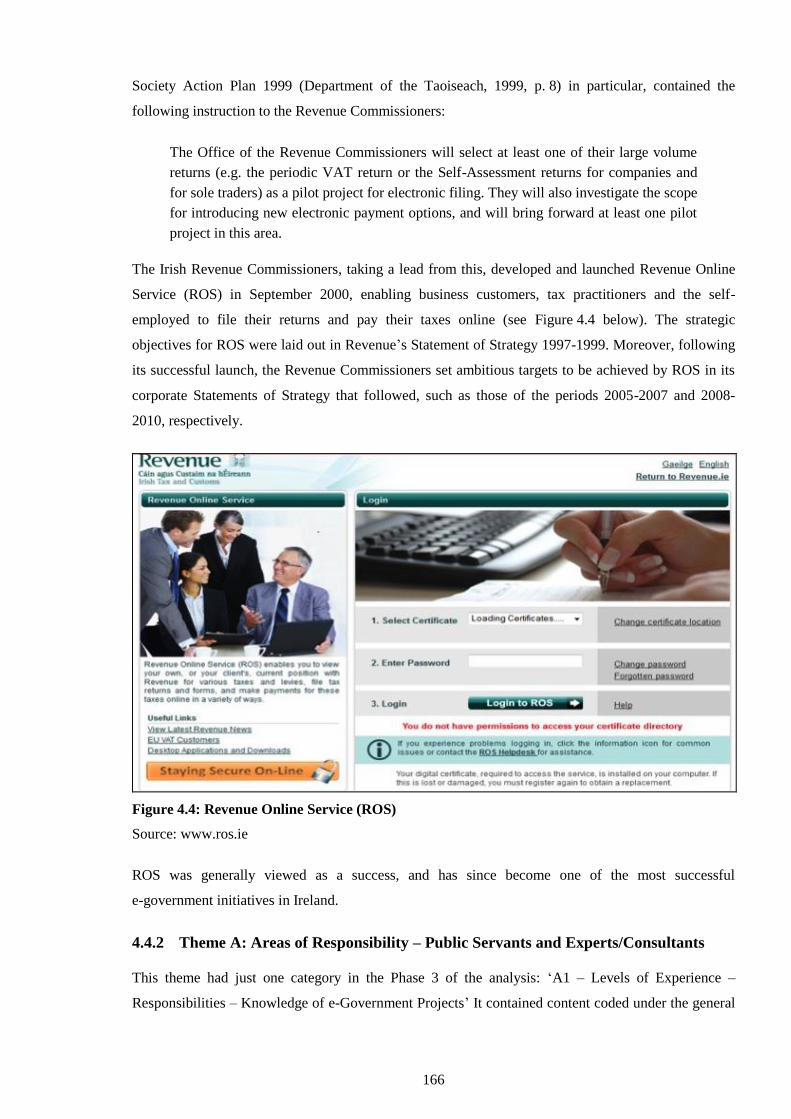
166
Society Action Plan 1999 (Department of the Taoiseach, 1999, p. 8) in particular, contained the
following instruction to the Revenue Commissioners:
The Office of the Revenue Commissioners will select at least one of their large volume
returns (e.g. the periodic VAT return or the Self-Assessment returns for companies and
for sole traders) as a pilot project for electronic filing. They will also investigate the scope
for introducing new electronic payment options, and will bring forward at least one pilot
project in this area.
The Irish Revenue Commissioners, taking a lead from this, developed and launched Revenue Online
Service (ROS) in September 2000, enabling business customers, tax practitioners and the self-
employed to file their returns and pay their taxes online (see Figure 4.4 below). The strategic
objectives for ROS were laid out in Revenue’s Statement of Strategy 1997-1999. Moreover, following
its successful launch, the Revenue Commissioners set ambitious targets to be achieved by ROS in its
corporate Statements of Strategy that followed, such as those of the periods 2005-2007 and 2008-
2010, respectively.
Figure 4.4: Revenue Online Service (ROS)
Source: www.ros.ie
ROS was generally viewed as a success, and has since become one of the most successful
e-government initiatives in Ireland.
4.4.2 Theme A: Areas of Responsibility – Public Servants and Experts/Consultants
This theme had just one category in the Phase 3 of the analysis: ‘A1 – Levels of Experience –
Responsibilities – Knowledge of e-Government Projects’ It contained content coded under the general
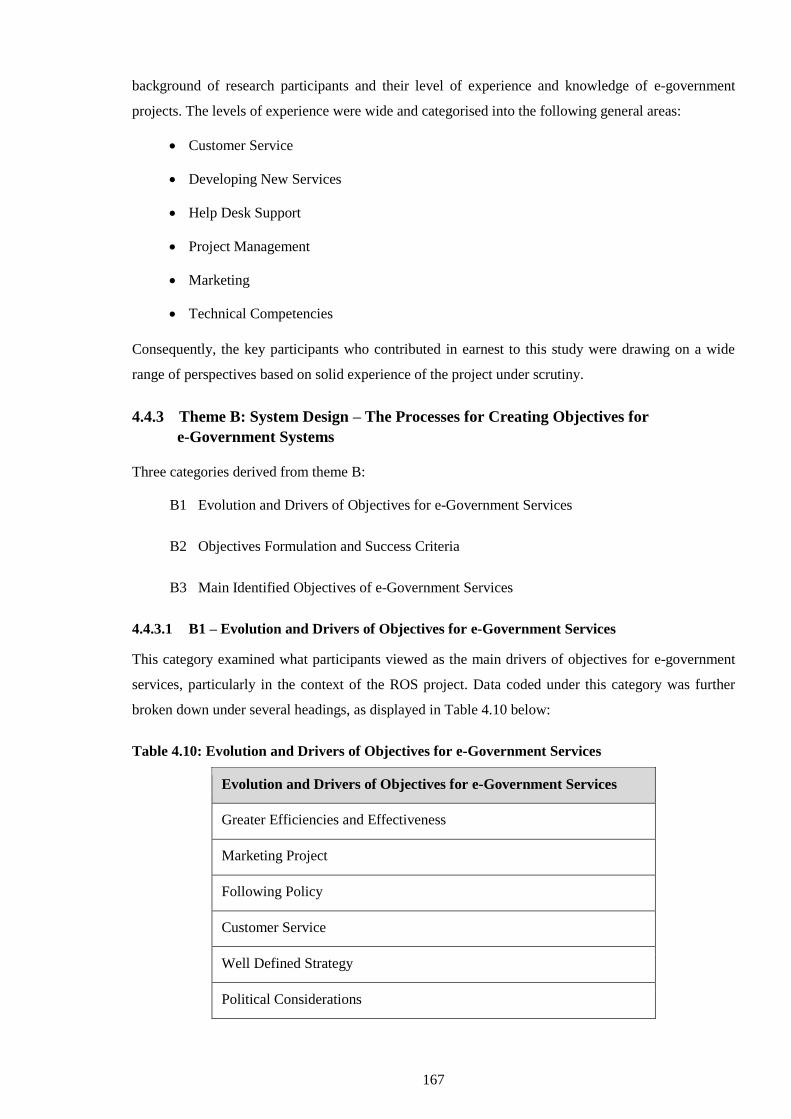
167
background of research participants and their level of experience and knowledge of e-government
projects. The levels of experience were wide and categorised into the following general areas:
Customer Service
Developing New Services
Help Desk Support
Project Management
Marketing
Technical Competencies
Consequently, the key participants who contributed in earnest to this study were drawing on a wide
range of perspectives based on solid experience of the project under scrutiny.
4.4.3 Theme B: System Design – The Processes for Creating Objectives for
e-Government Systems
Three categories derived from theme B:
B1 Evolution and Drivers of Objectives for e-Government Services
B2 Objectives Formulation and Success Criteria
B3 Main Identified Objectives of e-Government Services
4.4.3.1 B1 – Evolution and Drivers of Objectives for e-Government Services
This category examined what participants viewed as the main drivers of objectives for e-government
services, particularly in the context of the ROS project. Data coded under this category was further
broken down under several headings, as displayed in Table 4.10 below:
Table 4.10: Evolution and Drivers of Objectives for e-Government Services
Evolution and Drivers of Objectives for e-Government Services
Greater Efficiencies and Effectiveness
Marketing Project
Following Policy
Customer Service
Well Defined Strategy
Political Considerations
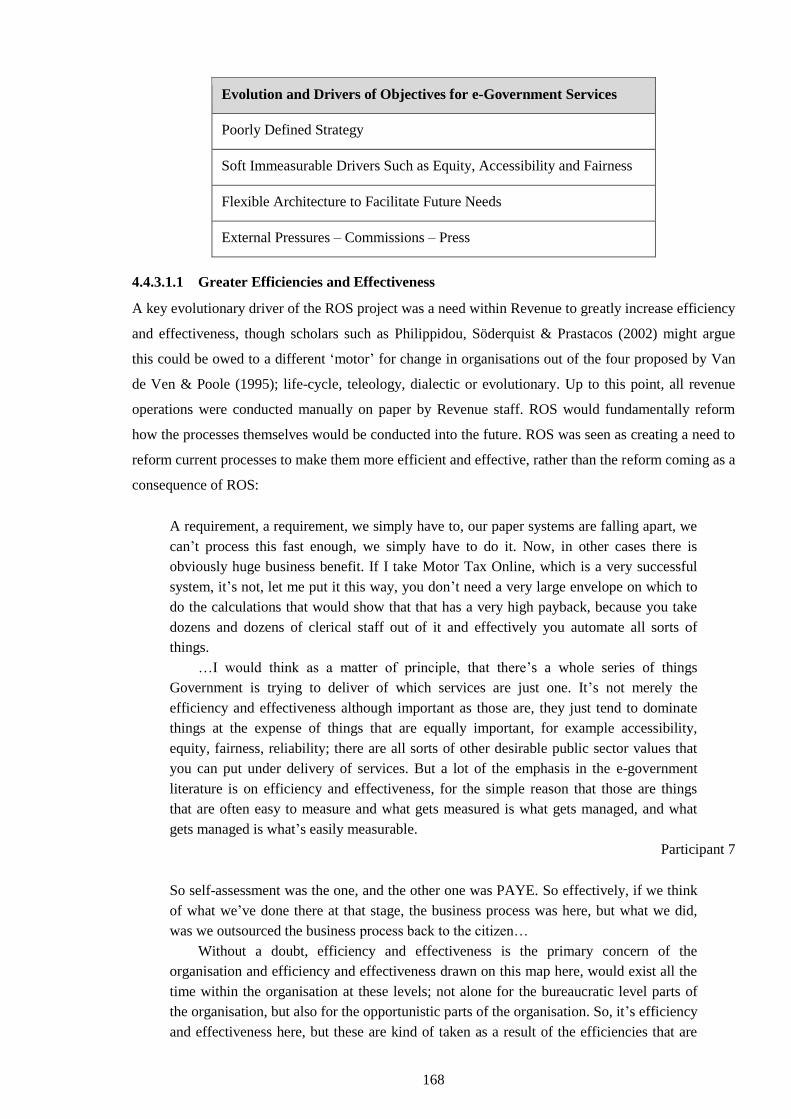
168
Evolution and Drivers of Objectives for e-Government Services
Poorly Defined Strategy
Soft Immeasurable Drivers Such as Equity, Accessibility and Fairness
Flexible Architecture to Facilitate Future Needs
External Pressures – Commissions – Press
4.4.3.1.1 Greater Efficiencies and Effectiveness
A key evolutionary driver of the ROS project was a need within Revenue to greatly increase efficiency
and effectiveness, though scholars such as Philippidou, Söderquist & Prastacos (2002) might argue
this could be owed to a different ‘motor’ for change in organisations out of the four proposed by Van
de Ven & Poole (1995); life-cycle, teleology, dialectic or evolutionary. Up to this point, all revenue
operations were conducted manually on paper by Revenue staff. ROS would fundamentally reform
how the processes themselves would be conducted into the future. ROS was seen as creating a need to
reform current processes to make them more efficient and effective, rather than the reform coming as a
consequence of ROS:
A requirement, a requirement, we simply have to, our paper systems are falling apart, we
can’t process this fast enough, we simply have to do it. Now, in other cases there is
obviously huge business benefit. If I take Motor Tax Online, which is a very successful
system, it’s not, let me put it this way, you don’t need a very large envelope on which to
do the calculations that would show that that has a very high payback, because you take
dozens and dozens of clerical staff out of it and effectively you automate all sorts of
things.
…I would think as a matter of principle, that there’s a whole series of things
Government is trying to deliver of which services are just one. It’s not merely the
efficiency and effectiveness although important as those are, they just tend to dominate
things at the expense of things that are equally important, for example accessibility,
equity, fairness, reliability; there are all sorts of other desirable public sector values that
you can put under delivery of services. But a lot of the emphasis in the e-government
literature is on efficiency and effectiveness, for the simple reason that those are things
that are often easy to measure and what gets measured is what gets managed, and what
gets managed is what’s easily measurable.
Participant 7
So self-assessment was the one, and the other one was PAYE. So effectively, if we think
of what we’ve done there at that stage, the business process was here, but what we did,
was we outsourced the business process back to the citizen…
Without a doubt, efficiency and effectiveness is the primary concern of the
organisation and efficiency and effectiveness drawn on this map here, would exist all the
time within the organisation at these levels; not alone for the bureaucratic level parts of
the organisation, but also for the opportunistic parts of the organisation. So, it’s efficiency
and effectiveness here, but these are kind of taken as a result of the efficiencies that are
169
gleamed at this stage of development. So I suppose, the short answer to the question is
yes, efficiency and effectiveness is of primary concern. Efficiency and effective delivery
of government services and how can this be achieved…
Participant 8
And the customer service angle was that, because we had so many people on customer
services issues we didn’t have enough people on the compliance side. So, the feeling was
that if we could channel customer service through the Internet, it would free up people.
These huge amounts of people who were tied up in customer, you know routine customer
service work, and enable them to go onto other work, more productive work. So it was,
two sides, better customer service and then better quality of work… internally.
Yes, I mean Revenue had its own agenda before the ‘‘“ became sort of a domestic
word almost. …and Revenue basically just escalated their plans very quickly then,
because they were well aware of the advantages that ‘e’ would bring both to the
customers and to Revenue.
Participant 10
4.4.3.1.2 Customer Service
Improving customer service influenced the formulation of objectives for ROS:
Well, in the context of ROS, we were never so much e-government driven, as we were
customer service driven. We had a very significant customer service problem at the time,
with very large volumes of post and telephone calls and that, we were seriously
challenged with and our taxpayer base was escalating. So, we actually sort of approached
it, we have all these problems from a customer service perspective, how can the Internet
help us? How can we make this electronic? So the thinking within Revenue had actually
started a year before the whole ‘big e-government agenda’ started within Ireland.
Participant 10
So for our business customers, yes, the perspective seems to be that efficient and
effective, and that was the goal. There was a customer service dimension; there was a
proof of concept perspective to ROS.
Participant 16
And we’ve learned how to do our business better. And we’ve made use of the information
that we’re getting in and we’ve improved our customer service. I think if people are
objective, if you do a survey among objective companies, they will say that it’s much
easier now to deal with us than it was ten years ago. Even five years ago. It’s all
developed now to online. It also, for us, it releases front-line staff to deal with
compliance, to deal with audit. And to deal with customer service, so they go hand-in-
hand.
Participant 17
4.4.3.1.3 Project Marketing
Marketing ROS both internally and externally was seen as a critical success factor if targets for uptake
were to be met:
170
Yes, one of the things we had to do was do some marketing… so, usually we develop a
system, we just announce it internally, there might be some change in management and so
on, but the, and you train people and they have to use the system with it. Here we had to
do, actually go out and do some marketing and so that was kind of reaching out, and we
had here a couple of containers, mobile classrooms you know and container trucks that
we moved around. Yes, so we could show people how to use the system. We could go to
you know, seminars and so on you know, seminars from the payroll industry and so on,
and talk about the whole thing. We actually did talks, and so on. As well as there was
consultation as well with, you know, it was internal consultation and external
consultation, with accounting and professional representatives… and even our offline
application, initially we provided that on CD. You know CD-ROMs, so they could be
introduced to that service and market it as well, so we could issue this at seminars, load it,
and so on.
Participant 9
We were Apple Mac-compatible right from the start, but we were always chasing rather
than on top of it... chasing the various upgrades… so that was, and all the journalists used
Mac, all right. But, you wanted the journalists to be able to use ROS, okay… Yes; we had
to talk to the journalists when the techie bits weren’t working… and as we developed
services for different sectors, we’d have different experts join that ROS Liaison Group,
and they’re still there, and they are still active and they have to market ROS so they will
have local events promoting it, as well to continue to get the uptake on it. That’s a huge
success… you see the difference; an IT project and we are talking about marketing it by
going out on the road, about selling it, that’s unheard of.
Participant 10
Well, I suppose by going mandatory, the outlook has changed because it was very much,
you know, let’s see how we get on… And we marketed it. So we’ve moved from… if you
wanted a buzz phrase, we’ve moved from marketing to mandatory. Okay? And that’s
exactly what’s happened.
The marketing was good. It obviously wasn’t bringing in the numbers. And we see
no reason… I mean the chairman made a very good speech just before the launch of the
mandatory system to say, look, ‘Why… you know, there’s no reason now in this
sophisticated day, we’ve got broadband, everybody has a computer.’
Participant 18
4.4.3.1.4 Following Policy
The fact that ROS formed part of a wider governmental reform policy assisted champions of ROS to
cut through procedural impediments that sometimes delay expensive projects:
Yes, ministers will give instructions and they will simply say ‘I want this bridge built or
that computer system built or this road put through there or whatever,’ and if the Minister
says it and the Cabinet backs him, it’s very, very hard for any civil servant to stop it…
There are certainly projects, and I have documents somewhere on my desk, which set the
Department of Finance’s Rules for putting a proposal for a project, and there are very
specific sets of guidelines and they will be done that way. There are other projects, which
are just political, economic or other necessities. We simply have to do this, there is no
171
choice; this is mandatory, and once something becomes mandatory, in the world of IT
that’s great, because you don’t have to waste any time justifying it, it has to be done, full
stop.
Participant 7
Well, this was one part of the overall, legal or strategic you know, policy or programme.
And actually, I had a look at a presentation from around about 2003, so I can refresh my
memory of you know, what was happening about ten years ago. And there it comes a
statement of strategy from 1997 to 1999, to encourage electronic filling of returns and
declarations and other electronic information exchange and key… for it and
redevelopments to underpin the effectiveness of our customer service accounting and
compliance programmes. There was also an Information Society Commission at that time
and they recommended that self-service over the Internet should be introduced by all
government departments as a matter of urgency. So that was in the background you
know, to us.
Participant 9
So the dreamers, the Dream Team that was out and, [unclear] would have lead that before
me, were working on the concept well ahead of the whole e-government agenda. We
were very fortunate; about a year in to the thinking and the planning and the legislation
and all those issues that the whole e-government agenda opened up, and along with it and
actual fund, a financial fund to support it. So that’s the angle Revenue took.
Participant 10
I mean, there were bits and pieces out there, but wasn’t a good strong framework,
certainly not as strong as it is now. So at the time it was a political dimension from
government to push e-government, we wanted to get something. There was an
information society and commission there, who had a separate stream of funding, where
they could encourage particular initiatives to just getting back to saying ‘who makes the
decisions’…
Participant 16
4.4.3.1.5 Well Defined Strategy
Another enabler of objectives was that Revenue already had a culture of computerisation that fed into
its own strategies, which in turn fit within a broader governmental set of strategies for ICT in
delivering public services:
172
Primarily, because we were in the game a lot longer than any other government
organisation; we’re the oldest government organisation, so we’re here since the inception
of the state in 1923 and we were the first government department to be established. We
also took on ICT very early on in the game; and the reason we were able to take it early
on in the game, was because we had already built an established bureaucratic structure
and we were able to actually adopt that early and build on that. So we took it on in 1960s,
so we’ve been in the software development business since 1960, and that puts us way out
in front, so when a new development or a new technology comes along we’re better and
capable of delivering on that. So they are the reasons why some organisations are to the
front and some organisations are to the back.
Participant 8
Our strategy too, was that Revenue was reorganising itself internally, and we needed
some way of taking the pressure off what would be a growing customer base with
reducing numbers internally. So we needed a system, we needed some means of a
strategy that we would be able to continue our business as normal when it was exploding,
when was the boom times, it’s a lot more customers.
Participant 16
4.4.3.1.6 Political Considerations
Political considerations were also drivers of the evolution of objectives for ROS:
Well, it requires political decision. At the end of the day, all of these things are politics,
so governments decide how they are going to allocate resources. If government says that
it is our policy to keep open rural Post Offices even though we know they cost money,
then that’s a political decision. All of these are socio-political decisions, are not
technological decisions. But technology has certain imperatives, and these may conflict
with what society actually wants; to take something simple there are, despite whatever it
says about decentralisation and de-concentration etc., the logic of technology is
centralisation. It makes sense if you are looking from an economic and efficiency point of
view to have everything on one big database; why would you scatter it around in this day
and age of good communications. In the old days, you could distribute databases because
communications were bad and therefore you needed your local data for any kind of speed
of access, but now we can move everything centrally.
Participant 7
Yes, there was an e-government agenda… and you know, they wanted information to be
provided on the interactive services, integrated services; and they had, there was, they
were going to have you know a public service broker that was going to be reached, and
they had this idea that it would be you know, a portal into all e-government services… I
mean it was part of the e-government plan for the use of, you know to provide services.
So we started providing services.
Participant 9
So there was, the impetus was coming from external to Revenue; it wasn’t just a Revenue
decision to say let’s go with ROS. It happened to be that the timing was; we need to be
173
doing something like that, and we had the capacity and the capability to develop
something.
Participant 16
4.4.3.1.7 Poorly Defined Strategy
Whereas participants clearly articulated the benefits of having a strategy in the first instance they
discerned differences between having a generic strategy and one that was clearly defined and fit for
purpose:
Companies have strategies. Companies might say, “We want to be in that market”. Now
governments, I suppose have strategies, but they are an awful lot of hot air. We want; I
think somebody has said the figure is, that 48 of the 50 United States have public
declarations that they want to be the electronic business hub for the United States. The
exact, I can’t remember it exactly, but every company wants to be the knowledge hub.
Ireland wants to be the knowledge centre, Sweden wants to be, Austria, everybody wants
to be it and all of these things, and we are going to be number one in Europe;
governments do this all the time. This is not strategy. Because often there is no real
concrete plan, it’s just… That, in other words, I am asking, is the question meaningful,
because I do not conceive government is really thinking very strategically most of the
time. A lot of the strategy is just waffle… They put out a big statement; let some other
committee, another report, another grand plan. Meanwhile, here’s the next election…
What you can ask is, “How well the technology supports the given agency?” And
whether the agencies are still in silos, which I think very much they still are.
Participant 7
It was more a case, our Senior Officer was one of the commissioners at the time, and who
later became the chairman; was a champion for this concept. So you had, you didn’t have
a, I would say the governance gateway that ROS went through the processes, and at end
of the day what’s going to be the cost-benefit analysis, it wasn’t there. It was a question
of something like ROS. I think Australians have tried something and the British have
tried different versions. One of the things that have been tried, the beauty of the Irish
scenario was, they were small enough to try it, and if it went wrong we could back out
fairly quickly.
Participant 16
4.4.3.1.8 Other Key Drivers
Other key drivers of objectives were soft immeasurable drivers such as equity, accessibility and
fairness developing a flexible ICT architecture to support future needs and external pressures from
journalist commentators and expert commissions:
Yes, and equity is also another tricky one to measure. If I say that, I have got to provide
equal access to all social groups to this service; now, immediately if I say that, then
efficiency and effectiveness go out the door in many instances. Let me give a very simple
example. It’s efficient and effective to close down small Post Offices in the countryside
because there are very few customers and you are probably too young to remember, you
are Greek anyway. But, there was a guy called Beeching in the 1950s who closed down
174
all these small railway lines and small stations in England, and they have also closed
down a lot of rural Post Offices here, and they tried to shut down local things. This is all
very efficient and effective and you can say you do not need to go to the Post Office now,
you can transact all your business electronically, and you can do online banking and so on
and so forth. But, in doing that, considerable damage is done to the social network in the
local community and you end up with things like rural depopulation, the local depression
and suicide and God knows what else. But these do not get measured in any index, or if
they do get mentioned on an index, it’s a rather different index. And this argument ranges
over all sorts of things; from hospitals, like closing down small hospitals to providing
services that very few people use. So it is, I like to think, that maybe every so often,
governments do actually think about other values other than economy, efficiency and
effectiveness when they are designing their e-government systems.
Participant 7
So there’s only a certain amount that you can do. You can’t force people to look for tax
back and often in the press lately you’ll see, oh, Revenue still have 500 million but they
haven’t refunded; we’d like to, but you have to come to us. You know? (laughs).
Participant 18
4.4.3.2 B1 – Summary
A key evolutionary driver of the ROS project was a need within Revenue to greatly increase efficiency
and effectiveness. Up to this point, all of its work was conducted manually on paper by Revenue staff.
ROS would fundamentally reform how the processes themselves would be conducted into the future.
ROS was seen as creating a need to reform current processes to make them more efficient and
effective, rather than the reform coming as a consequence of ROS. Marketing ROS both internally and
externally was seen as a critical success factor if targets for uptake were to be met. The fact that ROS
formed part of a wider governmental reform policy assisted champions of ROS to cut through
procedural impediments that sometimes delay expensive projects. Improving customer service
influenced the formulation of objectives for ROS. Another enabler of objectives was that Revenue
already had a culture of computerisation which fed into its own strategies, and which in turn fitted
within a broader governmental set of strategies for ICT in delivering public services. Whereas
participants clearly articulated the benefits of having a strategy in the first instance, they discerned
differences between having a strategy and one that was clearly defined and fit for purpose. Political
considerations were also drivers of the evolution of objectives for ROS. Other key drivers of
objectives were soft immeasurable drivers such as equity, accessibility and fairness, developing a
flexible ICT architecture to support future needs, and external pressures form journalist commentators
and expert commissions.
4.4.3.3 B2 – Objectives Formulation and Success Criteria
This category examined how objectives for the ROS project were formulated and how participants in
the study defined success criteria. Data coded under this category was further broken down under
several headings as displayed in Table 4.11 below:
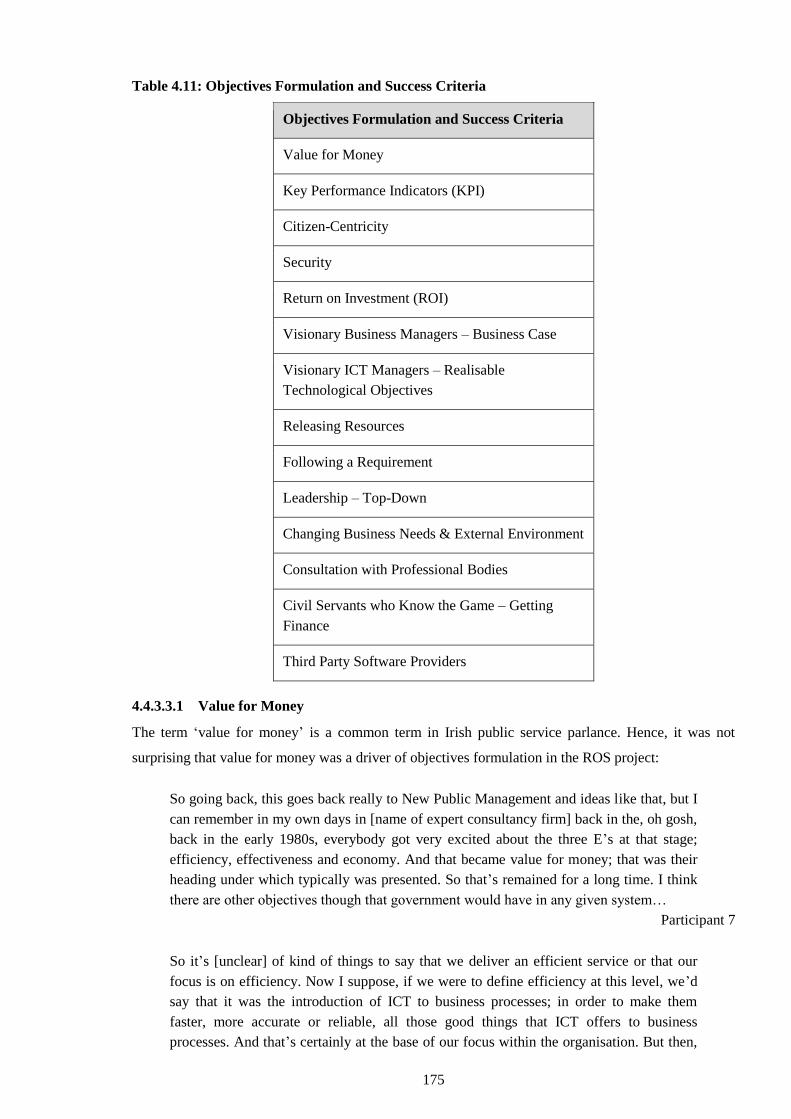
175
Table 4.11: Objectives Formulation and Success Criteria
Objectives Formulation and Success Criteria
Value for Money
Key Performance Indicators (KPI)
Citizen-Centricity
Security
Return on Investment (ROI)
Visionary Business Managers – Business Case
Visionary ICT Managers – Realisable
Technological Objectives
Releasing Resources
Following a Requirement
Leadership – Top-Down
Changing Business Needs & External Environment
Consultation with Professional Bodies
Civil Servants who Know the Game – Getting
Finance
Third Party Software Providers
4.4.3.3.1 Value for Money
The term ‘value for money’ is a common term in Irish public service parlance. Hence, it was not
surprising that value for money was a driver of objectives formulation in the ROS project:
So going back, this goes back really to New Public Management and ideas like that, but I
can remember in my own days in [name of expert consultancy firm] back in the, oh gosh,
back in the early 1980s, everybody got very excited about the three E’s at that stage;
efficiency, effectiveness and economy. And that became value for money; that was their
heading under which typically was presented. So that’s remained for a long time. I think
there are other objectives though that government would have in any given system…
Participant 7
So it’s [unclear] of kind of things to say that we deliver an efficient service or that our
focus is on efficiency. Now I suppose, if we were to define efficiency at this level, we’d
say that it was the introduction of ICT to business processes; in order to make them
faster, more accurate or reliable, all those good things that ICT offers to business
processes. And that’s certainly at the base of our focus within the organisation. But then,
176
part of what efficiency comes with is, how much efficiency do you offer and the
important thing then is the value for money… Is there a value for money associated with
the efficiency that you’ve delivered for the organisation and that’s almost more
fundamental than the efficiency itself. So everything that we do, is associated with a
value for money, will we get a return on the investment for the work that we’re going to
do on this effort to make this more efficient.
For instance, if we were to, obviously to make the introduction at the office, you
know when you come into the building, and you’re ushered into the building, and you
sign a sheet there… if we were to make that more efficient, we could introduce an ICT
element to that, and some organisations do that. But we don’t regard that as a value for
money development, and so value for money becomes kind of a pre-requisite for
efficiency and a pre-requisite for the development of any ICT product. Now, efficiency is
also associated with business process restructuring and design, so we apply things like
Lean and Six Sigma to organisation processes as well. And we do that sometimes prior to
a software development, and sometimes in conjunction with the software development.
And that’s a feature of efficiency, where we try to glean value for money from the
business process itself and how it’s structured, and the organisation structuring necessary
to actually support that business process, and then we may introduce a software element
of that to do all the things that software does. But that’s all pre-supposes, that’s there’s a
value for doing this.
Participant 8
4.4.3.3.2 Changing Business Needs and the External Environment
The changing business and political needs, as well as the external environment, influenced the
objectives formulation for ROS:
But, in my experience of being on these, and I sit in to some extent on some steering
committees on these things, there often isn’t a very formal business case. There is a
business need perceived; we need to do this.
Well the first thing is that government change, and governments, politicians by and
large, know nothing about technology, and few of them really think much in terms of
e-government at all, except to throw it out as a phrase that makes them sound as if they
are up to date, and with it.
Participant 7
We can expect, we should expect some hard and fast benefits for the way we do our
business in terms of… so yes, that would have changed over time, and that would change
over that period of time, and that we are now, can be more demanding, we’re more
informed, and ROS can deliver. External customer wise I can’t honestly say. I can’t
honestly say; it’s changed the way we expect them to be reacting with us.
Participant 16
And in the late ‘80s, the only method of payment you had to pay Revenue was a cheque
or cash, okay? There were a couple of instances where cheques went missing and were
cashed inappropriately. No one in Revenue was ever involved or was ever proved to be
involved, but because of this we began a project in about 1990; we were looking at new
177
methods of payment. This is when we introduced Direct Debit and we introduced Giro;
developed new methods.
When the ROS project was initially mooted in the late ‘90s, I was contacted in
connection with how we would deal with the payments. The system itself, the whole
online, the interface, how it would work and how it would look to the public was pretty
much developed; but there was no actual payment method, which when you’re a Revenue
organisation, it’s kind of important, okay?
Participant 18
4.4.3.3.3 Key Performance Indicators (KPIs)
Key performance indicators (KPIs) were used under the broader umbrella of ‘value for money’ for
specific targets for the ROS project:
Well, we set a target for you know fifty million for the first year and we achieved that,
you know fairly rapidly you know, I think, within the first few months…
Participant 9
50 million within the first, I think it was the first year… No, on collection… just to
collect, and it was in within six weeks! You know so, then the next, the target when I
came on board, the service went live in September 2000, the end of September 2000; I
came in in June 2001 and the challenge was to have 75 percent of the returns and
50 percent of the tax in online by 2005.
Participant 10
4.4.3.3.4 Citizen-Centricity
There was ample evidence in the data that citizen-centricity was an active agent in formulating
objectives and success criteria. It was recognised from the outset that the project could not succeed if
the citizen did not engage fully. This was a critical success factor:
Oh, they do think of the citizen, I think they do. My experience of civil servants is the
best of them of course, think of the citizen, and they don’t ignore in general savings
obviously, but they are very conscious. If you talk to people in Social Welfare as I was at
one stage, they would say the real problem cases we have need a lot of attention. These
are the difficult cases that need human intervention. We’ve huge backlogs there, because
of the work involved, it requires a lot of time, but if we can automate these systems over
here, we can release staff that can really deal with the difficult problems; if we can
automate the routine, we can then bring human skills to deal with the non-routine.
Participant 7
Citizen-centricity plays a role in that, without a doubt. Let’s look at ROS at the moment
and you identified quite correctly that there was a new application, a rich Internet
application called PAYE Any Time. And that is a rich Internet application; and so we
have evolved the requirements for our Internet offering, because we see that there has
been an evolution in citizens’ requirements and citizens’ expectations of what we would
offer.
Participant 8
178
We had a kind of a phase and we implemented a tax return, with a more complex tax
returns for the Income Tax for certain employees. I think it was around about the 2002,
and that was one that added, you know, added value, because the tax returns were twenty,
twenty-two pages you know on paper, so it was a lot, and we introduced you know, a
calculation facility unit which you know, calculated it and so on. So that’s been one of
our more successful tax returns because we get about 80 percent of those now
electronically, because there’s added value there, because it does the calculation for you.
Participant 9
The primary concern was to improve customer services and as Ken said to release
resources for compliance.
Well, I suppose, when we first went live, the first three forms, three very simple
forms, nearly as a proof of concept, we had enough to do with building the site, getting
the security right, and everything; so, the decision was taken to go with the simple forms
and then would very quickly more onto the more complicated forms. Once we moved
onto the complicated forms, we did engage with people on a consultative basis before
rolling out; how they would see the form working, and that side of things. Obviously, we
are stuck with tax legislation that we have to have certain things in the form, and do it in a
certain way, but there was a very strong consultative process, which maybe not individual
customers but certainly with the accountancy bodies and tax professionals.
Participant 10
It was, yes, we had again, part of our success criteria, part of our belief, and again it was
not just ROS, Revenue had established these type of groupings. We have a collaboration
structure where you’ll deal with accountancy bodies, legal representatives; groups of
these people who represent our customers…
Participant 16
4.4.3.3.5 Security
Security clearly featured as a major driver of objective formulation and success criteria for ROS:
Well, you know the main one was to ensure security and the non-repudiation process in
security. And, they showed that ROS had a good reputation of security because if people
felt that the system was insecure we had to assure them and so on.
Participant 9
Well, as we developed, so ROS in its initial stages, there were so many building blocks
that have to be in place to start an e-service; particularly a very secure one, and that’s
critical within a revenue service in comparison to a lot of other government projects. Our
security is so totally different, because not only do we take money in, but we give money
out. Okay, so we are very, very, different in comparison to…
Participant 10
179
The security was a big thing with ROS, and for the first time we had moved into a web
application which had a huge security element associated with it. So we had to be sure
that everything was going to be; well, I think the objective was a full 128-bit encryption
but I don’t think that was broached initially, I think that was done over time.
Participant 17
4.4.3.3.6 Return on Investment (ROI)
Return on investment (ROI) was central to the process of formulating objectives and success criteria
for ROS:
So everything that we do, is associated with a value for money, will we get a return on the
investment for the work that we’re going to do on this effort to make this more efficient.
One of the things that’s a feature of this organisation is a business case. So, a
business case is presented for any development that’s done within the organisation; for
instance, around about this stage, when consolidated customer service review was
brought about, there was a large business case to run that project. So similarly, with the
development of ROS, or any other application within the organisation, there is a business
case presented, and within that business case, a return on investment (ROI) is, an effort is
made to quantify that.
Participant 8
Okay, from a management perspective they had the objective, they wanted to see the
efficiencies and the better customer service and ROS delivered. But, Revenue had to see
the return in that investment, they actually had to see the staff moving out of the
processing of returns and payments, and moving into compliance, so that was one
objective that was fulfilled.
Participant 10
4.4.3.3.7 Visionary Business Managers – Business Case
Having the right business case and the visionary leaders on the business side of the project were
critical components in formulating objectives and success criteria for ROS. This is evidenced by the
fact that right to date, the overall project leaders are always from the business side in Revenue ICT
projects:
The Revenue, Irish Revenue, have been extremely progressive in their use of IT right
back to the 1960s, and very often these things are a matter of visionary leadership. So,
you’ve got a very capable visionary, possibly head of IT, but you need a combination,
this is what my own PhD was about. You need a combination of vision in the business
leadership, the senior management of the department and the capability and vision of the
IT people to deliver that; and it’s a synergy and a synthesis of those two, that does it.
Participant 7
Revenue took a strategic decision to have the project led by the business area as opposed
to the IT area.
Participant 10
180
But just to give you an insight into it, he was our CIO at the time. He was an extremely
visionary CIO because he had driven through all of the customer integration stuff from
1989 onwards. But when ROS came round his resources were really depleted at that point
and he had very few resources.
So, when ROS came along and the business people wanted to have a web presence,
our CIO at that point said, ‘I can’t do that, I can’t take on that task, unless I get more
resources to do it.’ So he more or less kind of put a block in the way of it and refused to
do it… So anyway, there was a concern about whether we would do it or not, and then the
business side got very engaged in this.
Participant 17
4.4.3.3.8 Visionary ICT Managers – Realisable Technological Objectives
Of equal importance to having visionary people with business leadership qualities in the team was
having visionary people on the technology side:
I remember now, this is back in the early 2000s, a lot has changed since then, I still think
we are very, very, good but back then really it was; you see, I suppose the difference
being, stop me talking in a second, the difference between our project and a lot of the
other e-government projects, not only in Ireland but across Europe at the time, was an
awful lot of them were e-filling, they weren’t e-filing, all right, an awful lot of them were
advertising this form and that form, but literally it was printed off when it got into the
office. Whereas ours was, as Tony would have shown you, fully interactive right through
into our back-end systems, and that’s where the savings came for Revenue and the
efficiencies came for Revenue and for the taxpayers, because they got an immediate
response…
Participant 10
So while Accenture were doing the front, the nice front-facing end of it, the biggest part
was the integration into the back end. All the electronic forms, transfers, the payments,
the accounting systems, the returns, all of that stuff had to be integrated and adjusted to
accommodate ROS. So the bulk of the work was in there; so our CIO still got kind of
lumped with a whole heap of work, but this was inevitable. John Leamy was a visionary
and he saw it and he drove it forward…
Participant 17
The ROS team became known as the ‘Dream Team’, a label, which has stuck to the present day:
So the dreamers, the Dream Team that was out and [unclear] would have led that before
me, were working on the concept well ahead of the whole e-government agenda.
Participant 10
Other key drivers for formulating objectives and success criteria included: releasing resources, having
top-down leadership and civil servants on board who ‘knew the game’ and could secure finance.
Finally, identifying and partnering with the right third-party software providers.
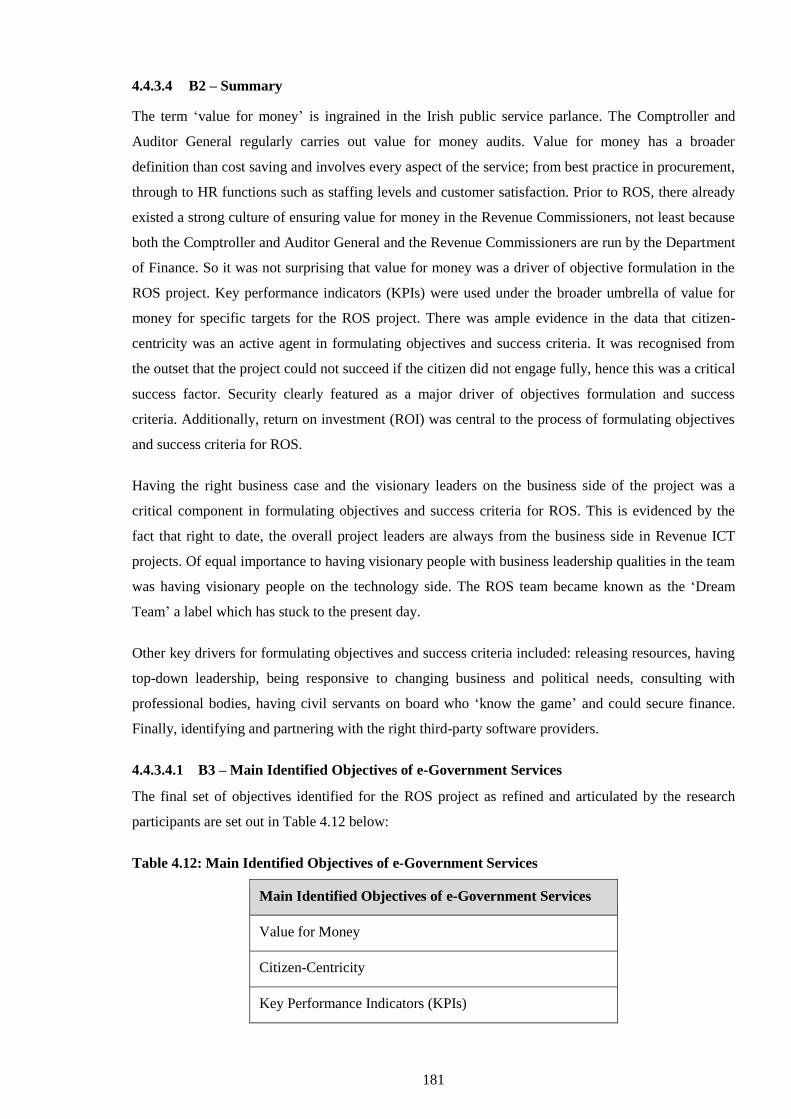
181
4.4.3.4 B2 – Summary
The term ‘value for money’ is ingrained in the Irish public service parlance. The Comptroller and
Auditor General regularly carries out value for money audits. Value for money has a broader
definition than cost saving and involves every aspect of the service; from best practice in procurement,
through to HR functions such as staffing levels and customer satisfaction. Prior to ROS, there already
existed a strong culture of ensuring value for money in the Revenue Commissioners, not least because
both the Comptroller and Auditor General and the Revenue Commissioners are run by the Department
of Finance. So it was not surprising that value for money was a driver of objective formulation in the
ROS project. Key performance indicators (KPIs) were used under the broader umbrella of value for
money for specific targets for the ROS project. There was ample evidence in the data that citizen-
centricity was an active agent in formulating objectives and success criteria. It was recognised from
the outset that the project could not succeed if the citizen did not engage fully, hence this was a critical
success factor. Security clearly featured as a major driver of objectives formulation and success
criteria. Additionally, return on investment (ROI) was central to the process of formulating objectives
and success criteria for ROS.
Having the right business case and the visionary leaders on the business side of the project was a
critical component in formulating objectives and success criteria for ROS. This is evidenced by the
fact that right to date, the overall project leaders are always from the business side in Revenue ICT
projects. Of equal importance to having visionary people with business leadership qualities in the team
was having visionary people on the technology side. The ROS team became known as the ‘Dream
Team’ a label which has stuck to the present day.
Other key drivers for formulating objectives and success criteria included: releasing resources, having
top-down leadership, being responsive to changing business and political needs, consulting with
professional bodies, having civil servants on board who ‘know the game’ and could secure finance.
Finally, identifying and partnering with the right third-party software providers.
4.4.3.4.1 B3 – Main Identified Objectives of e-Government Services
The final set of objectives identified for the ROS project as refined and articulated by the research
participants are set out in Table 4.12 below:
Table 4.12: Main Identified Objectives of e-Government Services
Main Identified Objectives of e-Government Services
Value for Money
Citizen-Centricity
Key Performance Indicators (KPIs)
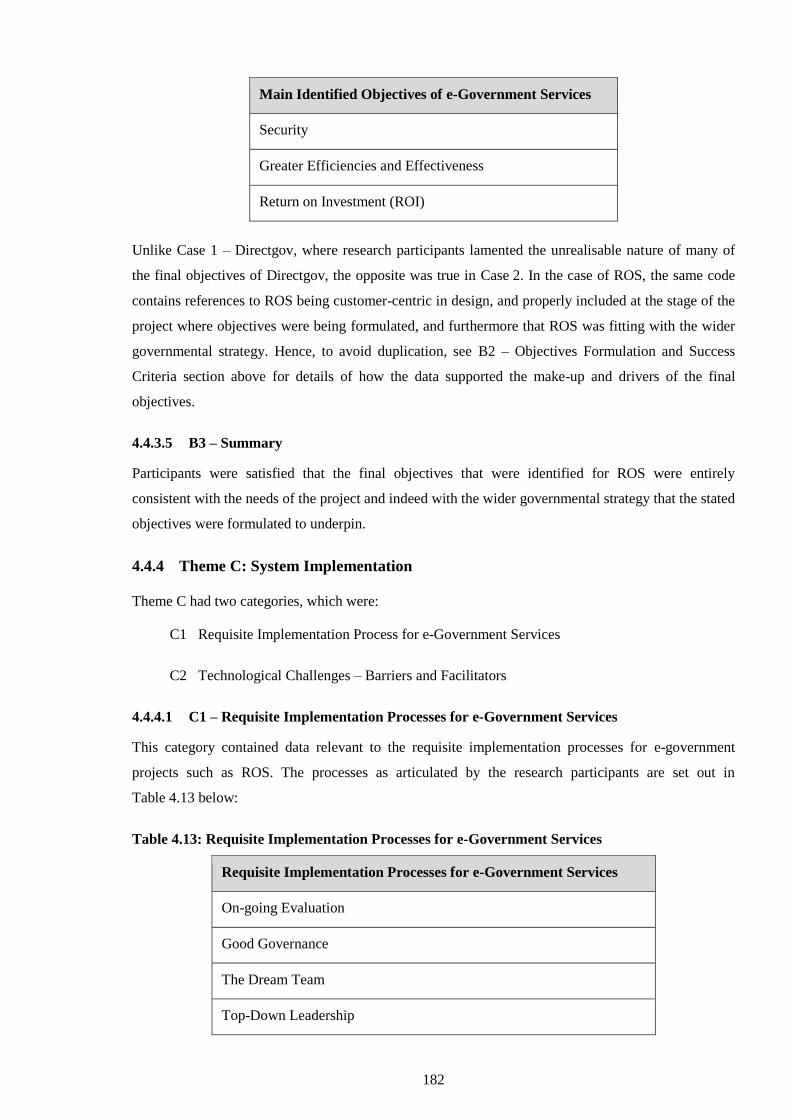
182
Main Identified Objectives of e-Government Services
Security
Greater Efficiencies and Effectiveness
Return on Investment (ROI)
Unlike Case 1 – Directgov, where research participants lamented the unrealisable nature of many of
the final objectives of Directgov, the opposite was true in Case 2. In the case of ROS, the same code
contains references to ROS being customer-centric in design, and properly included at the stage of the
project where objectives were being formulated, and furthermore that ROS was fitting with the wider
governmental strategy. Hence, to avoid duplication, see B2 – Objectives Formulation and Success
Criteria section above for details of how the data supported the make-up and drivers of the final
objectives.
4.4.3.5 B3 – Summary
Participants were satisfied that the final objectives that were identified for ROS were entirely
consistent with the needs of the project and indeed with the wider governmental strategy that the stated
objectives were formulated to underpin.
4.4.4 Theme C: System Implementation
Theme C had two categories, which were:
C1 Requisite Implementation Process for e-Government Services
C2 Technological Challenges – Barriers and Facilitators
4.4.4.1 C1 – Requisite Implementation Processes for e-Government Services
This category contained data relevant to the requisite implementation processes for e-government
projects such as ROS. The processes as articulated by the research participants are set out in
Table 4.13 below:
Table 4.13: Requisite Implementation Processes for e-Government Services
Requisite Implementation Processes for e-Government Services
On-going Evaluation
Good Governance
The Dream Team
Top-Down Leadership
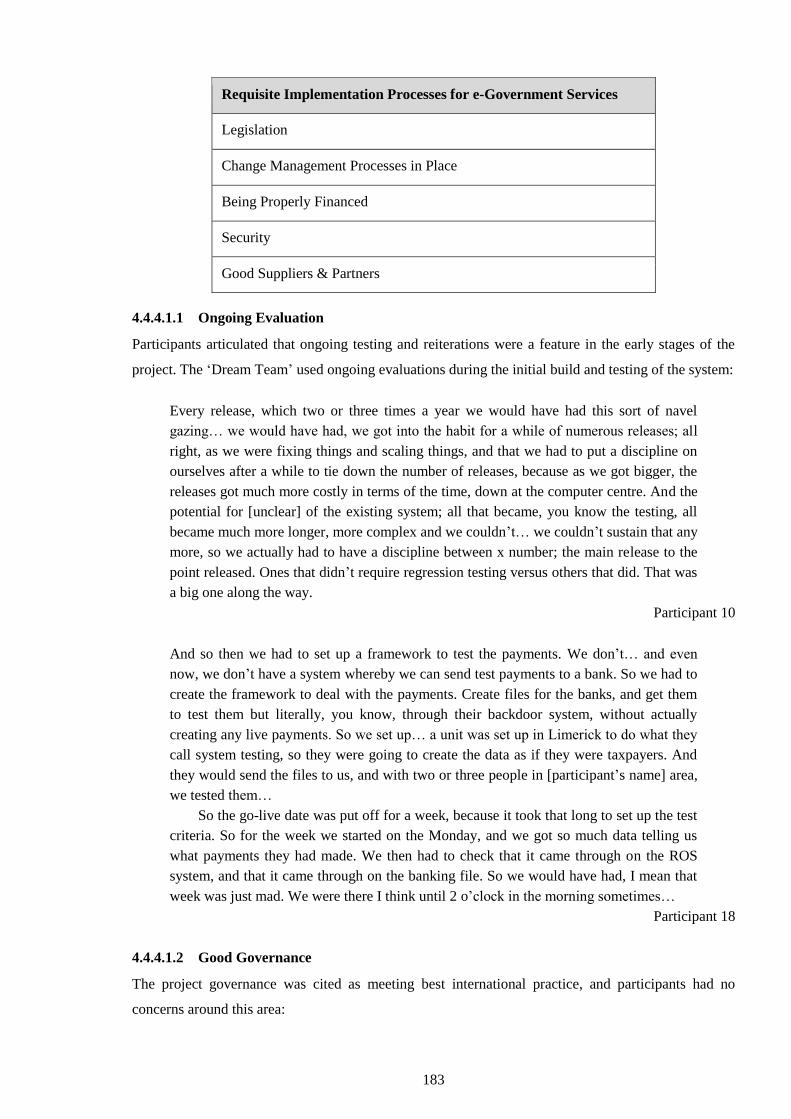
183
Requisite Implementation Processes for e-Government Services
Legislation
Change Management Processes in Place
Being Properly Financed
Security
Good Suppliers & Partners
4.4.4.1.1 Ongoing Evaluation
Participants articulated that ongoing testing and reiterations were a feature in the early stages of the
project. The ‘Dream Team’ used ongoing evaluations during the initial build and testing of the system:
Every release, which two or three times a year we would have had this sort of navel
gazing… we would have had, we got into the habit for a while of numerous releases; all
right, as we were fixing things and scaling things, and that we had to put a discipline on
ourselves after a while to tie down the number of releases, because as we got bigger, the
releases got much more costly in terms of the time, down at the computer centre. And the
potential for [unclear] of the existing system; all that became, you know the testing, all
became much more longer, more complex and we couldn’t… we couldn’t sustain that any
more, so we actually had to have a discipline between x number; the main release to the
point released. Ones that didn’t require regression testing versus others that did. That was
a big one along the way.
Participant 10
And so then we had to set up a framework to test the payments. We don’t… and even
now, we don’t have a system whereby we can send test payments to a bank. So we had to
create the framework to deal with the payments. Create files for the banks, and get them
to test them but literally, you know, through their backdoor system, without actually
creating any live payments. So we set up… a unit was set up in Limerick to do what they
call system testing, so they were going to create the data as if they were taxpayers. And
they would send the files to us, and with two or three people in [participant’s name] area,
we tested them…
So the go-live date was put off for a week, because it took that long to set up the test
criteria. So for the week we started on the Monday, and we got so much data telling us
what payments they had made. We then had to check that it came through on the ROS
system, and that it came through on the banking file. So we would have had, I mean that
week was just mad. We were there I think until 2 o’clock in the morning sometimes…
Participant 18
4.4.4.1.2 Good Governance
The project governance was cited as meeting best international practice, and participants had no
concerns around this area:
184
Well, with the governance, yes, the governance is the big aspect, and a project
management office certainly has, but now let me be clear about when the governance
came in. Governance was there with a PRINCE version for the introduction of ROS, so
there were project boards, there were steering groups, there were gateways for [unclear]
and money spent and these initiation documents, there were business cases and there was
project initiation. But governance over the period of time since 2000, when ROS was
brought in, has expanded and gotten bigger to the extent that now we have a programme
management office and the processes are even stronger; they probably follow the
PRINCE 2 methodology and they effectively beefed up on those governance structures.
So it would be wrong of me to say that the Project Management Office (PMO) and the
strong governance structures that were there, were always there, there were certainly
elements of them there all the time, but they’ve certainly got stronger.
Yes it’s return on investment; now, I think in fairness this is something that’s been
approached more recently within the organisation such that. So what we call, we have
three stages; actually, we have four governance stages that we’ve followed for many,
many years. We have a document called a project origination document (POD), which is
effectively the business case, and then we have project initiation document (PID), and
then we have project commencement document (PCD). Now, this here is the business
case, the POD, and it outlines the value for money and the business objective of the
proposal; value for money and business objective. There’s a gateway at that point that the
IT Executive (ITEX) come in and say, “Okay we’re going to spend some money, you’re
proposing that we spend some money to develop a piece of software for this.” And what
ITEX say is, “Okay it’s a worthy project, we’ve looked at the value for money, we’ve
looked at some of the business benefits, and we haven’t been able to quantify them yet
but let’s see how much it would cost to do effectively a feasibility study on this.” So,
they’re prepared to allocate x number of euros to go to the next stage, to go to the next
gateway to do a feasibility study for this project and that will include a guide, an estimate,
on what the project will take to develop and it will also incorporate a further view of the
benefits.
Participant 8
Change to work practice, internal work practices. Change of management, internally and
externally… yes, we use the opportunity to re-engineer some of the business processes;
okay, in consultation with the accountants. So, I am going into details again, and we
needed money, so legislation, finance, and then we needed corporate support… and that
was one of the keys to our success, we had that from government, and from within
Revenue. And we had the finance that was not an issue at the start. That was it!
Participant 10
4.4.4.1.3 The Dream Team
A dedicated team was put in place, which was physically removed from Revenue and free to develop
ROS from both the business and technological perspectives:
...and they set the team up there to do it on their own, and they gave them a clean sheet
and they even had a complete air wall between them and the main computer systems for a
long time. So it worked extremely well.
Participant 7
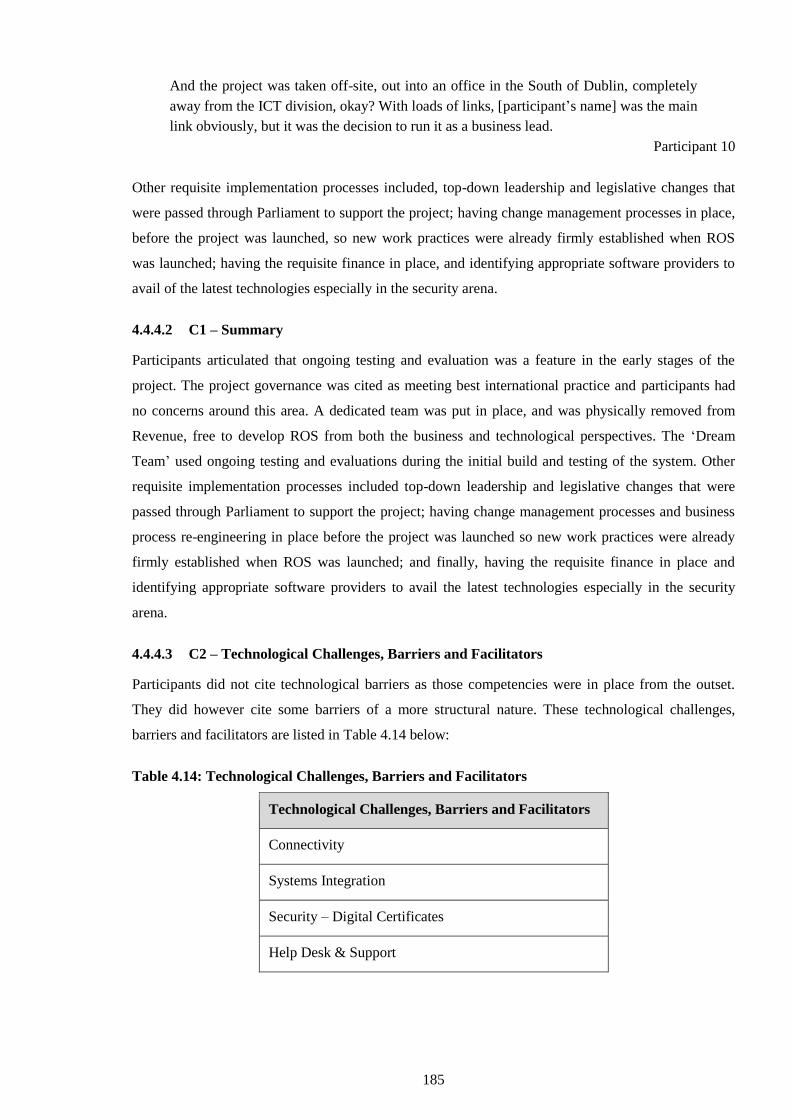
185
And the project was taken off-site, out into an office in the South of Dublin, completely
away from the ICT division, okay? With loads of links, [participant’s name] was the main
link obviously, but it was the decision to run it as a business lead.
Participant 10
Other requisite implementation processes included, top-down leadership and legislative changes that
were passed through Parliament to support the project; having change management processes in place,
before the project was launched, so new work practices were already firmly established when ROS
was launched; having the requisite finance in place, and identifying appropriate software providers to
avail of the latest technologies especially in the security arena.
4.4.4.2 C1 – Summary
Participants articulated that ongoing testing and evaluation was a feature in the early stages of the
project. The project governance was cited as meeting best international practice and participants had
no concerns around this area. A dedicated team was put in place, and was physically removed from
Revenue, free to develop ROS from both the business and technological perspectives. The ‘Dream
Team’ used ongoing testing and evaluations during the initial build and testing of the system. Other
requisite implementation processes included top-down leadership and legislative changes that were
passed through Parliament to support the project; having change management processes and business
process re-engineering in place before the project was launched so new work practices were already
firmly established when ROS was launched; and finally, having the requisite finance in place and
identifying appropriate software providers to avail the latest technologies especially in the security
arena.
4.4.4.3 C2 – Technological Challenges, Barriers and Facilitators
Participants did not cite technological barriers as those competencies were in place from the outset.
They did however cite some barriers of a more structural nature. These technological challenges,
barriers and facilitators are listed in Table 4.14 below:
Table 4.14: Technological Challenges, Barriers and Facilitators
Technological Challenges, Barriers and Facilitators
Connectivity
Systems Integration
Security – Digital Certificates
Help Desk & Support
186
4.4.4.3.1 Connectivity
Broadband penetration was in its infancy at the time ROS was being rolled out. Connectivity, or the
lack of it, was addressed by having both online and offline versions of the software available:
It was effectively the growth of the Internet, and the technologies for developing. The
broadband penetration, a number of customers originally you know, I suppose had them
increasing their bandwidth and use, because a lot of people were using dial-up
connections… and even our offline application, initially we provided that on CD. You
know CD-ROMs, so they could be introduced to that service and market it as well, so we
could issue this at seminars, load it, and so on.
People could do even before they became, you know, they could use the digital
certificate, they could use the offline return, do the calculations, and then they could say
how good it is, and once they had it there they could submit the return then on ROS.
Participant 9
Another thing was totally out of our control was the availability of broadband… it was
only, it was only starting… penetration, yes. There was, you know, over the years we
were, had numerous complaints from all round the country about they didn’t have
broadband, the system was slow; the system was not slow, it was just the Internet access.
We had one-off challenges every now and then, there was one peak filing date where the
ISP went down and we, there was no Internet for anybody, and it was on the filing day.
You know we… the lights dimmed, they didn’t go out, that’s the line we are sticking to.
But yes, that was a big issue at that time. It still is an issue in Ireland.
But, also as an organisation, to have the actual hardware in place to deal with the
huge volumes in a very confined space, in a number of days, was challenging. I know
initially the IT gurus would have said fine, you’ll only be a trickle down the pipe, it won’t
be much, but because ROS was processing into so much, into so many different systems
and servers from payments to returns and outputting sort of instantly as well…
acknowledgements, the traffic was enormous. And the various servers were seriously
challenged, and every one of them had to be upgraded from when I went in; I think we
probably had it fully cracked by about four or five, that we had suitable hardware in there
and the firewall, and a whole lot to do with. We call it the ‘pipe’… It just couldn’t take
the traffic. So, we did a huge amount of stress testing and volume testing and all that, but
you know something would always catch you out because one server, well one part of the
chain, might not have been upgraded so that was, a few stressful days around the
deadlines.
Participant 10
4.4.4.3.2 Systems Integration
Integrating front- and back-end systems created challenges from the outset, and systems integration
continues to be a challenge up to present:
…the challenges… our business management (BPM) and SOA software, sorry, Service
Oriented Architecture; so SOA and BPM are, I’d say, the biggest challenges we have… is
application integration. So we still have many applications out there that do different
things; so we have our main ERP system but we also have case management systems, we
have business analytic systems, and they all necessarily connect to one another in some
187
form or fashion. And those connections actually get quite into quite a jumble, because we
have interfaces… so the effort here is for us to become more flexible, is to de-couple
these applications, and to run an enterprise service…
Participant 8
Yes there were, because we were moving from the mainframe environment to a new
environment with client server tools and new database… So, the original case
management application was a proof of concept that you could integrate and use these
new tools; like both Integrated Tax Processing (ITP) and case management use the same
sort of tool set more or less.
They were technological [challenges] as well as providing the business requirement
of the integration.
Participant 19
4.4.4.3.3 Security Certificates
User identity created an important security challenge during the development of ROS. This was
resolved by introducing digital certificates:
The challenges at the outset; I think the biggest challenge was the security, was to come
up with a formula that would work for Revenue and that would satisfy our customers that
they were safe and that was the digital certificate and everything around that, and that
took a good while. So, that was one challenge and, that contract was renewed over time
there were issues around, whether we would have the certificates abroad or here, and
looking at the various issues around that. So, little things like that we had to consider
when we were going out to tender, and things like that.
Participant 10
We are contributing more to the e-government element of things, we’re sharing services
now with ROS, and can process things, our authentication for instance, we’re logging into
ROS, this digital security system we use, the digital certificate means that if the
Revenue… if the customer does a few jobs in the Department of Transport then it will
take the thread off it and, I don’t know the technical terms as such, they will take a link
from us. If you log in with your ROS certificate…
Participant 16
4.4.4.3.4 Help Desk and Support
It was recognised early on the life of the ROS project that a support help desk would be required to
offer the level of customer-centricity required to ensure the project’s success. Another customer
support instrument was the ROS Liaison Officer who locally trained people and could give direct
training and support to users up to a certain level:
188
But we do have you know people, in the organisation, in every tax district, that we call
them ROS liaison officers where somebody has, these would be people in the tax offices
and various places and so on, and their job is to provide specific support to ROS
customers that if they have any issues or technical issues, they will try and maybe help
them out.
Participant 9
Yes, so then we also would have had issues with patches, with upgrades and things like
that. So to support that, for our customers to be able to cope with all the upgrades of
technology, we had a help desk and we still have a help desk. A technical helpdesk that’s
available from, and we had fairly heavy hours now, from a government perspective; that
help desk was always half eight until half six, 8.30 to 6.30, but around any filing times it
was up until midnight! It was open weekends; it was open bank holidays, whenever it was
needed.
Participant 10
Once you’re in the large cases division and you get a letter. So the system then… the
letter said that any payment and returns to you after 1 January 2009 had to be filed on
ROS. Okay? Now, to support that, we set up a help desk outside. There is a main ROS
helpdesk, but we felt that because these were our specific cases and it wasn’t going to be
just ordinary citizens, that we would set up a dedicated desk…
Visit on site as well. Yes. And a helpdesk to deal with their queries.
Participant 18
4.4.4.4 C2 – Summary
Broadband was in its infancy at the time ROS was being rolled out. Having both online and offline
versions of the software available addressed connectivity or the lack of. Integrating front- and back-
end systems created challenges from the outset, and systems integration continues to be a challenge to
date. User identity created an important security challenge during the development of ROS, and this
was resolved by introducing digital certificates. It was recognised early in the life of the ROS project,
that a support help desk would be required to offer the level of customer-centricity required to ensure
the project’s success. Another customer support instrument was the ROS Liaison Officer, who locally
trained people and could give direct training and support to users up to a certain level. Moreover, for
large customers, a dedicated help desk was set up, and on-site visits were made to provide specialist
support.
4.4.5 Theme D: Evaluation and Future Development
Theme D had two categories, which were:
D1 Methods for Evaluation of e-Government Services
D2 Attitudinal Changes
D3 Ameliorating the Digital Divide
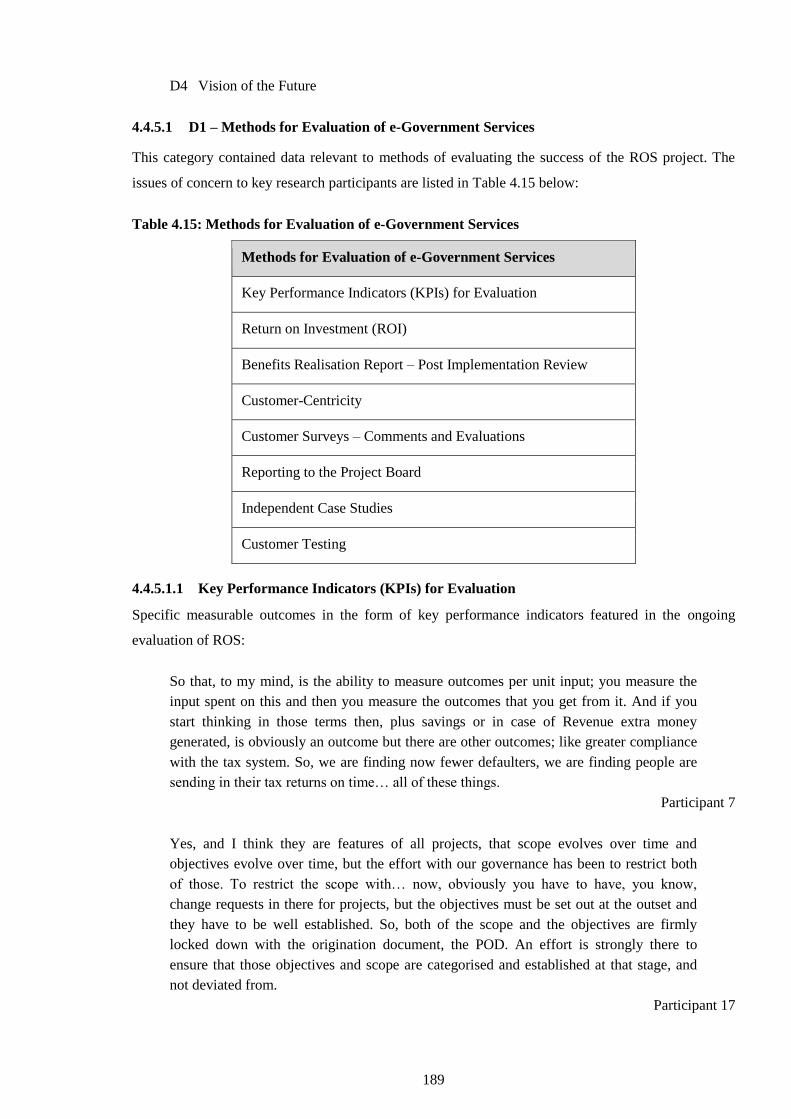
189
D4 Vision of the Future
4.4.5.1 D1 – Methods for Evaluation of e-Government Services
This category contained data relevant to methods of evaluating the success of the ROS project. The
issues of concern to key research participants are listed in Table 4.15 below:
Table 4.15: Methods for Evaluation of e-Government Services
Methods for Evaluation of e-Government Services
Key Performance Indicators (KPIs) for Evaluation
Return on Investment (ROI)
Benefits Realisation Report – Post Implementation Review
Customer-Centricity
Customer Surveys – Comments and Evaluations
Reporting to the Project Board
Independent Case Studies
Customer Testing
4.4.5.1.1 Key Performance Indicators (KPIs) for Evaluation
Specific measurable outcomes in the form of key performance indicators featured in the ongoing
evaluation of ROS:
So that, to my mind, is the ability to measure outcomes per unit input; you measure the
input spent on this and then you measure the outcomes that you get from it. And if you
start thinking in those terms then, plus savings or in case of Revenue extra money
generated, is obviously an outcome but there are other outcomes; like greater compliance
with the tax system. So, we are finding now fewer defaulters, we are finding people are
sending in their tax returns on time… all of these things.
Participant 7
Yes, and I think they are features of all projects, that scope evolves over time and
objectives evolve over time, but the effort with our governance has been to restrict both
of those. To restrict the scope with… now, obviously you have to have, you know,
change requests in there for projects, but the objectives must be set out at the outset and
they have to be well established. So, both of the scope and the objectives are firmly
locked down with the origination document, the POD. An effort is strongly there to
ensure that those objectives and scope are categorised and established at that stage, and
not deviated from.
Participant 17
190
4.4.5.1.2 Return on Investment (ROI)
ROI was a targeted objective at the project design phase and this was reflected in the evaluation
processes:
…what I am saying is, I have a limited number of people in Revenue and I have a limited
amount of resources. I should focus that on the areas that really matter, the people who
are likely to be defrauding the taxpayer of large amounts of money. I should not be
wasting time chasing PAYE people whose tax might be out by 50 or 60 euro. Or, even by
300 euro. I might get down to that stage once I’ve got all the big fish, but to my mind
why the Risk, Evaluation Analysis and Profiling (REAP) system is important, and I have
said this to [participant’s name], we had discussions about it. Why REAP is important, is
actually focusing in the resources, it’s to focus resources on the places that are likely to
prove productive. Because one of the things that public sector is particularly bad at is, it
evaluates itself by measuring inputs rather than outputs, or worst still, outcomes. And
then an outcome in this instance, an input is how many taxpayers we audited, and I can
put that up and say ‘Look we audited 20,000 tax, aren’t we clever?’ The fact that 19,957
of those were taxpayers who paid a few thousand in tax a year gets lost in that. So, we
would then measure outputs, how much did we get in in extra tax from this and that’s a
better measure, but a better measure still is, how many, how much better have we made
compliance now, as a result of the fact that we sent a few people to jail for tax evasion…
Participant 7
Okay, from a management perspective they had the objective, they wanted to see the
efficiencies and the better customer service and ROS delivered. But, Revenue had to see
the return in that investment, they actually had to see the staff moving out of the
processing of returns and payments, and moving into compliance, so that was one
objective that was fulfilled.
Participant 10
4.4.5.1.3 Benefits Realisation Report – Post Implementation Review
ROS, like all similar projects, was subjected to a Benefits Realisation Report which is presented to the
business side of the project to look at realised benefits or not, as the case may be:
Now benefits realisation is actually, it turns out to be quite tricky, so it’s the right way to
go, but it’s not the most easiest thing in the world. Because effectively the project starts
here, so you’ve followed, after the commencement document (PCD), you complete the
project but the project actually now continues with the benefits realisation plan. So, the
software is developed at this point, but there’s a benefits realisation report to be done
afterwards…
Participant 8
Nowadays we, we do a post-implementation review. We look at what we have said the
project would cost or what does it actually cost. What benefits did we say would come
from the projects? What are those of benefits that were realised; yes, so then they would
take place usually a few months after the implementation of the project, which is no good
while you are getting the benefits, until you know a certain amount of time.
Participant 9
191
4.4.5.1.4 Customer-Centricity
If ROS was to be a success and if the KPIs were to be met, the entire project was dependent on uptake.
This update required behavioural change and some considerable effort from end-users of the system.
Therefore, customer-centricity was placed at the heart of the ROS project from the development of the
strategy through project design to its evaluation:
Yes well, there’s a, you know, there’s a lot of positive comment in the press on ROS
facilities. And ROS has always held up as a successful government project and
particularly at this time of the year, and the Income Tax returns, the deadline for filing the
Income Tax returns is the 31st October, so we are reaching that deadline now. It’s the
16th November for people who file through ROS and you get journalists writing articles
and who were filing through ROS and praising our facilities and saying how good it is
and so on, how easy and user friendly it is.
Participant 9
We refer to them as our stakeholders, and we treated them like that; okay, we were, I
wouldn’t say partnership, but they were certainly stakeholders in it. So the whole design,
the whole design was agreed with them… we had large corporate, we had accountants,
we had small taxpayers, we had a cross-section of them all to see was it working for
them, and what did we need to change. So it wasn’t necessarily the forms only, because
the access controls system that was the engine that was at the heart of it, to make it work
for them. Because if it did not work for them, we were not going to get the uptake, it was
as simple as that. The accountants were key to getting the big return in, the FORM 11,
which is our Income Tax Return and it’s a 20-something-page return, it’s huge.
Participant 10
Recently I asked somebody what comes before that, what is contingent, and I got two
answers. One was the mission statement of the organisation, and then the second answer
was, what comes prior to that, was the needs of the citizen... So the needs of the citizen
comes first and then that is based on a mission statement… And then, the mission
determines legislation; it comes prior to legislation process if you follow that.
Participant 17
4.4.5.1.5 Customer Surveys – Comments and Evaluations
Primary research continued as part of the ongoing and formalised process for evaluating ROS. This
research used customer surveys and evaluations to continue to develop and improve the system:
Part of what we do, is also advertising campaigns and campaigns to advertise these
applications, and also to look back on users and citizens and to review their requirements
and their views on what we offer. We do that with special reports, special surveys.
Participant 8
Well, you know these steering groups, the people who are on these steering groups and so
on, will be the people from the IT area, the developers and so on. But, also people from
the business side of the organisation. Generally, feedback like the ROS Project would
come from the public as well, because if the system is not working, or something has
192
gone wrong. Certainly, there is consultation, ongoing consultation between Revenue and
say a representative body of taxation professionals and so on, so they would link the
feedback and so on.
Participant 9
I think the take-up; the success of it. As more people started to use the service, we were
getting more feedback and we were conscious that we had to take it, didn’t take it all on
board, but we took a lot of it on board, or took as much on board as we could. I don’t
think we would have, I think at the outset we would have said, we’ll do this, this and this,
but then we got oh no, we have to push this back, because this sector of our customer
base needs this done. That’s the only change, I don’t think at the start we would have
been, I know we were always in a consultative mode, I don’t think at the outset we would
have seen ourselves as being more driven by the customer. We were driving and
consulting, but they became bigger drivers in it.
Participant 10
Other less cited methods of evaluating ROS included reporting to the project board, testing
independent case studies, and offering hands-on customer testing:
They came in and they road-tested the system for us before it went live and gave us
feedback.
Participant 10
…we used to have a van that went around – a mobile unit, where people could go in and
use it. And we always would take feedback whenever we get word back from a customer,
a suggestion, we’d pass that on and as I say, it’s only, you know, there’s only maybe a
tiny percent you can implement but as I said earlier, this whole thing with the agents, we
implemented that. And when we get suggestions they would come to us. I know we had
forums or fora set up to get information. Revenue also has, I mean apart from ROS at all,
Revenue have like… we have a tax agent liaison committee, the TALC.
Participant 18
4.4.5.2 D1 – Summary
Specific measurable outcomes in the form of key performance indicators featured in the ongoing
evaluation of ROS. ROI was a targeted objective at the project design phase, and this was reflected in
the evaluation processes. ROS, like all similar projects, was subjected to a Benefits Realisation Report
which is presented to the business side of the project to look at realised benefits or not, as the case may
be. If ROS was to be a success and if the KPIs were to be met, the entire project was dependent on
uptake. This update required behavioural change and some considerable effort from end-users of the
system. Therefore, customer-centricity was placed at the heart of the ROS project from the
development of the strategy, through project design to its evaluation. Primary research continued as
part of the ongoing and formalised process for evaluating ROS. This research used customer surveys
and evaluations to continue to develop and improve the system.
193
4.4.5.3 D2 – Attitudinal Changes
This category contained data relevant to the extent to which research participants believed that
attitudes from all stakeholders had changed over the life of the ROS project. Their responses were
coded to two sub-themes as follows:
No Change
General Acceptance
4.4.5.3.1 No Change
Because there was little hostility toward ROS at the outset of the project, there was no discernible
attitudinal change by stakeholders to the project as articulated by the research participants:
Hmm… I wouldn’t have thought there was a change in our view on ROS over that ten-
year period, because I would still view it as being an extension of our ICT capability and
the application of ICT to business processes. We still, and what we have done is, we have
helped our citizens to do these things online. Just like we have helped our staff to do them
with applications before, so the processes exist within the organisation and we have
helped our staff to do these with applications. Once the Internet came, we helped our
citizens with applications, so we don’t really see them as changing.
Participant 8
4.4.5.3.2 General Acceptance
Despite some changes to work practices, there was general acceptance that ROS was the way of the
future:
And to get our auditors to accept it, because as part of the whole consultation and the
change, we completely changed that Income Tax Return and the Corporate Tax Return to
incorporate an amount of the accounts, a part of the accounts. That was a huge change, so
auditors no longer had the full set of accounts they were used to. All right, so that took
quite a while to convince them that they didn’t have to print off the return, they were not
going to see the return as they did see it before, it’s in HTML, it looks very different and
very boring and if you go to Court to prosecute, we have to give you the electronic
envelope and you have to learn how to interpret the electronic envelope. So they were
challenges, and this is where Revenue have, now, straight away, you are an inspector, you
are auditing your case and you have to see it through.
Participant 10
That has, again from the learning, from the different projects, knowing what can be done
and knowing the way, seeing the impact. ROS had a large impact on the internal
customers rather than say it was freeing up resources here, and seeing the way that the six
and a half thousand people in Revenue embrace the change that brought.
Participant 16
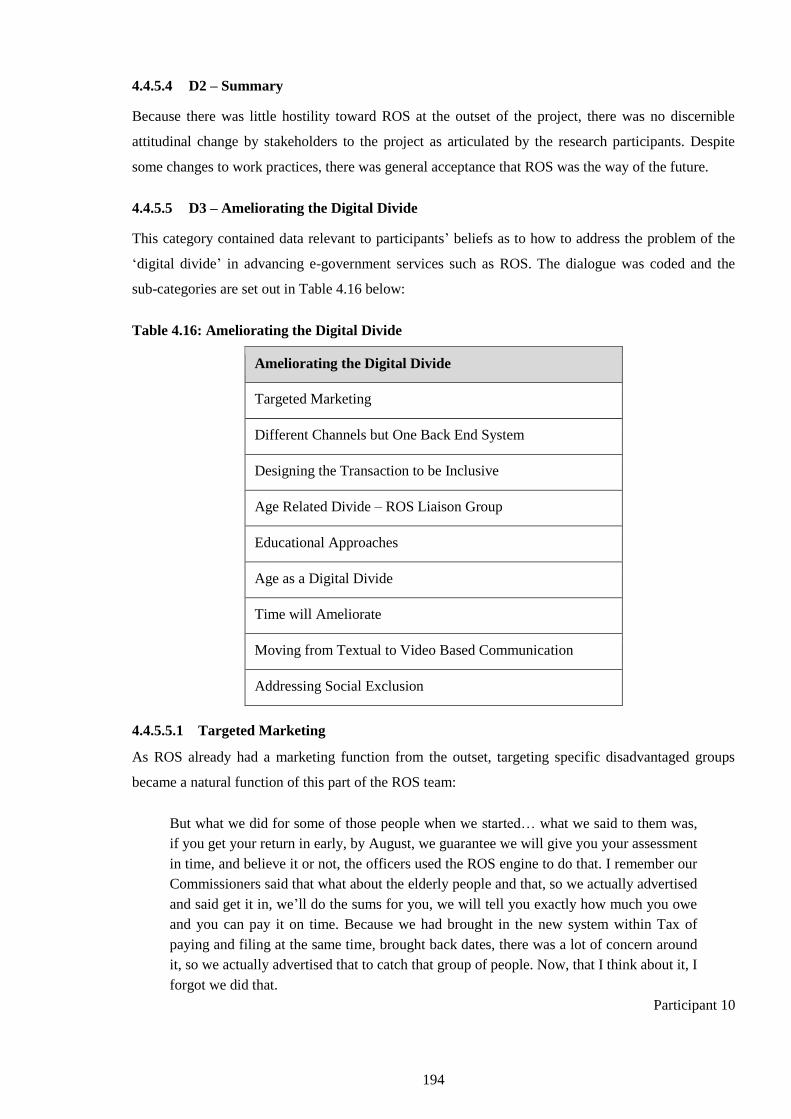
194
4.4.5.4 D2 – Summary
Because there was little hostility toward ROS at the outset of the project, there was no discernible
attitudinal change by stakeholders to the project as articulated by the research participants. Despite
some changes to work practices, there was general acceptance that ROS was the way of the future.
4.4.5.5 D3 – Ameliorating the Digital Divide
This category contained data relevant to participants’ beliefs as to how to address the problem of the
‘digital divide’ in advancing e-government services such as ROS. The dialogue was coded and the
sub-categories are set out in Table 4.16 below:
Table 4.16: Ameliorating the Digital Divide
Ameliorating the Digital Divide
Targeted Marketing
Different Channels but One Back End System
Designing the Transaction to be Inclusive
Age Related Divide – ROS Liaison Group
Educational Approaches
Age as a Digital Divide
Time will Ameliorate
Moving from Textual to Video Based Communication
Addressing Social Exclusion
4.4.5.5.1 Targeted Marketing
As ROS already had a marketing function from the outset, targeting specific disadvantaged groups
became a natural function of this part of the ROS team:
But what we did for some of those people when we started… what we said to them was,
if you get your return in early, by August, we guarantee we will give you your assessment
in time, and believe it or not, the officers used the ROS engine to do that. I remember our
Commissioners said that what about the elderly people and that, so we actually advertised
and said get it in, we’ll do the sums for you, we will tell you exactly how much you owe
and you can pay it on time. Because we had brought in the new system within Tax of
paying and filing at the same time, brought back dates, there was a lot of concern around
it, so we actually advertised that to catch that group of people. Now, that I think about it, I
forgot we did that.
Participant 10
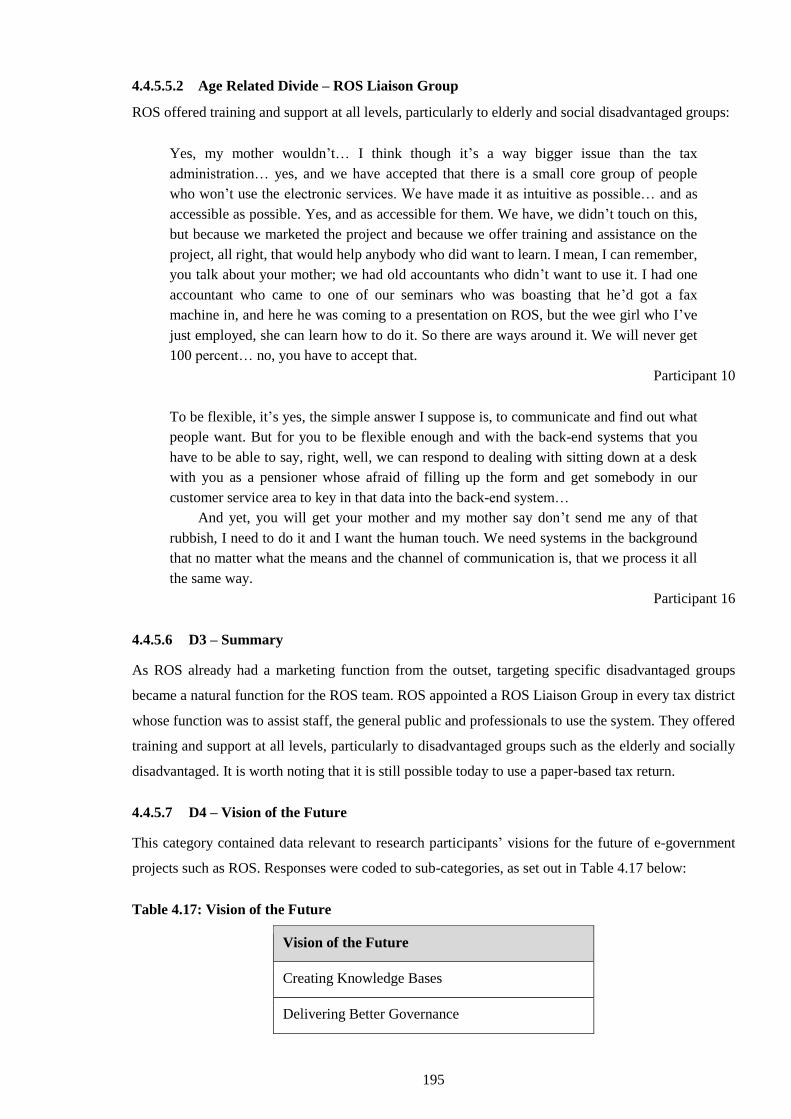
195
4.4.5.5.2 Age Related Divide – ROS Liaison Group
ROS offered training and support at all levels, particularly to elderly and social disadvantaged groups:
Yes, my mother wouldn’t… I think though it’s a way bigger issue than the tax
administration… yes, and we have accepted that there is a small core group of people
who won’t use the electronic services. We have made it as intuitive as possible… and as
accessible as possible. Yes, and as accessible for them. We have, we didn’t touch on this,
but because we marketed the project and because we offer training and assistance on the
project, all right, that would help anybody who did want to learn. I mean, I can remember,
you talk about your mother; we had old accountants who didn’t want to use it. I had one
accountant who came to one of our seminars who was boasting that he’d got a fax
machine in, and here he was coming to a presentation on ROS, but the wee girl who I’ve
just employed, she can learn how to do it. So there are ways around it. We will never get
100 percent… no, you have to accept that.
Participant 10
To be flexible, it’s yes, the simple answer I suppose is, to communicate and find out what
people want. But for you to be flexible enough and with the back-end systems that you
have to be able to say, right, well, we can respond to dealing with sitting down at a desk
with you as a pensioner whose afraid of filling up the form and get somebody in our
customer service area to key in that data into the back-end system…
And yet, you will get your mother and my mother say don’t send me any of that
rubbish, I need to do it and I want the human touch. We need systems in the background
that no matter what the means and the channel of communication is, that we process it all
the same way.
Participant 16
4.4.5.6 D3 – Summary
As ROS already had a marketing function from the outset, targeting specific disadvantaged groups
became a natural function for the ROS team. ROS appointed a ROS Liaison Group in every tax district
whose function was to assist staff, the general public and professionals to use the system. They offered
training and support at all levels, particularly to disadvantaged groups such as the elderly and socially
disadvantaged. It is worth noting that it is still possible today to use a paper-based tax return.
4.4.5.7 D4 – Vision of the Future
This category contained data relevant to research participants’ visions for the future of e-government
projects such as ROS. Responses were coded to sub-categories, as set out in Table 4.17 below:
Table 4.17: Vision of the Future
Vision of the Future
Creating Knowledge Bases
Delivering Better Governance
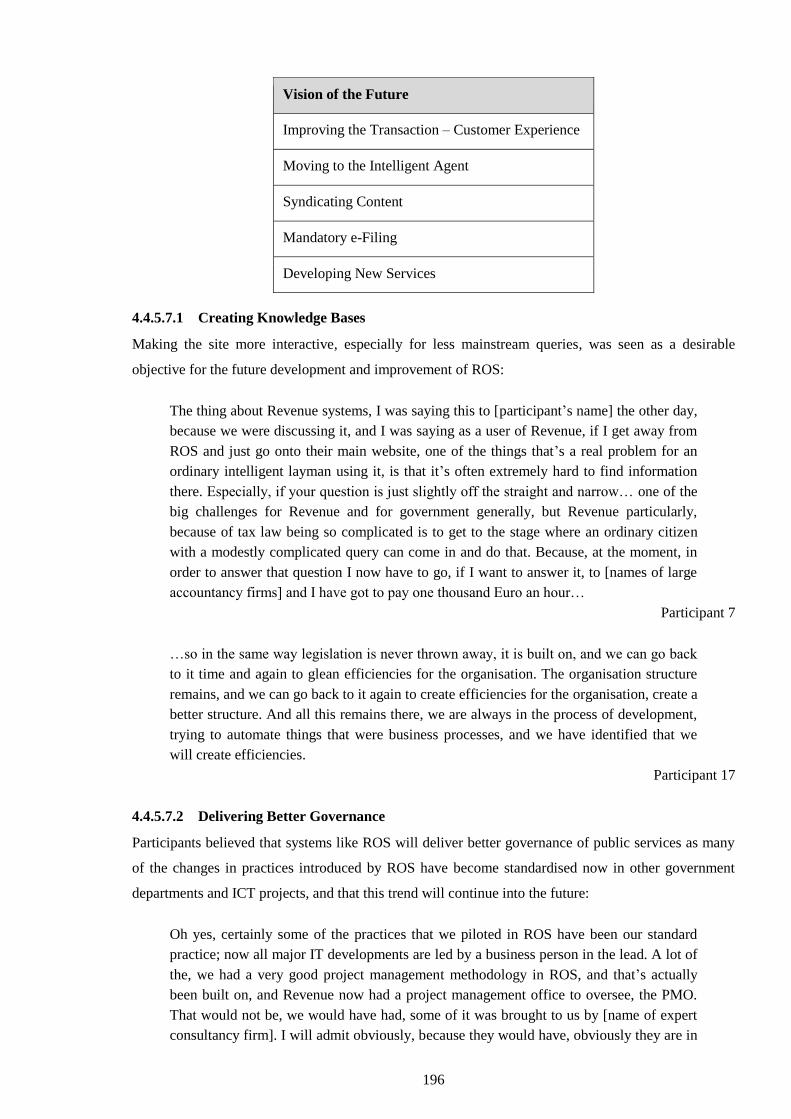
196
Vision of the Future
Improving the Transaction – Customer Experience
Moving to the Intelligent Agent
Syndicating Content
Mandatory e-Filing
Developing New Services
4.4.5.7.1 Creating Knowledge Bases
Making the site more interactive, especially for less mainstream queries, was seen as a desirable
objective for the future development and improvement of ROS:
The thing about Revenue systems, I was saying this to [participant’s name] the other day,
because we were discussing it, and I was saying as a user of Revenue, if I get away from
ROS and just go onto their main website, one of the things that’s a real problem for an
ordinary intelligent layman using it, is that it’s often extremely hard to find information
there. Especially, if your question is just slightly off the straight and narrow… one of the
big challenges for Revenue and for government generally, but Revenue particularly,
because of tax law being so complicated is to get to the stage where an ordinary citizen
with a modestly complicated query can come in and do that. Because, at the moment, in
order to answer that question I now have to go, if I want to answer it, to [names of large
accountancy firms] and I have got to pay one thousand Euro an hour…
Participant 7
…so in the same way legislation is never thrown away, it is built on, and we can go back
to it time and again to glean efficiencies for the organisation. The organisation structure
remains, and we can go back to it again to create efficiencies for the organisation, create a
better structure. And all this remains there, we are always in the process of development,
trying to automate things that were business processes, and we have identified that we
will create efficiencies.
Participant 17
4.4.5.7.2 Delivering Better Governance
Participants believed that systems like ROS will deliver better governance of public services as many
of the changes in practices introduced by ROS have become standardised now in other government
departments and ICT projects, and that this trend will continue into the future:
Oh yes, certainly some of the practices that we piloted in ROS have been our standard
practice; now all major IT developments are led by a business person in the lead. A lot of
the, we had a very good project management methodology in ROS, and that’s actually
been built on, and Revenue now had a project management office to oversee, the PMO.
That would not be, we would have had, some of it was brought to us by [name of expert
consultancy firm]. I will admit obviously, because they would have, obviously they are in
197
the business; and we adapted them and brought them out into a wider usage within
Revenue.
Participant 10
It needs to be seen in context, but at the time we were the first ones doing this, so a lot of
questions of why we were doing it, it was proving the way for hopefully other
government departments to follow. Some did, some didn’t; some tried and there was a
different other mix of their customer base.
Participant 16
4.4.5.7.3 Improving the Transaction – Customer Experience
Participants believed that as technologies improved, opportunities for greater sophistication at the back
end would afford greater simplification at the front end resulting in improvements for the transactions:
But now ROS is just part of mainstream Revenue. But now, we are actually going to roll
out a new service next year for the construction sector. Yes, and here we are back again
because we are not doing the IT side of it this time, but we are going to be doing the
change management and the roll out, we are going to be off again, yes, and it’s exciting.
Participant 10
Okay. Well, initially, as I’ve said, Revenues are always very progressive with their
systems. I remember the first PC we got back in 1989 or somewhere like that and we
knew… we could see the advantages of having technology for dealing with large pieces
of information, being able to serve our customers. We’ve developed the technology all of
the time, even at the moment now when you ring an office and you give us your tax
number, even before it gets to talk to an individual, they have your record in front of
them. You know? It’s all of this. All of their systems…
Participant 18
4.4.5.7.4 Moving to the Intelligent Agent
Participants further believed that much greater automation would be possible in the future using
various forms of intelligent agents:
Now, I would see the next generation of e-government as far as the consumer is
concerned, and we leave aside internal matters, but as far as the citizen is concerned, we
will move increasingly to the intelligent agent. Whereby, you ring up whatever
department it is, and most routine calls would be dealt with by computers who will talk to
you, who will be infinitely patient, who will be polite and who will be able to answer
your question… No, it is like an expert system. They need an artificial intelligent expert
system and the kind of thing that call centres are now using. Airline booking systems are
in the early stages of experimenting with this… and for many people it’s going to save
them money. The people at the end of the day who lose are the tax consultants who are
now not getting fees from people who can find the answer to questions.
Participant 7
198
4.4.5.8 D4 – Summary
Making the site more interactive especially for less mainstream queries was seen as a desirable
objective for future development of ROS. Participants believed that systems like ROS will deliver
better governance of public services as many of the changes in practices introduced by ROS have
become standardised now in other government departments and ICT projects, and that this trend will
continue into the future. Participants believed that as technologies improve, opportunities for greater
sophistication at the back end would afford greater simplification at the front end, resulting to
improvements to the transactions. Participants further believed that much greater automation would be
possible in the future using various forms of intelligent agents. Other visions of the future included
syndicating content, developing new services and mandatory e-filing.
4.5 Summary of Thematic Findings
4.5.1 Case Study 1
4.5.1.1 Project Design
The principal drivers for objectives in rolling out the Directgov project were general and non-specific
in nature. This was caused by poorly aligned and poorly defined strategies, particularly at the level of
central government, which in its turn propagated to government departments. Customer-centricity, set
out in the government’s strategic documents, was aspirational. However, the principal driver of
objectives remained as cost reduction. It was cited that this could be achieved through greater
efficiencies derived from the natural synergies that having a single web portal would produce. Other
general drivers of objectives included ideas about being modern and using the latest technologies. No
key informants cited the wider reform of service delivery by government as either an objective of the
project or indeed a by-product of its successful implementation. There was a clear difference of
opinion between participants’ ideas as to what would drive objectives and ideas put forward in the
government’s published strategy document delivered to parliament in 2005, which cited reforming
public services, increasing customer-centricity and reducing costs (Cabinet Office, 2005). Participants
did aspire to improve customer-centricity and reduce costs, but did not believe that the project
objectives would include wider reform of public services.
The misaligned strategies identified generated cynicism amongst those responsible for crystallising the
wider environmental drivers of objectives into formulated objectives and success criteria for the
project. The project could not be part of wider government reform as the structural prerequisites for
successfully changing attitudes, beliefs, culture and behaviours across government departments were
not in place. Even at this point in the Directgov project’s existence, the first of the three objectives of
the 2005 Transformational Government: Enabled by Technology Strategy (Cabinet Office, 2005) as
stated, “(1) The transformation of public services for the benefit of citizens, businesses, taxpayers and
front-line staff” was clearly unfeasible to those responsible for delivering the project. It is noteworthy
that as the project’s objective formulation moved from general to specific, customer-centricity was lost
199
along the way. The debate was now focused objectively on strategic misalignment between central
government and its departments.
The principal objectives of the Directgov project as articulated by the research participants were to
save money and increase efficiency. Customer-centricity was a desirable by-product which would
result to some limited extent as a natural consequence of the former two main objectives. Nobody
believed the Directgov project would be fundamental to reforming public services as articulated in the
government’s strategic documents. Following government policy was narrowly cited as an objective
that would probably appear in all government funded projects in any case.
4.5.1.2 Project Implementation
A leadership failure at political and senior civil servant level resulted in a structural management
deficit whereby mission-critical cross-departmental cooperation was not recognised in its importance,
and hence the requisite management structures were not put in place. This resulted in adverse
outcomes for the implementation of the Directgov project. Essential pillars to underpin the project
such as finance were not secured, and the consequences of this strategic level failure impacted on
almost every aspect of the project’s implementation.
Technology did not present as problematic to participants in delivering the project. Participants
believed they had good competencies in this regard, and in general that technology could serve as an
enabler. However, there were concerns about working in a risk-averse culture whilst at the same time
worrying about the level of responsibilities placed on participants’ shoulders amidst concerns
regarding the consequences for them, and for Directgov, should the project fail. Some frustrations
were voiced in connection with the capabilities for change and the pace of such changes, along with
the difficulty of forecasting future technological advances.
4.5.1.3 Project Evaluation
Given the lack of leadership at the strategic level planning stage of the Directgov project and its
consequences for implementing the project, it is hardly surprising that the processes for evaluating the
success or otherwise of the Directgov implementation suffered. In the absence of a structural
architecture, namely cross-departmental authority and cooperation, there was no possibility of having
the measuring capacity to conduct even the most basic evaluations of success. Incidentally, the single
most cited problem with evaluating Directgov was access to information. Participants advised that
they had created their own Key Performance Indicators (KPIs) to try and evaluate their project.
Government bodies were adept at producing reports and identifying gaps in the project’s ability to
deliver but there was little evidence of these reports being converted into actions. This phenomenon of
knowing what to do but not doing it, was expressed by one key informant as the ‘knowing-doing gap’.
Government bodies were certainly adept at producing reports and identifying gaps in the project’s
ability to deliver, but there was little evidence of these reports being converted into actions. Despite
200
the absence of specific metrics in evaluating Directgov, some crude efforts were made to measure
return on investment (ROI). There were also some independent case studies carried out on the
Directgov website. However, in the absence of a cross-departmental management structure,
channelling the outcomes of such studies can be no more than informal, and ad hoc. Independent case
studies can be valuable from a user perspective but the information systems deficit already identified
restricts the efficacy of any independent report. Collecting customer information to be parsed and
analysed as part of a formal evaluation system only featured in what could be described as an
elementary capacity. Despite Directgov being a transactional website, there were not many
mechanisms in place to record transactional information for evaluation purposes. In the absence of a
formal cross-departmental information flow and the requisite management structure to act on the
information received, evaluations were ad hoc, subjective, with inconsistent and sometimes
inappropriate KPIs used, which were occasionally consistent with confirmation bias.
Participants believed that there was now a more general acceptance that technologies such as
Directgov were going to continue to develop. However, there was still a significant number of people
who would not move over to digital services, at least at the point of delivery. Participants further
postulated that there was now a belief system in place in government departments that Directgov
needed to exist. Participants also believed that for at least another generation, there would still be a
significant cohort of customers who for a variety of reasons will not be able to use web-based services
exclusively. Wider social issues such as literacy, inability to use technology and access to technology,
are examples of such social exclusion problems which would act as a barrier to digitising services.
However, participants suggested that, by using different channels such as libraries and Post Offices,
customers could use intermediaries to access a common back-end system which would still facilitate a
high degree of automation from the point of delivery. Other approaches included education and age-
specific solutions which will decrease in necessity over time, to addressing wider social exclusion
issues.
Finally, participants believed that greater systems integration is desirable and inevitable. However, it
would require a greater degree of cross-departmental planning and management to achieve systems’
integration commensurate with aligning common processes. Participants did not underestimate the
scale of the task of integrating services but nevertheless, recognised that from the public’s perspective,
it would be a desirable vision for the future and the technology could play a key role in enabling it.
4.5.2 Case Study 2
4.5.2.1 Project Design
A key evolutionary driver of the ROS project was a need within Revenue to greatly increase efficiency
and effectiveness. Up to this point, all of its work was conducted manually on paper by Revenue staff.
ROS would fundamentally reform how the processes themselves would be conducted into the future.
201
ROS was seen as creating a need to reform current processes to make them more efficient and
effective, rather than the reform coming as a consequence of ROS.
Marketing ROS both internally and externally was seen as a critical success factor if targets for uptake
were to be met. The fact that ROS formed part of a wider governmental reform policy assisted
champions of ROS to cut through procedural impediments that sometimes delay expensive projects.
Improving customer service influenced the formulation of objectives for ROS. Another enabler of
objectives was that Revenue already had a culture of computerisation which fed into its own strategies,
and which in turn fitted within a broader governmental set of strategies for ICT in delivering public
services. Whereas participants clearly articulated the benefits of having a strategy in the first instance,
they discerned differences between having a strategy and one that was clearly defined and fit for
purpose. Political considerations were also drivers of the evolution of objectives for ROS. Other key
drivers of objectives were soft immeasurable drivers such as equity, accessibility and fairness,
developing a flexible ICT architecture to support future needs, and external pressures from journalist
commentators and expert commissions.
The term ‘value for money’ is ingrained in the Irish public service parlance. The Comptroller and
Auditor General regularly carries out value for money audits. Value for money has a broader
definition than cost saving and involves every aspect of the service; from best practice in procurement,
through to HR functions such as staffing levels and customer satisfaction. Prior to ROS, there already
existed a strong culture of ensuring value for money in the Revenue Commissioners, not least because
both the Comptroller and Auditor General and the Revenue Commissioners are run by the Department
of Finance. So it was not surprising that value for money was a driver of objective formulation in the
ROS project. Key performance indicators (KPIs) were used under the broader umbrella of value for
money for specific targets for the ROS project. There was ample evidence in the data, that citizen-
centricity was an active agent in formulating objectives and success criteria. It was recognised from
the outset that the project could not succeed if the citizen did not engage fully, hence this was a critical
success factor. Security clearly featured as a major driver of objectives formulation and success
criteria. Additionally, return on investment (ROI) was central to the process of formulating objectives
and success criteria for ROS.
Having the right business case and visionary leaders on the business side of the project was a critical
component in formulating objectives and success criteria for ROS. This is evidenced by the fact that
right to date the overall project leaders are always from the business side in Revenue ICT projects. Of
equal importance to having visionary people with business leadership qualities in the team was having
visionary people on the technology side. The ROS team became known as the ‘Dream Team’ a label
which has stuck to the present day.
Other key drivers for formulating objectives and success criteria included: releasing resources, having
top-down leadership, being responsive to changing business and political needs, consulting with
202
professional bodies, having civil servants on board who ‘know the game; and could secure finance.
Finally, identifying and partnering with the right third-party software providers. Participants were
satisfied that the final objectives that were identified for ROS were entirely consistent with the needs
of the project and indeed with the wider governmental strategy that the stated objectives were
formulated to underpin.
4.5.2.2 Project Implementation
Participants articulated that ongoing testing and evaluation was a feature in the early stages of the
project. The project governance was cited as meeting best international practice, and participants had
no concerns around this area. A dedicated team was put in place, and was physically removed from
Revenue, free to develop ROS from both the business and technological perspectives. The ‘Dream
Team’ used ongoing testing and evaluations during the initial build and testing of the system. Other
requisite implementation processes included top-down leadership and legislative changes that were
passed through Parliament to support the project; having change management processes and business
processes re-engineering in place before the project was launched so new work practices were already
firmly established when ROS was launched; and finally, having the requisite finance in place and
identifying appropriate software providers to avail the latest technologies especially in the security
arena.
Broadband was in its infancy at the time ROS was being rolled out. Having both online and offline
versions of the software available addressed connectivity or the lack of. Integrating front- and back-
end systems created challenges from the outset, and systems integration continues to be a challenge to
date. User identity created an important security challenge during the development of ROS and this
was resolved by introducing digital certificates. It was recognised early in the life of the ROS project
that a support help desk would be required to offer the level of customer-centricity required, to ensure
the project’s success. Another customer support instrument was the ROS Liaison Officer, who locally
trained people and could give direct training and support to users up to a certain level. Moreover, for
large customers, a dedicated help desk was set up, and on-site visits were made to provide specialist
support.
4.5.2.3 Project Evaluation
Specific measurable outcomes in the form of key performance indicators featured in the ongoing
evaluation of ROS. ROI was a targeted objective at the project design phase and this was reflected in
the evaluation processes. ROS, like all similar projects was subjected to a Benefits Realisation Report
which is presented to the business side of the project to look at realised benefits or not, as the case may
be. If ROS was to be a success and if the KPIs were to be met, the entire project was dependent on
uptake. This update required behavioural change and some considerable effort from end-users of the
system. Therefore, customer-centricity was placed at the heart of the ROS project from the
development of the strategy, through project design to its evaluation. Primary research continued as
203
part of the ongoing and formalised process for evaluating ROS. This research used customer surveys
and evaluations to continue to develop and improve the system.
Due to the fact that there was little hostility toward ROS at the outset of the project, there was no
discernible attitudinal change by stakeholders to the project as articulated by the research participants.
Despite some changes to work practices, there was general acceptance that ROS was the way of the
future.
As ROS already had a marketing function from the outset, targeting specific disadvantaged groups
became a natural function for the ROS team. ROS appointed a ROS Liaison Group in every tax district
whose function was to assist staff, the general public and professionals to use the system. They offered
training and support at all levels, particularly to disadvantaged groups such as the elderly and socially
disadvantaged. It is worth noting that it is still possible today to use a paper-based tax return.
Making the site more interactive especially for less mainstream queries was seen as a desirable
objective for future development of ROS. Participants believed that systems like ROS will deliver
better governance of public services as many of the changes in practices introduced by ROS have
become standardised now in other government departments and ICT projects, and that this trend will
continue into the future. Participants believed that as technologies improved, opportunities for greater
sophistication at the back end would afford greater simplification at the front end, resulting in
improvements to the transactions. Participants further believed that much greater automation would be
possible in the future using various forms of intelligent agents. Other visions of the future included
syndicating content, developing new services and mandatory e-filing.
4.6 Summary
This chapter used two cases to describe the challenges faced by e-government initiatives that are
intended to facilitate efficient and effective service delivery and meet citizens’ expectations. The
descriptions are structured under the four key themes identified in the literature depicting the life-cycle
and cross-life-cycle issues that emerge during the successful implementation of e-government projects.
Following the analytical strategy and coding framework as stated in the methodology chapter and
outlined in Appendix 7, these themes were further coded and broken down into sub-themes that
transpired by merging common and unique codes into a single framework for analysis.
The two cases have also been used to analyse the participants’ responses and reflections on the
challenges faced by e-government initiatives with reference to two purportedly successful
e-government projects in the UK and the Republic of Ireland respectively. These challenges would be
summarised and further analysed in the following chapter, which aims to extend this analysis, by
comparing and contrasting the issues identified, alongside the project cross-life-cycle issues that
emerged in the literature.
204
CHAPTER 5: CROSS–CASE ANALYSIS
5.1 Introduction
In the preceding chapter the two cases were analysed through the themes identified in the conceptual
framework which drives this research. This chapter will consider similarities and differences between
the cases, by exploring participants’ responses and reflections on the challenges faced by
e-government initiatives during the life-cycle of the said projects. With the intention to evaluate the
relevance of these existing themes identified in the literature, their views will be compared and
contrasted, using cross-case analysis with the aim of producing recommendations. The analysis in this
chapter is conducted in two stages. Firstly, the cross-case analysis key issues that emerge are identified
and examined. Furthermore, the cross-life-cycle issues that emerge from the conceptual framework are
explored in the light of the literature, seeking answers to the research question and subsidiary
questions posed at the outset.
5.2 Cross–Case Analysis
In case-oriented research, commonalities across multiple instances of a phenomenon may contribute to
conditional generalisations (Miles & Huberman, 1994). Furthermore, multiple-case designs allow for
cross-case analysis and the extension of theory, yielding more general results, and thus, establishing
external validity. These designs could be used when “the intent of the research is description, theory
building, or theory testing” (Benbasat et al., 1987, p. 373). Two cross-case analysis methods are
deliberated by Yin (1981), which are the case-survey and the case-comparison approaches. With
regard to the former approach, Yin (1981) argues that in developing a general explanation or theory,
one should not tabulate the case studies, which are units of analysis, making an analogy to
experiments. He postulates that although the case-comparison approach has not been sufficiently
documented to produce a specific set of guidelines, it is likely to prove more fruitful for cross-case
analysis. In the case-comparison approach, when the lessons from each case study are compared, a
common explanation should emerge, which would then be used to characterise the issues or
challenges. The key to good cross-case analysis according to Eisenhardt (1989) is to become
intimately familiar with each case, allowing the unique patterns to emerge respectively before pushing
for generalisations across the cases.
This research follows the case-comparison approach as recommended by Yin (1981), since the case-
survey requires a large number of cases, treating case studies as if they were data points allowing for
statistical inference (Remenyi et al., 1998). The aim by following the case-comparison approach in
this research is to develop a degree of analytical generalisability of the findings, and add confidence to
the researcher through the examination of similar and contrasting cases. To avoid possible pitfalls of
thin generalisations as cautioned by Miles & Huberman (1994), the case descriptions were provided
by organising the data under the key themes and sub-themes that emerged, following the analytical
205
strategy and coding framework as specified in the methodology chapter. Hence each case was
analysed distinctly, as demonstrated in the previous chapter, before allowing comparison of the cases.
5.3 Cross–Case Analysis Issues
5.3.1 Project Similarities
Both projects had the following elements in common:
They were both e-government projects
They were both generally deemed to be a success
They both involved new technologies
They both impacted on the business processes that the project portal supported
Though somehow similar, the projects also had their differences, outlined in the following section.
5.3.2 Project Differences
It is important to note at the outset that when comparing the cases, the projects differed in two
fundamental areas, such as the nature and the scale of the projects, contrasted and discussed below.
5.3.2.1 Nature of Project
Directgov demanded cross-departmental cooperation in all respects from aligning strategies through to
design and work practices, and to implementation and evaluation. By contrast, ROS involved just one
government department, Finance, which is the most powerful department in the Republic of Ireland.
All stakeholders saw ROS as desirable; from politicians such as ministers in the Cabinet, to the
Department of Finance and on down to the Revenue Commissioners, and out into the public arena,
which initially just meant the business community. Everybody commented on ROS as essentially a
good thing and there was no resistance to it. This was not the case with Directgov as the findings from
the in-case analysis suggest.
5.3.2.2 Scale of the Project
The Directgov website attracted over thirty million visitors a month in its peak, while the entire
population of Ireland is five million. Clearly, there is an immense difference in scale for these two
projects, both from a business and technical perspective. Furthermore, Directgov was intended to serve
as the UK government’s portal, whilst ROS intended to facilitate the provision of online tax services
only.
5.3.3 Method of Comparison
The cross-case analysis phase involved merging common and unique codes into a single framework
for analysis. This process of managing codes involved merging the codes into more researcher-led
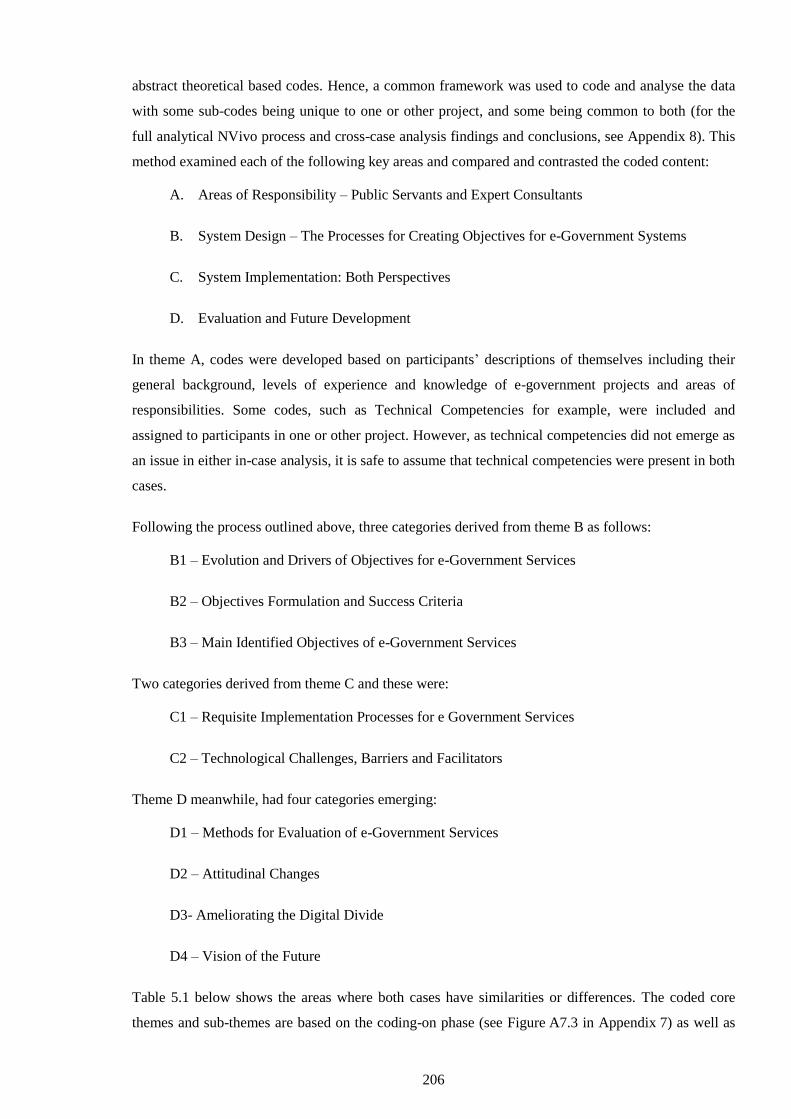
206
abstract theoretical based codes. Hence, a common framework was used to code and analyse the data
with some sub-codes being unique to one or other project, and some being common to both (for the
full analytical NVivo process and cross-case analysis findings and conclusions, see Appendix 8). This
method examined each of the following key areas and compared and contrasted the coded content:
A. Areas of Responsibility – Public Servants and Expert Consultants
B. System Design – The Processes for Creating Objectives for e-Government Systems
C. System Implementation: Both Perspectives
D. Evaluation and Future Development
In theme A, codes were developed based on participants’ descriptions of themselves including their
general background, levels of experience and knowledge of e-government projects and areas of
responsibilities. Some codes, such as Technical Competencies for example, were included and
assigned to participants in one or other project. However, as technical competencies did not emerge as
an issue in either in-case analysis, it is safe to assume that technical competencies were present in both
cases.
Following the process outlined above, three categories derived from theme B as follows:
B1 – Evolution and Drivers of Objectives for e-Government Services
B2 – Objectives Formulation and Success Criteria
B3 – Main Identified Objectives of e-Government Services
Two categories derived from theme C and these were:
C1 – Requisite Implementation Processes for e Government Services
C2 – Technological Challenges, Barriers and Facilitators
Theme D meanwhile, had four categories emerging:
D1 – Methods for Evaluation of e-Government Services
D2 – Attitudinal Changes
D3- Ameliorating the Digital Divide
D4 – Vision of the Future
Table 5.1 below shows the areas where both cases have similarities or differences. The coded core
themes and sub-themes are based on the coding-on phase (see Figure A7.3 in Appendix 7) as well as
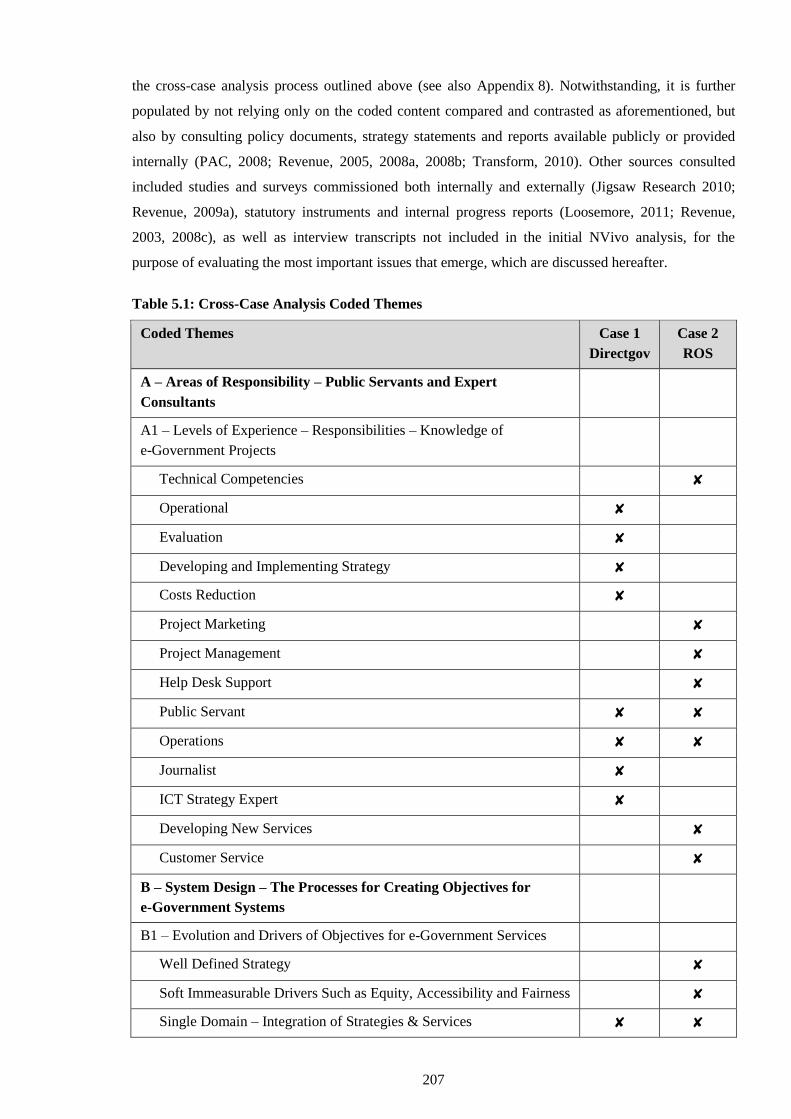
207
the cross-case analysis process outlined above (see also Appendix 8). Notwithstanding, it is further
populated by not relying only on the coded content compared and contrasted as aforementioned, but
also by consulting policy documents, strategy statements and reports available publicly or provided
internally (PAC, 2008; Revenue, 2005, 2008a, 2008b; Transform, 2010). Other sources consulted
included studies and surveys commissioned both internally and externally (Jigsaw Research 2010;
Revenue, 2009a), statutory instruments and internal progress reports (Loosemore, 2011; Revenue,
2003, 2008c), as well as interview transcripts not included in the initial NVivo analysis, for the
purpose of evaluating the most important issues that emerge, which are discussed hereafter.
Table 5.1: Cross-Case Analysis Coded Themes
Coded Themes Case 1
Directgov
Case 2
ROS
A – Areas of Responsibility – Public Servants and Expert
Consultants
A1 – Levels of Experience – Responsibilities – Knowledge of
e-Government Projects
Technical Competencies ✘
Operational ✘
Evaluation ✘
Developing and Implementing Strategy ✘
Costs Reduction ✘
Project Marketing ✘
Project Management ✘
Help Desk Support ✘
Public Servant ✘ ✘
Operations ✘ ✘
Journalist ✘
ICT Strategy Expert ✘
Developing New Services ✘
Customer Service ✘
B – System Design – The Processes for Creating Objectives for
e-Government Systems
B1 – Evolution and Drivers of Objectives for e-Government Services
Well Defined Strategy ✘
Soft Immeasurable Drivers Such as Equity, Accessibility and Fairness ✘
Single Domain – Integration of Strategies & Services ✘ ✘
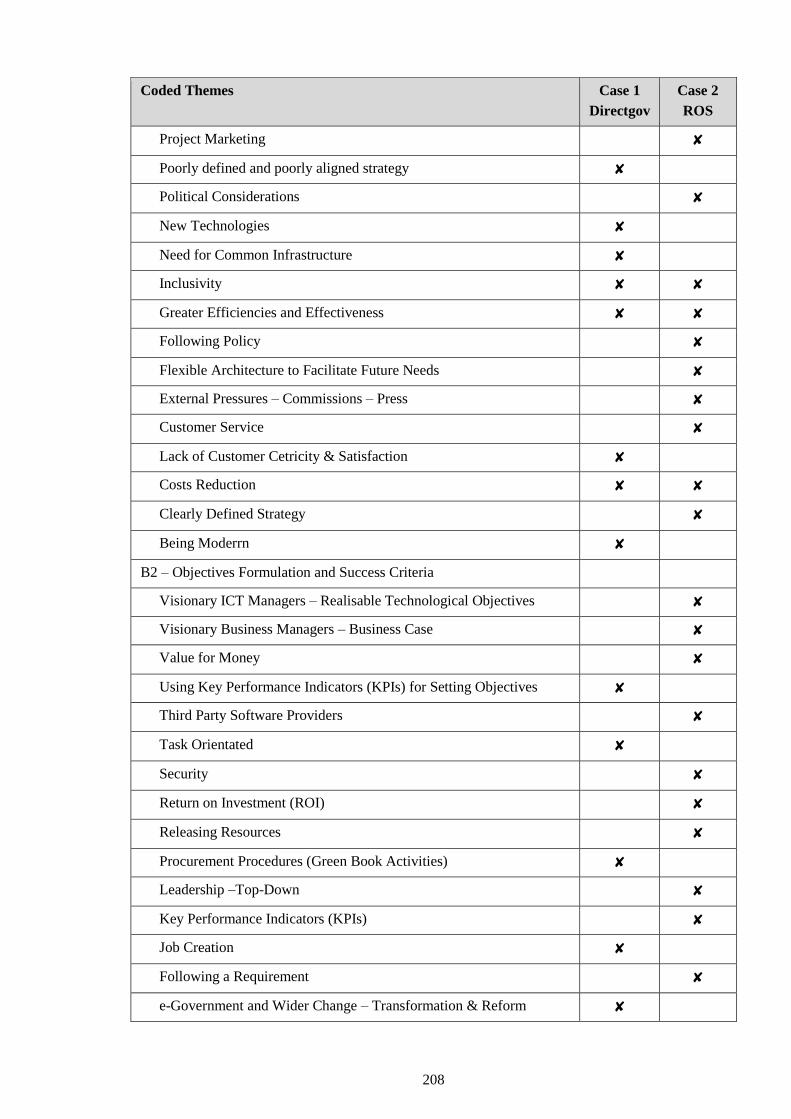
208
Coded Themes Case 1
Directgov
Case 2
ROS
Project Marketing ✘
Poorly defined and poorly aligned strategy ✘
Political Considerations ✘
New Technologies ✘
Need for Common Infrastructure ✘
Inclusivity ✘ ✘
Greater Efficiencies and Effectiveness ✘ ✘
Following Policy ✘
Flexible Architecture to Facilitate Future Needs ✘
External Pressures – Commissions – Press ✘
Customer Service ✘
Lack of Customer Cetricity & Satisfaction ✘
Costs Reduction ✘ ✘
Clearly Defined Strategy ✘
Being Moderrn ✘
B2 – Objectives Formulation and Success Criteria
Visionary ICT Managers – Realisable Technological Objectives ✘
Visionary Business Managers – Business Case ✘
Value for Money ✘
Using Key Performance Indicators (KPIs) for Setting Objectives ✘
Third Party Software Providers ✘
Task Orientated ✘
Security ✘
Return on Investment (ROI) ✘
Releasing Resources ✘
Procurement Procedures (Green Book Activities) ✘
Leadership –Top-Down ✘
Key Performance Indicators (KPIs) ✘
Job Creation ✘
Following a Requirement ✘
e-Government and Wider Change – Transformation & Reform ✘
209
Coded Themes Case 1
Directgov
Case 2
ROS
Delivering within Budget ✘
Consultation with Professional Bodies ✘
Civil Servants who Know the Game – Getting Finance ✘
Citizen-Centricity ✘
Changing Business Needs & External Environment ✘
Changing Business Environment ✘
C – Project Timelines ✘
B – Technical Drivers ✘
A – Functional Requirements ✘
Buisiness Cases ✘
Building Traffic ✘
Building Capacity ✘
Aligning Strategies ✘
B3 – Main Identified Objectives of e-Government Services
Value for Money ✘
Security ✘
Return on Investment (ROI) ✘
Reform Public Services ✘
Key Performance Indicators (KPIs) ✘
Increase Efficiencies ✘ ✘
Increase Customer-Centricity ✘ ✘
Facilitate Cost Saving ✘
Delivering on Policy ✘
C – System Implementation
C1 – Requisite Implementation Process for e-Government Services
Treasury Approval ✘
Top-Down Leadership ✘ ✘
The Dream Team ✘
Strong Management Structures ✘
Security ✘
Project Management Methodologies ✘ ✘
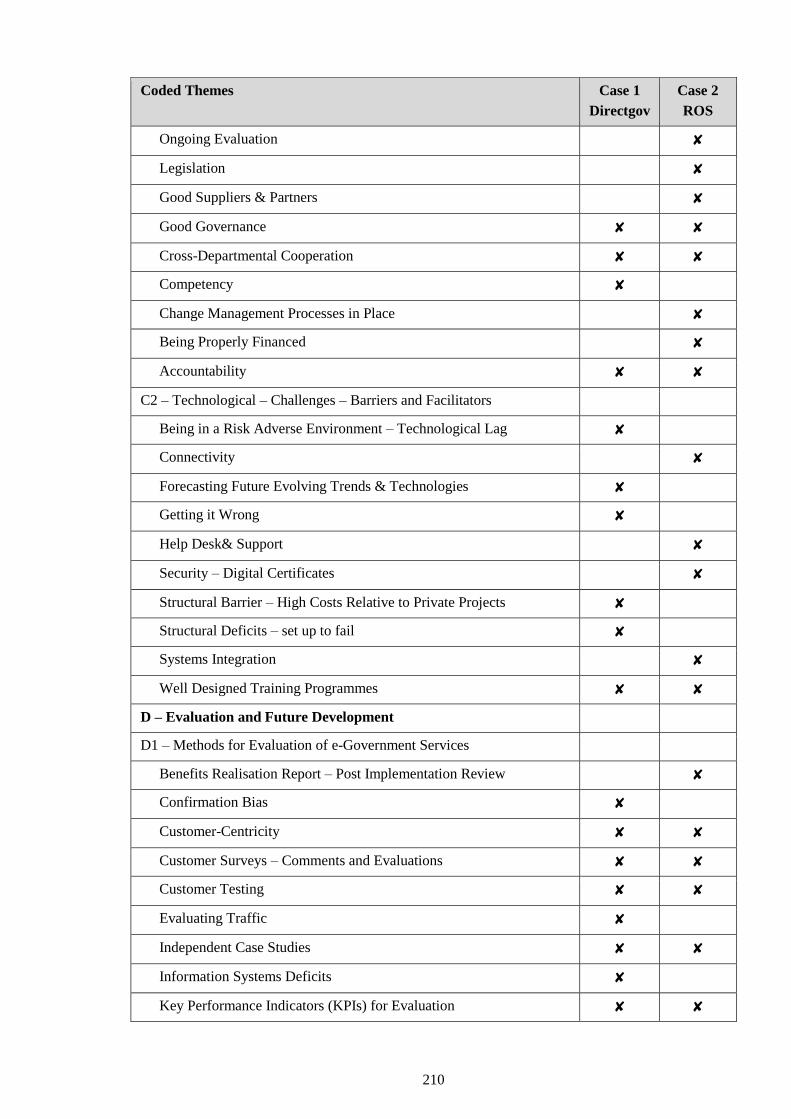
210
Coded Themes Case 1
Directgov
Case 2
ROS
Ongoing Evaluation ✘
Legislation ✘
Good Suppliers & Partners ✘
Good Governance ✘ ✘
Cross-Departmental Cooperation ✘ ✘
Competency ✘
Change Management Processes in Place ✘
Being Properly Financed ✘
Accountability ✘ ✘
C2 – Technological – Challenges – Barriers and Facilitators
Being in a Risk Adverse Environment – Technological Lag ✘
Connectivity ✘
Forecasting Future Evolving Trends & Technologies ✘
Getting it Wrong ✘
Help Desk& Support ✘
Security – Digital Certificates ✘
Structural Barrier – High Costs Relative to Private Projects ✘
Structural Deficits – set up to fail ✘
Systems Integration ✘
Well Designed Training Programmes ✘ ✘
D – Evaluation and Future Development
D1 – Methods for Evaluation of e-Government Services
Benefits Realisation Report – Post Implementation Review ✘
Confirmation Bias ✘
Customer-Centricity ✘ ✘
Customer Surveys – Comments and Evaluations ✘ ✘
Customer Testing ✘ ✘
Evaluating Traffic ✘
Independent Case Studies ✘ ✘
Information Systems Deficits ✘
Key Performance Indicators (KPIs) for Evaluation ✘ ✘
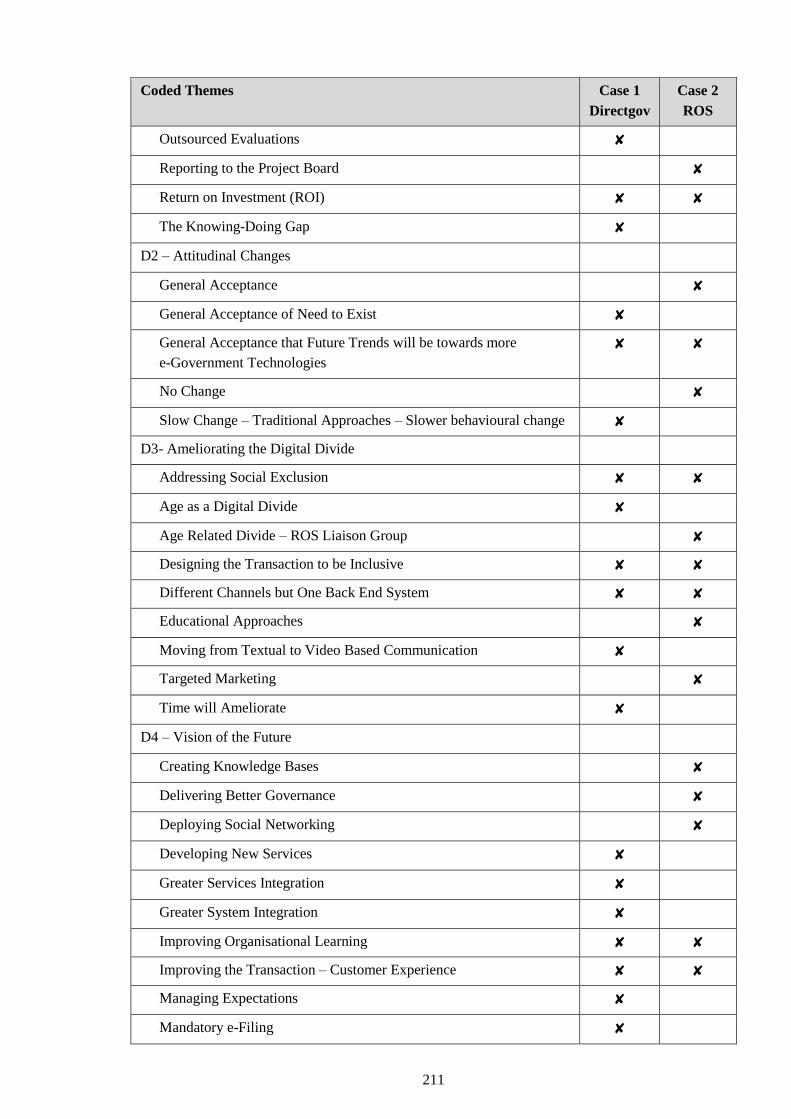
211
Coded Themes Case 1
Directgov
Case 2
ROS
Outsourced Evaluations ✘
Reporting to the Project Board ✘
Return on Investment (ROI) ✘ ✘
The Knowing-Doing Gap ✘
D2 – Attitudinal Changes
General Acceptance ✘
General Acceptance of Need to Exist ✘
General Acceptance that Future Trends will be towards more
e-Government Technologies
✘ ✘
No Change ✘
Slow Change – Traditional Approaches – Slower behavioural change ✘
D3- Ameliorating the Digital Divide
Addressing Social Exclusion ✘ ✘
Age as a Digital Divide ✘
Age Related Divide – ROS Liaison Group ✘
Designing the Transaction to be Inclusive ✘ ✘
Different Channels but One Back End System ✘ ✘
Educational Approaches ✘
Moving from Textual to Video Based Communication ✘
Targeted Marketing ✘
Time will Ameliorate ✘
D4 – Vision of the Future
Creating Knowledge Bases ✘
Delivering Better Governance ✘
Deploying Social Networking ✘
Developing New Services ✘
Greater Services Integration ✘
Greater System Integration ✘
Improving Organisational Learning ✘ ✘
Improving the Transaction – Customer Experience ✘ ✘
Managing Expectations ✘
Mandatory e-Filing ✘
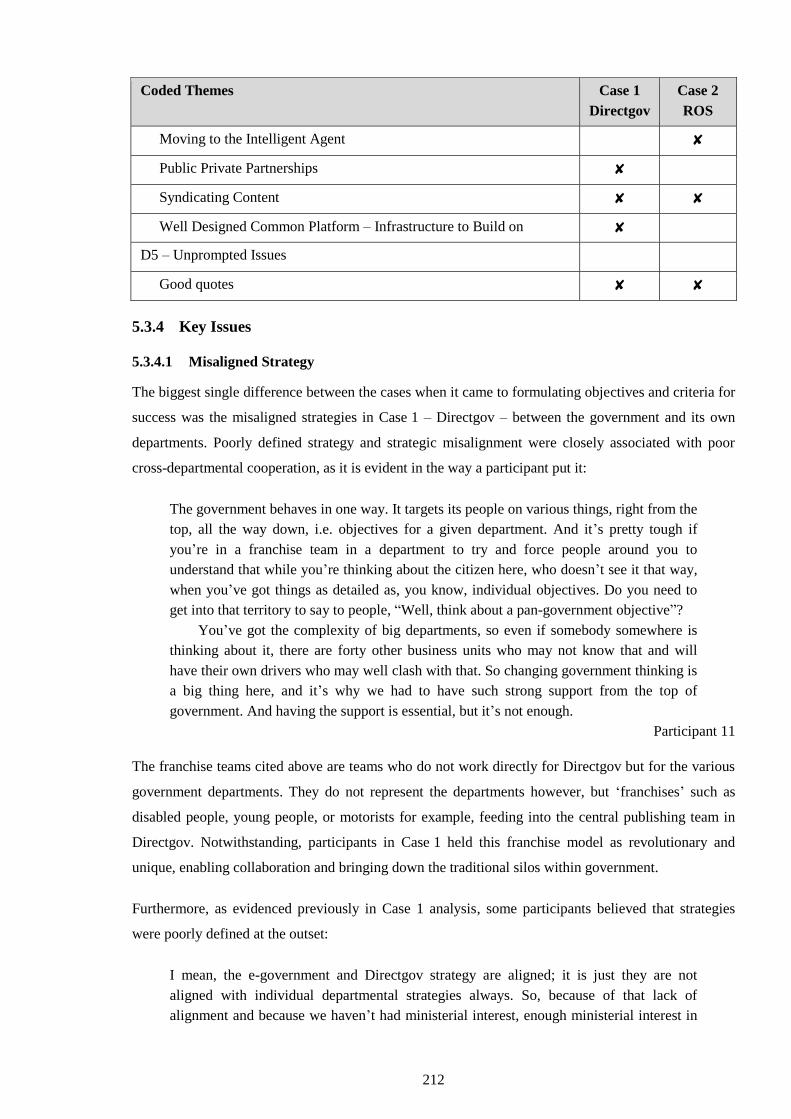
212
Coded Themes Case 1
Directgov
Case 2
ROS
Moving to the Intelligent Agent ✘
Public Private Partnerships ✘
Syndicating Content ✘ ✘
Well Designed Common Platform – Infrastructure to Build on ✘
D5 – Unprompted Issues
Good quotes ✘ ✘
5.3.4 Key Issues
5.3.4.1 Misaligned Strategy
The biggest single difference between the cases when it came to formulating objectives and criteria for
success was the misaligned strategies in Case 1 – Directgov – between the government and its own
departments. Poorly defined strategy and strategic misalignment were closely associated with poor
cross-departmental cooperation, as it is evident in the way a participant put it:
The government behaves in one way. It targets its people on various things, right from the
top, all the way down, i.e. objectives for a given department. And it’s pretty tough if
you’re in a franchise team in a department to try and force people around you to
understand that while you’re thinking about the citizen here, who doesn’t see it that way,
when you’ve got things as detailed as, you know, individual objectives. Do you need to
get into that territory to say to people, “Well, think about a pan-government objective”?
You’ve got the complexity of big departments, so even if somebody somewhere is
thinking about it, there are forty other business units who may not know that and will
have their own drivers who may well clash with that. So changing government thinking is
a big thing here, and it’s why we had to have such strong support from the top of
government. And having the support is essential, but it’s not enough.
Participant 11
The franchise teams cited above are teams who do not work directly for Directgov but for the various
government departments. They do not represent the departments however, but ‘franchises’ such as
disabled people, young people, or motorists for example, feeding into the central publishing team in
Directgov. Notwithstanding, participants in Case 1 held this franchise model as revolutionary and
unique, enabling collaboration and bringing down the traditional silos within government.
Furthermore, as evidenced previously in Case 1 analysis, some participants believed that strategies
were poorly defined at the outset:
I mean, the e-government and Directgov strategy are aligned; it is just they are not
aligned with individual departmental strategies always. So, because of that lack of
alignment and because we haven’t had ministerial interest, enough ministerial interest in
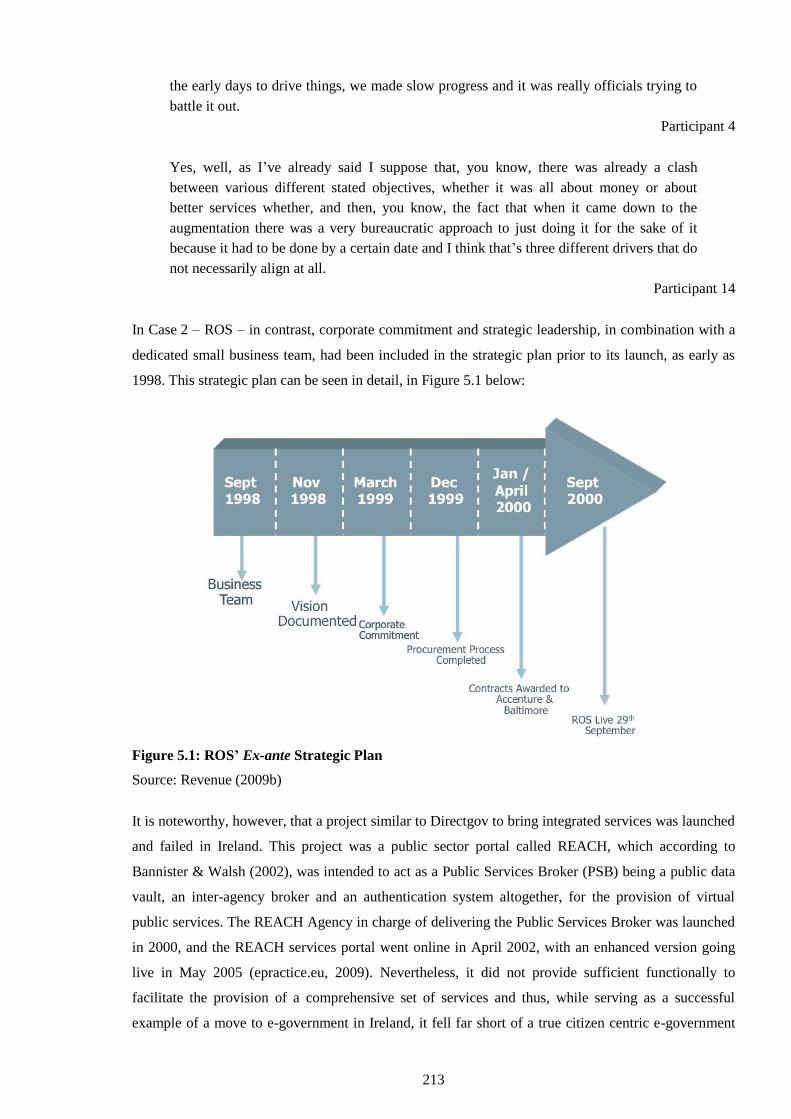
213
the early days to drive things, we made slow progress and it was really officials trying to
battle it out.
Participant 4
Yes, well, as I’ve already said I suppose that, you know, there was already a clash
between various different stated objectives, whether it was all about money or about
better services whether, and then, you know, the fact that when it came down to the
augmentation there was a very bureaucratic approach to just doing it for the sake of it
because it had to be done by a certain date and I think that’s three different drivers that do
not necessarily align at all.
Participant 14
In Case 2 – ROS – in contrast, corporate commitment and strategic leadership, in combination with a
dedicated small business team, had been included in the strategic plan prior to its launch, as early as
1998. This strategic plan can be seen in detail, in Figure 5.1 below:
Figure 5.1: ROS’ Ex-ante Strategic Plan
Source: Revenue (2009b)
It is noteworthy, however, that a project similar to Directgov to bring integrated services was launched
and failed in Ireland. This project was a public sector portal called REACH, which according to
Bannister & Walsh (2002), was intended to act as a Public Services Broker (PSB) being a public data
vault, an inter-agency broker and an authentication system altogether, for the provision of virtual
public services. The REACH Agency in charge of delivering the Public Services Broker was launched
in 2000, and the REACH services portal went online in April 2002, with an enhanced version going
live in May 2005 (epractice.eu, 2009). Nevertheless, it did not provide sufficient functionally to
facilitate the provision of a comprehensive set of services and thus, while serving as a successful
example of a move to e-government in Ireland, it fell far short of a true citizen centric e-government
214
platform ( Hughes et al., 2006). Moreover, the implementation strategy adopted by REACH was
reflective of traditional implementation models for e-government (see Layne & Lee, 2001), that reflect
a bias on technological issues to support web development and a lack of attention to stakeholder
concerns (Scott, Golden & Hughes, 2004). Local authorities for example, “only met once with
REACH and were not included by central government in the development of e-government strategy”
(Scott et al., 2004, p. 12). REACH has also been beset by management difficulties, in particular, the
management and performance of contractors with regard to software development issues. Most
importantly, lack of consultation, cross-departmental communication and collaboration issues, resulted
to its diminished credibility, which encouraged government departments and other public sector
bodies to develop parallel identification systems and portals (OECD, 2008). Hence, the REACH
initiative was discounted from being selected as the second case study for this research, since it had
already fallen by the wayside.
There is evidence in the data, which was not used in the in-case analysis as it was out of scope, which
suggests that cross-departmental cooperation was no more achievable in Ireland than it was in the
Directgov model. Attitudes amongst ROS participants have not changed in this regard, despite the
success of ROS:
As government departments became more e-aware I suppose, there was a proposal to
develop a single portal for all government agencies and government departments that was
called REACH and I saw it in. So, when we came to develop the services for PAYE, and
this would be in 2004/2005, we were encouraged to come under the portal umbrella they
were building and use it. We decided for the PAYE, we didn’t need the PKI security,
level of security, a lower level of security would suffice, and REACH were developing a
single authentication service to be used, the single one… in internal Revenue, it was
envisaged as being part of a wider government portal but we, it came back fully to
Revenue.
So, we went a long way down the road with them. They did deliver it; it was not, it
was, we were never fully comfortable with it, and eventually it was, because of other
issues with REACH, we went ahead and came back and developed our own
authentication service and REACH. REACH has subsequently fallen by the wayside; it’s
no longer there.
Participant 10
And you know, they wanted information to be provided on the interactive services,
integrated services; and they had, there was, they were going to have you know a public
service broker that was going to be reached, and they had this idea that it would be you
know, a portal into all e-government services. And that had some limited success and so
on, but the portal never really evolved…
Participant 9
5.3.4.2 Project Funding
Although funding was not an issue for Case 2, the lack of cross-departmental cooperation in Case 1
discussed above, resulted in difficulties to secure funding, especially as this was not put in place at the
215
strategic planning phase. Evidence suggests, however, that by the time implementation was underway,
the funding issue had been resolved in Case 1.
As discussed previously in the literature review, in Sir David Varney’s report to HM Treasury, Service
Transformation: A better service for citizens and businesses, a better deal for the taxpayer (Varney,
2006) a significant recommendation included the funding framework behind these super-sites in the
UK. Varney recognised that Directgov’s management spent an excessive amount of time on fund-
raising from other government departments which were also “nervous about migrating websites when
the overall viability and sustainability of Directgov looks unstable” (p. 50). The Service
Transformation Agreement that followed in 2007, focused inter alia on the efficiency savings of the
migration, the improvement of return on investment of IT projects, and the sharing of information
within and across departments (HM Treasury, 2007; Saxby, 2007b). Hence, since Directgov’s
inception, it took nearly two years to secure central government funding and obtain a mandate,
although some government departments bought into the idea of the project and became sponsors:
That was the way at that time and we hadn’t proven ourselves yet to be where the central
funding would come, so it was a test for us. So we set up the franchises, we had less
content obviously at that point, so we didn’t cover everything. But we had some good
sponsors in some of the departments who gave us not only the money, but the backing to
do it too. For example the Department for Transport (DfT) was very good, they said right,
we are going to use Directgov as their digital channel and that’s it.
…That was then I guess the key mid-point which was 2006, as you may know if you
read Sir Varney’s report, which gave us central funding and the mandate to converge
services and information on the website, so basically set out the fact that Directgov was
the front end to citizens.
Participant 21
Revenue on the other hand, was fortunate to be in a position to qualify for funding from an
Information Society Fund provided centrally by the Irish government to encourage departments to
embrace the Internet from the outset (Revenue, 2005). ROS continued to receive funding from this
source, in addition to funding directly from the Revenue budget. As outsourcing specialised skills was
required, adequate funding at the right time was crucial to the speedy delivery of the service.
However, in order to justify this funding, a clear benefits realisation model and a delivery timeline for
the benefits yielded was vital. Revenue has evolved a ‘project cookbook’ called the Revenue Delivery
Method, together with an experienced Programme Management Office (PMO) to advise on and
enforce the guidelines (Ryan, 2012).
5.3.4.3 Strategic and Visionary Leadership
Having top-down leadership in place was a key difference between the cases and in particular, the lack
of top-down leadership structures in the form of management controls being put in place at
government departmental level in Case 1. As it transpires from the evidence, leadership failure at
political and senior civil servant level resulted in a structural management deficit whereby mission-

216
critical cross-departmental cooperation was not recognised in its importance, and hence the requisite
management structures were not assigned. Directgov’s appointed Chief Executive Officer (CEO)
might have been responsible for the overall strategy and providing leadership, but there were
limitations:
I am responsible for Directgov; I am not responsible for other programmes other than to
make sure we are represented on them. But when we say Directgov, it is important to
understand what we mean by that, because there is Directgov the organisation and there is
Directgov the brand and the service. So, if we talk about the organisation, I am
responsible for the staff in the central team who run the Directgov service centrally. I also
provide leadership to the staff in franchises who work on Directgov content in
departments, but I don’t line manage them. The franchise staff are Directgov franchises,
but not line managed by me, however, I am responsible for the overall strategy to which
they are working towards.
Participant 4
Strategic planning was seriously impeded by the lack of securing funding from the outset as discussed
above, and as it transpires from the evidence. This in its turn wasted management’s time in trying to
negotiate with government departments and at the same time persuade their sponsors and senior level
ministerial backers:
Although it had endorsement from our ministerial committee at the time, it was the
ministerial committee who said, you know, their view was that if Directgov is going to be
a success and departments want it, then departments will fund it which worked for three
years but it involved an incredible amount of management time actually going round. So,
all our Chief Executive at that time did, was going round, talking to departments, trying
to get them to fund it – it was literally a full-time job. It made impossible to do any
forward strategic planning because you didn’t know what the funding is from one year to
the next and so on.
Participant 6
Moreover, strategic planning along with project continuity was impacted by a high turnover rate at
senior civil servant level and a change of administration at political level, resulting in changes to
policies and practices:
…you know, there’s a lot of turnover in senior management in government. There’s sort
of… and every time somebody leaves you know, you have to go around the same loop
again and of course any time there’s change in the administration, that happened and it’s
happened big time. Obviously the last twelve months. I think you have to start again. You
know? So why are you doing this? And, you know, there’s a…but, even when you don’t
have a change in administration, you know, there’s government, so-called zero-based
review.
Participant 13
217
Forward planning at strategic level and vision also go together, and government is learning or trying to
learn from the private sector, notwithstanding that the risk-averse culture environment it operates in is
a serious impediment:
Three or four years ago, as part of a senior delegation I went to Google, we talked to
Google, and a senior member of our team asked the chief exec of Google where he
thought the Internet would be in three years’ time. And he said he didn’t know in three
months’ time, let alone three years’ time. And where you think in terms of years, but
actually the more nimble, the industry think in terms of months, and so our strapline is
public services all in one place. Now five years ago, yes, one web but actually now the
public want it all over the place. Do you see how much time we’ve got to start moving
around slowly, so now Directgov is available on the mobile phone, but is that what we’re
expecting that in 2014, we’ll be getting more traffic on the mobile. Are we geared up for
that? How long is it going to take us to turn round to get that space? And then of course
you’ve got the Facebook presence or whatever. So we do tend to… obviously
governments are slower than a commercial organisation, so we’re trying to play catch up
in that sense, we have to be nimble.
Participant 12
These findings confirm issues identified in the literature, that the top five reasons for IT project failure
were “lack of user support and involvement, lack of properly defined project scope, lack of executive
management support and commitment, imprecise defined objectives and knowledge of the IT project,
and poor project management and leadership” (Standing et al., 2006, p. 1153). In fact, the ‘lack of
clear senior management and ministerial ownership and leadership’ was published by OGC as one of
the main reasons for high-profile public IT project failures, in its infamous list of ‘Common Causes of
Project Failure’ (OGC, 2007b).
For ROS on the other hand as discussed above, having the right business case and visionary leaders on
the business side of the project was a critical component in formulating objectives and success criteria
at strategic planning level. Furthermore, visionary leadership on the technological side of the project
was an equally important critical component. Another factor, which contributed to the success of ROS
was having senior civil servants on board who ‘knew the game’ and could secure finance, providing
support and commitment to the project:
Well, you see it’s hard to do things centrally. So if you have somebody, who like our
CEO or our CIO; our CIO has a view and a vision of what Revenue needs and he is the
only one that has that view and vision, apart from the chairman. But like if you go outside
the organisation, you really miss that view and vision. So to say what would be the
appropriate time to put this up, you know, if they had done that at this point you’d be in
that mess…
Participant 17
These people saw possibilities and evaluating these things, very often you make a case
and it’s an economic case and very often, you can rely on the fact that the game is played
218
in a way that the Department of Finance will approve the expenditure. So good civil
servants will learn how you play this game, how you put together an internal…
Participant 7
5.3.4.4 Dedicated In-house Development Team
Although ROS had from the outset its own in-house development team, which had become known as
the ‘Dream Team’, it took more than ten years and a lot of lessons learned for the UK government to
venture into something similar. This came in 2011, with the introduction of a new single prototype (or
Alpha) domain of the new UK government portal, GOV.UK, which eventually replaced Directgov.
The approach of the Government Digital Service (GDS) (that replaced the Directgov Agency) team
developing Alphagov was a cultural shock to central government as the bulk of the team was recruited
externally. Not only were there internal frictions, they were also received with suspicion and hostility
at first (Government Digital Service, 2011c). However there were others in government who saw this
positively and, despite sensing some arrogance by the externally-recruited developers, they watched
with fascination the GDS’s radical style: “the diverse people, the agile approach, the focus on delivery,
the excitement, the enthusiasm…” (Mather, 2012). Furthermore, the fact that the development was
carried out in-house, in contradiction to the government’s usual practice to outsource everything, was
hailed as a bold approach by GDS (Mather, 2012). This move had brought together incredible talent,
and by giving them the mandate and the financial backing they needed, the designers worked on an
approach they described as ‘government as a platform’, using open source code that others could build
upon.
It is worth noting however, that although Directgov had no in-house development team per se, the
people who worked for the Directgov Agency, including the participants who contributed to this
research, were enthusiastic, dedicated, and showed great resilience working through many
impediments throughout the lifetime of this project.
5.3.4.5 Embracing New Technologies
Another difference between the cases was their approach to embracing new technologies such as
social media, forecasting demand and scalability of systems, and providing user-friendly and intuitive
interfaces and services alike.
Although on the participation front, Directgov promoted public consultation by linking directly to the
online petitioning (e-petitions) section of the 10 Downing Street website, it did not offer e-voting or
any other form of interactivity or e-participation, nor had it embraced the latest Web 2.0 or social
networking technologies. Contrary to the service provision to both citizens and businesses, which had
been claimed to be successful, there had been little improvement to citizen engagement, input and
participation.
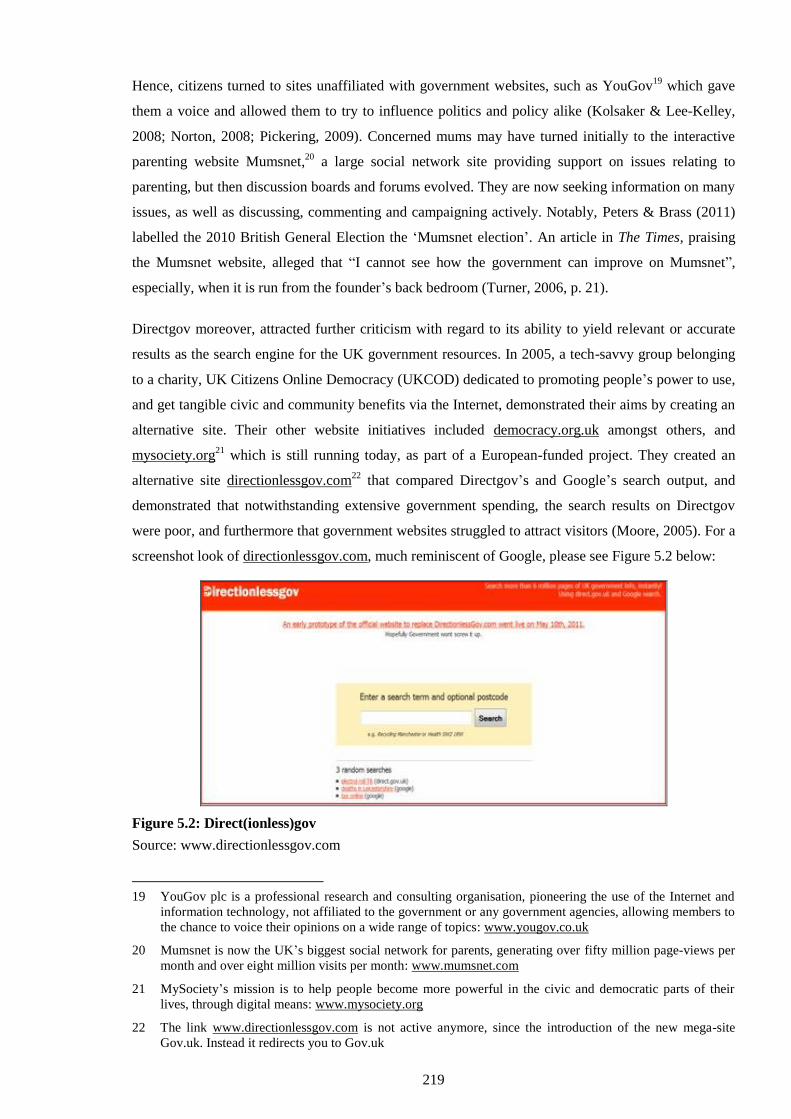
219
Hence, citizens turned to sites unaffiliated with government websites, such as YouGov19
which gave
them a voice and allowed them to try to influence politics and policy alike (Kolsaker & Lee-Kelley,
2008; Norton, 2008; Pickering, 2009). Concerned mums may have turned initially to the interactive
parenting website Mumsnet,20
a large social network site providing support on issues relating to
parenting, but then discussion boards and forums evolved. They are now seeking information on many
issues, as well as discussing, commenting and campaigning actively. Notably, Peters & Brass (2011)
labelled the 2010 British General Election the ‘Mumsnet election’. An article in The Times, praising
the Mumsnet website, alleged that “I cannot see how the government can improve on Mumsnet”,
especially, when it is run from the founder’s back bedroom (Turner, 2006, p. 21).
Directgov moreover, attracted further criticism with regard to its ability to yield relevant or accurate
results as the search engine for the UK government resources. In 2005, a tech-savvy group belonging
to a charity, UK Citizens Online Democracy (UKCOD) dedicated to promoting people’s power to use,
and get tangible civic and community benefits via the Internet, demonstrated their aims by creating an
alternative site. Their other website initiatives included democracy.org.uk amongst others, and
mysociety.org21
which is still running today, as part of a European-funded project. They created an
alternative site directionlessgov.com22
that compared Directgov’s and Google’s search output, and
demonstrated that notwithstanding extensive government spending, the search results on Directgov
were poor, and furthermore that government websites struggled to attract visitors (Moore, 2005). For a
screenshot look of directionlessgov.com, much reminiscent of Google, please see Figure 5.2 below:
Figure 5.2: Direct(ionless)gov
Source: www.directionlessgov.com
19 YouGov plc is a professional research and consulting organisation, pioneering the use of the Internet and
information technology, not affiliated to the government or any government agencies, allowing members to
the chance to voice their opinions on a wide range of topics: www.yougov.co.uk
20 Mumsnet is now the UK’s biggest social network for parents, generating over fifty million page-views per
month and over eight million visits per month: www.mumsnet.com
21 MySociety’s mission is to help people become more powerful in the civic and democratic parts of their
lives, through digital means: www.mysociety.org
22 The link www.directionlessgov.com is not active anymore, since the introduction of the new mega-site
Gov.uk. Instead it redirects you to Gov.uk
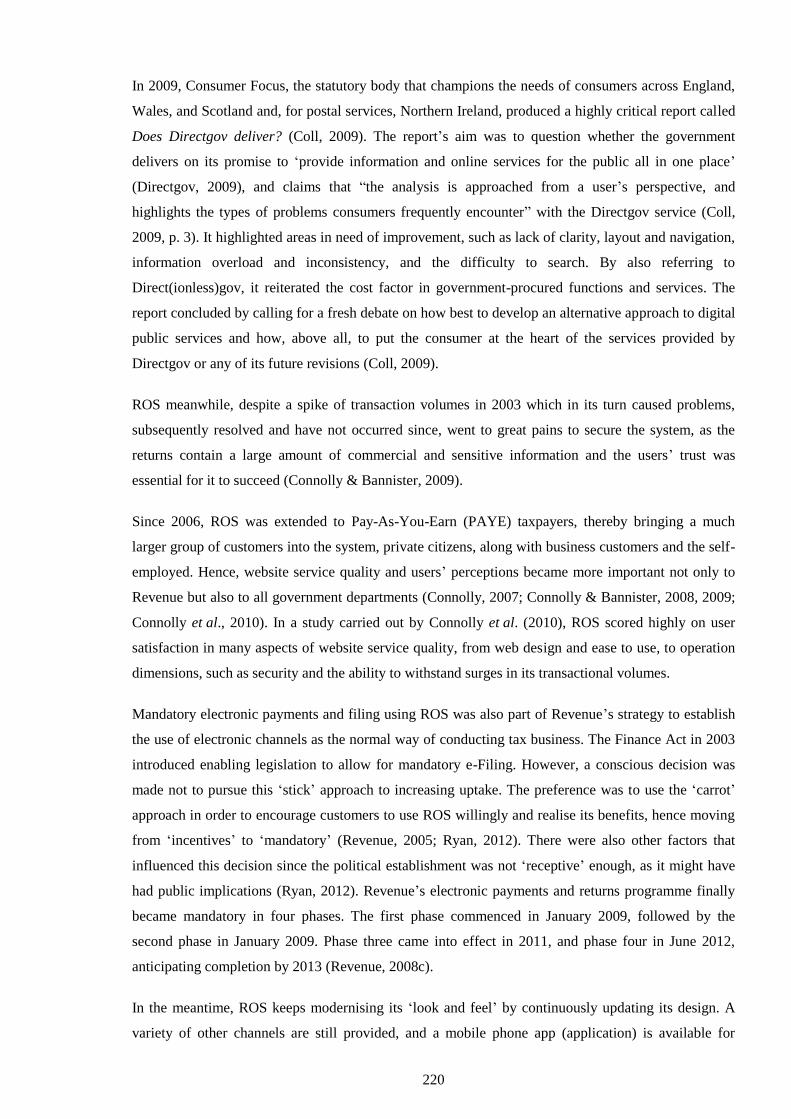
220
In 2009, Consumer Focus, the statutory body that champions the needs of consumers across England,
Wales, and Scotland and, for postal services, Northern Ireland, produced a highly critical report called
Does Directgov deliver? (Coll, 2009). The report’s aim was to question whether the government
delivers on its promise to ‘provide information and online services for the public all in one place’
(Directgov, 2009), and claims that “the analysis is approached from a user’s perspective, and
highlights the types of problems consumers frequently encounter” with the Directgov service (Coll,
2009, p. 3). It highlighted areas in need of improvement, such as lack of clarity, layout and navigation,
information overload and inconsistency, and the difficulty to search. By also referring to
Direct(ionless)gov, it reiterated the cost factor in government-procured functions and services. The
report concluded by calling for a fresh debate on how best to develop an alternative approach to digital
public services and how, above all, to put the consumer at the heart of the services provided by
Directgov or any of its future revisions (Coll, 2009).
ROS meanwhile, despite a spike of transaction volumes in 2003 which in its turn caused problems,
subsequently resolved and have not occurred since, went to great pains to secure the system, as the
returns contain a large amount of commercial and sensitive information and the users’ trust was
essential for it to succeed (Connolly & Bannister, 2009).
Since 2006, ROS was extended to Pay-As-You-Earn (PAYE) taxpayers, thereby bringing a much
larger group of customers into the system, private citizens, along with business customers and the self-
employed. Hence, website service quality and users’ perceptions became more important not only to
Revenue but also to all government departments (Connolly, 2007; Connolly & Bannister, 2008, 2009;
Connolly et al., 2010). In a study carried out by Connolly et al. (2010), ROS scored highly on user
satisfaction in many aspects of website service quality, from web design and ease to use, to operation
dimensions, such as security and the ability to withstand surges in its transactional volumes.
Mandatory electronic payments and filing using ROS was also part of Revenue’s strategy to establish
the use of electronic channels as the normal way of conducting tax business. The Finance Act in 2003
introduced enabling legislation to allow for mandatory e-Filing. However, a conscious decision was
made not to pursue this ‘stick’ approach to increasing uptake. The preference was to use the ‘carrot’
approach in order to encourage customers to use ROS willingly and realise its benefits, hence moving
from ‘incentives’ to ‘mandatory’ (Revenue, 2005; Ryan, 2012). There were also other factors that
influenced this decision since the political establishment was not ‘receptive’ enough, as it might have
had public implications (Ryan, 2012). Revenue’s electronic payments and returns programme finally
became mandatory in four phases. The first phase commenced in January 2009, followed by the
second phase in January 2009. Phase three came into effect in 2011, and phase four in June 2012,
anticipating completion by 2013 (Revenue, 2008c).
In the meantime, ROS keeps modernising its ‘look and feel’ by continuously updating its design. A
variety of other channels are still provided, and a mobile phone app (application) is available for
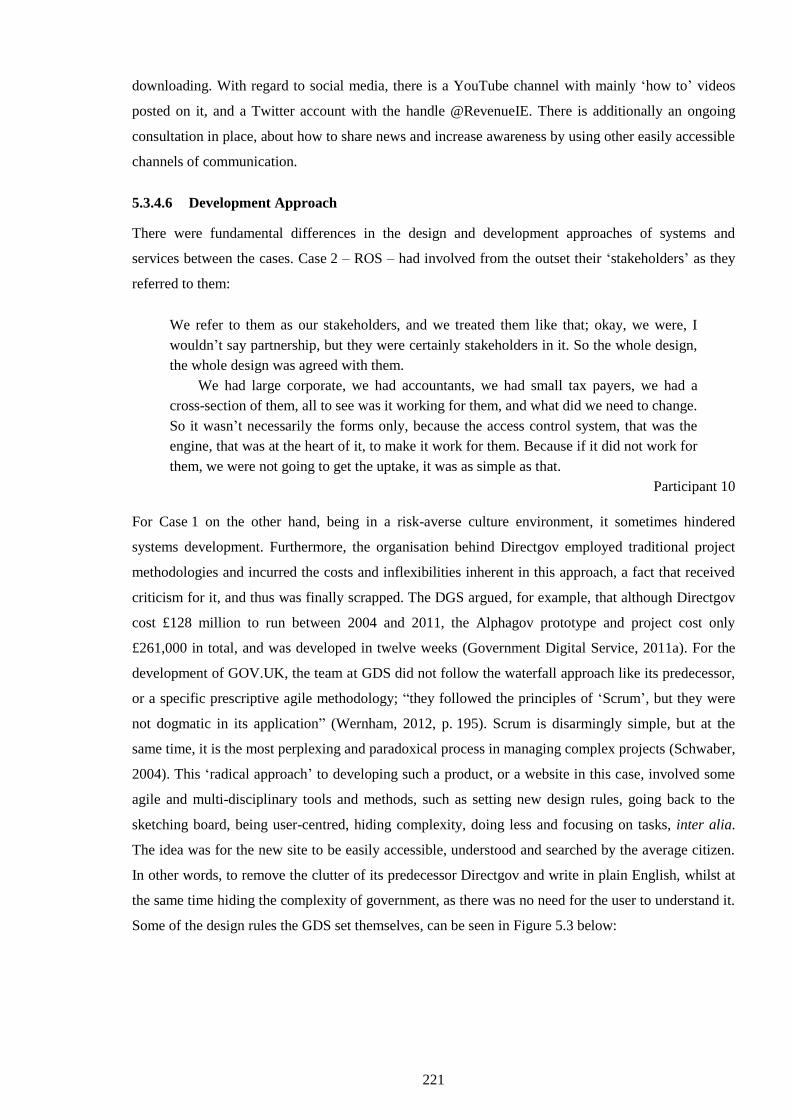
221
downloading. With regard to social media, there is a YouTube channel with mainly ‘how to’ videos
posted on it, and a Twitter account with the handle @RevenueIE. There is additionally an ongoing
consultation in place, about how to share news and increase awareness by using other easily accessible
channels of communication.
5.3.4.6 Development Approach
There were fundamental differences in the design and development approaches of systems and
services between the cases. Case 2 – ROS – had involved from the outset their ‘stakeholders’ as they
referred to them:
We refer to them as our stakeholders, and we treated them like that; okay, we were, I
wouldn’t say partnership, but they were certainly stakeholders in it. So the whole design,
the whole design was agreed with them.
We had large corporate, we had accountants, we had small tax payers, we had a
cross-section of them, all to see was it working for them, and what did we need to change.
So it wasn’t necessarily the forms only, because the access control system, that was the
engine, that was at the heart of it, to make it work for them. Because if it did not work for
them, we were not going to get the uptake, it was as simple as that.
Participant 10
For Case 1 on the other hand, being in a risk-averse culture environment, it sometimes hindered
systems development. Furthermore, the organisation behind Directgov employed traditional project
methodologies and incurred the costs and inflexibilities inherent in this approach, a fact that received
criticism for it, and thus was finally scrapped. The DGS argued, for example, that although Directgov
cost £128 million to run between 2004 and 2011, the Alphagov prototype and project cost only
£261,000 in total, and was developed in twelve weeks (Government Digital Service, 2011a). For the
development of GOV.UK, the team at GDS did not follow the waterfall approach like its predecessor,
or a specific prescriptive agile methodology; “they followed the principles of ‘Scrum’, but they were
not dogmatic in its application” (Wernham, 2012, p. 195). Scrum is disarmingly simple, but at the
same time, it is the most perplexing and paradoxical process in managing complex projects (Schwaber,
2004). This ‘radical approach’ to developing such a product, or a website in this case, involved some
agile and multi-disciplinary tools and methods, such as setting new design rules, going back to the
sketching board, being user-centred, hiding complexity, doing less and focusing on tasks, inter alia.
The idea was for the new site to be easily accessible, understood and searched by the average citizen.
In other words, to remove the clutter of its predecessor Directgov and write in plain English, whilst at
the same time hiding the complexity of government, as there was no need for the user to understand it.
Some of the design rules the GDS set themselves, can be seen in Figure 5.3 below:
222
Figure 5.3: Design Rules for Alpha.gov.uk
Source: Government Digital Service (2011b)
The designers of the new domain worked on an approach they described as ‘government as a
platform’, using open source code that others could build upon. The approach is endorsed by Tim
O’Reilly, founder and CEO of O’Reilly Media – one of the world’s most respected computer book
publishers and a proponent of ‘government as a platform’ and ‘open government’ (Lathrop & Ruma,
2010; O’Reilly, 2011). This approach in its turn underpinned the ‘digital by default’ strategy, to move
all public information services to digital delivery (National Audit Office, 2011a).
In addition, during Directgov’s and other IT projects’ development, users’ needs were not reflected in
the core part of the process and besides, have never been consulted (see Figure 5.4 below):
Figure 5.4: Old Development Process
Source: Government Digital Service (2013)
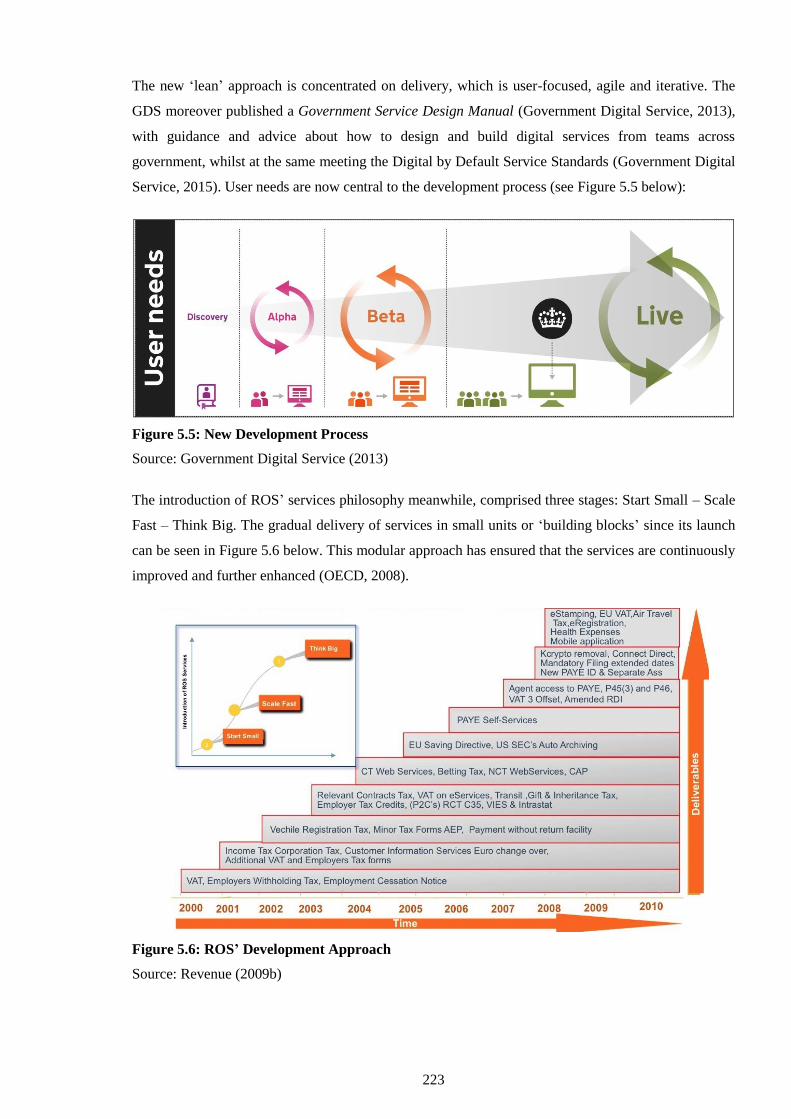
223
The new ‘lean’ approach is concentrated on delivery, which is user-focused, agile and iterative. The
GDS moreover published a Government Service Design Manual (Government Digital Service, 2013),
with guidance and advice about how to design and build digital services from teams across
government, whilst at the same meeting the Digital by Default Service Standards (Government Digital
Service, 2015). User needs are now central to the development process (see Figure 5.5 below):
Figure 5.5: New Development Process
Source: Government Digital Service (2013)
The introduction of ROS’ services philosophy meanwhile, comprised three stages: Start Small – Scale
Fast – Think Big. The gradual delivery of services in small units or ‘building blocks’ since its launch
can be seen in Figure 5.6 below. This modular approach has ensured that the services are continuously
improved and further enhanced (OECD, 2008).
Figure 5.6: ROS’ Development Approach
Source: Revenue (2009b)
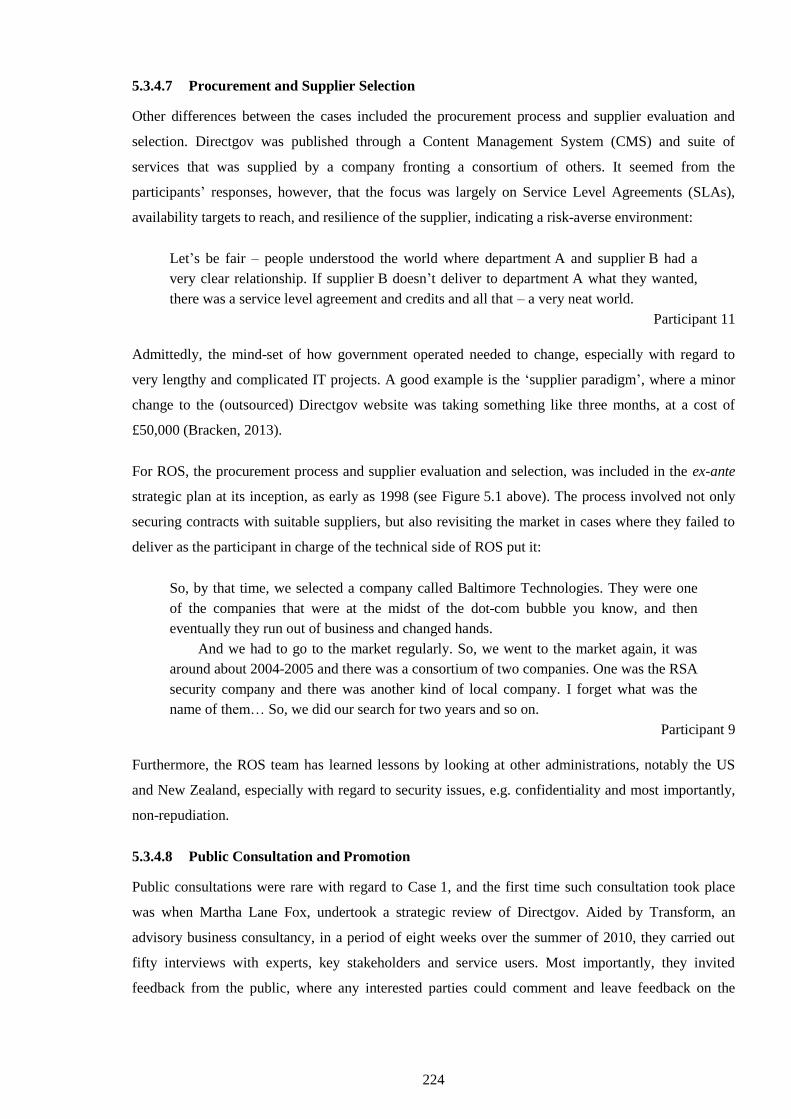
224
5.3.4.7 Procurement and Supplier Selection
Other differences between the cases included the procurement process and supplier evaluation and
selection. Directgov was published through a Content Management System (CMS) and suite of
services that was supplied by a company fronting a consortium of others. It seemed from the
participants’ responses, however, that the focus was largely on Service Level Agreements (SLAs),
availability targets to reach, and resilience of the supplier, indicating a risk-averse environment:
Let’s be fair – people understood the world where department A and supplier B had a
very clear relationship. If supplier B doesn’t deliver to department A what they wanted,
there was a service level agreement and credits and all that – a very neat world.
Participant 11
Admittedly, the mind-set of how government operated needed to change, especially with regard to
very lengthy and complicated IT projects. A good example is the ‘supplier paradigm’, where a minor
change to the (outsourced) Directgov website was taking something like three months, at a cost of
£50,000 (Bracken, 2013).
For ROS, the procurement process and supplier evaluation and selection, was included in the ex-ante
strategic plan at its inception, as early as 1998 (see Figure 5.1 above). The process involved not only
securing contracts with suitable suppliers, but also revisiting the market in cases where they failed to
deliver as the participant in charge of the technical side of ROS put it:
So, by that time, we selected a company called Baltimore Technologies. They were one
of the companies that were at the midst of the dot-com bubble you know, and then
eventually they run out of business and changed hands.
And we had to go to the market regularly. So, we went to the market again, it was
around about 2004-2005 and there was a consortium of two companies. One was the RSA
security company and there was another kind of local company. I forget what was the
name of them… So, we did our search for two years and so on.
Participant 9
Furthermore, the ROS team has learned lessons by looking at other administrations, notably the US
and New Zealand, especially with regard to security issues, e.g. confidentiality and most importantly,
non-repudiation.
5.3.4.8 Public Consultation and Promotion
Public consultations were rare with regard to Case 1, and the first time such consultation took place
was when Martha Lane Fox, undertook a strategic review of Directgov. Aided by Transform, an
advisory business consultancy, in a period of eight weeks over the summer of 2010, they carried out
fifty interviews with experts, key stakeholders and service users. Most importantly, they invited
feedback from the public, where any interested parties could comment and leave feedback on the
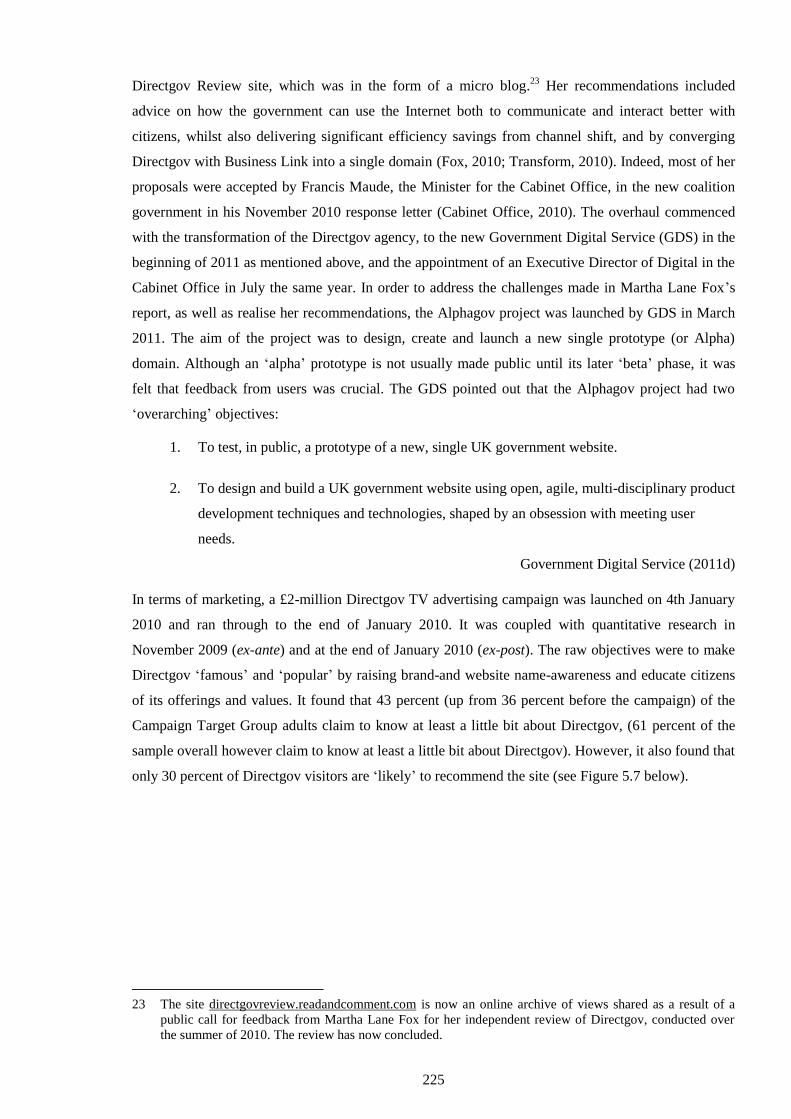
225
Directgov Review site, which was in the form of a micro blog.23
Her recommendations included
advice on how the government can use the Internet both to communicate and interact better with
citizens, whilst also delivering significant efficiency savings from channel shift, and by converging
Directgov with Business Link into a single domain (Fox, 2010; Transform, 2010). Indeed, most of her
proposals were accepted by Francis Maude, the Minister for the Cabinet Office, in the new coalition
government in his November 2010 response letter (Cabinet Office, 2010). The overhaul commenced
with the transformation of the Directgov agency, to the new Government Digital Service (GDS) in the
beginning of 2011 as mentioned above, and the appointment of an Executive Director of Digital in the
Cabinet Office in July the same year. In order to address the challenges made in Martha Lane Fox’s
report, as well as realise her recommendations, the Alphagov project was launched by GDS in March
2011. The aim of the project was to design, create and launch a new single prototype (or Alpha)
domain. Although an ‘alpha’ prototype is not usually made public until its later ‘beta’ phase, it was
felt that feedback from users was crucial. The GDS pointed out that the Alphagov project had two
‘overarching’ objectives:
1. To test, in public, a prototype of a new, single UK government website.
2. To design and build a UK government website using open, agile, multi-disciplinary product
development techniques and technologies, shaped by an obsession with meeting user
needs.
Government Digital Service (2011d)
In terms of marketing, a £2-million Directgov TV advertising campaign was launched on 4th January
2010 and ran through to the end of January 2010. It was coupled with quantitative research in
November 2009 (ex-ante) and at the end of January 2010 (ex-post). The raw objectives were to make
Directgov ‘famous’ and ‘popular’ by raising brand-and website name-awareness and educate citizens
of its offerings and values. It found that 43 percent (up from 36 percent before the campaign) of the
Campaign Target Group adults claim to know at least a little bit about Directgov, (61 percent of the
sample overall however claim to know at least a little bit about Directgov). However, it also found that
only 30 percent of Directgov visitors are ‘likely’ to recommend the site (see Figure 5.7 below).
23 The site directgovreview.readandcomment.com is now an online archive of views shared as a result of a
public call for feedback from Martha Lane Fox for her independent review of Directgov, conducted over
the summer of 2010. The review has now concluded.
226
Figure 5.7: Directgov TV Campaign Research Results
Source: Jigsaw Research (2010)
The explanation offered by the marketing agency that carried out the research was that, “there are
many reasons why people won’t recommend this kind of service to others that are not linked to their
satisfaction with it” (Jigsaw Research 2010, p. 26). Some of the reasons quoted were that at least two-
fifths feel that Directgov fulfils most criteria, although fewer than 45 percent agree that Directgov is
the nation’s official website, helps get things done and makes dealing with government easier. In
addition, although visitors perceived Directgov relatively well for being an official source,
comprehensive, helpful, up-to-date and accurate, they rated it slightly behind for looking modern and
for being easy to use (Jigsaw Research, 2010), which contradicts the marketing agency’s findings with
regard to satisfaction as cited above.
In the case of ROS, ongoing and effective consultation with both internal and external stakeholders,
such as business customers, tax agents and accounting professional bodies, resulted in a gradually
strengthening uptake over the years since its launch. On the other hand, even a monopoly like Revenue
needs marketing (Ryan, 2012). Hence, other factors that aided its uptake were user education provided
by using a ‘mobile training unit’ throughout the country, the utilisation of regional ROS Liaison
Officers and the positive view of the media, to mention a few. Figure 5.8 below shows the percentage
of timely filed Form 11s through ROS for the period 2001 to 2011. Form 11 is the Revenue’s
mandatory Income Tax Return form for self-employed individuals.
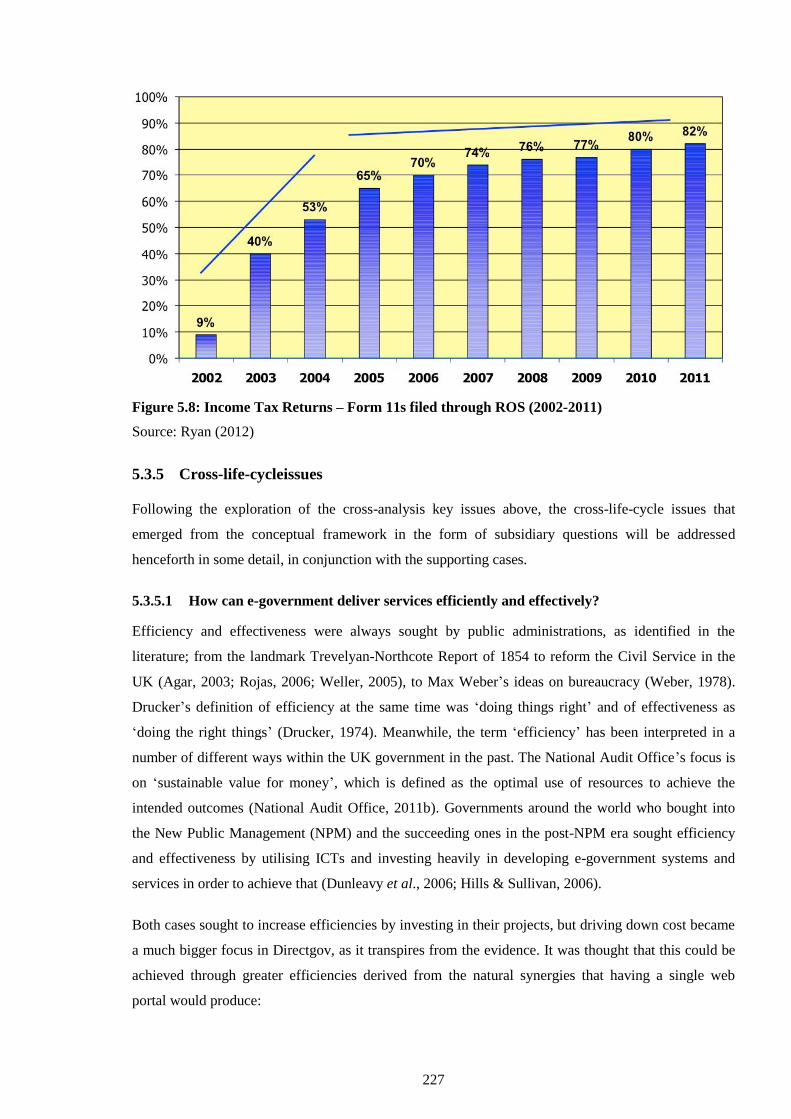
227
Figure 5.8: Income Tax Returns – Form 11s filed through ROS (2002-2011)
Source: Ryan (2012)
5.3.5 Cross-life-cycleissues
Following the exploration of the cross-analysis key issues above, the cross-life-cycle issues that
emerged from the conceptual framework in the form of subsidiary questions will be addressed
henceforth in some detail, in conjunction with the supporting cases.
5.3.5.1 How can e-government deliver services efficiently and effectively?
Efficiency and effectiveness were always sought by public administrations, as identified in the
literature; from the landmark Trevelyan-Northcote Report of 1854 to reform the Civil Service in the
UK (Agar, 2003; Rojas, 2006; Weller, 2005), to Max Weber’s ideas on bureaucracy (Weber, 1978).
Drucker’s definition of efficiency at the same time was ‘doing things right’ and of effectiveness as
‘doing the right things’ (Drucker, 1974). Meanwhile, the term ‘efficiency’ has been interpreted in a
number of different ways within the UK government in the past. The National Audit Office’s focus is
on ‘sustainable value for money’, which is defined as the optimal use of resources to achieve the
intended outcomes (National Audit Office, 2011b). Governments around the world who bought into
the New Public Management (NPM) and the succeeding ones in the post-NPM era sought efficiency
and effectiveness by utilising ICTs and investing heavily in developing e-government systems and
services in order to achieve that (Dunleavy et al., 2006; Hills & Sullivan, 2006).
Both cases sought to increase efficiencies by investing in their projects, but driving down cost became
a much bigger focus in Directgov, as it transpires from the evidence. It was thought that this could be
achieved through greater efficiencies derived from the natural synergies that having a single web
portal would produce:
228
And again it’s the balance around the efficiencies budget, ‘value for money’ and at the
moment particularly for [the] Efficiency Reform Group it’s about value for money.
Participant 12
Obviously we’re part of, you know, government efficiency drives and this wholesale
looks at how, particularly in today’s climate government can make more efficient use,
spend less money, get more for it. It’s taxpayers’ money after all.
Participant 11
It was the government’s view of efficiency and effectiveness to be honest; it wouldn’t
necessarily be my view. There seems to be a thing in government, that if you do things
absolutely correctly, and you join things all together and make one big amorphous mass
of it, it’s cheaper in terms of procurement and everything else.
Participant 22
For Case 2, a key evolutionary driver of the ROS project was a need within Revenue to greatly
increase efficiency and effectiveness. ROS was seen as creating a need to reform current processes to
make them more efficient and effective, rather than the reform coming as a consequence of ROS:
It makes sense if you are looking from an economic and efficiency point of view to have
everything on one big database; why would you scatter it around in this day and age of
good communications. In the old days, you could distribute databases because
communications were bad and therefore you needed your local data for any kind of speed
of access, but now we can move everything centrally. We can consolidate and integrate
systems and we can bring systems from different government departments and get the
one-stop-shop and all these wonderful nirvanas where we have one giant computer
system that serves everything.
Participant 7
But we don’t regard that as a value for money development, and so value for money
becomes kind of a pre-requisite for efficiency and a pre-requisite for the development of
any ICT product. Now, efficiency is also associated with business process restructuring
and design, so we apply things like Lean and Six Sigma to organisation processes as well.
And we do that sometimes prior to a software development, and sometimes in
conjunction with the software development.
Participant 8
5.3.5.2 How can public value be translated to citizen-centric services?
The notion of public value as a consequence of ICT-enabled public sector reform (including
e-government initiatives), has increased in its popularity and there were valuable efforts to bring
public value ideas within the ICT in public sector literature (Bannister, 2001a; Bannister & Connolly,
2011; Cordella & Bonina, 2012; Cordella & Willcocks, 2012; Kancijan & Vrček, 2011; I. Kearns,
2004). According to Cordella & Bonina (2012, p. 519), the public value paradigm suggests that, “the
qualities of public sector organizations are assessed on the basis of their ability to deliver the expected
value to the citizens and not only by their ‘value for money’ ratio”. The latter can be an expected
value, but not necessarily the only and prevailing one. It has been accepted in the literature, that the
229
ICT deployment in the public sector undeniably creates broader values beyond the new public
management desirable values of efficiency and effectiveness. These clusters of value range from
democratic engagement and transparency, to quality of life and safety and security (Bannister &
Remenyi, 2003; CJIT, 2007; Hills & Sullivan, 2006).
Nevertheless, the assessment of the qualitative value of ICT projects in the public sector along with
the monetary one, is a complex problem (Kancijan & Vrček, 2011). In measuring the political and
social value created as a result of ICT deployment in the public sector for example, traditional
financial Return on Investment (ROI) approaches do not capture all the benefits of investment on
e-government. A number of Public Value measurement models that were developed in order to
measure the return on ICT investments in the public sector, by assessing not only the financial returns
but also the political, social and environmental returns and impacts, were reviewed in the literature
(Dadayan, 2006; Jenner, 2009b; Millard, 2007). Although they vary widely in terms of variables used
and their specification, they have similarities in that they identify three sources of Public Value (CJIT,
2007, p. 107): “Outcomes (Effectiveness), Services (Efficiency) and, Public trust/legitimacy (Political
& Social Value)”. With regard to citizen-centricity, Bannister (2001b) proposed a model of IT value in
public administration where the core underlying values in public administration translate into IT
values, which in their turn are delivered via the supporting infrastructure and channels to the citizen
who can assume many roles in their interaction with the public administration.
For Directgov, citizen-centricity as set out in the government’s strategy was aspirational and it clearly
set out the government’s aims and objectives for future e-government projects. The most important
aim was “to use IT to reconstitute services around citizens, rather than departments” (Hallsworth et al.,
2009, p. 10). Nonetheless, as the project’s objective formulation moved from general to specific,
customer-centricity was lost along the way, and the principal driver of objectives remained the cost
reduction as it has been noted above:
So, I think that’s really key, important in a way. In terms of efficiency of, or,
effectiveness rather, in terms of customers actually reaching content and reaching
transactions appropriately, again, in the early days the information and architecture
wasn’t great, it’s still not right and Directgov acknowledge that.
Or, they don’t get the drive from the business to be customer-centric, so they come
with the business needs which are not customer-centric necessarily. So it’s down again to
the politics of the organisation and they bring with them the politics of the organisation,
whereas, I know as individuals they really care about customers. So there’s compromise,
there’s always a compromise solution, and it’s not always perfect for customers.
Participant 22
These days, probably I would say until a few years ago anyway, you know, we used to
have, you know, customer service or being customer-centric always as being one of the
top three objectives. These days it’s much more about value for money. You know?
Participant 13
230
The good thing about digital channels is you have to make them citizen-centric to
generate savings so actually by doing this, by definition, you make savings elsewhere
eventually.
Participant 21
Another issue that emerged surrounding the citizen-centric paradigm was the debate whether the
citizens should be either called or treated as customers. Bannister (2001b, p. 334) argues that “citizen-
centricity is a much richer concept than customer service. It is a concept that views the citizen in all
his or her roles, both individual and corporate”. Hence, for a full citizen-centric service transformation,
a “full understanding of citizen preferences is fundamental to inform re-design of services and
organisational change aimed at increased citizen-centricity” (In-Focus, 2008, p. 86):
Arguing whether or not government has customers and ultimately, it’s a pointless debate,
really. What’s important is that when you consider them as customers or as passengers
and there are some scenarios, like in prisons; it is ludicrous to refer to people as
customers.
But, you know, the point is not the label; it’s how you think about designing your
services… I think, is that whether you say our objective is to deliver great online
customer services what you mean is to maximise take-up to save money. On that
scenario, these two go hand in hand.
Participant 13
With regard to Case 2, although the general perception was that cost savings were central to
e-government development in Ireland, Timonen & O’Donnell (2003) found that the main driver was a
genuine desire for making government more efficient and citizen-centric. Findings from both cases
suggest that there was much more awareness of customer-centricity amongst the Case 2 team at the
outset of the project, as the main drivers of objectives such as greater efficiency and effectiveness,
following policy and customer service were more evident in ROS:
Well, in the context of ROS, we were never so much e-government driven as we were
customer service driven. We had a very significant customer service problem at the time,
with very large volumes of post and telephone calls and that, we were seriously
challenged with and our taxpayer base, was escalating. So, we actually sort of approached
it, we have all these problems from a customer service perspective, how can the Internet
help us? How can we make this electronic?
Participant 10
There was a customer service dimension; there was a proof of concept perspective to
ROS.
Participant 16
In addition, there was plenty of evidence in the data, that citizen-centricity was an active agent in
formulating objectives and success criteria, and was recognised from the outset that the project could
not succeed if the citizen did not engage fully:
231
So we help them with a citizen-centric interface like ROS, and that brings up compliance.
So ROS helps them to fill out the forms and it’s citizen-centric for value, not just to be
nice… So citizen-centricity and ROS, is an effort to help with a job that we’ve outsourced
to them to help them to be compliant and to help to ease the difficulties associated with
their particular job.
Participant 8
So a lot of the systems we’ve developed over time like ROS were developed in a growth
environment. And I don’t see any reason why in a recession they are not still relevant, in
fact they are even probably more so. But certainly the service you provide has to reflect
the needs of the customer and arguably they are different now than they were when there
was a boom.
Participant 23
5.3.5.3 Are e-government initiatives part of the wider government business
change/transformation?
As it has been mentioned above, attempting to transform the way government operates has been
observed since the mid-nineteenth century. Subsequently, when NPM was coined and introduced,
governments sought to utilise ICTs in general (including e-government projects) to aid government
business change, reform and transformation, initially by reintegrating government into more coherent
public sector or government-wide processes (Dunleavy et al., 2006). Curtain, Sommer & Vis-Sommer
(2004) maintain that e-government is far more than simply making certain information and services
for citizens available publicly online; it is a transforming agent for all layers of government, each
providing a variety of different services. The UK government’s strategy (Cabinet Office, 2005) for
delivering IT-enabled public services in the twenty-first century set a clear drive for greater efficiency
in the way services are provided, and it called for public services to be designed and co-ordinated
more around the needs of the citizen or customer, not the provider (National Audit Office, 2006b).
Other prerequisites were the need to redesign business processes, work across departments and
converge the new technology with legacy systems. Remenyi & Whittaker (1994, p. 51) define
business process reengineering as “a new managerial initiative which combines the transforming
power of information technology, with a process-based view of the organization”. Thus, IT is seen as
an enabler to transformation and business change. The role of IT in business process redesign was
overlooked in the past, as business processes existed in organisations before the development,
emergence and proliferation of ICTs. As deliberated in the literature, business process re-engineering
in government is called modernisation or transformation, or more recently smarter government, and is
facilitated by e-government and other IT developments which are seen as a central ingredient in
modernising the UK’s public sector (Brown, 2001; Cabinet Office, 1999, 2000; Cross, 2010;
Weerakkody et al., 2011).
The Service Transformation Agreement in 2007 focused on the efficiency savings in the migration of
the government departments websites to Directgov, the improvement in return on investment of IT
projects and the sharing of information within and across departments (HM Treasury, 2007; Saxby,
232
2007b). Portals such as Directgov change the way people interact with information, with each other
and with the organisations behind them. According to Ramos (2003), the benefits range from
achieving tactical and strategic objectives and transforming how the organisation operates, to simply
cutting costs.
Notwithstanding, reforming and transforming public services was an overwhelming objective in
Case 1:
If you can only change technology, there are savings to be had. Valuable. But that’s it.
You’re not transforming; you’re simply saving money. You spend a bit less. And that’s a
good thing to do. Yes. Fine. But if that’s the way you want to draw the line, great. That’s
not e-government to me. That’s just routine and you should be doing…
Participant 11
So we got internal process business change people, which is a very small team but they
look at processes that they need improving or they look at the capability model for
Directgov and do what it needs to be done.
Participant 21
Well you know, in Government where we started out, I think most people hoped it would
go away. So, I think the big change is everybody now in government, they all realise that
there is a demand for something like Directgov, clearly with 30 million people visiting it
a month. I mean my view is, that the basic proposition was always right, people want to
know if I go to a certain place or brand, that is the trusted official source of information.
That’s why I believe it has been successful. That is the fundamental reason, and it has
been successful against the odds.
Participant 4
So there are also, I think, issues in terms of service delivery, in terms of digital around
legislation. We are restricted by the laws that have been in place, for sometimes quite
literally, hundreds of years that affect the way that services are delivered. So there are
certainly a number of services that cannot be delivered without a change in legislation in
a digital way.
Participant 5
The wider government change, transformation and reform were strongly debated in Case 2, although
in the context of their own department only. The same applied to reforming public services, which was
not on the agenda per se. As discussed previously, ROS formed part of a wider governmental reform
policy, and that assisted champions of ROS to cut through procedural impediments that sometimes
delay expensive projects. With regard to business process re-engineering, ROS is praised by OECD
(2008, p. 192) as Revenue’s “…focus on benefits and on business process re-engineering for the
whole of the organisation, ensured that ROS was an integrated part of Revenue, and not an added layer
of service”:
I wouldn’t have thought there was a change in our view on ROS over that ten-year
period, because I would still view it as being an extension of our ICT capability and the
233
application of ICT to business processes. We still, and what we have done is, we have
helped our citizens to do these things online. Just like we have helped our staff to do them
with applications before, so the processes exist within the organisation and we have
helped our staff to do these with applications.
Participant 8
ROS came in at that point; now at one point I had identified the web as a feature of the
organisation, the organisation development because a lot of people would say well the
introduction of ROS was a stage of development. Now, I considered that for a long time,
I considered that actually the web is just another way of using ICT to manage business
processes; so whether it’s internal or external makes no difference really. So I took it out
as a stage of development and said, that it was the competency was re-used for the
Internet, but it did have to happen after the consolidated customer view.
Participant 17
Setting up something that’s online, your location is irrelevant, you know? It doesn’t
matter. As long as the public have access, you can be anywhere, so that was obviously
one of the objectives.
Participant 18
Change to Work practice, internal work practices. Change of management, internally and
externally.
[Interviewer]: Change of management?
Yes, we use the opportunity to re-engineer some of the business processes; okay, in
consultation with the accountants. So, I am going into details again, and we needed
money, so legislation, finance, and then we needed corporate support.
Participant 10
5.4 Summary
This chapter has explored the elucidations put forward by participants as to how they managed
challenges of the e-government projects they contributed to, and what they had learned during life-
cycles of these projects, from inception, to development and implementation, in an evolving and
sometimes adverse environment.
These explanations were compared and contrasted, using cross-case analysis. The analysis confirmed
the relevance of the existing themes identified in the literature. By progressing through in-case and
cross-case analysis using a case-based approach and a common framework to code and analyse the
data, the key issues were identified in conjunction with any similarities and differences between the
two cases. In addition, the cross-life-cycle issues that emerged from the conceptual framework that
derived from the literature were explored, with the aim of gaining a better understanding of the
challenges faced by e-government initiatives.
The next chapter summarises the research findings and synthesises the existing concepts and theories
with the aim to conceptualise the success of e-government projects into a conceptual framework, along
with recommendations on how this can be achieved.
234
CHAPTER 6: SUMMARY AND CONCLUSIONS
6.1 Introduction
This chapter aims to conclude the research detailed in this thesis and to propose areas for future
research. This is presented in five stages. First of all, there is an overview of the research, followed by
a discussion of the summary findings which addresses the research questions posed at the outset. A
synthesis of existing concepts, writings and experiences results in proposing a conceptual framework
depicting the elements for the successful strategic alignment of the adoption of e-government services
, and the contribution to the body of knowledge is highlighted. This is followed by the limitations of
this research process, with recommendations for further research concluding the thesis.
6.2 Overview of the Research
This research set out to explore how to improve the strategic alignment of the adoption of
e-government services by analysing success, amidst a high degree of project failure in IT.
Notwithstanding that the areas of IT project failure and IT alignment with strategic objectives have
long been of interest to researchers, especially in the private sector, there is a shortage of research
focusing on the public sector. A conceptual framework that depicts the life-cycle and the cross-life-
cycle issues that occur during IT in general, and e-government projects in particular, derived from the
literature, along with a number of subsidiary research questions that needed to be addressed. The
relevance of these research questions coded into themes and sub-themes through the in-depth in-case
analysis of two case studies, following an analytical strategy and coding framework, was confirmed.
This was followed by a cross-case analysis of the cases, where the key issues for both projects were
identified and reflected alongside the cross-lifetime issues in light of the literature. The analysis
produced a better understanding of the challenges faced by e-government investments and enabled
recommendations for the success of future IT and e-government projects to be made.
6.3 Research Questions
Each of the subsidiary research questions posed in the literature review chapter has been
comprehensively addressed in the parsing and analysing of data through several cycles of analysis as
set out under the data collection and analysis strategy outlined in this research above, as follows:
How are e-government initiatives objectives formulated and how are they evaluated
a priori? – during the strategy phase?
How did these objectives evolve? – into design objectives and at various stages?
The objectives of the initiatives were formulated in very different ways in each case. Both cases
originated from a political initiative following a worldwide thrust towards e-government and pressure
from outside expert bodies and the media. In the case of Directgov, the idea was realised by a political
decision after which there was a complete abdication of responsibility and leadership, and the project
235
was handed over to the Civil Service to implement. That implementation was bound to fail and it did
in some respects. The project did not have the authority to manage its own affairs, and despite being
seen generally as a success, no reasonable assessment of the Directgov project using industry
standards could conclude that to be the case. By contrast, the ROS project was realised from a political
notion to a well-defined and well-funded managed project, with well-evolved objectives that it did
meet. It did not however, inform the debate as to the extent to which its success could be emulated
across several government departments because this was never tested. There is no evidence in the data
to suggest that it would not meet the same fate as the Directgov project did, and for the same reasons.
How are e-government initiatives objectives converted into procedures and processes in
order to ensure objectives are met – during the implementation phase?
The objectives set for ROS were narrower but achievable. The objectives set for Directgov were broad
and unachievable. Therefore, the Directgov implementation exposed the strategic design flaws it
contained. The Directgov portal was not customer-centric enough, nor designed with the customer in
mind; findings showed that it was designed to save cost. Nor did it provide a platform to reform how
public services were delivered, as it did not have the management structures in place to deliver that
objective. The opposite is true in the case of ROS, for the same reasons, since it did meet its stated
objectives. It was designed with the customer in mind as it was recognised at the design stage that
customer uptake was a critical success factor. It did use KPIs and ROI criteria and delivered ‘value for
money’ as defined by the Irish public service, bringing as a consequence greater efficiencies and
effectiveness.
How are the results of e-government initiatives evaluated and how are these evaluations
used as feedback to ensure organisational learning – evaluation phase?
In order to ensure evaluation of such projects, information-gathering and -disseminating instruments
must be put in place at the outset. These information systems must collect both hard and soft data. This
did not happen in the case of Directgov, but did in the case of ROS. Once collected, formal analysis of
the qualitative and quantitative data must take place, and a formal reporting structure should be in
place to ensure the results of the analysis reach key decision-makers. As it stood at the time the
research took place, the ROS system was delivering these outcomes, while the Directgov project was a
testament to evaluative failure. Evidently it was not possible to assess if the £13-million per annum of
taxpayers’ money was delivering any value to the public service or the wider e-government agenda.
How can e-government deliver services efficiently and effectively – cross-life-cycle
issue?
Public service reform must become a political imperative that goes far beyond saving money in hard
times. Real reform must be managed at the business level as evidenced in the ROS project, where a
business leader along with technical experts now leads all e-government projects. It is only under these
conditions that e-government projects can take their place as part of that reform, and deliver public
services efficiently and effectively, as has been proven by the ROS model. It is no coincidence that the
236
term ‘efficiency and effectiveness’ became a mantra in Revenue parlance from the design stage of
ROS. However, until political leaders give effect to e-government projects in the form of properly
constituted projects which contain the same project methodologies and standards as would apply to
privately-funded projects, the outcomes will be similar to the ones reported on the Directgov case.
How can public value be translated to citizen-centric services – cross-life-cycle issue?
One of the ways to achieve this is to involve citizens in the design, testing and evaluation of
e-government projects so that the outcomes are better, as exemplified in the ROS model. Directgov
was designed to save money; however, there is no evidence to showcase that. What was evident is that
there was resistance at government departmental level even to allowing citizens to comment on the
Directgov website initially. As it transpired, it could not collect anything more than the crudest of
information from its citizens (see ‘COTA – Comment on this Article’ in the findings), and even this
information was not fed into a formal evaluation and reporting system. Therefore the citizen in the
Directgov project had no voice per se. Until the citizen is provided with a platform to feedback
information in relation to public services, whether online or elsewhere, those services cannot be
translated into truly citizen-centric.
Are e-government initiatives part of the wider government business change/
transformation – cross-life-cycle issue?
In both cases, there is no evidence that e-government services form part of a wider transformation
plan. In the case of ROS, one government department took an initiative that suited their own agenda
and aims. There is evidence in the data that a similar project to the Directgov project was launched and
failed in Ireland, and it was evident that there was no enthusiasm for it amongst the ROS participants.
No such similar portal existed in Ireland at the time this research took place, as each department
continued to develop its own website with all of the fragmentation and duplication of cost, data and
effort – which was the reason Directgov was conceived in the first place. Equally, Directgov did not
deliver on wider reform. e-Government could not deliver reform without the wider political and
business agenda and will being in place in the first instance, as both case studies clearly show.
However, there is an abundance of evidence that e-government can deliver efficiency and
effectiveness. There can be no doubt that the management and technical competencies exist in the
public service to deliver the desired efficiencies and effectiveness. The missing ingredient in ensuring
the e-government plays its role in forming part of a wider government change/transformation
programme is leadership. After all, the deficits identified in this study came from narratives of the
Directgov and ROS key participants who contributed to this research.
6.4 Validation of Findings
The research findings and recommendations, based on the evidence from the two case studies
undertaken, were presented to a small number of research participants where it was possible, allowing
them to validate their accuracy and comprehensiveness. Likewise, during the analysis stage in some
237
instances research participants were re-visited and consulted to tidy up points of detail or clarify facts.
In addition, as stated in the methodology chapter, following Directgov’s transition to GOV.UK at the
end of the year 2012, it was felt that in order to conclude the case’s journey and round up the findings
of this study, the researcher needed to approach the new government agency that was formed behind
it. The researcher was thereby granted two interviews with GOV.UK’s product manager and deputy
director single domain respectively. Furthermore, the researcher presented and discussed the findings,
obtaining invaluable feedback and additional information that was omitted with regard to Directgov’s
case description. Feedback included structural and administrative comments with regard to the
structure of the agency’s hierarchy, especially after its transformation, and the day-to-day operations,
management and policy issues respectively, which aided to a better comprehension of the case.
6.5 Research Contribution
It is claimed that the research contribution made in this study is three-fold; a theoretical contribution is
been made, along with an applied contribution that comprises recommendations to practitioners.
Additionally, by proposing a customised structured-case study research design method, it is making a
methodological contribution to knowledge.
6.5.1 Theoretical and Applied Contribution
Doctoral research needs to produce theoretical contributions with some degree of originality and it is
through contrasts that new ideas and insights are most easily created. Theoretical or ‘pure’ research
tends to lead to theoretical development, which might have practical implications, whilst applied
research is intended to lead to the solution of specific problems. Theoretical developments may take
three forms, such as discovery, invention and reflection; since discoveries are rare, the most common
outcomes of research are the two latter ones. Although theory is likely to have a part to play in applied
research studies, it is the application of theory in a practical setting that is important (Easterby-Smith
et al., 2002). In addition, the chances of such discoveries are improved, if both pure and applied
elements are incorporated into the research.
This is the case of this research, where it was necessary to understand key concepts and theories from
a theoretical perspective, before utilising this knowledge to allow examination of the cases from an
empirical perspective. The contribution of this research is presented in the form of a conceptual
framework that derives from a synthesis of concepts, models and theories reviewed in the literature, as
well as the key issues identified during the cross-case analysis. Moreover, lessons learned on how
government and e-government practitioners can improve the planning, development and
implementation of such systems, in a way that can yield citizen and public value, along with
recommendations, are discussed thereafter.
238
6.5.1.1 Theoretical Contribution
6.5.1.1.1 Synthesis of Concepts, Models, Theories and Identified Issues
In this section, the concepts, models, theories and key issues that emerge from the literature review
and this research, are synthesized and discussed below, with the aim to produce a conceptual
framework for the strategic alignment of the adoption of e-government services .
IT/Digital/Business Strategic Alignment
The strategic alignment concept has been explored extensively in the literature review where a
number of theories, models and frameworks were reviewed. These included strategy and ICT-
enabled change in organisations, as well as business strategy/IT alignment models in both the
private and public sectors. Manwani (2008) proposed an IT-enabled business change (ITEBC)
life-cycle model that depicts all the stages of such change in organisations. The most distinct
models on business strategy/IT alignment have also been reviewed, including the MIT90s
Framework (Scott Morton, 1991), the Strategic Alignment Model (SAM) (Henderson &
Venkatraman, 1993), as well as the hybrid SAM (Chan & Reich, 2007). Following the MIT90s
Framework, SAM has conceptual and practical value in creating, assessing and sustaining
strategic alignment between information technology and the business. Avison et al. (2004) also
found that alignment is shown to be amenable to measurement and that strategising can be a
useful part of the alignment process. Luftman (2003) argues that there is no ‘silver bullet’
solution as the technology and business environment are too dynamic, but achieving strategic
alignment is possible.
The findings of this research suggest that IT-enabled business change should be augmented by a
digital strategy, which concerns new technologies, platforms and delivery, which in its turn,
should be aligned with the overall IT/Business strategy as proposed in Figure 6.1 below. As
discussed in the cross-analysis chapter, GDS has already proposed the ‘digital by default’
service standard for designing digital government services.
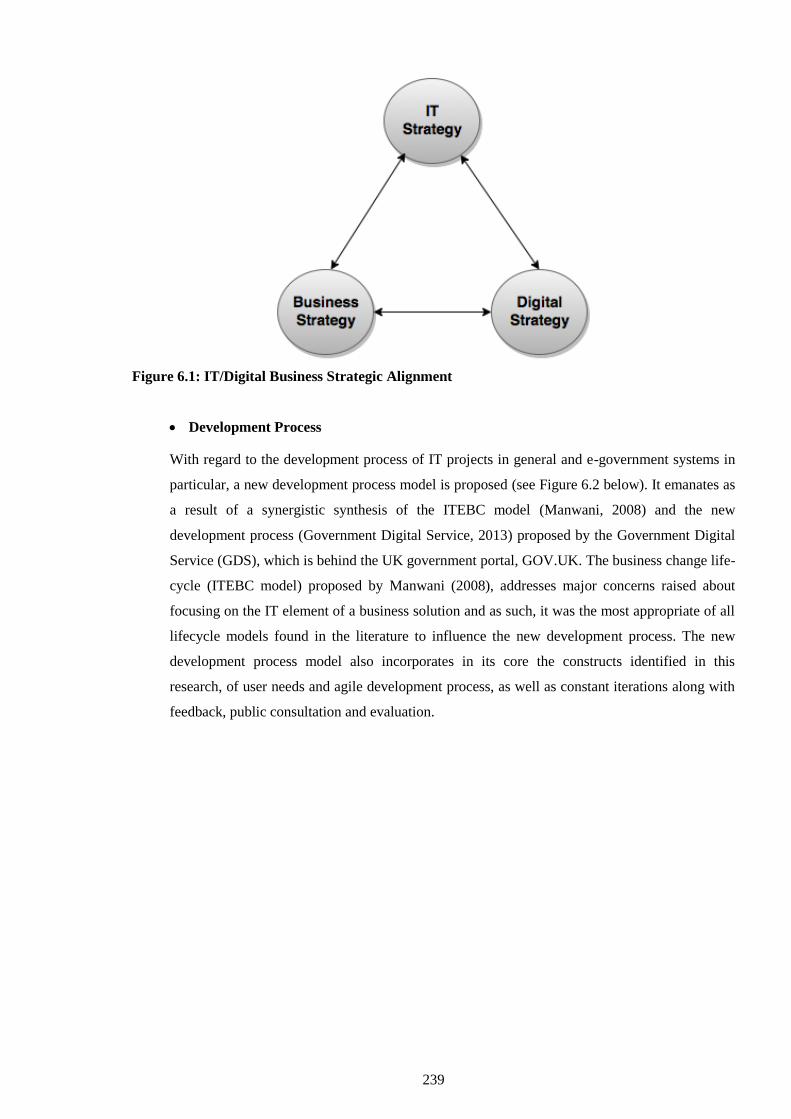
239
Figure 6.1: IT/Digital Business Strategic Alignment
Development Process
With regard to the development process of IT projects in general and e-government systems in
particular, a new development process model is proposed (see Figure 6.2 below). It emanates as
a result of a synergistic synthesis of the ITEBC model (Manwani, 2008) and the new
development process (Government Digital Service, 2013) proposed by the Government Digital
Service (GDS), which is behind the UK government portal, GOV.UK. The business change life-
cycle (ITEBC model) proposed by Manwani (2008), addresses major concerns raised about
focusing on the IT element of a business solution and as such, it was the most appropriate of all
lifecycle models found in the literature to influence the new development process. The new
development process model also incorporates in its core the constructs identified in this
research, of user needs and agile development process, as well as constant iterations along with
feedback, public consultation and evaluation.
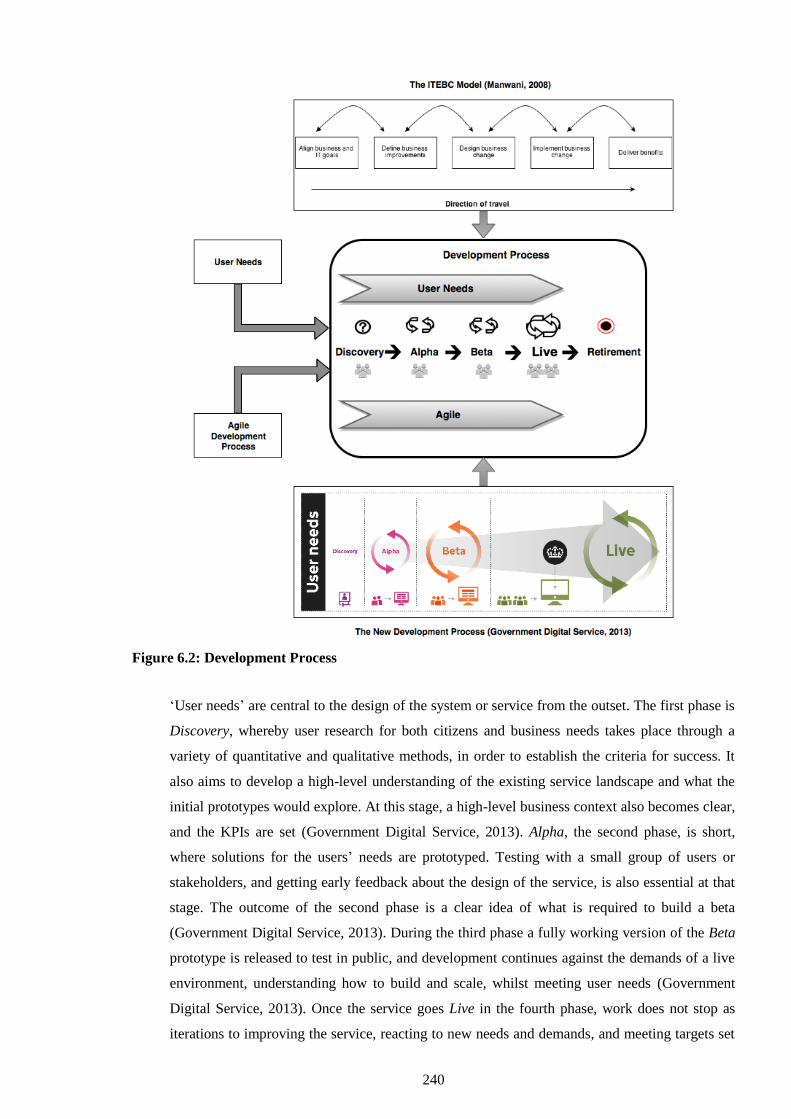
240
Figure 6.2: Development Process
‘User needs’ are central to the design of the system or service from the outset. The first phase is
Discovery, whereby user research for both citizens and business needs takes place through a
variety of quantitative and qualitative methods, in order to establish the criteria for success. It
also aims to develop a high-level understanding of the existing service landscape and what the
initial prototypes would explore. At this stage, a high-level business context also becomes clear,
and the KPIs are set (Government Digital Service, 2013). Alpha, the second phase, is short,
where solutions for the users’ needs are prototyped. Testing with a small group of users or
stakeholders, and getting early feedback about the design of the service, is also essential at that
stage. The outcome of the second phase is a clear idea of what is required to build a beta
(Government Digital Service, 2013). During the third phase a fully working version of the Beta
prototype is released to test in public, and development continues against the demands of a live
environment, understanding how to build and scale, whilst meeting user needs (Government
Digital Service, 2013). Once the service goes Live in the fourth phase, work does not stop as
iterations to improving the service, reacting to new needs and demands, and meeting targets set
241
during its development, continue. To provide a fully resilient service to all end-users, the service
should meet all security and performance standards. Moreover, analytics to accurately monitor
the key performance indicators identified in the building of the service should be configured, as
the service should be improved continuously, based on user feedback, analytics and further
research (Government Digital Service, 2013). The final phase is Retirement, since even the best
services, digital or other, eventually retire. Even so, it is being proposed that this should be
treated with the same degree of care as their creation, concentrating on user needs, and
preparing for a transition (Government Digital Service, 2013).
Central to the development process is also the ‘Agile’ software development approach, where
systems are developed in an iterative, incremental and evolutionary manner. The latest Standish
Group CHAOS report, discussed in Section 2.7.2 above, notes that the Agile process is one of
the success factors when it comes to project success. It has however evolved from ‘smaller
project milestones’, which actually means Agile is ‘olde 1990 language’ in software
development, according to Carroll (2013). Transforming government services nonetheless is not
only about creating successful online services with fully transactional and user-intuitive
websites and portals. Business process mapping and re-engineering is an integral element of the
approach prescribed here, from the Discovery phase above, to continuous iterations, even after
going live, and constant learning and adjusting as appropriate.
Project Funding
Securing funding should be put in place at the strategic planning phase as soon as a successful
business case has been made showcasing the estimated benefits of the initiative. This research
has shown that strategic planning was seriously impeded by the lack of securing funding from
the outset. It has also shown that even if it is well placed at the beginning of the planning
process, every effort should be made for optimism bias to be averted. Optimism bias has been
explored in the literature, with Lovallo & Kahneman (2003) referring to it as ‘delusional
optimism’ or cognitive bias contributing to optimism bias by offering psychological
explanations. Others like Flyvbjerg (2006) add that there is also the issue of ‘strategic
misrepresentation’, based on political and organisational explanations, i.e. pressures. Jenner
(2009b, p. 2) goes further by arguing that in order to justify investment for such projects,
benefits are exaggerated “to an extent that verges on benefits fraud”.
Leadership
It transpired from the findings of this research that having strategic top-down leadership in
place, which is also [preferably] visionary is not only desirable but also paramount for the
success of any e-government initiative. Strategic planning along with project continuity is
impacted by a high turnover rate at senior civil servant level and a change of administration at
political level, resulting in changes to policies and practices. In addition, political pressure, as
242
discussed previously, should not be taken lightly. Hence, it requires clear senior management
and ministerial ownership and leadership, as was also prescribed by OGC in its infamous list of
‘Common Causes of Project Failure’ (OGC, 2007b, p. 2).
Dedicated Development Team
This research has also found that a small in-house development team would be ideal, consisting
of the stakeholders and any core team members that have been identified, including the service
manager (Government Digital Service, 2013). The GDS for example, has brought developers
and designers into the team from externally, and that was a cultural shock to central
government. Not only were there internal frictions, they were also received with suspicion and
hostility at first (Government Digital Service, 2011c). Notwithstanding, they persevered, and
they are now seen positively and with fascination from many in government. Long before that,
in contrast to Directgov practices, ROS had its own internal dedicated team, which came to be
known as the ‘Dream Team’.
Business Transformation and Procurement: IT as a Commodity
The findings of this research showed that business transformation, especially in government, is
also exhibited by commercial reform which is the new DNA for commercial activities where IT
is seen as a commodity by shifting channels. In the Cloud era for example, there are no issues of
scalability, there is no ownership of bulk and expensive infrastructure, and virtualisation could
be achieved easily, along with lower Total Cost of Ownership (TCO). Transforming
procurement had become a number one priority in the UK government following costly
contracts and blunders following the ‘supplier paradigm’ as it had been reported and discussed
in the findings (Bracken, 2013). In Ireland, the procurement process and supplier evaluation and
selection, was included in the ex-ante strategic plan at its inception, as early as 1998 (Revenue,
2009b).
Cross-Departmental Cooperation
Cross-departmental cooperation was a major impediment for Directgov, owing to the fact that
its importance was not recognised, and hence the requisite management structures were not
assigned. Nevertheless, as it transpired from the findings, cross-departmental cooperation was
no more achievable in Ireland than it was in the Directgov model. Thus, cross-departmental
cooperation is vital, as the new UK Government Digital Strategy (Cabinet Office, 2012)
recognised, and committed to support all government departments fully, by developing digital
capability throughout the Civil Service. Moreover, departments publish their own digital
strategies identifying their needs and setting targets, and have their own digital leadership.
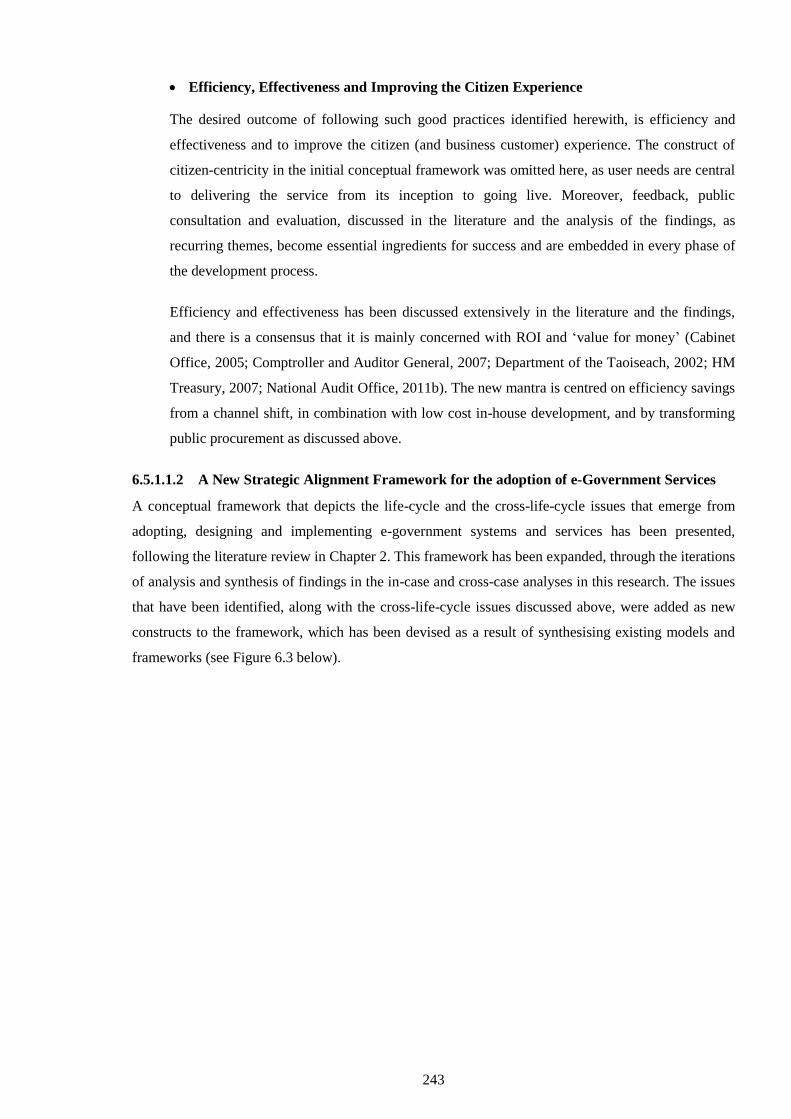
243
Efficiency, Effectiveness and Improving the Citizen Experience
The desired outcome of following such good practices identified herewith, is efficiency and
effectiveness and to improve the citizen (and business customer) experience. The construct of
citizen-centricity in the initial conceptual framework was omitted here, as user needs are central
to delivering the service from its inception to going live. Moreover, feedback, public
consultation and evaluation, discussed in the literature and the analysis of the findings, as
recurring themes, become essential ingredients for success and are embedded in every phase of
the development process.
Efficiency and effectiveness has been discussed extensively in the literature and the findings,
and there is a consensus that it is mainly concerned with ROI and ‘value for money’ (Cabinet
Office, 2005; Comptroller and Auditor General, 2007; Department of the Taoiseach, 2002; HM
Treasury, 2007; National Audit Office, 2011b). The new mantra is centred on efficiency savings
from a channel shift, in combination with low cost in-house development, and by transforming
public procurement as discussed above.
6.5.1.1.2 A New Strategic Alignment Framework for the adoption of e-Government Services
A conceptual framework that depicts the life-cycle and the cross-life-cycle issues that emerge from
adopting, designing and implementing e-government systems and services has been presented,
following the literature review in Chapter 2. This framework has been expanded, through the iterations
of analysis and synthesis of findings in the in-case and cross-case analyses in this research. The issues
that have been identified, along with the cross-life-cycle issues discussed above, were added as new
constructs to the framework, which has been devised as a result of synthesising existing models and
frameworks (see Figure 6.3 below).
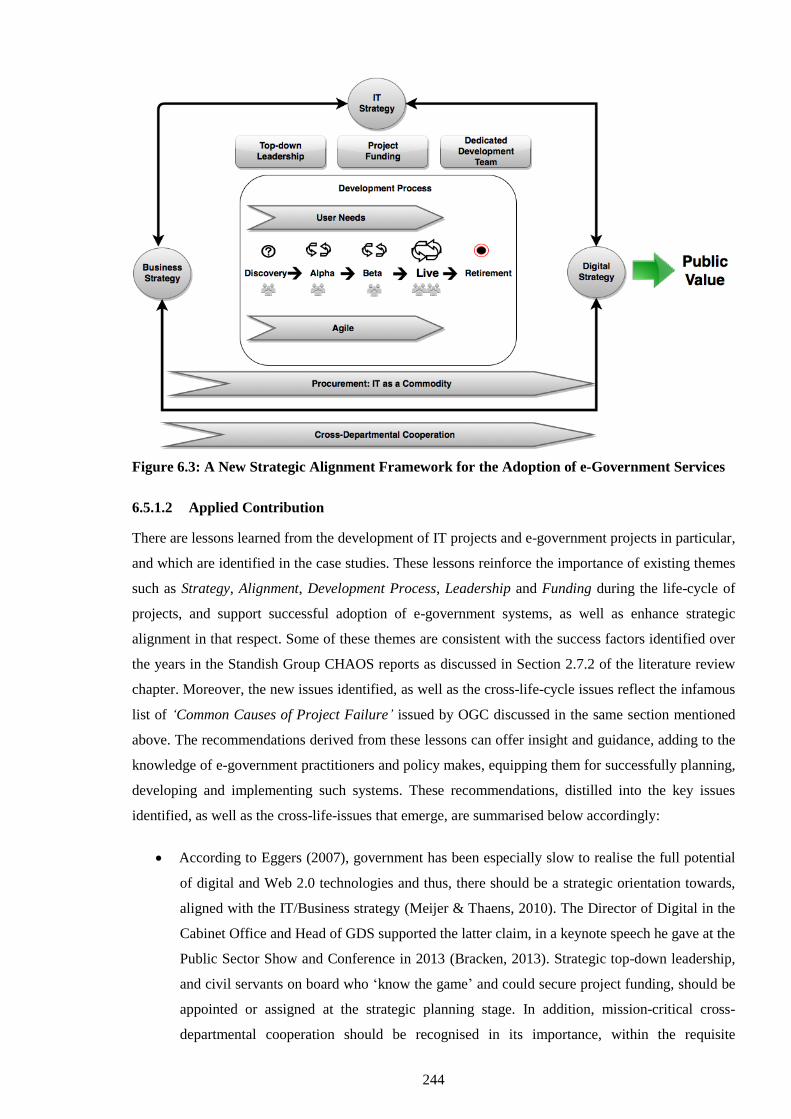
244
Figure 6.3: A New Strategic Alignment Framework for the Adoption of e-Government Services
6.5.1.2 Applied Contribution
There are lessons learned from the development of IT projects and e-government projects in particular,
and which are identified in the case studies. These lessons reinforce the importance of existing themes
such as Strategy, Alignment, Development Process, Leadership and Funding during the life-cycle of
projects, and support successful adoption of e-government systems, as well as enhance strategic
alignment in that respect. Some of these themes are consistent with the success factors identified over
the years in the Standish Group CHAOS reports as discussed in Section 2.7.2 of the literature review
chapter. Moreover, the new issues identified, as well as the cross-life-cycle issues reflect the infamous
list of ‘Common Causes of Project Failure’ issued by OGC discussed in the same section mentioned
above. The recommendations derived from these lessons can offer insight and guidance, adding to the
knowledge of e-government practitioners and policy makes, equipping them for successfully planning,
developing and implementing such systems. These recommendations, distilled into the key issues
identified, as well as the cross-life-issues that emerge, are summarised below accordingly:
According to Eggers (2007), government has been especially slow to realise the full potential
of digital and Web 2.0 technologies and thus, there should be a strategic orientation towards,
aligned with the IT/Business strategy (Meijer & Thaens, 2010). The Director of Digital in the
Cabinet Office and Head of GDS supported the latter claim, in a keynote speech he gave at the
Public Sector Show and Conference in 2013 (Bracken, 2013). Strategic top-down leadership,
and civil servants on board who ‘know the game’ and could secure project funding, should be
appointed or assigned at the strategic planning stage. In addition, mission-critical cross-
departmental cooperation should be recognised in its importance, within the requisite
245
management structures. The development process proposed herein can alleviate the ‘supplier
paradigm’ tradition and cut costs accordingly. Having the user needs’ at centre stage, constant
iterations, whilst receiving feedback and initiate public consultation, might not be a usual
practice followed by government thus far, but this research has shown it is paramount for its
success. Hence, it could be argued that part of the efficiency and effectiveness yielded with
the application of such framework, comprises citizen-centric values, as well as much-
neglected in the past public consultation prospects and exercises with end-users. Moreover,
effective procurement along with an in-house development team should deliver cost-savings
and a more coherent approach and control, to managing the required infrastructure and
development.
This research has also found that risk-aversion, particularly with Directgov was evident, and
which sometimes hindered systems development and the adoption of new technologies. For a
new idea, practice or object perceived as new, there should be a diffusion process, whereby an
innovation is communicated through certain channels among the members of a social system
to achieve acceptance over time (Rogers, 2003). Failure on the other hand is a necessary part
of the innovation process because from failure comes learning, iteration, adaptation, and the
building of new conceptual and physical models through an iterative learning process. Almost
all innovations are the result of prior learning from failures (Hess, 2012, 2014). Hence, whilst
risk-aversion in a government environment is understandable to a certain extent, senior Civil
Service leaders in charge of such initiatives, and e-government practitioners, should
understand the necessity and importance of failure, as many disruptive technology companies
of the likes of Google, Facebook and Amazon have done already.
6.5.1.3 Synopsis of the Theoretical and Applied Contribution
In addressing the question posed in this research on ‘how to improve the strategic alignment of the
adoption of e-government services ‘, it is intended that the findings of this research have enhanced
existing theoretical models and frameworks in the field of IT in general and e-government projects
development in particular. New issues that were identified which should increase the subject
understanding and in turn offer opportunities for further research. It is also hoped that the new
Strategic Alignment Framework for the Adoption of e-Government Services proposed herein will add
value to the existing body of conceptual frameworks and toolkits on e-government development. It
could be used by government to guide its planning, development and implementation of such systems,
in a way that can yield citizen and public value, as well as the much sought-after efficiency and
effectiveness.
246
6.5.2 Methodological Contribution
6.5.2.1 The Customised Case-Structured Research Design Method
With regard to research methodology, researchers usually follow the prescriptions of other scholars to
the letter, and simply apply a previously published method to a new body of data. Nonetheless, in the
practice-related investigative methodologies which are still emerging in the research field, new ways
of investigating practice are continually being proposed (Hill, 2011). Gray (1996, p. 3), a proponent of
practice-led research suggested that practice-led research is, “Firstly research which is initiated in
practice, where questions, problems, challenges are identified and formed by the needs of the practice
and practitioners; and secondly, that the research strategy is carried out through practice, using
predominantly methodologies and specific methods familiar to us as practitioners.” This is the case in
this research where in the quest for an appropriate research design within this descriptor of
investigative practice, a customised structured-case method is proposed to accommodate the various
approaches that were employed (see Figure 3.5 in Section 3.4.6).
The aforementioned customised structured-case method was adapted from Carroll & Swatman (2000),
and is in line with theory development from case-study research as prescribed by Eisenhardt (1989).
Grounded theory was used in part in this research in the form of the constant comparative method as a
data coding technique, something that Glaser (1999, p. 837) refers to as “adopt and adapt”, with other
research methods woven in; in this case the case study design. Since this research comprises two
cases, it employs the multiple or comparative case study design (holistic, where each case does not
consist of multiple embedded cases), in line with Yin’s (2009) recommendations. This approach, of
combining grounded theory analysis with the case study strategy, is referred to by Mäkelä & Turcan
(2007) and Arshad et al. (2013) as ‘grounded case research’. The structured-case approach proposed
by Carroll & Swatman (2000) has been promoted as a means of supporting theory-building as part of
case study research, and thus was found particularly suitable for this study. Nevertheless, it had to be
adapted from the original, since this research does not follow the cyclical approach producing a series
of conceptual frameworks, as follows: the customised structured-case method retains loosely the three
main elements – the conceptual framework, the research cycle and the literature-based scrutiny of
theory built – whilst the phase of reflection becomes that of theory building. The conceptual
framework for this research, derives from the literature, and represents the researcher’s views and
aims, in contrast with Glaser’s (1992) view. It is based on pre-conceived notions and a conceptual
structure that can underpin the research, grounded on available resources. In the first phase, Plan, the
case study design was applied and the appropriate cases were selected. In the second stage, data were
collected and the researcher’s impressions and interpretations were recorded in Field Notes, as guided
initially by the plan outlined in the previous stage. This stage was flexible enough to allow for
additional adjustments to data collection instruments, such as adding or amending questions as
appropriate, to the interview schedule. The data analysis phase employed the constant comparative
method as discussed above, querying the data and making constant comparisons to advance theoretical
247
development, via a computer-assisted qualitative data analysis software program. The themes in the
conceptual framework were used as initial codes to guide the analysis, along with ‘any other’ codes to
incorporate new themes. The circular, iterative and reflective nature of constant comparative method
counterbalanced the iterations back and forth between the data, the tentative findings and the inputs to
the conceptual framework, followed by its iterative updates as prescribed by Carroll & Swatman
(2000). The theory development phase in this research involved a literature-based scrutiny for both the
in-case and cross-case findings, before developing applicable theoretical and applied perspectives.
The methodological approach proposed follows good practice, and complies with the methodological
guidelines and principles of quality interpretive research. It is argued that it could be used to replicate
a similar or a qualitative study of another nature with the same rigour as the present one. It therefore
constitutes a contribution to the body of knowledge of investigative approaches and methodological
research designs.
6.6 Limitations
It was claimed earlier that there is a shortage of research focusing on IT project failure and IT strategy
alignment in the public sector in the IT and e-government literature respectively. This research
anticipates contributing towards this field; however, authoring a doctoral thesis has its limitations,
pitfalls and constraints (Dunleavy, 2003; Remenyi & Money, 2004), some of which, are discussed
below.
As deliberated in the methodology chapter, selecting the cases and sampling participants was
challenging. One major issue was gaining access to government, which was overcome by relying on
the researcher’s networks and lobbying accordingly. The difficulty of conducting research within
government was reported consonantly by Delany (1960), recounting his experiences in gaining access
to government departments. Two cases were eventually identified in the UK and the Republic of
Ireland. Although one can argue that there were many more cases to choose from in order to gain a
richer understanding, the limitations of choice given the circumstances and the time constraints, as
well as the aim to explore ostensibly successful e-government projects, reduced the scope.
Thirty-seven interviews were conducted overall in total over a period of nearly a year, and included
external research participant types, such as experts and consultants. The purpose was to reinforce
perceptions of the two cases, their differences and their standing, amidst latest developments in the
field. This external dimension, apart from informing the study, was also intended to have an impact on
the generalisability of the findings. Citizens and political figures were not included in this research,
since it was not certain, as Bannister (2001b, p. 332) put it when conducted a similar study, that “either
of these groups would add much of value”. Moreover, political figures were hard to reach whilst
sampling citizens would be problematic.
248
Another hurdle to overcome was the research participants’ availability, and sometimes reluctance, as
they were public servants and hence conscious of information sensitivity. As reported already in the
methodology chapter, research participants at the ROS case were more forthright in providing internal
documentation and other material, whilst those in Directgov were more conservative in doing so. In
addition, the research respondents in ROS were much more accommodating and appreciated the effort
made by the researcher to travel to the Republic of Ireland for the purpose of interviewing them, as
well as the logistics involved.
The findings recorded against this primary research data-set represent a true account of the roll-out of
the Directgov project in the UK and the ROS project in the Republic of Ireland as told from the
perspective of the participants who played a major role in both projects and contributed to this
research. There is always however the possibility of bias in their narratives, as their perception may
differ from the perspective of other actors in the respective projects. Urwin (2002, p. 303) alleges that:
“There will always be problems with data gathering and analysis, in the selection, partial
comprehension, misinterpretation, and in some cases deliberate distortion, or withholding of
information on the part of the informant.” Thus, to minimise bias, an effort was made to follow
principles of good practice as prescribed by Yin (2009) and others (Remenyi et al., 1998), such as
maintaining the chain of evidence, developing a case study database and have the key participants
review the draft findings report to strengthen validity.
The question of rigour was of primary concern all along, with each stage of this research taking a
significant amount of time and effort to complete. As Denzin & Lincoln (2008a) advocate, the
academic and disciplinary resistance to qualitative research illustrate the need for further rigour and
strengthening of the procedural issues in this field of discourse. From the outset, in an attempt to
explore existing theories, concepts, writings and experiences, the literature review was conducted as
comprehensively as possible. Moreover, encompassing rigour in the research process, the research
design and data analysis, was heavily influenced by Eisenhardt (1989), culminating in the adoption of
a customised structured-case approach as prescribed by Carroll & Swatman (2000). The data analysis
phase employed the constant comparative method which lies at the heart of grounded theory (Glaser &
Strauss, 1967; Strauss & Corbin, 1990). In addition, the use data analysis software (NVivo) supported
more rigorously and fluidly the research processes, and gave more confidence that the data analysis
was transparent and thorough (L. Richards, 2002; Welsh, 2002).
Although this research considered the reform of public service delivery in the form of wider
government business change and transformation, it did not look at similar cases in the broader public
sector. There is certainly a lot to be gained by looking at the broader public sector, and perhaps even
compare and contrast any advancement to these in central government.
While there are parallels between the Irish Civil Service and the UK model, there is undoubtedly an
immense difference in scale between these two cases, both from a business and technical perspective.
249
The Directgov web portal attracted over 30 million visitors a month in its peak at the time this research
took place, whilst the entire population of Ireland is five million. Hence, there may be much to be
learned from looking at similarities and differences in cases at countries of comparable size to the UK.
With regard to the methodological approach proposed in this research, it has been applied and tested
only in this study. Although it was applied successfully in this occasion, is subject to peer review and
scrutiny, as well as replication on another study with the same rigour.
6.7 Future Research
The aim in this research by following the case-comparison approach was to develop a degree of
analytical generalisability of the findings, and add confidence to the researcher through the
examination of similar and contrasting cases. According to Yin (2009), where two or more cases are
shown to support the same theory, replication may be claimed. Hence, multiple iterations of such case
studies can lend greater credibility to the results, and therefore additional research in this area would
be welcomed.
This could be achieved through a bigger number of similar cases or for a different sample of cases
altogether. As it has been noted above, it would be interesting to explore similar cases in the wider
public sector and even compare and contrast the findings with cases in central government should such
study be feasible to undertake.
By the same token, an obvious case to be explored is that of GOV.UK, the portal that succeeded
Directgov in the UK and the organisation behind it, the Government Digital Service (GDS),
particularly as it has been applauded for its ‘radical development approach’. Furthermore, it would be
interesting to compare and contrast with any similarities and differences in cases in countries of
comparable size to the UK, as previously discussed.
6.8 Final Note
“The most important lesson to keep in mind is that strategic alignment is a journey and
not an event”
(Henderson & Venkatraman, 1993, p. 482)
The exponential growth of IT, especially with the advent of the Internet and web technologies,
expedites technological developments, and creates tremendous opportunities for the future. This
research observed and documented in part the evolution of e-government systems and services to
‘digital by default’ platform (Government Digital Service, 2015). For government to deliver on the
promise of digital government as defined today, silos will have to be brought down altogether, and
digital aligned with IT and business strategy. Moreover, having a holistic view of the citizen and other
stakeholders is paramount, as it is vital to involve them at all stages of the life-cycle of any project.
250
REFERENCES
Accenture. (2005). The Government Executive Series. Leadership in Customer Service: New
Expectations, New Experiences. London: Accenture.
ADAE. (2005). Guide méthodologique MAREVA : Analyse de la valeur des projets d’ADELE. Paris:
French Agency for the Development of Electronic Administration.
Agar, J. (2003). The Government Machine: A Revolutionary History of the Computer. Cambridge,
MA: MIT Press.
AGIMO. (2004). Demand & Value Assessment Methodology. Canberra: Australian Government
Information Management Office.
Alford, J. & Hughes, O. (2008). Public Value Pragmatism as the Next Phase of Public Management.
The American Review of Public Administration, 38(2), 130-148.
Allen, D. K. & Wilson, T. D. (1996). Information strategies in UK higher education institutions.
International Journal of Information Management, 16(4), 239-251.
Andersen, K. V. & Henriksen, H. Z. (2006). E-government maturity models: Extension of the Layne
& Lee model. Government Information Quarterly, 23(2), 236-248.
Andresen, J., Baldwin, A., Betts, M., Carter, C., Hamilton, A., Stokes, E. & Thorpe, T. (2000). A
framework for measuring IT innovation benefits. ITcon, 5, 57-72.
Angehrn, A. (1997a). Designing mature internet business strategies: The ICDT model. European
Management Journal, 15(4), 361-369.
Angehrn, A. (1997b). The Strategic Implications of the Internet. Paper presented at the 5th European
Conference on Information Systems. Retrieved 22 September 2009, from
http://www.calt.insead.edu/Publication/ICDT/strategicImplication.htm
Argyris, C. & Schön, D. A. (1978). Organizational Learning: A Theory of Action Perspective.
Reading, MA: Addison Wesley.
Argyris, C. & Schön, D. A. (1999). On Organizational Learning (2nd ed.). Oxford: Blackwell
Publishers.
Armbrust, M., Fox, A., Griffith, R., Joseph, A. D., Katz, R., Konwinski, A., . . . Zaharia, M. (2010). A
view of cloud computing. Communications of the ACM, 53(4), 50-58.
Arshad, Y., Ahlan, A. R. & Ibrahim, S. N. S. (2013). Combining Grounded Theory and Case Study
Methods in IT Outsourcing Study. Journal of Information Systems Research and Innovation, 4,
84-93.
Arviansyah, A. (2015). Unraveling equivocality in evaluations of information systems projects. (PhD),
University of Twente, Enschede, The Netherlands.
Ashurst, C. & Doherty, N. F. (2003). Towards the formulation of a ‘best practice’ framework for
benefits realisation in IT projects. Electronic Journal of Information Systems Evaluation, 6(2), 1-
10.
Ashurst, C., Doherty, N. F. & Peppard, J. (2008). Improving the impact of IT development projects:
the benefits realization capability model. European Journal of Information Systems, 17(4), 352-
370.
Aspray, W. (Ed.) (1990). Computing before computers. Iowa: Iowa State University Press/AMES.
251
Atkinson, P. A. & Delamont, S. (2008). Analytic Perspectives. In N. K. Denzin & Y. S. Lincoln
(Eds.), Collecting and Interpreting Qualitative Materials (3rd ed.). Thousand Oaks, CA: Sage
Publications Inc.
Atkinson, R. (1999). Project management: cost, time and quality, two best guesses and a phenomenon,
its time to accept other success criteria. International Journal of Project Management, 17(6), 337-
342.
Atzori, L., Iera, A. & Morabito, G. (2010). The Internet of Things: A survey. Computer Networks,
54(15), 2787-2805.
Autor, D. H., Levy, F. & Murnane, R. J. (2003). The Skill Content of Recent Technological Change:
An Empirical Exploration. The Quarterly Journal of Economics, 118(4), 1279-1333.
Avison, D., Jones, J., Powell, P. & Wilson, D. (2004). Using and validating the strategic alignment
model. The Journal of Strategic Information Systems, 13(3), 223-246.
Awad, M. A. (2005). A comparison between agile and traditional software development
methodologies. (Honours Programme of the School of Computer Science and Software
Engineering Thesis), University of Western Australia, Crawley.
Baldry, D. (1998). The evaluation of risk management in public sector capital projects. International
Journal of Project Management, 16(1), 35-41.
Bannister, F. (2001a). Dismantling the silos: extracting new value from IT investments in public
administration. Information Systems Journal, 11(1), 65-84.
Bannister, F. (2001b). Value Evolution: Changing Perceptions of the Role and Value of Information
Technology in Irish Public Administration: Historic Development and Future Directions. (PhD),
Unversity College Dublin, Dublin. UCD Library Catalogue database.
Bannister, F. (2004). Deep e-Government. EGPA 2004 Annual Conference: Four months after:
Administering the New Europe, 1-4.
Bannister, F. (2007). The curse of the benchmark: an assessment of the validity and value of e-
government comparisons. International Review of Administrative Sciences, 73(2), 171-188.
Bannister, F. (2015). “Enacting electronic government success: An integrative study of government-
wide websites, organizational capabilities, and institutions” by Gil-Garcia, J Ramon, 2012 (Book
Review). Electronic Journal of e-Government, 13(1).
Bannister, F. & Connolly, R. (2011). Transformation and Public Sector Values. Paper presented at the
tGov 11, Brunel University, London.
Bannister, F. & Remenyi, D. (2003). The Societal Value of ICT: First Steps Towards an Evaluation
Framework. Electronic Journal of Information Systems Evaluation, 6(2), 197-206.
Bannister, F. & Walsh, N. (2002). The virtual public servant: Ireland’s public services broker.
Information Polity: The International Journal of Government & Democracy in the Information
Age, 7(2/3), 115.
Barnett, C., Barr, J., Christie, A., Duff, B. & Hext, S. (2010). Measuring the Impact and Value for
Money of Governance & Conflict Programmes. Hove, East Sussex: ITAD.
Barney, J. B. (1986). Types of Competition and the Theory of Strategy: Toward an Integrative
Framework. Academy of Management Review, 11(4), 791-800.
Baskerville, R. & Myers, M. D. (2004). Special Issue on Action Research in Information Systems:
Making IS Research Relevant to Practice-Forewood. MIS Quarterly, 28(3), 329-335.
Bazeley, P. (2007). Qualitative data analysis with NVivo. London: Sage Publications Limited.
252
Bazeley, P. (2009). Analysing Qualitative Data: More Than ‘Identifying Themes’. Malaysian Journal
of Qualitative Research (MJOR), 2, 6-22.
Bazeley, P. & Jackson, K. (2013). Qualitative data analysis with NVivo (2nd ed.). London: Sage
Publications Limited.
BCS. (2007). Success: Public Sector projects can work (BCS Ed.). London: British Computer Society.
Beekhuyzen, J. P., Nielsen, S. H. & Von Hellens, L. A. (2010). The Nvivo looking glass: Seeing the
data through the analysis. Paper presented at the 5th International Conference on
QualitativeResearch in IT & IT in Qualitative Research (QualIT2010).
Bekkers, V. (2003). Reinventing government in the information age. International practice in IT-
enabled public sector reform. Public Management Review, 5(1), 133 - 139.
Bekkers, V. & Homburg, V. (Eds.). (2005). The Information Ecology of E-Government: E-
Government as Institutional and Technological Innovation in Public Administration. Amsterdam:
IOS Press.
Bell, E. & Bryman, A. (2007). The Ethics of Management Research: An Exploratory Content
Analysis. British Journal of Management, 18(1), 63-77.
Bellamy, C. (2005). A Review of: “The Government Machine: A Revolutionary History of the
Computer”. Information Society, 21(5), 387-388.
Benbasat, I., Goldstein, D. K. & Mead, M. (1987). The case research strategy in studies of information
systems. MIS Quarterly, September 1987, 369-386.
Benbasat, I. & Zmud, R. W. (1999). Empirical research in information systems: the practice of
relevance. MIS Quarterly, 23(1), 3-16.
Benington, J. & Moore, M. H. (2011). Public value in complex and changing times. In J. Benington &
M. H. Moore (Eds.), Public value: Theory and practice (pp. 1-30). Basingstoke: Palgrave
Macmillan.
Benjamin, R. I. & Levinson, E. (1993). A framework for managing IT-enabled change. Sloan
management review, 34(4), 23-33.
Bennett, C. (2010). Directgov App selected as e-government awards finalist. Cam Bennett Online.
Retrieved from http://cambennettonline.com/blog/directgov-app-selected-as-e-government-
awards-finalist
Bergin, M. (2011). NVivo 8 and consistency in data analysis: reflecting on the use of a qualitative data
analysis program. Nurse Researcher, 18(3), 6-12.
Bharadwaj, A., El Sawy, O. A., Pavlou, P. A. & Venkatraman, N. (2013). Digital Business Strategy:
Toward a Next Generation of Insights. MIS Quarterly, 37(2), 471-482.
Bhatnagar, S. C. (2004). E-government: From Vision to Implementation: a Practical Guide with Case
Studies: Sage Publications.
Blaug, R., Horner, L. & Lekhi, R. (2006). Public value, politics and public management. A literature
review. London: The Work Foundation.
Blaxter, L., Hughes, C. & Tight, M. (2001). How to research (2nd ed.). Buckingham: Open University
Press.
Blodgett, J. H. & Schultz, C. K. (1969). Herman Hollerith: data processing pioneer. American
Documentation, 20(3), 221-226.
Blumberg, B. F., Cooper, D. R. & Schindler, P. S. (2014). Business Research Methods (4th ed.).
Maidenhead, UK: McGraw-Hill.
253
Boblin, S. L., Ireland, S., Kirkpatrick, H. & Robertson, K. (2013). Using Stake’s Qualitative Case
Study Approach to Explore Implementation of Evidence-Based Practice. Qualitative health
research, 23(9), 1267-1275.
Bourdon, S. (2002). The Integration of Qualitative Data Analysis Software in Research Strategies:
Resistances and Possibilities. Forum Qualitative Sozialforschung / Forum: Qualitative Social
Research, 3(2).
Bowen, G. A. (2005). Preparing a qualitative research-based dissertation: Lessons learned. The
Qualitative Report, 10(2), 208-222.
Bowers, S. (2010). NHS computer upgrade in crisis as supplier CSC misses critical deadline. The
Guardian. 31 March. Retrieved from http://www.guardian.co.uk/business/2010/mar/31/nhs-
software-crisis
Bracken, M. (2013). Digital Government. Paper presented at the The Public Sector Show 2013,
London.
Bradley, G. (2006). Benefit Realisation Management: A practical guide to achieving benefits through
change. Farnham: Gower Publishing, Ltd.
Bradley, G. (2010). Benefit Realisation Management: A practical guide to achieving benefits through
change (2nd ed.). Farnham: Gower Publishing, Ltd.
Brewer, M., Browne, J. & Wenchao, J. (2011). Universal Credit: a preliminary analysis, . London:
Institute for Fiscal Studies.
Bringer, J. D., Johnston, L. H. & Brackenridge, C. H. (2006). Using Computer-Assisted Qualitative
Data Analysis Software to Develop a Grounded Theory Project. Field Methods, 18(3), 245-266.
Brinkerhoff, D. (2005). Organisational legitimacy, capacity and capacity development. (Vol. Capacity
Study Reflection). Maastricht: RTI International.
Brown, T. (2001). Modernisation or Failure? IT Development Projects in the UK Public Sector.
Financial Accountability and Management, 17(4), 363-381.
Bryman, A. & Bell, E. (2007). Business Research Methods (2nd ed.). Oxford; New York: Oxford
University Press.
Bryman, A. & Bell, E. (2011). Business Research Methods (3rd ed.). Oxford; New York: Oxford
University Press.
Buzan, T. & Buzan, B. (2006). The Mind Map Book. Harlow: Pearson Education Group.
Cabinet Office. (1999). Modernising Government. London: The Stationery Office.
Cabinet Office. (2000). e-Government: A Strategic Framework for Public Services in the Information
Age. London: Cabinet Office.
Cabinet Office. (2005). Transformational Government: Enabled by Technology. London: The
Stationery Office.
Cabinet Office. (2006). Transformational Government: Implementation Plan. London: Stationery
Office.
Cabinet Office. (2010). Response by Minister for the Cabinet Office Francis Maude to the Directgov
2010 and Beyond Report. London: Cabinet Office.
Cabinet Office. (2012). Government Digital Strategy. London: Cabinet Office.
Campbell, D. T. & Stanley, J. C. (1963). Experimental and quasi-experimental designs for research.
Boston: Houghton Mifflin Company.
254
Campbell-Kelly, M. (2009). Origin of Computing. Scientific American Magazine, 301(3), 62-69.
Campbell-Kelly, M. & Aspray, W. (2004). Computer: a history of the information machine (2nd ed.).
Boulder, Colorado: Westview Press.
Capgemini. (2008). Scotland’s national procurement service wins top award for UK eGovernment.
Media and Analysts: News Alert. Retrieved from https://www.uk.capgemini.com/news/scotlands-
national-procurement-service-wins-top-award-for-uk-egovernment
Carroll, C. F. (2013). IT Success and Failure — the Standish Group CHAOS Report Success Factors.
Chris F Carroll. Retrieved from http://www.cafe-encounter.net/p1183/it-success-and-failure-the-
chaos-report-factors
Carroll, J. D. (1998). The entrepreneurial bureaucrat. Public Administration Review, 58(2), 180-182.
Carroll, J. M. & Swatman, P. (2000). Structured-case: a methodological framework for building theory
in information systems research. European Journal of Information Systems, 9(4), 235-242.
Cassell, C. & Symon, G. (2006). Taking qualitative methods in organization and management research
seriously. Qualitative Research in Organizations and Management: An International Journal,
1(1), 4-12.
Chan, C. & Swatman, P. M. C. (2004). B2B e-commerce stages of growth: the strategic imperatives.
Paper presented at the 37th Annual Hawaii International Conference on System Sciences, 2004
(HICSS ‘04), Hawaii.
Chan, Y. E. & Reich, B. H. (2007). IT alignment: what have we learned? Journal of Information
Technology, 22(4), 297-315.
Chang, A.-M. & Kannan, P. K. (2008). Leveraging Web 2.0 in government. Washington, DC: IBM
Center for the Business of Government.
Charmaz, K. (2000). Grounded Theory: Objectivist and Constructivist Methods. In N. K. Denzin & Y.
S. Lincoln (Eds.), Handbook of qualitative research (2nd ed.). Thousand Oaks, California: Sage
Publications.
Charmaz, K. (2008). Grounded Theory as an Emergent Method. In S. N. Hesse-Biber & P. Leavy
(Eds.), Handbook of Emergent Methods (pp. 155-172). New York: The Guilford Press.
Chee-Wee, T., Benbasat, I. & Cenfetelli, R. T. (2008). Building Citizen Trust towards e-Government
Services: Do High Quality Websites Matter? Paper presented at the 41st Hawaii International
Conference on System Sciences, 2008 (HICSS ‘08), Hawaii.
Chen, W. & Hirschheim, R. (2004). A paradigmatic and methodological examination of information
systems research from 1991 to 2001. Information Systems Journal, 14(3), 197-235.
Chui, M., Löffler, M. & Roberts, R. (2010). The internet of things. McKinsey Quarterly, 2(2010), 1-9.
Chun, S. A., Shulman, S., Sandoval, R. & Hovy, E. (2010). Government 2.0: Making connections
between citizens, data and government. Information Polity, 15(1), 1.
CJIT. (2007). The CJIT Guide. London: Office for Criminal Justice Reform.
Clark, M. (2010). State Support for the Expansion of UK University Computing in the 1950s. Annals
of the History of Computing, IEEE, 32(1), 23-33.
Clear, T. (2005). Critical Enquiry in Computer Science Education. In S. Fincher & M. Petre (Eds.),
Computer Science Education Research: The Field and The Endeavour (pp. 101-125). London:
Routledge Falmer, Taylor & Francis Group.
CMMI Product Team. (2002). Capability Maturity Model® Integration (CMMI SM), Version 1.1, SEI-
2002-TR-012. Pittsburg: Software Engineering Institute, Carnegie Mellon University.
255
Codagnone, C. (2008). Editorial: Efficiency and effectiveness. European Journal of ePractice, 13(4).
Retrieved from http://www.epracticejournal.eu
Coffey, A. J. & Atkinson, P. A. (1996). Making sense of qualitative data: Complementary research
strategies. London: Sage Publications, Inc.
Cohen, S., Dori, D., de Haan, U., Cohen, S., De Haan, U. & Dori, D. (2010). A software system
development life cycle model for improved stakeholders’ communication and collaboration.
International Journal of Computers, Communications & Control, 1, 23-44.
Coiera, E. W. (2007). Lessons from the NHS National Programme for IT. Medical journal of
Australia, 186(1), 3.
Coll, L. (2009). Does Directgov deliver? London: Consumer Focus.
Collins, T. (2013). Universal Credit IT – is the DWP still deceiving itself and the public?
Campaign4Change. 7 August 2013. Retrieved from
http://ukcampaign4change.com/2013/08/07/universal-credit-it-is-the-dwp-still-deceiving-itself-
and-the-public/
Collis, J. & Hussey, R. (2014). Business Research: A practical guide for postgraduate and
undergraduate students (4th ed.). London: Palgrave Macmillan Higher Education.
Comptroller and Auditor General. (2007). Value For Money (VFM). (Report No. 56). Dublin:
Department of Finance.
Connolly, R. (2007). Trust and the Taxman: a Study of the Irish Revenue’s Website Service Quality.
Electronic Journal of e-Government, 5(2), 127-134.
Connolly, R. & Bannister, F. (2008). eTax Filing & Service Quality: The Case of the Revenue Online
Service. Paper presented at the World Academy of Science, Engineering and Technology
(WASET) 2008, Venice.
Connolly, R. & Bannister, F. (2009). The Revenue Online System: Factors Influencing Adoption.
Paper presented at the UK Academy for Information Systems (UKAIS) 14th Annual Conference
2009, St Anne’s College, University of Oxford, Oxford.
Connolly, R., Bannister, F. & Kearney, A. (2010). Government website service quality: a study of the
Irish revenue online service. European Journal of Information Systems, 19(6), 649-667.
Conti, J. P. (2006). The Internet of things. Communications Engineer, 4(6), 20-25.
Coram, M. & Bohner, S. (2005). The impact of agile methods on software project management. Paper
presented at the 12th IEEE International Conference and Workshops on the Engineering of
Computer-Based Systems (ECBS ‘05).
Cordella, A. & Bonina, C. M. (2012). A public value perspective for ICT enabled public sector
reforms: A theoretical reflection. Government Information Quarterly, 29(4), 512-520.
Cordella, A. & Willcocks, L. (2012). Government policy, public value and IT outsourcing: The
strategic case of ASPIRE. The Journal of Strategic Information Systems, 21(4), 295-307.
Córdoba-Pachón, J.-R. (2015). Systems Thinking to Improve E-Government Evaluation. International
Journal of Public Administration in the Digital Age (IJPADA), 2(4), 1-15.
Cortada, J. W. (1996). Information Technology as Business History: Issues in the History and
Management of Computers (Vol. no.177, Contributions in Economics and Economic History).
Westport, Connecticut; London: Greenwood Press.
Craig, J. & Yetton, P. (1992). Business Process Redesign: A Critique of Process Innovation by
Thomas Davenport as a Case Study in the Literature. Australian Journal of Management
(University of New South Wales), 17(2), 285.
256
Creswell, J. W. (1994). Research design: Quantitative and qualitative approaches: Thousand Oaks,
CA: Sage.
Creswell, J. W. (2009). Research design: Qualitative, quantitative, and mixed methods approaches
(3rd ed.). London: Sage Publications Ltd.
Creswell, J. W. & Clark, V. L. P. (2007). Designing and conducting mixed methods research.
Thousand Oaks, CA: Sage Publications, Inc.
Creswell, J. W. & Miller, D. L. (2000). Determining Validity in Qualitative Inquiry. Theory Into
Practice, 39(3), 124.
Cross, M. (2004). Direct to your destination. The Guardian. 4 March 2009. Retrieved from
http://www.guardian.co.uk/technology/2004/mar/04/internet.egovernment
Cross, M. (2007). Chattering classes deserve a debate about e-government. The Guardian. 20
December 2007. Retrieved from
http://www.guardian.co.uk/technology/2007/dec/20/egovernment.it
Cross, M. (2010). E-government is not a financial cure-all. The Guardian. 6 April 2010. Retrieved
from http://www.guardian.co.uk/commentisfree/libertycentral/2010/apr/06/smarter-government-
costs-services
Cruickshank, J. (2010). Fixing NHS IT: A Plan of Action for a New Government (2020health Ed.).
London: 2020health.
Curtain, G. G., Sommer, M. H. & Vis-Sommer, V. (2004). The World of E-Government: Haworth
Press.
Dadayan, L. (2006). Measuring return on government IT investments. Paper presented at the 13th
European Conference on Information Technology Evaluation (ECITE), Genoa, Italy.
Dalcher, D. (2005). Breakthrough IT Change Management: How to Get Enduring Change Results
(Book Review). Project Management Journal, 36(1), 62-62.
Dalcher, D. & Genus, A. (2003). Introduction: Avoiding IS/IT Implementation Failure. Technology
Analysis & Strategic Management, 15(4), 403-407.
Daniels, C. B. & LaMarsh, W. J. (2007). Complexity as a Cause of Failure in Information Technology
Project Management. Paper presented at the IEEE International Conference on System of Systems
Engineering, 2007 (SoSE ‘07), San Antonio, TX.
Danish Digital Task Force. (2004). The Danish eGovernment Strategy 2004-2006: Realising The
Vision. Copenhagen: Danish Digital Task Force (DTF).
Davenport, T. H. (1993a). Process innovation: reengineering work through information technology.
Boston: Harvard Business School Press.
Davenport, T. H. (1993b). “Reengineering the Corporation” by Michael Hammer and James A.
Champy (Book Review). Sloan management review, 35(1), 103.
Davenport, T. H. (2005). The coming commoditization of processes. Harvard Business Review, 83(6),
100-108.
Davenport, T. H. & Short, J. E. (1990). The New Industrial Engineering: Information Technology and
Business Process Redesign. Sloan management review, 31(4), 11-27.
Davies, W. (2005). Is it Aldous Huxley or George Orwell? New Statesman, Special Supplement:
Joined-up Criminal Justice (1 August 2005).
Davis, F. D. (1986). A Technology Acceptance Model for Empirically Testing New End-User
Information Systems: Theory and Results. (PhD), Massachusetts Institute of Technology (MIT),
Cambridge, MA, US.
257
Davis, F. D. (1989). Perceived Usefulness, Perceived Ease of Use, and User Acceptance of
Information Technology. MIS Quarterly, 13(3), 319-340.
Dawson, L. (2008). Active exploration of emerging themes in a study of object-oriented requirements
engineering: the “Evolutionary Case” approach. The Electronic Journal of Business Research
Methods, 6(1), 29-42.
de Bri, F. & Bannister, F. (2015). E-Government Stage Models: A Contextual Critique. Paper
presented at the 48th Annual Hawaii International Conference on System Sciences, 2015 (HICSS
‘15).
de Brí, F. & Bannister, F. (2010). Whole-of-Government: The Continuing Problem of Eliminating
Silos. Paper presented at the 10th European Conference on E-government (ECEG), Limerick.
de Vaus, D. A. (2001). Research Design in Social Research. London: Sage Publications Ltd.
Delany, W. (1960). Some field notes on the problem of access in organizational research.
Administrative Science Quarterly, 448-457.
DeLone, W. H. & McLean, E. R. (1992). Information Systems Success: The Quest for the Dependent
Variable. Information Systems Research, 3(1), 60-95.
DeLone, W. H. & McLean, E. R. (2003). The DeLone & McLean Model of Information Systems
Success: A Ten-Year Update. Journal of Management Information Systems, 19(4), 9-30.
Denhardt, R. B. & Denhardt, J. V. (2009). Public administration: An action orientation (6th ed.).
Belmont, CA: Thomson Wadsworth.
Denzin, N. K. (2009). The elephant in the living room: or extending the conversation about the politics
of evidence. Qualitative Research, 9(2), 139-160.
Denzin, N. K. & Lincoln, Y. S. (2008a). Introduction: The discipline and practice of qualitative
research. In N. K. Denzin & Y. S. Lincoln (Eds.), Collecting and Interpreting Qualitative
Materials (3rd ed.). Thousand Oaks, CA: Sage Publications Inc.
Denzin, N. K. & Lincoln, Y. S. (Eds.). (2005). The Sage Handbook of Qualitative Research (3rd ed.).
Thousand Oaks, California: Sage Publications.
Denzin, N. K. & Lincoln, Y. S. (Eds.). (2008b). Collecting and Interpreting Qualitative Materials (3rd
ed.). Thousand Oaks, CA: Sage Publications Inc.
Department of Health. (2010). The future of the National Programme for IT. Retrieved from
http://webarchive.nationalarchives.gov.uk/+/www.dh.gov.uk/en/MediaCentre/Pressreleases/DH_1
19293
Department of Public Expenditure & Reform. (1997). Quality Customer Service. Retrieved from
http://per.gov.ie/quality-customer-service/
Department of the Taoiseach. (1996). Delivering Better Government. Dublin: The Stationery Office.
Department of the Taoiseach. (1999). Implementing the Information Society in Ireland: An Action
Plan. Dublin: The Stationery Office.
Department of the Taoiseach. (2002). New Connections - A Strategy to realise the potential of the
Information Society. Dublin: The Stationery Office.
Devlin, L. (1969). Report of the Public Services Organisation Review Group 1966-1969 (The Devlin
Report). Dublin: The Stationery Office.
Dey, I. (1993). Qualitative data analysis: A user friendly guide for social scientists. London: Taylor &
Francis.
258
Di Maio, A. (2005). U.K. Criminal Justice System Makes Portfolio Management Key to IT Success.
Egham: Gartner.
Directgov. (2009). About Directgov. Retrieved from
http://www.direct.gov.uk/en/SiteInformation/DG_4004497
Doherty, N. F., Ashurst, C. & Peppard, J. (2011). Factors affecting the successful realisation of
benefits from systems development projects: findings from three case studies. Journal of
Information Technology, 27(1), 1-16.
Dolman-Darrall, P. (2013). Focus on Outcomes. (Vol. June 2013). London: British Computer Society
(BCS).
Donnellan, B. & Helfert, M. (2010). The IT-CMF: a practical application of design science. Paper
presented at the DESRIST 2010, LNCS 6105, St. Gallen, Switzerland.
Downs, A. (1967). Inside bureaucracy (Rand Corporation, ed.). Boston: Little, Brown
Draper, A. K. (2004). The principles and application of qualitative research. Proceedings of the
Nutrition Society, 63(04), 641-646.
Drucker, P. F. (1974). Management: tasks, responsibilities, practices. London: Butterworth-
Heinemann.
Dunleavy, P. (2003). Authoring a Ph.D.: How to Plan, Draft, Write and Finish a Doctoral Dissertation:
Palgrave MacMillan.
Dunleavy, P., Margetts, H., Bastow, S. & Tinkler, J. (2006). New Public Management Is Dead--Long
Live Digital-Era Governance. Journal of Public Administration Research and Theory, 16(3), 467-
494.
Dybå, T. & Dingsøyr, T. (2008). Empirical studies of agile software development: A systematic
review. Information and Software Technology, 50(9–10), 833-859.
Dybå, T. & Dingsøyr, T. (2009). What Do We Know about Agile Software Development? Software,
IEEE, 26(5), 6-9.
e-Gov Unit/CJIT. (2006). UK Approach to Benefits Realisation: Country Report in Support of the
eGovernment Expert Meeting on the Cost and Benefit Analysis of e-Government - Feb 04. [Final
Version 0.11]. London: e-Gov Unit & CJIT.
Earl, M. J. (2000). Evolving the e-business. Business Strategy Review, 11(2), 33-38.
Easterby-Smith, M. (1997). Disciplines of Organizational Learning: Contributions and Critiques.
Human Relations, 50(9), 1085-1113.
Easterby-Smith, M., Thorpe, R. & Lowe, A. (2002). Management Research: An Introduction. London:
Sage Publications Ltd.
ECOTEC. (2007). A Handbook for Citizen-centric eGovernment. Brussels: eGovernment unit, DG
Information Society and Media, European Commission.
Edwards, P. N. (1998). Review: Virtual Machines, Virtual Infrastructures: The New Historiography of
Information Technology. Isis, 89(1), 93-99.
Eggers, W. D. (2007). Government 2.0: Using technology to improve education, cut red tape, reduce
gridlock, and enhance democracy. Lanham, MD: Rowman & Littlefield.
Eisenhardt, K. M. (1989). Building Theories from Case Study Research. Academy of Management
Review, 14(4), 532.
259
Elpez, I. & Fink, D. (2006). Information Systems Success in the Public Sector: Stakeholders’
Perspectives and Emerging Alignment Model. Issues in Informing Science & Information
Technology, 3, 219-232.
epractice.eu. (2009). eGovernment Factsheet - Ireland - History. epractice.eu. 23 August 2009.
Retrieved from http://epractice.eu/en/document/288268
European Commission. (2006). eGovernment Economics Project (eGEP): Measurement Framework
Final Version. Brussels: European Commisssion, DG Information Society.
European Commission. (2013). Assessing User Centric eGovernment performance in Europe –
eGovernment Benchmark 2012. Brussels: Capgemini.
Eveleens, J. L. & Verhoef, C. (2010). The rise and fall of the Chaos report figures. Software, IEEE,
27(1), 30-36.
Farbey, B., Land, F. & Targett, D. (1999). Moving IS evaluation forward: learning themes and
research issues. The Journal of Strategic Information Systems, 8(2), 189-207.
Federal CIO Council. (2002). Value Measuring Methodology. Washington, D.C.: CIO Council, Best
Practices Committee.
Fernández, W. (2012). The grounded theory method and case study data in IS research: issues and
design. In D. N. Hart & S. D. Gregor (Eds.), Information Systems Foundations: Theory Building in
Information Systems (pp. 43-59). Canberra, Australia: ANU E Press.
Ferraro, A. (2009). A Review of: Building Strong Nations. Improving Governability and Public
Management by Eran Vigoda-Gadot. Farnham, UK: Ashgate, 2009. International Public
Management Journal, 12(4), 506 - 507.
Ferry, G. (2003). A Computer Called Leo: Lyons Tea Shops and the World’s First Office Computer.
London: Fourth Estate.
Fielding, N. & Lee, R. M. (1998). Computer analysis and qualitative research. London: Sage
Publications Ltd.
Flyvbjerg, B. (2006). From Nobel prize to project management: getting risks right. Project
Management Journal, 37(3), 5-15.
Flyvbjerg, B. & COWI. (2004). Procedures for dealing with optimism bias in transport Planning:
Guidance document. London: The British Department for Transport.
Flyvbjerg, B., Holm, M. S. & Buhl, S. (2002). Underestimating Costs in Public Works Projects: Error
or Lie? Journal of the American Planning Association, 68(3), 279-295.
Flyvbjerg, B., Holm, M. S. & Buhl, S. (2005). How (in) accurate are demand forecasts in public works
projects. Journal of the American Planning Association, 71(2), 131-146.
Fontana, A. & Frey, J. H. (2000). The Interview: From Structured Questions to Negotiated Text. In N.
K. Denzin & Y. S. Lincoln (Eds.), Handbook of qualitative research (2nd ed.). Thousand Oaks,
California: Sage Publications.
Fontana, A. & Frey, J. H. (2008). The Interview: From Neutral Stance to Political Involvement. In N.
K. Denzin & Y. S. Lincoln (Eds.), Collecting and Interpreting Qualitative Materials (3rd ed.).
Thousand Oaks, CA: Sage Publications Inc.
Fortune, J. & Peters, G. (2005). Information systems : achieving success by avoiding failure.
Chichester: John Wiley.
Fox, M. L. (2010). Directgov 2010 and Beyond: Revolution Not Evolution. London: Race Online
2012.
Freeman, R. E. (1984). Strategic Management: A Stakeholder Approach. Boston: Pitman Publishing.
260
Freeman, R. E. (2004). The Stakeholder Approach Revisited. Zeitschrift fuer Wirtschafts- und
Unternehmensethik. Journal for Business, Economics and Ethics, 5(3), 228-241.
Freeman, R. E. & McVea, J. (2001). A Stakeholder Approach to Strategic Management. Darden
Business School Working Paper Series, No. 01-02, 1-32.
Frisk, J. E., Bannister, F. & Lindgren, R. (2015). Evaluation of information system investments: a
value dials approach to closing the theory-practice gap. Journal of Information Technology, 30(3),
276-292.
Fuchs, G. (2004). Change management - An underestimated key to success? DM Review, 14(12), 26.
Fuchs, S. E. (2001). Organizational change in the internet age. The Rational Edge. Retrieved from
http://www.oakhill-llc.com/docs/Sid-Organizational.change.in.the.internet.age.pdf
Fudge, M. K. (2013). Book Review: Enacting Electronic Government Success—An Integrative Study
of Government-wide Website, Organizational Capabilities, and Institutions. The American Review
of Public Administration, 43(3), 371-374.
Fujiwara, D. & Campbell, R. (2011). Valuation Techniques for Social Cost-Benefit Analysis. London:
HM Treasury.
Galliers, R. D. (1991). Choosing appropriate information systems research approaches: a revised
taxonomy. In H.-E. Nissen, H. K. Klein & R. Hirschheim (Eds.), Information Systems Research:
Contemporary Approaches and Emergent Traditions. Amsterdam: Elsevier North-Holland, Inc.
Gardner, S. & Ash, C. G. (2003). ICT-enabled organisations: a model for change management.
Logistics Information Management, 16(1), 18-24.
Gat, I. (2010). Standish Group Chaos Reports Revisited. The Agile Executive. Retrieved from
http://theagileexecutive.com/2010/01/11/standish-group-chaos-reports-revisited/
Gauld, R. & Goldfinch, S. (2006). Dangerous Enthusiasms: E-Government, Computer Failure and
Information Systems Development. Dunedin, New Zealand: Otago University Press.
Gelderman, C. J. & Van Weele, A. J. (2005). Purchasing Portfolio Models: A Critique and Update.
Journal of Supply Chain Management, 41(3), 19-28.
German Federal Ministry of the Interior. (2004). WiBe 4.0 - Recommendations on Economic
Efficiency Assessments in the German Federal Administration, in Particular with Regard to the
Use of Information Technology. Berlin: BdI, Department IT 2 (KBSt).
Gershon, P. (2004). Releasing Resources to the Front Line: Independent Review of Public Sector
Efficiency: Her Majesty’s Stationery Office.
Ghachem, L. (2006). Maturity of electronic commerce: A review of the principal models. Paper
presented at the FEBR 2006, Tampere, Finland.
Gibbs, G. R. (2002). Qualitative data analysis: Explorations with NVivo. Maidenhead: Open
University Press.
Gibbs, G. R. (2012). NVivo 10: Introductory Manual (Vol. Version 2.00). Huddersfield: University of
Huddersfield.
Gil-Garcia, J. R. (2012). Enacting electronic government success: An integrative study of government-
wide websites, organizational capabilities, and institutions (Vol. 31). New York: Springer Science
& Business Media.
Gil-Garcia, J. R. & Pardo, T. A. (2005). E-government success factors: Mapping practical tools to
theoretical foundations. Government Information Quarterly, 22(2), 187-216.
Gillmor, C. S. (2007). Stanford, the IBM 650, and the First Trials of Computer Date Matching. Annals
of the History of Computing, IEEE, 29(1), 74-80.
261
Glaser, B. G. (1978). Theoretical sensitivity: Advances in the methodology of grounded theory (Vol.
2). Mill Valley, CA: Sociology Press.
Glaser, B. G. (1992). Emergence vs Forcing: Basics of grounded theory analysis. Mill Valley, CA:
Sociology Press.
Glaser, B. G. (1998). Doing Grounded Theory: Issues and Discussions. Mill Valley, CA: Sociology
Press.
Glaser, B. G. (1999). The future of grounded theory. Qualitative health research, 9(6), 836-845.
Glaser, B. G. & Strauss, A. L. (1967). The discovery of grounded theory: Strategies for qualitative
research. Hawthorn, New York: Aldine de Gruyter.
Glaser, B. G. & Strauss, A. L. (1999). The discovery of grounded theory: Strategies for qualitative
research. Hawthorn, New York: Aldine de Gruyter.
Glass, R. L. (2005). IT Failure Rates - 70% or 10-15%? Software, IEEE, 22(3), 110-112.
Glass, R. L. (2006). The Standish Report: Does It Really Describe a Software Crisis? Communications
of the ACM, 49(8), 15-16.
Goldfinch, S. (2007). Pessimism, Computer Failure, and Information Systems Development in the
Public Sector. Public Administration Review, 67(5), 917-929.
Goles, T. & Hirschheim, R. (2000). The paradigm is dead, the paradigm is dead… long live the
paradigm: the legacy of Burrell & Morgan. Omega, 28(3), 249-268.
Goo, J., Kishore, R., Rao, H. R. & Nam, K. (2009). The Role of Service Level Agreements in
Relational Management of Information Technology Outsourcing: An Empirical Study. MIS
Quarterly, 33(1), 119-145.
Government Digital Service. (2011a). Alpha.gov.uk wrap-up. Retrieved from
http://digital.cabinetoffice.gov.uk/2011/07/29/alpha-gov-uk-wrap-up/
Government Digital Service. (2011b). A few design rules for Alpha.gov.uk. Retrieved from
http://digital.cabinetoffice.gov.uk/2011/04/28/alpha-gov-uk-design-rules/ - more-99
Government Digital Service. (2011c). The power of the disinterested. Retrieved from
http://digital.cabinetoffice.gov.uk/2011/05/09/the-power-of-the-disinterested/
Government Digital Service. (2011d). Towards a simpler, smaller, nimbler, cheaper, better gov.uk.
Retrieved from http://digital.cabinetoffice.gov.uk/2011/04/28/alpha-gov-uk-design-rules/ - more-
99
Government Digital Service. (2013). Government Service Design Manual. Retrieved from
https://www.gov.uk/service-manual/start
Government Digital Service. (2015). Digital by Default Service Standards. Retrieved from
https://www.gov.uk/service-manual/digital-by-default
Grant, G. & Chau, D. (2006). Developing a generic framework for e-government. In M. Gordon
Hunter & F. B. Tan (Eds.), Advanced Topics in Information Management (Vol. 5). London: Idea
Group Publishing London.
Grant, I. (2006). IT strategy @ UK.gov. Infosecurity Today, 3(4), 14-18.
Grant, I. (2009). UK government shuts down half its websites, 600 more to close. Computer Weekly. 5
August 2009. Retrieved from http://www.computerweekly.com/Articles/2009/08/05/237197/uk-
government-shuts-down-half-its-websites-600-more-to.htm
Gray, C. (1996). Inquiry Through Practice: Developing Appropriate Research Strategies. No Guru, No
Method. Helsinki, Finland: UIAH.
262
Greenhalgh, T., Russell, J. & Swinglehurst, D. (2005). Narrative methods in quality improvement
research. Quality and Safety in Health Care, 14(6), 443-449.
Guest, G., Bunce, A. & Johnson, L. (2006). How Many Interviews Are Enough? Field Methods, 18(1),
59-82.
Hackett, G. (1981). Survey Research Methods. The Personnel and Guidance Journal, 599-604.
Hahamis, P. (2011). A quest for an applicable model of growth for Directgov. Paper presented at the
11th European Conference on E-Government (ECEG 2011), Ljubljana, Slovenia.
Hair, J. F., Money, A. H., Samouel, P. & Page, M. (2007). Research methods for business: West
Sussex, John Wiley & Sons Ltd.
Halaweh, M. (2012). Integration of Grounded Theory and Case Study: An Exemplary Application
from E-commerce Security Perception Research. Journal of Information Technology Theory and
Application (JITTA), 13(1), 31-51.
Hallsworth, M., Nellis, G. & Brass, M. (2009). Installing New Drivers: How to improve government’s
use of IT. London: Institute for Government.
Hammer, M. & Champy, J. (1993). Reengineering the corporation: A manifesto for business
evolution. London: Nicholas Brealey Publishing Ltd.
Hammoud, M. S. (2008). Assessing project success: Comparing integrated change management and
change management. (PhD), Northcentral University, Prescott Valley, Arizona.
Harris, M. (2012). Introduction to IT-CMF Financial Critical Capabilities (CCs). Malvern: David
Consulting Group.
Hazlett, S. A. & Hill, F. (2003). E-government: the realities of using IT to transform the public sector.
MANAGING SERVICE QUALITY, 13, 445-452.
Heath, H. & Cowley, S. (2004). Developing a grounded theory approach: a comparison of Glaser &
Strauss. International Journal of Nursing Studies, 41(2), 141-150.
Heeks, R. (2006). Implementing and managing eGovernment: An International Text. London: Sage.
Heeks, R. & Bailur, S. (2007). Analyzing e-government research: Perspectives, philosophies, theories,
methods, and practice. Government Information Quarterly, 24(2), 243-265.
Heeks, R. & Bhatnagar, S. (2001). Understanding success and failure in information age reform. In R.
Heeks (Ed.), Reinventing government in the information age: international practice in IT-enabled
public sector reform (pp. 49). London/New York: Routledge.
Heeks, R. & Stanforth, C. (2007). Understanding e-Government project trajectories from an actor-
network perspective. European Journal of Information Systems, 16(2), 165.
Heine, M. L., Grover, V. & Malhotra, M. K. (2003). The relationship between technology and
performance: a meta-analysis of technology models. Omega, 31(3), 189-204.
Hekkala, R. (2007). “Grounded Theory–the two faces of the methodology and their manifestation in IS
research‟. Paper presented at the 30th Information Systems Research Seminar in Scandinavia
IRIS, Tampere, Finland.
Henderson, J. C. & Venkatraman, N. (1989). Strategic Alignment: A Model for Organisational
Transformation. In T. Kochan & M. Unseem (Eds.), Transforming Organisations. New York:
Oxford University Press.
Henderson, J. C. & Venkatraman, N. (1993). Strategic alignment: Leveraging information technology
for transforming organizations. IBM Systems Journal, 32(1), 4-16.
263
Heron, J. (1996). Co-operative Inquiry: Research into the Human Condition. London: Sage
Publications Ltd.
Heron, J. & Reason, P. (1997). A participatory inquiry paradigm. Qualitative inquiry, 3(3), 274-294.
Hess, E. D. (2012). Creating An Innovation Culture: Accepting Failure is Necessary. Forbes. 20 June
2012. Retrieved from http://www.forbes.com/sites/darden/2012/06/20/creating-an-innovation-
culture-accepting-failure-is-necessary/
Hess, E. D. (2014). Learn Or Die: Using Science to Build a Leading-edge Learning Organization.
Chichester: Columbia University Press.
Hill, G. (2011). How can you tell when there has been a contribution to knowledge (in a doctoral
research study)?. The (research) supervisor’s friend. Retrieved from
https://supervisorsfriend.wordpress.com/2011/05/17/how-can-you-tell-when-there-has-been-a-
contribution-to-knowledge-in-a-doctoral-research-study/
Hiller, J. & Belanger, F. (2001). Privacy Strategies for Electronic Government. In M. A. Abramson &
G. E. Means (Eds.), E-Government (pp. 162-198). Oxford: Rowman & Littlefield Publishers.
Hills, D. & Sullivan, F. (2006). Measuring public value 2: Practical approaches. London: The Work
Foundation.
Hirschheim, R. (1985). IS epistemology: an historical perspective. In E. Mumford, R. Hirschheim, G.
Fitzgerald & A. Wood-Harper (Eds.), Research Methods in Information Systems. Amsterdam:
Elsevier North-Holland, Inc.
Hirschheim, R. & Klein, H. K. (1989). Four paradigms of information systems development.
Communications of the ACM, 32(10), 1199-1216.
HM Government. (2012). The Civil Service Reform Plan. London: Government Digital Service.
HM Treasury. (2003). The Green Book: Appraisal and Evaluation in Central Government [3rd ed.].
London: The Stationery Office.
HM Treasury. (2004). Regularity, Propriety and Value for Money. Norwich: HMSO.
HM Treasury. (2007). Service Transformation Agreement. London: The Stationery Office.
HM Treasury. (2011). The Green Book: Appraisal and Evaluation in Central Government. London:
The Stationery Office.
Hoffer, C. W. (1975). Toward a Contingency Theory of Business Strategy. Academy of Management
Journal, 18(4), 784-810.
Homburg, V. M. F. (2008). Red Tape and Reforms: Trajectories of Technological and Managerial
Reforms in Public Administration. International Journal of Public Administration, 31(7), 749-770.
Hood, C. (1991). A Public Management for All Seasons? Public Administration, 69(1), 3-19.
Hood, C. & Lodge, M. (2004). Competency, Bureaucracy, and Public Management Reform: A
Comparative Analysis. Governance, 17(3), 313-333.
Hood, C. & Peters, G. (2004). The Middle Aging of New Public Management: Into the Age of
Paradox? Journal of Public Administration Research and Theory, 14(3), 267-282.
doi:10.1093/jopart/muh019
House of Commons. (2007). Delivering successful IT-enabled business change: Twenty-seventh
Report of Session 2006-07 (T. S. Office Ed.). London: House of Commons, Committee of Public
Accounts.
264
Howsawi, E. M., Eager, D. & Bagia, R. (2011). Understanding project success: The four-level project
success framework. Paper presented at the IEEE International Conference on Industrial
Engineering and Engineering Management (IEEM 2011), 6-9 Dec. 2011, Singapore.
Huai, J. (2011). Quality Evaluation of E-Government Public Service. Paper presented at the
International Conference on Management and Service Science (MASS), 12-14 Aug. 2011.
Hughes, J. & Jones, S. (2003). Reflections on the use of Grounded Theory in Interpretive Information
Systems Research. Paper presented at the 11th European Conference on Information Systems,
Naples, Italy.
Hughes, M., Scott, M. & Golden, W. (2006). The role of business process redesign in creating e-
government in Ireland. Business Process Management Journal, 12(1), 76-87.
Hughes, T. P. & Sheehan, J. R. (1999). What has influenced computing innovation? Computer, 32(2),
33-43.
Hutchison, A. J., Johnston, L. H. & Breckon, J. D. (2010). Using QSR NVivo to facilitate the
development of a grounded theory project: an account of a worked example. International Journal
of Social Research Methodology, 13(4), 283-302.
IEEE Spectrum. (2000). A backward glance. Arriving at the punched-card system. Spectrum, IEEE,
37(2), 58-61.
Ika, L. A. (2009). Project success as a topic in project management journals. Project Management
Journal, 40(4), 6-19.
In-Focus. (2008). Citizen-centric e-Government – Europe’s Roadmap. I-Ways, 31(2), 75-90.
Information Society Commission. (1997). Information Society Ireland: First Report of Ireland’s
Information Society Commission. Dublin: The Stationery Office.
Inovation Value Institute. (2012). IT Organizational Performance Improvement for Business Value:
Introducing the IT Capability Maturity Framework (IT-CMF). Maynooth, Ireland: Innovation
Value Institute.
Irani, Z., Love, P. E. D., Elliman, T., Jones, S. & Themistocleous, M. (2005). Evaluating e-
government: learning from the experiences of two UK local authorities. Information Systems
Journal, 15(1), 61-82.
Isaias, P. & Issa, T. (2015). High Level Models and Methodologies for Information Systems. New
York: Springer Science + Business Media.
Ishak, N. M. & Bakar, A. Y. A. (2012). Qualitative data management and analysis using NVivo: An
approach used to examine leadership qualities among student leaders. Education Research
Journal, 2(3), 94-103.
ITNow. (2013a). Agile Delivering Value. (Vol. June 2013). London: British Computer Society (BCS).
ITNow. (2013b). Agile. (Vol. June 2013). London: British Computer Society (BCS).
ITNow. (2013c). The CIO/IT Director Perspective. (Vol. June 2013). London: British Computer
Society (BCS).
Jackson, P. (2009). Making e-Government Pay: Realising benefits from ICT. PINpoint(June 2009),
12-14.
Jacob, S. A. & Furgerson, S. P. (2012). Writing Interview Protocols and Conducting Interviews: Tips
for Students New to the Field of Qualitative Research. Qualitative Report, 17(6), 1-10.
265
Jain, A. (2004). Using the lens of Max Weber’s Theory of Bureaucracy to examine E-Government
Research. Paper presented at the 37th Annual Hawaii International Conference on System
Sciences, 2004 (HICSS ‘04), Hawaii.
Jansen, A. (2005). Assessing E-government progress–why and what? Paper presented at the
NOKOBIT 2005, Bergen, Oslo.
Janssen, D., Rotthier, S. & Snijkers, K. (2004). If you measure it they will score: An assessment of
international eGovernment benchmarking. Information Polity, 9(3), 121-130.
Jeffcott, M. A. (2001). Technology alone will never work: Understanding How Organisational Issues
Contribute To User Neglect And Information Systems Failure in Healthcare. Rotterdam Paper.
Jenner, S. (2006). Science in Court. Financial Management (UK).(November 2006), 20-23.
Jenner, S. (2007). Demonstrating the value from IT investment in criminal justice. Public Safety IT
Magazine (September 2007).
Jenner, S. (2009a). The Emperor’s New Clothes? Lifting the fog on realising benefits from public
sector projects and programmes. PhD Research Proposal. Unpublished. London.
Jenner, S. (2009b). Realising Benefits from Government ICT Investment – a fool’s errand? . Reading:
Academic Publishing International.
Jigsaw Research (2010). Directgov Campaign Tracking Research: Q1 2010 Post-wave – Key Findings
Presentation Pack. London: Directgov.
Johnson, B. & Hencke, D. (2008). Not fit for purpose: £2bn cost of government’s IT blunders. The
Guardian. 5 January 2008. Retrieved from
http://www.guardian.co.uk/technology/2008/jan/05/computing.egovernment
Johnston, L. (2006). Software and Method: Reflections on Teaching and Using QSR NVivo in
Doctoral Research. International Journal of Social Research Methodology, 9(5), 379-391.
Jones, M. A., I. (2011). Guiding the use of Grounded Theory in Doctoral studies – an example from
the Australian film industry. International Journal of Doctoral Studies, 6, 95-114.
Jones, W. D. (2003). Watson and me: a life at IBM. Annals of the History of Computing, IEEE, 25(3),
4-18.
Jørgensen, M. & Moløkken-Østvold, K. (2006). How large are software cost overruns? A review of
the 1994 CHAOS report. Information and Software Technology, 48(4), 297-301.
Jugdev, K. & Muller, R. (2005). A retrospective look at our evolving understanding of project success.
Project Management Journal, 36(4), 19.
Kancijan, D. & Vrček, N. (2011). Proposing methodology pattern for measuring public value of IT
projects. Journal of Information and Organizational Sciences, 35(1), 31-58.
Kaplan, R. B. & Murdock, L. (1991). Core process redesign. McKinsey Quarterly(2), 27-43.
Kaplan, R. S. & Norton, D. P. (1992). The Balanced Scorecard: Measures that Drive Performance.
Harvard Business Review(January-February), 71-79.
Kearns, B. (2004). Technology and Change Management School of Computing Research Paper
(ITSM). Dublin, Ireland: Dublin Institute of Technology.
Kearns, I. (2004). Public Value and E-government. London: Institute for Public Policy Research.
King, N. (2004). Using Interviews in Qualitative Research. In C. Cassell & G. Symon (Eds.), Essential
Guide to Qualitative Methods in Organizational Research. London: Sage Publications Ltd.
266
King, S. & Cotterill, S. (2007). Transformational Government? The role of information technology in
delivering citizen-centric local public services. Local Government Studies, 33(3), 333 - 354.
Kirk, R. E. (2014). Experimental Design: Procedures for the Behavioural Sciences (4th ed.).
Thousand Oaks, California: SAGE Publications, Inc.
Kistermann, F. W. (2005). Hollerith punched card system development (1905-1913). Annals of the
History of Computing, IEEE, 27(1), 56-66.
Klein, H. K. & Myers, M. D. (1999). A set of principles for conducting and evaluating interpretive
field studies in information systems. MIS Quarterly, 23(1), 67-93.
Koeglreiter, G., Smith, R. & Torlina, L. (2012). Theory Building in Action: Structured-case with
action interventions. In D. N. Hart & S. D. Gregor (Eds.), Information Systems Foundations:
Theory Building in Information Systems (pp. 171-189). Canberra, Australia: ANU E Press.
Kolsaker, A. & Lee-Kelley, L. (2008). Citizens’ attitudes towards e-government and e-governance: a
UK study. International Journal of Public Sector Management, 21(7), 723-738.
Kraemer, K. L. & King, J. L. (2003). Information Technology and Administrative Reform: Will the
Time After E-Government Be Different? Irvine: Center for Research on Information Technology
and Organizations (CRITO), University of California.
Kraljic, P. (1983). Purchasing must become supply management. Harvard Business Review, 61(5),
109-117.
Krauss, S. E., Hamzah, A., Nor, Z., Omar, Z., Suandi, T., Ismail, I. & Zahari, M. (2009). Preliminary
investigation and interview guide development for studying how Malaysian farmers’ form their
mental models of farming. The Qualitative Report, 14(2), 245-260.
Kvale, S. (2002). Dialogue as oppression and interview research. Paper presented at the Nordic
Educational Research Association Conference, March 7-9, Tallinn, Estonia.
Lapsley, I. (2009). New Public Management: The Cruellest Invention of the Human Spirit? Abacus,
45(1), 1-21.
Larson, K. D. (1998). The role of service level agreements in IT service delivery. Information
Management & Computer Security, 6(3), 128-132.
Lathrop, D. & Ruma, L. (Eds.). (2010). Open Government: Collaboration, Transparency, and
Participation in Practice. Sebastopol, CA: O’Reilly Media.
Laws, K. & McLeod, R. (2004). Case study and grounded theory: Sharing some alternative
qualitative research methodologies with systems professionals. Paper presented at the 22nd
International Conference of the Systems Dynamics Society, Oxford, England.
Layne, K. & Lee, J. (2001). Developing fully functional E-government: A four stage model.
Government Information Quarterly, 18(2), 122-136.
Legris, P. & Collerette, P. (2006). A Roadmap for IT Project Implementation: Integrating Stakeholders
and Change Management Issues. Project Management Journal, 37(5), 64-75.
Legris, P., Ingham, J. & Collerette, P. (2003). Why do people use information technology? A critical
review of the technology acceptance model. Information & Management, 40(3), 191-204.
Leshem, S. & Trafford, V. (2007). Overlooking the conceptual framework. Innovations in education
and Teaching International, 44(1), 93-105.
Lewins, A. (2001). CAQDAS: Computer Assisted Qualitative Data Analysis. In N. Gilbert (Ed.),
Researching social life (pp. 302-323). London: Sage Publications Ltd.
Lewins, A. & Silver, C. (2006). Choosing a CAQDAS package: A working paper. Surrey University
Computer Assisted Qualitative Data Analysis Networking Project.
267
Lientz, B. P. (2013). Project Management: A Problem-Based Approach. Basingstoke: Palgrave
Macmillan.
Lientz, B. P. & Rea, K. P. (2004). Breakthrough IT Change Management: How to Get Enduring
Change Results. Oxford: Elsevier Butterworth-Heinemann.
Lin, C., Huang, Y.-A. & Cheng, M.-S. (2007). The Adoption of IS/IT Investment Evaluation and
Benefits Realization Methodologies in Service Organizations: IT Maturity Paths and Framework.
Contemporary Management Research, 3(2).
Lincoln, Y. S. & Guba, E. G. (1985). Naturalistic inquiry. London: Sage Publications, Inc.
Lips, M. (2007). Does public administration have artefacts? Information Polity: The International
Journal of Government & Democracy in the Information Age, 12(4), 243-252.
Loosemore, T. (2011). Implementing the Martha lane Fox Review of Government Online: Single
Government Website alpha. Retrieved from London:
Lovallo, D. & Kahneman, D. (2003). Delusions of Success: How Optimism Undermines Executives’
Decisions. Harvard Business Review, 81(7), 56-63.
Luftman, J. (2000). Assessing business-IT alignment maturity. Communications of AIS, 4(14), 1-51.
Luftman, J. (2003). Assessing IT/Business Alignment. Information Systems Management, 20(4), 9-15.
Luftman, J. & Ben-Zvi, T. (2010). Key Issues for IT Executives 2009: Difficult Economy’s Impact on
IT. MIS Quarterly Executive, 9(1), 49-59.
Luftman, J. & Brier, T. (1999). Achieving and Sustaining Business-IT Alignment. California
Management Review, 42(1), 109-122.
Luftman, J. & Kempaiah, R. (2007). An Update on Business-IT Allignment: “A Line” has been
drawn. MIS Quarterly Executive, 6(3), 165-177.
Lynn, L. E., Jr. (2001). The Myth of the Bureaucratic Paradigm: What Traditional Public
Administration Really Stood For. Public Administration Review, 61(2), 144-160.
Macredie, R. D., Sandom, C. & Paul, R. J. (1998). Modelling for Change: An Information Systems
Perspective on Change Management Models. In R. Macredie & D. Anketell (Eds.), Modelling for
added value: Springer Verlag.
Mäkelä, M. M. & Turcan, R. V. (2007). Building grounded theory in entrepreneurship research. In H.
Neergaard & J. P. Ulhøi (Eds.), Handbook of qualitative research methods in entrepreneurship
(pp. 122-143). Cheltenham: Edward Elgar Publishing Ltd.
Malerba, F., Nelson, R., Orsenigo, L. & Winter, S. (1999). ‘History-friendly’ models of industry
evolution: the computer industry. Industrial Corporate Change, 8(1), 3-40.
Malik, S. & Wintour, P. (2013). Universal Credit staff describe chaos behind scenes of flagship Tory
reform. The Guardian. 2 August 2013. Retrieved from
http://www.theguardian.com/politics/2013/aug/02/universal-credit-staff-flagship-reform
Mangabeira, W. C., Lee, R. M. & Fielding, N. G. (2004). Computers and Qualitative Research. Social
Science Computer Review, 22(2), 167-178.
Manley, B. W. (1993). Reengineering the Corporation” by Michael Hammer & James A. Champy
(Management Review). ENGINEERING MANAGEMENT JOURNAL(October 1993), 205.
Manwani, S. (2008). IT Enabled Business Change: Successful Management. London: British
Computer Society.
Manwani, S. (2010). The role of the sponsor in business change. International Journal of Knowledge,
Culture and Change Management, 9(12), 167-176.
268
Manwani, S. & Beaven, R. (2009). Re-energising Business Change: a Thomson Reuters case study.
Paper presented at the British Academy of Management Conference, Brighton, UK.
Marculescu, D., Marculescu, R., Zamora, N. H., Stanley-Marbell, P., Khosla, P. K., Park, S., . . .
Nakad, Z. (2003). Electronic textiles: a platform for pervasive computing. Proceedings of the
IEEE, 91(12), 1993-1994.
Marshall, C. & Rossman, G. B. (2006). Designing qualitative research. Thousand Oaks, CA: Sage
Publications, Inc.
Martin, S. (2003). On Public Management Reform. British Journal of Management, 14, S79-S81.
Mason, J. (2002). Qualitative Researching (2nd ed.). London: Sage Publications Ltd.
Mason, M. (2010). Sample Size and Saturation in PhD Studies Using Qualitative Interviews. Forum
Qualitative Sozialforschung / Forum: Qualitative Social Research, 11(3).
Mason, R. O., McKenney, J. L. & Copeland, D. G. (1997). An Historical Method for MIS Research:
Steps and Assumptions. MIS Quarterly, 21(3), 307-320.
Mather, A. (2012). The Emperor’s New Clothes. In The Eye Of The Storm. Retrieved from
http://blog.diverdiver.com/2012/10/the-emperors-new-clothes.html
Mayer-Schönberger, V. & Cukier, K. (2013). Big data: A revolution that will transform how we live,
work, and think. New York: Houghton Mifflin Harcourt Publishing.
Maykut, P. & Morehouse, R. (1994). Beginning qualitative research: A philosophic and practical
guide. London: Falmer Press.
McAfee, A. & Brynjolfsson, E. (2012). Big data: The management revolution. Harvard Business
Review, 90(10), 61-67.
McCaffery, C. (2007). Irish Information Society Policy. Networks and Communication Studies
(NETCOM), 21(1-2), 209-240.
McKay, J., Marshall, P. & Prananto, A. (2000). Stages of maturity for e-business: The SOG-e model.
Paper presented at the PACIS 2000, Hong Kong.
McLeod, L., Doolin, B. & MacDonell, S. G. (2012). A Perspective-Based Understanding of Project
Success. Project Management Journal, 43(5), 68-86.
Mechling, J. & Booz Allen Hamilton. (2002). Building a Methodology for Measuring the Value of E-
Services. Washington, D.C.: Booz Allen Hamilton.
Meijer, A. & Thaens, M. (2010). Alignment 2.0: Strategic use of new internet technologies in
government. Government Information Quarterly, 27(2), 113-121.
Melin, U. & Axelsson, K. (2008). Managing e-Government Projects: a Comparative Case Study of
two Inter-Organizational e-service Development Initiatives. Paper presented at the 16th European
Conference on Information Systems (ECIS 2008), National University of Ireland, Galway.
Meredith, J. (1998). Building operations management theory through case and field research. Journal
of Operations Management, 16(4), 441-454.
Merriam, S. B. (2009). Qualitative research: A guide to design and implementation. San Francisco:
Jossey-Bass.
Merriam-Webster (Ed.) (1996). Merriam-Webster’s Medical Desk Dictionary. Springfield, MA
Merriam-Webster Inc.
Miles, M. B. (1979). Qualitative Data as an Attractive Nuisance: The Problem of Analysis.
Administrative Science Quarterly, 24(4), 590-601.
269
Miles, M. B. & Huberman, A. M. (1994). Qualitative Data Analysis (2nd ed.). Thousand Oaks,
California: Sage Publications.
Miles, M. B., Huberman, A. M. & Saldaña, J. (2014). Qualitative Data Analysis: A Methods
Sourcebook (3rd ed.). Thousand Oaks, California: Sage Publications.
Millard, J. (Ed.) (2007). European eGovernment 2005-2007: Taking stock of good practice and
progress towards implementation of the i2010 eGovernment Action Plan. Brussels: European
Commission, DG Information Society and Media- eGovernment & CIP Operations.
Mingers, J. (2001). Combining IS Research Methods: Towards a Pluralist Methodology. Information
Systems Research, 12(3), 240-259.
Mintzberg, H. (1979). An Emerging Strategy of “Direct” Research. Administrative Science Quarterly,
24, 582-589.
Moon, M. J. (2002). The Evolution of E-Government among Municipalities: Rhetoric or Reality?
Public Administration Review, 62(4), 424-433.
Moore, M. H. (1995). Creating Public Value: Strategic Management in Government. Cambridge, MA:
Harvard University Press.
Moore, S. (2005). Directionless Gov. Zentelligence. Retrieved from
http://zentelligence.blogspot.co.uk/2005/12/directionless-gov.html
Morgan, R. (2013). Scandal of HM Government rewarding for failure. Burnt Oak Partners. 11 July
2013. Retrieved from http://www.burntoak-partners.com/2013/07/11/scandal-of-hm-government-
rewarding-for-failure/
Mott MacDonald. (2002). HM Treasury Report: Review of Large Public Procurement in the UK.
Croydon: Mott MacDonald.
Mowery, D. C. & Langlois, R. N. (1996). Spinning off and spinning on(?): the federal government
role in the development of the US computer software industry. Research Policy, 25(6), 947-966.
Myers, M. D. (1997). Qualitative Research in Information Systems. MIS Quarterly, 21(2), 241-242.
Myers, M. D. & Newman, M. (2007). The qualitative interview in IS research: Examining the craft.
Information and Organization, 17(1), 2-26.
National Audit Office. (2003). New IT systems for Magistrates’ Courts: the Libra project. HC 327
Session 2002-2003. London: The Stationery Office.
National Audit Office. (2004). Improving IT procurement. The impact of the Office of Government
Commerce’s initiatives on departments and suppliers in the delivery of major IT-enabled projects.
HC 877, Session 2003-2004. London: The Stationery Office.
National Audit Office. (2006a). Delivering successful IT-enabled business change: Case studies of
success. HC 33-II, Session 2006-2007. (Vol. II). London: National Audit Office.
National Audit Office. (2006b). Delivering successful IT-enabled business change. HC 33-I, Session
2006-2007. (Vol. I). London: National Audit Office.
National Audit Office. (2006c). The National Programme for IT in the NHS. HC 1173, Session 2005-
2006. London: The Stationery Office.
National Audit Office. (2007). Government on the internet: progress in delivering information and
services online. HC 529, Session 2006-2007. London: The Stationery Office.
National Audit Office. (2008). The National Programme for IT in the NHS: Progress since 2006. HC
484-II, Session 2007-2008. London: The Stationery Office.
270
National Audit Office. (2011a). Digital Britain One: shared information and services for government
online. Cross government. London: The Stationery Office.
National Audit Office. (2011b). The Efficiency and Reform Group’s role in improving public sector
value for money. HC 887, Session 2010–2011. London: The Stationery Office.
National Audit Office. (2011c). The National Programme for IT in the NHS: an update on the delivery
of detailed care records systems. HC 888, Session 2010–2012. London: The Stationery Office.
National Audit Office. (2012). Assurance for major projects. HC 1698, Session 2010–2012. London:
The Stationery Office.
National Audit Office & Audit Commission. (2006). Delivering Efficiently: Strengthening the links in
public service delivery chains. HC 940, Session 2005-2006. London: The Stationery Office.
Nolan, R. L. (1973). Managing the computer resource: a stage hypothesis. Communications of the
ACM(16), 399–405.
Norton, P. (2008). Directgov: The Right Direction for E-government or a Missed Opportunity? The
Journal of Information, Law and Technology (JILT)(1).
O’Reilly, T. (2007). What is Web 2.0: Design patterns and business models for the next generation of
software. Communications & strategies(1), 17.
O’Reilly, T. (2011). Government as a platform. Innovations: Technology, Governance, Globalization,
6(1), 13-40.
OECD. (2008). OECD Public Management Reviews - Ireland: Towards an Integrated Public Service.
Paris: OECD Publishing.
OECD. (2009). E-Government Studies Rethinking E-Government Services: User-Centred
Approaches: OECD Publishing.
OECD. (2010). Towards Smarter and more Transparent Government: e-Government Status. Spring
2010. Paris: OECD Publishing.
OECD. (2011). Government at a Glance 2011. Country Note: UNITED KINGDOM. Paris: OECD
Publishing.
OGC. (2007a). Managing successful programmes. Norwich: TSO.
OGC. (2007b). OGC Best Practice: Common Causes of Project Failure. London: Office of
Government Commerce.
Orlikowski, W. J. (1993). CASE tools as organizational change: Investigating incremental and radical
changes in systems development. MIS Quarterly, 309-340.
Orlikowski, W. J. & Baroudi, J. J. (1991). Studying Information Technology in Organizations:
Research Approaches and Assumptions. Information Systems Research, 2(1), 1-28.
Osborne, D. & Gaebler, T. (1992). Reinventing government: How the entrepreneurial spirit is
transforming government. Reading, MA: Adison-Wesley.
Osborne, S. P. (2006). The New Public Governance? Public Management Review, 8(3), 377-387.
Osborne, S. P. (Ed.) (2010). The new public governance: Emerging perspectives on the theory and
practice of public governance. Abingdon: Routledge.
PAC. (2007a). Central government’s use of consultants. Thirty-first Report of Session 2006–07.
London: The Stationery Office.
PAC. (2007b). Treasury Minutes on the Twentieth, the Twenty-Third, the Twenty-Fifth and the
Twenty-Sixth Reports from the Committee of Public Accounts 2006-2007. Norwich: HMSO.
271
PAC. (2008). Government on the Internet: Progress in delivering information and services online.
Retrieved from London:
PAC. (2011a). The National Programme for IT in the NHS: an update on the delivery of detailed care
records systems. Forty-fifth Report of Session 2010–12. London: The Stationery Office.
PAC. (2011b). Reducing Costs in the Department for Work and Pensions. Forty-seventh Report of
Session 2010–12. London: The Stationery Office.
Parasuraman, A., Zeithaml, V. A. & Berry, L. L. (1985). A conceptual model of service quality and its
implications for future research. Journal of Marketing, 49(4), 41-50.
Parasuraman, A., Zeithaml, V. A. & Berry, L. L. (2002). SERVQUAL: a multiple-item scale for
measuring consumer perceptions of service quality. In A. M. Findlay & L. Sparks (Eds.),
Retailing: critical concepts. London, New York: Routledge.
Parasuraman, A., Zeithaml, V. A. & Malhotra, A. (2005). ES-QUAL a multiple-item scale for
assessing electronic service quality. Journal of service research, 7(3), 213-233.
Parliamentary Office of Science and Technology. (2003). Government IT Projects. POSTnotes (POST
Ed.). London: Parliamentary Office of Science and Technology.
Passmore, D. (1996). Setting Performance Expectations. Business Communications Review, 26(12),
20-22.
Pather, S., Remenyi, B. & Remenyi, D. (2011). Managing Risks of ICT Projects. Reading: Academic
Publishing Ltd.
Paulk, M. C. (2002). Agile methodologies and process discipline. (Vol. Paper 3): Institute for Software
Research, Carnegie Mellon University.
Peng, M. W. (2002). Towards an Institution-Based View of Business Strategy. Asia Pacific Journal of
Management, 19(2/3), 251.
Peters, G. & Brass, R. (2011). LEADERS DIRECT. Business Strategy Review, 22(2), 23-35.
Petter, S., DeLone, W. & McLean, E. (2008). Measuring information systems success: models,
dimensions, measures, and interrelationships. European Journal of Information Systems, 17(3),
236-263.
Petter, S. & McLean, E. R. (2009). A meta-analytic assessment of the DeLone & McLean IS success
model: An examination of IS success at the individual level. Information & Management, 46(3),
159-166.
Pettigrew, A. M. (1977). Strategy Formulation as a Political Process. International Studies of
Management & Organization, 7(2), 78-87.
Pettigrew, A. M. (1985). The awakening giant: Change and continuity in ICI. Oxford: Blackwell.
Pettigrew, A. M. (1987). Context and Action in the Transformation of the Firm. Journal of
Management Studies, 24(6), 649-670.
Pettigrew, A. M. (2001). Management Research After Modernism. British Journal of Management,
12, S61-S70.
Philippidou, S., Söderquist, K. E. & Prastacos, G. P. (2002). Exploring the Organization Environment-
Link: Change as Coevolution. Paper presented at the 2nd European Academy of Management
Conference, Stockholm.
Pickering, A. (2009). New Labour’s Digital Vision: A Survey of E-Government in the UK Since 1997.
Knowledge Politics Quarterly, 2(1).
272
Pinto, J. K. & Mantel, S. J., Jr. (1990). The causes of project failure. Engineering Management, IEEE
Transactions on, 37(4), 269-276.
Plummer, A. A. (2001). Information systems methodology for building theory in health informatics:
The argument for a structured approach to case study research. Paper presented at the 34th Annual
Hawaii International Conference on System Sciences, 2001 (HICSS ‘01), Hawaii.
Pollitt, C. (2009). Bureaucracies Remember, Post-Bureaucratic Organizations Forget? Public
Administration, 87(2), 198-218.
Pollitt, C. & Bouckaert, G. (2000). Public management reform: a comparative analysis. Oxford; New
York: Oxford University Press.
Porter, M. E. (1991). Towards a Dynamic Theory of Strategy. Strategic Management Journal, 12, 95-
117.
Porter, M. E. (2001). Strategy and the Internet. Harvard Business Review, 79(3), 62-79.
Powell, P. (2003). Review: A computer called LEO: Georgina Ferry; 4th Estate, London, 2003. The
Journal of Strategic Information Systems, 12(2), 167-168.
Prananto, A., McKay, J. & Marshall, P. (2001). Frameworks to support e-business growth strategy.
Proceedings of the Global Cooperation in the New Millenium, ECIS, 1254–1263.
Prosci. (2004). Prosci’s Change Management Maturity Model. Loveland, USA
QDATRAINING. (2012a). Defining the Constant Comparative Method. Retrieved from
http://www.qdatraining.eu/content/defining-constant-comparative-method
QDATRAINING. (2012b). Shoutbox. Retrieved from
http://www.nvivotraining.eu/shoutbox?page=0%2C3
Rämö, H. (2002). Doing things right and doing the right things Time and timing in projects.
International Journal of Project Management, 20(7), 569-574.
Ramos, L. (2003). Why Top Executives Should Care About Portals. Planning Assumption. Retrieved
from http://www.gigaweb.com
Remenyi, D. (2011). Field Methods for Academic Research - Interviews, Focus Groups and
Questionnaires in Business and Management Studies (3rd ed.). Reading: Academic Publishing
International.
Remenyi, D. & Money, A. H. (2004). Research Supervision for Supervisors and Their Students.
Reading: Academic Conferences Ltd.
Remenyi, D. & Sherwood-Smith, M. (1998). Business benefits from information systems through an
active benefits realisation programme. International Journal of Project Management, 16(2), 81-98.
Remenyi, D., Sherwood-Smith, M. & White, T. (1997). Achieving Maximum Value from Information
Systems: A Process Approach. Chichester: John Wiley & Sons, Inc.
Remenyi, D. & Whittaker, L. (1994). The Cost and Benefits of BPR. Business Change & Re-
engineering, 2(2), 51-65.
Remenyi, D., Williams, B., Money, A. & Swartz, E. (1998). Doing research in business and
management: an introduction to process and methods. London: Sage.
Revenue. (2003). Revenue On-line Service (ROS): Fast Access, Secure Filing. Dublin: Revenue.
Revenue. (2005). European eGovernment Award Submission Case Document. Dublin: Revenue.
Revenue. (2008a). ICT Strategy 2009-2011. Dublin: Revenue.
Revenue. (2008b). Statement of Strategy 2008-2010. Dublin: Office of the Revenue Commissioners.
273
Revenue. (2008c). Tax Returns And Payments (Mandatory Electronic Filing And Payment Of Tax)
Regulations 2008-(S.I. No. 341 of 2008). Dublin: Revenue.
Revenue. (2009a). Revenue On-line Service (ROS): Making things easier... Dublin: Revenue.
Revenue. (2009b). Revenue Online Service (ROS): Winner of Central Irish e-Government & Inspire
e-Government Awards 2008. Dublin: Revenue.
Richards, L. (2002). Qualitative computing--a methods revolution? International Journal of Social
Research Methodology, 5(3), 263-276.
Richards, L. & Richards, T. (1981). NUDIST: A computer assisted technique for thematic analysis of
unstructured data. Bundoora, Victoria: Department of Sociology, School of Social Sciences, La
Trobe University.
Richards, T. (2002). An intellectual history of NUD*IST and NVivo. International Journal of Social
Research Methodology, 5(3), 199-214.
Riedl, R., Roithmayr, F. & Schenkenfelder, B. (2007). Using the Structured-case Approach to Build
Theory in E-Government. Paper presented at the 40th Annual Hawaii International Conference on
System Sciences, 2007 (HICSS ‘07), Hawaii.
Rogers, E. M. (2003). Diffusion of innovations (5th ed.). New York: The Free Press: Simon &
Schuster.
Rojas, R. (2006). Reviews. Annals of the History of Computing, IEEE, 28(1), 96-98.
Rosacker, K. M. & Olson, D. L. (2008). Public sector information system critical success factors.
Transforming Government: People, Process and Policy, 2(1), 60-70.
Rosenberg, J. P. & Yates, P. M. (2007). Schematic representation of case study research designs.
Journal of advanced nursing, 60(4), 447-452.
Royston, S. (2012). Understanding Universal Credit. Journal of Poverty and Social Justice, 20(1), 69-
86.
Rubinstein, D. (2007). Standish group report: There’s less development chaos today. Software
Development Times, 1.
Ryan, L. (2012). Celebrating 10 Years of Revenue Online. Paper presented at the eGovernment
Successes Conference, Dublin.
Sapountzis, S., Harris, K. & Kagioglou, M. (2008). Benefits Management and Benefits Realisation: A
Literature Review. Salford: Health and Care Infrastructure Research and Innovation Centre
(HCIRIC), The University of Salford.
Sarikas, O. D. & Weerakkody, V. (2007). Realising integrated e-government services: a UK local
government perspective. Transforming Government: People, Process and Policy, 1(2), 153-173.
Saxby, S. (2006). A critical analysis of the synergy between e-Government information and related
UK policies. Computer and Telecommunications Law Review, 12(6), 179-215.
Saxby, S. (2007a). News and comment on recent developments from around the world. Computer Law
& Security Report, 23(3), 211-226.
Saxby, S. (2007b). News and comment on recent developments from around the world. Computer Law
& Security Report, 23(2), 125-137.
Scholl, H. J. (2003). E-government: a special case of ICT-enabled business process change. Paper
presented at the 36th Annual Hawaii International Conference on System Sciences, 2003 (HICSS
‘03), Hawaii.
Schwaber, K. (2004). Agile project management with Scrum. Redmond, Washington: Microsoft Press.
274
Scott, M., Golden, W. & Hughes, M. (2004). The Implementation Of Citizen-Centred E-government:
a Stakeholder Viewpoint. Galway, Ireland: Centre for Innovation and Structural Change, NUI
Working Papers.
Scott Morton, M. (1995). Emerging organizational forms: Work and organization in the 21st century.
European Management Journal, 13(4), 339-345.
Scott Morton, M. (Ed.) (1991). The corporation of the 1990s: Information technology and
organizational transformation. New York: Oxford University Press.
Seddon, J. (1992). I Want You to Cheat!: The Unreasonable Guide to Service and Quality in
Organisation. New York: Vanguard Press.
Seddon, J. (2013). Universal Credit: a brilliant idea guaranteed to fail. Universal Credit. 19 December
2011. Retrieved from http://www.universalcredit.co.uk/category/universal-credit-a-brilliant-idea-
guaranteed-to-fail/
Sharma, K. (2006). Martin Campbell-Kelly & William Aspray, Computer: A History of the
Information Machine (second edition), Westview Press, Boulder, Colorado (2004). Technological
Forecasting and Social Change, 73(1), 83-86.
Shift Media. (2009). Press release: 72 finalists announced in the e-Government National Awards 2009.
News. Retrieved from http://www.siftmedia.co.uk/news/72-finalists-announced-e-government-
national-awards-2009
Shih, S.-P., Shaw, R.-S., Fu, T.-Y. & Cheng, C.-P. (2013). A Systematic Study of Change
Management During CMMI Implementation: A Modified Activity Theory Perspective. Project
Management Journal, 44(4), 84-100.
Silverman, D. (2010). Doing Qualitative Research (3rd ed.). London: Sage Publications Ltd.
Simons, M. (2001). Home Office cancels key immigration IT system. Computer Weekly. 22 February
2001. Retrieved from http://www.computerweekly.com/feature/Home-Office-cancels-key-
immigration-IT-system
Singh, H., Das, A. & Joseph, D. (2007). Country-level determinants of e-Government maturity.
Communications of the Association for Information Systems, 20, 632-648.
Srivastava, S. C. & Teo, T. S. H. (2004). A framework for electronic government: evolution, enablers
and resource drainers. Paper presented at the The 8th Pacific Asia Conference on Information
Systems (PACIS), Shanghai, China.
Stake, R. E. (1995). The Art of Case Study Research. Thousand Oaks, CA: Sage Publications.
Stake, R. E. (2000). Case Studies. In N. K. Denzin & Y. S. Lincoln (Eds.), Handbook of qualitative
research (2nd ed.). Thousand Oaks, California: Sage Publications.
Standing, C., Guilfoyle, A., Lin, C. & Love, P. E. D. (2006). The attribution of success and failure in
IT projects. Industrial Management & Data Systems, 106(8), 1148-1165.
Stanforth, C. (2010). Analysing e-Government Project Failure: Comparing Factoral, Systems and
Interpretive Approaches. Centre for Development Informatics, Institute for Development Policy
and Management, SED, University of Manchester, UK, iGovernment Working Paper 20.
Stephen, J., Page, J., Myers, J., Brown, A., Watson, D. & Magee, I. (2010). System Error: Fixing the
flaws in government IT. London: Institute for Government.
Strauss, A. L. & Corbin, J. M. (1990). Basics of qualitative research: Grounded theory procedures
and techniques. Thousand Oaks, CA: Sage Publications, Inc.
Sturdy, G. R. (2010). Business Process Reengineering: Strategies for Occupational Health and Safety.
Newcastle upon Tyne: Cambridge Scholars Publishing.
275
Sutton, K. (2005). Fighting fear of crime. New Statesman, Special Supplement: Joined-up Criminal
Justice (1 August 2005).
Suwardy, T., Ratnatunga, J., Sohal, A. S. & Speight, G. (2003). IT projects: evaluation, outcomes and
impediments. Benchmarking: An International Journal, 10(4), 325-342.
Swatman, P. M. C. (1993). Integrating Electronic Data Interchange into existing organisational
structure and internal application systems: the Australian Experience. (PhD), Curtin University of
Technology, Perth, Australia.
Syamsuddin, I. (2011). Evaluation of e-government initiatives in developing countries: an ITPOSMO
approach. International Research Journal of Applied and Basic Sciences, 2(12), 439-446.
Synnerstrom, S., Lalazarian, K., Manning, N., Parison, N. & Rinne, J. (2001). Civil Service Law &
Employment Regimes. The World Bank. Retrieved from
http://www1.worldbank.org/publicsector/civilservice/civilservicelaw.htm
Taylor, S. J. & Bogdan, R. (1984). Introduction to qualitative research: The search for meanings. New
York: Wiley.
The Economist. (2002). Computerising the NHS: The health service’s IT problem. The Economist. 17
October 2002. Retrieved from http://www.economist.com/node/1390034
The Prime Minister’s Office of Public Reform. (2002). Reforming our Public Services: Principles into
Practice. London: Office of Public Services Reform.
The Standish Group. (1995). Chaos Report. Boston: The Standish Group International, Inc.
The Standish Group. (2010). The Standish Group Chaos Summary for 2010. Boston: The Standish
Group International, Inc.
The Standish Group. (2013). Standish Group CHAOS Manifesto 2012/13. Boston: The Standish Group
International, Inc.
Thomas, G. & Fernández, W. (2008). Success in IT projects: A matter of definition? International
Journal of Project Management, 26(7), 733-742.
Thomas, M. (2008). If you ask me. Engineering & Technology, 3(1), 32.
Timonen, P. & O’Donnell, O. (2003). Development of E-Government in Ireland - Remaining Issues
and Challenges. Administration, 51(3), 3-20.
Toncich, D. J. (2006). Key factors in postgraduate research: A guide for students (6th ed.). Chrystobel
Engineering: Brighton, Australia.
Toor, S.-u.-R. & Ogunlana, S. O. (2010). Beyond the ‘iron triangle’: Stakeholder perception of key
performance indicators (KPIs) for large-scale public sector development projects. International
Journal of Project Management, 28(3), 228-236.
Transform. (2010). Directgov Strategic Review. London: Transform Innovation Ltd.
Trienekens, J. M., Bouman, J. & van der Zwan, M. (2004). Specification of Service Level
Agreements: Problems, Principles and Practices. Software Quality Journal, 12(1), 43-57.
Turban, E., King, D., Lee, J. & Viehland, D. (2006). Electronic commerce 2006 : a managerial
perspective (4 ed.). Upper Saddle River, N.J. ; [London]: Pearson Prentice Hall.
Turner, D. W. (2010). Qualitative interview design: A practical guide for novice investigators. The
Qualitative Report, 15(3), 754-760.
Turner, J. (2006). Nattering on the net-it’s a private affair. The Times. 2 December 2006.
276
Turner, J. R. & Müller, R. (2005). The project manager’s leadership style as a success factor on
projects: a literature review. Project Management Journal, 36(2), 49-61.
United Nations. (2012). United Nations E-Government Survey 2012: E-Government for the People
New York: Department of Economic and Social Affairs, United Nations.
Urquhart, C. (2000). An encounter with grounded theory: tackling the practical and philosophical
issues. In E. M. Trauth (Ed.), Qualitative research in IS: Issues and trends (pp. 104-140). Hershey
PA; London: Idea Group Publishing.
Urwin, G. (2002). Learning from Complex Information Systems Implementation: Case Studies in ERP
Projects. (DBA Thesis), Henley Management College, Henley-on-Thames.
Van de Ven, A. H. & Poole, M. S. (1995). Explaining Development and Change in Organisations.
Academy of Management Review, 20(3), 510-540.
Van de Ven, A. H. & Sun, K. (2011). Breakdowns in Implementing Models of Organization Change.
Academy of Management Perspectives, 25(3), 58-74.
Van Maanen, J. (2006). Ethnography then and now. Qualitative Research in Organizations and
Management: An International Journal, 1(1), 13-21.
Van Maanen, J. (2011). Ethnography as Work: Some Rules of Engagement. Journal of Management
Studies, 48(1), 218-234.
Varney, D. (2006). Service transformation: A better service for citizens and businesses, a better deal
for the taxpayer. London: Her Majesty’s Stationery Office.
Venkatraman, N. (1991). IT-Induced Business Reconfiguration. In M. Scott Morton (Ed.), The
corporation of the 1990s: Information technology and organizational transformation. New York:
Oxford University Press.
Venkatraman, N. (1994). IT-enabled business transformation: from automation to business scope
redefinition. Sloan management review, 35, 73-73.
Vigoda-Gadot, E. (2009). Building strong nations: improving governability and public management.
Farnham, UK: Ashgate.
Walsham, G. (1995a). The Emergence of Interpretivism in IS Research. Information Systems
Research, 6(4), 376-394.
Walsham, G. (1995b). Interpretive case studies in IS research: nature and method. European Journal
of Information Systems, 4(2), 74-81.
Walsham, G. (2006). Doing interpretive research. European Journal of Information Systems, 15(3),
320-330.
Ward, J. & Daniel, E. (2006). Benefits management: delivering value from IS and IT investments.
Chichester: John Wiley and Sons Ltd.
Ward, J., De Hertogh, S. & Viaene, S. (2007). Understanding the key practices for achieving business
benefits from IS/IT Investments: an empirical investigation. Cranfield School of Management.
Ward, J. & Elvin, R. (1999). A new framework for managing IT-enabled business change. Information
Systems Journal, 9(3), 197-221.
Ward, J. & Peppard, J. (2002). Strategic planning for information systems (3rd ed. / John Ward & Joe
Peppard. ed.). Chichester: Wiley.
Ward, J., Taylor, P. & Bond, P. (1996). Evaluation and realisation of IS/IT benefits: an empirical study
of current practice. European Journal of Information Systems, 4(4), 214-225.
277
Wateridge, J. (1998). How can IS/IT projects be measured for success? International Journal of
Project Management, 16(1), 59-63.
Watling, S. (2011). Digital exclusion: coming out from behind closed doors. Disability & Society,
26(4), 491-495.
Watson, T. J. (1994). Managing, Crafting and Researching: Words, Skill and Imagination in Shaping
Management Research. British Journal of Management, 5(2), 77.
Watson, T. J. (2011). Ethnography, Reality, and Truth: The Vital Need for Studies of ‘How Things
Work’ in Organizations and Management. Journal of Management Studies, 48(1), 202-217.
Weber, M. (1978). Bureaucracy. In G. Roth & C. Wittich (Eds.), Max Weber - Economy and society:
An outline of interpretive sociology Berkeley, California: University of California Press.
Weerakkody, V. & Currie, W. (2003). Integrating business process reengineering with information
systems development: issues & implications. In W. M. P. van der Aalst, A. H. M. ter Hofstede &
M. Wesk (Eds.), Business Process Management: a survey (Vol. 2678 of Lecture Notes in
Computer Science, pp. 302-320). Berlin: Springer.
Weerakkody, V., Janssen, M. & Dwivedi, Y. K. (2011). Transformational change and business process
reengineering (BPR): Lessons from the British and Dutch public sector. Government Information
Quarterly, 28(3), 320-328.
Weller, T. (2005). The government machine: A revolutionary history of the computer. Journal of
Documentation, 61(3), 454-456.
Welsh, E. (2002). Dealing with data: Using NVivo in the qualitative data analysis process. Forum
Qualitative Sozialforschung / Forum: Qualitative Social Research, 3(2), Art. 26.
Wernham, B. (2012). Agile Project Management for Government. London: Maitland and Strong.
West, D. M. (2004). E-Government and the Transformation of Service Delivery and Citizen Attitudes.
Public Administration Review, 64(1), 15-27.
West, D. M. (2005). Digital Government: Technology and Public Sector Performance: Princeton
University Press.
Wheeler-Carmichael, G. (2000). Government IT projects: the McCartney Report “Successful IT:
Modernizing Government in Action” and the CSSA Report “Getting IT Right for Government”.
Computer Law & Security Report, 16(5), 325-328.
Wilson, W. (1887). The Study of Administration Political Science Quarterly, 2 (2), 197-222.
Wisker, G. (2008). The postgraduate research handbook: succeed with your MA, MPhil, EdD and PhD
(2nd ed.): Palgrave.
Wong, L. P. (2008). Data Analysis in Qualitative Research: A Brief Guide to Using Nvivo. Malaysian
Family Physician, 3(1), 14-20.
Yates, K., Sapountzis, S., Lou, E. C. W. & Kagioglou, M. (2009). BeReal: Tools and methods for
implementing benefits realisation and management. Paper presented at the 5th Nordic Conference
on Construction Economics and Organisation, Reykjavík, Iceland (10-12 June 2009).
Yau, A. & Murphy, C. (2013). Is a Rigorous Agile Methodology the Best Development Strategy for
Small Scale Tech Startups? Pennsylvania: University of Pennsylvania.
Yin, R. K. (1981). The case study crisis: Some answers. Administrative Science Quarterly, 26(1), 58-
65.
Yin, R. K. (1994). Case Study Research: Design and Methods, Applied Social Research Methods
Series, Vol. 5: Thousand Oaks, CA: Sage Publications Inc.

278
Yin, R. K. (2003). Applications of case study research (2nd ed.). Thousand Oaks, CA: Sage
Publications, Inc.
Yin, R. K. (2009). Case Study Research: Design and Methods (4th ed. Vol. 5). Thousand Oaks, CA:
Sage Publications, Inc.
Yin, R. K. (2012). Applications of case study research (3rd ed.). Thousand Oaks, CA: Sage
Publications, Inc.
Zuboff, S. (1988). In the Age of the Smart Machine: The Future of Work and Power: Basic Books.
Zvegintzov, N. (1998). Frequently begged questions and how to answer them. Software, IEEE, 15(2),
93-96.
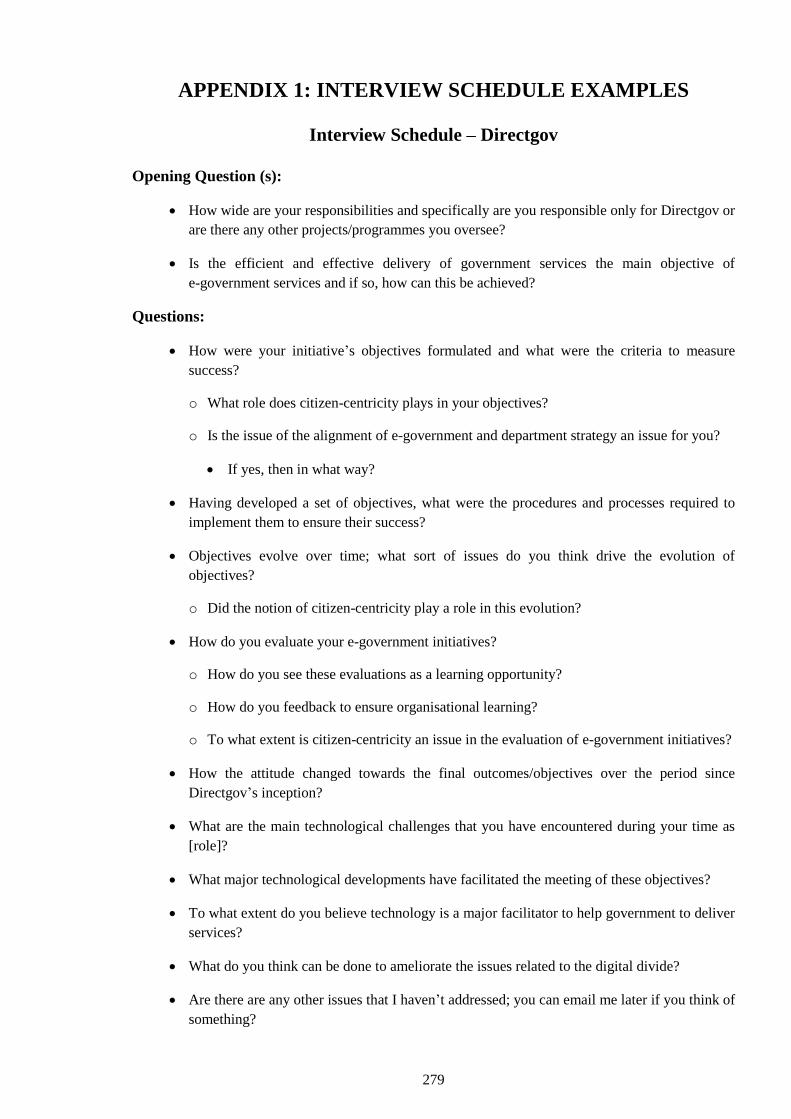
279
APPENDIX 1: INTERVIEW SCHEDULE EXAMPLES
Interview Schedule – Directgov
Opening Question (s):
How wide are your responsibilities and specifically are you responsible only for Directgov or
are there any other projects/programmes you oversee?
Is the efficient and effective delivery of government services the main objective of
e-government services and if so, how can this be achieved?
Questions:
How were your initiative’s objectives formulated and what were the criteria to measure
success?
o What role does citizen-centricity plays in your objectives?
o Is the issue of the alignment of e-government and department strategy an issue for you?
If yes, then in what way?
Having developed a set of objectives, what were the procedures and processes required to
implement them to ensure their success?
Objectives evolve over time; what sort of issues do you think drive the evolution of
objectives?
o Did the notion of citizen-centricity play a role in this evolution?
How do you evaluate your e-government initiatives?
o How do you see these evaluations as a learning opportunity?
o How do you feedback to ensure organisational learning?
o To what extent is citizen-centricity an issue in the evaluation of e-government initiatives?
How the attitude changed towards the final outcomes/objectives over the period since
Directgov’s inception?
What are the main technological challenges that you have encountered during your time as
[role]?
What major technological developments have facilitated the meeting of these objectives?
To what extent do you believe technology is a major facilitator to help government to deliver
services?
What do you think can be done to ameliorate the issues related to the digital divide?
Are there are any other issues that I haven’t addressed; you can email me later if you think of
something?
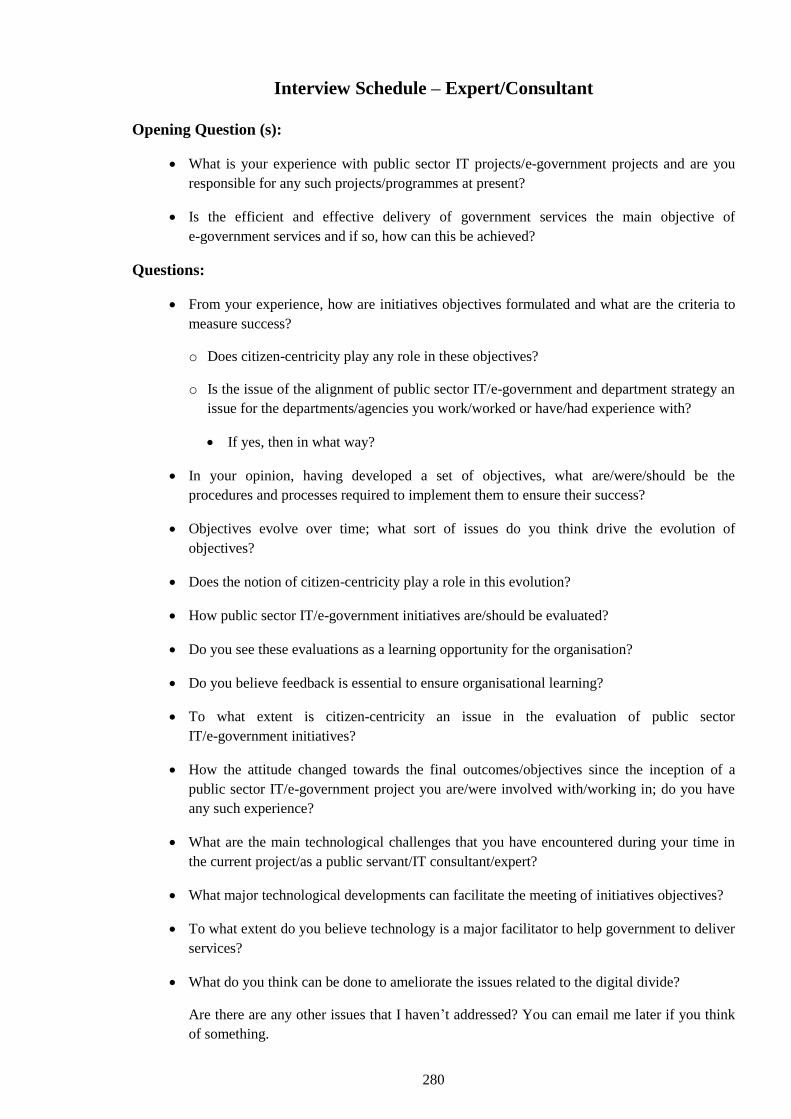
280
Interview Schedule – Expert/Consultant
Opening Question (s):
What is your experience with public sector IT projects/e-government projects and are you
responsible for any such projects/programmes at present?
Is the efficient and effective delivery of government services the main objective of
e-government services and if so, how can this be achieved?
Questions:
From your experience, how are initiatives objectives formulated and what are the criteria to
measure success?
o Does citizen-centricity play any role in these objectives?
o Is the issue of the alignment of public sector IT/e-government and department strategy an
issue for the departments/agencies you work/worked or have/had experience with?
If yes, then in what way?
In your opinion, having developed a set of objectives, what are/were/should be the
procedures and processes required to implement them to ensure their success?
Objectives evolve over time; what sort of issues do you think drive the evolution of
objectives?
Does the notion of citizen-centricity play a role in this evolution?
How public sector IT/e-government initiatives are/should be evaluated?
Do you see these evaluations as a learning opportunity for the organisation?
Do you believe feedback is essential to ensure organisational learning?
To what extent is citizen-centricity an issue in the evaluation of public sector
IT/e-government initiatives?
How the attitude changed towards the final outcomes/objectives since the inception of a
public sector IT/e-government project you are/were involved with/working in; do you have
any such experience?
What are the main technological challenges that you have encountered during your time in
the current project/as a public servant/IT consultant/expert?
What major technological developments can facilitate the meeting of initiatives objectives?
To what extent do you believe technology is a major facilitator to help government to deliver
services?
What do you think can be done to ameliorate the issues related to the digital divide?
Are there are any other issues that I haven’t addressed? You can email me later if you think
of something.
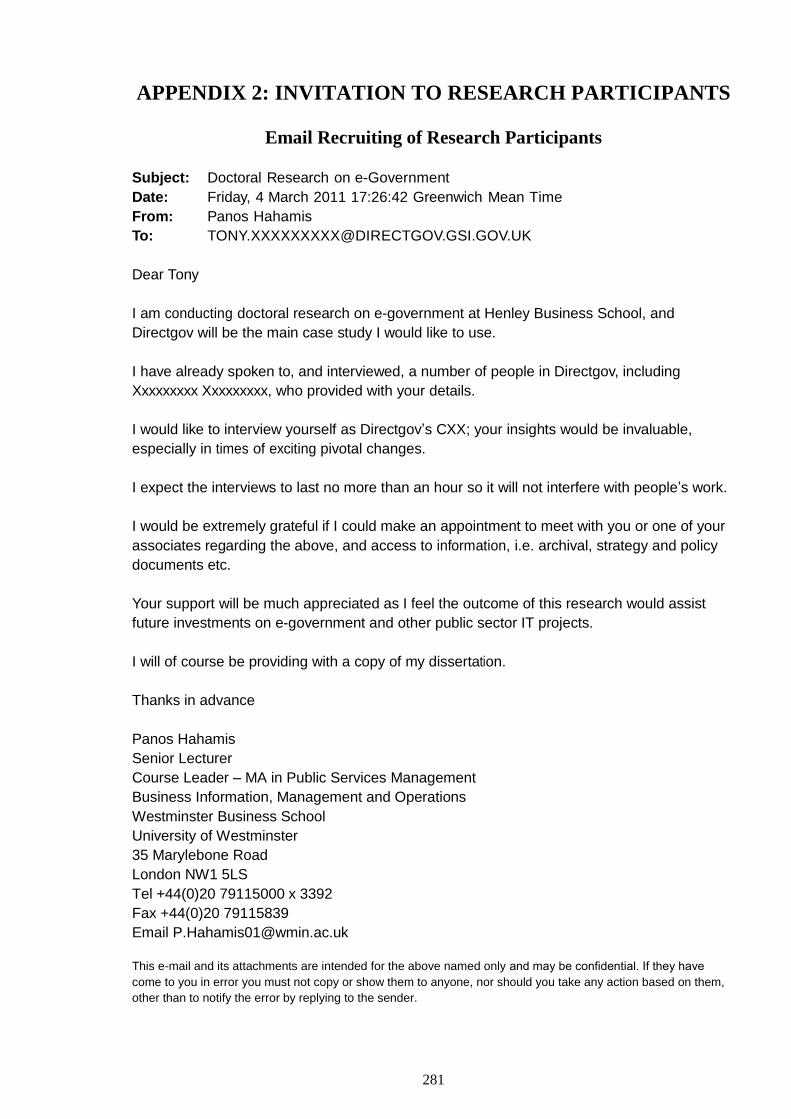
281
APPENDIX 2: INVITATION TO RESEARCH PARTICIPANTS
Email Recruiting of Research Participants
Subject: Doctoral Research on e-Government
Date: Friday, 4 March 2011 17:26:42 Greenwich Mean Time
From: Panos Hahamis
Dear Tony
I am conducting doctoral research on e-government at Henley Business School, and
Directgov will be the main case study I would like to use.
I have already spoken to, and interviewed, a number of people in Directgov, including
Xxxxxxxxx Xxxxxxxxx, who provided with your details.
I would like to interview yourself as Directgov’s CXX; your insights would be invaluable,
especially in times of exciting pivotal changes.
I expect the interviews to last no more than an hour so it will not interfere with people’s work.
I would be extremely grateful if I could make an appointment to meet with you or one of your
associates regarding the above, and access to information, i.e. archival, strategy and policy
documents etc.
Your support will be much appreciated as I feel the outcome of this research would assist
future investments on e-government and other public sector IT projects.
I will of course be providing with a copy of my dissertation.
Thanks in advance
Panos Hahamis
Senior Lecturer
Course Leader – MA in Public Services Management
Business Information, Management and Operations
Westminster Business School
University of Westminster
35 Marylebone Road
London NW1 5LS
Tel +44(0)20 79115000 x 3392
Fax +44(0)20 79115839
Email [email protected]
This e-mail and its attachments are intended for the above named only and may be confidential. If they have
come to you in error you must not copy or show them to anyone, nor should you take any action based on them,
other than to notify the error by replying to the sender.
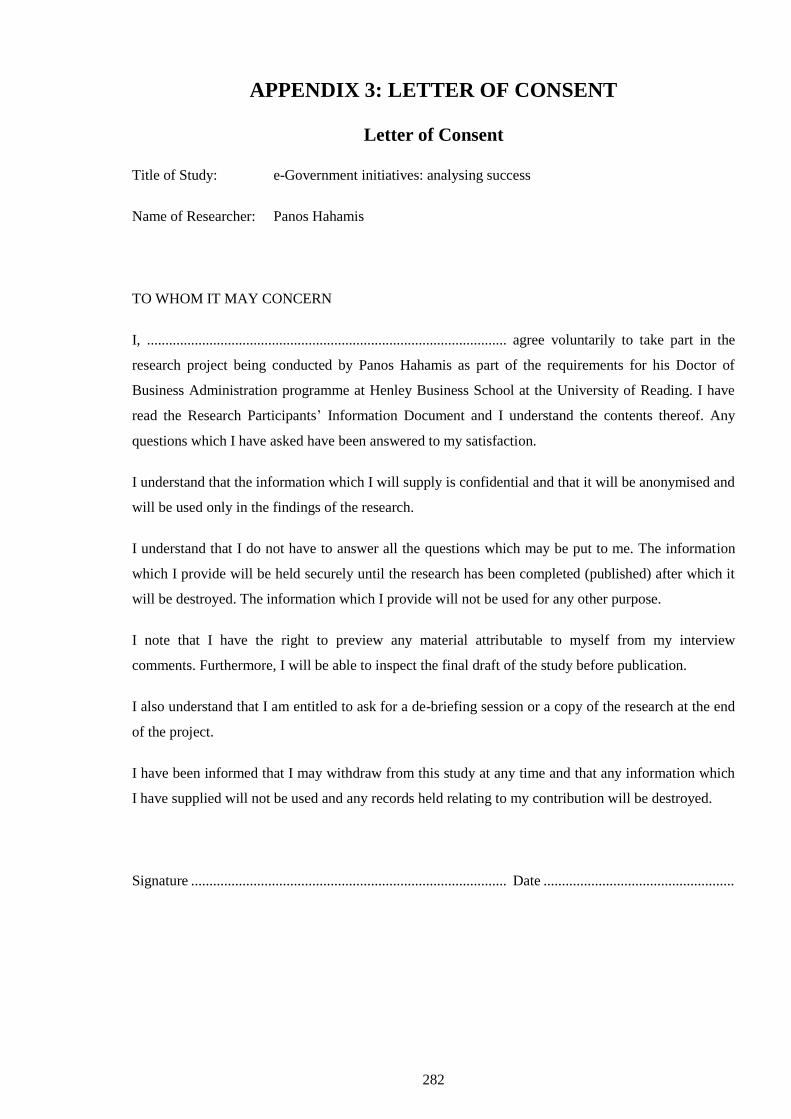
282
APPENDIX 3: LETTER OF CONSENT
Letter of Consent
Title of Study: e-Government initiatives: analysing success
Name of Researcher: Panos Hahamis
TO WHOM IT MAY CONCERN
I, .................................................................................................. agree voluntarily to take part in the
research project being conducted by Panos Hahamis as part of the requirements for his Doctor of
Business Administration programme at Henley Business School at the University of Reading. I have
read the Research Participants’ Information Document and I understand the contents thereof. Any
questions which I have asked have been answered to my satisfaction.
I understand that the information which I will supply is confidential and that it will be anonymised and
will be used only in the findings of the research.
I understand that I do not have to answer all the questions which may be put to me. The information
which I provide will be held securely until the research has been completed (published) after which it
will be destroyed. The information which I provide will not be used for any other purpose.
I note that I have the right to preview any material attributable to myself from my interview
comments. Furthermore, I will be able to inspect the final draft of the study before publication.
I also understand that I am entitled to ask for a de-briefing session or a copy of the research at the end
of the project.
I have been informed that I may withdraw from this study at any time and that any information which
I have supplied will not be used and any records held relating to my contribution will be destroyed.
Signature ...................................................................................... Date ....................................................
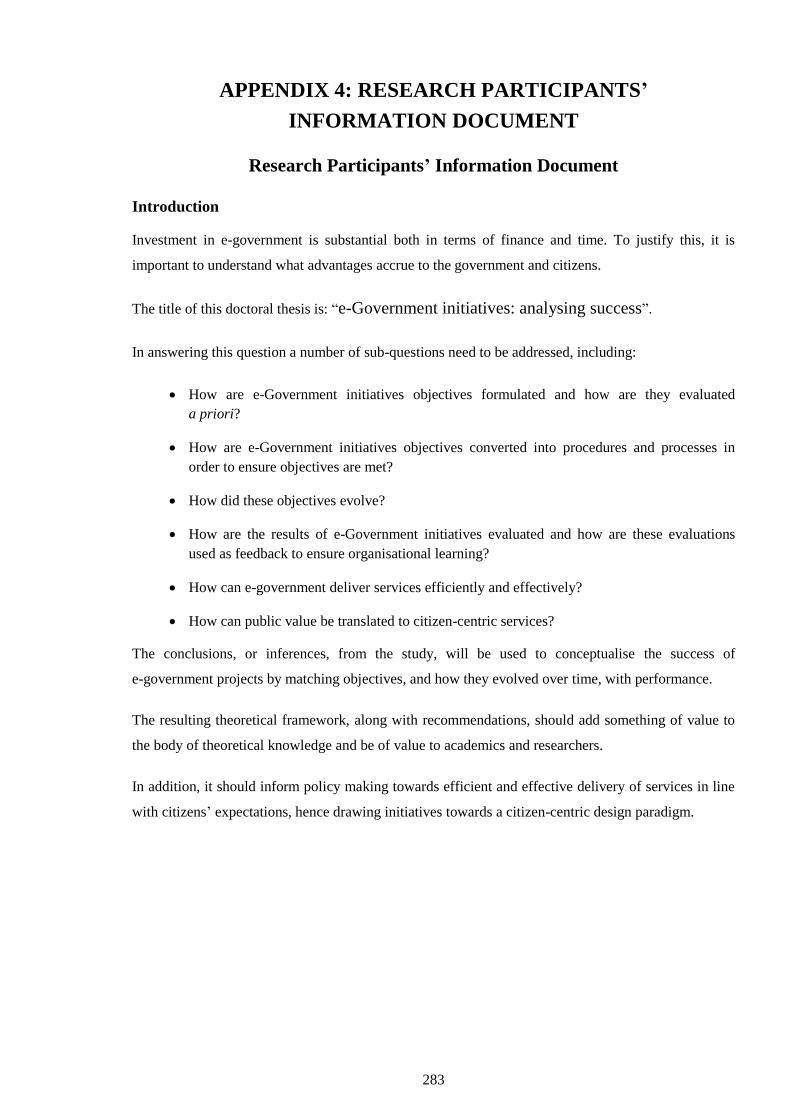
283
APPENDIX 4: RESEARCH PARTICIPANTS’
INFORMATION DOCUMENT
Research Participants’ Information Document
Introduction
Investment in e-government is substantial both in terms of finance and time. To justify this, it is
important to understand what advantages accrue to the government and citizens.
The title of this doctoral thesis is: “e-Government initiatives: analysing success”.
In answering this question a number of sub-questions need to be addressed, including:
How are e-Government initiatives objectives formulated and how are they evaluated
a priori?
How are e-Government initiatives objectives converted into procedures and processes in
order to ensure objectives are met?
How did these objectives evolve?
How are the results of e-Government initiatives evaluated and how are these evaluations
used as feedback to ensure organisational learning?
How can e-government deliver services efficiently and effectively?
How can public value be translated to citizen-centric services?
The conclusions, or inferences, from the study, will be used to conceptualise the success of
e-government projects by matching objectives, and how they evolved over time, with performance.
The resulting theoretical framework, along with recommendations, should add something of value to
the body of theoretical knowledge and be of value to academics and researchers.
In addition, it should inform policy making towards efficient and effective delivery of services in line
with citizens’ expectations, hence drawing initiatives towards a citizen-centric design paradigm.
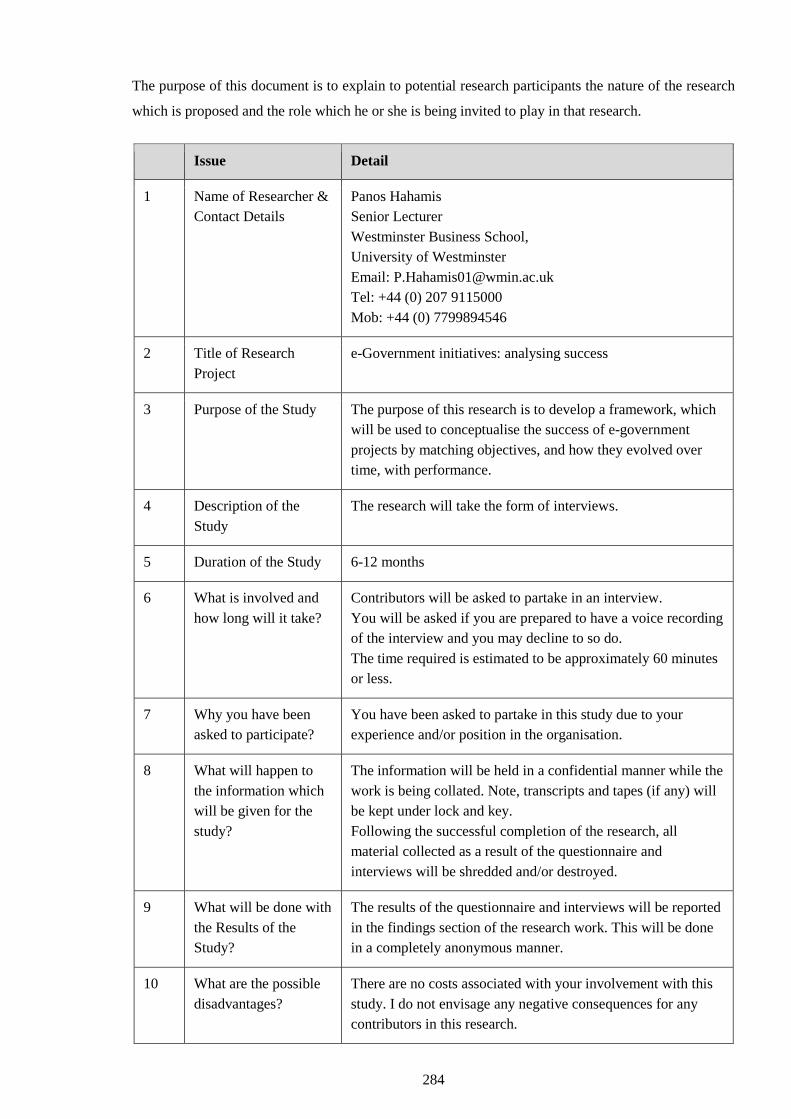
284
The purpose of this document is to explain to potential research participants the nature of the research
which is proposed and the role which he or she is being invited to play in that research.
Issue Detail
1 Name of Researcher &
Contact Details
Panos Hahamis
Senior Lecturer
Westminster Business School,
University of Westminster
Email: [email protected]
Tel: +44 (0) 207 9115000
Mob: +44 (0) 7799894546
2 Title of Research
Project
e-Government initiatives: analysing success
3 Purpose of the Study The purpose of this research is to develop a framework, which
will be used to conceptualise the success of e-government
projects by matching objectives, and how they evolved over
time, with performance.
4 Description of the
Study
The research will take the form of interviews.
5 Duration of the Study 6-12 months
6 What is involved and
how long will it take?
Contributors will be asked to partake in an interview.
You will be asked if you are prepared to have a voice recording
of the interview and you may decline to so do.
The time required is estimated to be approximately 60 minutes
or less.
7 Why you have been
asked to participate?
You have been asked to partake in this study due to your
experience and/or position in the organisation.
8 What will happen to
the information which
will be given for the
study?
The information will be held in a confidential manner while the
work is being collated. Note, transcripts and tapes (if any) will
be kept under lock and key.
Following the successful completion of the research, all
material collected as a result of the questionnaire and
interviews will be shredded and/or destroyed.
9 What will be done with
the Results of the
Study?
The results of the questionnaire and interviews will be reported
in the findings section of the research work. This will be done
in a completely anonymous manner.
10 What are the possible
disadvantages?
There are no costs associated with your involvement with this
study. I do not envisage any negative consequences for any
contributors in this research.
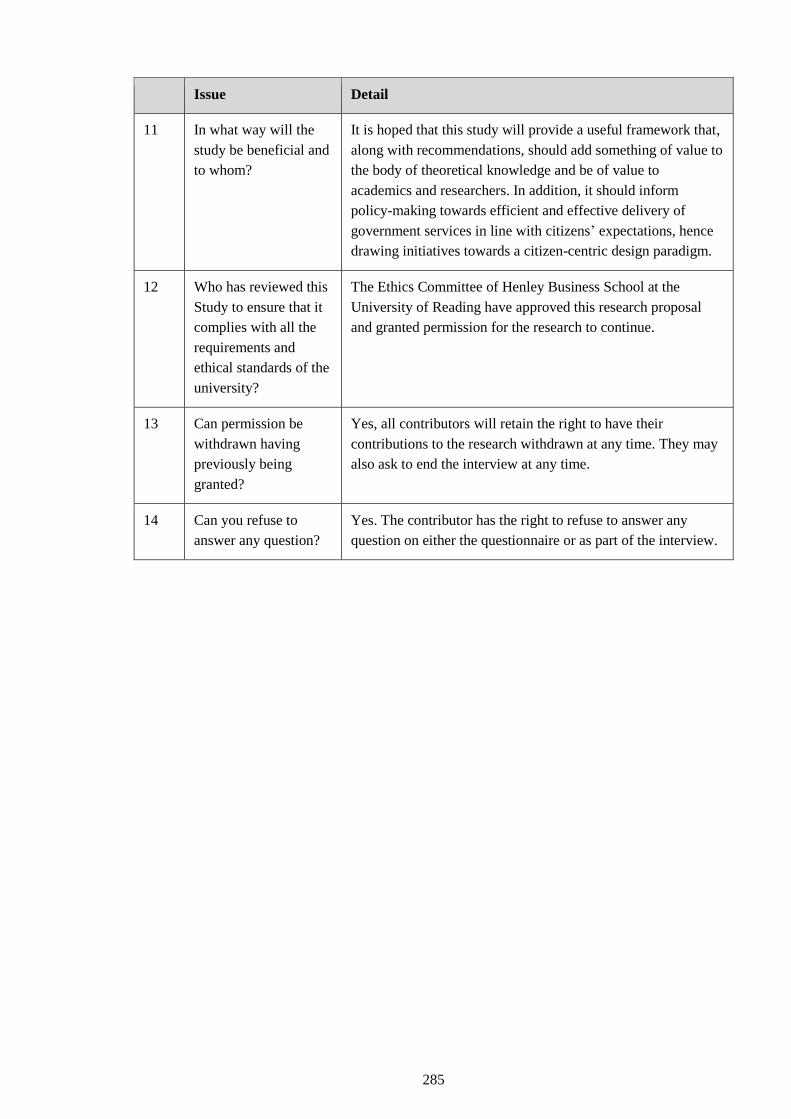
285
Issue Detail
11 In what way will the
study be beneficial and
to whom?
It is hoped that this study will provide a useful framework that,
along with recommendations, should add something of value to
the body of theoretical knowledge and be of value to
academics and researchers. In addition, it should inform
policy-making towards efficient and effective delivery of
government services in line with citizens’ expectations, hence
drawing initiatives towards a citizen-centric design paradigm.
12 Who has reviewed this
Study to ensure that it
complies with all the
requirements and
ethical standards of the
university?
The Ethics Committee of Henley Business School at the
University of Reading have approved this research proposal
and granted permission for the research to continue.
13 Can permission be
withdrawn having
previously being
granted?
Yes, all contributors will retain the right to have their
contributions to the research withdrawn at any time. They may
also ask to end the interview at any time.
14 Can you refuse to
answer any question?
Yes. The contributor has the right to refuse to answer any
question on either the questionnaire or as part of the interview.

286
APPENDIX 5: SERVICE AND CONFIDENTIALITY/NON-
DISCLOSURE AGREEMENT
White Transcription Services Limited (Reg No.6142474)
Registered Offices: 7 Crown Road, Tickhill, South Yorks. DN11 9PA
Tel: 01302 759597. Email: [email protected]
Service and Confidentiality/Non-Disclosure Agreement between:
White Transcription Services Limited
AND
Westminster Business School
University of Westminster
35 Marylebone Road
London NW1 5LS
White Transcription Services Limited fully understand that any work supplied is the property of
Westminster Business School, White Transcription Services Limited understand that the sound files
supplied are highly confidential and must not be discussed/passed onto / used for gain/ disclosed
UNDER ANY CIRCUMSTANCES.
White Transcription Services Limited agree to immediately delete any documents / files sent to us by
Westminster Business School if instructed to do so.
White Transcription Services Limited understand that the work supplied is required to be
stored/downloaded to/uploaded from a FIPS 140-2 encrypted flash drive. White Transcription Services
Limited agree that it shall delete all audio and transcriptions from the FIPS flash drive (both audio and
completed transcriptions) as soon as the completed file has been received Westminster Business
School.
White Transcription Services Limited understand that all work supplied is strictly confidential and it’s
directors and staff agree not to disclose any information gained during transcription. All staff have
been supplied with a non-disclosure and security policy/agreement which is held by the Directors of
White Transcription Services Limited
Panos Hahamis of Westminster Business school has been provided with a unique username and
password which accesses White Transcription Services Limited secure upload / download site.
Access to any documents resulting from disclosure of same is not the responsibility of White
Transcription Services Limited.
Signed:
Nicola White (Director)
(For: White Transcriptions Services Ltd )
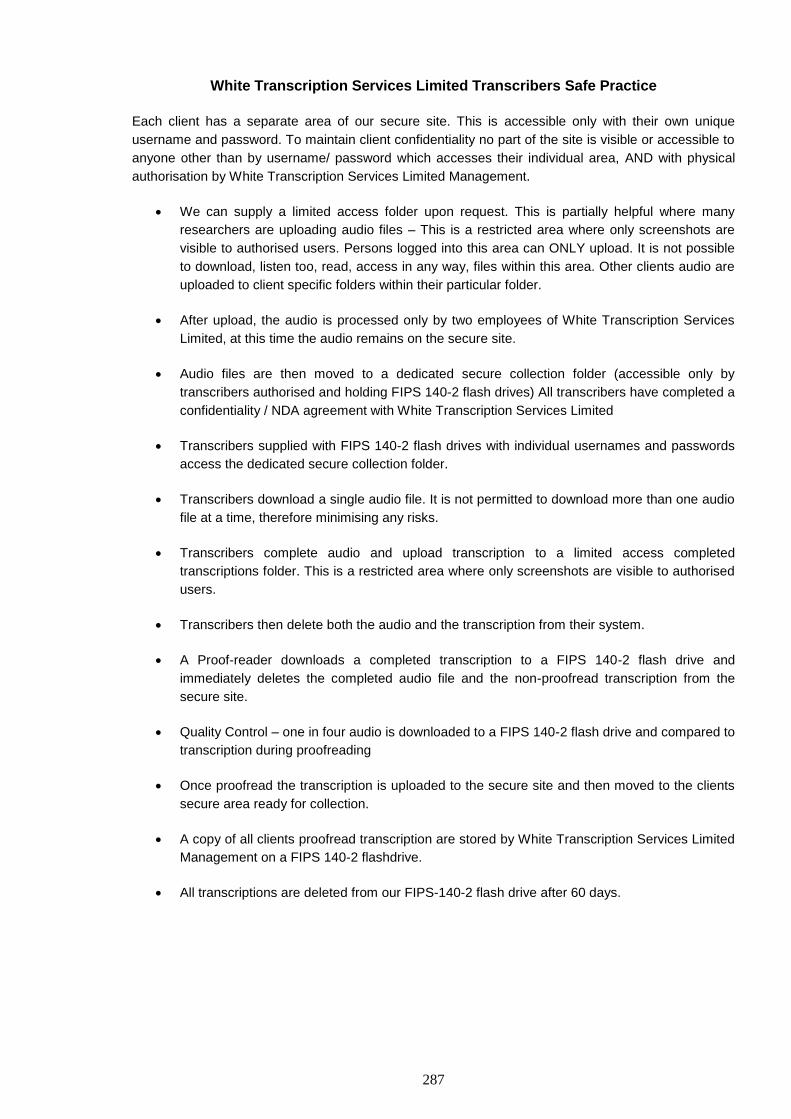
287
White Transcription Services Limited Transcribers Safe Practice
Each client has a separate area of our secure site. This is accessible only with their own unique
username and password. To maintain client confidentiality no part of the site is visible or accessible to
anyone other than by username/ password which accesses their individual area, AND with physical
authorisation by White Transcription Services Limited Management.
We can supply a limited access folder upon request. This is partially helpful where many
researchers are uploading audio files – This is a restricted area where only screenshots are
visible to authorised users. Persons logged into this area can ONLY upload. It is not possible
to download, listen too, read, access in any way, files within this area. Other clients audio are
uploaded to client specific folders within their particular folder.
After upload, the audio is processed only by two employees of White Transcription Services
Limited, at this time the audio remains on the secure site.
Audio files are then moved to a dedicated secure collection folder (accessible only by
transcribers authorised and holding FIPS 140-2 flash drives) All transcribers have completed a
confidentiality / NDA agreement with White Transcription Services Limited
Transcribers supplied with FIPS 140-2 flash drives with individual usernames and passwords
access the dedicated secure collection folder.
Transcribers download a single audio file. It is not permitted to download more than one audio
file at a time, therefore minimising any risks.
Transcribers complete audio and upload transcription to a limited access completed
transcriptions folder. This is a restricted area where only screenshots are visible to authorised
users.
Transcribers then delete both the audio and the transcription from their system.
A Proof-reader downloads a completed transcription to a FIPS 140-2 flash drive and
immediately deletes the completed audio file and the non-proofread transcription from the
secure site.
Quality Control – one in four audio is downloaded to a FIPS 140-2 flash drive and compared to
transcription during proofreading
Once proofread the transcription is uploaded to the secure site and then moved to the clients
secure area ready for collection.
A copy of all clients proofread transcription are stored by White Transcription Services Limited
Management on a FIPS 140-2 flashdrive.
All transcriptions are deleted from our FIPS-140-2 flash drive after 60 days.
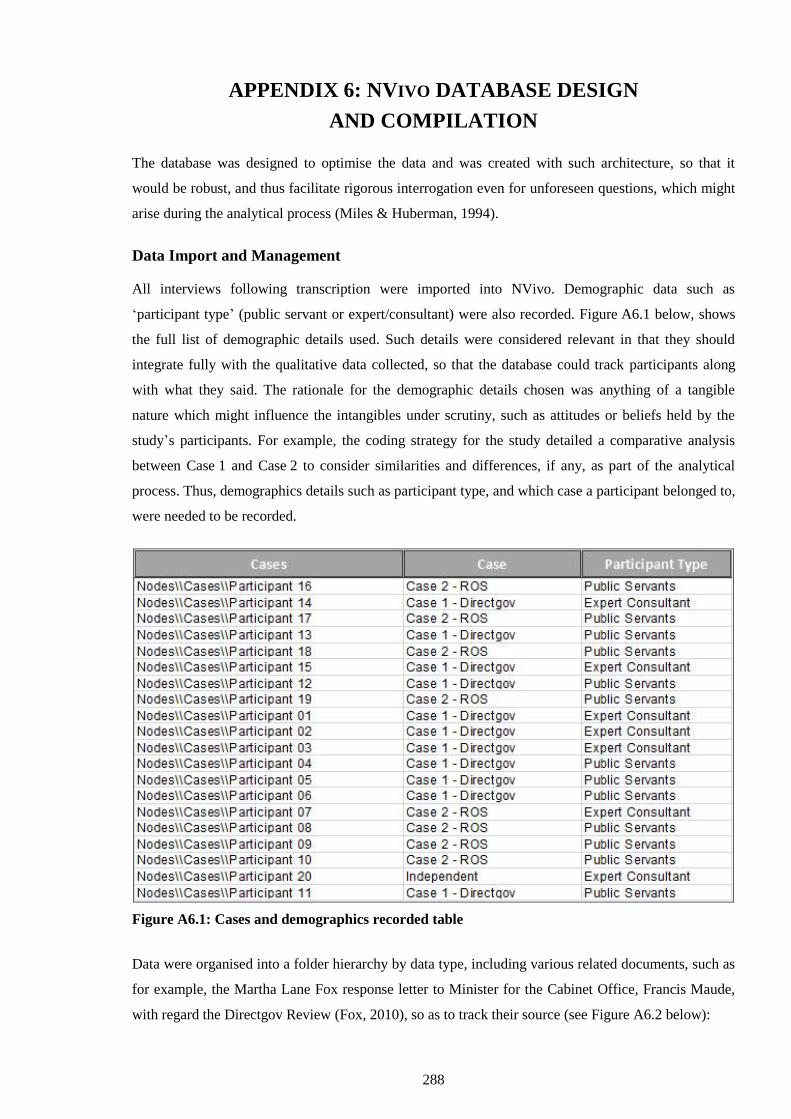
288
APPENDIX 6: NVIVO DATABASE DESIGN
AND COMPILATION
The database was designed to optimise the data and was created with such architecture, so that it
would be robust, and thus facilitate rigorous interrogation even for unforeseen questions, which might
arise during the analytical process (Miles & Huberman, 1994).
Data Import and Management
All interviews following transcription were imported into NVivo. Demographic data such as
‘participant type’ (public servant or expert/consultant) were also recorded. Figure A6.1 below, shows
the full list of demographic details used. Such details were considered relevant in that they should
integrate fully with the qualitative data collected, so that the database could track participants along
with what they said. The rationale for the demographic details chosen was anything of a tangible
nature which might influence the intangibles under scrutiny, such as attitudes or beliefs held by the
study’s participants. For example, the coding strategy for the study detailed a comparative analysis
between Case 1 and Case 2 to consider similarities and differences, if any, as part of the analytical
process. Thus, demographics details such as participant type, and which case a participant belonged to,
were needed to be recorded.
Figure A6.1: Cases and demographics recorded table
Data were organised into a folder hierarchy by data type, including various related documents, such as
for example, the Martha Lane Fox response letter to Minister for the Cabinet Office, Francis Maude,
with regard the Directgov Review (Fox, 2010), so as to track their source (see Figure A6.2 below):
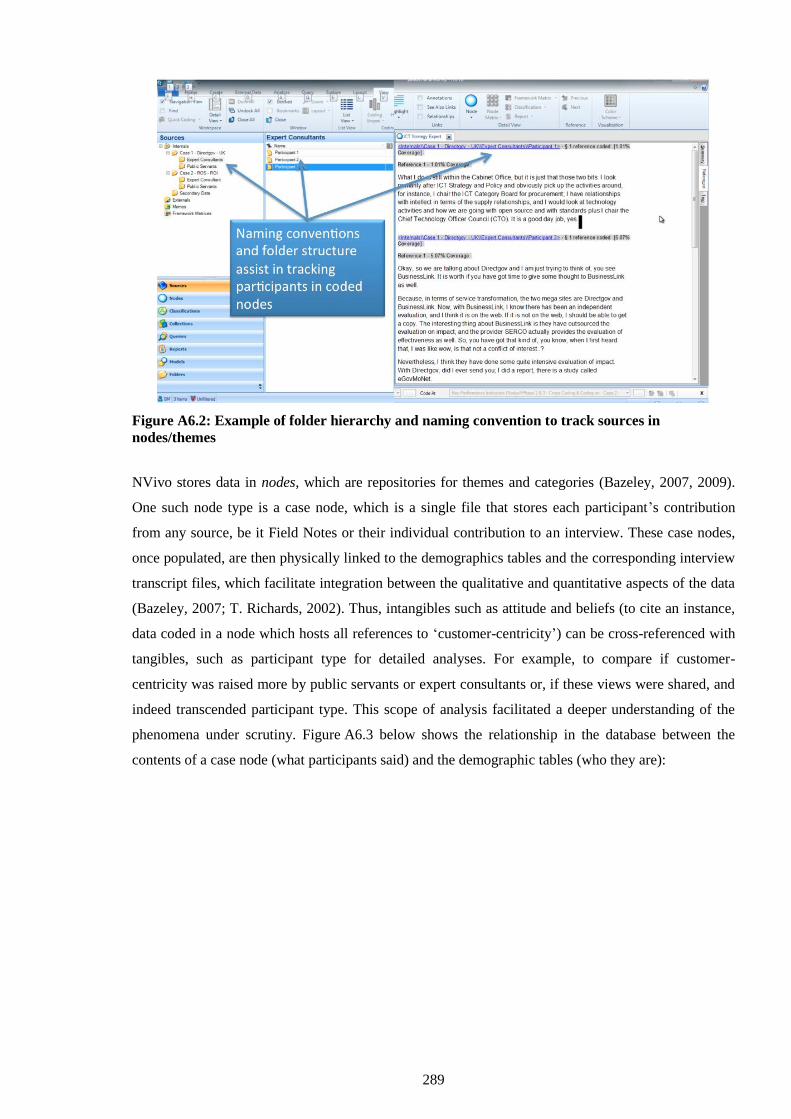
289
Figure A6.2: Example of folder hierarchy and naming convention to track sources in
nodes/themes
NVivo stores data in nodes, which are repositories for themes and categories (Bazeley, 2007, 2009).
One such node type is a case node, which is a single file that stores each participant’s contribution
from any source, be it Field Notes or their individual contribution to an interview. These case nodes,
once populated, are then physically linked to the demographics tables and the corresponding interview
transcript files, which facilitate integration between the qualitative and quantitative aspects of the data
(Bazeley, 2007; T. Richards, 2002). Thus, intangibles such as attitude and beliefs (to cite an instance,
data coded in a node which hosts all references to ‘customer-centricity’) can be cross-referenced with
tangibles, such as participant type for detailed analyses. For example, to compare if customer-
centricity was raised more by public servants or expert consultants or, if these views were shared, and
indeed transcended participant type. This scope of analysis facilitated a deeper understanding of the
phenomena under scrutiny. Figure A6.3 below shows the relationship in the database between the
contents of a case node (what participants said) and the demographic tables (who they are):
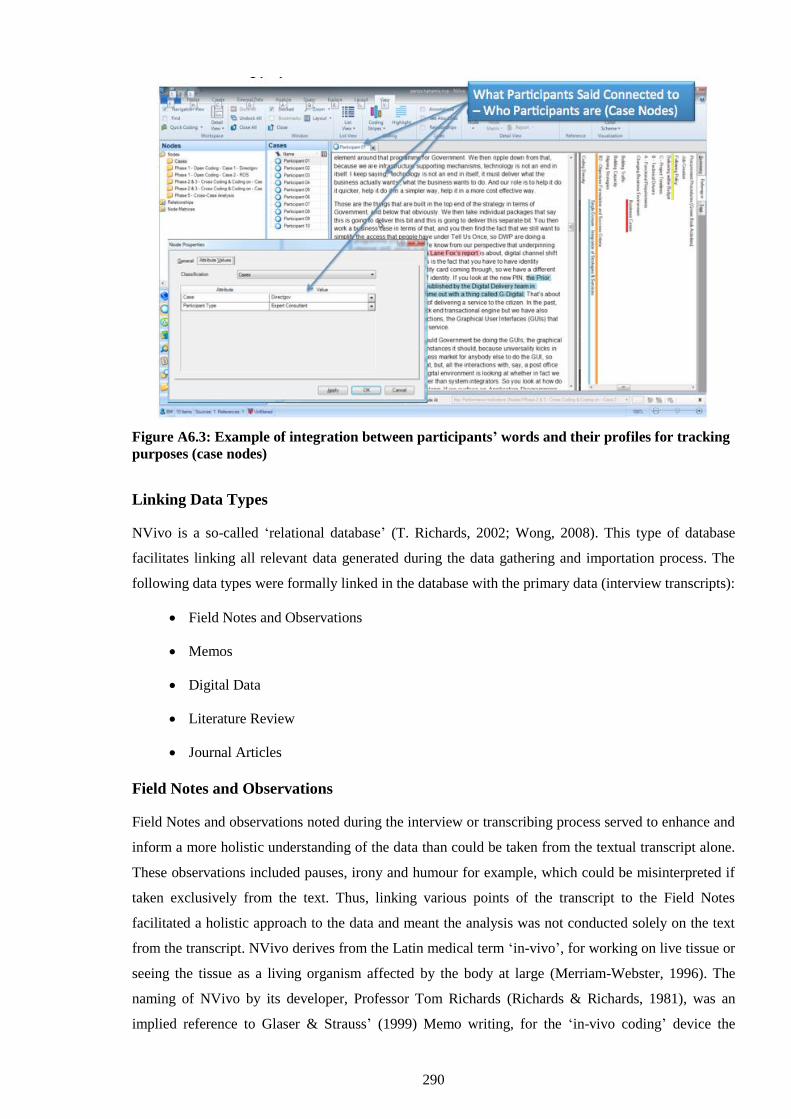
290
Figure A6.3: Example of integration between participants’ words and their profiles for tracking
purposes (case nodes)
Linking Data Types
NVivo is a so-called ‘relational database’ (T. Richards, 2002; Wong, 2008). This type of database
facilitates linking all relevant data generated during the data gathering and importation process. The
following data types were formally linked in the database with the primary data (interview transcripts):
Field Notes and Observations
Memos
Digital Data
Literature Review
Journal Articles
Field Notes and Observations
Field Notes and observations noted during the interview or transcribing process served to enhance and
inform a more holistic understanding of the data than could be taken from the textual transcript alone.
These observations included pauses, irony and humour for example, which could be misinterpreted if
taken exclusively from the text. Thus, linking various points of the transcript to the Field Notes
facilitated a holistic approach to the data and meant the analysis was not conducted solely on the text
from the transcript. NVivo derives from the Latin medical term ‘in-vivo’, for working on live tissue or
seeing the tissue as a living organism affected by the body at large (Merriam-Webster, 1996). The
naming of NVivo by its developer, Professor Tom Richards (Richards & Richards, 1981), was an
implied reference to Glaser & Strauss’ (1999) Memo writing, for the ‘in-vivo coding’ device the
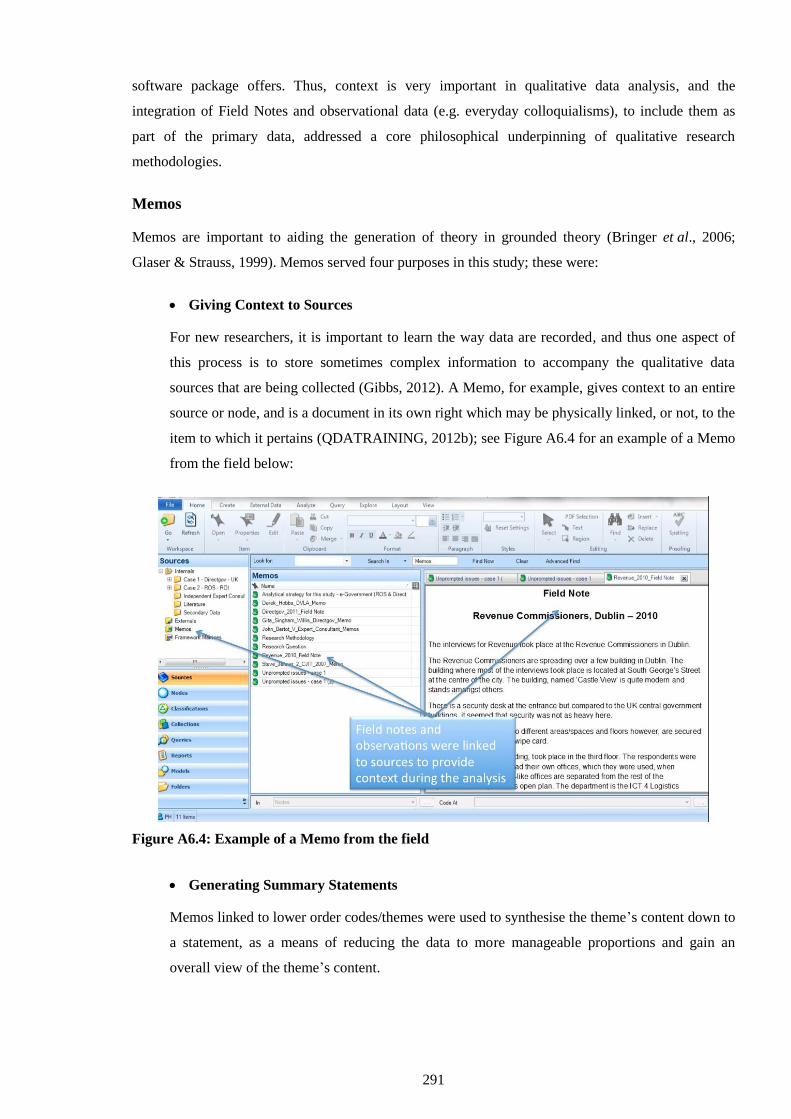
291
software package offers. Thus, context is very important in qualitative data analysis, and the
integration of Field Notes and observational data (e.g. everyday colloquialisms), to include them as
part of the primary data, addressed a core philosophical underpinning of qualitative research
methodologies.
Memos
Memos are important to aiding the generation of theory in grounded theory (Bringer et al., 2006;
Glaser & Strauss, 1999). Memos served four purposes in this study; these were:
Giving Context to Sources
For new researchers, it is important to learn the way data are recorded, and thus one aspect of
this process is to store sometimes complex information to accompany the qualitative data
sources that are being collected (Gibbs, 2012). A Memo, for example, gives context to an entire
source or node, and is a document in its own right which may be physically linked, or not, to the
item to which it pertains (QDATRAINING, 2012b); see Figure A6.4 for an example of a Memo
from the field below:
Figure A6.4: Example of a Memo from the field
Generating Summary Statements
Memos linked to lower order codes/themes were used to synthesise the theme’s content down to
a statement, as a means of reducing the data to more manageable proportions and gain an
overall view of the theme’s content.
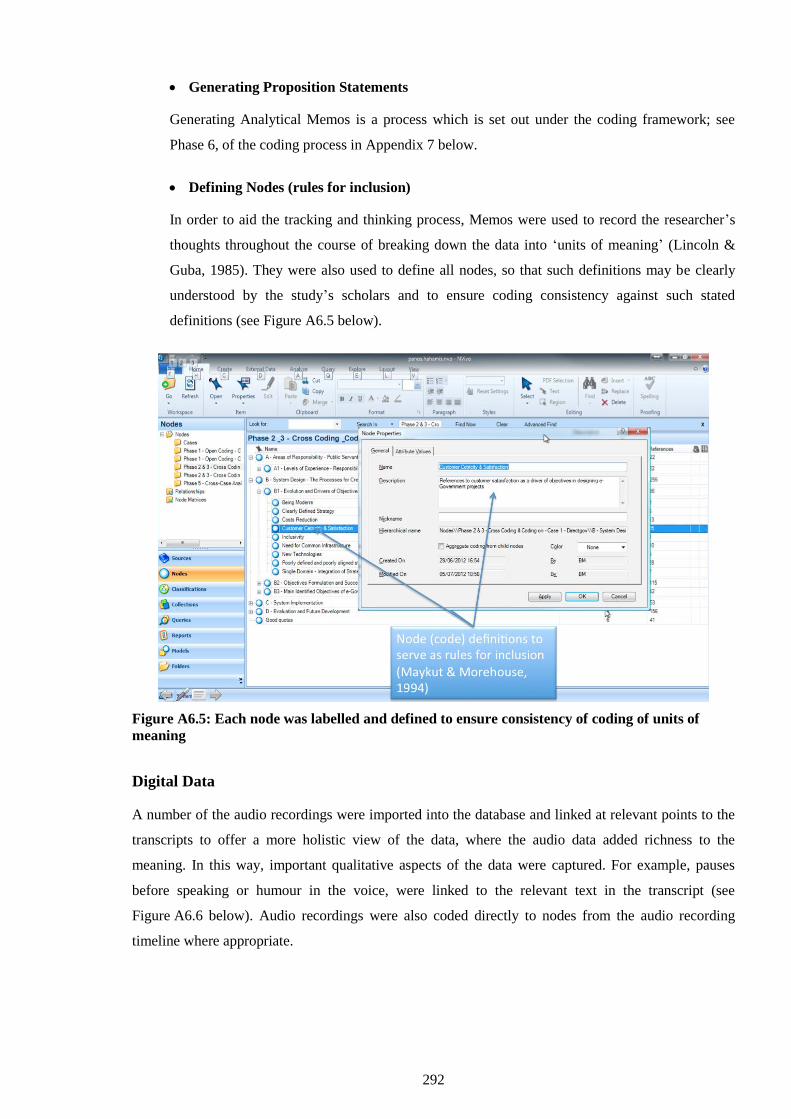
292
Generating Proposition Statements
Generating Analytical Memos is a process which is set out under the coding framework; see
Phase 6, of the coding process in Appendix 7 below.
Defining Nodes (rules for inclusion)
In order to aid the tracking and thinking process, Memos were used to record the researcher’s
thoughts throughout the course of breaking down the data into ‘units of meaning’ (Lincoln &
Guba, 1985). They were also used to define all nodes, so that such definitions may be clearly
understood by the study’s scholars and to ensure coding consistency against such stated
definitions (see Figure A6.5 below).
Figure A6.5: Each node was labelled and defined to ensure consistency of coding of units of
meaning
Digital Data
A number of the audio recordings were imported into the database and linked at relevant points to the
transcripts to offer a more holistic view of the data, where the audio data added richness to the
meaning. In this way, important qualitative aspects of the data were captured. For example, pauses
before speaking or humour in the voice, were linked to the relevant text in the transcript (see
Figure A6.6 below). Audio recordings were also coded directly to nodes from the audio recording
timeline where appropriate.
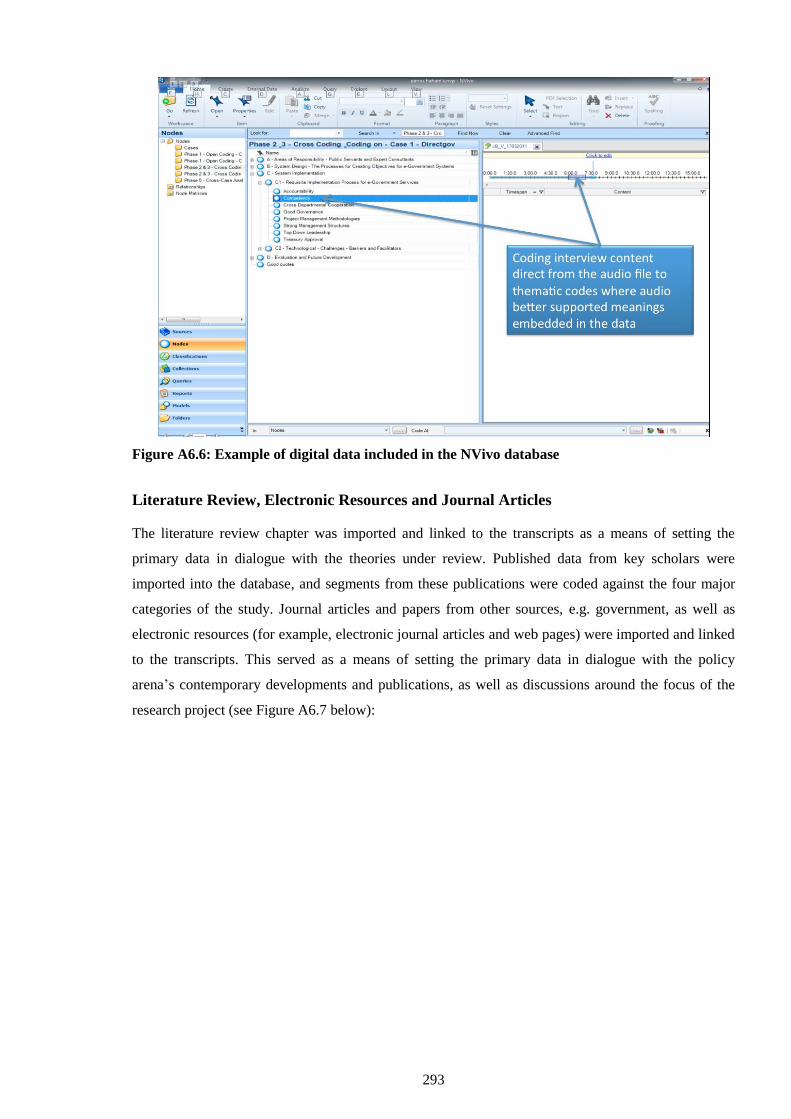
293
Figure A6.6: Example of digital data included in the NVivo database
Literature Review, Electronic Resources and Journal Articles
The literature review chapter was imported and linked to the transcripts as a means of setting the
primary data in dialogue with the theories under review. Published data from key scholars were
imported into the database, and segments from these publications were coded against the four major
categories of the study. Journal articles and papers from other sources, e.g. government, as well as
electronic resources (for example, electronic journal articles and web pages) were imported and linked
to the transcripts. This served as a means of setting the primary data in dialogue with the policy
arena’s contemporary developments and publications, as well as discussions around the focus of the
research project (see Figure A6.7 below):
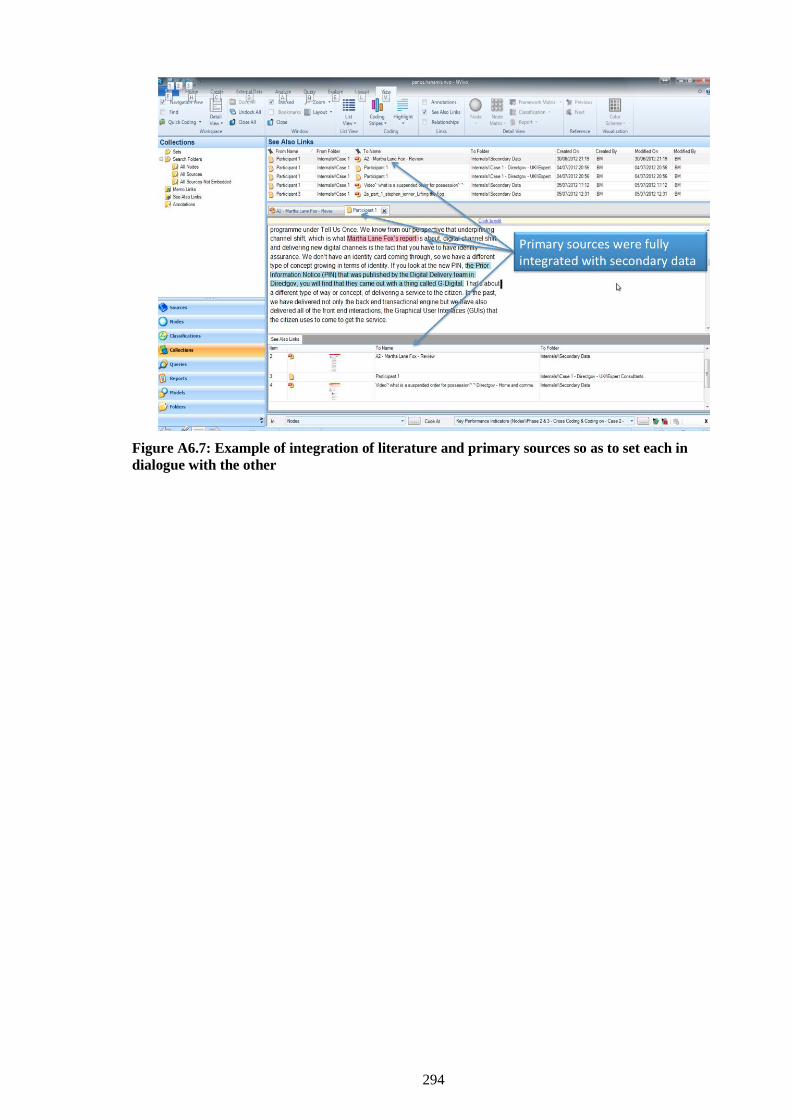
294
Figure A6.7: Example of integration of literature and primary sources so as to set each in
dialogue with the other
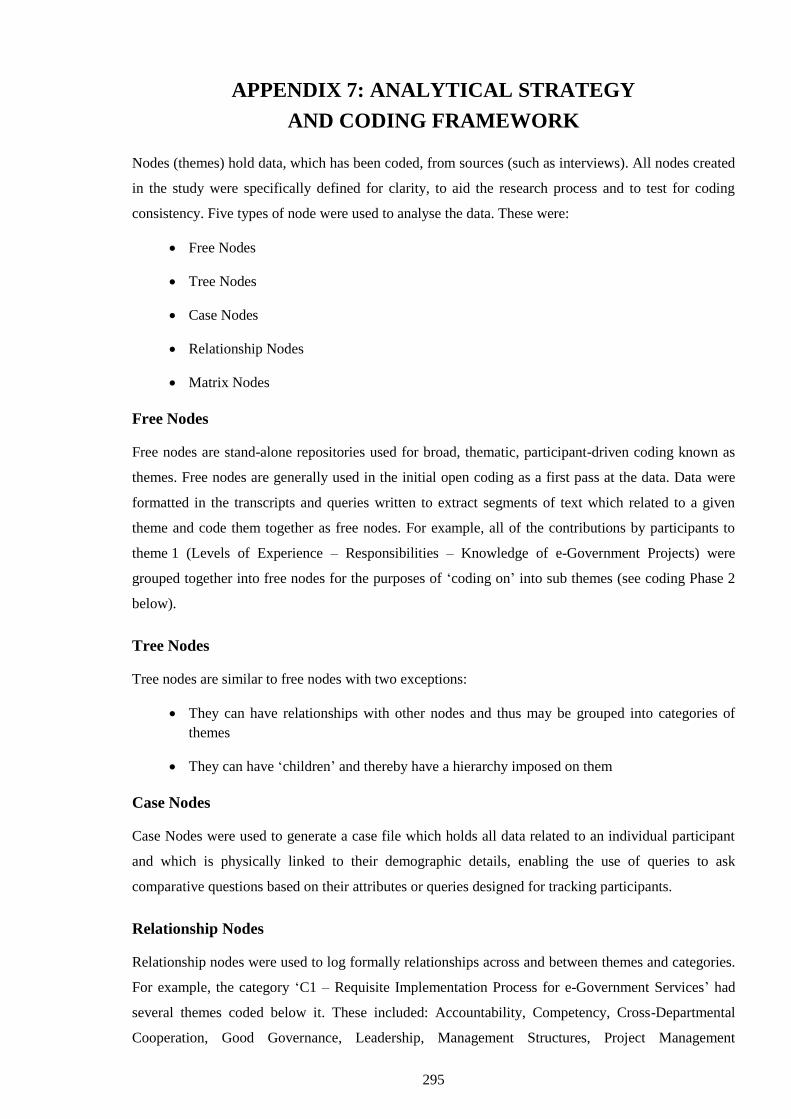
295
APPENDIX 7: ANALYTICAL STRATEGY
AND CODING FRAMEWORK
Nodes (themes) hold data, which has been coded, from sources (such as interviews). All nodes created
in the study were specifically defined for clarity, to aid the research process and to test for coding
consistency. Five types of node were used to analyse the data. These were:
Free Nodes
Tree Nodes
Case Nodes
Relationship Nodes
Matrix Nodes
Free Nodes
Free nodes are stand-alone repositories used for broad, thematic, participant-driven coding known as
themes. Free nodes are generally used in the initial open coding as a first pass at the data. Data were
formatted in the transcripts and queries written to extract segments of text which related to a given
theme and code them together as free nodes. For example, all of the contributions by participants to
theme 1 (Levels of Experience – Responsibilities – Knowledge of e-Government Projects) were
grouped together into free nodes for the purposes of ‘coding on’ into sub themes (see coding Phase 2
below).
Tree Nodes
Tree nodes are similar to free nodes with two exceptions:
They can have relationships with other nodes and thus may be grouped into categories of
themes
They can have ‘children’ and thereby have a hierarchy imposed on them
Case Nodes
Case Nodes were used to generate a case file which holds all data related to an individual participant
and which is physically linked to their demographic details, enabling the use of queries to ask
comparative questions based on their attributes or queries designed for tracking participants.
Relationship Nodes
Relationship nodes were used to log formally relationships across and between themes and categories.
For example, the category ‘C1 – Requisite Implementation Process for e-Government Services’ had
several themes coded below it. These included: Accountability, Competency, Cross-Departmental
Cooperation, Good Governance, Leadership, Management Structures, Project Management
296
Methodologies and Treasury Approval. Relationships were defined and coded between the following
codes: ‘Poorly Defined and Poorly Aligned Strategies’ (category B1) impacts on ‘Top-Down
Leadership’ which impacts on ‘Accountability’, leading to ‘Weaker Management Structures’,
resulting in ‘Poorer Governance’, leading to ‘Lack of Cross-Departmental Cooperation’, resulting in
‘Information Systems Deficit’, in its turn resulting in ‘Poorer Project Management Methodologies’,
leading to ‘Poorer Evaluation Methodologies’ (category D1), and hence leading to ‘Less Desirable
Outcomes’. Relationship nodes allow for conceptually mapping relationships across and between
themes and categories during the analytical processes (see Figure A7.1 below):
Figure A7.1: Example of relationship nodes
Matrix Nodes
Matrix nodes were used to intersect disparate nodes with each other, and with cases and
demographics. They were also used to analyse qualitative coding. For example, how often something
was raised prompted or unprompted (number of coding references), or how animated a person was
about something (number of words coded or amount of time taken up).
Application of Nodes in the Study – Coding Strategy
A coding strategy was used in the study to apply the five types of nodes as detailed above. The
guidelines for this coding methodology were drawn from Lincoln & Guba (1985) and Maykut &
Morehouse (1994), adopting a phenomenological approach based on the ‘constant comparative
method’ as a means of identifying and analysing categories and their relatedness, a process that
facilitates the researcher to develop theoretical perspectives that are grounded in the data.
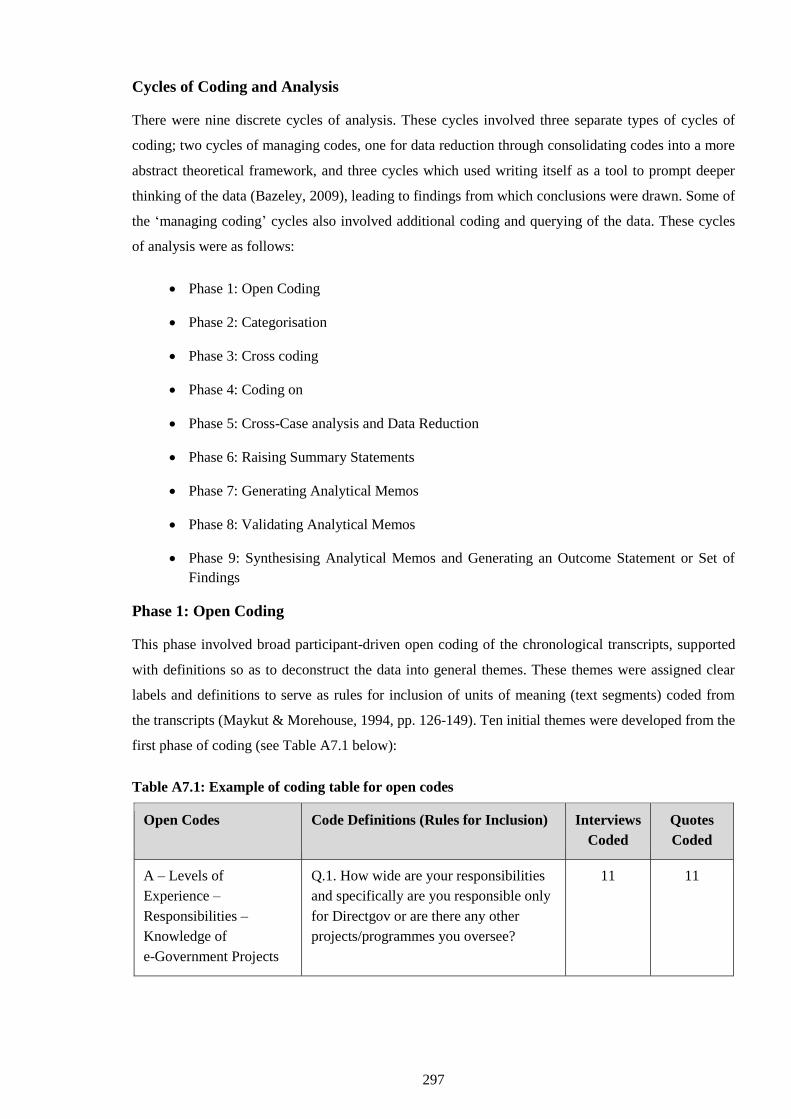
297
Cycles of Coding and Analysis
There were nine discrete cycles of analysis. These cycles involved three separate types of cycles of
coding; two cycles of managing codes, one for data reduction through consolidating codes into a more
abstract theoretical framework, and three cycles which used writing itself as a tool to prompt deeper
thinking of the data (Bazeley, 2009), leading to findings from which conclusions were drawn. Some of
the ‘managing coding’ cycles also involved additional coding and querying of the data. These cycles
of analysis were as follows:
Phase 1: Open Coding
Phase 2: Categorisation
Phase 3: Cross coding
Phase 4: Coding on
Phase 5: Cross-Case analysis and Data Reduction
Phase 6: Raising Summary Statements
Phase 7: Generating Analytical Memos
Phase 8: Validating Analytical Memos
Phase 9: Synthesising Analytical Memos and Generating an Outcome Statement or Set of
Findings
Phase 1: Open Coding
This phase involved broad participant-driven open coding of the chronological transcripts, supported
with definitions so as to deconstruct the data into general themes. These themes were assigned clear
labels and definitions to serve as rules for inclusion of units of meaning (text segments) coded from
the transcripts (Maykut & Morehouse, 1994, pp. 126-149). Ten initial themes were developed from the
first phase of coding (see Table A7.1 below):
Table A7.1: Example of coding table for open codes
Open Codes Code Definitions (Rules for Inclusion) Interviews
Coded
Quotes
Coded
A – Levels of
Experience –
Responsibilities –
Knowledge of
e-Government Projects
Q.1. How wide are your responsibilities
and specifically are you responsible only
for Directgov or are there any other
projects/programmes you oversee?
11 11
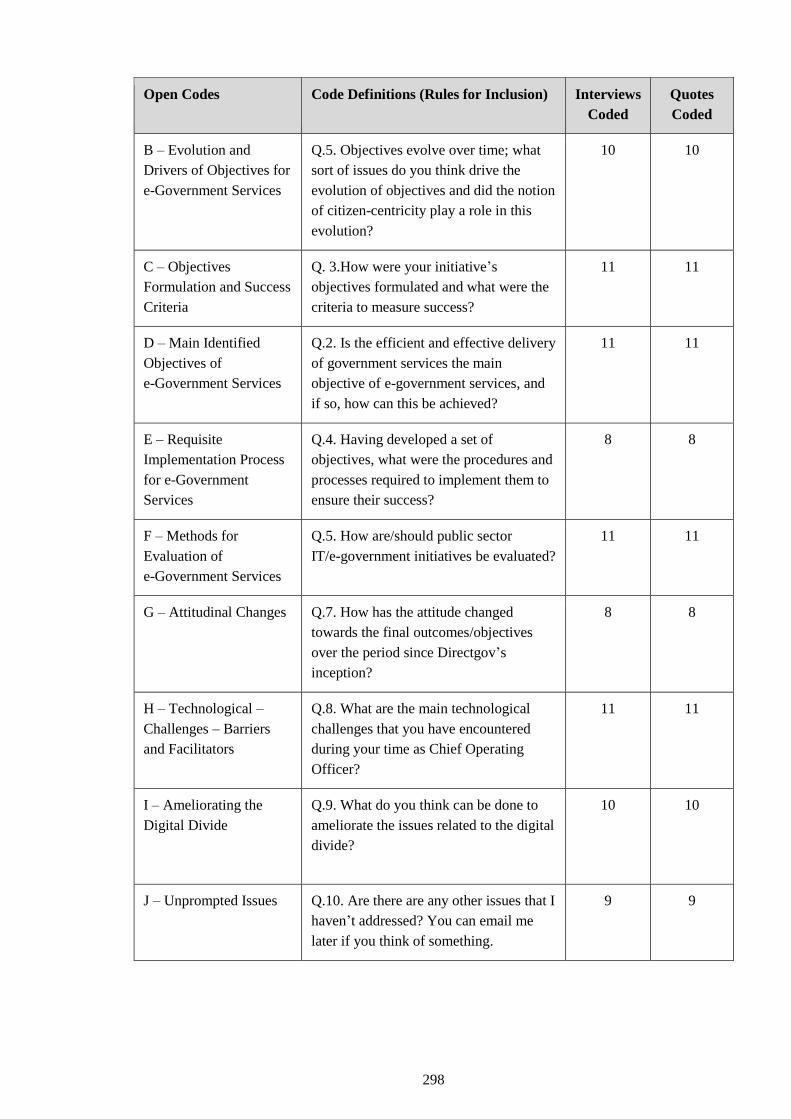
298
Open Codes Code Definitions (Rules for Inclusion) Interviews
Coded
Quotes
Coded
B – Evolution and
Drivers of Objectives for
e-Government Services
Q.5. Objectives evolve over time; what
sort of issues do you think drive the
evolution of objectives and did the notion
of citizen-centricity play a role in this
evolution?
10 10
C – Objectives
Formulation and Success
Criteria
Q. 3.How were your initiative’s
objectives formulated and what were the
criteria to measure success?
11 11
D – Main Identified
Objectives of
e-Government Services
Q.2. Is the efficient and effective delivery
of government services the main
objective of e-government services, and
if so, how can this be achieved?
11 11
E – Requisite
Implementation Process
for e-Government
Services
Q.4. Having developed a set of
objectives, what were the procedures and
processes required to implement them to
ensure their success?
8 8
F – Methods for
Evaluation of
e-Government Services
Q.5. How are/should public sector
IT/e-government initiatives be evaluated?
11 11
G – Attitudinal Changes Q.7. How has the attitude changed
towards the final outcomes/objectives
over the period since Directgov’s
inception?
8 8
H – Technological –
Challenges – Barriers
and Facilitators
Q.8. What are the main technological
challenges that you have encountered
during your time as Chief Operating
Officer?
11 11
I – Ameliorating the
Digital Divide
Q.9. What do you think can be done to
ameliorate the issues related to the digital
divide?
10 10
J – Unprompted Issues Q.10. Are there are any other issues that I
haven’t addressed? You can email me
later if you think of something.
9 9
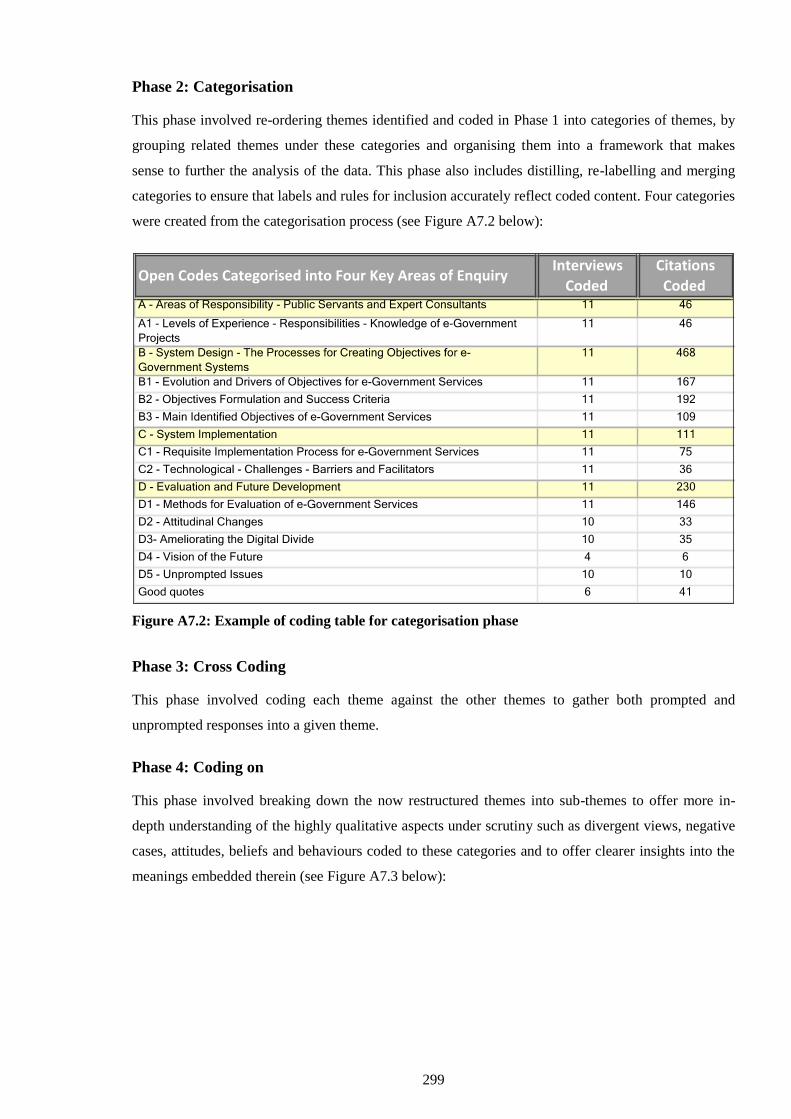
299
Phase 2: Categorisation
This phase involved re-ordering themes identified and coded in Phase 1 into categories of themes, by
grouping related themes under these categories and organising them into a framework that makes
sense to further the analysis of the data. This phase also includes distilling, re-labelling and merging
categories to ensure that labels and rules for inclusion accurately reflect coded content. Four categories
were created from the categorisation process (see Figure A7.2 below):
Figure A7.2: Example of coding table for categorisation phase
Phase 3: Cross Coding
This phase involved coding each theme against the other themes to gather both prompted and
unprompted responses into a given theme.
Phase 4: Coding on
This phase involved breaking down the now restructured themes into sub-themes to offer more in-
depth understanding of the highly qualitative aspects under scrutiny such as divergent views, negative
cases, attitudes, beliefs and behaviours coded to these categories and to offer clearer insights into the
meanings embedded therein (see Figure A7.3 below):
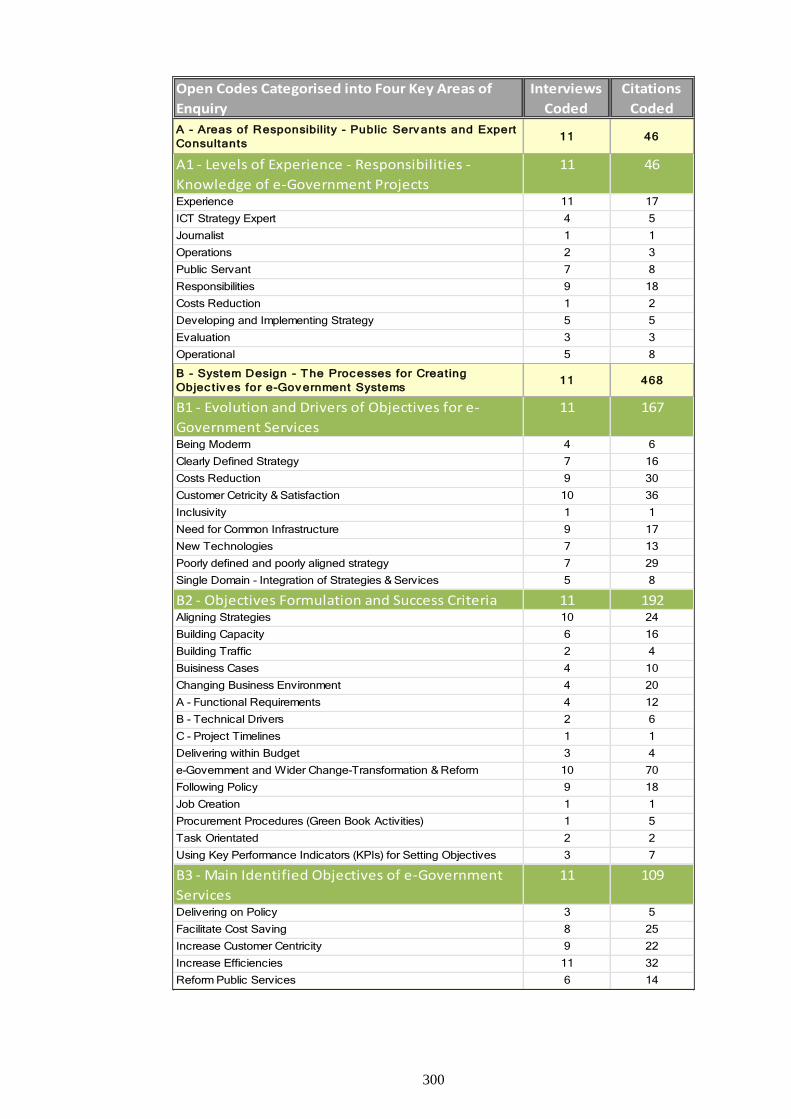
300
Open Codes Categorised into Four Key Areas of
Enquiry
Interviews
Coded
Citations
Coded
A - Areas of Responsibility - Public Serv ants and Expert
Consultants11 46
A1 - Levels of Experience - Responsibilities -
Knowledge of e-Government Projects
11 46
Experience 11 17
ICT Strategy Expert 4 5
Journalist 1 1
Operations 2 3
Public Servant 7 8
Responsibilities 9 18
Costs Reduction 1 2
Developing and Implementing Strategy 5 5
Evaluation 3 3
Operational 5 8
B - System Design - The Proc esses for Creating
Objec tiv es for e-Gov ernment Systems11 468
B1 - Evolution and Drivers of Objectives for e-
Government Services
11 167
Being Moderrn 4 6
Clearly Defined Strategy 7 16
Costs Reduction 9 30
Customer Cetricity & Satisfaction 10 36
Inclusivity 1 1
Need for Common Infrastructure 9 17
New Technologies 7 13
Poorly defined and poorly aligned strategy 7 29
Single Domain - Integration of Strategies & Services 5 8
B2 - Objectives Formulation and Success Criteria 11 192Aligning Strategies 10 24
Building Capacity 6 16
Building Traffic 2 4
Buisiness Cases 4 10
Changing Business Environment 4 20
A - Functional Requirements 4 12
B - Technical Drivers 2 6
C - Project Timelines 1 1
Delivering within Budget 3 4
e-Government and Wider Change-Transformation & Reform 10 70
Following Policy 9 18
Job Creation 1 1
Procurement Procedures (Green Book Activities) 1 5
Task Orientated 2 2
Using Key Performance Indicators (KPIs) for Setting Objectives 3 7
B3 - Main Identified Objectives of e-Government
Services
11 109
Delivering on Policy 3 5
Facilitate Cost Saving 8 25
Increase Customer Centricity 9 22
Increase Efficiencies 11 32
Reform Public Services 6 14
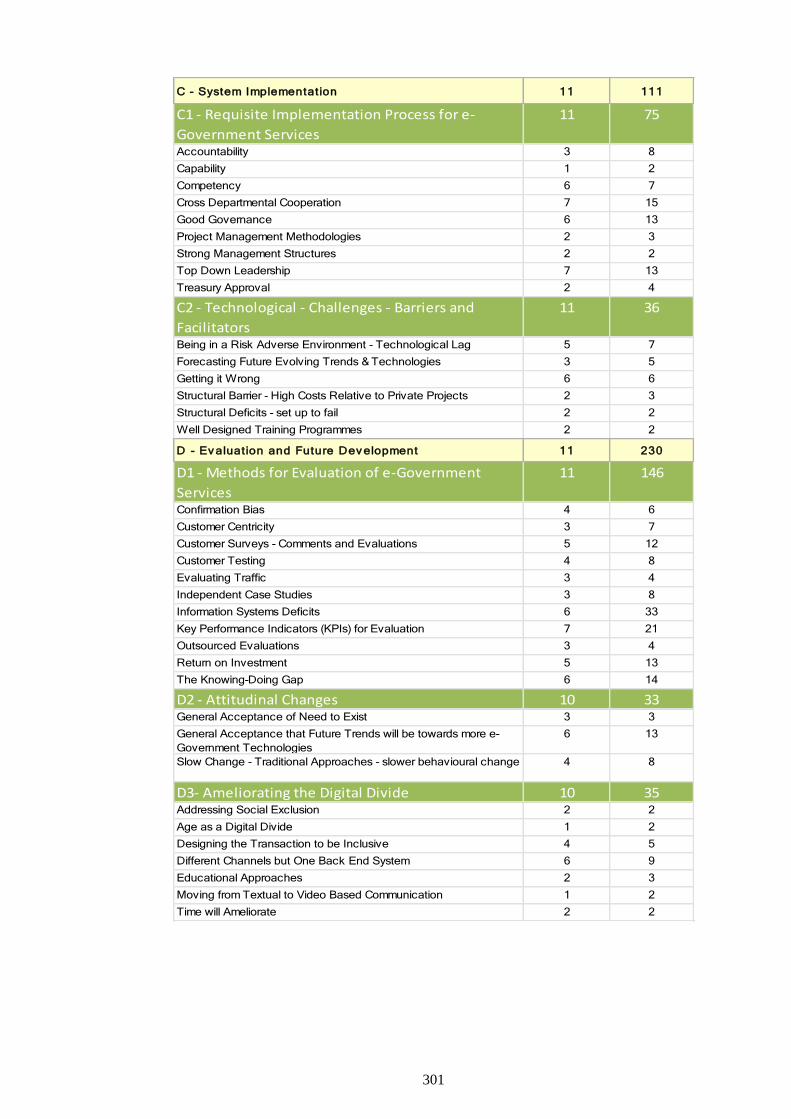
301
C - System Implementation 11 111
C1 - Requisite Implementation Process for e-
Government Services
11 75
Accountability 3 8
Capability 1 2
Competency 6 7
Cross Departmental Cooperation 7 15
Good Governance 6 13
Project Management Methodologies 2 3
Strong Management Structures 2 2
Top Down Leadership 7 13
Treasury Approval 2 4
C2 - Technological - Challenges - Barriers and
Facilitators
11 36
Being in a Risk Adverse Environment - Technological Lag 5 7
Forecasting Future Evolving Trends & Technologies 3 5
Getting it Wrong 6 6
Structural Barrier - High Costs Relative to Private Projects 2 3
Structural Deficits - set up to fail 2 2
Well Designed Training Programmes 2 2
D - Ev aluation and Future Dev elopment 11 230
D1 - Methods for Evaluation of e-Government
Services
11 146
Confirmation Bias 4 6
Customer Centricity 3 7
Customer Surveys - Comments and Evaluations 5 12
Customer Testing 4 8
Evaluating Traffic 3 4
Independent Case Studies 3 8
Information Systems Deficits 6 33
Key Performance Indicators (KPIs) for Evaluation 7 21
Outsourced Evaluations 3 4
Return on Investment 5 13
The Knowing-Doing Gap 6 14
D2 - Attitudinal Changes 10 33General Acceptance of Need to Exist 3 3
General Acceptance that Future Trends will be towards more e-
Government Technologies
6 13
Slow Change - Traditional Approaches - slower behavioural change 4 8
D3- Ameliorating the Digital Divide 10 35Addressing Social Exclusion 2 2
Age as a Digital Divide 1 2
Designing the Transaction to be Inclusive 4 5
Different Channels but One Back End System 6 9
Educational Approaches 2 3
Moving from Textual to Video Based Communication 1 2
Time will Ameliorate 2 2
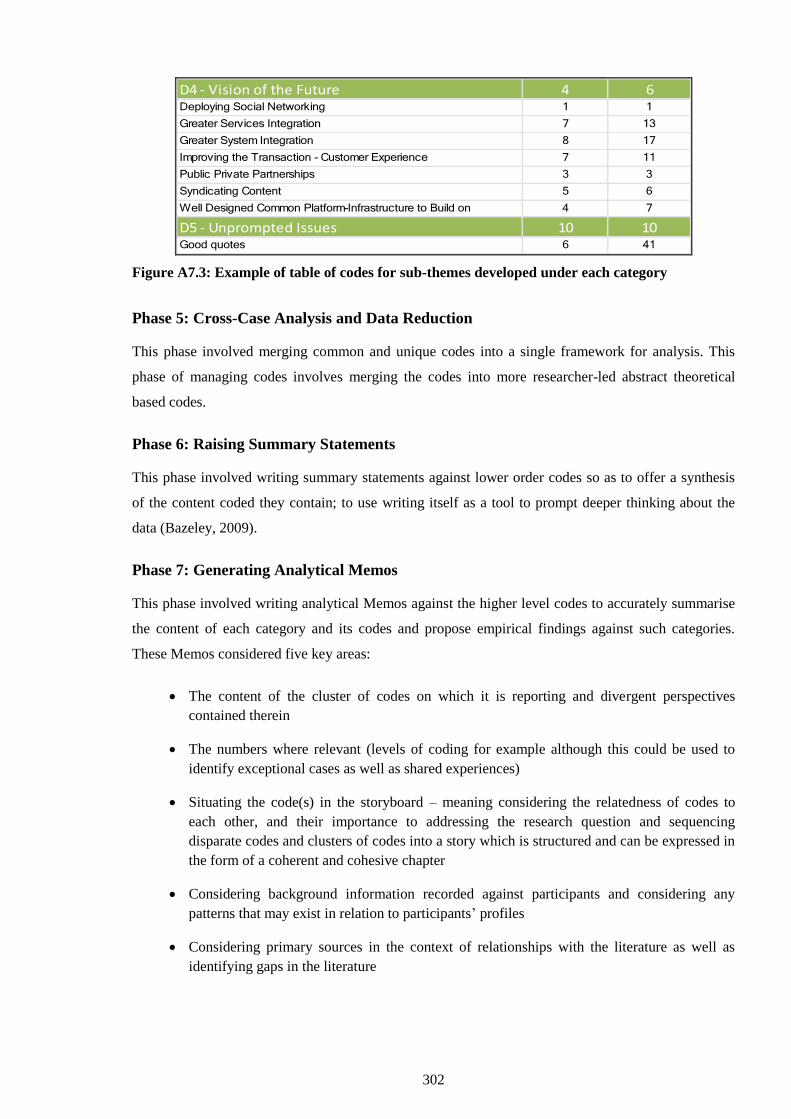
302
D4 - Vision of the Future 4 6Deploying Social Networking 1 1
Greater Services Integration 7 13
Greater System Integration 8 17
Improving the Transaction - Customer Experience 7 11
Public Private Partnerships 3 3
Syndicating Content 5 6
Well Designed Common Platform-Infrastructure to Build on 4 7
D5 - Unprompted Issues 10 10Good quotes 6 41
Figure A7.3: Example of table of codes for sub-themes developed under each category
Phase 5: Cross-Case Analysis and Data Reduction
This phase involved merging common and unique codes into a single framework for analysis. This
phase of managing codes involves merging the codes into more researcher-led abstract theoretical
based codes.
Phase 6: Raising Summary Statements
This phase involved writing summary statements against lower order codes so as to offer a synthesis
of the content coded they contain; to use writing itself as a tool to prompt deeper thinking about the
data (Bazeley, 2009).
Phase 7: Generating Analytical Memos
This phase involved writing analytical Memos against the higher level codes to accurately summarise
the content of each category and its codes and propose empirical findings against such categories.
These Memos considered five key areas:
The content of the cluster of codes on which it is reporting and divergent perspectives
contained therein
The numbers where relevant (levels of coding for example although this could be used to
identify exceptional cases as well as shared experiences)
Situating the code(s) in the storyboard – meaning considering the relatedness of codes to
each other, and their importance to addressing the research question and sequencing
disparate codes and clusters of codes into a story which is structured and can be expressed in
the form of a coherent and cohesive chapter
Considering background information recorded against participants and considering any
patterns that may exist in relation to participants’ profiles
Considering primary sources in the context of relationships with the literature as well as
identifying gaps in the literature
303
Phase 8: Validating Analytical Memos
This phase involved testing, validating and revising analytical Memos so as to self-audit proposed
findings by seeking evidence in the data beyond textual quotes to support the stated findings and
seeking to expand on deeper meanings embedded in the data. The process involved interrogation of
data and forced consideration of elements beyond the category itself; drawing on relationships across
and between categories and cross-tabulation with demographics, observations and literature. This
phase resulted in evidence-based findings, as each finding must be validated by being rooted in the
data itself and relies on the creation of reports from the data to substantiate findings.
Phase 9: Synthesising Proposition Statements and Generating an Outcome Statement
This phase involved synthesising the data into a coherent, well-supported outcome statement. As some
findings transcend or intersect with other major emergent themes, a synthesising process rather than a
simple merging of the proposition statements generated in Phase 6 was used to cohere meanings
embedded in the data into a final outcome statement.
Additional Tools
In support of the coding framework as outlined, other database tools were used to enhance
understanding of the data during the various stages of analysis. These included:
Conceptual Mapping
Database Queries
Database Reports
Data Subsets
Conceptual Mapping
A database tool known as the ‘modeller’ aided conceptual mapping. This tool enabled the use of mind-
mapping techniques (Buzan & Buzan, 2006) to explore meanings at different stages of analysis, and
was also used to demonstrate visually processes such as stages of analysis or conceptual frameworks
emerging from the study (see Figure A7.4 below):
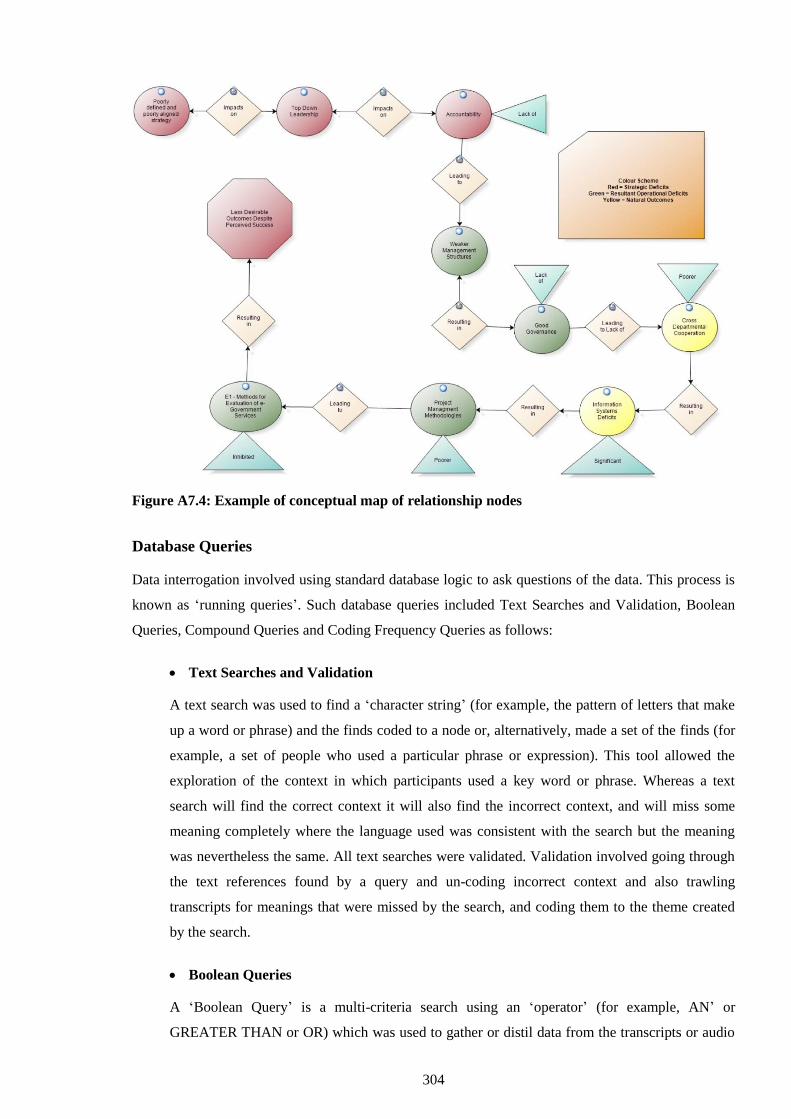
304
Figure A7.4: Example of conceptual map of relationship nodes
Database Queries
Data interrogation involved using standard database logic to ask questions of the data. This process is
known as ‘running queries’. Such database queries included Text Searches and Validation, Boolean
Queries, Compound Queries and Coding Frequency Queries as follows:
Text Searches and Validation
A text search was used to find a ‘character string’ (for example, the pattern of letters that make
up a word or phrase) and the finds coded to a node or, alternatively, made a set of the finds (for
example, a set of people who used a particular phrase or expression). This tool allowed the
exploration of the context in which participants used a key word or phrase. Whereas a text
search will find the correct context it will also find the incorrect context, and will miss some
meaning completely where the language used was consistent with the search but the meaning
was nevertheless the same. All text searches were validated. Validation involved going through
the text references found by a query and un-coding incorrect context and also trawling
transcripts for meanings that were missed by the search, and coding them to the theme created
by the search.
Boolean Queries
A ‘Boolean Query’ is a multi-criteria search using an ‘operator’ (for example, AN’ or
GREATER THAN or OR) which was used to gather or distil data from the transcripts or audio
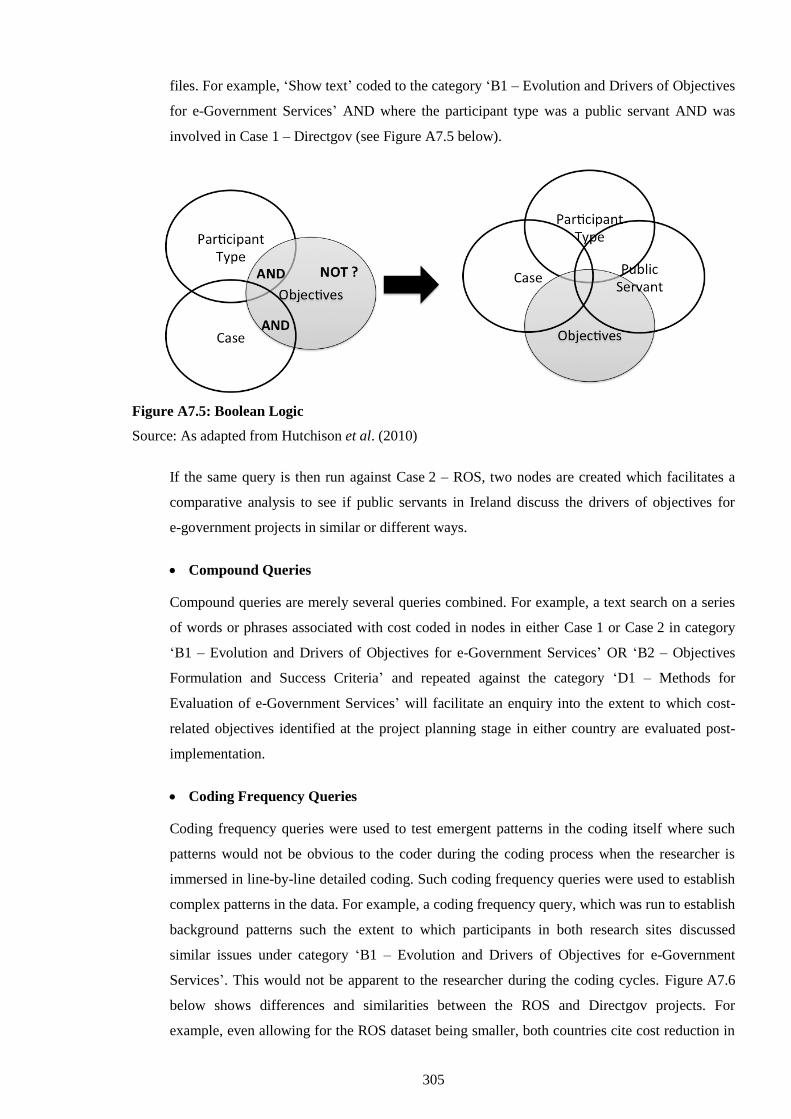
305
files. For example, ‘Show text’ coded to the category ‘B1 – Evolution and Drivers of Objectives
for e-Government Services’ AND where the participant type was a public servant AND was
involved in Case 1 – Directgov (see Figure A7.5 below).
Figure A7.5: Boolean Logic
Source: As adapted from Hutchison et al. (2010)
If the same query is then run against Case 2 – ROS, two nodes are created which facilitates a
comparative analysis to see if public servants in Ireland discuss the drivers of objectives for
e-government projects in similar or different ways.
Compound Queries
Compound queries are merely several queries combined. For example, a text search on a series
of words or phrases associated with cost coded in nodes in either Case 1 or Case 2 in category
‘B1 – Evolution and Drivers of Objectives for e-Government Services’ OR ‘B2 – Objectives
Formulation and Success Criteria’ and repeated against the category ‘D1 – Methods for
Evaluation of e-Government Services’ will facilitate an enquiry into the extent to which cost-
related objectives identified at the project planning stage in either country are evaluated post-
implementation.
Coding Frequency Queries
Coding frequency queries were used to test emergent patterns in the coding itself where such
patterns would not be obvious to the coder during the coding process when the researcher is
immersed in line-by-line detailed coding. Such coding frequency queries were used to establish
complex patterns in the data. For example, a coding frequency query, which was run to establish
background patterns such the extent to which participants in both research sites discussed
similar issues under category ‘B1 – Evolution and Drivers of Objectives for e-Government
Services’. This would not be apparent to the researcher during the coding cycles. Figure A7.6
below shows differences and similarities between the ROS and Directgov projects. For
example, even allowing for the ROS dataset being smaller, both countries cite cost reduction in
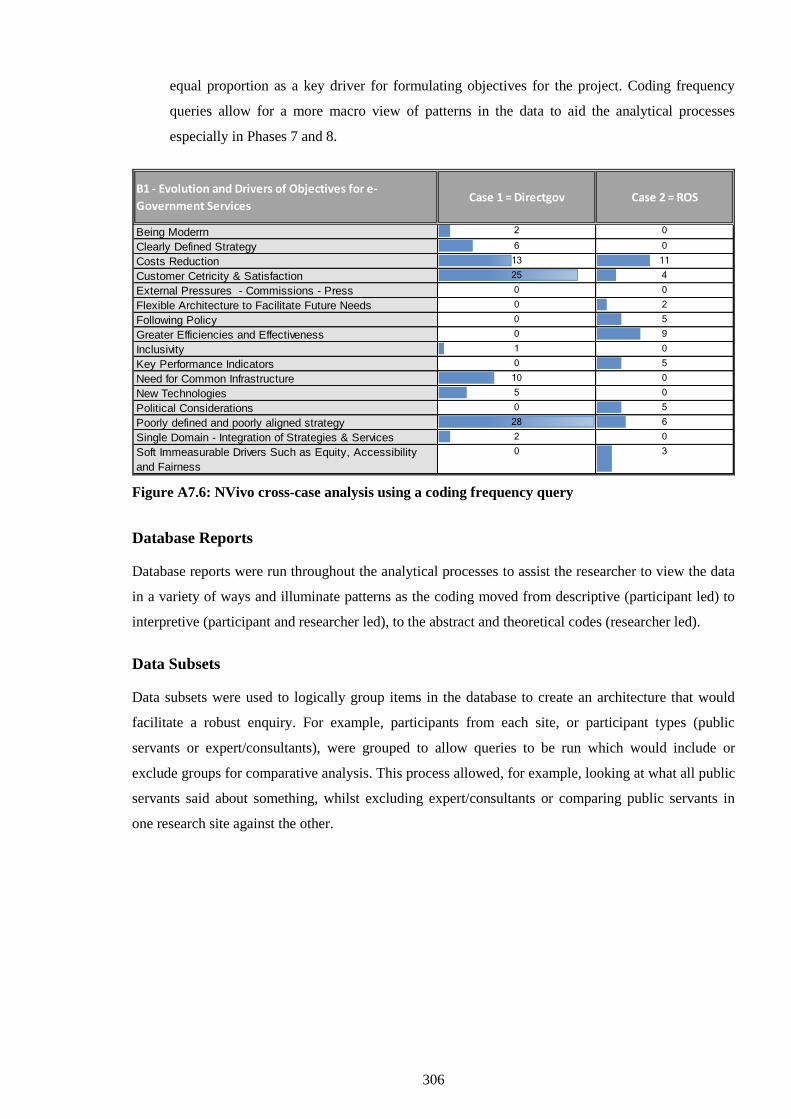
306
equal proportion as a key driver for formulating objectives for the project. Coding frequency
queries allow for a more macro view of patterns in the data to aid the analytical processes
especially in Phases 7 and 8.
B1 - Evolution and Drivers of Objectives for e-
Government ServicesCase 1 = Directgov Case 2 = ROS
Being Moderrn 2 0
Clearly Defined Strategy 6 0
Costs Reduction 13 11
Customer Cetricity & Satisfaction 25 4
External Pressures - Commissions - Press 0 0
Flexible Architecture to Facilitate Future Needs 0 2
Following Policy 0 5
Greater Efficiencies and Effectiveness 0 9
Inclusivity 1 0
Key Performance Indicators 0 5
Need for Common Infrastructure 10 0
New Technologies 5 0
Political Considerations 0 5
Poorly defined and poorly aligned strategy 28 6
Single Domain - Integration of Strategies & Services 2 0
Soft Immeasurable Drivers Such as Equity, Accessibility
and Fairness
0 3
Figure A7.6: NVivo cross-case analysis using a coding frequency query
Database Reports
Database reports were run throughout the analytical processes to assist the researcher to view the data
in a variety of ways and illuminate patterns as the coding moved from descriptive (participant led) to
interpretive (participant and researcher led), to the abstract and theoretical codes (researcher led).
Data Subsets
Data subsets were used to logically group items in the database to create an architecture that would
facilitate a robust enquiry. For example, participants from each site, or participant types (public
servants or expert/consultants), were grouped to allow queries to be run which would include or
exclude groups for comparative analysis. This process allowed, for example, looking at what all public
servants said about something, whilst excluding expert/consultants or comparing public servants in
one research site against the other.
307
APPENDIX 8: CROSS-CASE NVIVO ANALYSIS FINDINGS
Project Similarities
Both projects had the following elements in common:
They were both e-government projects
They were both generally deemed to be a success
They both involved new technologies
They both impacted on the business processes that the project portal supported
Project Differences
It is important to note at the outset that when comparing the cases, the projects differed in two
fundamental areas: the nature and the scale of the projects.
Nature of Project
Directgov demanded cross-departmental cooperation in all respects from aligning strategies through to
design and work practices, and to implementation and evaluation. By contrast, ROS involved just one
government department, Finance, which is the most powerful department in the Republic of Ireland.
All stakeholders saw ROS as desirable; from politicians such as ministers in the Cabinet, to the
Department of Finance and on down to the Revenue Commissioners, and out into the public arena,
which initially just meant the business community. Everybody commented on ROS as essentially a
good thing and there was no resistance to it. This was not the case with Directgov as the findings from
the in-case analysis suggest.
Scale of the Project
The Directgov website attracted over thirty million visitors a month in its peak, while the entire
population of Ireland is five million. Clearly, there is an immense difference in scale between these
two projects, both from a business and technical perspective. Furthermore, Directgov was intended to
serve as the UK government’s portal, whilst ROS intended to facilitate the provision of online tax
services only.
Method of Comparison
A common framework was used to code and analyse the data with some sub-codes being unique to
one or other project, and some being common to both. This method examined each of the following
key areas and compared and contrasted the coded content:
A. Areas of Responsibility – Public Servants and Expert Consultants
B. System Design – The Processes for Creating Objectives for e-Government Systems
308
C. System Implementation: Both Perspectives
D. Evaluation and Future Development
Theme A: Areas of Responsibility – Public Servants and Expert
Consultants
Codes were developed which contained contributions based on participants’ descriptions of
themselves including their general background, levels of experience and knowledge of e-government
projects and areas of responsibilities. Some codes, such as Technical Competencies for example, were
included and assigned to participants in one or other project. However, as technical competencies did
not emerge as an issue in either in-case analysis, it is safe to assume that technical competencies were
present in both cases.
Key Differences
Case 1 participants cited having expertise in developing and implementing strategies, while the Case 2
participants did not. This may be explained by the fact that Case 1 had a well-defined strategy at the
outset, while in Case 2 they were left to develop their own through the absence of good strategic
planning at government level.
Case 2 had a clear marketing strategy from the outset, while the Case 1 project did not. No participants
from Case 1 defined themselves under customer service, whilst at least one of the Case 2 participants
did. This suggests more awareness of customer-centricity amongst the Case 2 team at the outset of the
project. Project marketing competencies were considered and included from the inception of Case 2,
while the main focus in Case 1 was on cost reduction.
Theme B: System Design – The Processes for Creating Objectives for
e-Government Systems
Theme B had three categories under it and these were:
B1 – Evolution and Drivers of Objectives for e-Government Services
B2 – Objectives Formulation and Success Criteria
B3 – Main Identified Objectives of e-Government Services
B1 – Evolution and Drivers of Objectives for e-Government Services
Key Differences
Having a well-defined strategy supported by a clear marketing project plan was in evidence in the
Case 1 project by comparison to Case 2. Case 2 did not need as much a common infrastructure while
Case 1, clearly needed such a platform. Project drivers of objectives such as greater efficiency and
309
effectiveness, following policy and customer service were more evident in Case 2. Lack of customer-
centricity and satisfaction and a focus on cost reduction were also uniquely prevalent in the Case 1
project.
B2 – Objectives Formulation and Success Criteria
Key Differences
Value for money (as defined in Case 1) was a key driver in Case 1 only whilst equally measurable
KPIs such as return on investment (ROI), releasing resourses (people in the case of ROS), were much
more prevalent in Case 1. Having top-down leadership in place was a key difference between the
cases, while the debate about e-government and the wider change and transformation and reform was
strongly debated in Case 2, although in the context of their own department only. Building traffic and
capacity was more the focus in Case 2, while citizen-centricity was discussed as a driver of objectives
to a far greater extent in Case 1. The biggest single difference between the cases when it came to
formulating objectives and criteria for success was the misaligned strategies in Case 1 between the
government and its own departments.
B3 – Main Identified Objectives of e-Government Services
Key Differences
It was in the final stated objectives that most differences between the two cases became apparent.
Value for money as defined in the Case 2 analysis was a central feature of Case 2, and was
conspicuous by its absence in Case 1. Security was a clear objective in both cases but discussed more
in Case 1. ROI was clearly defined with measurable criteria in place in Case 2, but far less defined in
Case 1. Reforming public services was an unrealisable objective in Case 1 but not on the agenda for
Case 2, who were only interested in their own department. Both cases sought to increase efficiencies,
but driving down cost became a much bigger focus in Case 1.
Theme C: System Implementation
C1 – Requisite Implementation Processes for e-Government Services
Key Differences
Having the right team in place with the right top-down management structures behind it with best
practice project methodologies in place, coupled with the proper finance and change management
processes which were deliverable on the business side, were all key differences and indeed deficits in
Case 1. Cross-departmental cooperation was not an issue for Case 2, but was a serious impediment to
implementation on the Directgov project.
310
C2 – Technological Challenges, Barriers and Facilitators
Participants did not cite technological barriers in either case as those competencies were in place from
the outset. They did cite some barriers and challenges of a more structural nature.
Key Differences
The lack of top-down leadership structures in the form of management controls being put in place at
government departmental level in Case 1 was a key difference between the projects. Poor project
management methodologies prevented ongoing evaluation, and the lack of cross-departmental
cooperation meant that requisite change management processes were not in place. These issues did not
affect Case 2. By the time implementation was underway, however, the funding issue had been
resolved in Case 1.
Theme D: Evaluation and Future Development
Theme D had four categories under it and these were:
D1 – Methods for Evaluation of e-Government Services
D2 – Attitudinal Changes
D3- Ameliorating the Digital Divide
D4 – Vision of the Future
D1 – Methods for Evaluation of e-Government Services
This category contained data relevant to methods of evaluating the success of the both projects.
Key Differences
Project management evaluation processes such as reporting through a Benefits Realisation Report
were markedly different between the two cases. The measurable indicators required in Case 2 were
considerably clearer in definition and nature. There was doubt cast in Case 1 on business cases, and
confirmation bias was cited as present in Case 1 but not in Case 2. Customer-centricity was
significantly different between the two projects with Case 2 coming out far better. Customer testing
was present in both cases but with much better outcomes in Case 2, as defined by customer uptake.
The information systems deficit in Case 1 was detrimental and did not exist in Case 2. KPIs were
much better defined in Case 2, and return on investment (ROI) was clearly measured in Case 2, but not
in Case 1. The ‘knowing-doing gap’ as defined during the in-case analysis of Case 1, seriously eroded
implementation and evaluation of the Case 1 project.
311
D2 – Attitudinal Changes
This category contained data relevant to the extent to which study participants believed that attitudes
across government departments had changed over the life of the project.
Key Differences
Case 2 reported no real attitudinal change probably because it met very little resistance to begin with.
Case 1 did report change in that there was a growing acceptance of their need to exist coupled with
slow behavioural changes and a reluctance to move away from traditional ways of delivering public
services.
It is noteworthy that a project similar to Directgov to bring integrated services was launched and failed
in Ireland. There is evidence in the data, which was not used in the in-case analysis as it was out of
scope, which suggests that cross-departmental cooperation was no more achievable in Ireland than it
was in the Directgov model. Attitudes amongst ROS participants have not changed in this regard,
despite the success of ROS:
As government departments became more e-aware I suppose, there was a proposal to
develop a single portal for all government agencies and government departments that was
called REACH and I saw it in. So, when we came to develop the services for PAYE and
this would be in 2004/2005, we were encouraged to come under the portal umbrella they
were building and use it. We decided for the PAYE, we didn’t need the PKI security,
level of security, a lower level of security would suffice, and REACH were developing a
single authentication service to be used, the single one… in internal Revenue, it was
envisaged as being part of a wider government portal but we, it came back fully to
Revenue.
So, we went a long way down the road with them. They did deliver it; it was not, it
was, we were never fully comfortable with it, and eventually it was, because of other
issues with REACH, we went ahead and came back and developed our own
authentication service and REACH. REACH has subsequently fallen by the wayside; it’s
no longer there.
Participant 10
And you know, they wanted information to be provided on the interactive services,
integrated services; and they had, there was, they were going to have you know a public
service broker that was going to be reached, and they had this idea that it would be you
know, a portal into all e-government services. And that had some limited success and so
on, but the portal never really evolved…
Participant 9
D3 – Ameliorating the Digital Divide
This category contained data relevant to participants’ beliefs as to how to address the problem of the
‘digital divide’ in advancing e-government services.
312
Key Differences
This category does not lend itself well to comparison because the digital divide was a much greater
issue for Case 1 than Case 2. However, there were some common issues for both projects, such as age-
related digital exclusion. Case 2 had made specific appointments to address the issue, while Case 1
had done more to target socially and economically disadvantaged customers through video as a tool
for imparting information, and using different channels for interacting with customers, such as Post
Offices. One key difference between the cases was that Case 1 aspired to have a common back end
system while Case 2 already had this in place.
D4 – Vision of the Future
This category contained data relevant to study participants’ visions for the future of e-government
projects such as Directgov and ROS
Key Differences
Both cases had similar aspirations for the future. Systems and service integration was of more
importance to Case 1 participants, while both cases aspired to more syndicated content and improving
the customer transaction.
Cross-Case Analysis Summary
Project Similarities
Both projects had the following elements in common:
They were both e-government projects
They were both generally deemed to be a success
They both involved new technologies
They both impacted on the business processes that the project portal supported
Project Differences
It is important to note at the outset that when comparing the cases, the projects differed in two
fundamental areas: the nature and the scale of the projects.
The key differences between both cases under scrutiny in this study cannot be overstated.
Having a well-defined strategy supported by a clear marketing project plan was in evidence in the
Case 1 project in comparison with Case 2. Case 2 did not need as much common infrastructure while
Case 1 clearly needed such a platform. Project drivers of objectives such as greater efficiency and
effectiveness, following policy and customer service were more evident in Case 2. Lack of customer-
313
centricity and satisfaction and a focus on cost reduction were also uniquely prevalent in the Case 1
project.
Value for money (as defined in Case 1) was a key driver in Case 1 only whilst equally measurable
KPIs such as return on investment (ROI), releasing resources (people in the case of ROS) were much
more prevalent in Case 1. Having top-down leadership in place was a key difference between the
cases, while the debate about e-government and the wider change and transformation and reform was
strongly debated in Case 2, although in the context of their own department only. Building traffic and
capacity was more the focus in Case 2, while citizen-centricity was discussed as a driver of objectives
to a far greater extent in Case 1. The biggest single difference between the cases when it came to
formulating objectives and criteria for success was the misaligned strategies in Case 1 between the
government and its own departments.
It was in the final stated objectives that most differences between the two cases became apparent.
Value for money as defined in the Case 2 analysis was a central feature of Case 2, and was
conspicuous by its absence in Case 1. Security was a clear objective in both cases but discussed more
in Case 1. ROI was clearly defined with measurable criteria in place in Case 2, but far less defined in
Case 1. Reforming public services was an unrealisable objective in Case 1 but not on the agenda for
Case 2, who were only interested in their own department. Both cases sought to increase efficiencies,
but driving down cost became a much bigger focus in Case 1.
Having the right team in place with the right top-down management structures behind it with best
practice project methodologies in place, coupled with the proper finance and change management
processes which were deliverable on the business side, were all key differences and indeed deficits in
Case 1. Cross-departmental cooperation was not an issue for Case 2, but was a serious impediment to
implementation of the Directgov project.
The lack of top-down leadership structures in the form of management controls being put in place at
government departmental level in Case 1 was a key difference between the projects. Poor project
management methodologies prevented ongoing evaluation, and the lack of cross-departmental
cooperation meant that requisite change management processes were not in place. These issues did not
affect Case 2. By the time implementation was underway, however, the funding issue had been
resolved in Case 1.
Project management evaluation processes such as reporting through a Benefits Realisation Report
were markedly different between the two cases. The measurable indicators required in Case 2 were
considerably clearer in definition and nature. There was doubt cast in Case 1 on business cases, and
confirmation bias was cited as present in Case 1 but not in Case 2. Customer-centricity was
significantly different between the two projects with Case 2 coming out far better. Customer testing
was present in both cases but with much better outcomes in Case 2, as defined by customer uptake.
314
The information systems deficit in Case 1 was detrimental and did not exist in Case 2. KPIs were
much better defined in Case 2, and return on investment (ROI) was clearly measured in Case 2 but not
in Case 1. The ‘knowing-doing gap’, as defined during the in-case analysis of Case 1, seriously eroded
implementation and evaluation of the Case 1 project.
Case 2 reported no real attitudinal change probably because it met very little resistance to begin with.
Case 1 did report change in that there was a growing acceptance of their need to exist coupled with
slow behavioural changes and a reluctance to move away from traditional ways of delivering public
services.
It is noteworthy that a project similar to Directgov to bring integrated services was launched and failed
in Ireland. There is evidence in the data, which was not used in the in-case analysis as it was out of
scope, which suggests that cross-departmental cooperation was no more achievable in Ireland than it
was in the Directgov model. Attitudes amongst ROS participants have not changed in this regard,
despite the success of ROS.
The digital divide was a much greater issue for Case 1 than Case 2. However, there were some
common issues for both projects, such as age-related digital exclusion. Case 2 had made specific
appointments to address the issue, while Case 1 had done more to target socially and economically
disadvantaged customers through video as a tool for imparting information, and using different
channels for interacting with customers, such as Post Offices. One key difference between the cases
was that Case 1 aspired to have a common back end system while Case 2 already had this in place.
Both cases had similar aspirations for the future. Systems and service integration was of more
importance to Case 1 participants, while both cases aspired to more syndicated content and improving
the customer transaction.
In relation to best practice in pure project management, Case 2 definitely comes out better through
better planning, a clear strategy leading to clear and realisable objectives, ensuring that the project was
well implemented and evaluated. By contrast, the strategic deficits identified in Case 1 manifest
themselves so clearly in implementation impediment problems and practically no evaluation.
However, there is no evidence in the data of Case 2 performing any better when it comes to cross-
departmental cooperation. On the contrary, there is evidence of a similar project to Case 1 failing in
Ireland, and Case 2 participants showing no enthusiasm for it. Apart from releasing resources (people
in the case of Case 2) for other tasks, there is no evidence of real reform in the public sector generally
in Ireland at any stage during the years that Case 2 was implemented. No conclusions may be drawn
from the failings of Case 1 in relation to cross-departmental cooperation relative to Case 2, as these
elements were not common to both cases. Case 1 was a perceived success, but no fair or reasonable
analysis could concur with that general perception. Case 2 was perceived as a success, and is so only

315
by the narrow definitions of good project management at single departmental level. Case 2 could not
be held up as a perfect example of an e-government project template.