Embed Size (px)
Citation preview
business.unsw.edu.au
Last Updated 21 March 2016 CRICOS Code 00098G
Business School
12th International Conference on Tax Administration
31 March & 1 April 2016, Sydney, AUSTRALIA
e-filing and compliance risk: Evidence from Australian personal income tax
deductions
Neil Warren School of Taxation and Business Law
UNSW Business School UNSW Sydney 2052
ABSTRACT
Two major advances in personal income tax administration over recent decades are the pre-filling of tax returns and the electronic lodgement of those returns. However, pre-filling has been largely restricted to income and information reported in previous years, not current year costs incurred in generating taxable income (or deductions). This has not constrained national revenue bodies from putting in place incentives for greater take-up of e-filing as in the case of Australia where with electronically filed personal tax returns, the ATO has a general commitment to make any refunds in 12 days or less while with paper returns, it is 50 days. What has not been adequately investigated is whether incentivising e-filing by self-preparers, at a time when prefilling is focussed mostly on income with less on deductions, poses a potential compliance risk. This paper investigates this issue in the case of the Australian personal income taxpayers over the period 2003-04 to 2012–13 and whether there is a distinct change in the deductions claim behaviour of those self-preparers lodging electronically via e-tax compared to those lodging paper returns or via tax agents. The paper finds that over the 10 year period studied there were distinct changes in the work-related expense deduction claims behaviour of self-preparers relative to those using a tax agent, with e-tax self-preparers having a significantly increased incidence of claims, even though the average level of relative claim declined. In an environment with incentives for electronic lodgement and limited prefilling of deductions, it is concluded that this differential behaviour warrants further study from both a compliance risk perspective as well as the appropriateness of the current policy treatment of deductions.
Draft - Not for quotation without the author’s permission

e-filing and compliance risk: Evidence from Australian personal income tax deductions Warren
-2-
Table of Contents
Abstract ............................................................................................................................................................................................ 1 1 The issue ................................................................................................................................................................................... 3 2 Australia’s history with e-filed returns and pre-filling ................................................................................................................. 6 3 Has e-filing changed Australian personal income taxpayer deduction behaviour? ................................................................... 9
3.1 Evidence by method of lodgment ...................................................................................................................................... 10 3.2 Other explanatory variables .............................................................................................................................................. 16
4 Strategies for resolution of any electronic lodgement related compliance risk ........................................................................ 17 5 Bibliography ............................................................................................................................................................................. 20
List of Tables
Table 1 Personal income payers by Lodgement method: 1998-99 to 2013-14 ............................................................................ 7 Table 2 Personal income deduction as a % total income: Australia 1998-99 to 2013-14 ............................................................. 8 Table 3 Annual growth rates for personal taxable income and deduction: Australia 1998-99 to 2013-14 ..................................... 9 Table 4 Change in number of individuals and average value of deduction for individuals with >$20,000pa (2012-13 values): 2003-04 to 2012-13 (Code 0) ........................................................................................................................................................ 12 Table 5 Index of relative behaviour between 2003-04 and 2012-13 (Code 0) ............................................................................ 14 Table 6 Index of aggregate value of claims: 2003-04=100 (Code 11/16) ................................................................................... 16 Table 7 Personal income deduction trends in Australia: 2003-04 to 2012-13 ............................................................................ 17 Table 8 Deductions claimed below selected thresholds: Australia 2012-13 ............................................................................... 18
List of Figures
Figure 1 Trend in method of Lodgement: 1998-99 to 2013-14 ...................................................................................................... 6 Figure 2 Trend in Work Related Expenses:1997-98 to 2013-14.................................................................................................. 11 Figure 3 Work Related Expenses: 2003-04 to 2013-14 ............................................................................................................... 13
e-filing and compliance risk: Evidence from Australian personal income tax deductions Warren
-3-
1 THE ISSUE
Considerable attention has been given to the benefits of e-filing by personal income taxpayers and to pre-filling of returns by revenue bodies with information they already hold on those taxpayers or have collected from third parties. As the OECD (2015, p16 and Box 1) observed, by 2013 over 95% of OECD countries had electronic filing systems and over two-thirds of their revenue bodies achieved e-filing usage for over 75% of their personal income and corporate taxes and for VAT/GST.
For taxpayers, an advantage of e-filing is that it is free and typically, that the revenue body is committed to providing refunds much faster than with paper returns1. In the Australian case, the Australian Taxation Office (ATO) is committed to making refunds on e-filed tax returns within 12 business days but only 50 business days with paper returns.2 For revenue bodies, the benefits from pre-filling are the timeliness of lodgements, improved compliance and data integrity, and the releasing of revenue staff to better focus resources on those taxpayers where income prefilling is incomplete (or even not possible) or where taxpayers are attributed a high non-compliance risk-rating.
While pre-filling typically includes income-related information from employers, government bodies, financial institutions (interest income) and companies (dividend income), it rarely extends to all deductions. The reason for this is largely because third parties cannot readily attribute expenditure to individuals let alone whether this expenditure is tax deductible. In response, revenue bodies are attempting to facilitate individuals to pre-fill their deductions through enabling taxpayers to record in real time their deductions in advance of them being claimed. In the case of the ATO, this has seen the development of the myDeductions app as a complement to myTax, enabling income deductions to be recorded on mobile devices.3 In the Nordic countries, the solution has been to limit access to deductions and where they are available, to those where (actual or supporting) data can be supplied from third parties.4
This has led some5 who endorse a more widespread and rapid application of pre-filling to investigate the scope for limiting access to personal income tax deductions. However, any move to limit income-earning related deductions involves a separate debate to pre-filling which goes to the purpose of
1 For a discussion of personal income tax e-filing in Australia, Belgium, California, Québec, and Spain, see Vaillancourt(2011). 2 See https://www.ato.gov.au/Individuals/Lodging-your-tax-return/Lodge-a-paper-tax-return/ https://www.ato.gov.au/Individuals/Lodging-your-tax-return/Lodge-online/ https://www.ato.gov.au/Individuals/Lodging-your-tax-return/In-detail/Pre-fill-availability/ 3 See https://www.ato.gov.au/general/online-services/in-detail/transact-online/mydeductions/mydeductions/ .
In the ATO Annual Report 2014-15 (Volume 1, p12) it was stated that the ATO would use the information recorded in myDeductions for 2014-15 returns “to pre-fill their 2016 income tax return”. (see https://annualreport.ato.gov.au/sites/g/files/net376/f/AR_14-15_Vol1_n0995_js34758_w.pdf )
4 The range of non-income related deductions able to be pre-filled by revenue bodies from third parties includes: home mortgage interest, gifts, union fees, child care and unemployment insurance (see OECD 2006, 2008, 2010, 2012) for reference to the approach in Nordic countries). In Australia’s case, the private health insurance rebate which, while not technically a deduction is expenditure related, does attracts a rebate of tax and is effectively prefilled as is deductions data capable of being rolled-over from previous years. 5 Highfield(2006) found that prefilling in Nordic countries was substantially aided by limited access to a wide range of deductions while Evans (2004) and Kerr(2012) saw the availability of deductions like work-related expenses as a constraint on pre-filling designed to remove the need for taxpayers to lodge their own returns.
e-filing and compliance risk: Evidence from Australian personal income tax deductions Warren
-4-
deductions, how they should (or should not) be structured, and to whom they should be available.6 Assuming that economic efficiency issues are not overwhelmed by simplicity considerations,7 there will continue to be a case for earnings-related deductions and difficulties in prefilling such claims and concern about the integrity of data on claimed deductions (prefilled or not). Even if there was a widespread take-up of mobile devices to record deductions in real time as with the ATO myDeductions app, or more importantly, the provision by third parties of information on individual taxpayer’s deductible expenses, the revenue body will continue to have an issue with the data integrity as the split between what is ‘private, domestic or capital’ in nature and what is income-related expenses, will not always be clear.
Where this risk manifests itself most significantly is when taxpayers react positively but creatively
− to the promise of a rapid-processing of e-filed returns. Through pre-filled and e-filed returns, the ATO for example assures those taxpayers with simple returns that they can complete their return in “20 minutes”8 and that they can generally have any refund in “12 business days or less”. This expedited processing of returns raises two important issues: firstly, will taxpayers not report income not-prefilled on their tax return at the time of lodging and secondly, will they over-claim deductions because they know there is no third party information on it supplied to the revenue body.
In relation to the non-reporting of income not pre-filled, this is unlikely to be an issue. In the Nordic countries it is common for third-parties to be required to lodge taxpayer data within one month. In practice in many countries, it might take much longer and may not occur for some weeks (or even months) after the end of the financial year. However, while any prefilling in the interim will therefore be incomplete and early lodged returns will need post-assessment income matching when the full range of data is available, taxpayers would know that ultimately automated matching would reveal any mismatch at minimal administrative cost and so have every reason to include missing income data.
This is not the case with data on deductions as taxpayers would know that there is little third party information on them supplied to the revenue body and that small claims would not be cost effective for the body to pursue even if it identifies non-standard deduction claims behaviour. Moreover, if this non-compliance became systematic through a perception that detection is not occurring, then otherwise non-standard behaviour could become standard and over claiming, systematic, making automated detection of non-compliance difficult.
This issue is understood and the literature on how prefilling can reduce taxpayer compliance costs and non-compliance gives particular attention to minimising access to available deductions.9 Also, by removing deductions which cannot be prefilled, there is more scope to transition from pre-filling to automated lodgement with the taxpayer’s role being reduced to that of reviewing not completing returns. However while abolishing deductions might be attractive from a simplicity perspective in facilitating full pre-filling and automated lodgement, it is not necessarily acceptable from an 6 These issues are currently under review in Australia by the Australian Parliament House of Representatives Standing Committee on Economics Inquiry into Tax Deductibility (http://www.aph.gov.au/Parliamentary_Business/Committees/House/Economics/Tax_deductibility ) 7 While equity considerations are relevant to any consideration of deductions, the focus here would be on issues such as caps and offsets rather than elimination of access to such deductions. 8 See https://www.ato.gov.au/Individuals/Lodging-your-tax-return/In-detail/Transcripts/Video-transcript---The-benefits-of-lodging-with-myTax/ 9 See Evans and Tran-Nam (2010). OECD(2010, 2015), Vaillancourt(2011)
e-filing and compliance risk: Evidence from Australian personal income tax deductions Warren
-5-
economic efficiency, equity or political10 perspective. Some deductions are therefore inevitable even if this conflicts with achieving simplicity and facilitating prefilling. While deduction design can (as further discussed in Section 4) ameliorate such conflicts, just what those conflicts are and how they arise is a necessary precursor to any redesign to address design deficiencies. If for example, pre-filling income but not deductions on e-filed returns can be shown to be a compliance risk for a revenue body, then some support could be found for changes to the administration of deduction claims and to policy design so as to minimise non-compliance.
Box 1 e-Filing in OECD Countries
All major taxes Over two-thirds of revenue bodies in OECD countries achieved e-filing usage for over three-quarters (75%) of their
PIT, CIT, and VAT taxpayers in 2013.
Personal income tax The provision of e-filing services for the PIT is now just about universal across the countries surveyed, with all
countries where the national revenue body administers a PIT reporting the availability of this service for fiscal year 2013.
Almost 60% of revenue bodies reported that the majority of their personal taxpayers filing returns used e-filing (either by themselves or via tax professionals) for the 2013 year:
Twenty-nine of fifty reported usage rates in excess of 75%;
Four of fifty reported usage rates between 50-75%;
Four of fifty reported usage rates between 25-50%;
Thirteen of fifty reported usage rates less than 25%; and
For six countries relevant data were not available.
A number of countries have made substantial progress (i.e. +75% in absolute terms) over the last 10 years in increasing their e-filing usage-Argentina (+82%), Israel (+95%), Lithuania (+82%), Slovenia (+100%), South Africa (+95%).
Drawing on the information in Table 9.8, revenue bodies generally have not relied on the use of mandated e-filing requirements to achieve high rates of e-filing take up for PIT taxpayers.
There is potential for substantially greater use (i.e. +75% in absolute terms) of e-filing in 25% of countries surveyed, including in four OECD member countries-Czech Republic, Hungary, Luxembourg and Slovak Republic
Source: OECD (2015) p250
The focus of this paper is therefore on the important question of whether evidence can be found for e-filing changing taxpayer deduction claims behaviour and therefore poses a compliance risk in the form of disproportionately higher incidence and levels of deductions being claimed in their e-filed returns. Evidence will be sought from differential trends in selected personal income tax deductions in Australia since the introduction of e-filing for self-preparers in 1998-99, focusing on claims by those lodging with tax agents or who were self-preparers but either lodged electronically or with paper.
Section 2 begins with a brief overview of Australia’s history of e-filing and pre-filling. Section 3 utilises the annual Australian personal income taxpayer sample files for the period 2003-04 to 2012-13 to examine whether there is evidence of a disproportionate unexplained relative growth in the number and level of deductions by those lodging self-prepared e-filed and paper returns, and those whose returns are prepared by tax agents.
10 In the Australian context, the availability of numerous deductions has led to political sensitivity about any action designed to remove those deductions which result in a tax refund, as many individuals budget around receiving this refund.

e-filing and compliance risk: Evidence from Australian personal income tax deductions Warren
-6-
While preliminary analysis of the data shows that there is evidence in the Australian case of some unexplained differences in the trend behaviour of deduction claims by taxpayers with and without tax agents, there is also a marked difference in the behaviour of self-preparers depending on whether they are lodging by paper or electronically.
Section 4 examines the three important conclusions these findings raise for tax administrators and tax policy advisors. Firstly, the need for further detailed study into the underlying reasons for this disproportionate increase in deductions relative to the taxable income of self-preparers. This could include the use of longitudinal taxpayer (or panel) data to track changed behaviour. Secondly, as part of this investigation and as an interim integrity measure, self-preparers must be subject to greater audit effort, especially e-filers. Thirdly, a renewed focus must be given to the policy design of current deduction arrangements to ensure there are no unexpected behavioural consequences or compliance and therefore revenue risks to government from e-filed returns. The paper concludes with an examination of the alternative policy design options available to government in an environment where data matching or pre-filling deductions in e-filed returns is not an option and audit effort is not cost effective.
2 AUSTRALIA’S HISTORY WITH E-FILED RETURNS AND PRE-FILLING
The Federal Income Tax Assessment Act was introduced in 1915 but it was not until 1944 that the pay-as-you-earn (PAYE) tax system was adopted for employers and in1986, that self-assessment was introduced for tax payers. While computers were introduced into the ATO in 1965, the Electronic Lodgment System (ELS) for tax agents was not trialled until 1987 (Edmonds 2010) and was only operationalised from June 1990 for 1989-90 tax returns by tax agents. It was also not until 1999 that there was a pilot across 27,000 tax self-preparers of an electronic version of the ATO Taxpack called e-tax. While e-tax was introduced nationally in 1999-2000, it was not available for Mac computer users until 2012-13. As shown in Table 1 (and Figure 1), the take-up of e-tax was initially low but by 2012-13 accounted for 84% of all lodgements from self-preparers.
Figure 1 Trend in method of Lodgement: 1998-99 to 2013-14
Source: Table 1 at http://data.gov.au/dataset/25e81c18-2083-4abe-81b6-0f530053c63f/resource/3cd6dee1-785f-4876-a282-ebcf00f9949a/download/Taxstats2014Individual01SelectedItemsByYear.xlsx
e-filing and compliance risk: Evidence from Australian personal income tax deductions Warren
-7-
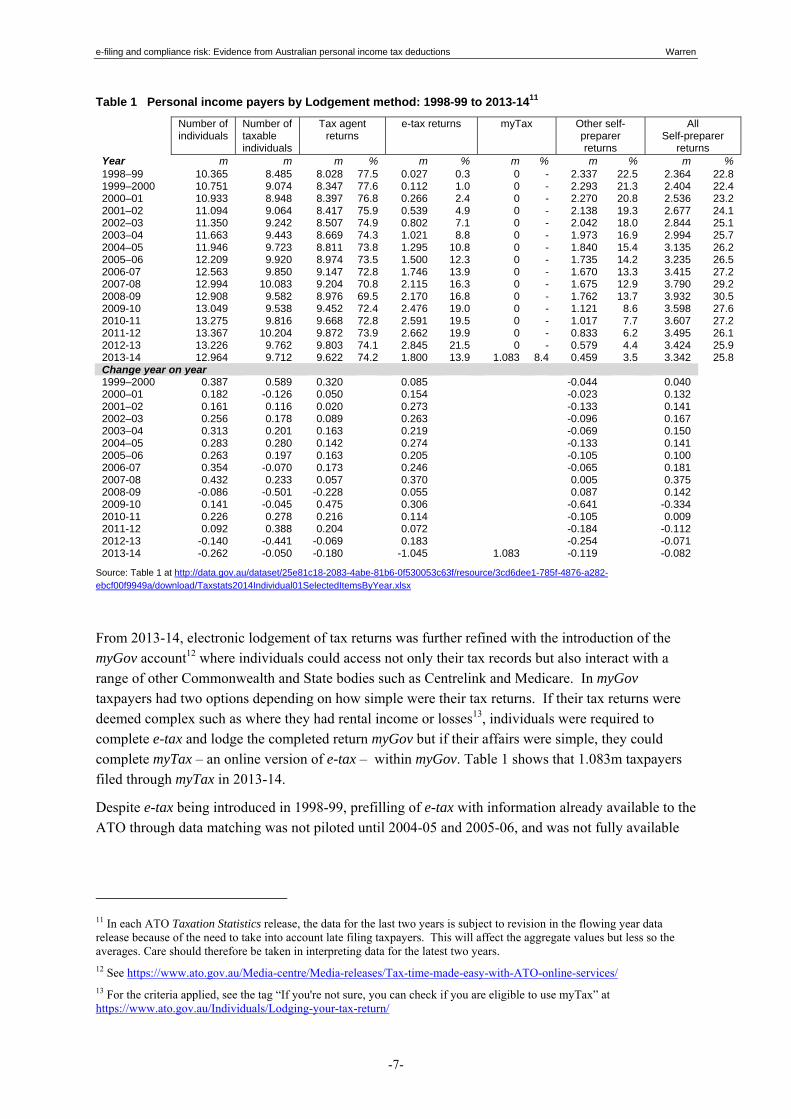
Table 1 Personal income payers by Lodgement method: 1998-99 to 2013-1411
Number of individuals
Number of taxable individuals
Tax agent returns
e-tax returns myTax Other self-preparer returns
All Self-preparer
returns Year m m m % m % m % m % m % 1998–99 10.365 8.485 8.028 77.5 0.027 0.3 0 - 2.337 22.5 2.364 22.8 1999–2000 10.751 9.074 8.347 77.6 0.112 1.0 0 - 2.293 21.3 2.404 22.4 2000–01 10.933 8.948 8.397 76.8 0.266 2.4 0 - 2.270 20.8 2.536 23.2 2001–02 11.094 9.064 8.417 75.9 0.539 4.9 0 - 2.138 19.3 2.677 24.1 2002–03 11.350 9.242 8.507 74.9 0.802 7.1 0 - 2.042 18.0 2.844 25.1 2003–04 11.663 9.443 8.669 74.3 1.021 8.8 0 - 1.973 16.9 2.994 25.7 2004–05 11.946 9.723 8.811 73.8 1.295 10.8 0 - 1.840 15.4 3.135 26.2 2005–06 12.209 9.920 8.974 73.5 1.500 12.3 0 - 1.735 14.2 3.235 26.5 2006-07 12.563 9.850 9.147 72.8 1.746 13.9 0 - 1.670 13.3 3.415 27.2 2007-08 12.994 10.083 9.204 70.8 2.115 16.3 0 - 1.675 12.9 3.790 29.2 2008-09 12.908 9.582 8.976 69.5 2.170 16.8 0 - 1.762 13.7 3.932 30.5 2009-10 13.049 9.538 9.452 72.4 2.476 19.0 0 - 1.121 8.6 3.598 27.6 2010-11 13.275 9.816 9.668 72.8 2.591 19.5 0 - 1.017 7.7 3.607 27.2 2011-12 13.367 10.204 9.872 73.9 2.662 19.9 0 - 0.833 6.2 3.495 26.1 2012-13 13.226 9.762 9.803 74.1 2.845 21.5 0 - 0.579 4.4 3.424 25.9 2013-14 12.964 9.712 9.622 74.2 1.800 13.9 1.083 8.4 0.459 3.5 3.342 25.8 Change year on year 1999–2000 0.387 0.589 0.320 0.085 -0.044 0.040 2000–01 0.182 -0.126 0.050 0.154 -0.023 0.132 2001–02 0.161 0.116 0.020 0.273 -0.133 0.141 2002–03 0.256 0.178 0.089 0.263 -0.096 0.167 2003–04 0.313 0.201 0.163 0.219 -0.069 0.150 2004–05 0.283 0.280 0.142 0.274 -0.133 0.141 2005–06 0.263 0.197 0.163 0.205 -0.105 0.100 2006-07 0.354 -0.070 0.173 0.246 -0.065 0.181 2007-08 0.432 0.233 0.057 0.370 0.005 0.375 2008-09 -0.086 -0.501 -0.228 0.055 0.087 0.142 2009-10 0.141 -0.045 0.475 0.306 -0.641 -0.334 2010-11 0.226 0.278 0.216 0.114 -0.105 0.009 2011-12 0.092 0.388 0.204 0.072 -0.184 -0.112 2012-13 -0.140 -0.441 -0.069 0.183 -0.254 -0.071 2013-14 -0.262 -0.050 -0.180 -1.045 1.083 -0.119 -0.082
Source: Table 1 at http://data.gov.au/dataset/25e81c18-2083-4abe-81b6-0f530053c63f/resource/3cd6dee1-785f-4876-a282-ebcf00f9949a/download/Taxstats2014Individual01SelectedItemsByYear.xlsx
From 2013-14, electronic lodgement of tax returns was further refined with the introduction of the myGov account12 where individuals could access not only their tax records but also interact with a range of other Commonwealth and State bodies such as Centrelink and Medicare. In myGov taxpayers had two options depending on how simple were their tax returns. If their tax returns were deemed complex such as where they had rental income or losses13, individuals were required to complete e-tax and lodge the completed return myGov but if their affairs were simple, they could complete myTax – an online version of e-tax – within myGov. Table 1 shows that 1.083m taxpayers filed through myTax in 2013-14.
Despite e-tax being introduced in 1998-99, prefilling of e-tax with information already available to the ATO through data matching was not piloted until 2004-05 and 2005-06, and was not fully available
11 In each ATO Taxation Statistics release, the data for the last two years is subject to revision in the flowing year data release because of the need to take into account late filing taxpayers. This will affect the aggregate values but less so the averages. Care should therefore be taken in interpreting data for the latest two years. 12 See https://www.ato.gov.au/Media-centre/Media-releases/Tax-time-made-easy-with-ATO-online-services/ 13 For the criteria applied, see the tag “If you're not sure, you can check if you are eligible to use myTax” at https://www.ato.gov.au/Individuals/Lodging-your-tax-return/

e-filing and compliance risk: Evidence from Australian personal income tax deductions Warren
-8-
until 2006-07.14 Today it is tax agents who are the biggest users of this information with tax agents being some 77% of those lodging returns electronically (Table 1). For the ATO, the primary motivation for data matching has been to uncover and reduce fraud and when combined with e-filing, to encourage better compliance and reduced compliance costs for taxpayers.15
While as previously noted, the merits of pre-filling are broadly acknowledged and well accepted, such pre-filling rarely extends to income earning related deductions because of a paucity of data on what is ‘private, domestic or capital’ in nature as distinct from a deductible expense incurred in generating taxable income. Exceptions are where those deductions can be pre-determined such as some minimum deduction entitlement or a fixed tax offset (Warren 2014) or those deductions which an employer (or the revenue body) have been informed of as a deductible expense when determining PAYE tax deductions such as where owner-occupied home mortgage interest is deductible (as in the United States). While data-matching might assist the revenue body to verify deductions data entered into tax returns, it cannot easily verify whether this entire claim is a legitimate expense incurred in earning taxable income which must restrict the scope for prefilling tax returns with such data.
Table 2 Personal income deduction as a % total income: Australia 1998-99 to 2013-14
Note: Colour code is blue below the midpoint (or benchmark) across the years for a given variable and red is above with the strength of the colour change reflecting greater distance from the benchmark value
Source: Table 1 at http://data.gov.au/dataset/25e81c18-2083-4abe-81b6-0f530053c63f/resource/3cd6dee1-785f-4876-a282-ebcf00f9949a/download/Taxstats2014Individual01SelectedItemsByYear.xlsx
As shown in Table 2, in Australia deductible work related expenses which are not pre-filled were 2.7% of total taxpayer assessable income in 2013-14 while rental property deductions were some 5.5%. Being deductible at taxpayer’s marginal tax rate which can be considerably greater than their average tax rate, the risk to revenue from deductions related non-compliance is real and significant. Table 3 highlights that since the introduction of e-tax in 1998-99, even though the average deduction claimed varies widely relative to income, the increase in the proportion of taxpayers making a claim is
14 See https://www.ato.gov.au/Tax-professionals/Tax-Agent-Portal/Using-the-Tax-Agent-Portal/Portal-reports/Pre-filling-service/Pre-filling-reports-2007-2015/ and the ANAO review of data matching at http://www.anao.gov.au/uploads/documents/2007-08_Audit_Report_30.pdf
15 See https://www.ato.gov.au/General/Building-confidence/In-detail/Data-matching/ and
https://www.ato.gov.au/general/building-confidence/in-detail/data-matching/current-data-matching-programs/
1998–99 1999–2000 2000–01 2001–02 2002–03 2003–04 2004–05 2005–06 2006-07 2007-08 2008-09 2009-10 2010-11 2011-12 2012-13 2013-14
Total Claims as % Total Income
Total w ork related expenses 2.3% 2.4% 2.6% 2.8% 2.8% 2.8% 2.8% 2.8% 2.7% 2.8% 2.8% 2.8% 2.7% 2.7% 2.7% 2.7%
Cost of managing tax affairs 0.2% 0.2% 0.3% 0.3% 0.3% 0.3% 0.3% 0.3% 0.3% 0.3% 0.3% 0.3% 0.3% 0.3% 0.3% 0.3%
Gifts or donations 0.2% 0.2% 0.2% 0.3% 0.3% 0.3% 0.3% 0.3% 0.3% 0.4% 0.3% 0.3% 0.3% 0.3% 0.3% 0.3%
Total Deductions 5.1% 4.1% 4.5% 4.8% 4.9% 5.0% 5.3% 5.8% 6.3% 5.8% 5.5% 4.9% 4.8% 4.6% 4.2% 4.3%
Rent interest deductions 1.6% 1.7% 2.0% 2.0% 2.2% 2.6% 2.9% 3.1% 3.1% 3.5% 3.4% 3.1% 3.5% 3.5% 3.1% 2.8%
Rent capital w orks deductions 0.1% 0.1% 0.2% 0.2% 0.2% 0.2% 0.2% 0.2% 0.2% 0.2% 0.3% 0.3% 0.3% 0.3% 0.3% 0.4%
Rent other rental deductions 1.6% 1.7% 1.8% 1.9% 2.0% 2.0% 2.0% 2.0% 1.9% 1.9% 2.0% 2.1% 2.1% 2.2% 2.3% 2.4%
Rent Deductions 3.3% 3.5% 4.0% 4.1% 4.4% 4.8% 5.2% 5.3% 5.2% 5.7% 5.7% 5.5% 5.9% 6.0% 5.7% 5.5%
Claimants as a % of all individuals
Total w ork related expenses 63.0% 63.7% 64.2% 62.6% 62.3% 62.6% 63.1% 63.7% 64.0% 64.9% 64.7% 64.8% 65.4% 66.3% 65.9% 66.3%
Cost of managing tax affairs 46.4% 46.4% 45.9% 45.5% 45.0% 44.4% 44.4% 44.1% 43.5% 43.4% 45.9% 45.1% 46.3% 47.3% 47.9% 47.6%
Gifts or donations 32.7% 32.3% 32.6% 33.8% 34.0% 34.4% 37.4% 35.6% 35.4% 34.9% 37.0% 34.8% 37.1% 34.9% 35.1% 35.1%
Total Deductions 80.8% 80.0% 79.5% 78.5% 78.0% 78.3% 79.3% 79.6% 79.9% 79.7% 79.9% 79.6% 80.4% 81.1% 80.7% 80.5%
Rent interest deductions 8.8% 9.2% 9.4% 9.8% 10.1% 10.5% 10.6% 10.8% 10.9% 11.0% 11.1% 11.4% 11.6% 12.1% 12.5% 12.7%
Rent capital w orks deductions 2.4% 2.7% 2.9% 3.3% 3.6% 4.0% 4.3% 4.5% 4.8% 4.9% 5.2% 5.6% 5.8% 6.3% 6.7% 7.1%
Rent other rental deductions 12.3% 12.6% 12.6% 12.9% 13.1% 13.3% 13.3% 13.5% 13.6% 13.6% 13.7% 14.1% 14.3% 14.8% 15.3% 15.6%
Net Rental Income 12.4% 12.7% 12.7% 13.0% 13.2% 13.5% 13.4% 13.6% 13.7% 13.7% 13.8% 14.2% 14.4% 14.9% 15.4% 15.7%

e-filing and compliance risk: Evidence from Australian personal income tax deductions Warren
-9-
clear with the growth in the number of claimants rising faster than taxpayer numbers. While monitoring outlier deduction claims can go some way to addressing deduction integrity concerns,16 it cannot easily address systemic non-compliance or increased take-up.
The focus of the following section is on whether: a) the move to e-filing and away from paper returns by self-preparers in Australia has resulted in
any meaningful increased incidence and level of claims by self-preparers as against that in returns prepared by tax agents; and
b) in the case of self-preparers, there is evidence of different behaviour between those lodging paper as against e-filed returns.
With this knowledge Section 4 will examine what implications any observations made might have for deduction design and administration of the Australian personal income tax.
Table 3 Annual growth rates for personal taxable income and deduction: Australia 1998-99 to 2013-14
2003-04 to 2012-13 1998-99 to 2013-14
Change in Claimants
Change in Average
Claim
Change in
Claimants
Change in Average
Claim
Total Income or Loss 1.4% 5.3% 1.5% 4.5%
Taxable income or loss 1.2% 5.3% 1.6% 4.7%
Total work related car expenses 3.5% 2.9% 4.6% 3.4%
Work related travel expenses 7.2% 1.3% 6.8% 1.9%
Total work related uniform/clothing expenses 2.8% 1.7% 1.1% 3.5%
Total work related self-education expenses 0.9% 3.1% 1.1% 3.5%
Other work related expenses 2.5% 3.6% 1.6% 4.8%
Total work related expenses 2.0% 4.2% 1.9% 5.3%
Gifts or donations 1.7% 5.9% 2.0% 7.2%
Cost of managing tax affairs 2.3% 6.3% 1.7% 6.5%
Total Deductions 1.7% 3.0% 1.5% 3.3%
Rent interest deductions 3.3% 4.3% 4.3% 6.3%
Rent capital works deductions 7.8% 5.0% 9.9% 4.3%
Rent other rental deductions 8.9% -5.0% 9.3% -7.2%
Note: Colour code is red below values for Total Income or Loss – the benchmark – and green above with the strength of the colour change reflecting greater distance from the benchmark value Source: Table 1 at http://data.gov.au/dataset/25e81c18-2083-4abe-81b6-0f530053c63f/resource/3cd6dee1-785f-4876-a282-ebcf00f9949a/download/Taxstats2014Individual01SelectedItemsByYear.xlsx
3 HAS E-FILING CHANGED AUSTRALIAN PERSONAL INCOME TAXPAYER DEDUCTION BEHAVIOUR?
Figure 1 (and Table 1) highlighted the rise in e-tax lodgements by self-preparers in Australia since 1998-99, the corresponding decline in paper-based lodgements, and the small decline in those lodging through tax agents. With pre-filling becoming established in 2006-07, there was a perceptible rise in self-preparers in that year, especially in e-tax preparers who rose 246,000 offset by paper lodgements falling 65,000. With returns lodged through tax agents rising 170,000 at a time when the overall increase in tax filers was 354,000, self-preparers were over 50% of net new filers, significantly up on its typical quarter share of all tax filers. In 2007-08 this trend continued with e-filers rising 370,000
16 This is the approach adopted by the ATO when it makes public and promotes deduction benchmark ratios for small business and selected professions. See https://www.ato.gov.au/Business/Small-business-benchmarks/

e-filing and compliance risk: Evidence from Australian personal income tax deductions Warren
-10-
while total new filers rose 432,000 and those with tax agents rising 57,000. Of the increase in tax filers in 2007-08, only 13% on balance filed to tax agents while 87% filed through e-tax.
This rapid rise in e-tax returns in 2007-08 can be largely attributed to the Federal Government requiring taxpayers to have lodged their 2007-08 returns to be entitled from April 2009 to the $900 cash bonus related to the global financial crisis economic stimulus package. However, in 2008-09 those who rushed to collect the bonus did not return resulting in a fall in tax filers of 86,000 (and taxable individuals of 501,000). With the number of e-tax and paper filers both increasing in 2008-09, the burden of this fall in overall tax-filers fell on tax agents who filed 228,000 less returns in 2008-09 than 2007-08.
Since 2008-09, the steady inroads e-tax made into the share of individuals lodging with tax agents has reversed, despite the availability of a Mac version of e-tax in 2012-13. Some insight into the cause of this trend is evident in Figure 2 which shows a decline in the real value of WRE claims since 2007-08. If this decline is the result of increased ATO compliance activity then because tax agents can provide taxpayers with the reassurance that they are less likely to be audited – especially if they have substantial deductions – then they have an incentive to lodge through a tax agent and be less ambitious with their claims. This might also explain why the return to tax agents has seen the average cost to taxpayers of having their tax affairs managed by an agent increasing 151% between 1998-99 and 2013-14 while average taxable income increased only 91% (and average weekly ordinary time earnings (AWOTE) by 95%). The net result is that the trend toward electronic lodgement by self-preparers has over the longer term, had little impact on tax agents, especially when there is more focus by revenue bodies on compliance, especially in relation to claimed deductions.
The question now is whether this changing mix in the method of tax return lodgement has in any way impacted on how Australian taxpayers have gone about claiming their income related deductions.
3.1 Evidence by method of lodgment
The focus of this section will be on those deductions where the individual has discretion about what and how much of a deduction to claim. For this reason, the cost of managing an individual’s tax affairs is not relevant as self-preparers will not typically have such a claim (although some do in practice). Less important too are deductions which carry over from a previous period or those which are relatively small in value such as donations and gifts to charities.17 Where the greatest discretion exists in the Australian system is with work-related expenses (WRE) and “other” expense claims related to residential rental properties. With work-related expenses being $20.8bill in 2013-14 and “other” rental property deductions being $18.4bill,18 individuals have some discretion at the margin over their deduction claims.
17 In 2013-14, work related expense deductions totalled $20.8bill, donations to charities some $2.6bill and the cost on managing tax affairs, $2.3bill while taxable income was $740.7bill. See Table 1 at http://data.gov.au/dataset/25e81c18-2083-4abe-81b6-0f530053c63f/resource/3cd6dee1-785f-4876-a282-ebcf00f9949a/download/Taxstats2014Individual01SelectedItemsByYear.xlsx 18 Rent interest deductions were $21.4bill and capital works deductions $2.7bill in 2013-14. Source as for footnote 17
e-filing and compliance risk: Evidence from Australian personal income tax deductions Warren
-11-
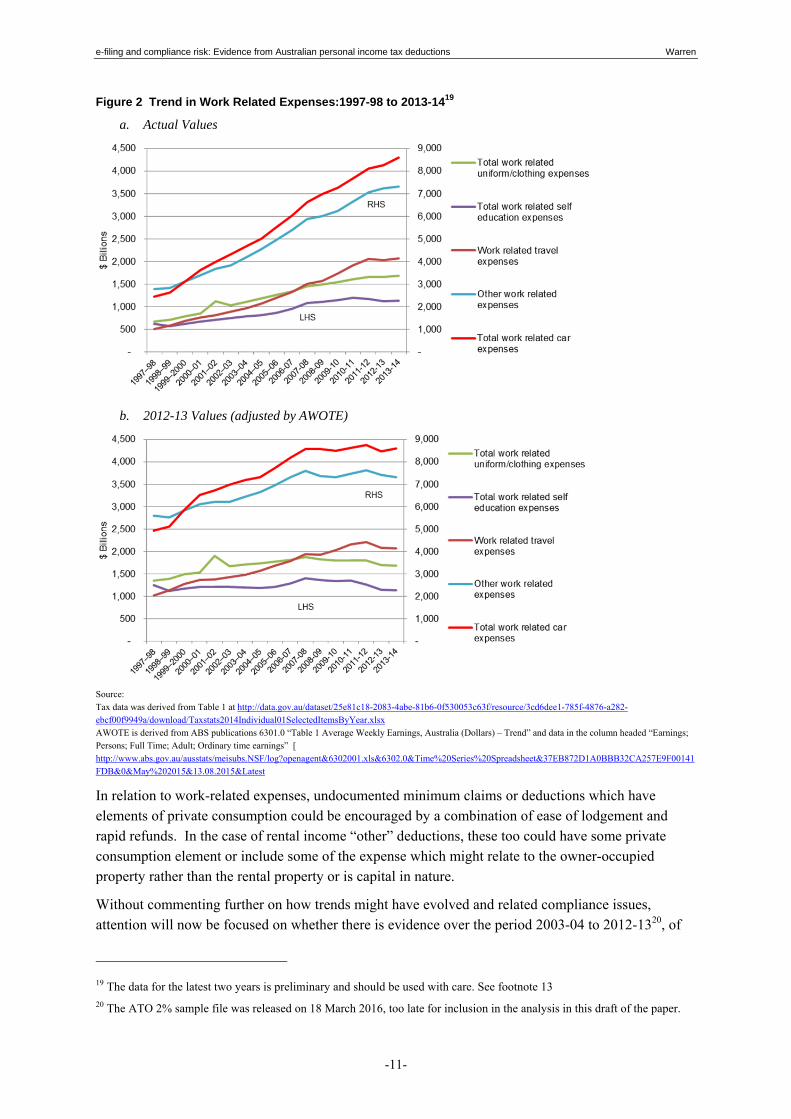
Figure 2 Trend in Work Related Expenses:1997-98 to 2013-1419
a. Actual Values
b. 2012-13 Values (adjusted by AWOTE)
Source: Tax data was derived from Table 1 at http://data.gov.au/dataset/25e81c18-2083-4abe-81b6-0f530053c63f/resource/3cd6dee1-785f-4876-a282-ebcf00f9949a/download/Taxstats2014Individual01SelectedItemsByYear.xlsx AWOTE is derived from ABS publications 6301.0 “Table 1 Average Weekly Earnings, Australia (Dollars) – Trend” and data in the column headed “Earnings; Persons; Full Time; Adult; Ordinary time earnings” [ http://www.abs.gov.au/ausstats/meisubs.NSF/log?openagent&6302001.xls&6302.0&Time%20Series%20Spreadsheet&37EB872D1A0BBB32CA257E9F00141FDB&0&May%202015&13.08.2015&Latest
In relation to work-related expenses, undocumented minimum claims or deductions which have elements of private consumption could be encouraged by a combination of ease of lodgement and rapid refunds. In the case of rental income “other” deductions, these too could have some private consumption element or include some of the expense which might relate to the owner-occupied property rather than the rental property or is capital in nature.
Without commenting further on how trends might have evolved and related compliance issues, attention will now be focused on whether there is evidence over the period 2003-04 to 2012-1320, of
19 The data for the latest two years is preliminary and should be used with care. See footnote 13 20 The ATO 2% sample file was released on 18 March 2016, too late for inclusion in the analysis in this draft of the paper.
e-filing and compliance risk: Evidence from Australian personal income tax deductions Warren
-12-
differential deduction claim patterns over time according to how individual income tax returns are lodged. While taxpayer sample data were available between 2003-04 and 2010-11 for lodgements which distinguished paper and e-tax self-preparers, for the period 2011-12 and 2012-13 data are only available for “all self-preparers” whether they e-filed or lodged paper returns. With paper returns becoming an increasingly small proportion of self-preparer returns (Table 1), this loss of detail while unfortunate is not fundamental as by far the greatest majority of self-preparers are e-filers (83% in 2012-13 from Table 1).
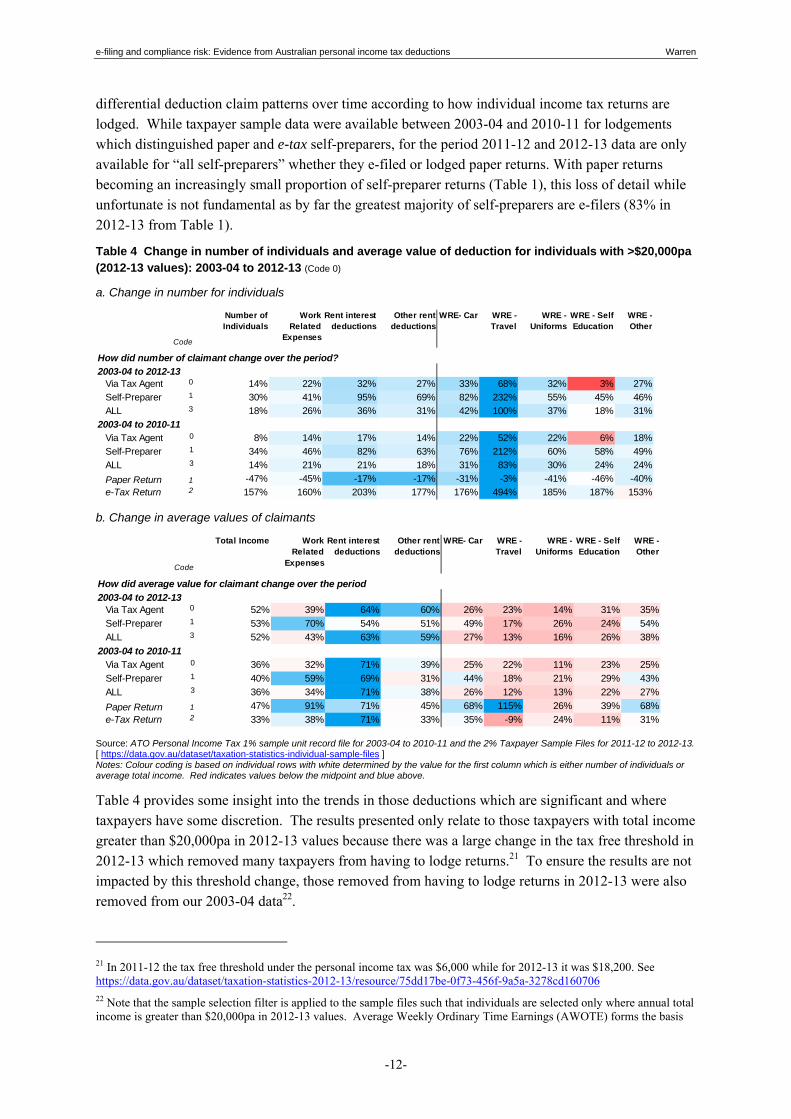
Table 4 Change in number of individuals and average value of deduction for individuals with >$20,000pa (2012-13 values): 2003-04 to 2012-13 (Code 0)
a. Change in number for individuals
b. Change in average values of claimants
Source: ATO Personal Income Tax 1% sample unit record file for 2003-04 to 2010-11 and the 2% Taxpayer Sample Files for 2011-12 to 2012-13. [ https://data.gov.au/dataset/taxation-statistics-individual-sample-files ] Notes: Colour coding is based on individual rows with white determined by the value for the first column which is either number of individuals or average total income. Red indicates values below the midpoint and blue above.
Table 4 provides some insight into the trends in those deductions which are significant and where taxpayers have some discretion. The results presented only relate to those taxpayers with total income greater than $20,000pa in 2012-13 values because there was a large change in the tax free threshold in 2012-13 which removed many taxpayers from having to lodge returns.21 To ensure the results are not impacted by this threshold change, those removed from having to lodge returns in 2012-13 were also removed from our 2003-04 data22.
21 In 2011-12 the tax free threshold under the personal income tax was $6,000 while for 2012-13 it was $18,200. See https://data.gov.au/dataset/taxation-statistics-2012-13/resource/75dd17be-0f73-456f-9a5a-3278cd160706 22 Note that the sample selection filter is applied to the sample files such that individuals are selected only where annual total income is greater than $20,000pa in 2012-13 values. Average Weekly Ordinary Time Earnings (AWOTE) forms the basis
Code
Number of Individuals
Work Related
Expenses
Rent interest deductions
Other rent deductions
WRE- Car WRE - Travel
WRE - Uniforms
WRE - Self Education
WRE - Other
How did number of claimant change over the period?
2003-04 to 2012-13Via Tax Agent 0 14% 22% 32% 27% 33% 68% 32% 3% 27%
Self-Preparer 1 30% 41% 95% 69% 82% 232% 55% 45% 46%
ALL 3 18% 26% 36% 31% 42% 100% 37% 18% 31%
2003-04 to 2010-11Via Tax Agent 0 8% 14% 17% 14% 22% 52% 22% 6% 18%
Self-Preparer 1 34% 46% 82% 63% 76% 212% 60% 58% 49%
ALL 3 14% 21% 21% 18% 31% 83% 30% 24% 24%
Paper Return 1 -47% -45% -17% -17% -31% -3% -41% -46% -40%
e-Tax Return 2 157% 160% 203% 177% 176% 494% 185% 187% 153%
Code
Total Income Work Related
Expenses
Rent interest deductions
Other rent deductions
WRE- Car WRE - Travel
WRE - Uniforms
WRE - Self Education
WRE - Other
How did average value for claimant change over the period
2003-04 to 2012-13Via Tax Agent 0 52% 39% 64% 60% 26% 23% 14% 31% 35%
Self-Preparer 1 53% 70% 54% 51% 49% 17% 26% 24% 54%
ALL 3 52% 43% 63% 59% 27% 13% 16% 26% 38%
2003-04 to 2010-11Via Tax Agent 0 36% 32% 71% 39% 25% 22% 11% 23% 25%
Self-Preparer 1 40% 59% 69% 31% 44% 18% 21% 29% 43%
ALL 3 36% 34% 71% 38% 26% 12% 13% 22% 27%
Paper Return 1 47% 91% 71% 45% 68% 115% 26% 39% 68%
e-Tax Return 2 33% 38% 71% 33% 35% -9% 24% 11% 31%

e-filing and compliance risk: Evidence from Australian personal income tax deductions Warren
-13-
In relation to work related expenses, Table 4 shows that self-preparer’s average total income rose 53% while average deductions of claimants rose 70%. The origin of this 70% increase is not straightforward. From Table 4a we can see that underlying this 70% is a 41% increase in claimants who are now claiming less relative to their income than before. This implies that over time, more individuals are claiming more of these deductions even though they are on average claiming less of this type of deduction. What is important to the issue under investigation in this paper is therefore not just the amount but also the incidence of claims by the selected groups of filers.
Figure 3 Work Related Expenses: 2003-04 to 2013-14
a. Incidence of claimants (% of group making a claim) (Code 21)
b. Average $pa WRE claim by claimants (Code 0)
c. WRE as a % of total income by claimants (Code 16)
Source: As for Table 4
on which incomes are adjusted over the period 2003-04 and 2012-13. Data used on AWOTE is derived from ABS publications 6301.0 “Table 1 Average Weekly Earnings, Australia (Dollars) – Trend” and data in the column headed “Earnings; Persons; Full Time; Adult; Ordinary time earnings” [ http://www.abs.gov.au/ausstats/meisubs.NSF/log?openagent&6302001.xls&6302.0&Time%20Series%20Spreadsheet&37EB872D1A0BBB32CA257E9F00141FDB&0&May%202015&13.08.2015&Latest ]. The change in average values of income and deductions are then measured based on the current nominal values of these variables in the years selected.
e-filing and compliance risk: Evidence from Australian personal income tax deductions Warren
-14-
Where the higher incidence of claims are most pronounced is with self-preparers as shown in Table 4a in the case of the different WREs, rising some 232% in the case of self-preparers claiming WRE-Travel over the period 2003-04 to 2012-13. However, amongst self-preparers, it would appear that there is another complicated pattern emerging.
Over the period for which we have separate data for self-preparers lodging with paper and e-tax, 2003-04 and 2010-11, there was a 212% increase in the incidence of claims for WRE-Travel. Since the incidence of claims for e-tax claimants rose 494% when the number of such individuals increased 157%, compared to paper return claimants falling 3% when the number of these taxpayers fell 47%, the incidence of claims with e-tax lodges is higher. Put differently, for e-tax individuals this can be thought of as the number lodging returns effectively rising from 100 to 257 and the number claiming WRE-Travel rising from 100 to 594, while for those lodging paper returns, the number lodging returns effectively fell from 100 to 53 and the number claiming WRE-Travel fell from 100 to 97.
Explaining the findings in Table 4 is therefore complicated by changes in the number of taxpayers in aggregate, the share in each category and the average level of each claim. In the case of total WRE, Figure 3 reveals that the results in Table 4 for e-tax filers is not driven by the incidence of claims over the period (Figure 3a) but by average claims increasing faster in percentage terms (coming off a lower base shown in Figure 3b) when compared to those filing through tax agents who claim more on average but have a lower claim incidence. In fact, the rate of claim for total WRE amongst self-preparer has diverged (now being much higher) than for those filing with tax agents.
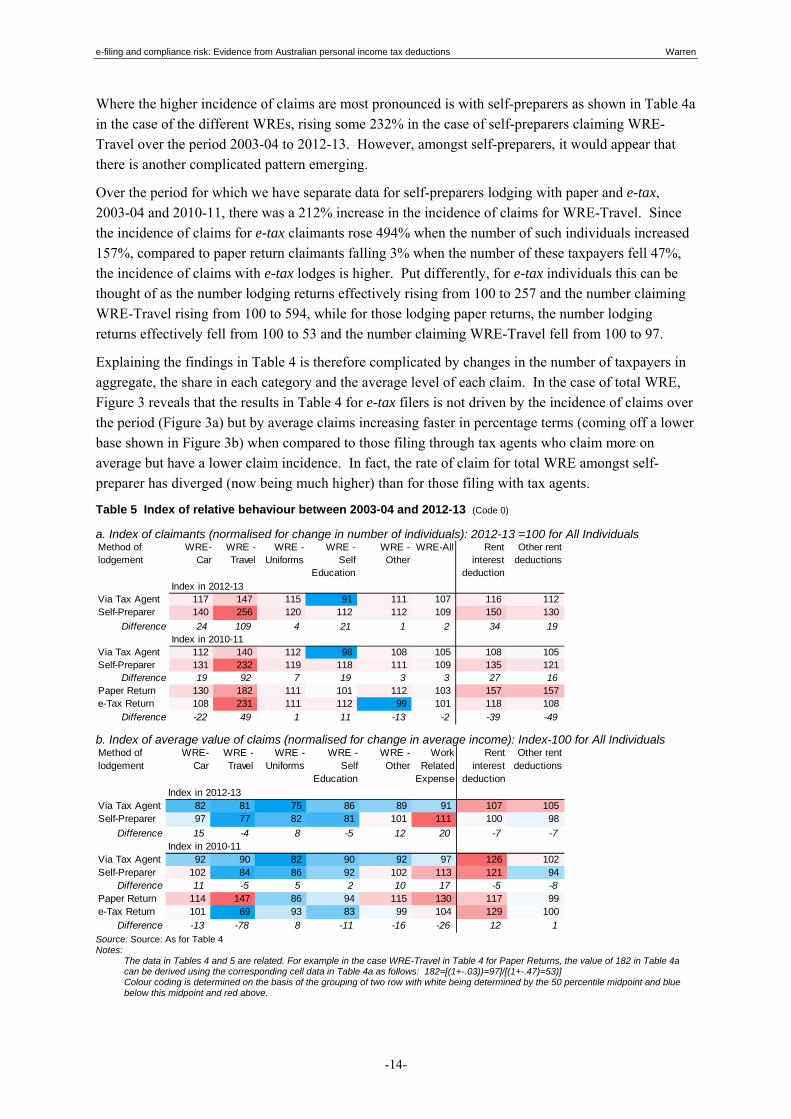
Table 5 Index of relative behaviour between 2003-04 and 2012-13 (Code 0)
a. Index of claimants (normalised for change in number of individuals): 2012-13 =100 for All Individuals
b. Index of average value of claims (normalised for change in average income): Index-100 for All Individuals
Source: Source: As for Table 4 Notes:
The data in Tables 4 and 5 are related. For example in the case WRE-Travel in Table 4 for Paper Returns, the value of 182 in Table 4a can be derived using the corresponding cell data in Table 4a as follows: 182=[(1+-.03))=97]/[(1+-.47)=53)] Colour coding is determined on the basis of the grouping of two row with white being determined by the 50 percentile midpoint and blue below this midpoint and red above.
Method of lodgement
WRE- Car
WRE - Travel
WRE - Uniforms
WRE - Self
Education
WRE - Other
WRE-All Rent interest
deduction
Other rent deductions
Index in 2012-13Via Tax Agent 117 147 115 91 111 107 116 112Self-Preparer 140 256 120 112 112 109 150 130
Difference 24 109 4 21 1 2 34 19Index in 2010-11
Via Tax Agent 112 140 112 98 108 105 108 105Self-Preparer 131 232 119 118 111 109 135 121
Difference 19 92 7 19 3 3 27 16Paper Return 130 182 111 101 112 103 157 157e-Tax Return 108 231 111 112 99 101 118 108
Difference -22 49 1 11 -13 -2 -39 -49
Method of lodgement
WRE- Car
WRE - Travel
WRE - Uniforms
WRE - Self
Education
WRE - Other
Work Related
Expense
Rent interest
deduction
Other rent deductions
Index in 2012-13Via Tax Agent 82 81 75 86 89 91 107 105Self-Preparer 97 77 82 81 101 111 100 98
Difference 15 -4 8 -5 12 20 -7 -7 Index in 2010-11
Via Tax Agent 92 90 82 90 92 97 126 102Self-Preparer 102 84 86 92 102 113 121 94
Difference 11 -5 5 2 10 17 -5 -8 Paper Return 114 147 86 94 115 130 117 99e-Tax Return 101 69 93 83 99 104 129 100
Difference -13 -78 8 -11 -16 -26 12 1

e-filing and compliance risk: Evidence from Australian personal income tax deductions Warren
-15-
While Figure 3 is revealing for total WRE, the challenge for this paper was how to simply disaggregate the data in Table 4 for different types of deductions to reveal the source of change in each case over time. The solution was to develop indexes capable of distinguishing the average level of claims from the incidence of claims within and across groups of individuals.
Table 5 reports on indexes which partition the findings in Table 4 into measures which reflect the growth in the number of taxpayers claiming different deductions and the growth in the average claim in each case. For example, a value of 117 in the first row of Table 5a is the ratio of (1+33%/1+14%) from the corresponding row in Table 4. The value of 117 can be interpreted as meaning that WRE-Car for 2012-13 for “Via Tax Agent” was a 17% increase on the number of claimants relative to the number of taxpayers over the period since 2003-04. A value less than 100 (blue) implies a fall in the relative number making a claim. In the case of Table 5b (which draws on Table 4b), blue indicates that the average claim fell relative to average income and red, that it increased.
Table 5 therefore allows us to visually (and numerically) understand changes in the incidence amongst taxpayers of their rates of claim (Table 5a) and changes in the average claim relative to the average income (Table 5b) of each group identified in the rows.
What Table 5 reveals is that in almost all cases, there has been a growth in the rate of claim amongst taxpayers (red in 5b) and a trend towards falls in the average level of claim. The two are obviously not unrelated and can be explained by the new claimants having relatively modest claims.
Since this paper is primarily interested in the behaviour of self-preparers as against paper and e-tax lodgements, the differential trends for self-preparers who lodge with paper or e-tax is of particular interest. While data are only available for those lodging through paper or e-tax for the period 2003-04 to 2010-11, what Table 5 reveals is that there are quite different outcomes for those lodging through tax agents (coloured row 1 in each of 5a and 5b) and those through paper (coloured row 5) and e-tax (coloured row 6). Reading off the colour coding in Table 5, the incidence of claims for self-preparers rose above those using a tax agent and those up until 2010-11 lodging with paper, had a greater claim incidence for WRE-Car and WRE-Other. Paper return lodgers also tended to have a far greater claim rate in relation to rent-interest and rent-other deductions. What is not immediately clear is whether the results for paper self-preparers is just a consequence of those who have not as yet gone electronic or is in some way revealing a trend amongst these individuals.
What Table 5a does reveal in coloured row 1 and 2 is that there is clearly a trend towards a higher incidence of claims amongst self-preparers. However, it is important to complement this finding on incidence with that in Table 5b on the level of the claim relative to income. It would appear that for paper return lodgers (coloured row 5), that in most cases in relation to WRE, their level of claim is relatively higher than for e-tax (coloured row 6) – although in some cases the level relative to income did fall for paper preparers (blue in coloured row 5 of Table 5b).
The results in Tables 5a and 5b when combined highlight a marked divergence between the results of self-preparers and those with tax agents – for the former there is a greater incidence of claims (coloured row 2 vs 1 in 5a) and a greater relative claim (coloured row 2 vs 1 in 5b). With paper self-preparers as against e-tax lodgers, while the there is a mixed picture for incidence (coloured row 6 vs 5 in 5a), the average claim relative to income appears to be higher for paper as against e-tax (coloured row 6 vs 5 in 5b).
Can it be concluded that a move to e-tax increased the relative incidence of claims and the amount claimed for this group as against other groups? What is apparent is a higher incidence of WRE claims

e-filing and compliance risk: Evidence from Australian personal income tax deductions Warren
-16-
amongst self-preparers (coloured row 2 vs 1in 5a) who by 2012-13 were largely e-tax lodgers with the level of claim relative to income (coloured row 2 vs 1in 5b) rising more for self-preparers than for those lodging through tax agents. There is clearly something very different happening with self-preparers which warrants further investigation.
Table 6 attempts to cast some light on what the changes in incidence of claims and the level of claims means for the aggregate level of claims relative to aggregate total income – in effect, the outcome of the combination of factors at work in Table 5. The indexes in Table 6 are benchmarked against the change in the aggregate level of income over the periods shown. A value greater than 100 (in red) indicates the aggregate value for the variable grew faster than aggregate total income and below 100, slower (in blue). The rate of growth for the deductions shown was consistently greater for self-preparers over those lodging through tax agents – and quite markedly so (coloured rows 1 and 2 in Table 6). While the experience for paper lodgers appears quite different from e-tax lodgers, this as noted above could simply be the product of the characteristics of taxpayers who are reluctant to lodge any other way than paper, rather than by any specific action (or reaction) by these individuals. What is more important is the differing pattern of results for self-preparers over those with tax agents.
However the results and findings from Tables 5 and 6 needs to be tempered with the data reported in Table 8a on the average level of claim across the different groups. Those persons with tax agents at the highest level of average WRE claim and those with paper returns typically lowest. This trend is however, not borne out in the case of rental deductions where those lodging paper returns are not too different from those with tax agents, with those lodging through e-tax having the lowest average claims. In relation to WRE, what self-preparers (paper or e-tax) might be doing is simply “catching up” to the activities of lodgers through tax agents. However, what Tables 5 and 6 above do indicate is that the level of claim relative to income of those using tax agents has moderated in recent years – but less so for self-preparers. Whether this is the consequence of increased ATO compliance activity – simply the setting a benchmark deduction ratios for different professions – and possible conservatism by tax agents, is unclear.
Table 6 Index of aggregate value of claims: 2003-04=100 (Code 11/16)
Source: Source: As for Table 4 Notes: Colour coding is determined on the basis of the grouping of two row with white being determined by the 50 percentile midpoint and blue below this midpoint and red above.
3.2 Other explanatory variables
While the above analysis has sought to investigate differences in the incidence and level of claims amongst taxpayers using different methods of filing tax returns, the interesting question which this raises is whether any trends observed are the result of changes in taxpayer behaviour or the result of
Method of lodgement
WRE- Car
WRE - Travel
WRE - Uniforms
WRE - Self
Education
WRE - Other
Work Related
Expenses
Rent interest
deduction
Other rent deductions
Index in 2012-13Via Tax Agent 96 118 86 78 99 97 124 117Self-Preparer 136 196 98 91 113 121 151 128
Difference 40 78 12 13 14 24 26 11Index in 2010-11
Via Tax Agent 103 126 92 88 99 102 136 107Self-Preparer 134 196 103 108 113 123 163 114
Difference 31 70 11 20 14 21 28 6Paper Return 149 267 95 95 128 135 183 155e-Tax Return 109 159 104 93 97 105 152 108
Difference -40 -108 9 -2 -31 -29 -31 -48
e-filing and compliance risk: Evidence from Australian personal income tax deductions Warren
-17-
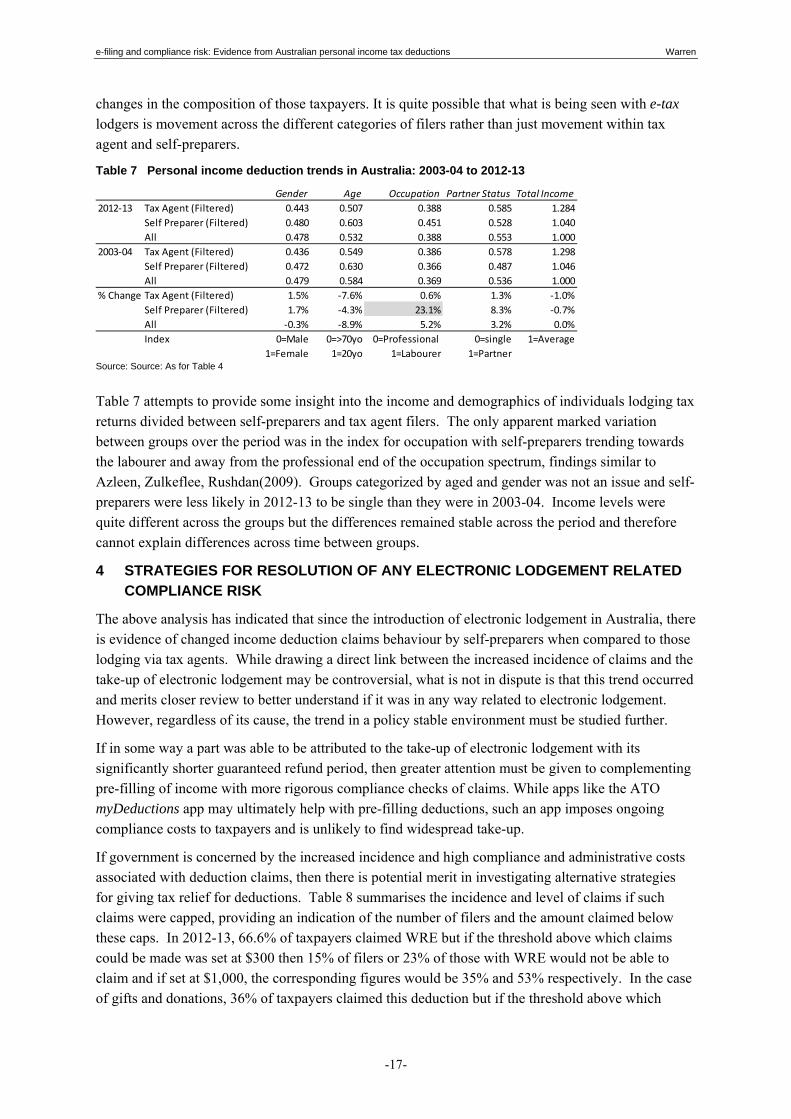
changes in the composition of those taxpayers. It is quite possible that what is being seen with e-tax lodgers is movement across the different categories of filers rather than just movement within tax agent and self-preparers.
Table 7 Personal income deduction trends in Australia: 2003-04 to 2012-13
Source: Source: As for Table 4
Table 7 attempts to provide some insight into the income and demographics of individuals lodging tax returns divided between self-preparers and tax agent filers. The only apparent marked variation between groups over the period was in the index for occupation with self-preparers trending towards the labourer and away from the professional end of the occupation spectrum, findings similar to Azleen, Zulkeflee, Rushdan(2009). Groups categorized by aged and gender was not an issue and self-preparers were less likely in 2012-13 to be single than they were in 2003-04. Income levels were quite different across the groups but the differences remained stable across the period and therefore cannot explain differences across time between groups.
4 STRATEGIES FOR RESOLUTION OF ANY ELECTRONIC LODGEMENT RELATED COMPLIANCE RISK
The above analysis has indicated that since the introduction of electronic lodgement in Australia, there is evidence of changed income deduction claims behaviour by self-preparers when compared to those lodging via tax agents. While drawing a direct link between the increased incidence of claims and the take-up of electronic lodgement may be controversial, what is not in dispute is that this trend occurred and merits closer review to better understand if it was in any way related to electronic lodgement. However, regardless of its cause, the trend in a policy stable environment must be studied further.
If in some way a part was able to be attributed to the take-up of electronic lodgement with its significantly shorter guaranteed refund period, then greater attention must be given to complementing pre-filling of income with more rigorous compliance checks of claims. While apps like the ATO myDeductions app may ultimately help with pre-filling deductions, such an app imposes ongoing compliance costs to taxpayers and is unlikely to find widespread take-up.
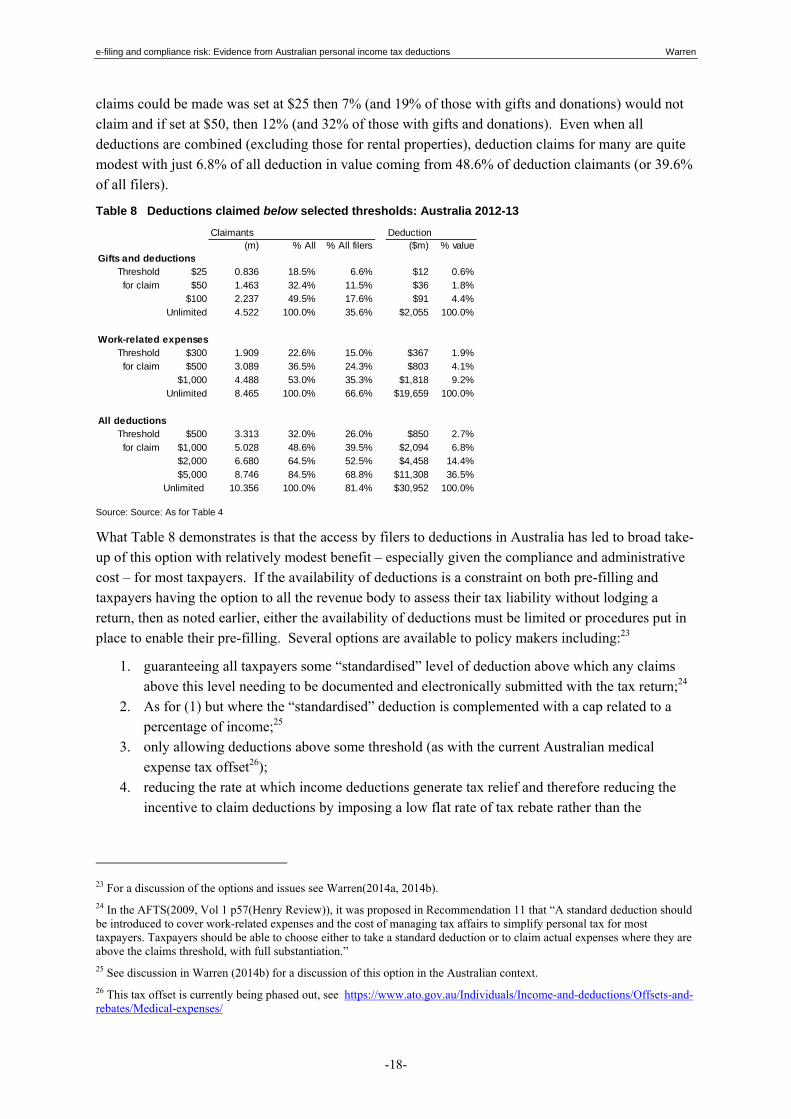
If government is concerned by the increased incidence and high compliance and administrative costs associated with deduction claims, then there is potential merit in investigating alternative strategies for giving tax relief for deductions. Table 8 summarises the incidence and level of claims if such claims were capped, providing an indication of the number of filers and the amount claimed below these caps. In 2012-13, 66.6% of taxpayers claimed WRE but if the threshold above which claims could be made was set at $300 then 15% of filers or 23% of those with WRE would not be able to claim and if set at $1,000, the corresponding figures would be 35% and 53% respectively. In the case of gifts and donations, 36% of taxpayers claimed this deduction but if the threshold above which
Gender Age Occupation Partner Status Total Income
2012‐13 Tax Agent (Filtered) 0.443 0.507 0.388 0.585 1.284
Self Preparer (Filtered) 0.480 0.603 0.451 0.528 1.040
All 0.478 0.532 0.388 0.553 1.000
2003‐04 Tax Agent (Filtered) 0.436 0.549 0.386 0.578 1.298
Self Preparer (Filtered) 0.472 0.630 0.366 0.487 1.046
All 0.479 0.584 0.369 0.536 1.000
% Change Tax Agent (Filtered) 1.5% ‐7.6% 0.6% 1.3% ‐1.0%
Self Preparer (Filtered) 1.7% ‐4.3% 23.1% 8.3% ‐0.7%
All ‐0.3% ‐8.9% 5.2% 3.2% 0.0%
Index 0=Male 0=>70yo 0=Professional 0=single 1=Average
1=Female 1=20yo 1=Labourer 1=Partner
e-filing and compliance risk: Evidence from Australian personal income tax deductions Warren
-18-
claims could be made was set at $25 then 7% (and 19% of those with gifts and donations) would not claim and if set at $50, then 12% (and 32% of those with gifts and donations). Even when all deductions are combined (excluding those for rental properties), deduction claims for many are quite modest with just 6.8% of all deduction in value coming from 48.6% of deduction claimants (or 39.6% of all filers).
Table 8 Deductions claimed below selected thresholds: Australia 2012-13
Source: Source: As for Table 4
What Table 8 demonstrates is that the access by filers to deductions in Australia has led to broad take-up of this option with relatively modest benefit – especially given the compliance and administrative cost – for most taxpayers. If the availability of deductions is a constraint on both pre-filling and taxpayers having the option to all the revenue body to assess their tax liability without lodging a return, then as noted earlier, either the availability of deductions must be limited or procedures put in place to enable their pre-filling. Several options are available to policy makers including:23
1. guaranteeing all taxpayers some “standardised” level of deduction above which any claims above this level needing to be documented and electronically submitted with the tax return;24
2. As for (1) but where the “standardised” deduction is complemented with a cap related to a percentage of income;25
3. only allowing deductions above some threshold (as with the current Australian medical expense tax offset26);
4. reducing the rate at which income deductions generate tax relief and therefore reducing the incentive to claim deductions by imposing a low flat rate of tax rebate rather than the
23 For a discussion of the options and issues see Warren(2014a, 2014b). 24 In the AFTS(2009, Vol 1 p57(Henry Review)), it was proposed in Recommendation 11 that “A standard deduction should be introduced to cover work-related expenses and the cost of managing tax affairs to simplify personal tax for most taxpayers. Taxpayers should be able to choose either to take a standard deduction or to claim actual expenses where they are above the claims threshold, with full substantiation.” 25 See discussion in Warren (2014b) for a discussion of this option in the Australian context. 26 This tax offset is currently being phased out, see https://www.ato.gov.au/Individuals/Income-and-deductions/Offsets-and-rebates/Medical-expenses/
Claimants (m) % All % All filers ($m) % value
Gifts and deductionsThreshold $25 0.836 18.5% 6.6% $12 0.6%for claim $50 1.463 32.4% 11.5% $36 1.8%
$100 2.237 49.5% 17.6% $91 4.4%Unlimited 4.522 100.0% 35.6% $2,055 100.0%
Work-related expensesThreshold $300 1.909 22.6% 15.0% $367 1.9%for claim $500 3.089 36.5% 24.3% $803 4.1%
$1,000 4.488 53.0% 35.3% $1,818 9.2%Unlimited 8.465 100.0% 66.6% $19,659 100.0%
All deductionsThreshold $500 3.313 32.0% 26.0% $850 2.7%for claim $1,000 5.028 48.6% 39.5% $2,094 6.8%
$2,000 6.680 64.5% 52.5% $4,458 14.4%$5,000 8.746 84.5% 68.8% $11,308 36.5%
Unlimited 10.356 100.0% 81.4% $30,952 100.0%
Deduction

e-filing and compliance risk: Evidence from Australian personal income tax deductions Warren
-19-
taxpayer’s marginal tax rate when calculating the income tax offset generated through deductions;
5. mandating that all deduction claims must be filed through deductions software such as the ATO myDeductions app, effectively enabling tax administrators to not only monitor deduction claims but to pre-fill deduction claims on tax returns;
6. some combination of 1 to 5 above
While the above options are by no means exclusive of all possibilities, they would act to reduce the incentive electronic lodgement might have for excessive or undocumented claims which pose a revenue risk to government. They would also act to reduce enforcement costs for tax administrators although this would be at the expense of increased compliance costs for taxpayers. However, simple measure such as (1) (and 2), while attractive for their simplicity in reducing the number of filers needing to formally claim deductions, could have a significant revenue cost if the level is set high and is available to a broad range of taxpayers.27
An additional concern is that any policy actions designed to address compliance risk and complexity might impinge on economic efficiency and equity by denying (or at least curtailing) legitimate deductions as with (3). While ever some deductions remain available and there is income prefilling, information asymmetry between the taxpayer and the tax administrator must be addressed, especially in an environment where tax refunds related to those deductions are expedited compared to those lodging paper returns. While policy change is an option, only through denial of any deductions does it remove compliance risk with deductions and until such a policy position is adopted, electronic lodgement must be complemented with equal focus on prefilling deductions and income to minimize compliance risk.
27 If the “standardised” deduction was available to only those in full-time employment then this might not be an issue but if it was also available to part-time (however defined) and the self-employed, then its cost could be a major constraint on pursuing this policy option.
e-filing and compliance risk: Evidence from Australian personal income tax deductions Warren
-20-
5 BIBLIOGRAPHY
Australia’s Future Tax System Review Panel (AFTS 2009) (K Henry (Chair), Harmer, J, Piggott, J, Ridout, H and Smith, G) (2009), Australia’s Future Tax System: Report to the Treasurer, Commonwealth of Australia, Canberra (Released May 2010)
Australian National Audit Office (ANAO) 2008 Auditor – General, Performance Audit: The Australian Taxation Office’s Use of Data Matching and Analytics in Tax Administration, Audit Report No.30 2007–08
Australian Tax Office (ATO) (2014) ATO Strategic Intent – Reinventing the ATO, Australian Taxation Office, Canberra, p.9.
Australian Taxation Office (ATO) (2015) Pre-filling Service, ATO, Canberra (https://www.ato.gov.au/Tax-professionals/Tax-Agent-Portal/Using-the-Tax-Agent-Portal/Portal-reports/Pre-filling-service/ )
Australian Treasury (2014) Improving tax compliance — enhanced third party reporting, pre-filling and data matching, Discussion Paper February (http://www.treasury.gov.au/ConsultationsandReviews/Consultations/2014/Improving-tax-compliance)
Azleen , I., Zulkeflee A.R., Rushdan Y. (2009) “Taxpayers' Attitude In Using E-Filing System: Is There Any Significant Difference Among Demographic Factors?”, Journal of Internet Banking and Commerce, 14(1):1-13 Edmonds, L. (2010) Working for all Australians: A brief history of the Australian Taxation Office 1910–2010, ATO Canberra available at (https://www.ato.gov.au/printfriendly.aspx?url=/General/Gen/Working-for-all-Australians-1910-2010/ )
Evans, C. (2004), “Diminishing Returns: The Case for Reduced Annual Filing for Personal Income Taxpayers in Australia”, Australia Tax Review 33(3): 168–181.
Evans, C. and Tran Nam, B. (2010) “Managing tax system complexity: Building bridges through pre-filled tax returns”, Australian Tax Forum 25(2):247-76
Highfield, R. (2006) ‘Pre-populated Income Tax Returns: The “Next Big Thing” in Reform of the Administration of Australia’s Personal Income Tax System’ in McKerchar M. and Walpole W. (eds) Further Global Challenges in Tax Administration, Fiscal Publications, UK
HMRC (2014) Business Plan 2014-16, United Kingdom Her Majesty’s Revenue and Customs, London.
Inspector General of Taxes (2013) Review into the Australian Taxation Office’s Compliance Approach to Individual Taxpayers - use of Data Matching, a report to the Assistant Treasurer, Canberra (http://igt.gov.au/files/2014/11/use-of-data-matching.pdf )
Kerr, J. (2012) “Tax return simplification: risk key engagement, a return to risk?, eJournal of Tax Research 10(2): 465-482
New Zealand Inland Revenue (2014) Statement of Intent 2014-18, New Zealand Inland Revenue, Wellington (https://www.ird.govt.nz/resources/4/f/4febb0e0-f764-4017-bcfc-c5bb4eeaf6bf/soi2014.pdf )
OECD (2006) “Using Third Party Information Reports to Assist Taxpayers Meet their Return Filing Obligations— Country Experiences With the Use of Pre-populated Personal Tax Returns”, Information Note, Forum on Tax Administration: Taxpayer Services Subgroup, Centre for Tax Policy and Administration, OECD (http://www.oecd.org/tax/administration/36280368.pdf )
OECD (2008) “Third Party Reporting Arrangements and Pre-filled Tax Returns: The Danish and Swedish Approaches”, Information Note, Forum on Tax Administration: Taxpayer Services

e-filing and compliance risk: Evidence from Australian personal income tax deductions Warren
-21-
Subgroup, Centre for Tax Policy and Administration, OECD (http://www.oecd.org/denmark/39948012.pdf )
OECD (2010a) Survey of Trends and Developments in the Use of Electronic Services, OECD, Paris (www.oecd.org/tax/administration/45035933.pdf)
OECD (2010b) Survey of Trends and Developments in the Use of Electronic Services for Taxpayer Service Delivery, OECD Forum on Tax Administration, (March) (Report 1 Survey Report; Report 2 Survey Tabulations) (http://www.oecd.org/ctp/administration/surveyoftrendsanddevelopmentsintheuseofelectronicservicesfortaxpayerservicedelivery.htm )
OECD (2012) Working Smarter in Revenue Administration – Using demand management strategies to meet service delivery goals, OECD, Paris(www.oecd.org/dataoecd/53/8/49428187.pdf )
OECD (2013) Managing Service Demand: A Practical Guide to Help Revenue Bodies Better Meet Taxpayers’ Service Expectations, OECD Publishing, available at: (http://dx.doi.org/10.1787/9789264200821-en )
OECD (2014) Increasing Taxpayers’ Use of Self-service Channels, OECD Publishing, available at: http://dx.doi.org/10.1787/9789264223288-en.
OECD (2015) Tax Administration 2015:Comparative Information on OECD and Other Advanced and Emerging Economies, OECD Publishing, Paris. (http://dx.doi.org/10.1787/tax_admin-2015-en )
Vaillancourt, F.(ed) (2011) Prefilled Personal Income Tax Returns: A Comparative Analysis of Australia, Belgium, California, Québec, and Spain, Fraser Institute Studies in Budget & Tax Policy, Canada. (https://www.fraserinstitute.org/sites/default/files/prefilled-personal-income-tax-returns.pdf )
Warren, N.A. (2014a) ‘Towards a holistic analysis of personal income tax reliefs and their reform’, Australian Tax Forum 29(1):81-106
Warren, N.A. (2014b) ‘A politically viable strategy for limiting personal income tax deductions: The case for a global cap, Australian Tax Forum 29(3):357-389