Embed Size (px)
Citation preview

Discussion PaperCentral Bureau of Statistics, P.B. 8131 Dep, 0033 Oslo 1, Norway
No. 15 15 June 1986
THE ENGINE OF FERTILITY —
INFLUENCED BY INTERBIRTH EMPLOYMENT?
BY
110 AN—MAGRITT JENSEN AND TORE SCRWELER
CONTENTSPage
1. Introduction .......... ........ ...... ................2. Data ..... ......... ..... ...... .......... . ..... 43. Modelling and measuring individual flow-rates
between sociodemographic states ..................... 64. Results and discussion 9
4.1 Transition from the first to the second child ... 94.2 Transition from the second to the third child.... 15
5 . Conclusion .......... ..... ..... ........ ......... 17References .. ..... ...... ....... ........... ......... 21Figures and tables. ....... ..... ........... 25
ABSTRACT
The decline in fertility is often related to the increased laborforce participation among married women. This article discusses the rela-tionship between fertility and employment by using a dynamic methodology oflife-course analysis based on time series data. An important question inthe article is whether the probability of having a child is influenced byemployment. We emphasize the probability of a second birth, however we alsogive some attention to the third birth.
Not to be quoted without permission from author(s). Comments welcome.

1
THE ENGINE OF FERTILITY
- INFIUENCFD BY INTERBIRTH EMPLOYMENT? 1)
By
An-Magritt Jensen and Tore Schweder
1 INTRODUCTION
Since the second World War, Norway, as most industrial countries, has
experienced rather sharp variations in fertility. During the years from
1945 to 1965 the total fertility rate rose from 2.44 to 2.95. This
incrêase plateaued and by 1970 a new trend of decreasing fertility rates
had begun. In 1984 the total fertility rate was 1.66, lower than ever
before.
The decline in fertility coincided with increasing labor force
participation among married women. From 1972 to 1981 the employment rate
increased from 45 to 62 percent. The increase occurred among women with
small children as well as among women with grown-up children. At the same
time two major changes in the marriage pattern evolved: increased
cohabitation without marriage (Brunborg 1979) and increased divorce (Social
Survey 1983).
Other factors which might have been related to the changes in
fertility and employment patterns were the rise in the level of education
(Jensen 1983) and the introduction of modern contraceptives (østby 1983).
The education might have increased the motivation as well the possibilities
for employment, while the modern contraceptives have given the women new
possibilities of controlling their fertility.
1) An earlier version of this paper was published as a working paper at theCenter for Demography and Ecology, University of Wisconsin, Madison (Jensen1985).
We want to thank professor Larry Bumpass, Center for Demography andEcology, for comments on the working paper. We also want to thank professorJan M. Hom, Britta Hoem, Eva Bernhardt and Cecilia Etzler, University ofStockholm for interest and discussions. Finally we want to thank PerSevaldson, director of research, Central Bureau of Statistics, Oslo, forcomments on this article.
Graduate student of statistics, Anne Marit Benterud, University ofOslo, has been in charge of the programming.

2
The purpose of this paper is to analyze the relationship between
fertility and labor force participation in a life-course perspective. Ac-
cording to Elder and Rockwell (1978 1 p.2) a life-course perspective "locates
individuals in age cohorts and thus in historical context". Three elements
are important in a life-course analysis; the cronological age, the social
age and the historical period. In our analysis time (the aging process) is
the dynamic variable, while social age (age at first birth) as well as his-
torical period (first child before a certain calendar year) are defined as
covariates. The relationship between fertility and labor force participati-
on has been a subject of great interest. It seems clear that an increase
in labor' force participation goes along with a drop in fertility in the
western world. However it has been difficult tu settle the causal relati-
onship between the two phenomena (Smith-Lovin and Tickamyer 1978, Hout
1978, Cramer 1980).
Several studies with a life-cycle approach, have given a picture of
the development of the labor force participation before, during and after
the childbearing years. These activities are less separated in time for
recent - cohorts than for older ones. Sorensen (1983) analyzed this qüestion
by comparing her - results to the four employment patterns among ever married
women. The patterns were originally categorized by Elder and Rockwell 10
years earlier: conventional, interrupted, double track and unstable. The
conventional patterb describes the case of women leaving the labor force by
the time of marriage or first childbirth, while the double track pattern is
the one where fertility and employment are not separated in time. She con-
cluded: "... there has been a real decline in the propensity to follow a
conventional pattern. The proportion following a pattern of role speciali-
zation was about the same in the two cohorts, and the double-track pattern
has become more common among the younger cohort" (p. 329).
Bumpass and Sweet (1980) examined patterns of employment for the
three stages of the life cycle: before marriage, between marriage and first
childbirth and between the first and the second childbirth. By comparing
marriage cohorts 1955-59 to marriage cohorts 1965-69, they concluded that
the percent of women employed had increased over time at all three life-
cycle stages. The percent who were working between first and second child-
birth increased from 37 to 51. However, the increase was less clear when
short-time employment was excluded, and by looking at the proportion of
women who had been working at least one year during the birth interval,
they found a decline for the youngest marriage cohorts. An interpretation
of this would be that although there has been a trend towards higher inter-
birth employment, a substantial proportion of this employment seems to have

3
short-term character. The analysis of Sorensen as well as the one of
Bumpass and Sweet are based upon american data.
The cohorts of our study, 1940-59, started their family life during
a period when it was more usual than before to combine childbearing with
employment, approximately from 1960 to 1980. Our point of departure, how-
,ever, will not be to analy7e employment related to fixed stages of the
life-cycle, but to analyze the influence of interbirth employment on the
propensity of having a (next) child. Our approach is to use life table
methods to estimate parameters in a multiple-state hazard model where also
marital status is taken into account, in order to purify the effect of
labor force participation on fertility.
Our general aim has been to improve the understanding of the rather
dramatic socio-demographic development which has taken place in Norway in
the last two decades. We will concentrate upon the interaction of fertili-
ty and employment among married women. However, we also have a secondary
aim of studying fertility and employment as statuses changing over time.
Several studies have emphasized the importance of a dynamic approach to the
analysis of fertility and employment, and an increasing number of studies
using such approaches have recently appeared (among others, Hout 1978,
Cramer 1980, and Moffitt 1984).
Using a hazard model in which the rates are assumed constant over
time segments, we analyze the parity specific fertility rate (intensity of
having a next child) taking into account labor force participation and
marital status at every stage of the life cycle. Background variables like
cohort and education level are also taken into account.
The following questions are addressed:
-- In what way does the labor force participation affect parityspecific fertility?
- What is the effect on the second child fertility of having beenin the labor force without interruption since first birth?
- What are the effects of covariates like level of education andage at first birth on second child fertility, and do women whostarted their reproduction early in our historical period (1960- 1980)have a different fertility rate compared to those whostarted late?
- What is the spacing pattern of the third child compared to thatof the second?
Our main, but tentative, conclusion is that the second child ferti-
lity is roughly the same for women in the labor force as for those outside
it. ' Interbirth employment does not se -ern to cause a drop in fertility. The

4
data therefore do not give support to the hypothesis that the recently ex-
perienced drop on the total fertility rate is caused by an increase in
female employment. On the other hand, we find a clear drop in the probabi-
lity of a second birth among women who have been working without interrup-
tion since the first birth. Our data, however, unfortunately has a number
of shortcomings. For this reason we have to be very cautious when drawing
conclusions.
The causality concept we employ is one which seems appropriate for
the social statistical analysis. Since the time aspect is taken properly
into account by the hazard model, it is, in contrast to ordinary regression
and correlation analysis, possible to make a distinction between cause and
effect, and to conclude from the data which way the causal relationship
goes. However, on a deeper level of analysis, it may be true that the drop
in fertility, even in the second parity fertility, which has been ex-
perienced since the 1950's, is in part caused by increased female employ-
ment. It is in fact reasonable to believe that the improved opportunities
for female employment and the fact that such employment was getting more
common, did affect the childbearing of all women, also when they were
outside the labor force. This question of causal relationship is a complex
one. In our view it makes sense to pose the question at the level of a
social statistical inquiry such as ours. And since we regard our paper as
exploratory, both with respect to the methodology and to the. substance, we
find it appropriate to express our finding of no substantial difference in
second parity fertility rate between female in and outside the labor force
as a tentative conclusion of no causal effect of labor force participation
on second parity fertility. We do this in the hope that it will provoke an
interest both in the argument and in the matter.
2 DATA
The survey "Women and Work" gives retrospective information about
childbirths, marital status and labor force participation of women born
from 1915 to 1959. We concentrate upon the approximately 800 women born
from 1940 to 1959.
Each woman was asked about her childbirths and current marital
status. She was asked about the month and year when she moved together with
a man for the first time, whether this was a consensual union or a marri-

5
age, and for month and year of every change in this status. For our purpose
we have divided the women into two groups, based upon whether or not they
live together with -a man. For the sake of brevity, we will use marriage or
cohabitation as synonyms for all women living together with a man. Not
living together with a man would either be a result of never having started
marriage or a result of divorce, or having ended a consensual cohabitation.
Bumpass (1984) has shown that abour two-fifths of children in the U.S. born
to married mothers experience a disruption of that marriage before they
reach age 16. We do not have the same information about norwegian children,
but divorces is common enough to convince us of the importance to control
for marital status of the mother. In this paper the marital status will
mainly be treated as a control variable, although it is, as labor force
participation and the number of children, an endogenous variable in the
model.
The information of labor force participation do, however, have some
shortcomings. We have information about the length of the time in the
labor force between the first and the second child, but we do not have in-
formation regarding the starting or leaving points of this employment,
which is ideally required by hazard models. Since employment rates increase
with the age of the youngest child, we have placed the labor force partici-
pation close to the next childbirth. This will bias the results, since
every woman who has worked at all during ehat interval will contribute to
the flow-rates of working women by the transition to a next childbirth. We
will thus have an overestimation of childbirths among workers. However
this decision is apparently the best alternative available.
Another problem is created for the open interval, for those who
have not had their second (or third) childbirth. The survey asked whether
or not the woman was working immediately after the last childbirth,but
this was a yes or no question and we have no information regarding when
work was started after the last. childbirth. We have calculated time as emp-
loyed after last child by combining information of labor force participa-
tion before the actual birth, immediatly after, at the time of the inter-
view and total length of time in employment.
A final aspect of the employment variable, is the lack of in-
formation of full-time and part-time work. As a consequence, a women
having limited employment, as a part time job of a couple of hours a week
and for a few months (the minimum to be reported was employment which
lasted more than 3 months) may in principle be sufficient to regard her as
being in the work state for the appropriate time period, which extends to
the time at her second child if she ever has any.

6
The role of education as an activity before and between the child-
births also needs to be mentioned. The "Women and Work" survey contains in-
formation on when women finished school only for the period from 1970 to
1980. As a consequence we were unfortunately forced to use level of educa-
tion as a static variable. Since level of education is developing in close
connection with fertility, a more satisfactory analysis should have inclu-
ded level of education as one of the endogenous dynamic variables. Women,
who are still pursuing an education are now formally represented as being
in the non-working state. Since such women have a low fertility, we might
thus have an underestimation of childbirths among non-workers.
These data problems make it difficult to construct a measure of
labor force participation, and the possibilities for error are considerab-
le. But the survey does represent our only source of reasonable data, and
since our aim was to explore the methodology as well as to get new demo-
s graphic insights, we accepted these limitations. 'It might be a slight
comfort that we share our data problems with several studies using a
dynamic approach of fertility and labor force participation (Hout 1978).
Fertility, cohabitation, and labor force participation constitute
the time dependent endogenous variables in our study. Age at first birth,
level of education at the time of interview, historical period, and whether
the employment has been uninterrupted, are the main background variables
for the second child fertility. Age at second birth, level of education,
and distance (in months) between the first and the second birth are the
background variables for the third child fertility.
3 MODELLING AND MEASURING INDIVIDUAL TRANSISION INTENSITIES BETWEEN
SOCIODEMOGRAPHIC STATES
Much attention has been given to the use of life-table methods in
various fields within demography. Our approach is based 'upon a hierarchi-
cal semi-Markovian setup, as described in Finnis and Hoem (1980), Hoem and
Selmer (1984), and Rodriguez et al. (1984). One difference in the methodo-
logy between these studies and the present one is the use of several time
dependent endogenous variables. Studies similar to ours are reported by
Menken et al. (1981), and Montgomery and Kisker (1985).
We consider each woman to be characterized by two different types

7
of variables. The endogenous variables are those which define her position
in the state space. These are time dependent variables. The second set of
variables are the background variables which determine the rate at which
the woman moves about in the state space. We will use the term covariates
for these background variables. The primary state variables are dynamic,
they evolve over time, while the covariates are static in the sense that
they are not affected by the state dynamic.
In Figure 1 the state space from the first to the second child is
represented. This space of 8 states is three-dimensional since it is
defined by the three time-dependent variables: number of children, cohabi-
tation or marriage, and labor force participation.
The time from first child was divided into 16 segments as indicated
in Figure 2, and the flow-rate is assumed constant within each segment. For
each segment of duration since first birth, an occurrence/exposure birth
rate has been computed, which is the sum of the number of children born
divided by the sum of exposure time. We present the intensity rates per
1000 women per unit time (months).
For each fertility transition, that is, for each horizontal arrow
in our state space diagram, a flow-rate (a step function with one step for
each of the 16 duration segments) was calculated. This gives us a profile
of the transition intensity as a function of duration time. The flow-rate
may be interpreted segment by segment as thesapproximate conditional proba-
bility of having a child within one unit of time, given that the woman has
not already had her second childbirth.
The state space for transitions from second to the third child
could, in principle, be a direct extention of the state space in Figure 1.
However, due to data problems discussed above, only the transition profiles
from the first to the second childbirth will be given separately for
workers and non-workers.
To explain the rationale of our model consider a woman who has her
first child. By the birth of the first child the woman enters one of the
four "boxes" on the left side in Figure 1, dependent on her status at the
time of the first birth. The alternative states, from the upper corner and
downwards are: Employed and married, employed and not married, nut-employed
and married and not-employed and not married. All of them are one-child
"boxes". As time goes by our woman will possibly move to some other state,
and this transition may later be followed by other transitions. At any
time counted from the time she had her first child she will find herself ina state from which new transitions are possible. The'transition intensiti-
es along the outgoing arrows from that state may be interpreted as the

strength of forces driving her to move in their direction. The probability
interpretation of the intensity r(t) is that with probability approximately
r(t)*h the women will make a transition along the arrow before a small
amount of time, h, has elapsed given that she was in the state from which
the arrow was pointing at time t. At the population level the intensity
may be interpreted as a measure of the flow of individuals along the arrow
relative to the number of individuals being at risk of this transition. In
this paper we will interchangeably use the term flow-rate and intensity and
we concentrate on the horizontal arrows in the state space, which give the
fertility transitions.
The flow-rate interpretation is of course fundamental to the occur-
rence-exposure rate method of estimation, which we will use.
We are assuming that the woman is characterized by her present
state and her covariates. There is thus no "memory" build into the system
by which her previous history plays a role in addition to the covariates
and the present state. If we were interested say in the effect of changes
in marital status on the flow-rates toward a next child, however, this
change could be defined as a history dependent covariate.
Since we are working with retrospective data our system is closed
and there is no need to equip the various states with unspecified exit
arrows for death, emigration or other occurences. The methodology we are
employing, however, is most appropriately designed for prospective studies
in which of course the system must be open.
As explaind above, our parity specific fertility rates are assumed
to be constant over consecutive segments. The covariates, which are all
categorical, are assumed to influence the fertility rate by proportionality
parameters. The fertility rate at each state of labor force participation
and marital status is thus fully parametrized, with the number of parame-
ters equal to the number of segments (16) plus the number of parameters in
the covariate structure. For example, the total number of parameters for
each of the second child fertility rates are 16 + 2 + 2 20 if the cova-
riates are age at first birth (3 levels) and education (3 levels) and if
there is no interaction between age and education.
Since the likelihood for each separate transition rate is propor-
tional to the Poisson likelihood with a log linear structure in the parame-
ters, and with occurrence-exposure rates as sufficient statistics (Kalb-
fleish and Prentice 1980, see also Whitehead 1980) the method of maximum
likelihood is well suited for estimating the parameters of the model. We
calculated the occurrence and exposure pröbabilities in SPSS and fed them
into GLIM (Baker and Neider 1978) in which the models were fitted and eva-

9
luated. Unfortunately, the dati handling capacities of GLIM are limited,
which caused us sume extra work, but GLIM is well suited at maximum likeli-
hood fitting of transformed linear models. Technically our approach is
almost identical to that of Rodriguez et al (1984).
4 RESULTS AND DISCUSSION
4.1 Transition from the first to the second child
We may now have a look at the transition rates from the first to
the second child for married women, given in figure 2. Let us call these
the second child fertility rates. As we see, the second child fertility
peaks at 2.5 - 3 years after the first birth, and it levels out at a non
negligible level after 5 - 6 . years.
Figure 3 displays the flow-rates among married women who are
working and those who are not. In interpreting Figure 3, it is important
to be aware of the fact that the females . may change their status at the
segments before childbirth. The figure describes the fertility rate of
women in the working/non-working state at a given duration after their
first birth, disregarding their transition history since first birth. The
figure provides a comparison between those women who were working, and
those who were not working at duration, t. One should also remember that
because we were lacking specific information, the time spent at work
between first and second child was assumed to occur just before the second
child was born.
The main impression from Figure 3 is that second child fertility is
roughly the same for working and non-working women. A closer look at the
figure, however, suggests that the workers' fertility is somewhat more
peaked 3 years after the first child, while the non-workers' fertility is
marginally more spread out through the interval, and a little higher at the
earlier segments. One possible interpretation of this might be that there
seems to be a higher share of planned childbirths among workers. But the
main conclusion is that second child fertility does not reveal clear diffe
rences between workers and non-workers neither in the level nor in the
form. This is an unexpected result.
On the other hand, we get a considerable difference between the two

10
groups of women when we examine mean birth intervals in months. Among
women who have at least two children, the oldest of which was at least 5,
the mean interval is 41.4 months for workers compared to 31.7 months for
non-workers. This difference is also noted in other studies.
Bhrolchiin (1983) has analyzed the consequences of employment on
the spacing of children. She used the stages from marriage to the first
child and then the stages between each successive birth until the fourth.
Ellingsmter and Iversen (1984) have analy7ed three phases: before marriage,
from the marriage to the first child and between the first and the second
child. The last mentioned analysis is based upon the same data as ours.
They reach the common conclusion that women who have been working between
childbirths have longer birth intervals than women who have not.
Bhrolchiin (1984) concluded from her study: "An important point to
note is.the agreement throughout all data sets considered, that inter-birth
410 working is associated with substantially longer interval length" (p. 57).
This is taken as evidence of two different kinds of strategies of child-..birth and work. The first strategy is to have children in close success-
ion, to avoid interbirth work, and to begin work soon after the birth of
the second child. The second strategy is to have large gaps between births
of successive children, and to work between births as well as after the
second birth. The result is "...two employment effects on spacing - posi-
tive and'negative" (p. 57).
There are several problems connected with this use of average in-
terval length. The main problem is the confusion of cause and effect. So
far, investigations of female labor force participation seem to agree on
the fact that the age of youngest child has a considerable impact on emp-
loyment. It is reasonable to believe that this mechanism functions for
one-child mothers as well as for mothers of higher parity. This means that
the probability of being employed increases with the age of the first
child. Women who happen to have long birth intervals will therefore more
often be in the ,labor force than those who happen to have their second
child soon after the first. Longer birth intervals give a higher probabili-
ty of being employed, and this does not of course imply that low fertility
is caused by employment.
Both the study of Bhrolchiin and the study of EllingsateT, and
Iversen analyze labor force participation in relation to the average length
of birth intervals among women who have closed the interval. As both
studies deal with changes in historical development this is not a problem
for the older women who have finished their childbearing. However for the
most recent cohorts this approach will result in an additional problem of

.11
selectivity, since those women who have had an early first birth and a
rapid next birth, have a greater probability of being represented within
each birth interval than the "slower" childbearers. This problem of selec-
tivity is severe when we focus on employment because of the interaction
between age when entering motherhood, and education as shown in several
studies (Rindfuss, Rumpass and StAehn 1980; Rindfuss and StAuhn 1983;
Kiernan and Diamond 1983; Marini 1984) and an interaction between employ-
ment and level of education (Bowen and Finegan 1969; Sweet 1973).
The difference between life table methods and the method of average
birth intervals is that, in the first case, all women in the survey who
have their first . child contribute to the second child fertility estimate
until they have their second childbirth or are censored by time of inter-
view, while the average is calculated among women who have at least two
children. In addition, and this is the most important point, confusion of
cause and effect is less likely with the life table method, since the life
table method takes the time aspect properly into account.
The hazard model revealed a different picture of the relationship
between employment and fertility than did comparisons of the average number
of months between births. Figure 3 seems to imply that there are no impor-
tant differences in the fertility between working and not working women.
However, at this stage we are not quite confident of such an interpretation•
because of the severe shortcomings of our data with respect to the regis-
tration of labor force participation and because women under education are
included in the group of nun-workers.
Let us turn to the effects of the covariates. In addition to age
at first childbirth and level of education, we also introduce a covariate
of historical period. We defined this covariate in order to get a measure
of the changes in the historical period in which the women reached adult-
hood, during the period from 1960 to 1980. Since this was a period of con-
siderable historical change in fertility as well as in employment, we have
chosen a covariate which give us a measure of the impact of the historical
period independently of the impact of our other variables. Our question was
whether the women who started their reproduction before a specified year
would have a different level of fertility to those who started after this
year. We wanted a division of the whole period which more or less would
split our sample in half. As discussed briefly in the introduction, several
changes took place at the end of 1960s, and the beginning of the 1970s,
which could reasonably be related to a change in the fertility. To see
whether an historical shift in fertility did take place around 1970, re-
gardless of the age of the women, we introduced a covariate which indicated

12
whether her first child was born before 1968. The year 1968 was chosen for
its symbolic value including political commitment and the foundation of
several feminist organizations. Although the proportion of young people who
actually took part in these movements was limited, the year is often regar-
ded as an historical watershed for young people reaching adulthood in that
period, and for many women of higher age.
Furthermore we defined a covariate measuring the effect of having
been employed without interruption since first birth. By this cova-
riate we wanted to get an impression of the impact of having an extensive
work commitment in the childbearing years. The effects for all covariates
are presented separately for workers and non-workers.
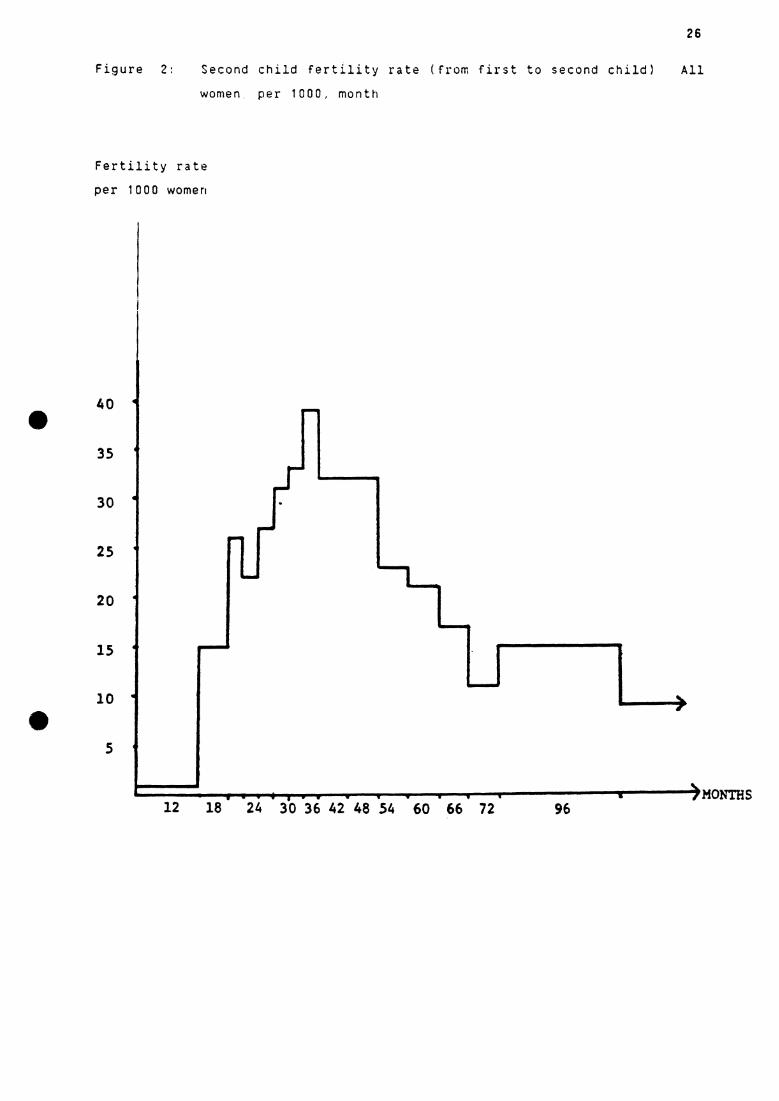
In Table 1 we present the gain in fit by introducing covariates in
our multiplicative model. The reference model is the model to which we es-
timate the effect of introducing a covariate or a set of covariates. By in-
!! troducing the covariate age at first birth for non-working women, the gain
in fit was 5.8 units of deviance, 'which is to be compared to the chi square
distribution at 2 degrees of freedom. The rationale for this procedure is
that since age his 3 categories, we have introduced 2 new parameters to the
model: the ratio of the fertility between medium aged mothers and young
ones and the ratio between old mothers and young ones. The young mothers
are serving as a reference group. Minus - 2 - • log - likelohood - ratio
between this model and the null model is 5.8 (the deviance is not precisely
equal to the - 2 - log - likelihood ratio, see Baker and Nelder (1978)) ,
which is to be compared to the chi square distribution with the number of
degrees of freedom equal to the number of new parameters introduced in the
model. A large increase in the fit does of course indicate that the cova-
riate introduced helps to explain the variation in the data. From Table 1
it is seen that age alone or education alone poorly explains the variation.
The simple model of adding age and education to the pure duration model is
the most satisfactory model involving these two covariates only, but a de-
viance of 9.6 for non-workers and 7.5 for workers at 4 degrees of freedom
is hardly impressive. When the binary historical covariate 1968 was added
to the model with age and education and duration we obtained an increased
fit of 32.3 units of deviance at 1 degree of freedom for non-workers, while
there is almost no gain in fit by introducing this covariate to workers
(2.4 units of deviance at 1 degree of freedom). The binary covariate; emp-
loyment without interruption, shows strong explanatory power (30.8 units of
deviance at 1 degree of freedom).
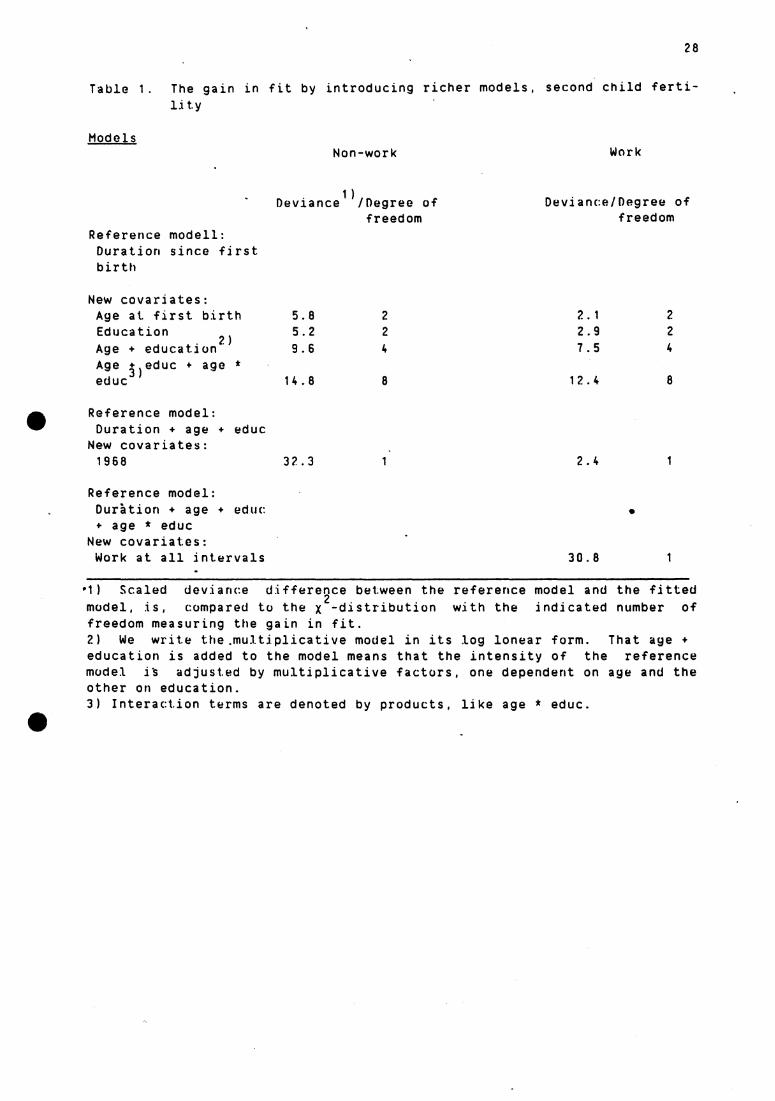
. Turning now to Table 2, we here present our adjustment estimatesfor workers and non-workers, the adjustment being the factor by which the

13
fertiltiy rate of the reference group is to be multiplied. The first cate-
gory is serving as a reference for each covariate, and this is indicated by
1.00 in the estimate column. For the model which includes no interactions,
the multiplicative effects may be combined simply by multiplication. As an
example consider a women who is in the labor force, who was in the medium
age group at her first birth, and who has more than twelve years of educa -
tion. A woman who started the childbearing after 1968 will have a second
child fertility rate which is about 0.88 * 1.45 * 0.62 = 0.79 as large as a
reference women who was in the youngest age group when she had her first
child, who has less than 10 years of schooling and had her first child
before 1968. We have also computed confidence intervals for the multiplica-
tive effects. These are unsymmetric because they are obtained by taking the
anti-log of the appropriate symmmetric confidence intervals of the log-
linear parameters.
In Table 2 we find that increasing age at first birth has a negati-
ve impact on second child fertility for workers only. The effect of the va-
riable as a whole is not statistically significant, however, neither for
'workers nor for non-workers.a,
The effects of education should be given special attention. Having
an educational level of more than 12 years seems to have a negative effect
on second child fertility rates among non-working women, while the effect
is positive for the workers. Although nearly statistically significant at
the 10 per cent level, the effect should not be overemphasized. This
effect has, however, also turned up in a study of cumulative number of
children and employment at the time of the interview (Jensen 1981). We see
from Table 1 that education as well as age at first birth has very little
effect on second child fertility.
We also find that women, who had not yet had their first child by
1968, had a smaller second child fertility than those who already had
started childbearing by this date. This applies both to workers and non-
workers, but the impact is much stronger among the non-workers, and only
significant for them. An interpretation of this could be that the potenti-
al for a decline was larger among the non-workers since the workers already
were adjusted to a relatively low level of fertility. If this interpreta-
tion is reasonable, it could also shed light on the small difference in the
second child fertility among the workers and non-workers. It appears that
the historical changes over the period studied affected non-workers to a
greater extent than workers. Simultaneously, of course, there was an inc-
rease in the proportion of women who worked.
From our data we see no important differences in the second child

1 4
fertility between women who are working and those who are not. The overall
probability of having a second child as a worker is 89 percent, compared to
86 percent among the non-workers. Both calculations are based upon data
for married women 8 years after first childbirth. In order to get a picture
of the impact of extensive work commitment during this period, we defined
work throughout the period (without interruption) as a covariate the refe-
rence group; workers. By this definition a much lower second child fertili-
ty for women who have been employed without interruption since first birth
is found. The probability of having a second child among these women was 37
percent lower than the figure for second child fertility of all workers
(married women 8 years after first child birth). All percentages are based
upon the reference group, which is lowest age at first birth and lowest
level of education. The effect of this covariate is strongly negative and
significant.
In table 3 we have calculated the probability of a second child
among all women with interbirth employment and who have worked through the
interval without interruption. Our calculations are based upon a model
with interaction between age at first birth and education (Duration + age +
education + age * education + work whithout interryption) at a duration of
8 years after first birth.
We find that the level of second birth is clearly lowered by work
without interruption for the majority of groups by age at at first birth
and education. Among the workers without interruption the number of women
is relatively low in the two groups; lowest age at first birth and highest
level of education and highest age at first birth and lowest level of edu-
cation,which makes the results for these two groups relatively uncertain.
It is interesting to note that work in general, as well as work
without interruption does affect the second child fertility to a lesser
degree among women at the highest level of education than other women. Most
clearly do we find a negative effect of work without interruption for women
at a medium level of education.
These results suggest that limited employment has little impact on
fertility, while extensive employment has considerable impact. Women with
an uninterrupted interbirth employment are still a minority. In our sample48 percent of the two child women had not been working during the interval
between the first and second child. Thirty-eight percent had been working
some of the time while only 16 percent had been working all of the time.

15
4.2 Transition from the second to the third child
•••
While most women in Norway have two children, we find a considerab-
le drop in the proportion of women who have a third child. Figure 4 shows
that 81 percent of the women have a second child within eight years after
their first birth, while 39 percent have a third child within another eight
years. Both percentages are based upon the reference group of women with
low age at first birth and low level of education. This means that of all
women who have entered motherhood in our sample only 40 percent will have
three children. The curve for the second childbirth is also steeper than
that of third childbirth. By looking at the third child fertility, we see
that the interval distribution between first and second child and between
second and third child differs markedly (figure 2 and figure 5). While the
second child fertility was strongly peaked between a year and a half to
about three and a half years the third child fertility seems to be rather
constant from 1 1/2 years after the second child was born. The "3 year
norm" seems to have been active for the timing of the second child. No
similar pattern of the timing of the third child seems to be working. This
result is in accordance with the findings of Rodriguez et al (1984) who
analyzed births, parity 3 to 8. They concluded: "... our results suggest a
distinct lack of pattern in cessation of childbearig by birth order (or in
timing for that matter) at least beyond the second birth" (p 26).
Separate duration profiles for the third child fertility rates for
workers and non-workers are not presented. The low number of women who had
three or more children did not allow separate estimation of third child
fertility rates for the two groups. However, assuming a common duration
profile, we have fitted multiplicative models, and we will present the
effect of the covariates separately for the two groups, as an indication of
the differences between those who have had no work after the second child
and those who have had some.
Table 4 shows that the covariate distance between the first to the
second child has the strongest effect on third child fertility among
workers (18.6 units of deviance, 1 degree of freedom), and that also it has
a strong effect among non-workers (11.5 units of deviance, 1 degree of
freedom). We also see that age at second child and education have a strong
effect, but only among non-workers.
Table 5 shows a negative and significant effect of education on
third birth transition rates among non-workers. The effect is very strong
for the highest level of education, indicating a level of the third child

16
fertility about 40 percent of that among women at low education. The posi-
tive effect of education, which appeared in Table 2 among the workers does
also emerge in Table 5. In another article we have showed that level of
education has a significant and clearly negative effect on the entrance to
motherhood (Jensen 1985). This leads us to a conclusion that education has
a negative effect on first child fertility, but well educated women who
have entered motherhood do not have a second or third child fertility which
is lower than less educated women. This finding is in accordance with con-
clusions drawn by other researchers (Rindfuss et al 1980, Rodriguez et al
1984).
Women who had not been working and were at age 25 or more at their
second childbirth had a probability of a third childbirth which was less
than 40 percent of the fertility for women at ages less than 21. For the
workers the corresponding figure was about 50 percent,' although the age va-
riable is not significant for this group.
The delay of the second birth has a negative and significant impact
on the third child fertility, both for workers and for non-workers. The
probability of a third child is less than 70 percent for the non-workers
and less than 30 percent for the . workers if the time between the first two
children is more than 30 months relative to those who have less than 30
months between the children. Also this result is supported by the analysis
of Rodriguez et al (1984). They suggest "the reproductive process as an
engine with its own inbuilt momentum" and in which previous birth intervals
are strong factors when giving the probability of a next birth: "There is a
strong correlation between behaviour in successive intervals, probably ref-
lecting variations in fecundity, coital . frequency, contraceptive use and
efficacy, and breast feeding propensity, with those having long previous
intervals being less 'likely to progress to a further birth." (p.27). A
discussion is going on to which degree the effect of the length of previous
intervals may be explained by unobservables (Heckman et al 1985 ), however,
here we shall be satisfied by the main conclusion of the impact of length
of birth interval on fertility without the further examinations' of these
processes. In our view this may imply that the pattern of fertility may be
less dependent upon traditional background factors than has previously been
assumed. A separation between higher and lower fertility women has not
been possible from this study of employment, age at first childbirth and
level of education. However, the last observation, that previous spacings
has such a large effect on third child fertility, may indicate that there
are important individual differences with respect to fertility. These dif-
ferences seems to go across and not parallel to background variables.

5 CONCLUSION
In this paper we have taken a dynamic approach to the study of fer-
tility and employment over the life course. We have employed multistate
hazard models, and we have estimated parity specific fertility rates of
step function form and with proportionality between groups by the method of
maximum likelihood. The two dynamic variables: labor force participation
and marital status are modeled into the state space and are regarded as en-
dogenous. Other grouped background variables such as education, age at
first birth, etc. are treated as exogenous. Women who have not had a
second (or third) birth are censored by the time of interview.
The results are discussed in two sections: we separately consider.
the intervals from the first to the second birth, and from the second to
the third birth. The main emphasis is placed upon a discussion of the
transition from the first to the second child, but we also devote some
space to analyze the differences between this birth interval and the subse-
quent third child fertility.
We found, unexpectedly, no significant difference in second child
fertility by employment. In concluding we wish to discuss three aspects of
this finding.
1) It may partly be a result of shortcomings of our data
2) It may be a resul i of certain aspects of the methodology
3) It may reflect a part of "Norwegian reality".
Data: as explained in section 2 there are several shortcomings of our data,
which by our method will lead to an overestimation of the second child fer-
tility for women in the labor force, and an underestimaton for those
outside the labor force and not under education. It is hard to asses the
magnitude of these biases, but they are probably not strong enough to
destroy the tentative conclusion.
Methodology: the next question is whether the result partly is an artefact
of the methodology we have used. In contrast to the method of comparing
the mean birth interval for two child mothers who had/had not worked
between the births, which may be called the backward method, o'ur forward
17

18
method based on the hazard concept is taking the dynamic aspect of time
more properly into consideration. The backward method will actually lead to
severe selection biases, and the results obtained by this method are hard
to interprete.
Two different definitions of employment are used in the backward
and the forward methodology. By the backward method the women are parti-
tioned into workers and non-workers according to their status at their
second childbirth. Women with only one birth are not taken into account.
The partition of workers and non-workers is regarded as fixed. As women
tend to join the work force as time goes by since their first childbirth,
the non-workers group is in a sense purified by the backward method. In
the forward method we do not operate with a fixed dichotomy between workers
and non-workers. The fertility rate is estimated at each point in time
since the first child birth, and this is done separately for those who were
inside and outside the workforce at that time. By the forward method the
woman is allowed to change her work status. This means that the non-workers
group at a given time consist of women who remain at home for the time
being, but who may join the labor force later on. Early after the first
birth we may say that the workers group consists only of women who were
employed through most of the time since the first birth. Since only 14
percent of the women in the sample worked throughout the interval, the oc-
currences and exposures of non-workers are based ðn 86 percent of the
sample for the early intervals after the first birth.
As we see it is difficult to draw comparisons between results based
upon a grouping of the women by the backward method and the grouping of the
women based on the forward method. Although our results are biased by li-
mitations of the data, we think the forward method of studying fertility
and employment gives insights which are difficult to obtain by the backward
methodology.
"Norwegian reality": Do we then have supporting evidence that the fertility
rate actually remained pretty much the same between workers and non-workers
in Norway since the late 1950's?
A norwegian fertility survey, conducted in 1977, showed that most
women agreed to a norm of two, and to a lesser degree, three children.
Above 50 percent of the women in the childbearing years (age 20-34) answe-
red that the ideal number of children was two. (Noack and Østby 1981).Among women aged 30-34 the distribution of the number of children was as
follows: 11 percent had no child, 14 percent, had one while 75 percent hadtwo or more children (Noack and Østby 1981, p. 181).

19
In order to understand the results of this analysis,another aspect
to take into consideration is that the labor force participation at this
stage of life still is relatively low in Norway. In 1972 only 35 percent of
these mothers were employed, while the figures were about 50 percent (all
women whose youngest child was less that 7 years) ten years later (Social
Survey 1983). Thise are quite low figures. Most of the employed women with
small children worked part-time,which indicates that there is a clear
future potencial for more labor force participation among women who are not
employed between the two births at the time of this survey.
It is probable that the non-workers group consists of women who
give preferences to childbearing on behalf of employment, but it is also
probable that a considerable group of these women adjust their fertility
behavior to future labor force participation. An interpretation of the
effect of the historical variable 1968, may give support to this argument.
We found that women who had their first child after 1968 had a considerab-
ly lower probability of a second child compared to women who had their
first child before 1968. This effect was much stronger among the non-
workers compared to the workers. We belive that the low frequency of inter-
birth employment indicates that a considerable part of these women are in-
fluenced by the general trend in society towards higher labor force parti-
cipation and lower fertility, but they have other preferences than inter-
birth employment. It is also probable that women who are still studying
constitutes a greater part of the non-working women who had their first
birth after 1968, than among the women who started birthgiving earlier.
In general there is little variation in the frequency of having a
second child left to be explained by employment. Our results indicate that
most of the variation in the second child fertility is simply explained by110 the passing of time. It would seem that women in Norway have their second
child pretty much independent of whether they have been employed or not
after the first birth. This finding however, is radically altered when we
take into consideration the extent of employment. While we do not have any
significant effect from labor force participation in general, the effect is
very strong and negative for those women who were employed without inter-
ruption after the first birth. In this case we also escape the methodologi-
cal problems of making choices where to place periods of employment.
One conclusion from this study is that it has shown the importance of
including a measure for the extent of the labor force participation,
instead of treating this as a "yes" or "no" variable. An interesting ques-
tion is then, how much employment is "needed" to have this negative effect
on fertility? According to this we find it important for future research

20
to make distinctions in the measurement of employment effects on fertility.
Our analysis indicates that employment in a gener.al term is not necessarily
an activity which competes with childbearing, while extensive employment
does have a clear effect of reduced fertility. Still the majority of nor-
wegian women do have at least two children in spite of difficulties in com-
bining 'work and small children. Only the minority of women with the most
extensive work commitment do not fulfill this norm, which seems to be wide-
spread throughout our society.

21
REFERENCES
Baker, R.3. and Neider, J.A. (1978): The GLIM system. Release 3, Oxford:
Numerical Algoriths Group.
° Bowen, W.G., and Finegan, T.A. (1969): The Economics of Labor Force
Participation. Princeton, N.J., Princeton University Press.
Brunborg, H. (1979): Cohabitation without marriage in Norway. Article 116,
Central Bureau of Statistics, Norway.
Brolchiin, M.N. (1983): Birth spacing and women's work: Some British
evidence. Centre for Population Studies, Research Paper no. 83-3,
University of London.
Bhrolchiin, M.N. (1984): Paid work and the tempo of childbearing: Longi-
tudinal evidence. Centre for Population Studies, Research Paper
No. 84-3, University of London.a
Bumpass, L. and J. Sweet (1980): Patterns of employment before and after
childbirth. Washington, DC: National Centre for Health Statistics.
Bumpass, L. (1984): Children and marital disruption: A replication and
update. Demography, Vol. 21, No. 1.
Cramer, J. (1980): Fertility and female employment: Problems of Causal
Direction. American Sociological Review. Vol. 45, No. 2.
Elder, G.H. and R.C. Rockwell (1979): The life-course and human
development: An ecological perspective. International Journal of ,
Behavioral Development. no. 2.
Ellingsater, A.L. and G. Iversen (1984): Changes in women's employment
Patterns. Samfunnsøkonomiske Studier, No. 55, Central Bureau of
Statistics, Norwily.
Finnis, F. and J.M. Huem (1980): Starting age and subsequent birth
intervals in cohabitational unions in current Danish cohorts, 1975.
Demography, Vol. 17, No. 3.

22
Heckman, J.J., V.J. Hotz and J.R. Walker (1§85): New Evidence on the timing
and spacing of births. American Economic Review, Vol. 75, No. 2.
Hoem, J.M. and R. Selmer (1984): The negligible influence of premarital
cohabitation on marital fertility in current Danish cohorts, 1975.
Demography, Vol. 21, No. 2
Hout, M. (1978): The determinants of material fertility in the United
States, 1968-1970: Inferences from a Dynamic Model. Demography,
Vol 15, No. 2.
Jensen, A.M. (1981): Number of children and female employment. Article
132, Central Bureau of Statistics, Norway.
!II Jensen, A.M. (1983): Working mothers - fewer children? About changes innumber of children, education and employment. Article 147, Central
Bureau of Statistics, Norway.
Jensen, A.M. (1985): Another child? A hazard model -for employment effects
on transitions from zero parity to the third birth. COE Working
Paper 85-5, University of Wisconsin, Madispn.
Kalbfleish, J.D. and R.L. Prentice (1980): The statistical analysis of ,
failure time data. New York, Wiley.
Kiernan, K.E. and I. Diamond (1983): The age at which childbearing starts -
a longitudinal study. Population Studies, Vol. 37.
Marini, M.M. (1984): Women's educational attainment and the timing of entry
into parenthood. American Sociological Review, Vol. 49.
Menken, J., J. Trussel, D. Stempel and O. Babakol (1981): Proportional
hazards life table models: An illustrative analysis of
socio-demographic influences on marriage dissolution in the United
States. Demography, Vol. 18, No. 2.
Mofitt, R. (1984): Profiles of fertility, labor supply and wages of
married women: A complete life-cycle model. Review of Economic
Studies,

23
Montgomery, M.R. and E.E. Kisker (1985): Parity and employment transitions
in Sweden and Malaysia: A comparison using multiple-state hazard
models. ?aper at PAA annual meeting. Boston.
Noack, T. and L. Østby (1981): Fertility among norwegian women. Results
from the Fertility Survey 1977, Samfunnsøkonomiske studier, No.
49, Central Burau of Statistics, Norway.
Noack, T. and E. Østby (1984): Childless or childfree? A descriptive
study of sterilisation, infecundity and intentional childlessness.
Scandinavian Population Studies, Vol. 6, No. 2.
østby, L. (1983): The use of contraceptives in Norway. Tidsskrift for den
norske lageforening, No. 26.
Rindfuss, R.R., L. Bumpass and C. St. John (1980): Education and
fertility: Implications for the roles women occupy. American
Sociological Review, 45.
Rindfuss, R.R. and C. St. John (1983): Social determinants of age at first
birth. Journal of Marriage and the Family, Aug.
Rodriquez, G., J. Hobcraft, J. McDonald, J Menken and J. Trussel (1984): A
Comparative Analysis of Determinants of Birth Intervals.
Comparative Studies, World Fertility Survey, No. 30.
Smith-Lovin, L. and A.R. Tickamyer (1978): Labor force participation,
fertility behavior, and sex role attitudes. American Sociological
Review, Vol. 43.
Social Survey (1983): Statistical Analysis No. 51, Central Bureau of
Statistics, Norway.
Sweet, J.A. (1973): Women in the Labor Force. New York. Seminar Press.
Sorensen, A. (1983): Women's employment patterns after marriage. Journal
of Marriage and the Family, May.

24
Whitehead, J. (1980 ): Fitting Cox's regression model to survival data using
GLIM. Appl. Statist. 29, pp 268-75.
•
•

11
Not imarried •Married
I Not 'married,
Married
..1A
Notemployed
Two children
Not married,'
Married
vrNot married,
Married
One child
Employed
Figure 1: Model for transition intensity from 1 child to 2 children
Note to figure 1: The horizontal unbroken arrows indicate thetransitions from the first.to the second child, which are analyzed inthis article. The vertical, broken i arrows indicate the transitionsfrom not employed to employed. The figure does not have any arrowfrom employed to not employed, since our data only had duration andnot the exact time of interbirth employment. We are assuming thatemployment, if any immidiately preceeded the second birth. Theremaining broken arrows indicate the transitions in marital status.Our calculations are based upon those women who are in the "boxes" ofmarried women at each time-unit.
25
•
26
Figure 2: Second child fertility rate (from first to second child) All
women per 1000, month
Fertility rate
per 1000 women
40•
35
30
25
20
15
10
5
12 18 24 30 36 42 48 54 60 66 72
96)Moms

27
Figure 3: Second child fertility rate, workers and non-workers. Marr:cd
women, per 1000, month
c'erti1 4 t;pPr 1000 women
55
50
45
40
35
30
25
20
15
10
5
4•11 1111 •
.11.011.111.111111... Non-workers
III.11611611611111.41116116111Lialialli
12 18 24 30 36 42 48 54 60 66 7221 27 33
96 MONTHS
28
Table 1. The gain in fit by introducing richer models, second child ferti-lity
Models Non-work Work
Reference modell:Duration since firstbirth
Deviance1)/Degree offreedom
Deviance/Degree offreedom
New covariates:Age at first birth 5.8 2 2.1 2Education
?)5.2 2 2.9 2
Age + education9.6 4 7.5 4Age +
)educ + age *
educ3
14.8 8 12.4 8
Reference model:Duration + age + educ
New covariates:1968 32.3 1 2.4 1
Reference model:Duràtion + age + educ+ age * educ
New covariates:Work at all intervals 30.8 1
•
.1) Scaled deviance differe9ce between the reference model and the fittedmodel, is, compared to the -distribution with the indicated number offreedom measuring the gain in fit.2) We write the.multiplicative model in its log lonear form. That age +education is added to the model means that the intensity of the referencemodel it adjusted by multiplicative factors, one dependent on age and theother on education.3) Interaction terms are denoted by products, like age * educ.
e
29
Table 2. Multiplicative effects of the covariates on fertility from firstto second child. Married women
Covariate
Non-work Work
Age at 1. birth
Less than 21 years'21-25 yearsMore than 25 years
Estimate1)
1.001.290.99
. 2)Conf.int.
(0.97,1.61)(0.67,1.47)
Estimate Conf.int.
1.00
0.88
(0.67,1.16)
0.67
(0.47,0.95)
Level of education Less than 10 years10 to 12 yearsMore than 12 years
First child Before 1968After 1968
1.000.800.59
1.000.41
(0.65,1.00)(0.38,0.90)
(0.32,0.52)
1.000.991.45
1.000.62
(0.72,1.37)(0.99,2.12)
(0.39,1.00)
1) Estimates are based upon the multiplicative model duration + age + educ+ 19682) Confidence interval 90 p e rcent.
•

30
Table 3. Probability of a second child 8 years after first birth for all
workers, and workers with uninterrupted employment, by age at
first birth, and level of education. Percent
Ail workers
Workers with
uninterrupted employment
Under
Age at first birth
Under
Age at first birth
Mure than Mure than
21 21-25 25 21 21-25 25
92 94 74 63 68 41
92 93 85 62 65 53
100 98 96 100 77 99
Education
Less than 10
years
10-12 years
More than 12
years

31
Figure 4: Cumulative probability of having a second and third childbirth
among all women who have entered motherhood, within 8 years
after previous childbirth. Percent
1 00
90 I
80
70
60
50
40
30
20
10
Second child
Third child
12 18 24 30 36 42 48 54 60 66 72 96
MONTHS
e 21 27 33

Figure 5: Third child fertility rate. All per 1000 women, month
Fertility rate
per 1000 women
32
25
20
15 ir
10 a,
MONTHS12 18 24 30 36 42 48 54 60 66 72 96
21 27 33
•
k

•Fsti
1)mate Cunf.i
2)nt. Estimate Conf.int.
1.00
1.00
0.69
(0.49,0.99)
1.59
(0.85,2.98)0.37
(0.21,0.64)
0.54
(0.21,0.72)
1.00
1.00
0.78
(0.56,1.50)
1.12
(0.57,2.22)0.42
(0.22,0.80)
2.27
(0.82,6.30)
1.00
1.00
0.66
(0.48,0.92)
0.28
(0.16,0.48)
33
Table 4. The gain in fit by introducing richer models, third child fertili-ty
Non-work Work
Models:
Dev.1) d . f . Dev. I d.f.
Reference model:Duration since secondbirth
Covariates:Age at 2. birth 24.7 2 4.5 2Education 14.1 2 1.4 2Distance 1-2 child 11.5 1 18.6 1Age + educ + distance 34.1 5 24.8 5Age + educ + dist +
82)
age * educ 39.2 9 27.1
1) Our estimates are based upon the multiplicative model (age + educdistance).2) See note 2 to table 2.1) See note 1 to table 1.2) Degrees of freedom are one less for workers compared to non-workers dueto no observation in one of the cells.
Table 5. Multiplicative effects of the covariates on fertility from secondto third child. Married women
Non-work Work
Age at 2. birth
Less than 23 years23 to 26 yearsMore than 26 years
Level of education Less than 10 years
- 10 to 12 yearsMore than 12 years
Distance 1-2 child Less than 30 months30 months or more

ISSUED IN THE SERIES DISCUSSION PAPER
No. 1 I. Aslaksen and O. Bjerkholt: Certainty Equivalence Procedures inthe Macroeconomic Planning of an Oil Economy.
No. 3 E. Biørn: On the Prediction of Population Totals from Sample Sur-veys Based on Rotating Panels.
No. 4 P. Frenger: A Short Run Dynamic Equilibrium Model of the NorwegianProduction Sectors.
No. 5 I. Aslaksen and O. Bjerkholt: Certainty Equivalence Procedures inDecision-Making under Uncertainty: an Empirical Application.
No. 6 E. Bjorn: Depreciation Profiles and the User Cost of Capital.
No. 7 P. Frenger: A Directional Shadow Elasticity of Substitution.
No. 8 S. Longva, L. Lorentsen, and O. Olsen: The Multi-Sectoral ModelMSG-4, Formal Structure and Empirical Characteristics.
No. 9 J. Fagerberg and G. Sollie: The Method of Constant Market SharesRevisited.
No. 10 E. Bjorn: Specification of Consumer Demand Models with StochsticElements in the Utility Function and the First Order Conditions.
•■•
No. 11 E. Bjorn, E. Holmoy, and O. Olsen: Gros's and Net Capital, Produc-tivity, and the Form of the Survival Function - Some NorwegianEvidence.
No. 12 J. K. Dagsvik: Markov Chains Generated by Maximizing Components ofMultidimensional Extremal Processes.
No. 13 E. Biørn, M. Jensen, and M. Reymert: KVARTS - A Quarterly Model ofthe Norwegian Economy.
No. 14 R. Aaberge: On the problem of measuring inequality.
No. 15 A-M. Jensen and T. Schweder: The Engine of Fertility - Influencedby Interbirth Employment: