Embed Size (px)
Citation preview
Proceedings of Machine Learning Research 74:103–115, 2017 Full Paper - LIDTA 2017
Effect of Data Imbalance on Unsupervised DomainAdaptation
of Part-of-Speech Tagging and Pivot Selection Strategies
Xia Cui [email protected]
Frans Coenen [email protected]
Danushka Bollegala [email protected]
Department of Computer Science, University of Liverpool, Ashton Street, Liverpool L69 3BX, UK
Editors: Luıs Torgo, Bartosz Krawczyk, Paula Branco and Nuno Moniz.
Abstract
Domain adaptation is the task of transforming a model trained using data from a sourcedomain to a different target domain. In Unsupervised Domain Adaptation (UDA), we donot assume any labelled training data from the target domain. In this paper, we considerthe problem of UDA in the contact of Part-of-Speech (POS). Specifically, we study theeffect of data imbalance on UDA of POS, and compare different pivot selection strategiesfor accurately adapting a POS tagger trained using some source domain data to a targetdomain. We propose the use of F-score to select pivots using available labelled data inthe source domain. Our experimental results on using benchmark dataset for cross-domainPOS tagging, show that using frequency combined with F-scores for selecting pivots in thesource labelled data produces the best results.
Keywords: Domain Adaptation, Data Imbalance, Part-of-Speech Tagging, Pivot Selection
1. Introduction
In many real-world applications involving machine learning methods we frequently en-counter two important problems: (a) the training and testing data distributions beingdifferent (data mismatch) (Blitzer et al., 2006, 2007; Ben-David et al., 2009), and (b) largediscrepancy in terms of the amount of training data available for the different target classeswe would like to learn (data imbalance) (Provost, 2000; Guo and Viktor, 2004; Zheng et al.,2004).
A popular solution to the first problem is Domain Adaptation (DA). DA considers theproblem of adapting a machine learning model from a source domain towards a differenttarget domain. For example, we would like to train a sentiment classifier for classifying thesentiment on iPads. Let us further assume that we do not have any labelled training dataexpressing user sentiment associated with iPads. However, we might have some labelledtraining data expressing user sentiment on iPhones. Considering that iPhones and iPadshave some resemblance in terms of their functionalities, we might be able to first use theavailable labelled data for iPhones and train a sentiment classifier. We could then adapt thistrained iPhone sentiment classifier to classify the user reviews of iPads. In this example, weassumed the availability of unlabelled data for both iPhone source domain and iPad targetdomain, whereas labelled training instances were available only for the source domain. This
c© 2017 X. Cui, F. Coenen & D. Bollegala.
Effect of data imbalance on UDA of POS tagging
particular DA setting is referred to as Unsupervised Domain Adaptation (UDA) (DaumeIII, 2007). In contrast, if we had at least a few labelled training instances for the targetdomain, in addition to the labelled training instances we have for the source domain, thenit is referred to as Supervised Domain Adaptation (SDA) (Daume III et al., 2010). UDAis particularly challenging compared to SDA because of the lack of labelled training datafor the target domain. In this paper we consider the effect of the distribution of the sourcedomain’s labelled data on UDA.
Data imbalance arises when we have unequal numbers of training instances for the differ-ent target classes we would like to learn (Chawla et al., 2004; Branco et al., 2016; Krawczyk,2016). For example, in a sentiment classification setting, we might have a disproportion-ately large amount of positively labelled data to negatively labelled data. If we simply mixall available data and train a classifier, it might be incorrectly biased towards predicting thepositive label by default. Under or oversampling methods that respectively select a subsetof training instances from the majority class or take multiple samples from the minorityclass have been proposed to overcome data imbalance issues in machine learning (He andGarcia, 2009).
We study cross-domain part-of-speech (POS) tagging (Schnabel and Schutze, 2013;Schanbel and Schutze, 2014) in which we can encounter both the data mismatch and dataimbalance problems discussed above. POS tagging is the task of assigning POS categoriessuch as noun, verb, adjective, adverb, etc. to each word in a sentence. POS tagging is oneof the fundamental steps in most natural language processing (NLP) applications such asdependency parsing, sentiment classification, machine translation and text summarisation.For example, adjectives are known to carry useful information related to the sentiment of auser who has written a review about a product. Consequently, using adjectives as featuresfor training a classifier to predict sentiment has been an effective strategy. In the cross-domain POS setting, we would like to train a POS tagger using data from a source domainand apply the trained POS tagger on a different target domain. For example, we couldtrain a POS tagger using manually annotated Wall Street Journal articles and adapt thelearnt POS tagger to tag POS in social media such as tweets. In the UDA of POS taggerswe do not assume any POS labelled training data for the target domain.
As we later see in our analysis, the POS distribution of words is highly uneven. SomePOS categories such as nouns and adjectives are highly frequent, whereas adverbs are muchless frequent. Therefore, when we adapt a POS tagger to a new domain we must take intoaccount the imbalance of training data for the different POS categories. Several heuristicmethods have been proposed in prior work on cross-domain POS tagging for selecting pivotsas we discuss later in Section 2. However, to the best of our knowledge, prior work on cross-domain POS tagging has largely ignored this data imbalance issue and have focused purelyon the adaptation task. In this paper, we study the effect of data imbalance on UDAapplied in cross-domain Part-of-Speech (POS) tagging. UDA methods first select a subsetof features that are common to both source and target domains, which are referred to aspivots. Next, a projection is learnt from the source and target domains to the space spannedby the pivots. The source domain’s labelled training data can then be used to learn a POStagger in this shared pivot space. By using common features as pivots we can reduce thedissimilarity between the two domains, thereby improving the accuracy of POS tagging inthe target domain.
104
Effect of data imbalance on UDA of POS tagging
Our contributions in this paper can be summarised as follows:
• We compare the effect of previously proposed pivot selection strategies for selectingpivots for UDA of POS tagging under data imbalance. Specifically, we compare fre-quency (FREQ), mutual information (MI), pointwise mutual information (PMI) andpositive pointwise mutual information (PPMI) as heuristics for selecting pivots. Theseheuristics can be computed either using labelled data or unlabelled data giving riseto two flavours.
• We propose a pivot selection method using the F-score for UDA of POS tagging,aimed at the problem of high imbalance ratio in POS categories. This method preferscategories with lower performance, measured using F-score, when selecting pivots,thereby selecting more pivots to cover low performing categories. We use only labelleddata from the source domain training instances when measuring F-scores. In ourexperiments, we see that the proposed F-score-based pivot selection method indeedimproves the POS tagging accuracy of low-performing categories, thereby improvingthe overall performance.
2. Related Work
Blitzer et al. (2006) propose one Structural Correspondence Learning (SCL) (Blitzer et al.,2006) for adapting a POS tagger from domain to another. SCL uses the frequency of a wordin the source and the target domain to determine its appropriateness as a pivot. A wordthat appears frequently in both the source and the target domain is likely to be independentof the domains and more suitable for domain adaptation. SCL train linear predictors topredict the presence of pivots using other features. These pivot predictors can then beused to predict the probability of a particular pivot in a sentence even if that pivot doesnot appear in that sentence. In effect, the pivot predictors can be seen as representing aprojection from the source (or target) feature spaces to the common pivot space.
In addition to FREQ, various pivot selection strategies for DA have been proposedin the literature such as mutual information (MI), pointwise mutual information (PMI)and positive pointwise mutual information (PPMI). Blitzer et al. (2006) proposed to selectfeatures that frequently occurred in the two domains to be pivots for cross-domain POStagging. Some other strategies were proposed for cross-domain sentiment classification.Blitzer et al. (2007) proposed to select features with higher MI between labels to be pivots.Pan et al. (2010) proposed to select features with lower MI between different domains tobe pivots. Bollegala et al. (2015) and Bollegala et al. (2014) proposed to select pivots usingPMI and PPMI respectively.
Although we focus on pivot selection strategies for domain adaptation in this paper,we note that there are alternative DA methods that do not require pivot selection. Forexample, prediction-based lower dimensional word embeddings have been used as featuresfor reducing the mismatch between source and target sentences thereby adapting a POStagger trained using source domain data to a different target domain (Schanbel and Schutze,2014). Instance weighting methods emphasise source domain labelled data instances thatare similar to the target domain during training (Jiang and Zhai, 2007). Autoencoders havealso been used to learn domain-independent feature representations which can then be used
105
Effect of data imbalance on UDA of POS tagging
for learning a classifier (Ziser and Reichart, 2016). We do not consider these pivotless DAmethods in this paper.
3. Pivot Selection for Unsupervised Cross-domain Part-of-SpeechTagging
The POS tag of a word depends on the POS tags of the preceding words; sequence labellerssuch as hidden markov models (HMMs) and conditional random fields (CRFs) have beensuccessfully used for learning accurate POS taggers (Kudo et al., 2004). However, by en-coding structural features, it is possible to obtain comparable performance using sequencelabellers as well as classifiers on POS tagging (Keerthi and Sundararajan, 2007). Therefore,in this work we model POS tagging as a multi-class classification problem where for a givenword, we must select its correct POS tag from a pre-defined finite set of POS categories. Thismodelling assumption enables us to straightforwardly extend previously proposed pivot se-lection methods for cross-domain sentiment classification. However, sentiment classificationis often modelled as a binary classification task (positive vs. negative sentiment) whereasPOS tagging is a multi-class classification task. For example, the PennTreebank POS tagset contains 36 categories1.
To extend the pivot selection methods proposed for binary classification tasks (i.e. sen-timent classification) to multi-class classification tasks (i.e. POS tagging) we collate alltraining data for the categories to a single category, except for the POS category of in-terest. This is similar to building a one vs. rest binary classifier for each POS category.Specifically, the score function φ(x,D) for a feature x in a set of training instances D iscomputed by heuristic pivot selection methods such as: FREQ, MI, PMI and PPMI. Thefrequency of a feature x in a set of training instances D is denoted by FREQ(x,D). Themutual information between a feature x and a set of instances D is given by:
MI(x,D) = p(x,D) log
(p(x,D)
p(x)p(D)
)(1)
We use “∗” to denote the sum over the set of features or sets of instances for all the domains,and compute the probabilities in (1) using the frequency counts as follows:
p(x,D) = FREQ(x,D)/FREQ(∗, ∗),p(x) = FREQ(x, ∗)/FREQ(∗, ∗),p(D) = FREQ(∗,D)/FREQ(∗, ∗)
Similarly, we compute PMI and PPMI by:
PMI(x,D) = log
(p(x,D)
p(x)p(D)
)(2)
PPMI(x,D) = max(PMI(x,D), 0) (3)
1. https://www.ling.upenn.edu/courses/Fall_2003/ling001/penn_treebank_pos.html
106

Effect of data imbalance on UDA of POS tagging
3.1. Pivot Selection for Unlabelled Data
Unlabelled pivot selection methods use unlabelled data from the source domain and targetdomain (we use notations DSU
and DTUto denote unlabelled data in the source and the
target domains respectively).For example, FREQU can be computed using Eq. (4) for selecting top-ranked features
by occurrence in both domains to be pivots. However, for labelled datasets, pivot selectionmethods are based on the number of classes, hence the selection process is under multi-classsettings.
xU = min(φ(x,DSU), φ(x,DTU
)) (4)
3.2. Pivot Selection for Labelled Data
As described above, we follow the idea of one vs. rest binary classification to select pivotsbased on each known tag for labelled datasets in the source domain. For each POS tag Pin m POS tags, we split the labelled datasets into DP+ (x is labelled as P ) and DP− (x isNOT labelled as P ), then compute the score φ(DP ) for this POS tag as follows:
φ(x,DP ) = |φ(x,DP+)− φ(x,DP−)| (5)
| · | is the absolute value and used for measuring the difference between two sets of instances.The score for each feature x is then computed by the sum of scores from all POS categories:
xL =
m∑i=1
φ(x,DPi) (6)
Under these scoring methods, features with higher score are more likely to be pivots becausethey occur frequently or they are more associated with labels.
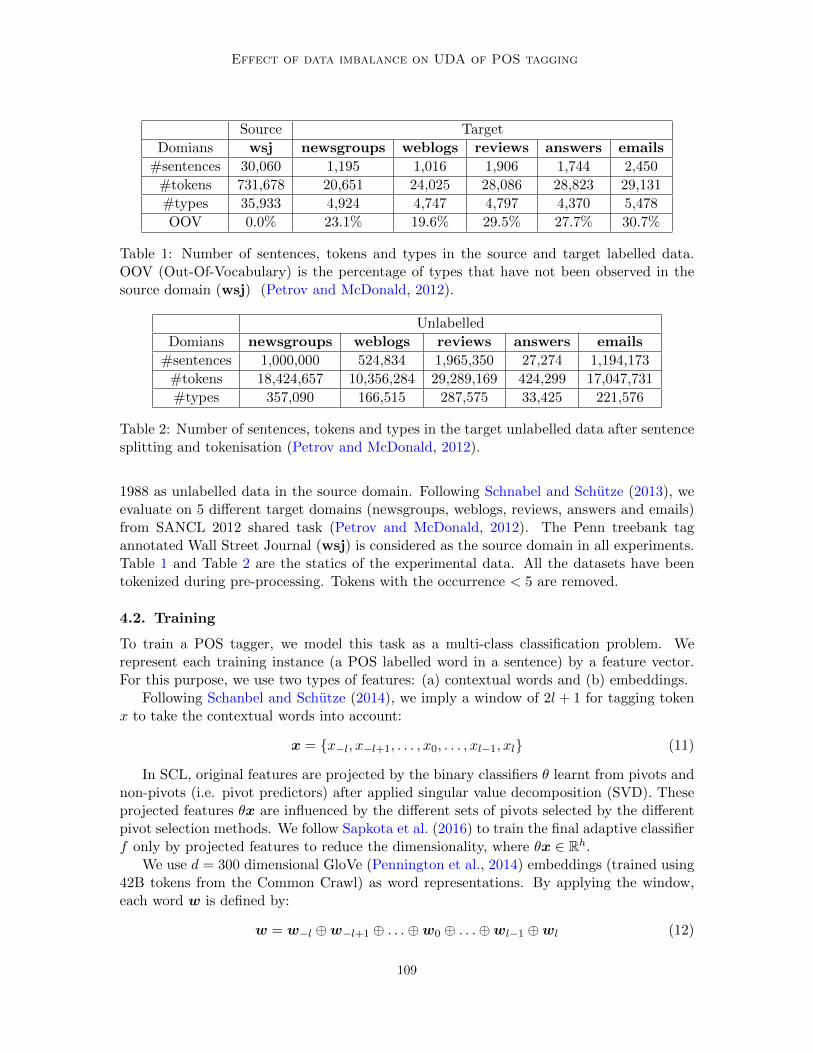
3.3. Effect of the Label Distribution
In the training datasets (Figure 1), there are very popular POS categories (e.g., nouns(NN)) and less popular ones (e.g., symbols (SYM)). However, none of the above-mentionedpivot selection methods take into consideration this imbalance in data when computing thescore when selecting a feature as a pivot. A straightforward method to incorporate thedistributional information to the pivot selection process is to multiply the score φ(x,DPi)of a feature x as a pivot for representing the i-th POS category by the probability qi of thatcategory, thus:
q(x) =m∑i=1
qiφ(x,DPi) (7)
The pivot selection score q(x) of a feature x given by (7) prefers frequent POS categorieswhen selecting pivots.
3.4. Effect of the F-Score
The pivot selection method described in Section 3.3 is agnostic to the individual performanceon a particular POS category. As we later see in our experiments (Figure 2), the frequency
107

Effect of data imbalance on UDA of POS tagging
of a POS category is not correlating with the performance obtained for that category bya POS tagger. In other words, some low-frequent as well as high-frequent POS categoriesappear to be equally difficult for adapting a POS tagger to. Therefore, we need a pivotselection method that is aware of the performance on POS categories.
For this purpose, we propose a novel pivot selection method that uses F-score. We firsttrain a POS tagger separately for each POS category Pi using a randomly selected samplefrom the labelled data from the source domain. Next, we evaluate its performance on arandomly selected (different) sample from the source domain. We compute the F-score forthis POS tagger on the i-th POS category. Note that we do not use any labelled test datafrom the target domain for this purpose because in UDA we do not have any labelled datafor the target domain. Let us denote the F-score for the i-th POS category to be Fi.
We would like to select pivots from POS categories that have low Fi values to encourageadaptation to those categories. We can consider the reciprocal of the F-scores, 1/Fi for thispurpose. Unfortunately, 1/Fi is not a [0, 1] bounded score such as a probability. Therefore,we compute such a bounded score ri using the softmax function:
ri =exp(1/Fi)∑Nj=1 exp(1/Fj)
(8)
Here, N is the total number of POS categories. Note that for pivot selection purposes it issufficient to determine the relative ordering of the features according to their scores r(x).Because (8) is monotonically increasing w.r.t. to the reciprocal of the F scores, we cansimply use the reciprocal of the F score as ri in (9) as follows:
r(x) =
m∑i=1
riφ(x,DPi) (9)
3.5. Nouns
Nouns is one of the most popular POS categories. In fact, in our datasets nouns are themajority POS category. As a baseline for selecting pivots from the majority category, wepropose a score function for pivot selection that prefers features that occur frequently in thenoun category. This baseline demonstrates the performance of a pivot selection method thatconsiders only one POS category such as nouns (NN). This score function xNN is defined asthe score from only category NN.
xNN = |φ(x,DNN+)− φ(x,DNN−)| (10)
4. Experiments
To evaluate the different pivot selection methods described in Section 3, we use the selectedpivots with SCL to perform cross-domain POS tagging.
4.1. Experimental Data
Following Blitzer et al. (2006), we use the Penn Treebank (Marcus et al., 1993) of the WallStreet Journal (WSJ) section 2-21 as the labelled data, and 100,000 WSJ sentences from
108
Effect of data imbalance on UDA of POS tagging
Source Target
Domians wsj newsgroups weblogs reviews answers emails
#sentences 30,060 1,195 1,016 1,906 1,744 2,450
#tokens 731,678 20,651 24,025 28,086 28,823 29,131
#types 35,933 4,924 4,747 4,797 4,370 5,478
OOV 0.0% 23.1% 19.6% 29.5% 27.7% 30.7%
Table 1: Number of sentences, tokens and types in the source and target labelled data.OOV (Out-Of-Vocabulary) is the percentage of types that have not been observed in thesource domain (wsj) (Petrov and McDonald, 2012).
Unlabelled
Domians newsgroups weblogs reviews answers emails
#sentences 1,000,000 524,834 1,965,350 27,274 1,194,173
#tokens 18,424,657 10,356,284 29,289,169 424,299 17,047,731
#types 357,090 166,515 287,575 33,425 221,576
Table 2: Number of sentences, tokens and types in the target unlabelled data after sentencesplitting and tokenisation (Petrov and McDonald, 2012).
1988 as unlabelled data in the source domain. Following Schnabel and Schutze (2013), weevaluate on 5 different target domains (newsgroups, weblogs, reviews, answers and emails)from SANCL 2012 shared task (Petrov and McDonald, 2012). The Penn treebank tagannotated Wall Street Journal (wsj) is considered as the source domain in all experiments.Table 1 and Table 2 are the statics of the experimental data. All the datasets have beentokenized during pre-processing. Tokens with the occurrence < 5 are removed.
4.2. Training
To train a POS tagger, we model this task as a multi-class classification problem. Werepresent each training instance (a POS labelled word in a sentence) by a feature vector.For this purpose, we use two types of features: (a) contextual words and (b) embeddings.
Following Schanbel and Schutze (2014), we imply a window of 2l + 1 for tagging tokenx to take the contextual words into account:
x = {x−l, x−l+1, . . . , x0, . . . , xl−1, xl} (11)
In SCL, original features are projected by the binary classifiers θ learnt from pivots andnon-pivots (i.e. pivot predictors) after applied singular value decomposition (SVD). Theseprojected features θx are influenced by the different sets of pivots selected by the differentpivot selection methods. We follow Sapkota et al. (2016) to train the final adaptive classifierf only by projected features to reduce the dimensionality, where θx ∈ Rh.
We use d = 300 dimensional GloVe (Pennington et al., 2014) embeddings (trained using42B tokens from the Common Crawl) as word representations. By applying the window,each word w is defined by:
w = w−l ⊕w−l+1 ⊕ . . .⊕w0 ⊕ . . .⊕wl−1 ⊕wl (12)
109
Effect of data imbalance on UDA of POS tagging
Figure 1: Distribution of the 48 PennTreebank POS tags in training data (wsj).
where ⊕ is vector concatenation and w ∈ Rd.We combine two types of features by introducing a mixing parameter γ, so that adaptive
classifier f is trained on [γθx,w].
4.3. Classification Accuracy
Accuracy (the percentage of correct predictions) is not a suitable measurement for datasetswith large numbers of labels, as it cannot show the effect on imbalanced data from thevarious labels. Therefore, we use the F-score to measure the classification accuracy for eachPOS tag when a particular pivot selection strategy is applied to SCL. Here, the F-scoresare computed using the target domain’s test labelled instances as follows:
Precision(Pi) =no. of correctly predicted words as category Pi
total no. of test words in the target domain(13)
Recall(Pi) =no. of correctly predicted words as category Pi
total no. of test words belonging to category Pi(14)
F-score(Pi) =2× Precision(Pi)× Recall(Pi)
Precision(Pi) + Recall(Pi)(15)
5. Results
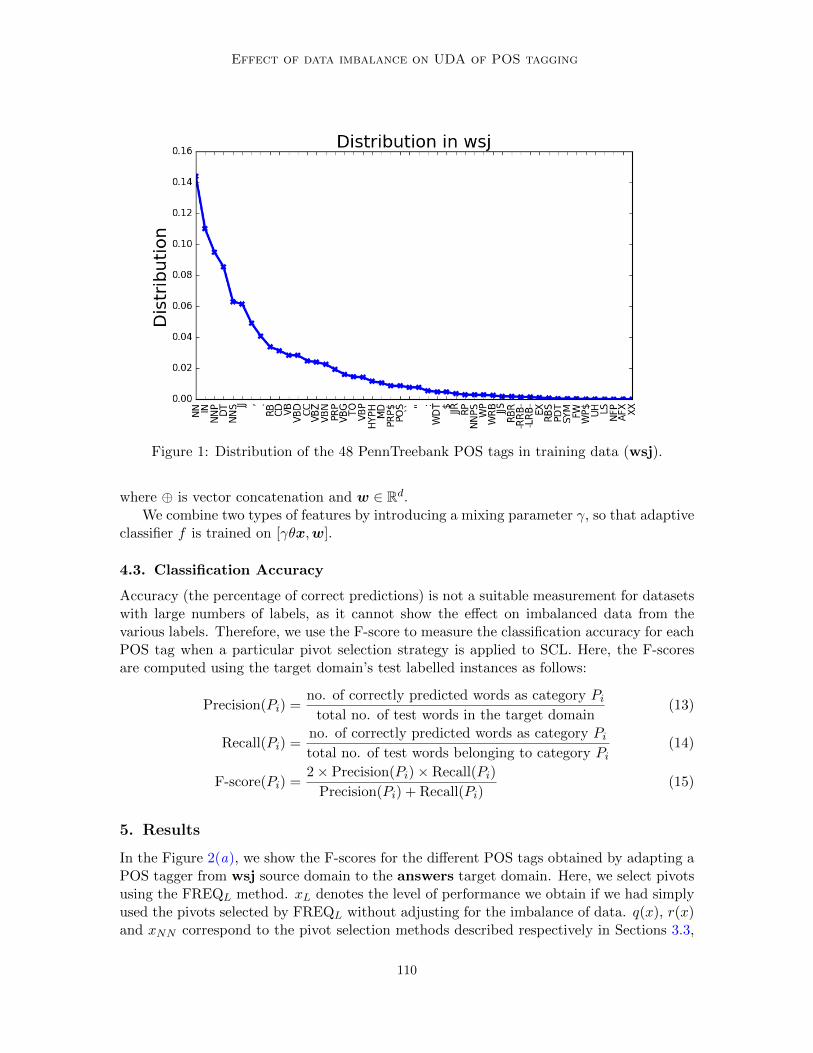
In the Figure 2(a), we show the F-scores for the different POS tags obtained by adapting aPOS tagger from wsj source domain to the answers target domain. Here, we select pivotsusing the FREQL method. xL denotes the level of performance we obtain if we had simplyused the pivots selected by FREQL without adjusting for the imbalance of data. q(x), r(x)and xNN correspond to the pivot selection methods described respectively in Sections 3.3,
110
Effect of data imbalance on UDA of POS tagging
(a) Different labelled data strategies using FREQL.
(b) Different pivot selection methods using r(x).
Figure 2: F-score for the 48 PennTreebank POS tags (left to right: high to low distributionin training data, as shown in Figure 1) for adapting from wsj to answers under mixingparameter γ = 1.0.
3.4 and 3.5. The POS tags are arranged in the horizontal axis in the descending orderof their frequency in the source domain. The mixing parameter γ is fixed to 1 in thisexperiment and we later study its effect on the performance.
111
Effect of data imbalance on UDA of POS tagging
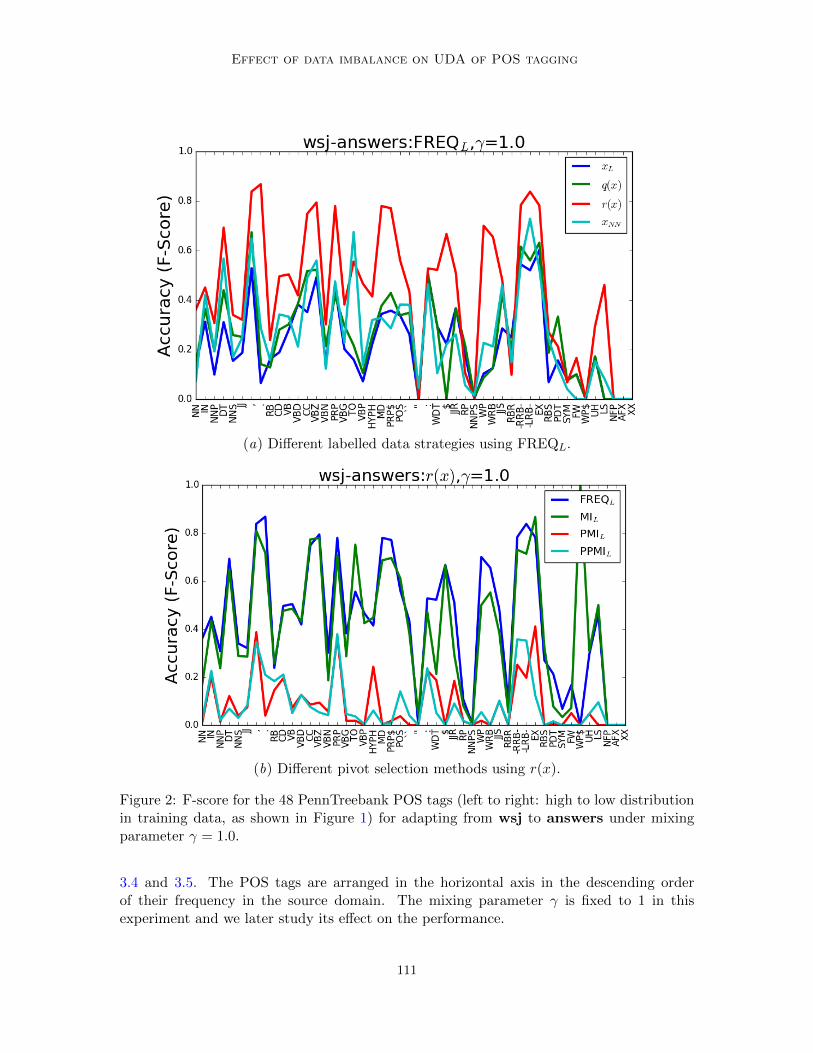
Figure 3: F-score for different pivot selection methods using unlabelled datasets.
Figure 2(a) shows that r(x) is the best multi-label strategy for FREQL. Similar resultswere obtain when r(x) was combined with other pivot selection methods (MI, PMI andPPMI), and on other target domains. Because of space limitation, we use show the resultsfor the wsj-answers adaptation setting. We see that probability of a POS tag (q(x)),or selecting pivots from the majority category (xNN ), performs at a similar level to notperforming any adjustments due to data imbalance (xL).
Next, we study the effect of the proposed F-score-based pivot selection method, r(x),with different labelled pivot selection methods. Figure 2(b) shows that F-score by FREQ isconsistently better than others for all labelled methods. Figure 3 shows that FREQ is alsoone of the good pivot selection methods for unlabelled datasets, MIU is closely followingFREQU . These two results agree with the observation made by Blitzer et al. (2007) thatFREQ works better for POS tagging as a pivot selection strategy. Overall, PMI or PPMIwith any multi-class pivot selection strategy proposed in this paper do not work well ondatasets with large numbers of categories. A possible reason is that PMI and PPMI do notweight the amount of information obtained about one random event by observing anotherby the joint probability of the two events (Bollegala et al., 2015).
5.1. Effect on Mixing Parameter
In Section 4.2, we defined a mixing parameter γ for the combination of two types of features.Table 3 shows that all labelled pivot selection methods share the same trend for γ ={0.01, 0.1, 1, 10, 100}. The highest F-score is obtained with 0.01. These F-scores are closerto each other for different pivot selection methods when γ towards zero because we reducethe weight of pivot predictors from SCL and pretrained word embeddings are not influencedby the pivot selection method. All unlabelled pivot selection methods also follow this trend(not shown in Table 3 due to space limitations). The differences between F-scores reported
112

Effect of data imbalance on UDA of POS tagging
Method xL q(x) r(x) xNN xL q(x) r(x) xNN
γ FREQL MIL0.01 0.6993 0.6982 0.6985 0.6992 0.6986 0.6993 0.6993 0.7006
0.1 0.6927 0.6910 0.6975 0.6877 0.6857 0.6890 0.6930 0.6977
1 0.2246 0.2604 0.4370 0.2649 0.2407 0.2461 0.3533 0.3689
10 0.4366 0.4328 0.4824 0.4290 0.4317 0.4314 0.4589 0.4725
100 0.6890 0.6909 0.6957 0.6959 0.6900 0.6892 0.6860 0.6931
PMIL PPMIL0.01 0.7001 0.7025 0.6966 0.7034 0.6996 0.6977 0.6939 0.7002
0.1 0.5270 0.6775 0.5005 0.5113 0.6992 0.4118 0.5133 0.4666
1 0.1254 0.1492 0.0846 0.1151 0.6955 0.0907 0.0836 0.0956
10 0.3296 0.4359 0.3225 0.3423 0.6811 0.3085 0.3198 0.3236
100 0.6732 0.6906 0.6779 0.6636 0.6609 0.6621 0.6611 0.6839
Table 3: F-score for pivot selection strategies with mixing parameter γ ={0.01, 0.1, 1, 10, 100}. Highest F-score for each strategy is bolded. xL, q(x), r(x) and xNN
denote data imbalance strategies by (6), (7), (9) and (10) respectively.
by the different pivot selection methods with the optimal value of γ for that method are notstatistically significant, which indicates that pretrained word embeddings can be used toovercome any disfluencies introduced by the pivot selection methods if the mixing parameteris carefully selected. We differ the study of learning the best combinations of pretrainedword embedding-based features and pivot predictors to future work.
6. Conclusion
We compare the effect of previously proposed pivot selection strategies for UDA of POStagging under data imbalance. We propose a combination of pivot selection method andlabelled data strategy (FREQL + r(x)) that works better than other combinations in theour experiments. We also show that the classification accuracy on a single category doesnot improve using a single category strategy (e.g. xNN).
References
Shai Ben-David, John Blitzer, Koby Crammer, Alex Kulesza, Fernando Pereira, and Jen-nifer Wortman Vaughan. A theory of learning from different domains. Machine Learning,79:151–175, 2009.
John Blitzer, Ryan McDonald, and Fernando Pereira. Domain adaptation with structuralcorrespondence learning. In Proc. of EMNLP, pages 120–128, 2006.
John Blitzer, Mark Dredze, and Fernando Pereira. Biographies, bollywood, boom-boxesand blenders: Domain adaptation for sentiment classification. In Proc. of ACL, pages440–447, 2007.
Danushka Bollegala, David Weir, and John Carroll. Learning to predict distributions ofwords across domains. In Proc. of ACL, pages 613 – 623, 2014.
113

Effect of data imbalance on UDA of POS tagging
Danushka Bollegala, Tingting Mu, and John Y. Goulermas. Cross-domain sentiment clas-sification using sentiment sensitive embeddings. IEEE Transactions on Knowledge andData Engineering, 28(2):398–410, Feb 2015. ISSN 1041-4347.
Paula Branco, Luıs Torgo, and Rita P. Ribeiro. A survey of predictive modeling on imbal-anced domains. ACM Comput. Surv., 49(2):31:1–31:50, August 2016. ISSN 0360-0300.
Nitesh V. Chawla, Nathalie Japkowicz, and Aleksander Kotcz. Editorial: special issue onlearning from imbalanced data sets. ACM SIGKDD Explorations Newsletter, 6(1):1 – 6,June 2004.
Hal Daume III. Frustratingly easy domain adaptation. In Proc. of ACL, pages 256–263,2007.
Hal Daume III, Abhishek Kumar, and Avishek Saha. Frustratingly easy semi-supervised do-main adaptation. In Proc. of the Workshop on Domain Adaptation for Natural LanguageProcessing, pages 53–59, 2010.
Hongyu Guo and Herna L. Viktor. Learning from imbalanced data sets with boosting anddata generation: the databoost-im approach. SIGKDD Newsletters, 6:30 – 39, 2004.
Haibo He and Edwardo A. Garcia. Learning from imbalanced data. IEEE Transactions onKnowledge and Data Engineering, 21(9):1263–1284, 2009.
Jing Jiang and ChengXiang Zhai. Instance weighting for domain adaptation in nlp. InProc. of ACL, pages 264 – 271, 2007.
S. Sathiya Keerthi and S. Sundararajan. Crf versus svm-struct for sequence labelling.Technical report, Yahoo Research, 2007.
Bartosz Krawczyk. Learning from imbalanced data: open challenges and future directions.Progress in Artificial Intelligence, 5(4):221–232, Nov 2016.
Taku Kudo, Kaoru Yamamoto, and Yuji Matsumoto. Applying conditional random fieldsto japanese morphological analysis. In EMNLP’04, 2004.
Mitchell P. Marcus, Mary Ann Marcinkiewicz, and Beatrice Santorini. Building a largeannotated corpus of english: The penn treebank. Comput. Linguist., 19(2):313–330, June1993. ISSN 0891-2017.
Sinno Jialin Pan, Xiaochuan Ni, Jian-Tao Sun, Qiang Yang, and Zheng Chen. Cross-domainsentiment classification via spectral feature alignment. In Proc. of WWW, pages 751–760,2010.
Jeffery Pennington, Richard Socher, and Christopher D. Manning. Glove: global vectorsfor word representation. In Proc. of Empirical Methods in Natural Language Processing(EMNLP), pages 1532–1543, 2014.
Slav Petrov and Ryan McDonald. Overview of the 2012 shared task on parsing the web.In Notes of the first workshop on syntactic analysis of non-canonical language (sancl),volume 59, 2012.
114

Effect of data imbalance on UDA of POS tagging
Foster Provost. Machine learning from imbalanced data sets. In AAAI 2000 Workshop onImbalanced Data Sets, 2000.
Upendra Sapkota, Thamar Solorio, Manuel Montes-y Gomez, and Steven Bethard. Do-main adaptation for authorship attribution: Improved structural correspondence learn-ing. pages 2226—2235, 2016.
Tobias Schanbel and Hinrich Schutze. Flors: Fast and simple domain adaptaton for part-of-speech tagging. Transactions of Association for Computational Linguistics, pages 15–26,2014.
Tobias Schnabel and Hinrich Schutze. Towards robust cross-domain domain adaptation forpart-of-speech tagging. In Proc. of IJCNLP, pages 198–206, 2013.
Zhaohui Zheng, Xiaoyun Wu, and Rohini Srihari. Feature selection for text categorizationon imbalanced data. ACM SIGKDD Explorations Newsletter, 6(1):80 – 89, June 2004.
Yftah Ziser and Roi Reichart. Neural structural correspondence learning for domain adap-tation. arXiv, 2016.
115