Embed Size (px)
Citation preview
E-Defense Shaking Table Tests on a Steel High-rise Building Retrofitted by Dampers against Long-period Ground Motions D. Sato, Y. Shimada, H. Ouchi, Y. Oshita & H. Kitamura Tokyo University of Science, Japan T. Nagae, K. Fukuyama, K. Kajiwara, & T. Inoue National Research Institute for Earth Science and Disaster Prevention, Japan M. Nakashima Kyoto University, Japan T. Saito Building Research Institute, Japan N. Fukuwa Nagoya University, Japan SUMMARY A series of shaking table tests on a high-rise building are conducted in order to assess effects of retrofit using steel or oil dampers. The specimen consists of a four-story steel frame and an upper substitute layers made of concrete slabs and rubber bearings. Steel or oil brace dampers are attached to the steel frame. Long-period ground motions and a design ground motion are used for the tests. Total input energies of the specimen reasonably correspond to the estimations of energy spectra. The deformations of specimen are reduced especially in the portion having dampers. In the moment frame, the energy is mostly dissipated in the steel or oil brace dampers. Keywords: High-rise building, Long-period ground motion, Shaking table test, Energy absorption, Retrofit 1. INTRODUCTION It had been pointed out that inter-plate earthquakes cause long-period ground motions in large cities of Japan. They may have the large seismic energy which is exceeding the level of design assumptions into high-rise buildings. When 2011 Tohoku earthquake (March 11, 2011) occurred, many high-rise buildings which were constructed in Tokyo have kept vibrating for over 10 minutes. In order to acquire realistic data on the damage, a series of shaking table tests on a high-rise building is conducted by using 3-dimension full-scale testing facility, nicknamed "E-Defense" [1-3]. The adopted test system consists of a lower part represented by four-story steel moment frame structure and an upper part simplified by substitute layers made of concrete mass and rubber bearings. Long-period ground motions and a design ground motion are used for the tests. In the tests using long period ground motions, the specimen is subjected to large cumulative inelastic deformations as well as large inter-story drifts. Such seismic loads are represented by total input energy to the specimen. The total input energy from each test is plotted in the corresponding energy spectrum of the input wave, indicating reasonable correlations. The beam ends dissipate ninety percent of the total input energy of the steel frame. The results characterized by input energy and its distribution suggest the adopted measuring methods reasonable. The seismic performance assessment in terms of input energy can be developed not just for a seismic design but also for damage monitoring techniques. In addition, this specimen is retrofitted by using steel or oil brace dampers, the shaking table tests are carried out. Steel or oil brace dampers are attached to the steel moment frame. Total input energies of the specimen reasonably correspond to the estimations of energy spectra. The deformations of specimen are reduced especially in the portion having dampers. In the steel frame, the energy is mostly dissipated in the steel or oil brace dampers.
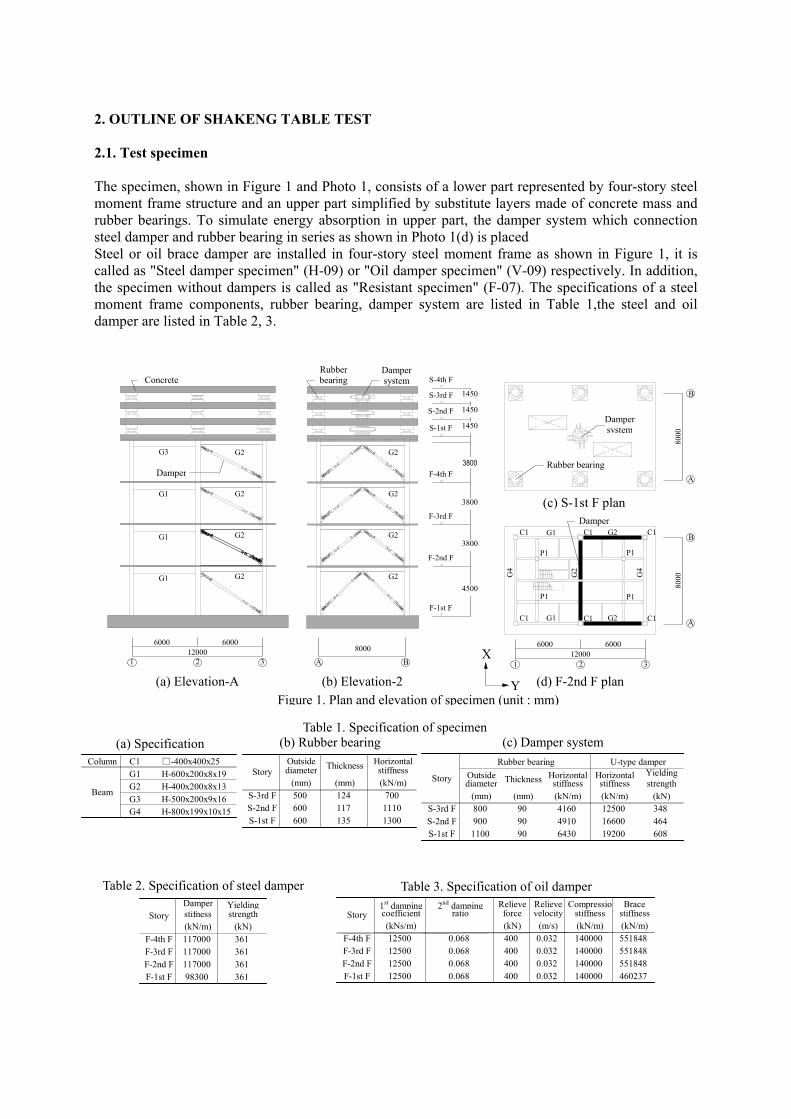
2. OUTLINE OF SHAKENG TABLE TEST 2.1. Test specimen The specimen, shown in Figure 1 and Photo 1, consists of a lower part represented by four-story steel moment frame structure and an upper part simplified by substitute layers made of concrete mass and rubber bearings. To simulate energy absorption in upper part, the damper system which connection steel damper and rubber bearing in series as shown in Photo 1(d) is placed Steel or oil brace damper are installed in four-story steel moment frame as shown in Figure 1, it is called as "Steel damper specimen" (H-09) or "Oil damper specimen" (V-09) respectively. In addition, the specimen without dampers is called as "Resistant specimen" (F-07). The specifications of a steel moment frame components, rubber bearing, damper system are listed in Table 1,the steel and oil damper are listed in Table 2, 3.
Figure 1. Plan and elevation of specimen (unit : mm)
Concrete
(a) Elevation-A
12000 6000 6000
Damper
G3
G1
G1
G1
G2
G2
G2
G2
1 2 3
Damper
12000 6000 6000
8000(d) F-2nd F plan Y
X
G4
G4
G2
G1
G1
G2C1
C1
P1
C1
C1
C1
C1G2
P1
P1
P1
1 2
3
A
B
Rubber bearing
Damper system
8000
(c) S-1st F plan
A
B
8000
(b) Elevation-2
1450
S-4th F
S-3rd F
S-2nd F
S-1st F
F-4th F
F-3rd F
F-2nd F
F-1st F
Rubber bearing
G2
G2
G2
G2
A B
1450
1450
3800
3800
3800
4500
Damper system
Table 1. Specification of specimen(a) Specification
Column C1 □-400x400x25G1 H-600x200x8x19G2 H-400x200x8x13G3 H-500x200x9x16G4 H-800x199x10x15
Beam
(b) Rubber bearingOutside Horizontal
(c) Damper system
Outside Horizontal Horizontaldiameter stiffness(mm) (mm) (kN/m)
S-3rd F 500 124 700S-2nd F 600 117 1110
StoryThickness
S-1st F 600 135 1300
Yieldingdiameter stiffness stiffness strength
(mm) (mm) (kN/m) (kN/m) (kN)S-3rd F 800 90 4160 12500 348
U-type damper
Story
Rubber bearing
Thickness
S-2nd F 900 90 4910 16600 464S-1st F 1100 90 6430 19200 608
Table 3. Specification of oil damper Table 2. Specification of steel damper Damper Yieldingstifness strength(kN/m) (kN)
F-4th F 117000 361F-3rd F 117000 361F-2nd F 117000 361
Story
F-1st F 98300 361
1st damping 2nd damping Relieve Relieve Compressio Bracecoefficient ratio force velocity stiffness stiffness(kNs/m) (kN) (m/s) (kN/m) (kN/m)
F-4th F 12500 0.068 400 0.032 140000 551848F-3rd F 12500 0.068 400 0.032 140000 551848F-2nd F 12500 0.068 400 0.032 140000 551848
Story
F-1st F 12500 0.068 400 0.032 140000 460237
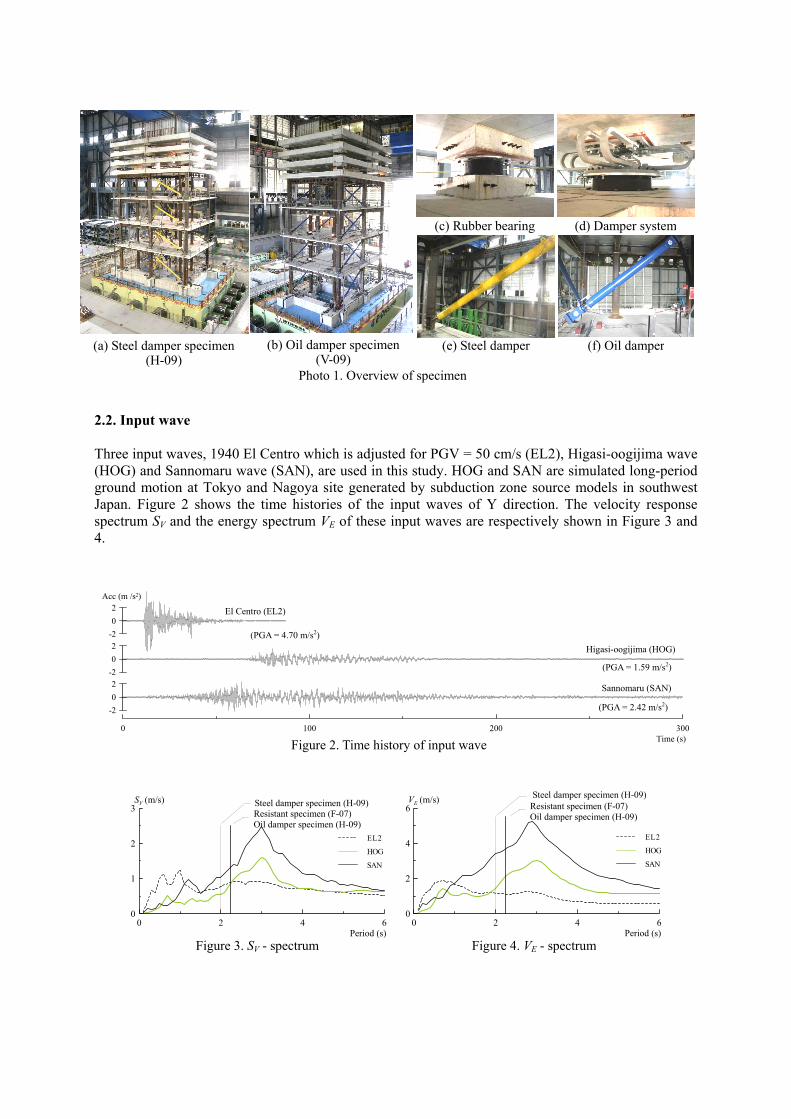
Photo 1. Overview of specimen
(a) Steel damper specimen(H-09)
(b) Oil damper specimen(V-09)
(c) Rubber bearing (d) Damper system
(e) Steel damper (f) Oil damper
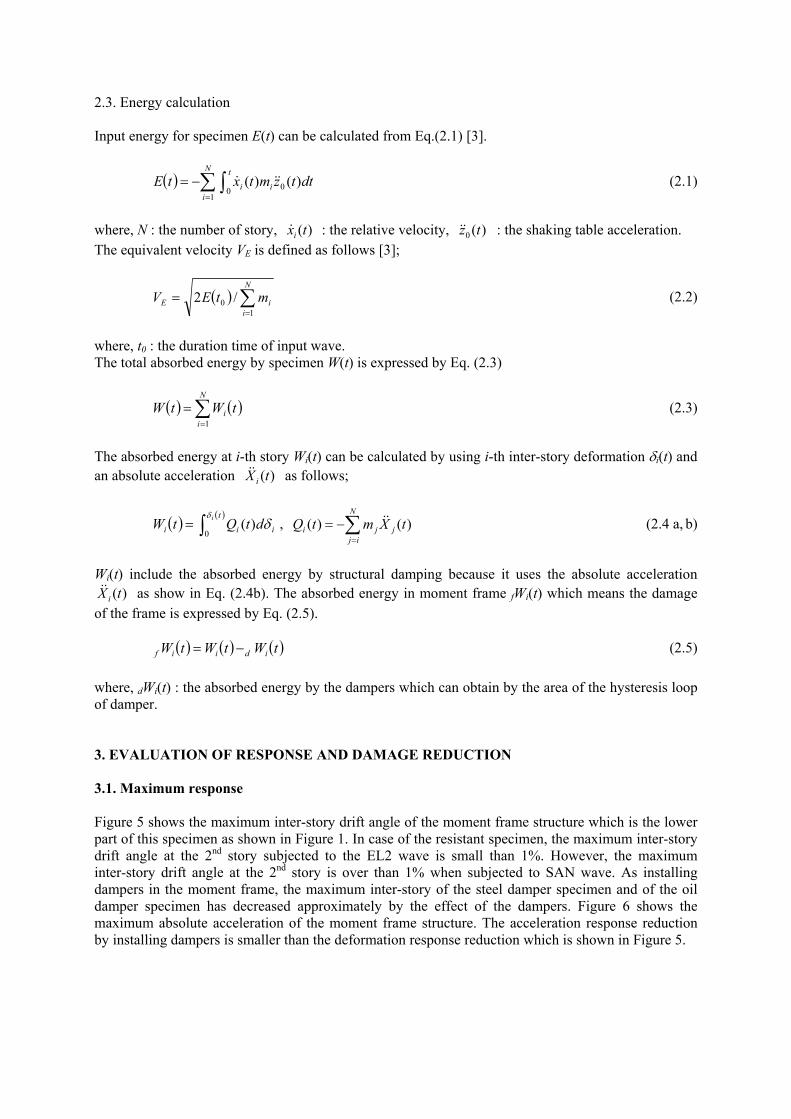
2.2. Input wave Three input waves, 1940 El Centro which is adjusted for PGV = 50 cm/s (EL2), Higasi-oogijima wave (HOG) and Sannomaru wave (SAN), are used in this study. HOG and SAN are simulated long-period ground motion at Tokyo and Nagoya site generated by subduction zone source models in southwest Japan. Figure 2 shows the time histories of the input waves of Y direction. The velocity response spectrum SV and the energy spectrum VE of these input waves are respectively shown in Figure 3 and 4.
Sannomaru (SAN)
Higasi-oogijima (HOG)
El Centro (EL2)
(PGA = 4.70 m/s2)
(PGA = 1.59 m/s2)
(PGA = 2.42 m/s2)
Figure 2. Time history of input wave0 100 200 300
Time (s)
-202
-202
-202
Acc (m /s2)
0
1
2
3SV (m/s)
0 2 4 6Period (s)
EL2
HOG
SAN
Resistant specimen (F-07) Oil damper specimen (H-09)
Steel damper specimen (H-09)
0
2
4
6VE (m/s)
0 2 4 6Period (s)
Figure 3. SV - spectrum Figure 4. VE - spectrum
Resistant specimen (F-07) Oil damper specimen (H-09)
Steel damper specimen (H-09)
EL2
HOG
SAN
2.3. Energy calculation Input energy for specimen E(t) can be calculated from Eq.(2.1) [3].
( ) ∑∫=
−=N
i
t
ii dttzmtxtE1
0 0 )()( &&& (2.1)
where, N : the number of story, : the relative velocity, : the shaking table acceleration. The equivalent velocity V
)(txi& )(0 tz&&E is defined as follows [3];
( ) ∑=
=N
iiE mtEV
10 /2 (2.2)
where, t0 : the duration time of input wave. The total absorbed energy by specimen W(t) is expressed by Eq. (2.3)
( ) ( )∑=
=N
ii tWtW
1 (2.3)
The absorbed energy at i-th story Wi(t) can be calculated by using i-th inter-story deformation δi(t) and an absolute acceleration as follows; )(tX i
&&
( ) ( )∫=
t
iiii dtQtW
δδ
0)( , (2.4 a,)()( tXmtQ
N
ijjji ∑
=
−= && b)
Wi(t) include the absorbed energy by structural damping because it uses the absolute acceleration
as show in Eq. (2.4b). The absorbed energy in moment frame )(tX i&& fWi(t) which means the damage
of the frame is expressed by Eq. (2.5).
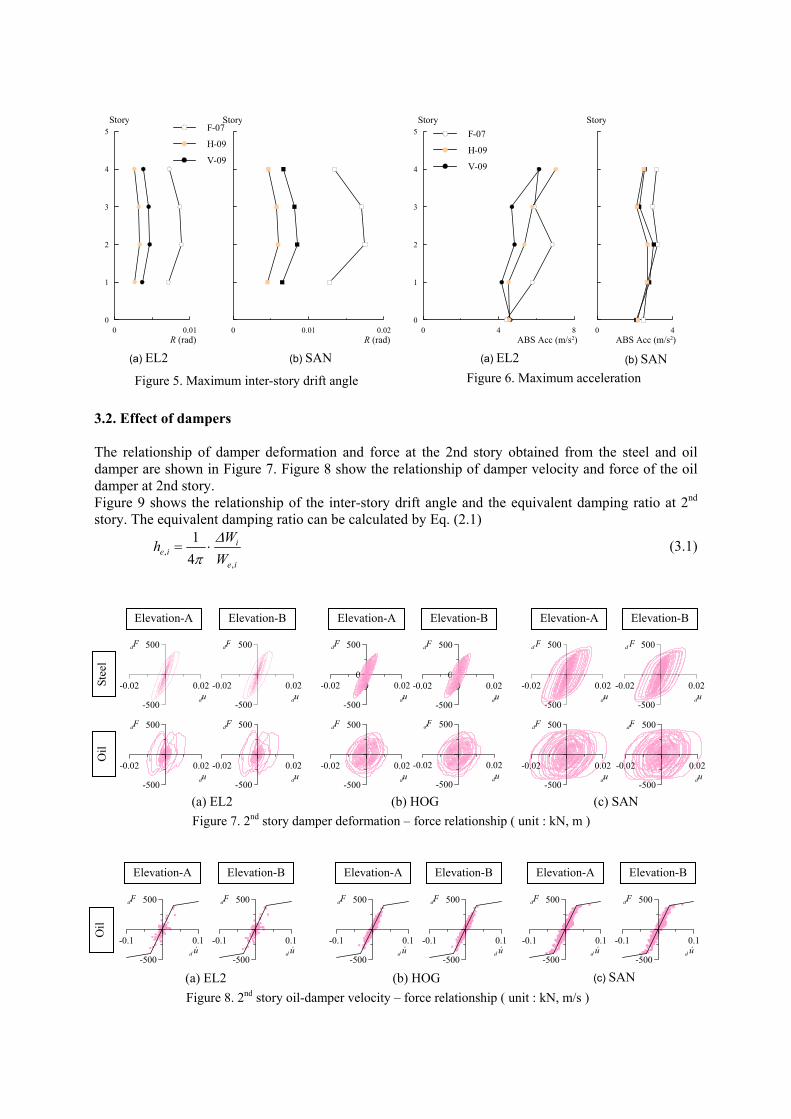
( ) ( ) ( )tWtWtW idiif −= (2.5) where, dWi(t) : the absorbed energy by the dampers which can obtain by the area of the hysteresis loop of damper. 3. EVALUATION OF RESPONSE AND DAMAGE REDUCTION 3.1. Maximum response Figure 5 shows the maximum inter-story drift angle of the moment frame structure which is the lower part of this specimen as shown in Figure 1. In case of the resistant specimen, the maximum inter-story drift angle at the 2nd story subjected to the EL2 wave is small than 1%. However, the maximum inter-story drift angle at the 2nd story is over than 1% when subjected to SAN wave. As installing dampers in the moment frame, the maximum inter-story of the steel damper specimen and of the oil damper specimen has decreased approximately by the effect of the dampers. Figure 6 shows the maximum absolute acceleration of the moment frame structure. The acceleration response reduction by installing dampers is smaller than the deformation response reduction which is shown in Figure 5.
0 0.01 0.02R (rad)
Story
0 0.01R (rad)
0
1
2
3
4
5Story
F-07
H-09
V-09
(a) EL2 (b) SAN
Figure 5. Maximum inter-story drift angle
0 4ABS Acc (m/s2)
Story
0 4 8ABS Acc (m/s2)
0
1
2
3
4
5Story
(a) EL2 (b) SANFigure 6. Maximum acceleration
F-07
H-09
V-09
3.2. Effect of dampers The relationship of damper deformation and force at the 2nd story obtained from the steel and oil damper are shown in Figure 7. Figure 8 show the relationship of damper velocity and force of the oil damper at 2nd story. Figure 9 shows the relationship of the inter-story drift angle and the equivalent damping ratio at 2nd story. The equivalent damping ratio can be calculated by Eq. (2.1)
ie
iie W
Wh,
, 41 Δπ⋅= (3.1)
Elevation-A
Figure 7. 2nd story damper deformation – force relationship ( unit : kN, m ) (a) EL2 (c) SAN (b) HOG
-0.02 0.02du
-500
500dF
-0.02 0.02du
-500
500dF
-0.02 0.02du
-500
500dF
-0.02 0 0.02du
-500
0
500dF
Elevation-B
-0.02 0.02du
-500
500dF
-0.02 0.02du
-500
500dF
Elevation-A Elevation-B Elevation-A Elevation-B
-0.02 0.02du
-500
500dF
-0.02 0 0.02du
-500
0
500dF
-0.02 0.02du
-500
500d F
-0.02 0.02du
-500
500dF
Stee
l O
il
-0.02 0.02du
-500
500d F
-0.02 0.02du
-500
500dF
ud &-0.1 0.1
-500
500dF
ud &-0.1 0.1
-500
500dF
ud &-0.1 0.1
-500
500dF
Figure 8. 2nd story oil-damper velocity – force relationship ( unit : kN, m/s ) (c) SAN
Elevation-A Elevation-B Elevation-A Elevation-B Elevation-A Elevation-B
ud &-0.1 0.1
-500
500dF
ud &-0.1 0.1
-500
500dF
ud &-0.1 0.1
-500
500dF
Oil
(a) EL2 (b) HOG
0.0001 0.001 0.01 0.10
0.05
0.1
0.15
0.2
0.25
0.3he,2
R2 (rad)
HOG
EL2
SAN
SAN
SAN
HOGHOG
EL2EL2
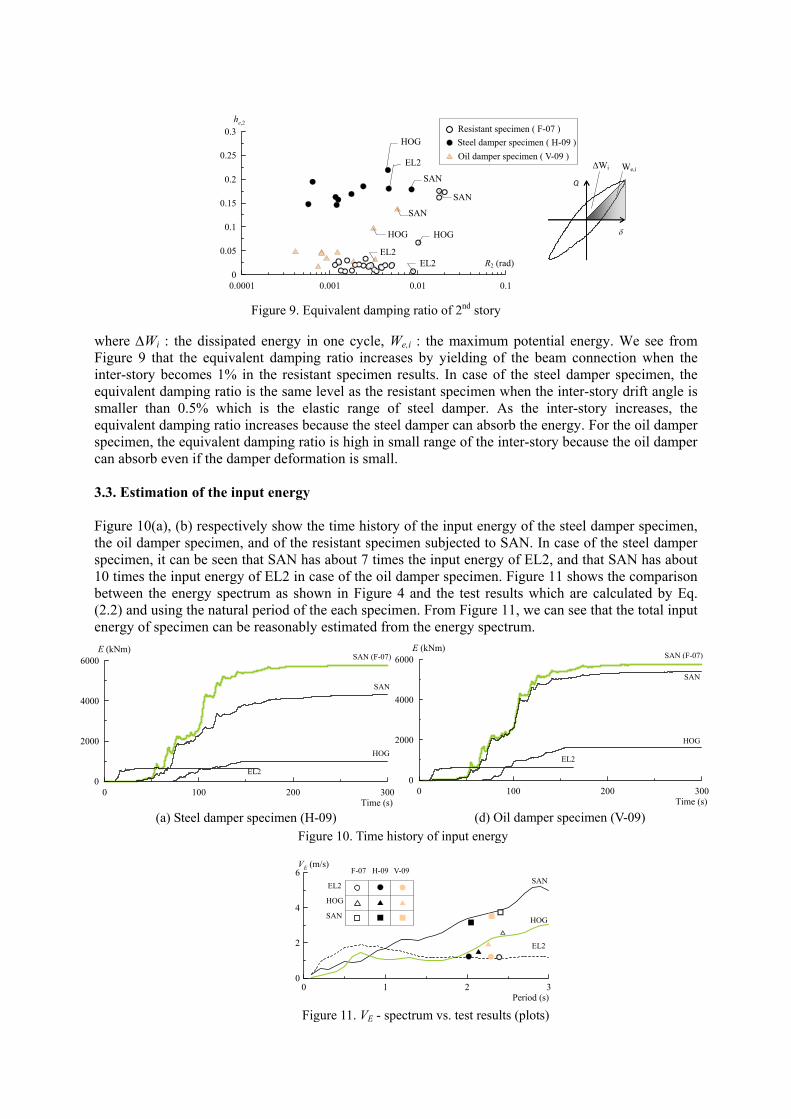
Figure 9. Equivalent damping ratio of 2nd story
Resistant specimen ( F-07 ) Steel damper specimen ( H-09 ) Oil damper specimen ( V-09 )
ΔWi
where ΔWi : the dissipated energy in one cycle, We,i : the maximum potential energy. We see from Figure 9 that the equivalent damping ratio increases by yielding of the beam connection when the inter-story becomes 1% in the resistant specimen results. In case of the steel damper specimen, the equivalent damping ratio is the same level as the resistant specimen when the inter-story drift angle is smaller than 0.5% which is the elastic range of steel damper. As the inter-story increases, the equivalent damping ratio increases because the steel damper can absorb the energy. For the oil damper specimen, the equivalent damping ratio is high in small range of the inter-story because the oil damper can absorb even if the damper deformation is small. 3.3. Estimation of the input energy Figure 10(a), (b) respectively show the time history of the input energy of the steel damper specimen, the oil damper specimen, and of the resistant specimen subjected to SAN. In case of the steel damper specimen, it can be seen that SAN has about 7 times the input energy of EL2, and that SAN has about 10 times the input energy of EL2 in case of the oil damper specimen. Figure 11 shows the comparison between the energy spectrum as shown in Figure 4 and the test results which are calculated by Eq. (2.2) and using the natural period of the each specimen. From Figure 11, we can see that the total input energy of specimen can be reasonably estimated from the energy spectrum.
0
2
4
6VE (m/s)
0 1 2 3Period (s)
SAN
HOG
F-07 V-09
SAN
HOG
EL2
H-09
EL2
Figure 11. VE - spectrum vs. test results (plots)
We,i
Q
δ
(a) Steel damper specimen (H-09)
HOG
EL2
SAN
SAN (F-07)
0 100 200 300Time (s)
0
2000
4000
6000E (kNm)
(d) Oil damper specimen (V-09) Figure 10. Time history of input energy
HOG
SAN
EL2
SAN (F-07)
0 100 200 3000
2000
4000
6000E (kNm)
Time (s)
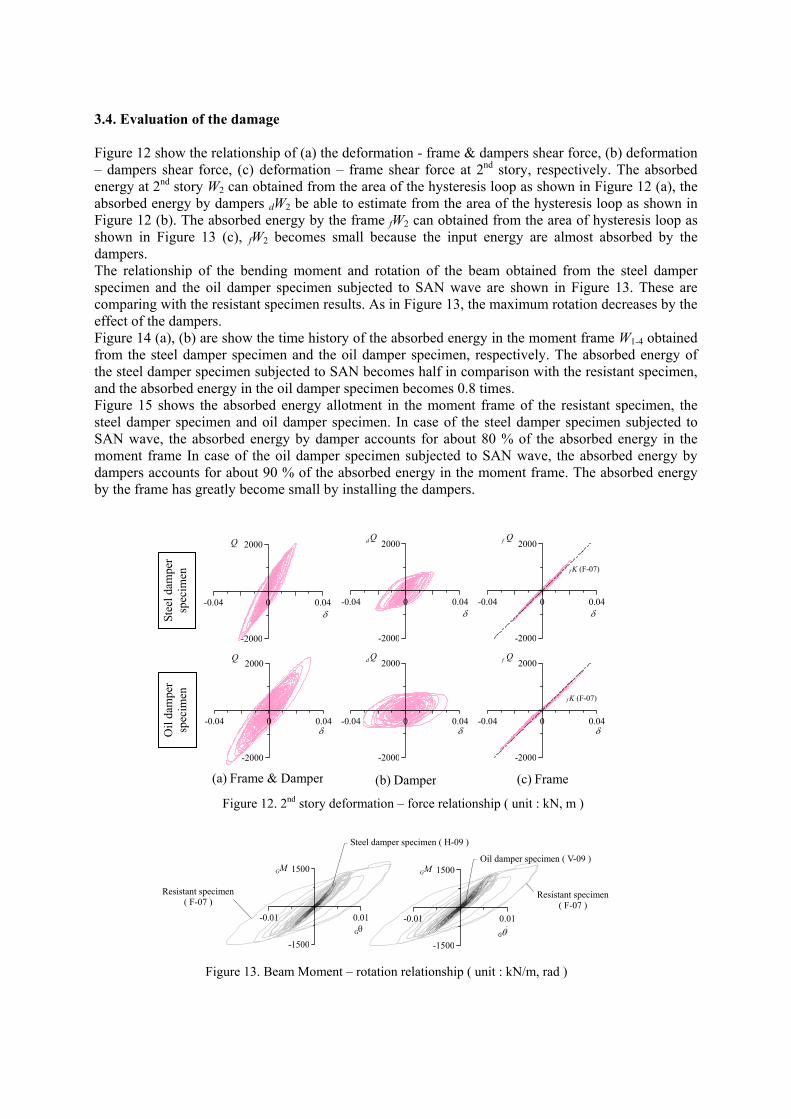
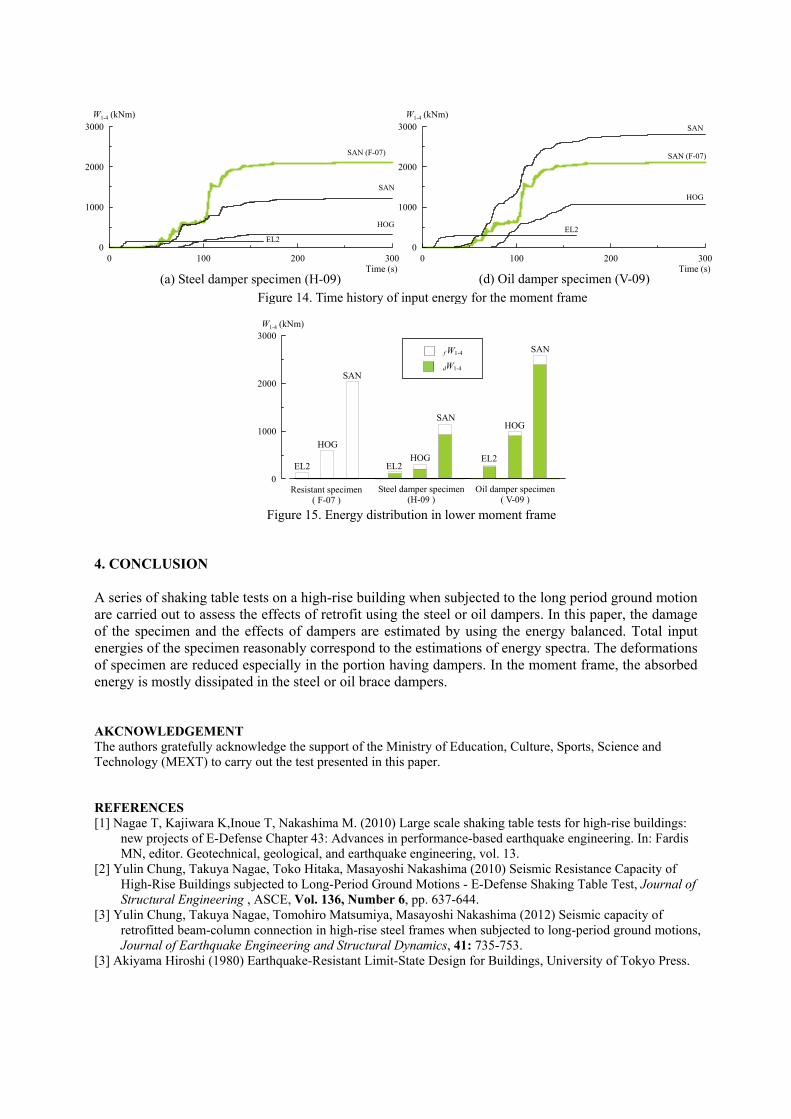
3.4. Evaluation of the damage Figure 12 show the relationship of (a) the deformation - frame & dampers shear force, (b) deformation – dampers shear force, (c) deformation – frame shear force at 2nd story, respectively. The absorbed energy at 2nd story W2 can obtained from the area of the hysteresis loop as shown in Figure 12 (a), the absorbed energy by dampers dW2 be able to estimate from the area of the hysteresis loop as shown in Figure 12 (b). The absorbed energy by the frame fW2 can obtained from the area of hysteresis loop as shown in Figure 13 (c), fW2 becomes small because the input energy are almost absorbed by the dampers. The relationship of the bending moment and rotation of the beam obtained from the steel damper specimen and the oil damper specimen subjected to SAN wave are shown in Figure 13. These are comparing with the resistant specimen results. As in Figure 13, the maximum rotation decreases by the effect of the dampers. Figure 14 (a), (b) are show the time history of the absorbed energy in the moment frame W1-4 obtained from the steel damper specimen and the oil damper specimen, respectively. The absorbed energy of the steel damper specimen subjected to SAN becomes half in comparison with the resistant specimen, and the absorbed energy in the oil damper specimen becomes 0.8 times. Figure 15 shows the absorbed energy allotment in the moment frame of the resistant specimen, the steel damper specimen and oil damper specimen. In case of the steel damper specimen subjected to SAN wave, the absorbed energy by damper accounts for about 80 % of the absorbed energy in the moment frame In case of the oil damper specimen subjected to SAN wave, the absorbed energy by dampers accounts for about 90 % of the absorbed energy in the moment frame. The absorbed energy by the frame has greatly become small by installing the dampers.
δ-0.04 0 0.04
-2000
2000Q
δ-0.04 0 0.04
-2000
2000d Q
δ -0.04 0 0.04
-2000
2000Q
δ-0.04 0 0.04
-2000
2000d Q
δ
f K (F-07)
-0.04 0 0.04
-2000
2000f Q
-0.04 0 0.04
-2000
2000f Q
δ
f K (F-07)
(a) Frame & Damper (b) Damper (c) Frame
Oil
dam
per
sp
ecim
en
Stee
l dam
per
spec
imen
Figure 12. 2nd story deformation – force relationship ( unit : kN, m )
-0.01 0.01Gθ
-1500
1500GM
Gθ-0.01 0.01
Gθ
-1500
1500GM
Resistant specimen ( F-07 )
Oil damper specimen ( V-09 )
Resistant specimen ( F-07 )
Steel damper specimen ( H-09 )
Figure 13. Beam Moment – rotation relationship ( unit : kN/m, rad )
HOG
EL2
SAN
SAN (F-07)
0 100 200 300Time (s)
0
1000
2000
3000W1-4 (kNm)
HOG
SAN
EL2
SAN (F-07)
0 100 200 300Time (s)
0
1000
2000
3000W1-4 (kNm)
(a) Steel damper specimen (H-09) (d) Oil damper specimen (V-09) Figure 14. Time history of input energy for the moment frame
0
1000
2000
3000W1-4 (kNm)
Resistant specimen ( F-07 )
SAN
HOG
EL2EL2
SAN
HOG
SAN
HOG
EL2
Steel damper specimen (H-09 )
Oil damper specimen ( V-09 )
Figure 15. Energy distribution in lower moment frame
f W1-4
dW1-4
4. CONCLUSION A series of shaking table tests on a high-rise building when subjected to the long period ground motion are carried out to assess the effects of retrofit using the steel or oil dampers. In this paper, the damage of the specimen and the effects of dampers are estimated by using the energy balanced. Total input energies of the specimen reasonably correspond to the estimations of energy spectra. The deformations of specimen are reduced especially in the portion having dampers. In the moment frame, the absorbed energy is mostly dissipated in the steel or oil brace dampers. AKCNOWLEDGEMENT The authors gratefully acknowledge the support of the Ministry of Education, Culture, Sports, Science and Technology (MEXT) to carry out the test presented in this paper. REFERENCES [1] Nagae T, Kajiwara K,Inoue T, Nakashima M. (2010) Large scale shaking table tests for high-rise buildings:
new projects of E-Defense Chapter 43: Advances in performance-based earthquake engineering. In: Fardis MN, editor. Geotechnical, geological, and earthquake engineering, vol. 13.
[2] Yulin Chung, Takuya Nagae, Toko Hitaka, Masayoshi Nakashima (2010) Seismic Resistance Capacity of High-Rise Buildings subjected to Long-Period Ground Motions - E-Defense Shaking Table Test, Journal of Structural Engineering , ASCE, Vol. 136, Number 6, pp. 637-644.
[3] Yulin Chung, Takuya Nagae, Tomohiro Matsumiya, Masayoshi Nakashima (2012) Seismic capacity of retrofitted beam-column connection in high-rise steel frames when subjected to long-period ground motions, Journal of Earthquake Engineering and Structural Dynamics, 41: 735-753.
[3] Akiyama Hiroshi (1980) Earthquake-Resistant Limit-State Design for Buildings, University of Tokyo Press.