Embed Size (px)
Citation preview

1. Significant accounting policies 198 2. Accounting estimates and assessments 209 3. Consolidated Group 211 4. Revenue 212 5. Functional costs 212 6. Other operating income and expense 214 7. Other financial income/expense, net 214 8. Interest income and interest expense 214 9. Income taxes 215 10. Intangible assets 218 11. Property, plant and equipment 220 12. Equipment on operating leases 220 13. Equity-method investments 221 14. Receivables from financial services 226 15. Marketable debt securities 228 16. Other financial assets 228 17. Other assets 229 18. Inventories 229 19. Trade receivables 230 20. Equity 230 21. Share-based payment 232
22. Pensions and similar obligations 234 23. Provisions for other risks 241 24. Financing liabilities 242 25. Other financial liabilities 243 26. Deferred income 243 27. Other liabilities 243 28. Consolidated statement of cash flows 244 29. Legal proceedings 244 30. Financial guarantees, contingent liabilities
and other financial obligations 245 31. Financial instruments 248 32. Management of financial risks 256 33. Segment reporting 264 34. Capital management 269 35. Earnings per share 269 36. Related party relationships 270 37. Remuneration of the members
of the Board of Management and the Supervisory Board 271
38. Principal accountant fees 272 39. Additional information 272
E | Consolidated Financial Statements.

198
1. Significant accounting policies
General information
The consolidated financial statements of Daimler AG and its subsidiaries (“Daimler” or “the Group”) have been prepared in accordance with Section 315a of the German Commercial Code (HGB) and comply with the International Financial Report-ing Standards (IFRS) as adopted by the European Union (EU).
Daimler AG is a stock corporation organized under the laws of the Federal Republic of Germany. The company is entered in the Commercial Register of the Stuttgart District Court under No. HRB 19360 and its registered office is located at Mercedesstraße 137, 70327 Stuttgart, Germany.
The consolidated financial statements of Daimler AG are presented in euros (€). Unless otherwise stated, all amounts are stated in millions of euros. All figures shown are rounded in accordance with standard business rounding principles.
The Board of Management authorized the consolidated financial statements for publication on February 13, 2015.
Basis of preparation
Applied IFRSs. The accounting policies applied in the consolidated financial statements comply with the IFRSs required to be applied in the EU as of December 31, 2014.
IFRSs issued, EU endorsed and initially adopted in the reporting period. In May 2011, the IASB issued three new standards that provide guidance with respect to accounting for investments of the reporting entity in other entities. Daimler applies the new consolidation standards as of the mandatory effective date for IFRS users in the EU of January 1, 2014 on a retrospective basis.
IFRS 10 Consolidated Financial Statements supersedes consol-idation rules in IAS 27 Consolidated and Separate Financial Statements as well as SIC-12 Consolidation – Special Purpose Entities. IFRS 10 establishes a single consolidation model based on control that applies to all entities. According to the new model, control exists if the parent company has the power of decision over the subsidiary based on voting rights or other rights, if it participates in positive and negative variable returns from the subsidiary, and if it can affect these returns by its power of decision. The Group companies were analyzed based on the new control concept. As a result, two companies were reclas-sified. These companies are exclusively companies with sub-ord inate importance for the Group and for the presentation of a true and fair view of its profitability, liquidity and capital resources and financial position due to their inactive or minor business activities. Therefore, these companies are not con-solidated and hence have no effect on the consolidated financial statements.
IFRS 11 Joint Arrangements provides new guidance on account-ing for joint arrangements. The standard supersedes IAS 31 Interests in Joint Ventures as well as SIC-13 Jointly Controlled Entities – Non-Monetary Contributions by Ventures. In the future, it has to be decided whether a joint operation or a joint venture exists. In a joint venture, the parties that have joint control have rights to the net assets. Interests in a joint venture are to be accounted for as an investment using the equity method. This does not affect Daimler due to the fact that joint ventures were already accounted for using the equity method in the past. A joint operation exists if the parties that have joint control have rights to the assets and obligations for the liabili-ties. In this case, the proportionate assets, liabilities, revenues and expenses have to be recognized. As of the reporting date, six joint operations exist, which have no material effect on the consolidated financial statements.
Notes to the Consolidated Financial Statements.

199
E | Consolidated Financial Statements | Notes to the Consolidated Financial Statements
IFRS 12 Disclosure of Interests in Other Entities provides guidance on disclosure requirements for interests in other entities by combining existing disclosure requirements from several standards in IFRS 12. See Notes 3 and 13 for further information on extended disclosure requirements.
All other IFRSs with mandatory initial application in the EU as of January 1, 2014 had no significant impact on the consolidated financial statements.
IFRSs issued but neither EU endorsed nor yet adopted. In July 2014, the IASB published IFRS 9 Financial Instruments, which shall supersede IAS 39. IFRS 9 deals with the classifi-cation, recognition and measurement (including impairment) of financial instruments as well as with regulations for general hedge accounting. With IFRS 9, additional notes will be required, as specified by the revised IFRS 7 Financial Instruments – Disclosures. Subject to being endorsed by the EU, application of IFRS 9 is mandatory for reporting periods beginning on or after January 1, 2018. Early adoption is permitted. Investigation of the effects on the consolidated financial statements of adopting IFRS 9 has not yet been completed. In May 2014, the IASB published IFRS 15 Revenue from Contracts with Customers. It replaces existing guidance for revenue recognition, including IAS 18 Revenue, IAS 11 Construction Contracts and IFRIC 13 Customer Loyalty Programmes. The new standard defines a comprehensive framework for determining whether, in which amount and at which date revenue is recognized. The new standard specifies a uniform, five-step model for revenue recognition, which is generally to be applied to all contracts with customers. Disclosure require-ments are also extended. Subject to being endorsed by the EU, application of IFRS 15 is mandatory for reporting periods beginning on or after January 1, 2017. Early adoption is per-mitted. Investigation of the effects on the consolidated financial statements of adopting IFRS 15 has not yet been completed.
Subject to EU endorsement of these standards, which are then to be adopted in future periods, Daimler does not currently plan to apply these standards earlier. Other IFRSs issued but not EU endorsed are not expected to have a significant impact on the Group’s profitability, liquidity and capital resources or financial position.
Presentation. Presentation in the consolidated statement of financial position differentiates between current and non-current assets and liabilities. Assets and liabilities are classified as current if they are expected to be realized or settled within one year or within a longer and normal operating cycle. Deferred tax assets and liabilities as well as assets and provisions for pensions and similar obligations are generally presented as non-current items.
The consolidated statement of income is presented using the cost-of-sales method.
Commercial practices with respect to certain products manufactured by the Group necessitate that sales financing, including leasing alternatives, be made available to the Group’s customers. Accordingly, the Group’s consolidated financial statements are significantly influenced by the activities of its financial services business.
To enhance readers’ understanding of the Group’s profitability, liquidity and capital resources and financial position, unaudited information with respect to the Group’s industrial and financial services business activities (Daimler Financial Services) is provided in addition to the audited consolidated financial state-ments. Such information, however, is not required by IFRS and is not intended to, and does not represent the separate IFRS profitability, liquidity and capital resources and financial position of the Group’s industrial or financial services business activities. Eliminations of the effects of transactions between the industrial and financial services businesses have generally been allocated to the industrial business columns.
Reclassifications within functional costs. In the course of the organizational focus of the divisions on their customers and markets, corporate functions in each country are being streamlined and functional departments are being aligned more closely with the needs of the divisions. In this context, Daimler has reviewed the allocation of the cost centers in the headquarters functions to the individual functional costs. As a result, amongst other changes, IT services and personnel expenses have been reclassified from general administrative expenses to the other functional costs.

200
Measurement. The consolidated financial statements have been prepared on the historical cost basis with the exception of certain items such as available-for-sale financial assets, derivative financial instruments, hedged items, and pensions and similar obligations. The measurement models applied to those exceptions are described below.
Principles of consolidation. The consolidated financial statements include the financial statements of Daimler AG and the financial statements of all subsidiaries, including structured entities which are directly or indirectly controlled by Daimler AG. Control exists if the parent company has the power of decision over a subsidiary based on voting rights or other rights, if it participates in positive and negative variable returns from a subsidiary, and if it can affect these returns by its power of decision.
Structured entities which are controlled also have to be con-solidated. Accordingly, the assets and liabilities remain in the consolidated statement of financial position. Structured entities are entities which have been designed so that voting or similar rights are not relevant in deciding who controls the entity. This is the case for example if voting rights relate to administrative tasks only and the relevant activities are directed by means of contractual arrangements.
The financial statements of consolidated subsidiaries which are included in the consolidated financial statements are generally prepared as of the reporting date of the consolidated financial statements. The financial statements of Daimler AG and its subsidiaries included in the consolidated financial state-ments are prepared using uniform recognition and measure-ment principles. All intercompany assets and liabilities, equity, income and expenses as well as cash flows from transactions between consolidated entities are entirely eliminated in the course of the consolidation process.
Business combinations are accounted for using the purchase method.
Changes in equity interests in Group subsidiaries that reduce or increase Daimler’s percentage ownership without loss of control are accounted for as an equity transaction between owners.
Table E.06 shows the effects of the retrospective change of the allocation to the individual functional costs on the consolidated statement of income in 2013.
Table E.07 shows the effects on the consolidated statement of income in 2014 if the original allocation of the cost centers to the individual functional costs had been retained.
There are no effects on net profit, basic and diluted earnings per share or Group equity.
E.06Effects of reclassifications within functional costs
2013 disclosed
Reclassifi-cations
2013 changed
In millions of euros
Cost of sales 92,457 398 92,855
Selling expenses 10,875 175 11,050
General administrative expenses 3,865 -677 3,188
Research and non-capitalized development costs
4,101
104
4,205
E.07Effects of retention of original presentation of functional costs
2014 changed
Reclassifi-cations
2014 previous classifi-
cation
In millions of euros
Cost of sales 101,688 -461 101,227
Selling expenses 11,534 -204 11,330
General administrative expenses 3,329 787 4,116
Research and non-capitalized development costs
4,532
-122
4,410

201
E | Consolidated Financial Statements | Notes to the Consolidated Financial Statements
Investments in associated companies, joint ventures or joint operations. An associated company is an entity over which the Group has significant influence. Significant influence is the power to participate in the financial and operating policy decisions of the investee. Associated companies are generally accounted for using the equity method.
For entities over which Daimler has joint control together with a partner (joint arrangements), it has to be decided if a joint operation or a joint venture exists. In a joint venture, the parties that have joint control of the arrangement have rights to the net assets of the arrangement. For joint ventures, the equity method has to be applied. A joint operation exists when the jointly controlling parties have direct rights to the assets and obligations for the liabilities. In this case, the prorated assets and liabilities and the prorated income and expenses are gener-ally to be recognized. As the joint operations recognized at the end of the reporting period have no significant impact on the consolidated financial statements, they continue to be accounted for using the equity method.
In the special event that the financial statements of associated companies, joint ventures or joint operations should not be available in good time, the Group’s proportionate share of the results of operations is included in Daimler’s consolidated financial statements with a one to three-month time lag. Adjust-ments are made for all significant events or transactions that occur during the time lag (see also Note 13).
Subsidiaries measured at amortized cost. Subsidiaries, associated companies, joint ventures and joint operations whose business is non-active or of low volume and that are not material for the Group and the fair presentation of financial position, liquidity and capital resources, and profitability are generally measured at amortized cost in the consolidated financial statements.
Foreign currency translation. Transactions in foreign currency are translated at the relevant foreign exchange rates prevailing at the transaction date. In subsequent periods, assets and liabilities denominated in foreign currency are translated into euros using period-end exchange rates; gains and losses from this measurement are recognized in profit and loss (except for gains and losses resulting from the translation of available-for-sale equity instruments, which are recognized in other com-prehensive income/loss).
Assets and liabilities of foreign companies for which the functional currency is not the euro are translated into euros using period-end exchange rates. The translation adjustments are presented in other comprehensive income/loss. The components of equity are translated using historical rates. The statements of income and cash flows are translated into euros using average exchange rates during the respective periods.
The exchange rates of the US dollar, the British pound, the Japanese yen, the Chinese renminbi and the Russian ruble – the most significant foreign currencies for Daimler – were as shown in table E.08.
Exchange rates
2014 2013
USD GBP JPY CNY RUB USD GBP JPY CNY RUB
1 € = 1 € = 1 € = 1 € = 1 € = 1 € = 1 € = 1 € = 1 € = 1 € =
Average exchange rate on December 31
1.2141
0.7789
145.2300
7.5358
72.3370
1.3791
0.8337
144.7200
8.3491
45.3246
Average exchange rates during the respective period
First quarter 1.3696 0.8279 140.8000 8.3576 48.0425 1.3206 0.8511 121.7900 8.2209 40.1518
Second quarter 1.3711 0.8147 140.0000 8.5438 47.9415 1.3062 0.8506 129.0700 8.0376 41.3464
Third quarter 1.3256 0.7938 137.7500 8.1734 48.0583 1.3242 0.8545 131.0200 8.1111 43.4394
Fourth quarter 1.2498 0.7891 142.7500 7.6824 59.7160 1.3610 0.8407 136.4800 8.2903 44.2920
E.08

202
Accounting policies
Revenue recognition. Revenue from sales of vehicles, service parts and other related products is recognized when the risks and rewards of ownership of the goods are transferred to the customer, the amount of revenue can be estimated reliably and collectability is reasonably assured. Revenue is recognized net of sales reductions such as cash discounts and sales incen-tives granted.
Daimler uses a variety of sales promotion programs dependent on various market conditions in individual countries as well as the respective product life cycles and product-related factors (such as amounts of discounts offered by competitors, excess industry production capacity, the intensity of market competition and consumer demand for the products). These programs comprise cash offers to dealers and customers as well as lease subsidies or loans at reduced interest rates.
Revenue also includes revenue from the rental and leasing business as well as interest from the financial services business at Daimler Financial Services. The revenue from the rental and leasing business results from operating leases and is recog-nized on a straight-line basis over the periods of the contracts. In addition, sales revenue is generated at the end of lease contracts from the subsequent sale of the vehicles. Revenue from receivables from financial services is recognized using the effective interest method. When loans are issued below market rates, related receivables are recognized at present value and revenue is reduced for the interest incentive granted. If subsidized leasing fees are agreed upon in connection with finance leases, revenue from the sale of a vehicle is reduced by the amount of the interest incentive granted.
The Group offers extended, separately priced warranties for certain products. Revenue from these contracts is deferred and recognized over the contract period in proportion to the costs expected to be incurred based on historical information. In circumstances in which there is insufficient historical information, income from extended warranty contracts is recog-nized on a straight-line basis. A loss on these contracts is recognized in the current period if the sum of the expected costs for services under the contract exceeds unearned revenue.
For transactions with multiple deliverables, such as when vehicles are sold with free or reduced-in-price service programs, the Group allocates revenue to the various elements based on their estimated fair values.
Research and non-capitalized development costs. Expen-diture for research and development that does not meet the conditions for capitalization according to IAS 38 Intangible Assets is expensed as incurred.
Borrowing costs. Borrowing costs are expensed as incurred unless they are directly attributable to the acquisition, construc-tion or production of a qualifying asset and are therefore part of the cost of that asset. Depreciation of the capitalized borrowing costs is presented within cost of sales.
Government grants. Government grants related to assets are deducted from the carrying amount of the asset and are recognized in profit or loss over the life of a depreciable asset as a reduced depreciation expense. Government grants which compensate the Group for expenses are recognized as other operating income in the same period as the expenses themselves.
Profit/loss from equity-method investments. This item includes all income and expenses in connection with investments accounted for using the equity method. In addition to the prorated profits and losses from financial investments, it also includes profits and losses resulting from the sale of equity interests or the remeasurement of equity interests following a loss of significant influence. Daimler’s share of dilution gains and losses occurring if the Group or other owners do not participate in capital increases of companies in which shares are held and accounted for using the equity method are also included in profit/loss from equity-method investments. This item also includes losses and/or gains on the impairment of investments’ carrying amounts or on the reversal of such impairments.
Other financial income/expense, net. Other financial income/expense, net includes all income and expense from financial transactions which are not included in interest income and/or interest expense, and for Daimler Financial Services are not included in revenue and/or cost of sales. For example, expense from the compounding of interest on provisions for other risks is recorded in this line item.
Furthermore, income and expenses from equity interests are included in other financial income/expense, net, if such income or expenses are not presented under equity-method investments.
Interest income and interest expense. Interest income and interest expense include interest income from investments in securities, cash and cash equivalents as well as interest expense from liabilities. Furthermore, interest and changes in fair values related to interest rate hedging activities as well as income and expense resulting from the allocation of premiums and discounts are included. The interest components of defined benefit pension obligations and other similar obligations as well as of the plan assets available to cover these obliga-tions are also presented in this line item.
203
E | Consolidated Financial Statements | Notes to the Consolidated Financial Statements
An exception to the aforementioned principles is made for Daimler Financial Services. In this case, interest income and expense and gains or losses from derivative financial instruments are disclosed under revenue and cost of sales respectively.
Income taxes. Income taxes are comprised of current income taxes and deferred taxes.
Current income taxes are calculated based on the respective local taxable income and local tax rules for the period. In addition, current income taxes presented for the period include adjustments for uncertain tax payments or tax refunds for periods not yet finally assessed including interest expense and penalties on the underpayment of taxes. For the case that amounts included in the tax return might not be realized (uncer-tain tax positions), a provision for income taxes is recognized. The amount is based on the best possible assessment of the expected tax payment. Tax refund claims from uncertain tax positions are recognized when it is predominantly likely and thus reasonably expected that they can be realized. Only in the case of tax loss carryforwards or unused tax credits, no provision for taxes or tax claim is recognized for these uncertain tax positions. Instead the deferred tax assets for the unused tax loss carryforwards or tax credits are to be adjusted.
Changes in deferred tax assets and liabilities are generally recognized through profit and loss in deferred taxes in the consolidated statement of income, except for changes recognized in other comprehensive income/loss or directly in equity.
Deferred tax assets or liabilities are calculated on the basis of temporary differences between the tax basis and the financial reporting of assets and liabilities including differences from consolidation, on unused tax loss carryforwards and unused tax credits. Measurement is based on the tax rates expected to be effective in the period in which an asset is recognized or a liability is settled. For this purpose, the tax rates and tax rules are used which have been enacted at the reporting date or are soon to be enacted. Daimler recognizes a valuation allowance for deferred tax assets when it is unlikely that a corre-sponding amount of future taxable profit will be available against which the deductible temporary differences, tax loss carryforwards and tax credits can be utilized. Deferred tax liabilities for taxable temporary differences in connection with investments in subsidiaries, branches, associates and interests in joint arrangements are not recognized if the Group is able to control the timing of the reversal of the temporary difference and it is probable that the temporary difference will not reverse in the foreseeable future.
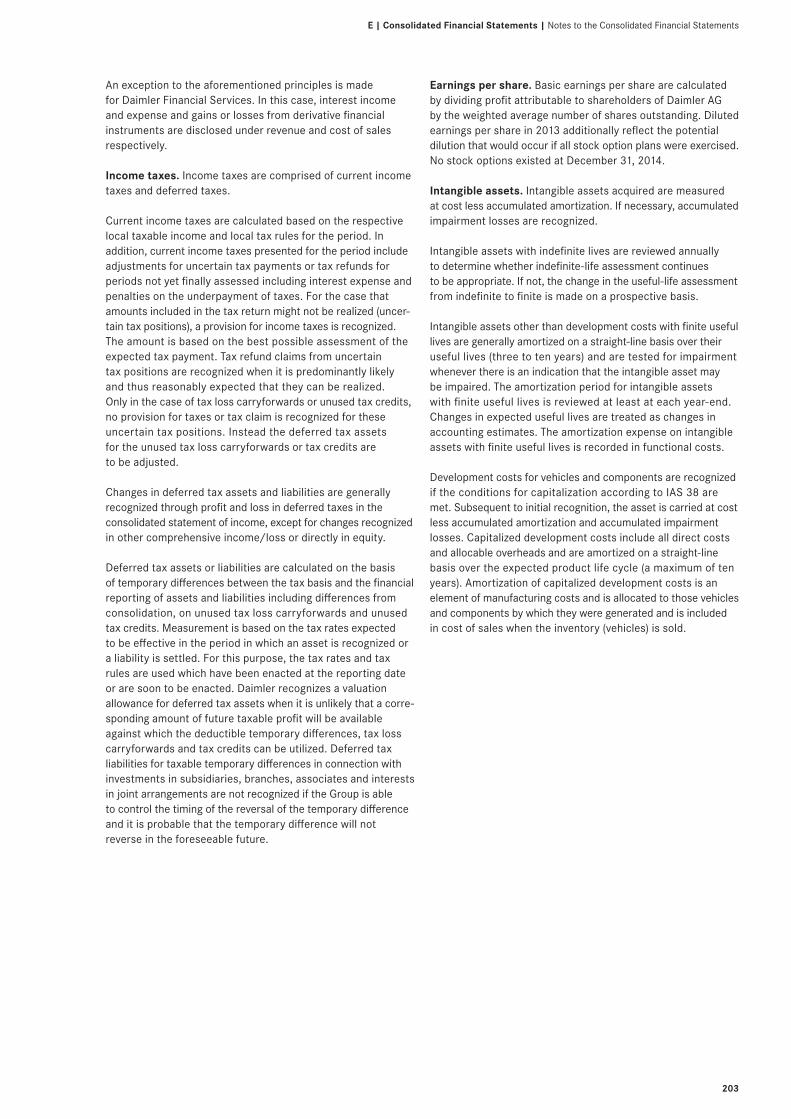
Earnings per share. Basic earnings per share are calculated by dividing profit attributable to shareholders of Daimler AG by the weighted average number of shares outstanding. Diluted earnings per share in 2013 additionally reflect the potential dilution that would occur if all stock option plans were exercised. No stock options existed at December 31, 2014.
Intangible assets. Intangible assets acquired are measured at cost less accumulated amortization. If necessary, accumulated impairment losses are recognized.
Intangible assets with indefinite lives are reviewed annually to determine whether indefinite-life assessment continues to be appropriate. If not, the change in the useful-life assessment from indefinite to finite is made on a prospective basis.
Intangible assets other than development costs with finite useful lives are generally amortized on a straight-line basis over their useful lives (three to ten years) and are tested for impairment whenever there is an indication that the intangible asset may be impaired. The amortization period for intangible assets with finite useful lives is reviewed at least at each year-end. Changes in expected useful lives are treated as changes in accounting estimates. The amortization expense on intangible assets with finite useful lives is recorded in functional costs.
Development costs for vehicles and components are recognized if the conditions for capitalization according to IAS 38 are met. Subsequent to initial recognition, the asset is carried at cost less accumulated amortization and accumulated impairment losses. Capitalized development costs include all direct costs and allocable overheads and are amortized on a straight-line basis over the expected product life cycle (a maximum of ten years). Amortization of capitalized development costs is an element of manufacturing costs and is allocated to those vehicles and components by which they were generated and is included in cost of sales when the inventory (vehicles) is sold.
204
Goodwill. For acquisitions, goodwill represents the excess of the consideration transferred over the fair values assigned to the identifiable assets proportionally acquired and liabilities assumed. Goodwill is accounted for at the subsidiaries in the functional currency of those subsidiaries.
In connection with obtaining control, non-controlling interest in the acquiree is principally recognized at the proportionate share of the acquiree’s identifiable assets, which are measured at fair value.
Property, plant and equipment. Property, plant and equipment are measured at acquisition or manufacturing costs less accumulated depreciation. If necessary, accumulated impair-ment losses are recognized.
The costs of internally produced equipment and facilities include all direct costs and allocable overheads. Acquisition or manufacturing costs include the estimated costs, if any, of dismantling and removing the item and restoring the site.
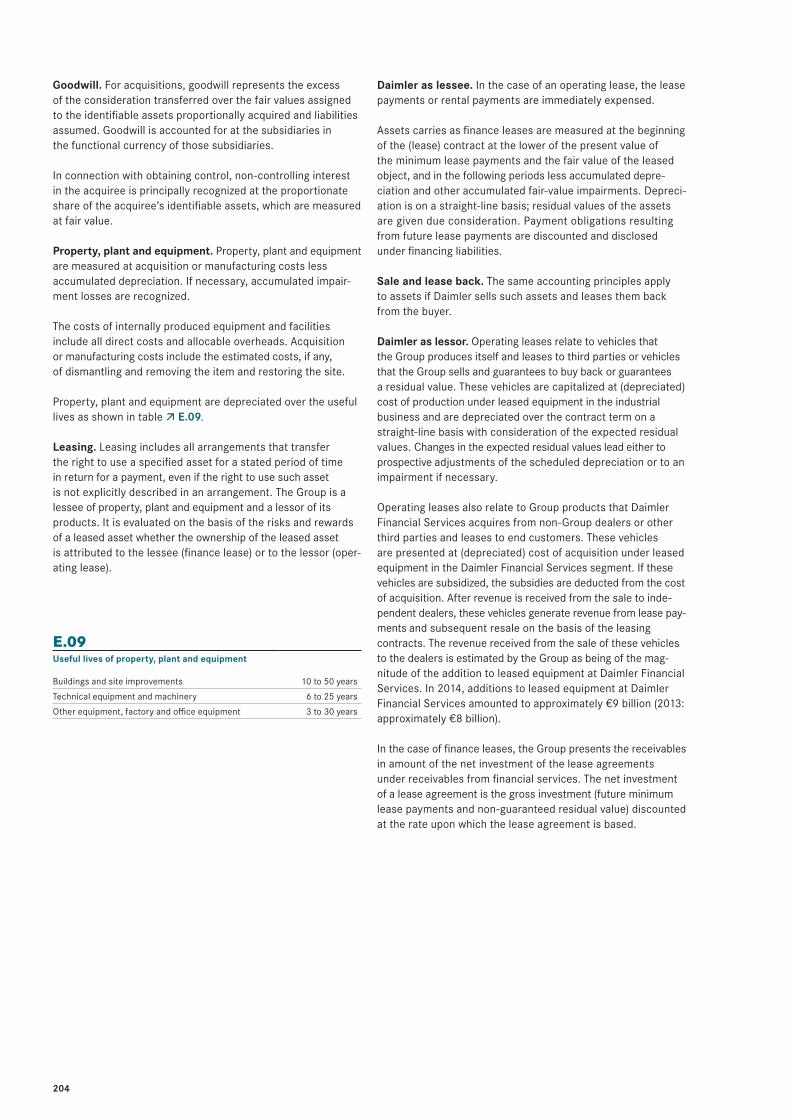
Property, plant and equipment are depreciated over the useful lives as shown in table E.09.
Leasing. Leasing includes all arrangements that transfer the right to use a specified asset for a stated period of time in return for a payment, even if the right to use such asset is not explicitly described in an arrangement. The Group is a lessee of property, plant and equipment and a lessor of its products. It is evaluated on the basis of the risks and rewards of a leased asset whether the ownership of the leased asset is attributed to the lessee (finance lease) or to the lessor (oper-ating lease).
Daimler as lessee. In the case of an operating lease, the lease payments or rental payments are immediately expensed.
Assets carries as finance leases are measured at the beginning of the (lease) contract at the lower of the present value of the minimum lease payments and the fair value of the leased object, and in the following periods less accumulated depre-ciation and other accumulated fair-value impairments. Depreci-ation is on a straight-line basis; residual values of the assets are given due consideration. Payment obligations resulting from future lease payments are discounted and disclosed under financing liabilities.
Sale and lease back. The same accounting principles apply to assets if Daimler sells such assets and leases them back from the buyer.
Daimler as lessor. Operating leases relate to vehicles that the Group produces itself and leases to third parties or vehicles that the Group sells and guarantees to buy back or guarantees a residual value. These vehicles are capitalized at (depreciated) cost of production under leased equipment in the industrial business and are depreciated over the contract term on a straight-line basis with consideration of the expected residual values. Changes in the expected residual values lead either to prospective adjustments of the scheduled depreciation or to an impairment if necessary. Operating leases also relate to Group products that Daimler Financial Services acquires from non-Group dealers or other third parties and leases to end customers. These vehicles are presented at (depreciated) cost of acquisition under leased equipment in the Daimler Financial Services segment. If these vehicles are subsidized, the subsidies are deducted from the cost of acquisition. After revenue is received from the sale to inde-pendent dealers, these vehicles generate revenue from lease pay-ments and subsequent resale on the basis of the leasing contracts. The revenue received from the sale of these vehicles to the dealers is estimated by the Group as being of the mag-nitude of the addition to leased equipment at Daimler Financial Services. In 2014, additions to leased equipment at Daimler Financial Services amounted to approximately €9 billion (2013: approximately €8 billion).
In the case of finance leases, the Group presents the receivables in amount of the net investment of the lease agreements under receivables from financial services. The net investment of a lease agreement is the gross investment (future minimum lease payments and non-guaranteed residual value) discounted at the rate upon which the lease agreement is based.
Useful lives of property, plant and equipment
Buildings and site improvements 10 to 50 years
Technical equipment and machinery 6 to 25 years
Other equipment, factory and office equipment 3 to 30 years
E.09

205
E | Consolidated Financial Statements | Notes to the Consolidated Financial Statements
Equity-method investments. On the date of acquisition, a positive difference between cost of acquisition and Daimler’s share of the fair values of the identifiable assets and liabilities of the associated company or joint venture are determined and recognized as investor level goodwill. The goodwill is included in the carrying amount of the equity-method investment. With step acquisition of an equity interest by which significant influence or joint control is achieved for the first time, the invest-ment is generally accounted for on the basis of IFRS 3 Business Combinations. This means that the previously held equity interest is remeasured on the date of acquisition; any resulting gain or loss is recognized through profit and loss. If an equity interest in an existing associated company is increased without any resulting change in significant influence, goodwill is deter-mined only for the additionally acquired interest; the previous investment is not remeasured at fair value.
Daimler reviews on each balance-sheet date whether there is any objective indication of impairments of equity-method investments. If such indications exist, the Group determines the impairment loss to be recognized. If the carrying amount exceeds the recoverable amount of an investment, the carrying amount is written down to the recoverable amount. The recov-erable amount is the greater of fair value less costs to sell and value in use. An impairment or impairment reversal is recog-nized in the consolidated statement of income under income/loss on equity-method investments; this also includes any gains and/or losses on the sale of equity-method investments.
Interim gains or losses (to be eliminated) from transactions with companies accounted for at-equity are recognized through profit and loss with corresponding adjustments of the investments’ carrying amounts.
Impairment of non-current non-financial assets. Daimler assesses at each reporting date whether there is an indi-cation that an asset may be impaired. If such indication exists, Daimler estimates the recoverable amount of the asset. The recoverable amount is determined for each individual asset unless the asset generates cash inflows that are not largely independent of those from other assets or groups of assets (cash-generating units). In addition, goodwill and other intangible assets with indefinite useful lives are tested annually for impairment; this takes place at the level of the cash- generating units. If the carrying amount of an asset or of a cash-generating unit exceeds the recoverable amount, an impair-ment loss is recognized for the difference.
The recoverable amount is the higher of fair value less costs of disposal and value in use. For cash-generating units, which at Daimler correspond to the reportable segments, Daimler in a first step determines the respective recoverable amount as value in use and compares it with the respective carrying amount (including goodwill). Value in use is measured by discounting expected future cash flows from the continuing use of the cash-generating units using a risk-adjusted interest rate. Future cash flows are determined on the basis of the long-term planning, which is approved by the Board of Manage-ment and which is valid at the date when the impairment test is conducted. This planning is based on expectations regarding future market share, the growth of the respective markets as well as the products’ profitability. The multi-year planning comprises a planning horizon until 2021 and therefore mainly covers the product life cycles of our automotive business. The rounded risk-adjusted interest rates used to discount cash flows, which are calculated for each segment, are currently unchanged from the previous year at 8% after taxes for the cash-generating units of the industrial business and 9% after taxes for Daimler Financial Services. Whereas the discount rate for Daimler Financial Services represents the cost of equity, the risk-adjusted interest rate for the cash-generating units of the industrial business is based on the weighted average cost of capital (WACC). These are calculated based on the capital asset pricing model (CAPM) taking into account current market expectations. In calculating the risk-adjusted interest rate for impairment test purposes, specific peer group information for beta factors, capital structure data and cost of debt are used. Periods not covered by the forecast are taken into account by recognizing a residual value (terminal value), which generally does not consider any growth rates. In addition, several sensitivity analyses are conducted. These show that even in case of more unfavorable premises for main influencing factors with respect to the original planning, no need for impairment exists. If value in use is lower than the carrying amount, fair value less costs of disposal is additionally calculated to determine the recoverable amount.
An assessment for assets other than goodwill is made at each reporting date as to whether there is any indication that previously recognized impairment losses may no longer exist or may have decreased. If this is the case, Daimler records a partial or entire reversal of the impairment; the carrying amount is thereby increased to its recoverable amount. However, the increased carrying amount may not exceed the carrying amount that would have been determined (net of depreciation) had no impairment loss been recognized in prior years.

206
Non-current assets held for sale and disposal groups. The Group classifies non-current assets or disposal groups as held for sale if the conditions of IFRS 5 Non-current assets held for sale and discontinued operations are fulfilled. In this case, the assets or disposal groups are no longer depreciated but measured at the lower of carrying amount and fair value less costs to sell. If fair value less costs to sell subsequently increases, any impairment loss previously recognized is reversed, this reversal is restricted to the impairment loss previously recognized for the assets or disposal group concerned. The Group generally discloses these assets or disposal groups separately in the consolidated statement of financial position.
Inventories. Inventories are measured at the lower of cost and net realizable value. The net realizable value is the estimated selling price less any remaining costs to sell. The cost of inventories is generally based on the specific identification method and includes costs incurred in acquiring the inventories and bringing them to their existing location and condition. Costs for large numbers of inventories that are interchangeable are allocated under the average cost formula. In the case of manufactured inventories and work in progress, cost also includes production overheads based on normal capacity.
Financial instruments. A financial instrument is any contract that gives rise to a financial asset of one entity and a financial liability or equity instrument of another entity. Financial instru-ments in the form of financial assets and financial liabilities are generally presented separately. Financial instruments are recognized as soon as Daimler becomes a party to the con-tractual provisions of the financial instrument. In the case of purchases or sales of financial assets through the regular market, Daimler uses the transaction date as the date of initial recognition or derecognition.
Upon initial recognition, financial instruments are measured at fair value. For the purpose of subsequent measurement, financial instruments are allocated to one of the categories mentioned in IAS 39 Financial Instruments: Recognition and Measurement. Transaction costs directly attributable to acquisition or issuance are considered by determining the carrying amount if the financial instruments are not mea-sured at fair value through profit or loss.
Financial assets. Financial assets primarily comprise receivables from financial services, trade receivables, receivables from banks, cash on hand, derivative financial assets and marketable securities and investments.
Financial assets at fair value through profit or loss. Financial assets at fair value through profit or loss include those financial assets designated as held for trading.
Derivatives, including embedded derivatives separated from the host contract, which are not classified as hedging instruments in hedge accounting, as well as shares and marketable debt securities acquired for the purpose of selling in the near term are classified as held for trading. Gains or losses on these financial assets are recognized in profit or loss.
Loans and receivables. Loans and receivables are non-derivative financial assets with fixed or determinable payments that are not quoted in an active market, such as receivables from financial services or trade receivables. After initial recognition, loans and receivables are subsequently carried at amortized cost using the effective interest method less any impairment losses. Gains and losses are recognized in the statement of income when the loans and receivables are impaired or derec-ognized. Interest effects on the application of the effective interest method are also recognized in profit or loss. Available-for-sale financial assets. Available-for-sale financial assets are non-derivative financial assets that are designated as available for sale or that are not classified in any of the preceding categories. This category includes equity instruments and debt instruments such as government bonds, corporate bonds and commercial papers.
After initial measurement, available-for-sale financial assets are measured at fair value, with unrealized gains or losses being recognized in other comprehensive income/loss. If objective evidence of impairment exists or if changes occur in the fair value of a debt instrument resulting from currency fluctuations, these changes are recognized in profit or loss. Upon disposal of financial assets, the accumulated gains and losses recognized in other comprehensive income/loss resulting from measure-ment at fair value are recognized in profit or loss. If a reliable estimate cannot be made of the fair value of an unquoted equity instrument, such as an investment in a German limited liability company, this instrument is measured at cost (less any impairment losses). Interest earned on available-for-sale financial assets is generally reported as interest income using the effective interest method. Dividends are recognized in profit or loss when the right of payment has been established.

207
E | Consolidated Financial Statements | Notes to the Consolidated Financial Statements
Cash and cash equivalents. Cash and cash equivalents consist primarily of cash on hand, checks and demand deposits at banks, as well as debt instruments and certificates of deposits with a remaining term when acquired of up to three months, which are not subject to any material value fluctuations. Cash and cash equivalents correspond with the classification in the consolidated statement of cash flows.
Impairment of financial assets. At each reporting date, the carrying amounts of financial assets other than those to be measured at fair value through profit or loss are assessed to determine whether there is objective evidence of impair-ment. Objective evidence may exist for example if a debtor is facing serious financial difficulties or there is a substantial change in the debtor’s technological, economic, legal or market environment. For quoted equity instruments, a significant or prolonged decline in fair value is additional objective evidence of possible impairment. Daimler has defined criteria for the significance and duration of a decline in fair value. A decline in fair value is deemed significant if it exceeds 20% of the carrying amount of the investment; a decline is deemed prolonged if the carrying amount exceeds the fair value for a period longer than nine months.
Loans and receivables. If there are objective indications that the value of a loan or receivable has to be impaired, the amount of the impairment loss is measured as the difference between the carrying amount of the asset and the present value of expected future cash flows (excluding expected future credit losses that have not yet been incurred), discounted at the original effective interest rate of the financial asset. The amount of the impairment loss is recognized in profit or loss. If, in a subsequent reporting period, the amount of the impairment loss decreases and the decrease can be attributed objectively to an event occurring after the impairment was recognized, the impairment loss recorded in prior periods is reversed and recognized in profit or loss.
In most cases, an impairment loss on loans and receivables (e.g. receivables from financial services including finance lease receivables and trade receivables) is recorded using allowance accounts. The decision to account for credit risks using an allowance account or by directly reducing the receivable depends on the estimated probability of the loss of receivables.
Available-for-sale financial assets. If an available-for-sale financial asset is impaired, the difference between its cost (net of any principal payment and amortization) and its current fair value (less any impairment loss previously recognized in the statement of income) is reclassified from other comprehensive income/loss to the statement of income. Reversals with respect to equity instruments classified as available for sale are recognized in other comprehensive income/loss. Reversals of impairment losses on debt instruments are recognized through the statement of income if the increase in fair value of the instrument can be objectively attributed to an event occur-ring after the impairment losses were recognized in the conso-lidated statement of income.
Offsetting financial instruments. Financial assets and financial liabilities are offset and the net amount is presented in the consolidated statement of financial position provided that an enforceable right currently exists to offset the amounts involved, and there is an intention either to carry out the offsetting on a net basis or to settle a liability when the related asset is sold.
Financial liabilities. Financial liabilities primarily include trade payables, liabilities to banks, bonds, derivative financial liabilities and other liabilities.
Financial liabilities measured at amortized cost. After initial recognition, financial liabilities are subsequently measured at amortized cost using the effective interest method. Financial liabilities at fair value through profit or loss. Financial liabilities at fair value through profit or loss include financial liabilities held for trading. Derivatives, (including embedded derivatives separated from the host contract) which are not used as hedging instruments in hedge accounting, are classified as held for trading. Gains or losses on liabilities held for trading are recognized in profit or loss.
Derivative financial instruments and hedge accounting. The Group uses derivative financial instruments exclusively for hedging financial risks that arise from its commercial business or refinancing activities. These are mainly interest rate risks, currency risks and commodity price risks.
Embedded derivatives are separated from the host contract, which is not measured at fair value through profit or loss, if an analysis shows that the economic characteristics and risks of embedded derivatives are not closely related to those of the host contract.

208
Derivative financial instruments are measured at fair value upon initial recognition and at each subsequent reporting date. The fair value of listed derivatives is equal to their positive or negative market value. If a market value is not available, fair value is calculated using standard financial valuation models such as discounted cash flow or option pricing models. Deriva-tives are presented as assets if their fair value is positive and as liabilities if the fair value is negative.
If the requirements for hedge accounting set out in IAS 39 are met, Daimler designates and documents the hedge relationship from the date a derivative contract is entered into as a fair value hedge, a cash flow hedge or a hedge of a net investment in a foreign business operation. In a fair value hedge, the fair value of a recognized asset or liability or an unrecognized firm commitment is hedged. In a cash flow hedge, the variability of cash flows to be received or paid from expected transactions related to a recognized asset or liability or a highly probable forecast transaction are hedged. The documentation of the hedg-ing relationship includes the objectives and strategy of risk management, the type of hedging relationship, the nature of the risk being hedged, the identification of the hedging instrument and the hedged item, as well as a description of the method used to assess hedge effectiveness. Hedging transactions are expected to be highly effective in achieving offsetting risks from changes in fair value or cash flows and are regularly assessed to determine that they have actually been highly effective throughout the financial reporting periods for which they are designated.
Changes in the fair value of derivative financial instruments are recognized periodically in either profit or loss or other compre-hensive income/loss, depending on whether the derivative is designated as a hedge of changes in fair value or cash flows. For fair value hedges, changes in the fair value of the hedged item and the derivative are recognized in profit or loss. For cash flow hedges, fair value changes in the effective portion of the hedging instrument after taxes are recognized in other comprehensive income/loss. Amounts recognized in other comprehensive income/loss are reclassified to the statement of income when the hedged underlying transaction affects the statement of income. The ineffective portions of fair value changes are recognized in profit or loss.
If derivative financial instruments do not or no longer qualify for hedge accounting because the qualifying criteria for hedge accounting are not or are no longer met, the derivative financial instruments are classified as held for trading and are measured at fair value through profit or loss.
Pensions and similar obligations. The measurement of defined benefit plans for pensions and other post-employment benefit obligations (medical care) in accordance with IAS 19 Employee Benefits is based on the projected unit credit method. Plan assets invested to cover defined benefit pension obliga-tions and other post-employment benefit obligations (medical care) are measured at fair value and offset against the corre-sponding obligations. For the valuation of defined benefit plans, differences between actuarial assumptions used and actual developments as well as changes in actuarial assumptions result in actuarial gains and losses, which have a direct impact on the conso lidated statement of financial position or on the consolidated statement of income.
The balance of defined benefit plans for pensions and other post-employment benefit obligations and plan assets (net pension obligation or net pension assets) accrues interest at the discount rate used as a basis for the measurement of the gross pension obligation. The resulting net interest expense or income is recognized in profit and loss under interest expense or interest income in the consolidated statement of income. The other expenses resulting from pension obligations and other post-employment benefit obligations (medical care), which mainly result from entitlements acquired during the year under review, are taken into consideration in the functional costs in the consolidated statement of income.
The discount factors used to calculate the present values of defined benefit pension obligations are to be determined by reference to market yields at the end of the reporting period on high-quality corporate bonds in the respective markets. For very long maturities, there are no high-quality corporate bonds available as a benchmark. The respective discount factors are estimated by extrapolating current market rates along the yield curve.
Gains or losses on the curtailment or settlement of a defined benefit plan are recognized when the curtailment or settlement occurs.

209
E | Consolidated Financial Statements | Notes to the Consolidated Financial Statements
Provisions for other risks. A provision is recognized when a liability to third parties has been incurred, an outflow of resources is probable and the amount of the obligation can be reasonably estimated. The amount recognized as a provi-sion represents the best estimate of the obligation at the balance sheet date. Provisions with an original maturity of more than one year are discounted to the present value of the expenditures expected to settle the obligation at the end of the reporting period. Provisions are regularly reviewed and adjusted as further information becomes available or circumstances change.
A provision for expected warranty costs is recognized when a product is sold, upon lease inception, or when a new warranty program is initiated. Estimates for accrued warranty costs are primarily based on historical experience.
Daimler records the fair value of an asset retirement obligation from the period in which the obligation is incurred.
Restructuring provisions are set up in connection with programs that materially change the scope of business performed by a segment or business unit or the manner in which business is conducted. In most cases, restructuring expenses include termination benefits and compensation payments due to the termination of agreements with suppliers and dealers. Restructuring provisions are recognized when the Group has a detailed formal plan that has either commenced imple-mentation or been announced.
Share-based payment. Share-based payment comprises cash-settled liability awards.
Liability awards are measured at fair value at each balance sheet date until settlement and are classified as provisions. The profit or loss of the period equals the addition to and/or the reversal of the provision during the reporting period and the dividend equivalent paid during the period, and is included in the functional costs.
Presentation in the consolidated statement of cash flows. Interest paid as well as interest and dividends received are classified as cash provided by/used for operating activities. The cash flows from short-term marketable debt securities with high turnover rates and significant amounts are offset and presented within cash used for investing activities.
2. Accounting estimates and assessments
In the consolidated financial statements, to a certain degree, estimates, assessments and assumptions have to be made which can affect the amounts and reporting of assets and liabili-ties, the reporting of contingent assets and liabilities on the balance sheet date and the amounts of income and expense reported for the period. The major items affected by such estimates, assessments and assumptions are described as follows. Actual amounts may differ from the estimates. Changes in the estimates, assessments and assumptions can have a material impact on the consolidated financial statements.
Recoverable amounts of cash-generating units and equity-method investments. In the context of impairment tests for non-financial assets, estimates have to be made to determine the recoverable amounts of cash-generating units. Assump-tions have to be made in particular with regard to future cash inflows and outflows for the planning period and the following periods. The estimates include assumptions regarding future market share and the growth of the respective markets as well as regarding the products’ profitability. On the basis of the impairment tests carried out in 2014, the recoverable amounts are substantially larger than the net assets of the Group’s cash-generating units.
When objective evidence of impairment is present, estimates and assessments also have to be made to determine the recoverable amount of an equity method financial investment. The determination of the recoverable amount is based on assumptions regarding future business developments for the determination of the expected future cash flows of that financial investment. See Note 13 for the presentation of carry-ing amounts and fair values of equity-method financial investments in listed companies.
Recoverable amount of equipment on operating leases. Daimler regularly reviews the factors determining the values of its leased vehicles. In particular, it is necessary to estimate the residual values of vehicles at the end of their leases, which constitute a substantial part of the expected future cash flows from leased assets. In this context, assumptions have to be made regarding the future supply of and demand for vehicles, as well as the development of vehicle prices. Those assumptions are determined either by qualified estimates or by publications provided by expert third parties; qualified estimates are based, as far as they are publicly available, on external data with con-sideration of internally available additional information such as historical experience of price developments and recent sale prices. The residual values thus determined serve as a basis for systematic depreciation; changes in residual values lead either to prospective adjustments of the systematic deprecia-tion or, in the case of a significant drop in expected residual values, to impairment. If systematic depreciation is prospec-tively adjusted, changes in estimates of residual values do not have a direct effect but are equally distributed over the remain-ing periods of the lease contracts.
210
Collectability of receivables from financial services. The Group regularly estimates the risk of default on receivables from financial services. Many factors are taken into consid-eration in this context, including historical loss experience, the size and composition of certain portfolios, current economic events and conditions and the estimated fair values and adequacy of collateral. Changes in economic conditions can lead to changes in our customers’ creditworthiness and to changes in used vehicle prices, which would have a direct effect on the market values of the vehicles assigned as collateral. Changes to the estimation and assessment of these factors influence the allowance for credit losses with a resulting impact on the Group’s net profit. See also Notes 14 and 32 for further information.
Product warranties. The recognition and measurement of provisions for product warranties is generally connected with estimates.
The Group provides various types of product warranties depending on the type of product and market conditions. Provisions for product warranties are generally recognized when vehicles are sold, upon lease inception, or when new warranty programs are initiated. Based on historical warranty claim expe rience, assumptions have to be made on the type and extent of future warranty claims and customer goodwill, as well as on possible recall or buyback campaigns for each model series. In addition, the estimates also include assump-tions on the amounts of potential repair costs per vehicle and the effects of possible time or mileage limits. The provisions are regularly adjusted to reflect new information.
Further information on provisions for other risks is provided in Note 23.
Legal proceedings. Various legal proceedings, claims and governmental investigations are pending against Daimler AG and its subsidiaries on a wide range of topics. Adverse decisions in one or more of those proceedings could require us to pay substantial compensatory and punitive damages or to undertake service actions, recall campaigns or other costly actions. Litigation and governmental investigations often involve complex legal issues and are connected with a high degree of uncertainty. Accordingly, the assessment of whether an obligation exists on the balance sheet date as a result of an event in the past, and whether a future cash outflow is likely and the obligation can be reliably estimated, largely depends on estimations by the management. Daimler regularly evaluates the current stage of legal proceedings, also with the involve-ment of external legal counsel. It is therefore possible that the amounts of provisions for pending or potential litigation will have to be adjusted due to future developments. Changes in estimates and premises can have a material effect on the Group’s future profitability. It is also possible that provisions accrued for some legal proceedings may turn out to be insufficient once such proceedings have ended. Daimler may also become liable for payments in legal proceedings no provisions were established for. Although the final resolution of any such proceedings could have a material effect on Daimler’s operating results and cash flows for a particular report-ing period, Daimler believes that it should not materially affect the Group’s financial position.
Pensions and similar obligations. The calculation of provisions for pensions and similar obligations and the related pension cost are based on various mathematical models. The calculations are subject to various assumptions on matters such as current actuarially developed probabilities (e.g. discount factors and cost-of-living increases), future fluctuations with regard to age and period of service, and experience with the probability of occurrence of pension payments, annuities or lump sums. As a result of changed market or economic conditions, the probabilities on which the influencing factors are based, may differ from current developments. The financial effects of deviations of the main factors are calculated with the use of sensitivity analyses. See Note 22 for further information.

211
E | Consolidated Financial Statements | Notes to the Consolidated Financial Statements
Income taxes. The calculation of income taxes of Daimler AG and its subsidiaries is based on the legislation and regulations applicable in the various countries. Due to their complexity, the tax items presented in the financial statements are possibly subject to different interpretation by taxpayers on the one hand and local tax authorities on the other. For the calculation of deferred tax assets, assumptions have to be made regarding future taxable income and the time of realization of the deferred tax assets. In this context, Daimler takes into consid-eration, among other things, the projected earnings from business operations, the effects on earnings of the reversal of taxable temporary differences, and realizable tax strategies. As future business developments are uncertain and are some-times beyond Daimler’s control, the assumptions to be made in connection with accounting for deferred tax assets are connected with a substantial degree of uncertainty. On each balance sheet date, Daimler carries out impairment tests on deferred tax assets on the basis of the planned taxable income in future financial years; if Daimler assesses that the prob-ability of future tax advantages being partially or fully unrealized is more than 50%, the deferred tax assets are impaired. Further information is provided in Note 9.
3. Consolidated Group
Composition of the Group. Table E.10 shows the composition of the Group.
The aggregate balance sheet totals of the subsidiaries, associated companies, joint ventures and joint operations accounted for at amortized cost whose business is non-active or of low volume and which are not material for the Group and the fair presentation of its profitability, liquidity and capital resources and financial position would amount to approxi-mately 1% of the Group’s balance sheet total; the aggregate revenues and the aggregate net profit would amount to approximately 1% of the Group’s revenue and net profit.
A detailed list of the companies included in the consolidated financial statements and of the equity investments of Daimler AG pursuant to Sections 285 und 313 of the German Commercial Code (HGB) is provided in the statement of investments. Further information is provided in Note 39. Acquisitions and disposals of consolidated subsidiaries. The increase in the number of consolidated subsidiaries also includes additions due to the Group’s internal restructuring, which had no effect on the balance sheet total or on net profit.
Structured entities. The structured entities of the Group are rental companies and asset-backed-securities (ABS) com-panies. The purpose of the rental companies primarily is the acquisition, renting and management of assets. The ABS com-panies are primarily used for the Group’s refinancing. The assets transferred to structured entities usually result from the Group’s leasing and sales financing business. Those entities refinance the purchase price by issuing securities.
At the reporting date, the Group has business relationships with 18 controlled structured entities, of which 16 are fully consoli-dated. In addition, the Group has relationships with 5 non-con-trolled structured entities. The unconsolidated structured entities are not material for the Group’s profitability, liquidity and capital resources and financial position.
Composition of the Group
2014
At December 31, 2013
Consolidated subsidiaries 327 320
Germany 60 49
International 267 271
Unconsolidated subsidiaries 80 92
Germany 33 35
International 47 57
Subsidiaries accounted for using the equity method
5
3
Germany 0 0
International 5 3
Joint operations accounted for using the equity method
3
3
Germany 1 1
International 2 2
Joint ventures accounted for using the equity method
13
15
Germany 3 4
International 10 11
Associated companies accounted for using the equity method
12
12
Germany – –
International 9 9
Joint operations, joint ventures and associated companies accounted for at (amortized) cost
30
29
Germany 15 13
International 15 16
470 474
E.10

212
Acquisitions and disposals in the year 2013
BAIC Motor. In 2013, BAIC Motor Corporation Ltd. (BAIC Motor) issued new shares to Daimler representing a 12% equity interest for a price of €627 million (including transaction costs). At the same time, BAIC Motor increased its equity interest in the joint venture Beijing Benz Automotive Co., Ltd. (BBAC) by 1% to 51%; Daimler increased its equity interest in the jointly owned sales company Beijing Mercedes-Benz Sales Service Co., Ltd. also by 1% to 51%. EADS. In 2013, Daimler sold its equity interest in the European Aeronautic Defence and Space Company EADS N.V. (since January 2, 2014: Airbus Group N.V.) and lost its significant influence on that company.
See Note 13 for further information on the associated companies accounted for using the equity method.
4. Revenue
Table E.11 shows the composition of revenue at Group level.
Revenue by segment E.87 and region E.89 is presented in Note 33.
5. Functional costs
Cost of sales. Items included in cost of sales are shown in table E.12.
Amortization expense of capitalized development costs in the amount of €1,212 million (2013: €1,134 million) is presented in expense of goods sold.
Selling expenses. In 2014, selling expenses amounted to €11,534 million (2013: €11,050 million). Selling expenses include direct selling costs as well as selling overhead expenses and consist of personnel expenses, material costs and other selling costs.
General administrative expenses. General administrative expenses amounted to €3,329 million in 2014 (2013: €3,188 million) and comprise expenses which were not attributable to production, sales or research and development functions, including personnel expenses, depreciation and amortization on fixed and intangible assets, and other administrative costs.
Research and non-capitalized development costs. Research and non-capitalized development costs were €4,532 million in 2014 (2013: €4,205 million) and primarily comprise personnel expenses and material costs.
Optimization programs. Measures and programs with implementation costs that materially impacted EBIT of the segments are briefly described below.
Acquisitions and disposals of equity-method investments
Disposals in the year 2014
RRPSH. In the first quarter of 2014, the Board of Management and the Supervisory Board of Daimler AG decided to sell the 50% equity interest in Rolls-Royce Power Systems Holding GmbH (RRPSH) to the partner Rolls-Royce Holdings plc (Rolls-Royce). For that purpose, Daimler exercised a put option on its stake in RRPSH that had been agreed upon with Rolls-Royce in 2011. The transaction was closed in the third quarter of 2014 and the agreed purchase price of €2,433 million was received. The gain on the sale amounted to €1,006 million. In addition, the measurement of the put option resulted in an expense of €118 million in the first quarter of 2014 (2013: €60 million).
Tesla. In the fourth quarter of 2014, the Group sold its 4% equity interest in Tesla Motors, Inc. (Tesla) and prematurely terminated the related hedging instrument. In the second quarter of 2014, the remeasurement of the Tesla shares after the end of Daimler’s significant influence on Tesla led to a non-cash gain of €718 million. An expense of approximately €124 million and a cash inflow of €625 million resulted from the hedging instrument and the sale of the equity interest. A gain of €594 million resulted in total.
Revenue
2014 2013
In millions of euros
Sales of goods 114,013 103,594
Rental and leasing business 12,245 10,966
Interest from the financial services business at Daimler Financial Services
3,180
3,040
Sales of other services 434 382
129,872 117,982
E.11
Cost of sales
2014 2013
In millions of euros
Expense of goods sold -91,574 -83,377
Depreciation of equipment on operating leases -5,049 -4,376
Refinancing costs at Daimler Financial Services
-1,443
-1,578
Impairment losses on receivables from financial services
-433
-416
Other cost of sales -3,189 -3,108
-101,688 -92,855
E.12

213
E | Consolidated Financial Statements | Notes to the Consolidated Financial Statements
In the course of the organizational focus on the divisions, Daimler started a restructuring program for its sales organization in Germany in 2014. Selected sales-and-service centers and outlets are being combined into car and commercial vehicles outlets in order to steadily increase the profitability of Daimler’s own dealer activities in the highly competitive German market. In addition, the restructuring program includes the plan to sell selected operations of the Group’s current sales network, primarily by the end of 2015. Due to their minor impact on the Group’s profitability, liquidity and capital resources and financial position, assets and liabilities held for sale are not presented separately in the consolidated statement of finan-cial position. At December 31, 2014, this disposal group’s assets amounted to €300 million and its liabilities amounted to €27 million. Measurement at fair value less cost to sell led to an impairment of property, plant and equipment in an amount of €93 million, which affected all automotive segments, but mainly the Mercedes-Benz Cars segment.
For these restructuring measures, the Group anticipates further negative effects on earnings of up to €0.5 billion in 2015 and 2016.
Moreover, in January 2013, Daimler Trucks announced work-force adjustments as part of its goal of increasing its profitability by stronger utilization of efficiencies. In the administrative area in Brazil, a voluntary redundancy program was launched in the first quarter of 2013 leading to a reduction of approxi-mately 1,000 jobs. In April 2014, Daimler Trucks announced the continuation of the workforce adjustments in Brazil with the start of a voluntary program that led to a reduction of about 1,500 jobs in 2014, mostly in the production area. These workforce adjustments also affected Daimler Buses to a small extent. In addition, in non-productive areas in Germany, a reduction of approximately 800 jobs is planned for which a program was started in May 2013, based on socially acceptable voluntary measures, that was continued in 2014.
The Group anticipates further expenses of up to €50 million in 2015 for these optimization programs at Daimler Trucks.
Finally, EBIT at Daimler Buses in 2013 included expenses related to the optimization measures started in Western Europe and North America in 2012. This optimization program was successfully completed by the end of 2013.
Table E.13 shows the effects of the optimization programs on the key figures of the segments.
In addition to the impairments of property, plant and equipment mentioned above, the expenses listed in table E.13 primarily relate to personnel measures and are included in the line items within the consolidated statement of income as shown in table E.14.
Cash effects resulting from the optimization programs are mainly expected until the end of 2017.
E.13Optimization programs
2014 2013
In millions of euros
Mercedes-Benz Cars
EBIT -81 –
Cash flow -5 –
Provisions for optimization programs1 – –
Daimler Trucks
EBIT -165 -116
Cash flow -170 -50
Provisions for optimization programs1 6 64
Mercedes-Benz Vans
EBIT -17 –
Cash flow -1 –
Provisions for optimization programs1 – –
Daimler Buses
EBIT -14 -39
Cash flow -25 -39
Provisions for optimization programs1 13 36
1 Amounts of provisions for optimization programs as of December 31.
E.14Income and expenses associated with optimization programs
2014 2013
In millions of euros
Cost of sales -95 -71
Selling expenses -33 -14
General administrative expenses -43 -50
Research and non-capitalized development costs -13 -13
Other operating expenses -93 -10
Other operating income – 3
-277 -155

214
6. Other operating income and expense
The composition of other operating income is shown in table E.16.
Income from costs recharged to third parties includes income from licenses and patents, shipping costs and other costs charged to third parties, with related expenses primarily within the functional costs.
Government grants and subsidies mainly comprise reimburse-ments relating to current part-time early retirement contracts and subsidies for alternative drive systems.
The composition of other operating expense is shown in table E.17.
Further information on the impairment of property, plant and equipment is provided in Note 5.
Other miscellaneous expense includes losses from disposals of current assets, changes in other provisions (partially in connection with legal proceedings) and additional miscellaneous items. The line item includes an addition of €600 million to the provision for EU Commission antitrust proceedings concerning European commercial vehicle manufacturers.
7. Other financial income/expense, net
Table E.18 shows the components of other financial income/expense, net.
In 2014, miscellaneous other financial income/expense, net includes income from the disposal of the 50% equity interest in RRPSH of €1,006 million (2013: €0 million) as well as income from the disposal of the Tesla shares of €88 million (2013: €0 million). It also includes expenses of €118 million (2013: €60 million) from the measurement of the RRPSH put option and of €212 million (2013: €23 million) from hedging the Tesla share price. In 2013, a loss of €140 million on the sale of the remaining EADS shares is disclosed.
8. Interest income and interest expense
Table E.19 shows the components of interest income and interest expense.
Personnel expenses and average number of employees. Personnel expenses included in the consolidated statement of income amounted to €19,607 million in 2014 (2013: €18,753 million). The average numbers of people employed are shown in table E.15.
Due to the organizational focus of the divisions on their customers and markets, the numbers of employees previously reported under sales and marketing are included in the respective divisions in 2014. This does not apply, however, to the Group’s own sales-and-service centers in Germany and the logistics center in Germersheim, whose employees are included under group functions and services as of 2014. The employees previously shown under Other are also included herein.
Information on the total remuneration of the current and former members of the Board of Management and the current members of the Supervisory Board is provided in Note 37.
Average number of employees
2014 2013
Mercedes-Benz Cars 128,883 97,003
Daimler Trucks 83,343 80,186
Mercedes-Benz Vans 16,147 15,073
Daimler Buses 16,419 16,557
Daimler Financial Services 8,594 7,937
Group functions and services 26,471 –
Sales and marketing – 52,151
Other – 6,477
279,857 275,384
E.15
Other operating income
2014 2013
In millions of euros
Income from costs recharged to third parties 1,039 840
Government grants and subsidies 92 86
Gains on sales of property, plant and equipment 63 47
Rental income, not relating to sales financing 59 45
Reimbursements under insurance policies 19 26
Other miscellaneous income 487 486
1,759 1,530
E.16
Other operating expense
2014 2013
In millions of euros
Losses on sales of property, plant and equipment -120 -88
Impairment on property, plant and equipment -93 –
Other miscellaneous expenses -947 -311
-1,160 -399
E.17

215
E | Consolidated Financial Statements | Notes to the Consolidated Financial Statements
9. Income taxes
Profit before income taxes is comprised as shown in table E.20.
Profit before income taxes in Germany includes profit/loss from equity-method investments if the equity interests in those companies are held by German companies.
Table E.21 shows the components of income taxes.
The current tax expense includes tax benefits at German and foreign companies of €53 million (2013: €1,038 million) recognized for prior periods.
The deferred tax expense is comprised of the components shown in table E.22.
For German companies, in 2014 and 2013, deferred taxes were calculated using a federal corporate income tax rate of 15%, a solidarity tax surcharge of 5.5% on each year’s federal corpo-rate income taxes, and a trade tax rate of 14%. In total, the tax rate applied for the calculation of German deferred taxes in both years amounted to 29.825%. For non-German com-panies, the deferred taxes at period-end were calculated using the tax rates of the respective countries. Table E.23 shows a reconciliation of expected income tax expense to actual income tax expense determined using the unchanged applicable German combined statutory tax rate of 29.825%.
In 2014 and 2013, the Group released valuation allowances on deferred tax assets of foreign subsidiaries. The resulting tax benefits are included in the line item change of valuation allowance on deferred tax assets.
Tax-free income and non-deductible expenses include all other effects at foreign and German companies relating to tax-free income and non-deductible expenses, for instance tax-free gains included in net periodic pension costs at the German com-panies and tax-free results of our equity-method investments. Moreover, the line item includes tax-free gains realized on the sale of RRPSH in 2014 and on the sale and remeasurement of EADS shares in 2013 as well as non-deductible expenses in connection with the EU commission’s ongoing antitrust pro-ceedings concerning European commercial vehicle manu-facturers in 2014. Furthermore, in 2013, the line item also includes tax benefits relating to tax assessments of prior years. The tax benefits relating to tax assessments of prior years consist of the current tax benefits recognized for prior periods as well as partly offsetting deferred tax expenses recognized for prior periods.
Other financial income/expense, net
2014 2013
In millions of euros
Expense from compounding of provisions and effects of changes in discount rates1
-353
-95
Miscellaneous other financial income/expense, net 811 -254
458 -349
1 Excluding the expense from compounding provisions for pensions and similar obligations.
E.18
Interest income and interest expense
2014 2013
In millions of euros
Interest income
Net interest income on the net assets of defined benefit pension plans
3
2
Interest and similar income 142 210
145 212
Interest expense
Net interest expense on the net obligation from defined benefit pension plans
-350
-355
Interest and similar expense -365 -529
-715 -884
E.19
Profit before income taxes
2014 2013
In millions of euros
German companies 2,960 5,630
Non-German companies 7,213 4,509
10,173 10,139
E.20
Components of income taxes
2014 2013
In millions of euros
Current taxes
German companies -1,125 202
Non-German companies -1,395 -1,007
Deferred taxes
German companies 242 -180
Non-German companies -605 -434
-2,883 -1,419
E.21
Components of deferred tax expense
2014 2013
In millions of euros
Deferred taxes -363 -614
due to temporary differences -44 -710
due to tax loss carryforwards and tax credits -319 96
E.22

216
Deferred tax assets and deferred tax liabilities are offset if the deferred tax assets and liabilities relate to income taxes levied by the same taxation authority and if there is the right to set off current tax assets against current tax liabilities. In the presentation of deferred tax assets and liabilities in the consolidated statement of financial position, no difference is made between current and non-current. In the consolidated statement of financial position, deferred tax assets and liabilities are presented as shown in table E.24.
In respect of each type of temporary difference and in respect of each type of unutilized tax loss carryforwards and unutilized tax credits, the deferred tax assets and liabilities before offset are summarized in table E.25.
The development of deferred tax assets, net, is shown in table E.26.
Including the items recognized in other comprehensive income/loss (including items from equity-method investments), the expense for income taxes is comprised as shown in table E.27.
In the consolidated statement of financial position, the valuation allowances on deferred tax assets, which are mainly attribut-able to foreign companies, decreased by €163 million compared to December 31, 2013. On the one hand, this is a result of the reversal of valuation allowances of €276 million recorded in net profit. On the other hand, an increase of the valuation allowance was recognized in equity, mainly due to currency translation.
At December 31, 2014, the valuation allowance on deferred tax assets relates, among other things, to corporate income tax loss carryforwards (€484 million), tax loss carryforwards in connection with capital losses (€10 million) and tax credits (€11 million). €20 million of the deferred tax assets for corporate income tax loss carryforwards adjusted by a valuation allow-ance relates to tax loss carryforwards which expire at various dates from 2018 through 2019, €152 million relates to tax loss carryforwards which expire at various dates from 2020 through 2024, €49 million relates to tax loss carryforwards which expire at various dates from 2025 through 2034 and €263 million relates to tax loss carryforwards which can be carried forward indefinitely. The deferred tax assets on loss carryforwards connected with capital losses were partly reduced by valuation allowances because the carryforward periods of those losses are limited and can only be utilized with future capital gains. The tax loss carryforwards connected with capital losses expire at the end of 2016. Of the tax credit carryforwards adjusted by a valuation allowance, €5 million expire at various dates from 2015 through 2018 and €4 million expire at various dates from 2020 through 2034; €2 million relates to tax credits which can be carried forward indefinitely.
Reconciliation of expected income tax expense to actual income tax expense
2014 2013
In millions of euros
Expected income tax expense -3,034 -3,024
Foreign tax rate differential -91 -51
Trade tax rate differential 21 54
Tax law changes -21 -10
Change of valuation allowance on deferred tax assets
276
143
Tax-free income and non-deductible expenses -44 1,546
Other 10 -77
Actual income tax expense -2,883 -1,419
E.23
E.24 Deferred tax assets and liabilities
At December 31,2014 2013
In millions of euros
Deferred tax assets 4,124 1,829
Deferred tax liabilities -1,070 -892
Deferred tax assets, net 3,054 937
Split of tax assets and liabilities before offset
At December 31,2014 2013
In millions of euros
Intangible assets 52 59
Property, plant and equipment 327 367
Equipment on operating leases 1,273 1,131
Inventories 752 603
Receivables from financial services 275 275
Other financial assets 4,349 3,406
Tax loss carryforwards and unused tax credits 3,323 3,542
Provisions for pensions and similar obligations 958 818
Other provisions 2,313 1,862
Liabilities 1,384 614
Deferred income 1,186 899
Other 315 292
16,507 13,868
Valuation allowances -918 -1,081
Deferred tax assets, gross 15,589 12,787
Development costs -2,162 -2,195
Other intangible assets -73 -175
Property, plant and equipment -1,639 -1,442
Equipment on operating leases -6,053 -4,940
Inventories -50 -72
Receivables from financial services -736 -656
Other financial assets -352 -249
Other assets -189 -98
Provisions for pensions and similar obligations -872 -1,604
Other provisions -177 -159
Other -232 -260
Deferred tax liabilities, gross -12,535 -11,850
Deferred tax assets, net 3,054 937
E.25

217
E | Consolidated Financial Statements | Notes to the Consolidated Financial Statements
Furthermore, the valuation allowance primarily relates to temporary differences as well as net operating losses for state and local taxes at the US companies. Daimler believes that it is more likely than not that those deferred tax assets cannot be utilized. In 2014 and prior years, the Group had tax losses at several subsidiaries in several countries. After offsetting the deferred tax assets with deferred tax liabilities, the deferred tax assets not subject to valuation allowances amounted to €466 million for those subsidiaries. Daimler believes it is more likely than not that future taxable income will be sufficient to allow utilization of the deferred tax assets. Daimler’s current estimate of the amount of deferred tax assets that is considered realizable may change in the future, necessitating higher or lower valuation allowances.
The retained earnings of non-German subsidiaries are largely intended to be reinvested in those operations. The Group did not recognize deferred tax liabilities on retained earnings of non-German subsidiaries of €21,242 million (2013: €16,419 million). If earnings are paid out as dividends, an amount of 5% would be taxed under German taxation rules and, if applicable, with non-German withholding tax. Additionally, income tax conse-quences may arise if the dividends first have to be distributed by a non-German subsidiary to a non-German holding company. Normally, the distribution would lead to an additional income tax expense. It is not practicable to estimate the amount of tax-able temporary differences for these undistributed foreign earnings.
The Group has various unresolved issues concerning open income tax years with the tax authorities in a number of jurisdictions. Daimler believes that it has recognized adequate provisions for any future income taxes that may be owed for all open tax years. As a result of future adjudications or changes in the opinions of the fiscal authorities, it cannot be ruled out that Daimler might receive tax refunds for previous years.
Change of deferred tax assets, net
2014 2013
In millions of euros
Deferred tax assets, net as of January 1 937 2,465
Deferred tax expense -363 -614
Change in deferred tax expense/benefit on financial assets available-for-sale included in other comprehensive income/loss
-6
-6
Change in deferred tax expense/benefit on derivative financial instruments included in other comprehensive income/loss
800
-338
Change in deferred tax expense/benefiton actuarial gains/losses from defined benefit pension plans
1,682
-372
Other changes1 4 -198
Deferred tax assets, net as of December 31 3,054 937
1 Primarily effects from currency translation.
E.26
Tax expense in equity
2014 2013
In millions of euros
Income tax expense -2,883 -1,419
Income tax expense/benefit recorded in other reserves
2,476
-772
-407 -2,191
E.27
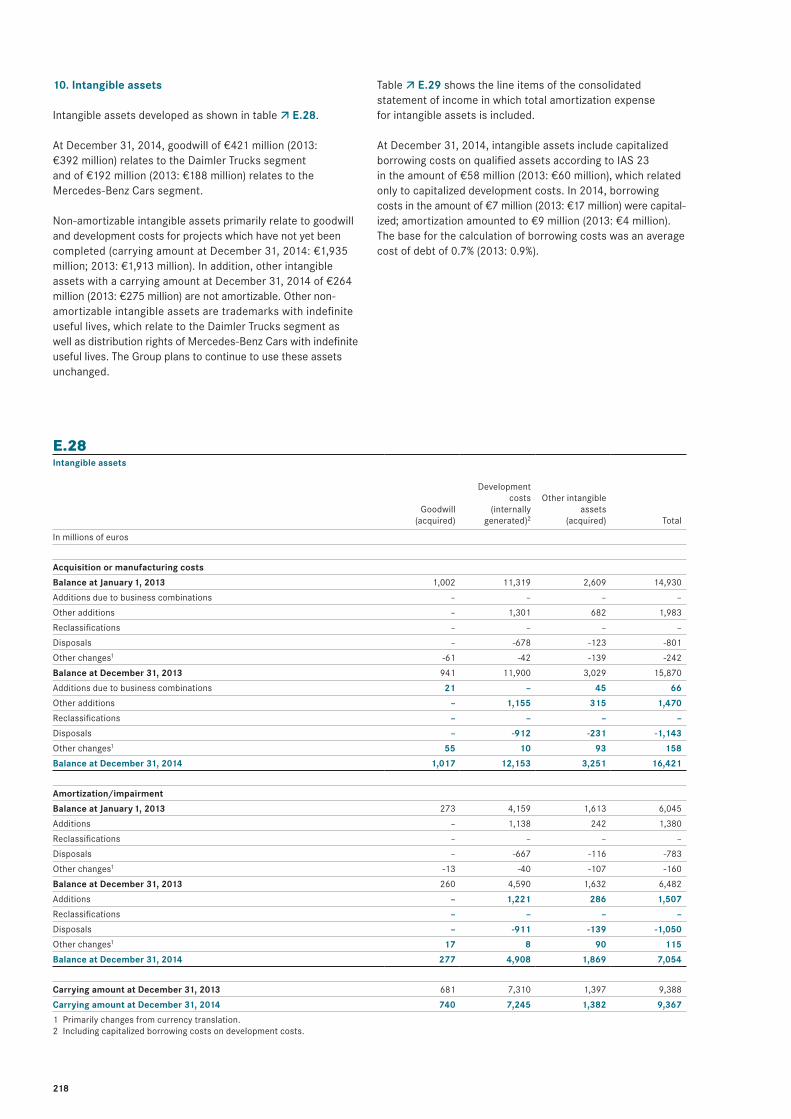
218
Table E.29 shows the line items of the consolidated statement of income in which total amortization expense for intangible assets is included.
At December 31, 2014, intangible assets include capitalized borrowing costs on qualified assets according to IAS 23 in the amount of €58 million (2013: €60 million), which related only to capitalized development costs. In 2014, borrowing costs in the amount of €7 million (2013: €17 million) were capital-ized; amortization amounted to €9 million (2013: €4 million). The base for the calculation of borrowing costs was an average cost of debt of 0.7% (2013: 0.9%).
10. Intangible assets
Intangible assets developed as shown in table E.28.
At December 31, 2014, goodwill of €421 million (2013: €392 million) relates to the Daimler Trucks segment and of €192 million (2013: €188 million) relates to the Mercedes-Benz Cars segment.
Non-amortizable intangible assets primarily relate to goodwill and development costs for projects which have not yet been completed (carrying amount at December 31, 2014: €1,935 million; 2013: €1,913 million). In addition, other intangible assets with a carrying amount at December 31, 2014 of €264 million (2013: €275 million) are not amortizable. Other non-amortizable intangible assets are trademarks with indefinite useful lives, which relate to the Daimler Trucks segment as well as distribution rights of Mercedes-Benz Cars with indefinite useful lives. The Group plans to continue to use these assets unchanged.
Intangible assets
Goodwill (acquired)
Development costs
(internally generated)2
Other intangible
assets (acquired)
Total
In millions of euros
Acquisition or manufacturing costs
Balance at January 1, 2013 1,002 11,319 2,609 14,930
Additions due to business combinations – – – –
Other additions – 1,301 682 1,983
Reclassifications – – – –
Disposals – -678 -123 -801
Other changes1 -61 -42 -139 -242
Balance at December 31, 2013 941 11,900 3,029 15,870
Additions due to business combinations 21 – 45 66
Other additions – 1,155 315 1,470
Reclassifications – – – –
Disposals – -912 -231 -1,143
Other changes1 55 10 93 158
Balance at December 31, 2014 1,017 12,153 3,251 16,421
Amortization/impairment
Balance at January 1, 2013 273 4,159 1,613 6,045
Additions – 1,138 242 1,380
Reclassifications – – – –
Disposals – -667 -116 -783
Other changes1 -13 -40 -107 -160
Balance at December 31, 2013 260 4,590 1,632 6,482
Additions – 1,221 286 1,507
Reclassifications – – – –
Disposals – -911 -139 -1,050
Other changes1 17 8 90 115
Balance at December 31, 2014 277 4,908 1,869 7,054
Carrying amount at December 31, 2013 681 7,310 1,397 9,388
Carrying amount at December 31, 2014 740 7,245 1,382 9,367
1 Primarily changes from currency translation.2 Including capitalized borrowing costs on development costs.
E.28

219
E | Consolidated Financial Statements | Notes to the Consolidated Financial Statements
Amortization expense for intangible assets in the consolidated statement of income
2014 2013
In millions of euros
Cost of sales 1,344 1,319
Selling expenses 92 30
General administrative expenses 41 25
Research and non-capitalized development costs 30 6
1,507 1,380
E.29
Property, plant and equipment
Land, leasehold
improvements and buildings including
buildings on land owned by others
Technical equipment
and machinery
Other
equipment, factory and
office equipment
Advance payments
relating to plant and equipment
and construction in progress
Total
In millions of euros
Acquisition or manufacturing costs
Balance at January 1, 2013 14,941 20,760 20,282 2,260 58,243
Additions due to business acquisitions – – – – –
Other additions 218 1,181 1,853 1,833 5,085
Reclassifications 199 918 536 -1,666 -13
Disposals -76 -945 -700 -27 -1,748
Other changes1 -447 -339 -463 -127 -1,376
Balance at December 31, 2013 14,835 21,575 21,508 2,273 60,191
Additions due to business acquisitions – – – – –
Other additions 228 833 1,415 2,267 4,743
Reclassifications 238 1,239 568 -2,036 9
Disposals -158 -930 -1,066 -32 -2,186
Other changes1 253 362 461 49 1,125
Balance at December 31, 2014 15,396 23,079 22,886 2,521 63,882
Depreciation/impairment
Balance at January 1, 2013 7,968 14,237 15,438 1 37,644
Additions 258 1,070 1,664 – 2,992
Reclassifications – – – – –
Disposals -32 -875 -625 – -1,532
Other changes1 -150 -207 -335 . -692
Balance at December 31, 2013 8,044 14,225 16,142 1 38,412
Additions2 420 1,210 1,861 10 3,501
Reclassifications – 108 -108 – –
Disposals -118 -825 -970 – -1,913
Other changes1 108 241 352 -1 700
Balance at December 31, 2014 8,454 14,959 17,277 10 40,700
Carrying amount at December 31, 2013 6,791 7,350 5,366 2,272 21,779
Carrying amount at December 31, 2014 6,942 8,120 5,609 2,511 23,182
1 Primarily changes from currency translation. 2 Includes impairments of property, plant and equipment of €93 million in connection with the planned disposal of selected sites
of the Group’s own sales network.
E.30

220
11. Property, plant and equipment
Property, plant and equipment developed as shown in table E.30.
In 2014, government grants of €47 million (2013: €34 million) were deducted from property, plant and equipment.
Property, plant and equipment include buildings, technical equipment and other equipment capitalized under finance lease arrangements with a carrying amount of €238 million (2013: €262 million). In 2014, additions to and depreciation expense on assets under finance lease arrangements amounted to €19 million (2013: €17 million) and €40 million (2013: €67 million), respectively.
12. Equipment on operating leases
The development of equipment on operating leases is shown in table E.31.
At December 31, 2014, equipment on operating leases with a carrying amount of €4,367 million is pledged as security for liabilities from ABS transactions related to a securitization transaction of future lease payments on operating leases and related vehicles (2013: €5,084 million) (see also Note 24).
Minimum lease payments. Non-cancelable future lease payments to Daimler for equipment on operating leases are due as presented in table E.32.
Equipment on operating leases
In millions of euros
Acquisition or manufacturing costs
Balance at January 1, 2013 32,345
Additions due to business combinations –
Other additions 15,953
Reclassifications 13
Disposals -12,458
Other changes1 -975
Balance at December 31, 2013 34,878
Additions due to business combinations –
Other additions 18,052
Reclassifications -9
Disposals -14,479
Other changes1 2,486
Balance at December 31, 2014 40,928
Depreciation/impairment
Balance at January 1, 2013 6,287
Additions 4,376
Reclassifications –
Disposals -3,733
Other changes1 -212
Balance at December 31, 2013 6,718
Additions 5,049
Reclassifications –
Disposals -4,341
Other changes1 452
Balance at December 31, 2014 7,878
Carrying amount at December 31, 2013 28,160
Carrying amount at December 31, 2014 33,050
1 Primarily changes from currency translation.
E.31
Maturity of minimum lease payments for equipment on operating leases
At December 31,2014 2013
In millions of euros
Maturity
within one year 5,742 4,877
between one and five years 5,990 4,692
later than 5 years 48 112
11,780 9,681
E.32

221
E | Consolidated Financial Statements | Notes to the Consolidated Financial Statements
13. Equity-method investments
Table E.33 shows the carrying amounts and profits/losses from equity-method investments.
Table E.34 presents key figures on interests in associated companies accounted for using the equity method in the Group’s consolidated financial statements.
Summarized carrying amounts and profits/losses from equity-method investments
Associated companies
Joint ventures
Joint operations
Subsidiaries
Total
In millions of euros
At December 31, 2014
Equity investment1 1,795 448 44 7 2,294
Equity result1 864 26 5 2 897
At December 31, 2013
Equity investment1 3,029 358 40 5 3,432
Equity result1 3,469 -130 5 1 3,345
1 Including investor-level adjustments.
E.33
Key figures on interests in associated companies accounted for using the equity method
EADS RRPSH BBAC BAIC Motor Kamaz Others Total
In millions of euros
At December 31, 2014
Equity interest (in %) – – 49.0 10.1 15.0 – –
Stock market price1 – – – 730 38 – –
Equity investment2 – – 852 686 71 186 1,795
Equity result2 – 13 133 34 –32 716 864
Dividends to Daimler – 92 – 10 1 – –
At December 31, 2013
Equity interest (in %) – 50.0 49.0 12.0 15.0 – –
Stock market price1 – – – – 121 – –
Equity investment2 – 1.494 640 595 155 145 3.029
Equity result2 3.397 62 84 – 12 –86 3.469
Dividends to Daimler – 71 101 23 2 – –
1 Proportionate stock market prices. 2 Including investor-level adjustments.
E.34

222
Airbus Group N.V. (formerly EADS). The Group reported its investment in and its proportionate share in the profits and losses of the European Aeronautic Defence and Space Company EADS N.V. (EADS), a global leader in aerospace, defense and related services, in the reconciliation of total segments’ assets to Group assets and total segments’ EBIT to Group EBIT, respectively, in the segment reporting.
At December 31, 2012 Daimler disclosed an equity interest of approximately 14.9% in EADS. Because of the agreed participation rights in the Supervisory Board, Daimler was able to exercise significant influence on EADS. The 14.9% interest in EADS was held by a subsidiary of Daimler which in 2007 issued equity interests to investors in exchange for cash. As a result of that transaction, the Group reported a non-controlling inter-est in its consolidated statement of financial position repre-senting the investor’s ownership (“Dedalus-investors”) of the consolidated subsidiary that issued the equity interest. At December 31, 2012, the amount reported as non-controlling interest reflected the investor’s 50% share in the net assets of that subsidiary.
On March 27, 2013, the Extraordinary Shareholders’ Meeting of EADS approved the new management and shareholder structure. Subsequently, the shareholders’ pact concluded in 2000 was dissolved and replaced with a new shareholders’ pact without the participation of Daimler on April 2, 2013. At the same time, EADS shares which were previously held by Daimler but were economically allocable to the Dedalus investors were transferred to the Dedalus investors. With the dissolution of the previous shareholders’ pact, Daimler lost its significant influence on EADS. As a result of that loss and of the transfer of the EADS shares to the Dedalus investors, the EADS shares were remeasured through profit or loss at the then higher stock-market price of EADS shares on April 2, 2013. Overall, this resulted in income of €3,356 million, which was recognized in Group EBIT in 2013. Of that amount, €1,669 million was allocable to Daimler shareholders and €1,687 million was allocable to the Dedalus investors. The income of €3,356 million was disclosed within equity-method investments and was therefore solely a book gain with no impact on cash. Furthermore, income of €41 million resulted from measurement using the equity method, thereof €34 million in the first quarter of 2013 and €7 million in the second quarter of 2013.
On April 16, 2013, the Group announced that it would sell its remaining stake of approximately 7.4% in EADS through an accelerated placement procedure. The sale, which took place on April 17, 2013, at an offer price of €37 per EADS share, led to an additional expense of €184 million in Group EBIT in 2013. The additional expense was disclosed within other financial expenses, net, and resulted from the fall in the EADS share price since April 2, 2013. The sale generated a cash inflow of €2,239 million in 2013. Following the conclusion of the trans-action, Daimler no longer holds any shares in EADS. Moreover, in 2013, the Group entered into cash-settled contracts with both Goldman Sachs and Morgan Stanley, which allowed a limited upside participation in the EADS share price until the end of 2013. This resulted in income of €44 million disclosed within other financial expenses, net, for the year 2013.
RRPSH/RRPS (formerly Tognum AG). Rolls-Royce Power Systems Holding GmbH (RRPSH) and its subsidiary Rolls-Royce Power Systems AG (RRPS) operate in development, manu-facturing, distribution and service, in particular in the fields of reciprocating engines, energy generation and other engines and related components. RRPSH and its subsidiary procure engines, other parts and services from Daimler AG.
On September 25, 2012, the dependent company RRPS, formerly Tognum AG (Tognum) and the controlling company RRPSH concluded a control and profit and loss transfer agreement, resulting in Tognum subordinating the management of its company under the control of RRPSH and committing to transfer its entire profits to RRPSH. On November 15, 2012, Tognum’s shareholders’ meeting approved the control and profit and loss transfer agreement, which was then entered in the commercial register on December 19, 2012.
On January 1, 2013, Rolls-Royce assumed, as contractually agreed, control over RRPSH and RRPSH was included as a subsidiary in the consolidated financial statements of Rolls-Royce. Daimler continued to exercise significant influence on Tognum through its equity interest in RRPSH.
The decision of the regional court of Frankfurt am Main of November 15, 2011 to transfer Tognum AG shares which are not already owned by RRPSH in return for compensation (a “squeeze-out“ under German takeover law) took effect in March 2013 and RRPSH has held 100% of Tognum’s shares since then.
The objections to the decision were withdrawn because the appellant’s representatives and RRPSH agreed to an out-of-court settlement. The minority shareholders of Tognum AG, whose shares were transferred to RRPSH in the context of the “squeeze-out” under German takeover law, and the former shareholders of Tognum AG, who accepted the compensation of the control and profit and loss transfer agreement effective December 19, 2012, received compensation of €31.61 per share pursuant to the out-of-court settlement.
In 2011, Rolls-Royce granted Daimler the right to exercise a put option on the shares it held in RRPSH at a price which generally hedged Daimler’s investment in RRPSH. Starting on January 1, 2013, the put option had a duration of six years. On December 31, 2013, the value of this option was €118 million. The option was recognized as an asset to be measured at fair value through profit or loss. The change in the fair value of the option during 2013 resulted in an expense of €60 million, which was recognized in other financial expense, net. The carrying amount of this option, which was presented under other financial assets, as well as changes in its fair value were recognized in the segment reporting as corporate items in the reconciliation to Group figures. Further details of the put option are provided in Note 31.

223
E | Consolidated Financial Statements | Notes to the Consolidated Financial Statements
In March 2014, Daimler decided to sell its 50% equity interest in the investment in RRPSH to its partner Rolls-Royce. For that purpose, Daimler exercised the put option on its stake in RRPSH that was agreed upon with Rolls-Royce in 2011. The carrying amount of the equity interest of €1,415 million, which was allocated to the Daimler Trucks segment, was reclassified to assets held for sale. Measurement using the equity method was ended. The proportionate share in the results of RRPSH was allocated to the Daimler Trucks segment. In mid-April 2014, the sale price of €2,433 million was agreed upon. The trans-action was consummated on August 26, 2014, when antitrust law and foreign-trade law approvals had been obtained; the board members and management representatives from Daimler in RRPSH companies resigned. The proceeds of the sale of €1,006 million are classified as other financial result and, in the segment reporting, are presented in the reconciliation of total segments’ EBIT to Group EBIT.
BBAC. Beijing Benz Automotive Co., Ltd. (BBAC) was founded by Daimler Greater China Ltd. (DGRC), Daimler AG und BAIC Motor Corporation Ltd. (BAIC Motor) as a joint venture. BBAC produces and distributes Mercedes-Benz passenger cars and spare parts in China. In 2013, Daimler participated in a capital increase and made a payment of approximately €160 million. The Chinese partner BAIC Motor participated with the same amount. On November 18, 2013, BAIC Motor increased its stake in BBAC by 1% to 51% by way of a capital increase in which Daimler did not participate. As a result of this transaction, Daimler’s equity interest in BBAC decreased to 49% and the Group classified the investment in BBAC as an associated company; the company had been accounted for as a joint venture until the end of the third quarter of 2013. The effect of the change of status of BBAC was not material; the investment in BBAC continues to be accounted for using the equity method. The investment and the proportionate share in the results of BBAC are allocated to the Mercedes-Benz Cars segment.
In addition, Daimler plans to contribute equity of €0.3 billion according to its shareholding ratio to BBAC in 2015. Additional funds needed by BBAC to finance its investment will be directly raised in the capital markets by BBAC.
BAIC Motor. BAIC Motor Corporation Ltd. (BAIC Motor) is the passenger car division of BAIC Group, one of the leading automotive companies in China. Directly or via subsidiaries, BAIC Motor is engaged in the business of researching, developing, manufacturing, selling, marketing and servicing auto motive vehicles and related parts and components and all related services. On November 18, 2013, BAIC Motor issued new shares to Daimler representing a 12% equity interest in BAIC Motor for a purchase price of €627 million including trans-action costs. Due to Daimler’s representation on the board of directors of BAIC Motor and other contractual arrangements, the Group classifies this investment as an investment in an asso-ciate, to be accounted for using the equity-method; in the segment reporting, the investment’s carrying amount and its proportionate share of profit or loss are presented in the reconciliation of total segment’s assets to Group assets and total segments’ EBIT to Group EBIT, respectively. In December 2013 and in June 2014, the shareholders of BAIC Motor decided to pay a dividend. The portions of €23 million and €10 million attributable to Daimler decreased the investments carrying amounts accordingly. The effects on the consolidated financial statements resulting from allocating the purchase price to the identifiable assets and liabilities are not material.
On December 19, 2014, BAIC Motor successfully placed its equity securities for trading on the Hong Kong Stock Exchange, also with the issue of new shares. As a result, Daimler’s interest in BAIC Motor was diluted from 12.0% to 10.1%. Daimler continues to classify this investment as an investment in an associate, to be accounted for using the equity-method. The effect of dilution was not material.
Kamaz. Daimler and the Russian truck manufacturer Kamaz OAO (Kamaz) have signed a license agreement to produce Axor and Atego driver’s cabs as well as delivery contracts for cabs, engines and axles for trucks and buses of the Russian company within the framework of their strategic partnership. Resulting from its agreed representation on the board of directors of Kamaz and its significant contractual rights as a minority shareholder, the Group can exercise significant influence on Kamaz. Therefore, the Group accounts for its equity interest in Kamaz using the equity method; the investment and the proportionate share in the profit and loss of Kamaz are allocated to the Daimler Trucks segment.
In 2010, the Group and the European Bank for Reconstruction and Development (EBRD) agreed to increase their strategic investment in Kamaz. Daimler increased its equity interest in Kamaz to 15%. Of that interest, 4% was legally held by EBRD, but Daimler was deemed to be the economic owner of those shares due to the equity-method measurement. In October 2014, Daimler agreed with EBRD to take over the remaining 4% interest. With this step, Daimler has raised its investment in Kamaz to 15% also in legal terms.
In 2014, the Group recognized an impairment loss of €30 million with respect to its investment in Kamaz. The loss is included in the line item profit/loss on equity-method investments, net.

224
Table E.35 shows summarized IFRS financial information after purchase price allocation for the significant associated companies which were the basis for equity-method accounting in the Group’s consolidated financial statements
E.35Summarized IFRS financial information on significant associated companies accounted for using the equity method
BBAC1 BAIC Motor2 Kamaz3
2014 2013 2014 2013 2014 2013
In millions of euros
Information on the statement of income
Revenue 5,767 4,490 5,211 1,667 2,124 2,620
Profit/loss from continuing operations after taxes 310 192 384 359 9 99
Profit/loss from discontinued operations after taxes – – – – – –
Other comprehensive income/loss . – – – -5 1
Total comprehensive income 310 192 384 359 4 100
Information on the statement of financial position and reconciliation to equity-method carrying amounts
Non-current assets 3,314 2,048 10,127 8,268 595 971
Current assets 2,648 740 4,314 4,001 685 1,016
Non-current liabilities 584 214 1,784 2,539 210 289
Current liabilities 3,484 1,168 6,586 4,405 476 673
Equity (including non-controlling interest) 1,894 1,406 6,071 5,325 594 1,025
Equity (excluding non-controlling interests) attributable to the Group
928
689
594
533
89
150
Unrealized profit (-)/loss (+) on sales to/purchases from -76 -49 – – – –
Goodwill – – 86 77 4 6
Other . – 6 -15 -22 -1
Carrying amount of equity-method investment 852 640 686 595 71 155
1 BBAC: Figures for the statement of income relate to the period of January 1 to December 31. Figures for the statement of financial position and the reconciliation to equity-method carrying amounts relate to the balance sheet date December 31.
2 BAIC Motor: Figures for the statement of income relate for the year 2014 to the period of January 1 to September 30 (for the year 2013 to the period of January 1 to December 31). Figures for the statement of financial position and the reconciliation to equity-method carrying amounts relate for the year 2014 to the balance sheet date September 30 (for the year 2013 to the balance sheet date December 31). Figures for BAIC Motor are based on local GAAP.
3 Kamaz: Figures for the statement of income relate to the period from October 1 to September 30. Figures for the statement of financial position and the reconciliation to equity-method carrying amounts relate to the balance sheet date September 30. In order to consolidate the company without a time lag, adjustments are made as of December 31, which are included in line item Other.

225
E | Consolidated Financial Statements | Notes to the Consolidated Financial Statements
Other minor equity-method investments. The Group’s investment in Tesla Motors, Inc. (Tesla) was included in other minor equity-method investments in associated companies. In 2013, the Group realized a dilution gain of €11 million due to a capital increase in which Daimler did not take part. The equity interest in Tesla amounted to 4% at December 31, 2013; the fair value and carrying amount of the investment were €531 million and €13 million at that time. Due to its represen-tation on the board of directors, participation in decision- making processes and jointly conducted projects, the Group was able to exercise significant influence on Tesla. Therefore, the Group accounted for its equity interest in Tesla using the equity method. Since the annual shareholders’ meeting of Tesla on June 3, 2014, no representative of Daimler has been a member of the Board of Directors. Therefore, Daimler’s significant influence on Tesla ended on the day of the annual shareholders’ meeting. After that, the equity interest was recognized until it was sold as a financial asset available for sale at fair value based on the stock-market price. The difference between the first-time fair value measurement on June 3, 2014 using the stock-market price and the carrying amount measured by applying the equity method resulted in a non-cash gain of €718 million affecting Group EBIT in the second quarter of 2014. The gain was presented under equity-method investments. On December 31, 2013 the carrying amount was assigned to the Mercedes-Benz Cars segment. The investment was sold in the fourth quarter of 2014. The gain on the remeasurement and sale of the Tesla shares is presented in the segment reporting in the reconciliation of total segments’ EBIT to Group EBIT. Further information is provided in Note 33.
In addition, the equity-method profits and losses of other minor investments mainly contain startup losses at several com-panies in the area of alternative drive systems (2014: €34 million; 2013: €205 million), which are allocated to the Mercedes-Benz Cars segment. Impairments of investments of €30 million (2013: €174 million) are included in those amounts.
In 2012, an impairment loss was recognized on the investment in the joint venture Fujian Benz Automotive Co. Ltd. (FBAC); in the second quarter of 2014, the impairment was reversed based on improved profit expectations, leading to a gain of €61 million. FBAC received a capital increase of €24 million in the third quarter of 2014. The investment and the propor-tionate share in the profits and losses of FBAC are allocated to the Mercedes-Benz Vans segment.
In the first quarter of 2014, a capital increase of €34 million took place at the joint venture Shenzen BYD Daimler New Tech-nology Co. Ltd. (SBDNT). On April 4, 2014, Daimler provided a joint and separate liability guarantee to external banks which agreed to provide a syndicated loan facility to SBDNT. The guarantee provided by Daimler amounts to maximum of CNY 750 million (approximately €100 million) and equates to the Group’s share in the loan granted to SBDNT based on its 50% equity interest in SBDNT. The carrying amount of the investment in SBDNT is allocated to the Mercedes-Benz Cars segment.
In March 2014, Daimler acquired the 50.1% of the shares in Li-Tec Battery GmbH (Li-Tec), which had previously been held by Evonik Degussa GmbH (Evonik), and therefore became the sole owner of the company. The effects on the consolidated financial statements are not material.
Daimler does not recognize losses in relation with equity-method investments of €60 million (2013: €0 million) as Daimler is not obliged to compensate these losses.
Table E.36 shows summarized aggregated financial information for the other minor equity-method investments after purchase price allocation and on a pro rata basis.
Further information on equity-method investments is provided in Notes 3 and 36.
E.36Summarized aggregated financial information on minor equity-method investments
Associated companies Joint ventures
2014 2013 2014 2013
In millions of euros
Summarized aggregated financial information (pro rata)
Profit/loss from continuing operations after taxes – -9 -85 -25
Profit/loss from discontinued operations after taxes – – – –
Other comprehensive income/loss 7 -2 1 –
Total comprehensive income/loss 7 -11 -84 -25

226
14. Receivables from financial services
Table E.37 shows the components of receivables from financial services.
Types of receivables. Receivables from sales financing with customers include receivables from credit financing for customers who purchased their vehicle either from a dealer or directly from Daimler.
Receivables from sales financing with dealers represent loans for floor financing programs for vehicles sold by the Group’s automotive businesses to dealers or loans for assets purchased by dealers from third parties, primarily used vehicles traded in by dealers’ customer or real estate such as dealers’ show-rooms.
Receivables from financial services
At December 31, 2014 At December 31, 2013Current Non-current Total Current Non-current Total
In millions of euros
Sales financing with customers 10,307 22,852 33,159 9,065 17,599 26,664
Sales financing with dealers 11,786 2,203 13,989 9,781 1,723 11,504
Finance-lease contracts 5,084 10,368 15,452 4,545 8,928 13,473
Gross carrying amount 27,177 35,423 62,600 23,391 28,250 51,641
Allowances for doubtful accounts -408 -513 -921 -390 -481 -871
Carrying amount, net 26,769 34,910 61,679 23,001 27,769 50,770
E.37
Maturities of the finance lease contracts
< 1 year
1 year up
to 5 years
At December 31, 2014
< 1 year
1 year up
to 5 years
At December 31, 2013
> 5 years
Total
> 5 years
Total
In millions of euros
Contractual future lease payments 5,145 9,104 571 14,820 4,667 7,568 482 12,717
Unguaranteed residual values 483 1,744 46 2,273 367 1,796 56 2,219
Gross investment 5,628 10,848 617 17,093 5,034 9,364 538 14,936
Unearned finance income -544 -995 -102 -1,641 -489 -889 -85 -1,463
Gross carrying amount 5,084 9,853 515 15,452 4,545 8,475 453 13,473
Allowances for doubtful accounts -159 -208 -5 -372 -150 -213 -15 -378
Carrying amount, net 4,925 9,645 510 15,080 4,395 8,262 438 13,095
E.38

227
E | Consolidated Financial Statements | Notes to the Consolidated Financial Statements
Receivables from finance-lease contracts consist of receiv-ables from leasing contracts for which all substantial risks and rewards incidental to the leasing objects are transferred to the lessee. At December 31, 2014, finance-lease contracts included non-automotive assets from contracts of the financial services business with third parties (leveraged leases) in the amount of €365 million (December 31, 2013: €455 million).
Maturities of the finance lease contracts are shown in table E.38.
All cash flow effects attributable to receivables from financial services are presented within cash provided by/used for operating activities in the consolidated statement of cash flows.
Allowances. Changes in the allowance account for receivables from financial services are shown in table E.39.
The total expense from the impairment of receivables from financial services amounted to €433 million in 2014 (2013: €416 million).
Credit risks. Table E.40 provides an overview of credit risks included in receivables from financial services.
Receivables not subject to an individual impairment assessment are grouped and subject to collective impairment allowances to cover credit losses.
Further information on financial risks and nature of risks is provided in Note 32.
At December 31, 2014, receivables from financial services with a carrying amount of €3,068 million (2013: €3,007 million) were pledged as collateral for liabilities from ABS transactions (see also Note 24).
Within the context of the ongoing concentration on the auto-motive business, Daimler Financial Services sold a non- automotive asset that was subject to finance lease contracts in 2014. This resulted in a cash inflow of €69 million (2013: €48 million). The pre-tax income from this transaction in 2014 amounted to €45 million (2013: €11 million), and was allocated to the EBIT of the Daimler Financial Services segment.
Changes in the allowance account for receivables from financial services
2014 2013
In millions of euros
Balance at January 1 871 938
Charged to costs and expenses 421 405
Amounts written off -208 -273
Reversals -166 -137
Currency translation and other changes 3 -62
Balance at December 31 921 871
E.39
Credit risks included in receivables from financial services
At December 31,2014 2013
In millions of euros
Receivables, neither past due nor impaired individually
58,142
47,264
Receivables past due, not impaired individually
less than 30 days 1,517 1,479
30 to 59 days 330 266
60 to 89 days 75 59
90 to 119 days 42 38
120 days or more 116 173
Total 2,080 2,015
Receivables impaired individually 1,457 1,491
Carrying amount, net 61,679 50,770
E.40

228
15. Marketable debt securities
The marketable debt securities with a carrying amount of €6,634 million (2013: €7,066 million) are part of the Group’s liquidity management and comprise debt instruments classified as available-for-sale. When a short-term liquidity requirement is covered with quoted securities, those securities are presented as current assets.
At December 31, 2014, a pool of marketable debt securities with a carrying amount of €204 million (2013: €204 million) was pledged as collateral, almost exclusively for liabilities to financial institutions.
Further information on marketable debt securities is provided in Note 31.
16. Other financial assets
The line item other financial assets presented in the consolidated statement of financial position is comprised of the classes shown in table E.41.
In 2014, equity instruments measured at cost with a carrying amount of €1 million were sold (2013: €37 million). The gains realized on the sales were €5 million in 2014 (2013: €15 million). As of December 31, 2014, the Group did not generally intend to dispose of any of the reported equity instruments.
Financial assets recognized at fair value through profit or loss relate exclusively to derivative financial instruments which are not used in hedge accounting.
At December 31, 2014, receivables with a carrying amount of €302 million (2013: €198 million) were pledged as collateral for liabilities from ABS transactions (see also Note 24).
As of December 31, 2013, other receivables and financial assets included a loan (including accumulated interest) to Chrysler LLC of US $2.2 billion, which was fully impaired. It was derecognized in 2014.
Further information on other financial assets is provided in Note 31.
Other financial assets
Current
At December 31, 2014 Current
At December 31, 2013Non-current Total Non-current Total
In millions of euros
Available-for-sale financial assets – 2,269 2,269 – 2,052 2,052
thereof equity instruments recognized at fair value through profit or loss – 1,647 1,647 – 1,452 1,452
thereof equity instruments carried at cost – 622 622 – 600 600
Derivative financial instruments used in hedge accounting 574 722 1,296 1,006 697 1,703
Financial assets recognized at fair value through profit or loss 42 55 97 81 269 350
Other receivables and financial assets 1,737 588 2,325 1,631 505 2,136
2,353 3,634 5,987 2,718 3,523 6,241
E.41

229
E | Consolidated Financial Statements | Notes to the Consolidated Financial Statements
17. Other assets
Non-financial other assets are comprised as shown in table E.42.
Other expected reimbursements predominantly relate to recovery claims from our suppliers in connection with issued product warranties.
18. Inventories
Inventories are comprised as shown in table E.43.
The amount of write-down of inventories to net realizable value recognized as expense in cost of sales was €391 million in 2014 (2013: €311 million). Inventories that are expected to be turned over after more than twelve months amounted to €977 million at December 31, 2014 (2013: €798 million) and are primarily spare parts.
Based on the requirement to provide collateral for certain vested employee benefits in Germany, the value of company cars included in inventories at Daimler AG in an amount of €609 million at December 31, 2014 (2013: €627 million) was pledged as collateral to the Daimler Pension Trust e.V.
The carrying amount of inventories recognized during the period by taking possession of collateral held as security amounted to €91 million at December 31, 2014 (2013: €60 million). Those assets are utilized in the context of the normal business cycle.
Other assets
Current
At December 31, 2014 Current
At December 31, 2013Non-current Total Non-current Total
In millions of euros
Reimbursements due to income tax refunds 517 40 557 650 35 685
Reimbursements due to other tax refunds 2,190 22 2,212 1,686 21 1,707
Reimbursements due to the Medicare Act (USA) – 81 81 – 108 108
Other expected reimbursements 175 146 321 138 104 242
Prepaid expenses 294 130 424 296 147 443
Others 422 136 558 347 116 463
3,598 555 4,153 3,117 531 3,648
E.42
Inventories
At December 31,2014 2013
In millions of euros
Raw materials and manufacturing supplies 2,409 2,011
Work in progress 2,936 2,275
Finished goods, parts and products held for resale 15,412 13,028
Advance payments to suppliers 107 35
20,864 17,349
E.43

230
19. Trade receivables
Trade receivables are comprised as shown in table E.44.
At December 31, 2014, €78 million of the trade receivables mature after more than one year (2013: €116 million).
Allowances. Table E.45 shows changes in the allowance account for trade receivables.
The total expense from the impairment of trade receivables amounted to €130 million in 2014 (2013: €105 million).
Credit risks. Table E.46 provides an overview of credit risks included in trade receivables.
Receivables not subject to an individual impairment assessment are grouped and subject to collective impairment allowances to cover credit losses.
Further information on financial risk and types of risk is provided in Note 32.
20. Equity
See also the consolidated statement of changes in equity E.05.
Share capital. The share capital is divided into no-par-value shares. All shares are fully paid up. Each share confers the right to one vote at the Annual Shareholders’ Meeting of Daimler AG and, if applicable, with the exception of any new shares potentially not entitled to dividends, to an equal portion of the profits as defined by the dividend distribution decided upon at the Annual Shareholders’ Meeting. Each share represents a proportionate amount of approximately €2.87 of the share capital. See E.47 for the development of shares issued or outstanding.
Approved capital. The Annual Shareholders’ Meeting held on April 9, 2014, once again authorized the Board of Management, with the consent of the Supervisory Board, to increase the share capital of Daimler AG in the period until April 8, 2019 by a total of €1.0 billion in one lump sum or by separate partial amounts at different times by issuing new, registered no-par-value shares in exchange for cash and/or non-cash contributions (Approved Capital 2014). The new shares are generally to be offered to the shareholders for subscription (also by way of indirect subscription pursuant to Section 186 Subsection 5 Sentence 1 of the German Stock Corporation Act (AktG)). Among other things, the Board of Management was authorized with the consent of the Supervisory Board to exclude shareholders’ subscription rights under certain conditions and within defined limits.
Approved Capital 2014 replaces Approved Capital 2009, which was limited until April 7, 2014 and had not been utilized. Approved Capital 2014 has not yet been issued.
Conditional capital. By resolution of the Annual Meeting on April 14, 2010, the Board of Management was authorized, with the consent of the Supervisory Board, until April 13, 2015 to issue once or several times convertible and/or warrant bonds or a combination of these instruments (“bonds”) with a total face value of up to €10.0 billion and a maturity of no more than ten years. The Board of Management is allowed to grant the holders of these bonds conversion or warrant rights for new registered no-par-value shares in Daimler AG with an allocable portion of the share capital of up to €500 million in accordance with the details defined in the terms and conditions of the bonds. Among other things, the Board of Management was authorized with the consent of the Supervisory Board to exclude shareholders’ subscription rights for the bonds with conversion or warrant rights for new registered no-par- value shares in Daimler AG under certain conditions and within defined limits. The bonds can also be issued by majority-owned direct or indirect subsidiaries of Daimler AG.
Accordingly, the share capital is conditionally increased by an amount of up to €500 million (Conditional Capital 2010). The authorization to issue convertible and/or warrant bonds has not yet been utilized.
Trade receivables
At December 31,2014 2013
In millions of euros
Gross carrying amount 9,046 8,200
Allowances for doubtful accounts -412 -397
Net carrying amount 8,634 7,803
E.44
Changes in the allowance account for trade receivables
2014 2013
In millions of euros
Balance at January 1 397 402
Charged to costs and expenses 73 66
Amounts written off -66 -59
Currency translation and other changes 8 -12
Balance at December 31 412 397
E.45

231
E | Consolidated Financial Statements | Notes to the Consolidated Financial Statements
Stock option plan. The Stock option plan initiated in 2004 expired on March 31, 2014. Of the 0.2 million options granting subscription rights to new shares representing €0.6 million of the share capital remaining from this plan on December 31, 2013, 0.1 million options granting subscription rights to new shares representing €0.2 million of the share capital were exercised in 2014. The remaining options that had not been exercised by March 31, 2014 expired on that date.
Treasury shares. By resolution of the Annual Shareholders’ Meeting held on April 14, 2010, the Board of Management, with the consent of the Supervisory Board, was authorized until April 13, 2015 to acquire treasury shares for all legal purposes in a volume up to 10% of the share capital issued as of the day of the resolution. The authorization applies for example to the purchase of shares for the purpose of cancellation, for using them for business combinations or to acquire companies, or for disposal in other ways than through the stock exchange or by offering them to all shareholders. This authorization was not exercised in the reporting period.
As was the case at December 31, 2013, no treasury shares are held by Daimler AG at December 31, 2014.
Employee share purchase plan. In 2014, 0.4 million Daimler shares representing €1.1 million or 0.04% of the share capital were purchased for a price of €26 million and reissued to employees (2013: 0.5 million Daimler shares representing €1.5 million or 0.05% of the share capital were purchased for a price of €24 million).
Capital reserves. Capital reserves primarily comprise premiums arising on the issue of shares as well as expenses relating to the exercise of stock option plans and the issue of employee shares, effects from changes in ownership interests in con-solidated entities and related transaction costs.
Retained earnings. Retained earnings comprise the accumulated net profits and losses of all companies included in Daimler’s consolidated financial statements, less any profits distributed. In addition, the effects of remeasuring defined benefit plans as well as the related deferred taxes are presented within retained earnings.
Dividends. Under the German Stock Corporation Act (AktG), the dividend is paid out of the distributable profit reported in the annual financial statements of Daimler AG (parent company only) in accordance with the German Commercial Code (HGB). For the year ended December 31, 2014, the Daimler management will propose to the shareholders at the Annual Shareholders’ Meeting to pay out €2,621 million of the distributable profit of Daimler AG as a dividend to the shareholders, equivalent to €2.45 per no-par-value share entitled to a dividend (2013: €2,407 million and €2.25 per no-par-value share entitled to a dividend respectively).
Other reserves. Other reserves comprise accumulated unrealized gains/losses from currency translation of the financial statements of the consolidated foreign companies and accu-mulated unrealized gains/losses on the measurement of financial assets available-for-sale, derivative financial instruments and equity-method investments.
Table E.02 shows the details of changes in other reserves in other comprehensive income/loss.
In the line item unrealized gains/losses from equity-method investments, the amounts for 2014 include unrealized gains from currency translation of €11 million before taxes and after taxes (amounts attributable to shareholders of Daimler AG only). In 2013, the line item includes the following components (amounts attributable to shareholders of Daimler AG only): unrealized losses from currency translation of €80 million before and after taxes, unrealized losses from financial assets avail-able-for-sale of €41 million before taxes and €38 million after taxes, and unrealized gains from derivative financial instru-ments of €153 million before taxes and €107 million after taxes.
Credit risks included in trade receivables
At December 31,2014 2013
In millions of euros
Receivables neither past due nor impaired individually
5,270
5,536
Receivables past due, not impaired individually
less than 30 days 969 554
30 to 59 days 151 113
60 to 89 days 42 36
90 to 119 days 18 24
120 days or more 78 76
Total 1,258 803
Receivables impaired individually 2,106 1,464
Carrying amount, net 8,634 7,803
E.46
Development of shares issued
2014 2013
In millions of shares
Shares outstanding/issued on January 1 1,070 1,068
Shares repurchased in the share buyback program and not cancelled (previous years)
.
-1
Reissued shares to employees in theemployee share purchase plan
.
1
Creation of new shares by exercise of stock options
.
2
Shares outstanding/issued on December 31 1,070 1,070
E.47

232
21. Share-based payment
As of December 31, 2014, the Group has the 2011–2014 Performance Phantom Share Plans (PPSP) outstanding. The PPSP are cash-settled share-based payment instruments and are measured at their respective fair values at the balance sheet date. The PPSP are paid out at the end of the stipulated holding period; earlier, pro-rated payoff is possible in the case of benefits leaving the Group only if certain defined con-ditions are met. PPSP 2010 was paid out as planned in the first quarter of 2014.
Moreover, 50% of the annual bonus of the members of the Board of Management is paid out after a waiting period of one year. The actual payout is determined by the development of Daimler shares compared to an automobile related index (Auto-STOXX). The fair value of this medium-term annual bonus, which depends on this development, is measured by using the intrinsic value at the reporting date.
In 2014, rights from Stock Option Plan (SOP) 2004 also existed. The exercisable stock options granted in 2004 were equity-settled share-based payment instruments and were measured at fair value at the date of grant. The unexercised rights from Stock Option Plan 2004 expired on March 31, 2014.
Options granted to the Board of Management in 2004 for which – according to the recommendations of the German Corporate Governance Code – the Presidential Committee can impose a limit or reserve the right to impose a limit in the event of exceptional and unpredictable developments were measured at their intrinsic values as of balance sheet date. The options were exercised completely in 2013. The pre-tax effects of share-based payment arrangements for the executive managers of the Group and the members of the Board of Management of Daimler AG on the consolidated statement of income and consolidated statement of financial position are shown in table E.48.
Table E.49 shows expenses in the consolidated statement of income resulting from the rights of current members of the Board of Management.
The details shown in table E.49 do not represent any paid or committed remuneration, but refer to expenses calculated according to IFRS. Details of the remuneration of the members of the Board of Management in 2014 can be found in the Remuneration Report. E Management Report from page 118
Performance Phantom Share Plans. In 2014, the Group adopted a Performance Phantom Share Plan (PPSP), similar to those used from 2005 to 2013, under which eligible employees are granted phantom shares entitling them to receive cash payments after four years. During the four-year period between the allocation of the preliminary phantom shares and the payout of the plan at the end of the term, the phantom shares earn a dividend equivalent in the amount of the actual dividend paid on ordinary Daimler shares. The amount of cash paid to eligible employees at the end of the holding period is based on the number of vested phantom shares (determined over a three-year performance period) multiplied by the quoted price of Daimler’s ordinary shares (calculated as an average price over a specified period at the end of the four–year plan period). The vesting period is therefore four years. For the plans granted as of 2009, the quoted price of Daimler’s ordinary shares to be used for the payout is limited to 2.5 times the Daimler share price at the date of grant. For the plans granted as of the beginning of 2012, the payout for the members of the Board of Manage-ment is also limited to 2.5 times the allotment value used to determine the preliminary number of phantom shares. The limitation of the payout for the members of the Board of Management also includes the dividend equivalents paid out after January 1, 2014.
Effects of share-based payment
ProvisionExpense at December 31,
2014 2013 2014 2013
In millions of euros
PPSP -173 -250 363 344
SOP – -2 – –
Medium-term component of annual bonus of the members of the Board of Management
-6
-7
12
11
-179 -259 375 355
E.48

233
E | Consolidated Financial Statements | Notes to the Consolidated Financial Statements
Stock Option Plans. In April 2000, the Annual Shareholders’ Meeting approved the Daimler Stock Option Plan (SOP), which granted stock options for the purchase of Daimler ordinary shares to eligible employees. Options granted under the SOP were exercisable at a reference price per Daimler ordinary share, which was determined in advance, plus a 20% premium. The options became exercisable in equal installments at the earliest on the second and third anniversaries of the date of grant. All unexercised options expired ten years after the date of grant. If the market price per Daimler ordinary share on the date of exercise was at least 20% higher than the reference price, the holder was entitled to receive a cash pay-ment equal to the original exercise premium of 20%. No new stock options were granted after 2004. The last SOP plan 2004 expired on March 31, 2014. All unexercised rights expired.
In the event of exercise, the Group generally issued ordinary shares.
Determination of the number of phantom shares that vest of the existing PPSP 2011 to 2013 is based on return on net assets derived from internal targets and return on sales compared with benchmarks oriented towards competitors.
The number of phantom shares that vest of the PPSP granted in 2014 will be based on the relative share performance, which measures the development of the price of a share price index based on a competitor group including Daimler, and the return on sales (RoS) compared with benchmarks oriented towards competitors. Special rules apply for the members of the Board of Management: Daimler’s RoS must be not equal to but higher than that of the competitors in order to achieve the same target achievement as the other plan participants.
The Group recognizes a provision for awarding the PPSP in the consolidated statement of financial position. Since payment per vested phantom share depends on the quoted price of Daimler’s ordinary shares, that quoted price essentially repre-sents the fair value of each phantom share. The proportionate remuneration expenses from the PPSP recognized in the individual years are determined on the price of Daimler ordinary shares and the estimated target achievement.
Expenses in the consolidated statement of income resulting from share-based payments to current members of the Board of Management
Dr. Dieter Zetsche Dr. Wolfgang Bernhard Dr. Christine Hohmann-Dennhardt Wilfried Porth2014 2013 2014 2013 2014 2013 2014 2013
In millions of euros
PPSP -6.1 -10.9 -2.5 -4.2 -2.3 -2.5 -2.5 -4.4
SOP – -1.6 – – – – – –
Medium-term component of the annual bonus
-1.8
-1.9
-0.7
-0.6
-0.7
-0.6
-0.7
-0.7
Andreas Renschler1 Hubertus Troska Bodo Uebber Prof. Dr. Thomas Weber2014 2013 2014 2013 2014 2013 2014 2013
In millions of euros
PPSP -0.2 -4.9 -1.6 -2.2 -2.9 -5.2 -2.6 -4.6
SOP – – – – – – – -0.1
Medium-term component of the annual bonus
-0.1
-0.7
-0.7
-0.6
-0.8
-0.8
-0.7
-0.7
1 Stepped down from the Board of Management as of January 28, 2014. Amounts are included pro rata for 2014.
E.49

234
Table E.50 shows the development of the stock options issued.
The weighted average share price of Daimler ordinary shares during the exercise period was €66.40 (2013: €48.83).
The stock options issued to active members of the Board of Management were exercised completely in 2013. The members of the Board of Management Dr. Dieter Zetsche and Prof. Dr. Thomas Weber each exercised 0.1 million options. The depart-ing board member Andreas Renschler, who stepped down from the Board of Management as of January 28, 2014, exercised fewer than 0.1 million stock options in 2013. The average exercise price was €43.57 per share. The members of the Board of Management Dr. Wolfgang Bernhard, Dr. Christine Hohmann-Dennhardt, Wilfried Porth, Hubertus Troska and Bodo Uebber had no outstanding or exercisable option rights in the year 2013.
22. Pensions and similar obligations
Table E.51 shows the composition of provisions for pension benefit plans and similar obligations.
At the Daimler Group, defined benefit pension obligations exist as well as, to a smaller extent, defined contribution pension obligations, specific to the various countries. In addition, healthcare benefit obligations are recognized outside Germany.
Defined benefit pension plans
Provisions for pension obligations are made for defined commitments to active and former employees of the Daimler Group and their survivors. The defined benefit pension plans provided by Daimler generally vary according to the economic, tax and legal circumstances of the country concerned. Most of the defined benefit pension plans also provide benefits in the case of invalidity and death.
The Group’s main German and non-German pension plans are described below.
Development of the stock options issued
Number of
stock options in millions
2014 Average
exercise price ineuros per share
Number of
stock options in millions
2013Average
exercise price ineuros per share
Balance at beginning of year 0.2 43.57 2.7 42.24
Exercised -0.1 43.57 -2.2 42.62
Disposals/Forfeited -0.1 43.57 -0.3 37.33
Outstanding at end of year – – 0.2 43.57
Exercisable at end of year – – 0.2 43.57
E.50

235
E | Consolidated Financial Statements | Notes to the Consolidated Financial Statements
German plans. Most employees in Germany have defined benefit pension plans; most of the pension plans for the active workforce are based on individual retirement benefit accounts, to which the company makes annual contributions. The amount of the contributions for employees paid according to wage- tariff agreements depends on the tariff classification in the respective year, and for executives it depends on their respective income. For the commitments to retirement benefits made until 2011, the contributions continue to be converted into capital components and credited to the individual pension account with the application of fixed factors related to each employee’s age. The conversion factors include a fixed value increase. The pension plans were newly structured for new entrants in 2011 to reduce the risks associated with defined benefit plans. New entrants now benefit from value increases of the contri-butions through an investment fund with a special lifecycle model. The company guarantees at a minimum the value of the con-tributions paid in. Pension payments are made either as a life annuity, twelve annual installments, or a single lump sum. In addition, previously concluded defined benefit plans exist which primarily depend on employees’ wage-tariff classification upon transition into the benefit phase and which foresee a life annuity.
As well as the employer-financed pension plans granted by German companies, the employees of some companies are also offered various earnings-conversion models.
Most of the pension obligations in Germany relating to defined benefit pension plans are funded by assets invested in long-term outsourced funds. Contractual trust arrangements (CTA) exist between Daimler AG as well as some subsidiaries in Germany and the Daimler Pension Trust e.V. The Daimler Pension Trust e.V. acts as a collateral trust fund.
In Germany, there are no statutory or regulatory minimum funding requirements.
Non-German plans. Significant plans exist primarily in the United States and Japan. They comprise plans relating to final salaries as well as plans relating to salary based com-ponents. Most of the obligations outside Germany from defined benefit pension plans are funded by assets outplaced into long-term investment funds.
Risks from defined benefit pension plans. The general requirements with regard to retirement benefit models are laid down in the Pension Policy, which has Group-wide validity. Accordingly, the committed benefits are intended to contribute to additional financial security during retirement, and in the case of death or invalidity to be capable of being planned and fulfilled by the respective company of the Group and to have a low-risk structure. In addition, a committee exists that approves new pension plans and amendments to existing pension plans as well as guidelines relating to company retire-ment benefits.
The obligations from defined benefit pension plans and the pension plan assets can be subject to fluctuations over time. This can cause the funded status to be negatively or positively impacted. Fluctuations in the defined benefit pension obli-gations result at the Daimler Group in particular from changes in financial assumptions such as discount rates and increases in the cost of living, but also from changes in demographic assumptions such as adjusted life expectancies. With most of the German plans, expected long-term wage and salary increases do not have an impact on the amount of the obligation.
The fair value of plan assets is predominantly determined by the situation on the capital markets. Unfavorable developments, especially of equity prices and fixed-interest securities, could reduce that fair value. The diversification of fund assets, the engagement of asset managers using quantitative and qualitative analyses, and the continual monitoring of performance and risk help to reduce associated investment risk. The Group regu-larly makes additional contributions to the plan assets in order to cover future obligations from defined benefit pension plans. In addition, the Group made an extraordinary contribution of €2.5 billion in 2014 to sustainably strengthen the German plan assets.
As a general principle, it is the Group’s objective to design new pension plans as defined benefit plans based on capital components or on annual contributions, or as defined contribution plans.
Compositions of provisions for pension benefit plans and similar obligations
December 31,2014 2013
In millions of euros
Provision for pension benefits 11,619 8,624
Provision for other post-employment benefits 1,187 1,245
12,806 9,869
E.51

236
Reconciliation of the net obligation from defined benefit pension plans. The development of the relevant factors is shown in table E.52.
Composition of plan assets. Plan assets and income from plan assets are used solely to pay pension benefits and to administer the plans. The composition of the Group’s pension plan assets is shown in table E.53.
E.52Present value of defined benefit pension obligations and fair value of plan assets
2014 2013
TotalGerman
plansNon-German
plans
TotalGerman
plansNon-German
plans
In millions of euros
Present value of the defined benefit obligation at January 1
23,230
20,310
2,920
23,943
20,698
3,245
Current service cost 527 437 90 548 453 95
Interest cost 822 679 143 755 635 120
Contributions by plan participants 57 55 2 56 52 4
Actuarial gains (-)/losses from changes in demographic assumptions
168
99
69
-14
-71
57
Actuarial gains (-)/losses from changes in financial assumptions
5,867
5,629
238
-1,136
-892
-244
Actuarial gains (-)/losses from experience adjustments -32 -41 9 121 121 –
Actuarial gains (-)/losses 6,003 5,687 316 -1,029 -842 -187
Past service cost, curtailments and settlements 22 19 3 – – –
Pension benefits paid -841 -697 -144 -829 -691 -138
Currency exchange-rate changes and other changes 307 6 301 -214 5 -219
Present value of the defined benefit obligation at December 31
30,127
26,496
3,631
23,230
20,310
2,920
Fair value of plan assets at January 1
14,668
12,588
2,080
14,207
12,143
2,064
Interest income from plan assets 533 429 104 464 381 83
Actuarial gains 761 571 190 262 199 63
Actual return on plan assets 1,294 1,000 294 726 580 146
Contributions by the employer 3,111 2,975 136 537 448 89
Contributions by plan participants 57 53 4 57 52 5
Pension benefits paid -773 -650 -123 -763 -641 -122
Currency exchange-rate changes and other changes 224 7 217 -96 6 -102
Fair value of plan assets at December 31 18,581 15,973 2,608 14,668 12,588 2,080
Funded status -11,546 -10,523 -1,023 -8,562 -7,722 -840
thereof recognized in other assets 73 – 73 62 – 62
thereof recognized in provisions for pensions and similar obligations
-11,619
-10,523
-1,096
-8,624
-7,722
-902

237
E | Consolidated Financial Statements | Notes to the Consolidated Financial Statements
Market prices are available for equities and bonds due to their listing in active markets. Most of the bonds have investment grade ratings. They include government bonds of very good creditworthiness.
The investment strategy is reviewed regularly and adjusted if deemed necessary. The investment strategy is determined by Investment Committees, which are generally composed of representatives of the Finance and Human Resources depart-ments. Several pension plans use dedicated liability driven investment approaches to take the structure of pension obliga-tions into account in the investment process.
E.53Composition of pension plan assets
2014 2013
TotalGerman
plansNon-German
plans
TotalGerman
plansNon-German
plans
In millions of euros
Energy, commodities and utilities 832 718 114 839 737 102
Financials 1,097 925 172 995 861 134
Healthcare 461 367 94 387 322 65
Industrials 503 416 87 479 408 71
Consumer goods 955 788 167 865 732 133
Information technology and telecommunication services 778 650 128 636 538 98
Others 64 – 64 88 – 88
Equities 4,690 3,864 826 4,289 3,598 691
Government bonds in EUR 3,854 3,853 1 4,084 4,078 6
Government bonds in USD 969 555 414 936 628 308
Government bonds in other currencies 443 – 443 329 – 329
Government bonds 5,266 4,408 858 5,349 4,706 643
Corporate bonds in EUR 2,247 2,241 6 886 885 1
Corporate bonds in USD 1,925 1,521 404 829 574 255
Corporate bonds in other currencies 200 44 156 233 42 191
Corporate bonds 4,372 3,806 566 1,948 1,501 447
Securitized bonds 54 5 49 1,066 1,009 57
Bonds 9,692 8,219 1,473 8,363 7,216 1,147
Other exchange-traded instruments1 -4 -5 1 5 1 4
Total exchange-traded instruments 14,378 12,078 2,300 12,657 10,815 1,842
Alternative investments2 674 567 107 690 592 98
Real estate 514 410 104 496 408 88
Other non-exchange-traded instruments1 -123 -154 31 85 78 7
Cash and cash equivalents 3,138 3,072 66 740 695 45
Total non-exchange-traded instruments 4,203 3,895 308 2,011 1,773 238
Plan assets at December 31 18,581 15,973 2,608 14,668 12,588 2,080
thereof fair value of own transferable financial instruments
7
7
–
3
3
–
thereof fair value of self-used plan assets 88 88 – 96 96 –
1 Includes derivative financial instruments which could have a negative fair value at the balance sheet date. 2 Alternative investments mainly comprise private equity.

238
Pension cost. The components of pension cost included in the consolidated statement of income are shown in table E.54.
Table E.55 shows the line items within the consolidated statement of income in which the net periodic pension cost is included.
Measurement assumptions. The measurement date for the Group’s defined benefit pension obligations and plan assets is generally December 31. The measurement date for the Group’s net periodic pension cost is generally January 1. The assump-tions used to calculate the defined benefit obligations vary according to the economic conditions of the countries in which the pension plans are situated.
Calculation of the defined benefit obligation uses life expectancy for the German plans is based on the 2005 G mortality tables of K. Heubeck. For Non-German plans, comparable country-specific calculation methods are used.
Table E.56 shows the significant weighted average measure-ment factors used to calculate pension benefit obligations.
Discount rates for German and non-German pension plans are determined annually as of December 31 on the basis of high-quality corporate bonds with maturities and currencies matching those of the pension payments.
Sensitivity analysis. An increase or decrease in the main actuarial assumptions would affect the present value of the defined benefit pension obligations as shown in table E.57.
The calculations carried out by actuaries were done in isolation for the evaluation parameters regarded as important. This means that if there is a simultaneous change in several parameters, the individual results cannot be summed due to correlation effects. With a change in the parameters, the sensitivities shown cannot be used to derive a linear development of the defined benefit obligation. For the calculation of the sensitivity of life expectancy, by means of fixed (non-age-dependent) factors for a reference person, a life expectancy one year higher or one year lower was achieved.
Effect on future cash flows. Daimler currently plans to make contributions of €0.7 billion to its pension plans for the year 2015; the final amount is usually set in the fourth quarter of a financial year. In addition, the Group expects to make pension benefit payments of €0.9 billion in 2015.
The weighted average duration of the defined benefit obligations is shown in table E.58.
E.54Pension cost
2014 2013
TotalGerman
plansNon-German
plans
TotalGerman
plansNon-German
plans
In millions of euros
Current service cost -527 -437 -90 -548 -453 -95
Past service cost, curtailments and settlements -22 -19 -3 – – –
Net interest expense -292 -250 -42 -293 -253 -40
Net interest income 3 – 3 2 – 2
-838 -706 -132 -839 -706 -133

239
E | Consolidated Financial Statements | Notes to the Consolidated Financial Statements
Net periodic pension cost within the consolidated statement of income
2014 2013
In millions of euros
Cost of sales -318 -313
Selling expenses -106 -121
General administrative expenses -51 -43
Research and non-capitalized development costs -74 -71
Interest income 3 2
Interest expense -292 -293
-838 -839
E.55
Significant factors for the calculation of pension benefit obligations
German plans Non-German plans At December 31, At December 31,
2014 2013 2014 2013
In percent
Discount rates 1.9 3.4 3.9 4.5
Expected increase in cost of living1 1.8 1.8 – –
1 For German plans, expected increases in cost of living may affect – depending on the design of the pension plan – the obligation to the Group’s current employees as well as retirees and their survivors. For most non-German plans, expected increases in cost of living do not have a material impact on the amount of the obligation.
E.56
E.58Weighted average duration of the defined benefit obligations
2014 2013
in years
German plans 17 16
Non-German plans 16 16
E.57Sensitivity analysis for the present value of the defined benefit obligation
At December 31, 2014 At December 31, 2013
TotalGerman
plansNon-German
plans
TotalGerman
plansNon-German
plans
In millions of euros
Sensitivity for discount rates + 0.25% -1,210 -1,080 -130 -800 -720 -80
Sensitivity for discount rates - 0.25% 1,270 1,140 130 860 760 100
Sensitivity for expected increase in cost of living
+ 0.10%
120
110
10
100
90
10
Sensitivity for expected increase in cost of living
- 0.10%
-130
-120
-10
-100
-90
-10
Sensitivity for life expectancy + 1 year 520 480 40 360 350 10
Sensitivity for life expectancy - 1 year -540 -500 40 -390 -380 -10

240
Defined contribution pension plans
Under defined contribution pension plans, Daimler makes defined contributions to external insurance policies or invest-ment funds. There are fundamentally no further contractual obligations or risks for Daimler in excess of the defined contri-butions. The Group also pays contributions to governmental pension schemes. In 2014, the total cost from defined contri-bution plans amounted to €1.4 billion (2013: €1.3 billion). Of those payments, €1.3 billion (2013: €1.2 billion) was related to governmental pension plans.
Multi-employer plans. Daimler participates in some collectively bargained defined benefit pension plans maintained by more than one employer. The Group presents several of these plans in its consolidated financial statements as defined contribution plans because the information required to use defined benefit accounting is not available in a timely manner or in sufficient detail. The Group cannot exercise direct control over such plans and the plan trustees have no legal obligation to share information directly with participating employers. Higher contributions by the Group to such a pension plan could be required in particular when an underfunded status exceeds a specific level. Exit from such a plan can lead to the companies involved having to offset the potential future shortfall relating to their share of the plan. Furthermore, the possibility exists that Daimler can be liable for other participants’ obligations. At December 31, 2014, the Group does not anticipate significant costs from the existing collective plans of multiple employers; no exit from any of these plans is intended.
Other post-employment benefits
Certain foreign subsidiaries of Daimler, mainly in the United States, provide their employees with post-employment health care benefits with defined entitlements, which have to be accounted for as defined benefit plans. These obligations are funded to a small extent through reimbursement rights and plan assets. Table E.59 shows key data for other post-employment benefits
Significant risks for other post-employment benefits (medical care) relate to rising healthcare costs and lower contributions to those costs from the public sector. In addition, these plans are subject to the usual risks for defined benefit plans, in particular the risk of changes in discount rates.
In May 2014, Daimler Trucks North America LLC and the United Auto Workers union (UAW) entered into an agreement to settle a healthcare plan as part of a collective bargaining agreement. As a result of this agreement, the obligation to the active eligible employees was settled in the fourth quarter of 2014. The resulting cash outflow from this transaction was approximately €0.3 billion. The transfer of the obligation to the retirees is subject to US court approval. The approval was received in December 2014 and became legally binding with expiration of the deadline for notices of appeal at the end of January 2015. The cash outflow from this transaction (approximately €0.1 billion) will occur in the first quarter of 2015. The settlement has no material impact on the Group’s con-solidated statement of income or on the EBIT of Daimler Trucks.
Key data for other post-employment benefits
2014 2013
In millions of euros
Present value of defined benefit obligations 1,193 1,258
Fair value of plan assets and reimbursement rights
87
121
Funded status -1,106 -1,137
Net periodic cost for other post-employment benefits
-51
-92
E.59

241
E | Consolidated Financial Statements | Notes to the Consolidated Financial Statements
23. Provisions for other risks
The development of provisions for other risks is summarized in table E.60.
Product warranties. Daimler issues various types of product warranties, under which it generally guarantees the perfor-mance of products delivered and services rendered for a certain period. The provision for these product warranties covers expected costs for legal and contractual warranty claims as well as expected costs for policy coverage, recall campaigns and buyback commitments. The provision for buyback commitments represents the expected costs related to the Group’s obli gation under certain conditions to repurchase vehicles from customers. Buybacks may occur for a number of reasons including litiga-tion, compliance with laws and regulations in a particular region and customer satisfaction issues. The utilization date of product warranties depends on the incidence of the warranty claims and can span the entire term of the product warranties. The cash outflow for non-current product warranties is principally expected within a period until 2017.
Personnel and social costs. Provisions for personnel and social costs primarily comprise expected expenses of the Group for employee anniversary bonuses, profit sharing arrangements and management bonuses as well as early retirement and partial retirement plans. The additions recorded to the provisions for profit sharing and management bonuses in the reporting year usually result in cash outflows in the following year. The cash outflow for non-current provisions for personnel and social costs is primarily expected within a period until 2025.
Other. Provisions for other risks include obligations for expected reductions in revenue already recognized such as bonuses, discounts and other price reduction commitments. They also include expected costs in connection with liability and litigation risks, provisions for optimization programs, provisions for environmental protection risks, as well as provisions for other taxes and various other risks which cannot be allocated to other categories.
Further information on other provisions for other risks is provided in Notes 5 and 29.
Provisions for other risks
Product warranties
Personnel and social costs
Other
Total
In millions of euros
Balance at December 31, 2013 4,705 3,233 3,951 11,889
thereof current 2,380 1,501 2,738 6,619
thereof non-current 2,325 1,732 1,213 5,270
Additions 2,617 1,967 3,088 7,672
Utilizations -2,182 -1,474 -1,882 -5,538
Reversals -270 -46 -325 -641
Addition of accrued interest and effects of changes in discount rates 32 284 37 353
Currency translation and other changes 86 -23 181 244
Balance at December 31, 2014 4,988 3,941 5,050 13,979
thereof current 2,423 1,806 3,038 7,267
thereof non-current 2,565 2,135 2,012 6,712
E.60

242
24. Financing liabilities
The composition of financing liabilities is shown in table E.61.
Liabilities from finance leases relate primarily to leases of property, plant and equipment which transfer substantially all risks and rewards to the Group as lessee. Future minimum lease payments under finance leases amounted to €436 million at December 31, 2014 (2013: €474 million). The reconciliation of future minimum lease payments from finance lease arrange-ments to the corresponding liabilities is shown in table E.62.
Financing liabilities
At December 31, 2014 At December 31, 2013Current Non-current Total Current Non-current Total
In millions of euros
Notes/bonds 9,914 33,262 43,176 9,091 29,653 38,744
Commercial paper 2,269 8 2,277 1,086 – 1,086
Liabilities to financial institutions 11,101 11,792 22,893 10,173 8,916 19,089
Deposits in the direct banking business 8,350 2,503 10,853 8,539 2,718 11,257
Liabilities from ABS transactions 4,114 1,875 5,989 3,478 2,653 6,131
Liabilities from finance leases 40 245 285 39 271 310
Loans, other financing liabilities 502 714 1,216 586 535 1,121
36,290 50,399 86,689 32,992 44,746 77,738
E.61
Reconciliation of minimum lease payments to liabilities from finance lease arrangements
Future minimum lease payments
Interest included in future minimum lease payments
Liabilities from finance lease arrangements
at December 31, at December 31, at December 31,2014 2013 2014 2013 2014 2013
In millions of euros
Maturity
within one year 56 53 16 14 40 39
between one and five years 149 160 56 56 93 104
later than five years 231 261 79 94 152 167
436 474 151 164 285 310
E.62

243
E | Consolidated Financial Statements | Notes to the Consolidated Financial Statements
25. Other financial liabilities
The composition of other financial liabilities is shown in table E.63.
Financial liabilities recognized at fair value through profit or loss relate exclusively to derivative financial instruments which are not used in hedge accounting.
Further information on other financial liabilities is provided in Note 31.
26. Deferred income
The composition of deferred income is shown in table E.64.
27. Other liabilities
Table E.65 shows the composition of other liabilities.
Other financial liabilities
At December 31, 2014 At December 31, 2013Current Non-current Total Current Non-current Total
In millions of euros
Derivative financial instruments used in hedge accounting
1,409
908
2,317
178
217
395
Financial liabilities recognized at fair value through profit or loss
228
131
359
150
263
413
Liabilities from residual value guarantees 888 1,024 1,912 857 934 1,791
Liabilities from wages and salaries 885 27 912 744 24 768
Accrued interest expenses 800 – 800 893 – 893
Deposits received 400 392 792 508 109 617
Other 3,452 162 3,614 3,245 154 3,399
Miscellaneous other financial liabilities 6,425 1,605 8,030 6,247 1,221 7,468
8,062 2,644 10,706 6,575 1,701 8,276
E.63
E.64Deferred income and prepaid expenses
At December 31, 2014 At December 31, 2013Current Non-current Total Current Non-current Total
In millions of euros
Deferral of revenue from multi-year service and maintenance agreements
1,216
1,935
3,151
977
1,331
2,308
Deferral of sales revenue received from sales with residual-value guarantees
370
866
1,236
301
743
1,044
Deferral of advance rental payments received from operating lease arrangements
581
466
1,047
254
333
587
Other deferred income 246 314 560 336 321 657
2,413 3,581 5,994 1,868 2,728 4,596
Other liabilities
At December 31, 2014 At December 31, 2013Current Non-current Total Current Non-current Total
In millions of euros
Income tax liabilities 151 11 162 181 12 193
Other tax liabilities 1,552 1 1,553 1,011 2 1,013
Miscellaneous other liabilities 304 2 306 259 4 263
2,007 14 2,021 1,451 18 1,469
E.65

244
28. Consolidated statement of cash flows
Calculation of funds. At December 31, 2014, cash and cash equivalents included restricted funds of €112 million (2013: €69 million). The restricted funds primarily relate to subsidiaries where exchange controls apply so that the Group has restricted access to the funds.
Cash provided by/used for operating activities. Changes in other operating assets and liabilities are shown in table E.66.
The decrease in provisions in the reporting year mainly resulted from provisions for pensions and similar obligations primarily due to an extraordinary contribution to the German pension fund assets. Contrary effects were caused by the addition to the provision for the EU Commission’s antitrust proceedings concern-ing European commercial vehicle manufacturers and the increase in the provision for personnel costs. In the prior year, the change in the provisions was primarily influenced by the increases in provisions for dealer incentives and for personnel costs. Table E.67 shows cash flows included in cash provided by/used for operating activities.
The line item other non-cash expense and income within the reconciliation of profit before income taxes to cash provided by/used for operating activities primarily included the effect of the remeasurement of the Tesla shares (see Note 13).
Cash provided by financing activities. Cash provided by financing activities includes cash flows from hedging the currency risks of financial liabilities. In 2014, cash provided by financing activities included payments for the reduction of the outstanding finance lease liabilities of €46 million (2013: €52 million).
29. Legal proceedings
Various legal proceedings, claims and governmental inves-tigations (legal proceedings) are pending against Daimler AG and its subsidiaries on a wide range of topics, including vehicle safety, emissions, fuel economy, financial services, dealer, supplier and other contractual relationships, intellectual property rights, product warranties, environmental matters, antitrust matters and shareholder matters. Legal proceedings relating to products deal with claims on account of alleged vehicle defects. Some of these claims are asserted by way of class action suits. Adverse decisions in one or more of these proceedings could require us to pay substantial compensatory and punitive damages or undertake service actions, recall cam-paigns or other costly actions.
Changes in other operating assets and liabilities
2014 2013
In millions of euros
Provisions -838 573
Financial instruments 289 131
Miscellaneous other assets and liabilities 1,581 1,536
1,032 2,240
E.66
Cash flows included in cash provided by/used for operating activities
2014 2013
In millions of euros
Interest paid -445 -385
Interest received 136 172
Dividends received 171 144
E.67

245
E | Consolidated Financial Statements | Notes to the Consolidated Financial Statements
In mid-January 2011, the European Commission carried out antitrust investigations of European commercial vehicle manufacturers, including Daimler AG. If antitrust infringements are discovered, the European Commission can impose con-siderable fines depending on the gravity of the infringement. In November 2014, the European Commission served Daimler with its statement of objections which, from the European Commission’s perspective, further explains and legally evaluates the relevant facts. Resulting from knowledge gained from access to essential documents of the European Commission’s file, Daimler AG, in December 2014, decided to increase provisions by €600 million. Daimler is taking the Commission’s initial suspicion very seriously and is also – parallel to the Commission’s investigations – carrying out its own extensive internal investigation to clarify the underlying circumstances. The company is cooperating with the authorities but will at the same time – while stating the company’s legal view – safeguard its rights in the further proceedings and is also reviewing all of its procedural options. In accordance with IAS 37.92, the Group does not provide further information on this antitrust investigation and the associated risk for the Group, especially with regard to the measures taken in this context, in order not to impair the outcome of the proceeding.
The Federal Republic of Germany initiated arbitration proceed-ings against Daimler Financial Services AG, Deutsche Telekom AG and Toll Collect GbR and submitted its statement of claims in August 2005. It seeks damages, contractual penalties and the transfer of intellectual property rights to Toll Collect GmbH. In particular, the Federal Republic of Germany is claiming– lost revenue of €3.33 billion for the period September 1, 2003
through December 31, 2004 plus interest at 5% per annum above the respective base rate since submission of claims (an amount of €2 billion as at the date of September 29, 2014),
– and contractual penalties of approximately €1.65 billion through July 31, 2005 plus interest at 5% per annum above the respective base rate since submission of claims (an amount of €225 million as at the date of September 29, 2014),
– plus refinancing costs of €196 million.
Since, among other things, some of the contractual penalties are dependent on time and further claims for contractual penalties have been asserted by the Federal Republic of Germany, the amount claimed as contractual penalties may increase. The defendants submitted their response to the statement of claims on June 30, 2006. The Federal Republic of Germany delivered its reply to the arbitrators on February 15, 2007, and the defendants delivered their rebuttal on October 1, 2007 (see also Note 30). The arbitrators held the first hearing on June 16 and 17, 2008. Additional briefs from the claimant and the defendants have been filed since then. A hearing of witnesses and experts took place between December 6 and 14, 2010. The parties submitted further written statements on July 15 and November 15, 2011. After the Tribunal’s President resigned for personal reasons as of March 30, 2012, the new President was determined by the Administrative Court in Berlin as of October 29, 2012. The arbitrators held further hearings in May and October 2014. In accordance with IAS 37.92, no further information is disclosed regarding the arbitration proceedings and the related risks to the company, in particular regarding the measures taken by the company, in order to prevent negative effects on the proceedings. Daimler believes the claims of the Federal Republic of Germany are without merit and will continue to defend itself vigorously.
The Group recognizes provisions in connection with pending or threatened proceedings to the extent that a loss is probable and can be reasonably estimated. Such provisions are reflected in the Group’s consolidated financial statements and are based on estimates. Risks resulting from legal proceed-ings, however, sometimes cannot be assessed reliably or only to a limited extent. Consequently, provisions accrued for some legal proceedings may turn out to be insufficient once such proceedings have ended. Daimler may also become liable for payments in legal proceedings no provisions were established for. Although the final resolution of any such proceedings could have a material effect on Daimler’s operating results and cash flows for a particular reporting period, Daimler believes that it should not materially affect the Group’s financial position.
30. Financial guarantees, contingent liabilities and other financial obligations
Financial guarantees. Financial guarantees principally represent contractual arrangements. These guarantees generally provide that in the event of default or non-payment by the primary debtor, the Group will be required to settle such financial obligations. The maximum potential obligation resulting from these guarantees amounted to €786 million at December 31, 2014 (2013: €772 million) and includes liabilities recognized in the amount of €84 million (2013: €80 million). These amounts include financial guarantees, which the Group issued for the benefit of Chrysler in connection with the Chrysler transactions entered into in 2007 and 2009. At December 31, 2014, these guarantees amounted to €0.3 billion. For a portion of these financial guarantees, Chrysler provided collateral of €0.2 billion to an escrow account.

246
Contingent liabilities. Table E.68 shows estimates of the financial effects of contingent liabilities at December 31.
Guarantees under buyback commitments represent arrange-ments whereby the Group guarantees specified trade-in or resale values for sold vehicles. Such guarantees provide the holder with the right to return purchased vehicles to the Group, the right being primarily contingent on the future purchase of vehicles or services. The provisions recognized in connection with these buyback commitments, amounted to €58 million at December 31, 2014 (2013: €43 million). Residual value guarantees related to arrangements for which revenue recognition is precluded due to the Group’s obligation to repurchase assets sold to unre-lated guaranteed parties are included in other financial liabilities.
Other contingent liabilities comprise contingent liabilities which constitute other guarantees as well as miscellaneous contingent liabilities which do not constitute other guarantees. At December 31, 2014, the best estimate for potential obli-gations from other guarantees for which no provisions had yet been recognized was €34 million (2013: €42 million). The miscellaneous contingent liabilities which do not constitute other guarantees primarily comprise potential obligations from other tax and customs duty risks; the best estimate for potential obligations at December 31, 2014 amounts to €349 million (2013: €328 million).
In 2002, our subsidiary Daimler Financial Services AG, Deutsche Telekom AG and Compagnie Financière et Industrielle des Autoroutes S.A. (Cofiroute) entered into a consortium agreement in order to jointly develop, install and operate under a contract with the Federal Republic of Germany (operating agreement) a system for the electronic collection of tolls for all commercial vehicles over 12 tons GVW using German highways. Daimler Financial Services AG and Deutsche Telekom AG each hold a 45% equity interest and Cofiroute holds the remaining 10% equity interest in both the consortium (Toll Collect GbR) and the joint venture company (Toll Collect GmbH) (together Toll Collect).
According to the operating agreement, the toll collection system had to be operational no later than August 31, 2003. After a delay of the launch date of the toll collection system, which resulted in a loss of revenue for Toll Collect and in pay-ments of contractual penalties for delays, the toll collection system was introduced on January 1, 2005 with on-board units that allowed for slightly less than full technical performance in accordance with the technical specification (phase 1). On January 1, 2006, the toll collection system was installed and started to operate with full effectiveness as specified in the operating agreement (phase 2). On December 20, 2005, Toll Collect GmbH received a preliminary operating permit as specified in the operating agreement. Toll Collect GmbH expects to receive the final operating permit, and continues to operate the toll collection system under the preliminary operating permit in the interim.
Failure to perform various obligations under the operating agreement may result in penalties, additional revenue reductions and damage claims that could become significant over time.
However, penalties and revenue reductions are capped at €150 million per year until the final operating permit has been issued and at €100 million per year following the issuance of the final operating permit. These cap amounts are subject to a 3% increase for every year of operation.
E.68Composition of contingent liabilities
At December 31,2014 2013
In millions of euros
Guarantees under buyback commitments 1,208 974
Other contingent liabilities 383 370
1,591 1,344

247
E | Consolidated Financial Statements | Notes to the Consolidated Financial Statements
Beginning in June 2006, the Federal Republic of Germany began reducing monthly payments to Toll Collect GmbH by €8 million in partial set-off against amounts claimed in the arbitration proceeding referred to below. This offsetting may require the consortium members to provide additional operating funds to Toll Collect GmbH.
The operating agreement calls for the submission of all disputes related to the toll collection system to arbitration. The Federal Republic of Germany has initiated arbitration proceedings against Daimler Financial Services AG, Deutsche Telekom AG and the consortium. According to the statement of claims received in August 2005, the Federal Republic of Germany is seeking damages including contractual penalties and reimbursement of lost revenue that allegedly arose from delays in the oper-ability of the toll collection system. See Note 29 for additional information.
Each of the consortium members (including Daimler Financial Services AG) has provided guarantees supporting the obligations of Toll Collect GmbH towards the Federal Republic of Germany relating to the completion and operation of the toll collection system, which are subject to specific triggering events. In addition, Daimler AG has guaranteed bank loans obtained by Toll Collect GmbH. The guarantees are described in detail below:
– Guarantee of bank loans. Daimler AG issued a guarantee to third parties up to a maximum amount of €100 million for bank loans which could be obtained by Toll Collect GmbH. This amount represents the Group’s 50% share of Toll Collect GmbH’s external financing guaranteed by its shareholders.
– Equity maintenance undertaking. The consortium members have the obligation to contribute, on a joint and several basis, additional funds to Toll Collect GmbH as may be necessary for Toll Collect GmbH to maintain a minimum equity (based on German Commercial Code accounting principles) of 15% of total assets (a so-called “equity maintenance undertaking”). This obligation will terminate on August 31, 2015, when the operating agreement expires, or earlier if the agreement is terminated. Such obligation may arise if Toll Collect GmbH is subject to revenue reductions caused by underperformance, if the Federal Republic of Germany is successful in claiming lost revenue against Toll Collect GmbH for any period the system was not fully operational, or if Toll Collect GmbH incurs penalties that may become payable under the above mentioned agreements. If such penalties, revenue reductions or other events reduce Toll Collect GmbH’s equity to a level below the minimum equity percentage agreed upon, the consortium members are obligated to fund Toll Collect GmbH’s operations to the extent necessary to reach the required minimum equity.
Cofiroute’s risks and obligations are limited to €70 million. Daimler Financial Services AG and Deutsche Telekom AG are jointly obliged to indemnify Cofiroute for amounts exceeding this limitation.
While Daimler’s maximum future obligation resulting from the guarantee of the bank loan can be determined (2014: €100 million), the Group is unable to reasonably estimate the amount or range of amounts of possible loss resulting from the financial guarantee in form of the equity maintenance under-taking due to the various uncertainties described above, although it could be material. Only the guarantee for the bank loan is included in the above disclosures for financial guarantees.
Obligations from product warranties and extended product warranties are not included in the above disclosures. See Note 23 for provisions relating to such obligations.
Other financial obligations. The composition of other financial obligations is shown in Table E.69.
In connection with its production programs, Daimler has committed to purchase various volumes of parts and components over extended periods. The Group also has entered into service arrangements for the provision of future services. In addition, the Group has committed to purchase or invest in the construction and maintenance of production facilities. Amounts under the latter arrangements represent commitments to purchase plant or equipment in the future.
E.69Composition of other financial obligations (nominal amounts)
At December 31,2014 2013
In millions of euros
Commitments from purchasing contracts 9,769 9,771
Long-term rental and leasing agreements 2,157 1,980
Irrevocable credit commitments 1,320 1,508
Other miscellaneous financial commitments 2,318 1,356
15,564 14,615

248
The Group has additional other financial obligations resulting from non-cancelable long-term rental agreements and operating leases for property, plant and equipment; the contracts partially include renewal or repurchase options and escalation clauses. In 2014, Daimler recognized as expense rental payments of €517 million (2013: €501 million). Table E.70 provides an overview of when future minimum lease payments under non-cancelable long-term rental and lease agreements fall due (nominal amounts).
In addition, the Group had issued irrevocable loan commitments as of December 31, 2014. These loan commitments had not been utilized as of that date. An overview of the maturities of irrevocable credit commitments is shown in table E.85 in Note 32.
Miscellaneous other financial commitments primarily comprise financial obligations to make payments in connection with capital contributions to be made into the share capital of uncon-solidated subsidiaries or associated companies as well as obligations in connection with cooperation agreements.
31. Financial instruments
Carrying amounts and fair values of financial instruments
Table E.71 shows the carrying amounts and fair values of the Group’s financial instruments. The fair value of a financial instrument is the price at which a party would accept the rights and/or obligations of that financial instrument from another independent party. Given the varying influencing factors, the reported fair values can only be viewed as indicators of the prices that may actually be achieved on the market.
The fair values of financial instruments were calculated on the basis of market information available on the balance sheet date. The following methods and premises were used:
Receivables from financial services. The fair values of receivables from financial services with variable interest rates are estimated to be equal to the respective carrying amounts because the interest rates agreed and those available in the market do not significantly differ. The fair values of receivables from financial services with fixed interest rates are determined on the basis of discounted expected future cash flows.
The discounting is based on the current interest rates at which similar loans with identical terms could have been obtained as of December 31, 2014 and December 31, 2013.
Trade receivables and cash and cash equivalents. Due to the short terms of these financial instruments, it is assumed that their fair values are equal to the carrying amounts.
Marketable debt securities and other financial assets. Financial assets available-for-sale include: – debt and equity instruments measured at fair value; these
instruments were measured using quoted market prices at December 31. Otherwise, the fair value measurement of these debt and equity instruments is based on inputs that are either directly or indirectly observable on active markets. Equity instruments measured at fair value predominantly comprise the investments in Nissan Motor Co., Ltd. (Nissan) and Renault SA (Renault).
– equity interests measured at cost; fair values could not be determined for these financial instruments because no stock exchange or market prices are available. These equity inter-ests comprise investments in non-listed companies for which no objective evidence existed at the balance sheet date that these assets were impaired and whose fair values cannot be determined with sufficient reliability. It is assumed that the fair values approximate the carrying amounts.
E.70Future minimum lease payments under long-term rental and lease agreements
At December 31,2014 2013
In millions of euros
Maturity
within one year 416 376
between one and five years 1,112 1,032
later than five years 629 572
2,157 1,980

249
E | Consolidated Financial Statements | Notes to the Consolidated Financial Statements
Financial assets recognized at fair value through profit or loss include derivative financial instruments not used in hedge accounting. These financial instruments as well as derivative financial instruments used in hedge accounting comprise: – derivative currency hedging contracts; the fair values
of cross currency interest rate swaps are determined on the basis of the discounted estimated future cash flows using market interest rates appropriate to the remaining terms of the financial instruments. The valuation of currency forwards is based on market quotes of forward curves; currency options were measured using price quotations or option pricing models using market data.
– derivative interest rate hedging contracts; the fair values of interest rate hedging instruments (e.g. interest rate swaps) are calculated on the basis of the discounted estimated future cash flows using the market interest rates appropriate to the remaining terms of the financial instruments.
– derivative commodity hedging contracts; the fair values of commodity hedging contracts (e.g. commodity forwards) are determined on the basis of current reference prices with consideration of forward premiums and discounts.
Other receivables and assets are carried at amortized cost. Because of the predominantly short maturities of these financial instruments, it is assumed that the fair values approximate the carrying amounts.
Financing liabilities. The fair values of bonds, loans, commercial paper, deposits in the direct banking business and liabilities from ABS transactions are calculated as the present values of the estimated future cash flows. Market inter-est rates for the appropriate terms are used for discounting.
Trade payables. Due to the short maturities of these financial instruments, it is assumed that their fair values are equal to the carrying amounts.
Carrying amounts and fair values of financial instruments
At December 31, 2014 At December 31, 2013Carrying amount
Fair value
Carrying amount
Fair value
In millions of euros
Financial assets
Receivables from financial services 61,679 62,057 50,770 51,115
Trade receivables 8,634 8,634 7,803 7,803
Cash and cash equivalents 9,667 9,667 11,053 11,053
Marketable debt securities
Available-for-sale financial assets 6,634 6,634 7,066 7,066
Other financial assets
Available-for-sale financial assets 2,269 2,269 2,052 2,052
thereof equity instruments measured at fair value 1,647 1,647 1,452 1,452
thereof equity instruments measured at cost 622 622 600 600
Financial assets recognized at fair value through profit or loss 97 97 350 350
Derivative financial instruments used in hedge accounting 1,296 1,296 1,703 1,703
Other receivables and assets 2,325 2,325 2,136 2,136
92,601 92,979 82,933 83,278
Financial liabilities
Financing liabilities 86,689 88,043 77,738 79,026
Trade payables 10,178 10,178 9,086 9,086
Other financial liabilities
Financial liabilities recognized at fair value through profit or loss 359 359 413 413
Derivative financial instruments used in hedge accounting 2,317 2,317 395 395
Miscellaneous other financial liabilities 8,030 8,030 7,468 7,468
107,573 108,927 95,100 96,388
E.71

250
Other financial liabilities. Financial liabilities recognized at fair value through profit or loss comprise derivative financial instruments not used in hedge accounting. For information regarding these financial instruments as well as derivative financial instruments used in hedge accounting, see the notes above under marketable debt securities and other financial assets.
Miscellaneous other financial liabilities are carried at amortized cost. Because of the predominantly short maturities of these financial instruments, it is assumed that the fair values approx-imate the carrying amounts.
Offsetting of financial instruments. The Group concludes derivative transactions in accordance with the master netting arrangements (framework agreement) of the International Swaps and Derivatives Association (ISDA) and other appropriate national framework agreements. However, these arrange-ments do not meet the criteria for netting in the consolidated statement of financial position according to IAS 32.42, as they allow netting only in the case of future events such as default or insolvency on the part of the Group or the counterparty.
Table E.72 shows the carrying amounts of the derivative financial instruments subject to the described arrangements as well as the possible financial effects of netting in accor-dance with the master netting arrangements.
Table E.73 provides an overview of the classification into measurement hierarchies of financial assets and liabilities measured at fair value (according to IFRS 13).
At the end of each reporting period, Daimler reviews the necessity of reclassification between the measurement hierarchies.
E.72Disclosure for recognized financial instruments that are subject to an enforceablemaster netting arrangement or similar agreement
At December 31, 2014 At December 31, 2013
Gross and net amounts of
financial instru-ments in the
balance sheet
Amounts
subject to a master netting
arrangement
Net amounts
Gross and net amounts of
financial instru-ments in the
balance sheet
Amounts
subject to a master netting arrangement
Net amounts
In millions of euros
Other financial assets 1,393 -670 723 2,053 -206 1,847
Other financial liabilities 2,676 -670 2,006 808 -206 602
1 The other financial assets which are subject to a master netting arrangement comprise derivative financial instruments that are included in hedge accounting and financial assets measured at fair value through profit or loss (see Note 16).
2 The other financial liabilities which are subject to a master netting arrangement comprise derivative financial instruments that are included in hedge accounting and financial liabilities measured at fair value through profit or loss (see Note 25).

251
E | Consolidated Financial Statements | Notes to the Consolidated Financial Statements
For the determination of the credit risk from derivative financial instruments which are allocated to the Level 2 measurement hierarchy, the exception described in IFRS 13.48 (portfolios managed on basis of net exposure) is applied.
The development of financial assets recognized at fair value through profit or loss and classified as Level 3 is shown in table E.74.
The financial assets shown as classified as level 3 and presented in table E.74 consist solely of Daimler’s option to sell the shares it held in RRPSH to Rolls-Royce (see also Note 13). Daimler sold its shares in RRPSH to Rolls-Royce in 2014. The option was exercised and derecognized through profit or loss.
Measurement hierarchy of financial assets and liabilities measured at fair value
At December 31, 2014 At December 31, 2013Total Level 11 Level 22 Level 33 Total Level 11 Level 22 Level 33
In millions of euros
Available-for-sale financial assets
Financial assets available for sale 8,281 6,158 2,123 – 8,518 6,264 2,254 –
thereof equity instruments 1,647 1,642 5 – 1,452 1,446 6 –
thereof marketable debt securities 6,634 4,516 2,118 – 7,066 4,818 2,248 –
Financial assets measured at fair value through profit or loss
97
–
97
–
350
–
232
118
Derivative financial instruments used in hedge accounting
1,296
–
1,296
–
1,703
–
1,703
–
9,674 6,158 3,516 – 10,571 6,264 4,189 118
Liabilities measured at fair value
Financial liabilities measured at fair value through profit or loss
359
–
359
–
413
–
413
–
Derivative financial instruments used in hedge accounting
2,317
–
2,317
–
395
–
395
–
2,676 – 2,676 – 808 – 808 –
1 Fair value measurement of these assets and liabilities is based on quoted prices (unadjusted) in active markets for these or identical assets or liabilities.2 Fair value measurement of these assets and liabilities is based on inputs that are observable on active markets either directly (i.e. as prices) or indirectly
(i.e. derived from prices).3 Fair value measurement of these assets and liabilities is based on inputs for which no observable market data is available.
E.73
E.74Development of financial assets recognized at fair value through profit or loss classified as level 3
2014 2013
In millions of euros
Balance at January 1 118 178
Losses recognized in other financial income/expense, net
-118
-60
Balance at December 31 – 118

252
Table E.75 shows into which measurement hierarchy (according to IFRS 13) the fair values of the financial assets and liabilities are classified which are not measured at fair value in the consolidated statement of financial position. The carrying amounts of financial instruments presented according to IAS 39 measurement categories are shown in table E.76.
E.75Measurement hierarchy of financial assets and liabilities not measured at fair value
At December 31, 2014 At December 31, 2013Total Level 11 Level 22 Level 33 Total Level 11 Level 22 Level 33
In millions of euros
Financial assets measured at cost
Receivables from financial services 62,057 – 62,057 – 51,115 – 51,115 –
Financial liabilities measured at cost
Financing liabilities 88,043 39,525 48,518 – 79,026 36,384 42,642 –
thereof bonds 44,367 39,525 4,842 – 39,656 35,161 4,495 –
thereof liabilities from ABS transactions 5,996 – 5,996 – 6,145 1,223 4,922 –
thereof other financing liabilities 37,680 – 37,680 – 33,225 – 33,225 –
1 Fair value measurement of these assets and liabilities is based on quoted prices (unadjusted) in active markets for these or identical assets or liabilities.2 Fair value measurement of these assets and liabilities is based on inputs that are observable on active markets either directly (i.e. as prices) or indirectly
(i.e. derived from prices).3 Fair value measurement of these assets and liabilities is based on inputs for which no observable market data is available.

253
E | Consolidated Financial Statements | Notes to the Consolidated Financial Statements
Net gains or losses
Table E.77 shows the net gains or losses of financial instruments included in the consolidated statement of income (excluding derivative financial instruments used in hedge accounting).
Net losses of financial assets and liabilities recognized at fair value through profit or loss primarily include gains and losses attributable to changes in market value.
Net gains on available-for-sale financial assets mainly include income from the measurement of equity interests as well as realized gains from their disposal.
Net losses on loans and receivables mainly include impairment losses that are charged to cost of sales, selling expenses and other financial income/expense, net. Foreign currency gains and losses are also included.
Net gains on financial liabilities measured at cost mainly include gains and losses from the measurement of liabilities denominated in foreign currencies.
Net gains/losses
2014 2013
In millions of euros
Financial assets and liabilities recognized at fair value through profit or loss1
-578
-218
Available-for-sale financial assets 235 90
Loans and receivables -210 -598
Financial liabilities measured at cost 124 74
1 Financial instruments classified as held for trading; these amounts relate to financial instruments that are not used in hedge accounting.
E.77
Carrying amounts of financial instruments presented according to IAS 39 measurement categories
At December 31, 2014 2013
In millions of euros
Assets
Receivables from financial services1 46,599 37,675
Trade receivables 8,634 7,803
Other receivables and assets 2,325 2,136
Loans and receivables 57,558 47,614
Marketable debt securities 6,634 7,066
Other financial assets 2,269 2,052
Available-for-sale financial assets 8,903 9,118
Financial assets recognized at fair value through profit or loss2
97
350
Liabilities
Trade payables 10,178 9,086
Financing liabilities3 86,404 77,428
Other financial liabilities4 7,946 7,388
Financial liabilities measured at cost 104,528 93,902
Financial liabilities recognized at fair value through profit or loss2
359
413
The table above does not include cash and cash equivalents or the carrying amounts of derivative financial instruments used in hedge accounting as these financial instruments are not assigned to an IAS 39 measurement category.
1 This does not include lease receivables of €15,080 million as of December 31, 2014 (2013: €13,095 million) as these are not assigned to an IAS 39 measurement category.
2 Financial instruments classified as held for trading purposes. These figures comprise financial instruments that are not used in hedge accounting.
3 This does not include liabilities from finance leases of €285 million as of December 31, 2014 (2013: €310 million) as these are not assigned to an IAS 39 measurement category.
4 This does not include liabilities from financial guarantees of €84 million as of December 31, 2014 (2013: €80 million) as these are not assigned to an IAS 39 measurement category.
E.76

254
Total interest income and total interest expense
Total interest income and total interest expense for financial assets or financial liabilities that are not measured at fair value through profit or loss are shown in table E.78.
See Note 1 for qualitative descriptions of accounting for financial instruments (including derivative financial instruments).
Information on derivative financial instruments
Use of derivatives. The Group uses derivative financial instruments exclusively for hedging financial risks that arise from its commercial business or refinancing activities. These are mainly interest rate risks, currency risks and commodity price risks. For these hedging purposes, the Group mainly uses currency forward transactions, cross currency interest rate swaps, interest rate swaps, options and commodity forwards.
Fair values of hedging instruments. Table E.79 shows the fair values of hedging instruments at the end of the reporting period.
Fair value hedges. The Group uses fair value hedges primarily for hedging interest rate risks.
Net gains and losses from these hedging instruments and the changes in the value of the underlying transactions are shown in table E.80.
Cash flow hedges. The Group uses cash flow hedges for hedging currency risks, interest rate risks and commodity price risks.
Unrealized pre-tax gains and losses on the measurement of derivatives, which are recognized in other comprehensive income, are shown in table E.81.
Table E.82 provides an overview of the reclassifications of pre-tax gains/losses from equity to the statement of income for the period.
Net profit for 2014 includes net losses (before income taxes) of €17 million (2013: €7 million) attributable to the ineffective-ness of derivative financial instruments entered into for hedging purposes (hedge-ineffectiveness).
In 2014, the discontinuation of cash flow hedges as a result of non-realizable hedged items resulted in losses of €6 million (2013: €8 million).
The maturities of the interest rate hedges and cross currency interest rate hedges as well as of the commodity hedges corre-spond with those of the underlying transactions. The realization of the underlying transactions of the cash flow hedges is expected to correspond with the maturities of the hedging transactions shown in table E.83. As of December 31, 2014, Daimler utilized derivative instruments with a maximum maturity of 36 months (2013: 36 months) as hedges for currency risks arising from future transactions.
Total interest income and total interest expense
2014 2013
In millions of euros
Total interest income 3,089 2,964
Total interest expense -1,666 -1,977
E.78
Fair values of hedging instruments
At December 31,2014 2013
In millions of euros
Fair value hedges 535 118
Cash flow hedges -1,527 1,177
Hedges of net investments in foreign operations -29 13
E.79
Net gains/losses from fair value hedges
2014 2013
In millions of euros
Net gains/losses from hedging instruments 553 -386
Net gains/losses from underlying transactions -552 413
E.80
Unrealized gains/losses from cash flow hedges
2014 2013
In millions of euros
Unrealized gains/losses -2,433 1,388
E.81
Reclassifications of pre-tax gains/losses from equity to the statement of income
2014 2013
In millions of euros
Revenue 340 286
Cost of sales -90 -36
Interest income – –
Interest expense -2 -2
248 248
E.82

255
E | Consolidated Financial Statements | Notes to the Consolidated Financial Statements
Hedges of net investments in foreign operations. Daimler also partially hedges the foreign currency risk of selected investments with the application of derivative financial instru-ments.
Nominal values of derivative financial instruments. Table E.83 shows the nominal values of derivative financial instruments entered into for the purpose of hedging currency risks, interest rate risks and commodity price risks that arise from the Group’s operating and/or financing activities.
Hedging transactions for which the effects from the measure-ment of the hedging instrument and the underlying trans -action to a large extent offset each other in the consolidated statement of income mostly not classify for hedge accounting.
Even if derivative financial instruments do not or no longer qualify for hedge accounting, these instruments are still hedging financial risks from the operating business. A hedging instrument is terminated if the hedged item no longer exists or is no longer expected to occur.
Explanations of the hedging of exchange rate risks, interest rate risks and commodity price risks can be found in Note 32 in the sub-item finance market risk.
Nominal values of derivative financial instruments
At December 31, 2014 At December 31, 2013
Nominal valuesMaturity≤ 1 year
Maturity > 1 year
Nominal values
In millions of euros
Hedging of currency risks from receivables/liabilities
Forward exchange contracts 5,513 5,511 2 5,747
Cross currency interest rate swaps 5,803 2,246 3,557 4,776
thereof cash flow hedges 2,137 843 1,294 1,305
thereof fair value hedges 2,926 1,264 1,662 2,541
Hedging of currency risks from forecasted transactions
Forward exchange contracts and currency options 41,621 25,511 16,110 30,439
thereof cash flow hedges 39,873 23,813 16,060 29,525
Hedging of currency risks of net investments in foreign operations
Currency swaps 545 545 – 1,898
thereof hedging of net investments in foreign operations 545 545 – 1,898
Hedging of interest rate risks from receivables/liabilities
Interest rate swaps 31,884 5,087 26,797 29,656
thereof cash flow hedges 1,647 897 750 3,837
thereof fair value hedges 27,384 4,176 23,208 22,775
Hedging of commodity price risks from forecasted transactions
Forward commodity contracts 1,460 659 801 1,389
thereof cash flow hedges 1,305 540 765 1,059
Total nominal values of derivative financial instruments 86,826 39,559 47,267 73,905
thereof cash flow hedges 44,962 26,093 18,869 35,726
thereof fair value hedges 30,310 5,440 24,870 25,316
E.83

256
32. Management of financial risks
General information on financial risks
As a result of its businesses and the global nature of its operations, Daimler is exposed in particular to market risks from changes in foreign currency exchange rates and interest rates, while commodity price risks arise from procurement. An equity price risk results from investments in listed companies (including Nissan, Renault, BAIC Motor and Kamaz). In addition, the Group is exposed to credit risks from its leasing and financing activities and from its operating business (trade receiv-ables). With regard to the leasing and financing activities, credit risks arise from operating lease contracts, finance lease contracts and financing contracts. Furthermore, the Group is exposed to liquidity and country risks relating to its credit and market risks or a deterioration of its operating business or financial market disturbances. If these financial risks materialize, they could adversely affect Daimler’s profitability, liquidity and capital resources and financial position.
Daimler has established guidelines for risk controlling procedures and for the use of financial instruments, including a clear segregation of duties with regard to financial activities, settle-ment, accounting and the related controlling. The guidelines upon which the Group’s risk management processes for financial risks are based are designed to identify and analyze these risks throughout the Group, to set appropriate risk limits and controls and to monitor the risks by means of reliable and up-to-date administrative and information systems. The guide-lines and systems are regularly reviewed and adjusted to changes in markets and products.
The Group manages and monitors these risks primarily through its operating and financing activities and, if required, through the use of derivative financial instruments. Daimler uses deriv-ative financial instruments exclusively for hedging financial risks that arise from its commercial business or refinancing activities. Without these derivative financial instruments, the Group would be exposed to higher financial risks (additional information on financial instruments and especially on the nominal values of the derivative financial instruments used is included in Note 31). Daimler regularly evaluates its financial risks with due consideration of changes in key economic indi-cators and up-to-date market information.
Any market sensitive instruments including equity and debt securities that the plan assets hold to finance pension and other post-employment healthcare benefits are not included in the following quantitative and qualitative analysis. See Note 22 for additional information on Daimler’s pension and other post-employment benefits.
Credit risk
Credit risk is the risk of economic loss arising from a counter-party’s failure to repay or service debt in accordance with the contractual terms. Credit risk encompasses both the direct risk of default and the risk of a deterioration of creditwor-thiness as well as concentration risks.
The maximum risk positions of financial assets which are generally subject to credit risk are equal to their carrying amounts (without consideration of collateral, if available). Table E.84 shows the maximum risk positions.
Maximum risk positions of financial assets and loan commitments
See also
Note
Maximum risk position
2014
Maximum risk position
2013
In millions of euros
Liquid assets 16,301 18,119
Receivables from financial services
14
61,679
50,770
Trade receivables 19 8,634 7,803
Derivative financial instruments used in hedge accounting (assets only)
16
1,296
1,703
Derivative financial instruments not used in hedge accounting (assets only)
16
97
350
Loan commitments 30 1,320 1,508
Other receivables and financial assets
16
2,325
2,136
E.84

257
E | Consolidated Financial Statements | Notes to the Consolidated Financial Statements
Liquid assets. Liquid assets consist of cash and cash equiva-lents and marketable debt securities classified as available- for-sale. With the investment of liquid assets, banks and issuers of securities are selected very carefully and diversified in accordance with a limit system. In the past years, the limit methodology was continuously enhanced to counteract the decline of the creditworthiness of the banking sector in the course of the financial crisis. Additionally, liquid assets are increasingly also held at financial institutions outside Europe with high creditworthiness and as bonds issued by German federal states. At the same time, the Group has increased the number of financial institutions with which investments are made. In connection with investment decisions, priority is placed on the borrower’s very high creditworthiness and on balanced risk diversification. The limits and their utilizations are reassessed continuously. In this assessment Daimler also considers the credit risk assessment of its counterparties by the capital markets. In line with the Group’s risk policy, most liquid assets are held in investments with an external rating of “A” or better.
Receivables from financial services. Daimler’s financing and leasing activities are primarily focused on supporting the sales of the Group’s automotive products. As a consequence of these activities, the Group is exposed to credit risk, which is monitored and managed based on defined standards, guide-lines and procedures. Daimler Financial Services manages its credit risk irrespective of whether it is related to a financing contract or to an operating lease or a finance lease contract. For this reason, statements concerning the credit risk of Daimler Financial Services refer to the entire financing and leasing business, unless specified otherwise.
Exposure to credit risk from financing and lease activities is monitored based on the portfolio subject to credit risk. The portfolio subject to credit risk is an internal control quantity that consists of wholesale and retail receivables from financial services and the portion of the operating lease portfolio that is subject to credit risk. Receivables from financial services comprise claims arising from finance lease contracts and repayment claims from financing loans. The operating lease portfolio is reported under equipment on operating leases in the Group’s consolidated financial statements. Overdue lease payments from operating lease contracts are recognized in trade receivables.
In addition, the Daimler Financial Services segment is exposed to credit risk from irrevocable loan commitments to retailers and end customers. At December 31, 2014, irrevocable loan commitments of Daimler Financial Services amounted to €1,306 million (2013: €1,407 million), of which €772 million had a maturity of less than one year (2013: €1,004 million), €249 million had maturities between one and three years (2013: €244 million), €172 million had maturities between three and four years (2013: €83 million) and €113 million had maturities between four and five years (2013: €76 million).
The Daimler Financial Services segment has guidelines setting the framework for effective risk management at a global as well as at a local level. In particular, these rules deal with mini-mum requirements for all risk-relevant credit processes, the definition of financing products offered, the evaluation of customer quality, requests for collateral as well as the treatment of unsecured loans and non-performing claims. The limitation of concentration risks is implemented primarily by means of global limits, which refer to single customer exposures. As of December 31, 2014, exposure to the biggest 15 customers did not exceed 4.0% (2013: 4.1%) of the total portfolio.
With respect to its financing and lease activities, the Group holds collateral for customer transactions. The value of collateral generally depends on the amount of the financed assets. The financed vehicles usually serve as collateral. Furthermore, Daimler Financial Services mitigates the credit risk from financing and lease activities, for example through advance payments from customers.
Scoring systems are applied for the assessment of the default risk of retail and small business customers. Corporate customers are evaluated using internal rating instruments. Both evaluation processes use external credit bureau data if available. The scoring and rating results as well as the availability of security and other risk mitigation instruments, such as advance payments, guarantees and, to a lower extent, residual debt insurances, are essential elements for credit decisions.
Significant loans and leases to corporate customers are tested individually for impairment. An individual loan or lease is considered impaired when there is objective evidence that the Group will be unable to collect all amounts due as specified by the contractual terms. Examples of objective evidence that loans or lease receivables may be impaired include the following factors: significant financial difficulty of the borrower, a rising probability that the borrower will become bankrupt, delinquency in his installment payments, and restructured or renegotiated contracts to avoid immediate default.

258
Loans and finance lease receivables related to retail or small business customers are grouped into homogeneous pools and collectively assessed for impairment. Impairments are required for example if there are adverse changes in the payment status of the borrowers included in the pool, adverse changes in expected loss frequency and severity, and adverse changes in economic conditions.
Within the framework of testing for impairment, existing collateral is generally given due consideration. In that context, any excess collateral of individual customers is not netted off with insufficient collateral of other customers. The maximum credit risk is limited by the fair value of collateral (e.g. financed vehicles).
If, in connection with contracts, a worsening of payment behavior or other causes of a need for impairment are recognized, collection procedures are initiated by claims management to obtain the overdue payments of the customer, to take possession of the asset financed or leased or, alternatively, to renegotiate the impaired contract. Restructuring policies and practices are based on the indicators or criteria which, in the judgment of local management, indicate that repayment will probably continue and that the total proceeds expected to be derived from the renegotiated contract exceed the expected proceeds to be derived from repossession and remarketing.
Impairment losses have remained at the favorable low level of the previous year in a globally stable risk situation.
Further details on receivables from financial services and the balance of the recorded impairments are provided in Note 14.
Trade receivables. Trade receivables are mostly receivables from worldwide sales activities of vehicles and spare parts. The credit risk from trade receivables encompasses the default risk of customers, e.g. dealers and general distribution com panies, as well as other corporate and private customers. Daimler manages its credit risk from trade receivables using appropriate IT applications and databases on the basis of internal guidelines which have to be followed globally.
A significant part of the trade receivables from each country’s domestic business is secured by various country-specific types of collateral. This collateral includes conditional sales, guarantees and sureties as well as mortgages and cash deposits. In order to prevent the credit risk Daimler assesses the credit worthiness of the counterparties.
For trade receivables from export business, Daimler also evaluates each general distribution company’s creditworthiness by means of an internal rating process and its country risk. In this context, the year-end financial statements and other relevant information on the general distribution companies such as payment history are used and assessed.
Depending on the creditworthiness of the general distribution companies, Daimler usually establishes credit limits and limits credit risks with the following types of collateral:
– credit insurances, – first-class bank guarantees and – letters of credit.
These procedures are defined in the export credit guidelines, which have Group-wide validity.
Appropriate provisions are recognized for the risks inherent in trade receivables. For this purpose, all receivables are regularly reviewed and impairments are recognized if there is any objective indication of non-performance or other contractual violations. In general, substantial individual receiv-ables and receivables whose realizability is jeopardized are assessed individually. In addition, taking country-specific risks and any collateral into consideration, the other receivables are grouped by similarity of contract and tested for impairment collectively. One important factor for the definition of the impairment to be recognized is the respective country risk.
Further information on trade receivables and the status of impairments recognized is provided in Note 19.
Derivative financial instruments. The Group uses derivative financial instruments exclusively for hedging financial risks that arise from its commercial business or refinancing activities. Daimler manages its credit risk exposure in connection with derivative financial instruments through a limit system, which is based on the review of each counterparty’s financial strength. This system limits and diversifies the credit risk. As a result, Daimler is exposed to credit risk only to a small extent with respect to its derivative financial instruments. In accordance with the Group’s risk policy, most derivatives are contracted with counterparties which have an external rating of “A” or better.
Other receivables and financial assets. With respect to other receivables and financial assets in 2014 and 2013, Daimler is exposed to credit risk only to a small extent.

259
E | Consolidated Financial Statements | Notes to the Consolidated Financial Statements
Liquidity risk
Liquidity risk comprises the risk that a company cannot meet its financial obligations in full.
Daimler manages its liquidity by holding adequate volumes of liquid assets and by maintaining syndicated credit facilities in addition to the cash inflows generated by its operating business. Additionally, the possibility to securitize receivables of financial services business (ABS transactions) also reduces the Group’s liquidity risk. Liquid assets comprise cash and cash equivalents as well as debt instruments classified as held for sale. The Group can dispose of these liquid assets at short notice.
In general, Daimler makes use of a broad spectrum of financial instruments to cover its funding requirements. Depending on funding requirements and market conditions, Daimler issues commercial paper, bonds and financial instruments secured by receivables in various currencies. In 2014, Daimler had very good access to the money and capital markets. Bank credit lines are also used to cover financing requirements. Potential downgrades of our credit ratings could have a negative impact on the Group’s financing.
In addition, customer deposits at Mercedes-Benz Bank are used as a further source of refinancing.
The funds raised are used to finance working capital and capital expenditure as well as the cash needs of the lease and financing business and unexpected liquidity needs. In accor-dance with internal guidelines, the refunding of the lease and financing business is generally carried out with matching maturities so that financing liabilities have the same maturity profile as the leased assets and the receivables from financial services. At December 31, 2014, liquidity amounted to €16.3 billion (2013: €18.1 billion). In 2014, significant cash inflows resulted from the positive contributions to earnings by the automotive segments and from the sale of the RRPSH and Tesla shares (see Note 3). Cash outflows mainly resulted from refinancing the portfolio growth of the leasing and sales financing activities of Daimler Financial Services, as well as from the unscheduled contribution to the German pension plan assets (see Note 22).
At December 31, 2014, the Group had short-term and long-term credit lines totaling €41.7 billion, of which €17.2 billion were not utilized. These credit lines include a syndicated €9.0 billion credit facility of Daimler AG with five year tenor and two extension options of two years in total which was signed with a syndicate of international banks in September 2013. In 2014, Daimler exercised the option to extend the credit line by a further year until 2019. This syndicated facility serves as a back-up for commercial paper drawings and provides funds for general corporate purposes. At December 31, 2014, this facility had not been utilized.
From an operating point of view, the management of the Group’s liquidity exposures is centralized by a daily cash pooling process. This process enables Daimler to manage its liquidity surplus and liquidity requirements according to the actual needs of the Group and each subsidiary. The Group’s short-term and mid-term liquidity management takes into account the maturities of financial assets and financial liabilities and estimates of cash flows from the operating business.
Information on the Group’s financing liabilities is also provided in Note 24.
Country risk
Country risk is the risk of economic loss arising from changes of political, economic, legal or social conditions in the respective country, e.g. resulting from sovereign measures such as expropriation or interdiction of foreign currency transfers.
Daimler is exposed to country risk mainly resulting from cross-border funding of Group companies and customers as well as cross-border capital investments at Group companies and joint ventures. Additionally, country risk also arises from cross-border investments of liquid assets with financial institutions.
Daimler manages these risks via country exposure limits (e.g. for export credits or for hard currency portfolios of financial services entities) and via insurance of equity investments in high-risk countries. An internal rating system serves as a basis for Daimler’s risk-oriented country exposure management; it assigns all countries to risk classes, with consideration of external ratings and capital market indications of country risks.

260
Table E.85 provides an overview of how the future liquidity situation of the Group is affected by the cash flows from liabilities and financial guarantees as of December 31, 2014.
Finance market risks
The global nature of its businesses exposes Daimler to significant market risks resulting from fluctuations in foreign currency exchange rates and interest rates. In addition, the Group is exposed to market risks in terms of commodity price risk associated with its business operations, which the Group hedges partially through derivative financial instru-ments. The Group is also exposed to equity price risk in connection with its investments in listed companies (including Nissan, Renault, BAIC Motor and Kamaz). If these market risks materialize, they will adversely affect the Group’s profit-ability, liquidity and capital resources and financial position.
Daimler manages market risks to minimize the impact of fluctuations in foreign exchange rates, interest rates and commodity prices on the results of the Group and its segments. The Group calculates its overall exposure to these market risks to provide the basis for hedging decisions, which include the selection of hedging instruments and the determination of hedging volumes and the corresponding periods. Decisions regarding the management of market risks resulting from fluctuations in foreign exchange rates, interest rates (asset-/liability management) and commodity prices are regularly made by the relevant Daimler risk management committees.
As part of its risk management system, Daimler employs value at risk. In performing these analyses, Daimler quantifies its market risk exposure to changes in foreign currency exchange rates and interest rates on a regular basis by predicting the potential loss over a target time horizon (holding period) and confidence level.
The value at risk calculations employed:
– express potential losses in fair values, and
– assume a 99% confidence level and a holding period of five days.
Daimler calculates the value at risk for exchange rate and interest rate risk according to the variance-covariance approach. The value at risk calculation method for commodity hedging instruments is based on a Monte Carlo simulation.
When calculating the value at risk by using the variance- covariance approach, Daimler first computes the current market value of the Group’s financial instruments portfolio. Then the sensitivity of the portfolio value to changes in the relevant market risk factors, such as particular foreign currency exchange rates or interest rates of specific maturities, is quantified. Based on expected volatilities and correlations of these market risk factors, which are obtained from the Risk-Metrics™ dataset, a statistical distribution of potential changes in the portfolio value at the end of the holding period is computed. The loss which is reached or exceeded with a probability of only 1% can be derived from this calculation and represents the value at risk.
Liquidity runoff for liabilities and financial guarantees1
Total 2015 2016 2017 2018 2019 ≥ 2020
In millions of euros
Financing liabilities2 92,492 38,150 19,445 13,698 6,994 4,226 9,979
Derivative financial instruments3 3,359 1,858 1,095 281 79 24 22
Trade payables4 10,178 10,146 32 – – – –
Miscellaneous other financial liabilities excluding accrued interest
7,230
5,625
535
469
249
109
243
Irrevocable loan commitments of the Daimler Financial Services segment and of Daimler AG5
1,320
786
–
249
172
113
–
Financial guarantees6 786 786 – – – – –
115,365 57,351 21,107 14,697 7,494 4,472 10,244
1 The amounts were calculated as follows: (a) If the counterparty can request payment at different dates, the liability is included on the basis of the earliest date on which Daimler can
be required to pay. The customer deposits of Mercedes-Benz Bank are considered in this analysis to mature within the first year. (b) The cash flows of floating interest financial instruments are estimated on the basis of forward rates.2 The stated cash flows of financing liabilities consist of their undiscounted principal and interest payments.3 The undiscounted sum of the net cash outflows of the derivative financial instruments is shown for the respective year. For individual periods,
this may also include negative cash flows from derivatives with an overall positive fair value.4 The cash outflows of trade payables are undiscounted.5 The maximum available amounts are stated.6 The maximum potential obligations under the issued guarantees are stated. It is assumed that the amounts are due within the first year.
E.85

261
E | Consolidated Financial Statements | Notes to the Consolidated Financial Statements
The Monte Carlo simulation uses random numbers to generate possible changes in market risk factors over the holding period. The changes in market risk factors indicate a possible change in the portfolio value. Running multiple repetitions of this simu-lation leads to a distribution of portfolio value changes. The value at risk can be determined based on this distribution as the portfolio value loss which is reached or exceeded with a probability of 1%.
Oriented towards the risk management standards of the international banking industry, Daimler maintains its financial controlling system independent of operating Corporate Treasury and with a separate reporting line.
Exchange rate risk. Transaction risk and currency risk management. The global nature of Daimler’s businesses exposes cash flows and earnings to risks arising from fluctuations in exchange rates. These risks primarily relate to fluctuations between the US dollar and the euro, which also apply to the export of vehicles to China and between the British pound and the euro.
In the operating vehicle business, the Group’s exchange rate risk primarily arises when revenue is generated in a currency that is different from the currency in which the costs of generating the revenue are incurred (transaction risk). When the revenue is converted into the currency in which the costs are incurred, it may be inadequate to cover the costs if the value of the currency in which the revenue is generated declined in the interim relative to the value of the currency in which the costs were incurred. This risk exposure primarily affects the Mercedes-Benz Cars segment, which generates a major portion of its revenue in foreign currencies and incurs manufacturing costs primarily in euros. The Daimler Trucks segment is also subject to transaction risk, but to a lesser extent because of its global production network. The Mercedes-Benz Vans and Daimler Buses segments are also directly exposed to transaction risk, but only to a minor degree compared to the Mercedes-Benz Cars and Daimler Trucks segments. In addition, the Group is indirectly exposed to transaction risk from its equity-method investments.
Cash inflows and outflows of the business segments are offset if they are denominated in the same currency. This means that the exchange rate risk resulting from revenue generated in a particular currency can be offset by costs in the same currency, even if the revenue arises from a transaction indepen-dent of that in which the costs are incurred. As a result, only the net exposure is subject to transaction risk. In addition, natural hedging opportunities exist to the extent that currency exposures of the operating businesses of individual segments offset each other at Group level, thereby reducing overall currency exposure. These natural hedges eliminate the need for hedging to the extent of the matched exposures. To provide an additional natural hedge against any remaining transaction risk exposure, Daimler generally strives to increase cash outflows in the same currencies in which the Group has a net excess inflow.
In order to mitigate the impact of currency exchange rate fluctuations for the operating business (future transactions), Daimler continually assesses its exposure to exchange rate risks and hedges a portion of those risks by using derivative financial instruments. Daimler’s Foreign Exchange Committee (FXCo) manages the Group’s exchange rate risk and its hedging transactions through currency derivatives. The FXCo consists of representatives of the relevant segments and central functions. The Corporate Treasury department aggregate foreign currency exposures from Daimler’s subsidiaries and operative units and carries out the FXCo’s decisions concerning foreign currency hedging through transactions with international financial institutions. Risk Controlling regularly informs the Board of Management of the actions taken by Corporate Treasury based on the FXCo’s decisions.
The Group’s targeted hedge ratios for forecasted operating cash flows in foreign currency are indicated by a reference model. On the one hand, the hedging horizon is naturally limited by uncertainty related to cash flows that lie far in the future; on the other hand, it may also be limited by the fact that appro-priate currency contracts are not available. This reference model aims to protect the Group from unfavorable movements in exchange rates while preserving some flexibility to partici-pate in favorable developments. Based on this reference model and depending on the market outlook, the FXCo determines the hedging horizon, which usually varies from one to three years, as well as the average hedge ratios. Reflecting the character of the underlying risks, the hedge ratios decrease with increasing maturities. At year-end 2014, foreign exchange management showed an unhedged position in the automotive business for the underlying forecasted cash flows in US dollars in calendar year 2015 of 21% and for the underlying forecasted cash flows in British pounds in calendar year 2015 of 23%. The corre-sponding figures at year-end 2013 for calendar year 2014 were 35% for US dollars and 26% for British pounds. The lower unhedged US dollar position compared to the previous year contributes to a lower exposure of cash flows to currency risk with respect to the US dollar.
262
The hedged position of the operating vehicle businesses is influenced by the amount of derivative currency contracts held. The derivative financial instruments used to cover foreign currency exposure are primarily forward foreign exchange contracts and currency options. Daimler’s guidelines call for a mixture of these instruments depending on the assessment of market conditions. Value at risk is used to measure the exchange rate risk inherent in these derivative financial instru-ments.
Table E.86 shows the period-end, high, low and average value at risk figures of the exchange rate risk for the 2014 and 2013 portfolios of derivative financial instruments, which were entered into primarily in connection with the operative vehicle businesses. Average exposure has been computed on an end-of-quarter basis. The offsetting transactions under-lying the derivative financial instruments are not included in the following value at risk presentation. See also table E.83 for the nominal volumes on the balance sheet date of deriva-tive currency instruments entered into to hedge the currency risk from forecasted transactions.
In 2014, the development of the value at risk from foreign currency hedging was mainly driven by changes in the nominal volume and by the increased foreign currency volatilities at year end.
The Group’s investments in liquid assets or refinancing activities generally are not allowed to result in currency risk. Transaction risks arising from liquid assets or payables in foreign currencies that result from the Group’s investment or refinancing on money and capital markets are generally hedged against currency risks at the time of investing or refinancing in accordance with Daimler’s internal guidelines. The Group uses appropriate derivative financial instruments (e.g. cross currency interest rate swaps) to hedge against currency risk.
Since currency risks arising from the Group’s investment refinancing in foreign currencies and the respective hedging transactions principally offset each other, these financial instruments are not included in the value at risk calculation presented.
Effects of currency translation. For purposes of Daimler’s consolidated financial statements, the income and expenses and the assets and liabilities of subsidiaries located outside the euro zone are converted into euros. Therefore, period- to-period changes in average exchange rates may cause trans-lation effects that have a significant impact on, for example, revenue, segment result (EBIT) and assets and liabilities of the Group. Unlike exchange rate transaction risk, exchange rate translation risk does not necessarily affect future cash flows. The Group’s equity position reflects changes in book values caused by exchange rates. In general Daimler does not hedge against exchange rate translation risk.
Interest rate risk. Daimler uses a variety of interest rate sensitive financial instruments to manage the liquidity needs of its day-to-day operations. A substantial volume of interest rate sensitive assets and liabilities results from the leasing and sales financing business operated by the Daimler Financial Services segment. The Daimler Financial Services companies enter into transactions with customers that primarily result in fixed-rate receivables. Daimler’s general policy is to match funding in terms of maturities and interest rates wherever economically feasible. However, for a limited portion of the receivables portfolio in selected and developed markets, the Group does not match funding in terms of maturities in order to take advantage of market opportunities. As a result, Daimler is exposed to risks due to changes in interest rates. In this regard, the Group is not exposed to any liquidity risks.
An asset/liability committee consisting of members of the Daimler Financial Services segment and the Corporate Treasury department manages the interest rate risk relating to Daimler’s leasing and financing activities by setting targets for the interest rate risk position. The Treasury Risk Management department and the local Daimler Financial Services companies are jointly responsible for achieving these targets. As separate functions, the Daimler Financial Services Risk Management and the Daimler Financial Services Control-ling & Reporting department monitors target achievement on a monthly basis. In order to achieve the targeted interest rate risk positions in terms of maturities and interest rate fixing periods, Daimler also uses derivative financial instruments such as interest rate swaps. Daimler assesses its interest rate risk position by comparing assets and liabilities for corre-sponding maturities, including the impact of the relevant derivative financial instruments. Derivative financial instruments are also used in conjunction with the refinancing related to the industrial business. Daimler coordinates the funding activities of the industrial and financial services businesses at the Group level.
Table E.86 shows the period-end, high, low and average value at risk figures of the interest rate risk for the 2014 and 2013 portfolio of interest rate sensitive financial instruments and derivative financial instruments of the Group, including the derivative financial instruments of the leasing and sales financing business. In this respect, the table shows the interest rate risk regarding the unhedged position of interest rate sensitive financial instruments. The average values have been computed on an end-of-quarter basis.
In the course of 2014, changes of the value at risk for interest rate sensitive financial instruments were primarily determined by the development of interest rate volatilities.

263
E | Consolidated Financial Statements | Notes to the Consolidated Financial Statements
Commodity price risk. Daimler is exposed to the risk of changes in commodity prices in connection with procuring raw materials and manufacturing supplies used in production. A small portion of the raw material price risk, primarily relating to forecasted procurement of certain metals, is mitigated with the use of derivative financial instruments.
For precious metals, central commodity management shows an unhedged position of 32% of the forecasted commodity purchases at year-end 2014 for calendar year 2015. The corre-sponding figure at year-end 2013 was 27% for calendar year 2014.
Table E.86 shows the period-end, high, low and average value at risk figures of the commodity price risk for the 2014 and 2013 portfolio of derivative financial instruments used to hedge raw material price risk. Average exposure has been computed on an end-of-quarter basis. The transactions underlying the derivative financial instruments are not included in the value at risk presentation. See also table E.83 for the nominal values of derivative commodity price hedges at the balance sheet date.
Compared to the previous year, the value at risk of commodity derivatives has increased. The main reasons for this development were rising volatilities and for platinum an increase in the nominal hedge volume.
Equity price risk. Daimler predominantly holds investments in shares of companies which are classified as long-term investments, such as Nissan or Renault, or which are accounted for using the equity method, such as BAIC Motor or Kamaz. Therefore, the Group does not include these investments in a market risk assessment.
Value at risk for exchange rate risk, interest rate risk and commodity price risk
2014 2013Period-end High Low Average Period-end High Low Average
In millions of euros
Exchange rate risk (from derivative financial instruments)
731
731
370
494
442
784
386
527
Interest rate risk 36 39 30 36 37 59 28 42
Commodity price risk (from derivative financial instruments)
38
38
25
32
24
38
24
32
E.86

264
33. Segment reporting
Reportable segments. The reportable segments of the Group are Mercedes-Benz Cars, Daimler Trucks, Mercedes-Benz Vans, Daimler Buses and Daimler Financial Services. The segments are largely organized and managed separately accord-ing to nature of products and services provided, brands, distribution channels and profile of customers.
The vehicle segments develop and manufacture passenger cars and off-road vehicles, trucks, vans and buses. Mercedes-Benz Cars sells passenger cars and off-road vehicles under the Mercedes-Benz brand and small cars under the smart brand. Daimler Trucks distributes its trucks under the brand names Mercedes-Benz, Freightliner, FUSO, Western Star, Thomas Built Buses and BharatBenz. The vans of the Mercedes-Benz Vans segment are primarily sold under the brand name Mercedes-Benz and also under the Freightliner brand. Daimler Buses sells completely built-up buses under the brand names Mercedes-Benz and Setra. In addition, Daimler Buses produces and sells bus chassis. The vehicle segments also sell related spare parts and accessories.
The Daimler Financial Services segment supports the sales of the Group’s vehicle segments worldwide. Its product portfolio mainly comprises tailored financing and leasing pack-ages for customers and dealers. The segment also provides services such as insurance, fleet management, investment products and credit cards, as well as various mobility services.
Management and reporting systems. The Group’s manage-ment reporting and controlling systems principally use accounting policies that are the same as those described in Note 1 in the summary of significant accounting policies according to IFRS.
The Group measures the performance of its operating segments through a measure of segment profit or loss which is referred to as “EBIT” in our management and reporting system. EBIT comprises gross profit, selling and general administrative expenses, research and non-capitalized development costs, other operating income and expense, and our share of profit/loss from equity-method investments, net, as well as other financial income/expense, net. Although amortization of capitalized borrowing costs is included in cost of sales, it is not included in EBIT.
Intersegment revenue is generally recorded at values that approximate third-party selling prices.
Segment assets principally comprise all assets. The industrial business segments’ assets exclude income tax assets, assets from defined benefit pension plans and other post-employment benefit plans, and certain financial assets (including liquidity).
Segment liabilities principally comprise all liabilities. The industrial business segments’ liabilities exclude income tax liabilities, liabilities from defined benefit pension plans and other post-employment benefit plans, and certain financial liabilities (including financing liabilities).
Daimler Financial Services’ performance is measured on the basis of return on equity, which is the usual procedure in the banking business.
The residual value risks associated with the Group’s operating leases and finance lease receivables are generally borne by the vehicle segments that manufactured the leased equipment. Risk sharing is based on agreements between the respective vehicle segments and Daimler Financial Services; the terms vary by vehicle segment and geographic region.
Non-current assets consist of intangible assets, property, plant and equipment and equipment on operating leases.
Capital expenditures for property, plant and equipment and intangible assets reflect the cash effective additions to these property, plant and equipment and intangible assets as far as they do not relate to capitalized borrowing costs, goodwill and finance leases.
Depreciation and amortization may also include impairments as far as they do not relate to goodwill.
Amortization of capitalized borrowing costs is not included in the amortization of intangible assets or depreciation of property, plant and equipment since it is not considered as part of EBIT.

265
E | Consolidated Financial Statements | Notes to the Consolidated Financial Statements
Reconciliation. Reconciliation includes corporate items for which headquarters are responsible. Transactions between the segments are eliminated in the context of consolidation and the eliminated amounts are included in the reconciliation.
The effects of certain legal proceedings are excluded from the operative results and liabilities of the segments if such items are not indicative of the segments’ performance, since their related results of operations may be distorted by the amount and the irregular nature of such events. This may also be the case for items that refer to more than one reportable segment.
Reconciliation also includes corporate projects and equity interests not allocated to the segments. If the Group hedges investments in associated companies for strategic reasons, the related financial assets and earnings effects are generally not allocated to the segments.
Information related to geographic areas. With respect to information about geographical regions, revenue is allocated to countries based on the location of the customer; non-current assets are presented according to the physical location of these assets.
Mercedes-Benz Cars. In 2014, in the segment Mercedes-Benz Cars the restructuring of the Group’s sales organization had an effect of €81 million (see also Note 5). Furthermore, the segment profit of Mercedes-Benz Cars includes in profit/loss from equity-method investments an impairment of €30 million (2013: €174 million) on an investment in the area of alternative drive systems.
Daimler Trucks. In January 2013, Daimler Trucks decided on workforce adjustments in Germany and Brazil, which were continued in 2014. Expenses recorded in this regard and for the restructuring of the Group’s sales organization amounted to €165 million in 2014 (2013: €116 million). In 2014, the optimization programs led to a cash outflow of €170 million (2013: €50 million) (see also Note 5).
Mercedes-Benz Vans. In 2014, profit/loss from equity-method investments for the segment Mercedes-Benz Vans includes the reversal of an impairment on the investment in FBAC of €61 million (2013: €0 million). In addition, the restructuring of the Group’s sales organization affected Mercedes-Benz Vans by an amount of €17 million.
Daimler Buses. Expenses from the measures described under Daimler Trucks and from the restructuring of the Group’s sales organization impacted Daimler Buses in 2014 with a total amount of €14 million. In the previous year, the expenses of €39 million included effects from the optimization programs in Western Europe and North America (see also Note 5).
Daimler Financial Services. The interest income and interest expenses of Daimler Financial Services are included in revenue and cost of sales, and are presented in Notes 4 and 5.
Table E.87 presents segment information as of and for the years ended December 31, 2014 and 2013.

266
Segment information
Mercedes-Benz Cars
Daimler
Trucks
Mercedes-Benz Vans
Daimler
Buses
Daimler Financial Services
Total
Segments
Recon-
ciliation
Consoli-
dated Group
In millions of euros
2014
External revenue 70,899 30,302 9,601 4,155 14,915 129,872 – 129,872
Intersegment revenue 2,685 2,087 367 63 1,076 6,278 -6,278 –
Total revenue 73,584 32,389 9,968 4,218 15,991 136,150 -6,278 129,872
Segment profit (EBIT) 5,853 1,878 682 197 1,387 9,997 755 10,752
thereof profit/loss from equity-method investments
103
-1
63
1
-15
151
746
897
thereof expenses from compounding of provisions and changes in discount rates
-247
-70
-20
-11
-4
-352
-1
-353
Segment assets 51,950 20,181 5,895 3,562 105,454 187,042 2,593 189,635
thereof equity method investments 936 545 97 8 30 1,616 678 2,294
Segment liabilities 34,811 12,131 4,349 2,622 97,837 151,750 -6,699 145,051
Additions to non-current assets 10,949 1,896 1,004 507 9,899 24,255 10 24,265
thereof investments in intangible assets
1,238
77
115
13
20
1,463
–
1,463
thereof investments in property, plant and equipment
3,621
788
304
105
23
4,841
3
4,844
Depreciation and amortization of non-current assets1
4,562
1,435
452
225
3,368
10,042
15
10,057
thereof amortization of intangible assets
1,086
284
93
15
20
1,498
–
1,498
thereof depreciation of property, plant and equipment1
2,446
766
197
75
14
3,498
3
3,501
1 Includes impairments of property, plant and equipment of €93 million from the planned sale of selected sites of the Group’s sales network, of which €64 million relates to Mercedes-Benz Cars, €13 million to Daimler Trucks, €14 million to Mercedes-Benz Vans and €2 million to Daimler Buses.
E.87

267
E | Consolidated Financial Statements | Notes to the Consolidated Financial Statements
Mercedes-Benz Cars
Daimler
Trucks
Mercedes-Benz Vans
Daimler
Buses
Daimler Financial Services
Total
Segments
Recon-
ciliation
Consoli-
dated Group
In millions of euros
2013
External revenue 61,883 29,431 9,021 4,044 13,603 117,982 – 117,982
Intersegment revenue 2,424 2,042 348 61 919 5,794 -5,794 –
Total revenue 64,307 31,473 9,369 4,105 14,522 123,776 -5,794 117,982
Segment profit (EBIT) 4,006 1,637 631 124 1,268 7,666 3,149 10,815
thereof profit/loss from equity-method investments
-127
69
3
1
1
-53
3,398
3,345
thereof expenses from compounding of provisions and changes in discount rates
-57
-20
-8
-3
-5
-93
-2
-95
Segment assets 46,752 21,105 5,578 3,256 89,370 166,061 2,457 168,518
thereof equity method investments 706 2,109 2 6 13 2,836 596 3,432
Segment liabilities 28,917 11,005 3,987 2,403 82,774 129,086 -3,931 125,155
Additions to non-current assets 11,110 1,960 1,196 384 8,301 22,951 70 23,021
thereof investments in intangible assets
1,533
166
189
6
38
1,932
–
1,932
thereof investments in property, plant and equipment
3,710
839
288
76
19
4,932
43
4,975
Depreciation and amortization of non-current assets
3,857
1,457
375
200
2,824
8,713
35
8,748
thereof amortization of intangible assets
961
316
65
23
11
1,376
–
1,376
thereof depreciation of property, plant and equipment
1,972
784
151
72
14
2,993
-1
2,992

268
Reconciliations. Reconciliations of the total segment amounts to the respective items included in the consolidated financial statements are shown in table E.88.
Other corporate items in the reconciliation of the total segments’ profit to Group EBIT. In 2014, the line item other corporate items comprises expenses of €600 million in connection with the ongoing EU Commission antitrust proceedings concerning European commercial vehicle manufacturers as well as further expenses in connection with legal proceedings. This line item also includes expenses of €212 million from the hedging of the Tesla share price (2013: €0 million) and income of €88 million from the sale of the Tesla shares (2013: €0 million), as well as expenses of €118 million from the measurement of the RRPSH put option (2013: €60 million). In the prior year, a loss of €140 million was disclosed in connection with the disposal of the remaining shares in EADS, which was reported within other financial income/expense, net.
Revenue and non-current assets by region. Revenue from external customers and non-current assets by region are shown in table E.89.
E.89Revenue and non-current assets by region
Revenue Non-current assets2014 2013 2014 2013
In millions of euros
Western Europe 43,722 41,123 40,519 38,371
thereof Germany 20,449 20,227 32,882 32,070
United States 33,310 28,597 18,161 14,839
Other American countries 9,550 10,168 2,778 2,496
Asia 29,446 24,481 1,859 1,667
thereof China 13,294 10,705 79 41
Other countries 13,844 13,613 2,282 1,954
129,872 117,982 65,599 59,327
E.88Reconciliation to Group figures
2014 2013
In millions of euros
Total of segments’ profit (EBIT) 9,997 7,666
Result from the disposal of the investment in RRPSH
1,006
–
Equity-method investments
Remeasurement of the investment in Tesla
718
–
Remeasurement and sale of the investment in EADS
–
3.397
Other income from equity-method investments1
28
1
Other corporate items -1,039 -331
Eliminations 42 82
Group EBIT 10,752 10,815
Amortization of capitalized borrowing costs2
-9
-4
Interest income 145 212
Interest expense -715 -884
Profit before income taxes 10,173 10,139
Total of segments’ assets 187,042 166,061
Carrying amount of equity-method investments3
678
596
Income tax assets4 4,028 1,939
Unallocated financial assets (including liquidity) and assets from pensions and similar obligations4
13,886
14,560
Other corporate items and eliminations -15,999 -14,638
Group assets 189,635 168,518
Total of segments’ liabilities 151,750 129,086
Income tax liabilities4 47 61
Unallocated financial liabilities and liabilities from pensions and similar obligations4
9,661
11,551
Other corporate items and eliminations -16,407 -15,543
Group liabilities 145,051 125,155
1 Mainly comprises the Group’s proportionate share of profits and losses of BAIC Motor.
2 Amortization of capitalized borrowing costs is not considered in the internal performance measure “EBIT” but is included in cost of sales.
3 Mainly comprises the carrying amount of the investment in BAIC Motor.4 Industrial business.

269
E | Consolidated Financial Statements | Notes to the Consolidated Financial Statements
34. Capital management
“Net assets” and “value added” represent the basis for capital management at Daimler. The assets and liabilities of the segments in accordance with IFRS provide the basis for the determination of net assets at Group level. The industrial segments are accountable for the operational net assets; all assets, liabilities and provisions which they are responsible for in day-to-day operations are therefore allocated to them. Performance measurement at Daimler Financial Services is on an equity basis, in line with the usual practice in the banking business. Net assets at Group level additionally include assets and liabilities from income taxes as well as other corporate items and eliminations.
The average annual net assets are calculated from the average quarterly net assets. The average quarterly net assets are calculated as an average of the net assets at the beginning and the end of the quarter and are shown in table E.90.
The cost of capital of the Group’s average net assets is reflected in “value added.” Value added shows the extent to which the Group achieves or exceeds the minimum return requirements of the shareholders and creditors, thus creating additional value. The required rate of return on net assets, and thus the cost of capital, are derived from the minimum rates of return that investors expect on their invested capital. The Group’s cost of capital comprises the cost of equity as well as the costs of debt and pension obligations of the industrial business; in addition, the expected returns on liquidity and on the plan assets of the pension funds of the industrial business are considered with the opposite sign. In the reporting period, the cost of capital used for our internal capital management amounted to 8% after taxes.
The objective of capital management is to increase value added among other things by optimizing the cost of capital. This is achieved on the one hand by the management of the net assets, for instance by optimizing working capital, which is within the operational responsibility of the segments. In addition, taking into account legal regulations, Daimler strives to optimize the costs and risks of its capital structure and, consequently, the cost of capital, with due consideration of applicable law. Examples of this include a balanced relationship between equity and financial liabilities as well as an appropriate level of liquidity, oriented towards the operational requirements.
35. Earnings per share
The calculation of basic and diluted earnings per share for net profit attributable to shareholders of Daimler AG is shown in table E.91.
Average net assets
2014 2013
In millions of euros
Mercedes-Benz Cars 17,114 16,658
Daimler Trucks 9,313 10,571
Mercedes-Benz Vans 1,742 1,547
Daimler Buses 982 1,068
Daimler Financial Services1 7,154 6,607
Net assets of the segments 36,305 36,451
Equity method investments2 618 638
Assets and liabilities from income taxes3 2,700 2,479
Other corporate items and eliminations3 1,156 1,080
Net assets Daimler Group 40,779 40,648
1 Equity2 Unless allocated to the segments3 Industrial business
E.90
Earnings per share
2014 2013
In millions of euros
Profit attributable to shareholders of Daimler AG – basic
6,962
6,842
Dilutive effects on net profit – –
Profit attributable to shareholders of Daimler AG – diluted
6,962
6,842
In millions of shares
Weighted average number of shares outstanding – basic
1,069.8
1,068.8
Dilutive effect of stock options – 0.3
Weighted average number of shares outstanding – diluted
1,069.8
1,069.1
E.91

270
36. Related party relationships
Related parties are deemed to be associated companies, joint ventures, joint operations and unconsolidated subsidiaries, as well as persons who exercise a significant influence on the financial and business policy of the Daimler Group. The latter category includes all persons in key positions and their close family members. At the Daimler Group, those persons are the members of the Board of Management and of the Supervisory Board.
Most of the goods and services supplied within the ordinary course of business between the Group and related parties comprise transactions with associated companies, joint ventures and joint operations, and are shown in table E.92.
Associated companies. A large proportion of the Group’s sales of goods and services with associated companies as well as receivables results from business relations with Beijing Benz Automotive Co., Ltd. (BBAC). In December 2013, the share-holders of BBAC decided to pay a dividend, of which €101 million is attributable to Daimler. The related receivable is included in table E.92. As described under Note 13, in the third quarter of 2013, BAIC Motor increased its stake in the joint venture BBAC by 1% to 51%. As a result of this transaction, Daimler’s equity interest in BBAC decreased to 49% and the Group classified the investment in BBAC as an associated company; the company had been accounted for as a joint venture until the end of the third quarter of 2013.
Significant transactions of goods and services also took place with Rolls-Royce Power Systems AG (RRPS), which is a subsidiary of RRPSH.
The purchases of goods and services shown in table E.92 were primarily from MBtech Group GmbH & Co. KGaA (MBtech Group). MBtech Group develops, integrates and tests components, systems, modules and vehicles worldwide.
Joint ventures. In the prior year, transactions with joint ventures predominantly related to the business relationship with BBAC (see information in the section on associated companies). Furthermore, significant sales of goods and services took place with Fujian Benz Automotive Co. Ltd. (FBAC) as well as with Mercedes-Benz Trucks Vostok OOO and Fuso Kamaz Trucks Rus Ltd., joint ventures established with Kamaz OAO, another of the Group’s associated companies.
Until the end of March 2013, further significant sales and pur-chases of goods and services were related to Mercedes-Benz Österreich Vertriebsgesellschaft, which distributes vehicles and spare parts of the Group. In March 2013, the remaining shares of the entity were acquired together with other Pappas Group entities.
In connection with its 45% equity interest in Toll Collect GmbH, Daimler has issued guarantees which are not shown in table E.92 (€100 million at December 31, 2014 and €100 million at December 31, 2013).
Joint operations. Joint operations primarily relate to significant business transactions with Beijing Mercedes-Benz Sales Service Co., Ltd. (BMBS), which provides advisory and other services relating to marketing, sales and distribution in the Chinese market.
Note 13 provides details of the business operations of the significant associated companies and joint ventures, as well as significant transaction, in the year 2014.
Contributions to plan assets. In 2014 and 2013, the Group made contributions of €3,121 million and €560 million to its external funds to cover pension and other post-employment benefits. See also Note 22 for further information.
E.92Transactions with related parties
Sales of goods and services
and other income
Purchases of goods and services
and other expense
Receivables
Payables
at December 31, at December 31,2014 2013 2014 2013 2014 2013 2014 2013
In millions of euros
Associated companies 2,433 1,184 316 417 764 713 65 61
thereof BBAC 2,093 1,685 28 54 726 569 16 12
Joint ventures 646 1,9861 134 1651 195 191 6 4
Joint operations 25 48 221 225 44 43 22 50
1 Includes transactions with BBAC until September 30, 2013

271
E | Consolidated Financial Statements | Notes to the Consolidated Financial Statements
Board members. Throughout the world, the Group has business relationships with numerous entities that are customers and/or suppliers of the Group. Those customers and/or suppliers include companies that have a connection with some of the members of the Board of Management or of the Super-visory Board and close family members of these board members of Daimler AG or its subsidiaries.
Board of Management and Supervisory Board members and close family members of these board members may also purchase goods and services from Daimler AG or its subsidiaries as customers. When such business relationships exist, trans-actions are concluded on the basis of customary market condi-tions.
See Note 37 for information on the remuneration of board members.
37. Remuneration of the members of the Board of Management and the Supervisory Board
Remuneration granted to the members of the Board of Management and the Supervisory Board who were active as of December 31, 2014, affected net profit for the year ended December 31 as shown in table E.93.
Expenses for variable remuneration with long-term incentive effect, as shown in table E.93, result from the ongoing measurement at fair value at each balance sheet date of all rights granted and not yet due under the Performance Phantom Share Plans (PPSP). In the previous year, the stock options granted in 2004 were measured at their intrinsic value. These rights were fully exercised by the members of the Board of Management in the year 2013. In 2014, the active members of the Board of Management were granted 153,912 (2013: 251,359) phantom shares in connection with the PPSP; the fair value of these phantom shares at the grant date was €10.1 million (2013: €10.9 million). According to Section 314 Subsection 1 Number 6a of the German Commercial Code (HGB) the overall remuneration granted to the members of the Board of Management, excluding service cost resulting from entitlements to post-employment benefits, amounted to €29.9 million (2013: €32.1 million). See Note 21 for additional information on share-based payment of the members of the Board of Management.
The members of the Supervisory Board are solely granted short-term benefits for their board and committee activities, except for remuneration and other benefits paid to those members representing the employees in accordance with their contracts of employment. No remuneration was paid for services provided personally beyond board and committee activities, in particular for advisory or agency services, in 2014 or 2013.
No advance payments or loans were made to members of the Board of Management or to the members of the Supervisory Board of Daimler AG.
The payments made in 2014 to former members of the Board of Management of Daimler AG and their survivors amounted to €16.8 million (2013: €14.6 million). The pension provisions for former members of the Board of Management and their survivors amounted to €263.0 million as of December 31, 2014 (2013: €217.0 million).
Information regarding the remuneration of the members of the Board of Management and of the Supervisory Board is disclosed on an individual basis in the Remuneration Report, which is part of the Management Report. E Management Report from page 118
Remuneration of the members of the Board of Management and the Supervisory Board
2014 2013
In millions of euros
Remuneration granted to the members of the Board of Management
Fixed remuneration 8.2 9.1
Short-term variable remuneration 5.8 6.1
Mid-term variable remuneration 6.2 6.6
Variable remuneration with a long-term incentive effect
20.7
40.6
Post-employment benefits (service cost) 2.8 2.5
Termination benefits – –
43.7 64.9
Remuneration granted to the members of the Supervisory Board
3.6
3.0
47.3 67.9
E.93

272
38. Principal accountant fees
The shareholders of Daimler AG elected KPMG AG Wirtschafts-prüfungsgesellschaft as the external auditor at the Annual Shareholders’ Meeting held on April 9, 2014. The fees paid for services provided by KPMG AG Wirtschaftsprüfungsgesell-schaft and companies of the worldwide KPMG group are shown in table E.94.
The annual audit fees are for the audit of the consolidated financial statements and the company financial statements of Daimler AG and all subsidiaries included in the Group’s consolidated financial statements. Fees for other attestation services include in particular the review of the interim IFRS financial statements (2014: €5 million; 2013: €5 million) and fees relating to the audit of the internal control system (2014: €3 million; 2013: €3 million). The remaining fees primar-ily relate to project-related reviews performed in the context of the introduction of IT systems, attestation services in connec-tion with capital market actions, other assurance services and, to a small extent, voluntary audits.
The Audit Committee of the Supervisory Board of Daimler AG prepares a recommendation each year on the election of the auditor it has classified as independent. The independent auditor is then elected by the Annual Shareholders’ Meeting of Daimler AG on the basis of the recommendation of the Super-visory Board. After the external auditor is appointed by the Supervisory Board of Daimler AG, the Audit Committee approves the conditions, scope and fees for the audit services, the review of the interim consolidated financial statements and the audit of the internal control system.
For all other permissible attestation services and other services (so-called non-audit services), the Audit Committee has implemented an approval process to monitor the inde-pendence of the external auditor, which regulates the principles and procedures of an advance approval of non-audit services by means of a clearly defined catalogue of services.
39. Additional information
German Corporate Governance Code. The Board of Management and the Supervisory Board of Daimler AG have issued a declaration pursuant to Section 161 of the German Stock Corporation Act (AktG) and have made it perma-nent available to their shareholders on Daimler’s website at
w http://www.daimler.com/company/corporate- governance/company-declarations/declaration-to-161-aktg.
Third-party companies. At December 31, 2014, the Group was a shareholder of the companies included in table E.95 that meet the criteria of a significant third-party company as defined by the German Corporate Governance Code.
Information on investments. The statement of investments of Daimler AG pursuant to Sections 285 and 313 of the German Commercial Code (HGB) is presented in table E.96. Information on equity and earnings and information on investments pursuant to Section 285 No. 11 fourth part of the Sentence and/or Section 313 Subsection 2 No. 4 Sentence 2 of the HGB is omitted pursuant to Section 286 Subsection 3 Sentence 1 No. 1 and/or Section 313 Subsection 2 No. 4 Sentence 3 of the HGB to the extent that such information is of minor relevance for a fair presentation of the profitability, liquidity and capital resources and financial position of Daimler AG. In addition, the statement of investments (footnote 7) indicates which consolidated companies make use of the exemp-tion pursuant to Section 264 Subsection 3 and/or Section 264b of the HGB. The consolidated financial statements of Daimler AG release those subsidiaries from the requirements that would otherwise apply.
Third-party companies
Name of the company
Renault SA2
Nissan Motor Company Ltd.3
Headquarters of the company
Boulogne-Billancourt, France
Tokyo, Japan
Equity interest in %1 3.1 3.1
Total equity in millions of euros4 22,837 30,464
Net profit in millions of euros4 586 2,896
1 As of December 31, 2014.2 Based on IFRS consolidated financial statements
for the year ended December 31, 2013.3 Based on national consolidated financial statements
for the year ended March 31, 2014.4 Excluding non-controlling interests.
E.95
E.94Accountant fees
2014 2013
In millions of euros
Audit of financial statements 24 24
thereof KPMG AG Wirtschaftsprüfungsgesellschaft
10
10
Other attestation services 14 13
thereof KPMG AG Wirtschaftsprüfungsgesellschaft
10
10
Tax consulting 2 2
thereof KPMG AG Wirtschaftsprüfungsgesellschaft
1
2
Other services 4 3
thereof KPMG AG Wirtschaftsprüfungsgesellschaft
4
2
44 42

273
E | Consolidated Financial Statements | Notes to the Consolidated Financial Statements
Statement of investments of Daimler AG
Name of the Company Domicile, Country Capital share in %1
Equity in millions
of €
Net income (loss) in
millions of €
Footnote
I. Consolidated subsidiaries
Atlantis Foundries (Pty.) Ltd. Atlantis Industria, Republic of South Africa 100.00 – –
Banco Mercedes-Benz do Brasil S.A. São Paulo, Brazil 100.00 440 40
Belerofonte Empreendimentos Imobiliários Ltda. São Paulo, Brazil 100.00 – –
BlackStar InvestCo LLC Wilmington, USA 100.00 653 587
Brooklands Estates Management Limited Milton Keynes, United Kingdom 100.00 – –
Campo Largo Comercio de Veículos e Peças Ltda. São Bernardo do Campo, Brazil 100.00 – –
car2go Canada Ltd. Vancouver, Canada 100.00 – –
car2go Danmark A/S Copenhagen, Denmark 100.00 – –
car2go Deutschland GmbH Leinfelden-Echterdingen, Germany 100.00 6 -11
car2go Europe GmbH Leinfelden-Echterdingen, Germany 75.00 72 -13
car2go Italia S.R.L. Milan, Italy 100.00 – –
car2go N.A. LLC Wilmington, USA 100.00 21 -18
car2go Nederland B.V. Utrecht, Netherlands 100.00 – –
car2go Österreich GmbH Vienna, Austria 100.00 – –
car2go Sverige AB Kista, Sweden 100.00 – –
car2go UK Ltd. Milton Keynes, United Kingdom 100.00 – –
CARS Technik & Logistik GmbH Wiedemar, Germany 100.00 – – 7, 8
CLIDET NO 1048 (Proprietary) Limited Centurion, Republic of South Africa 100.00 – –
Conemaugh Hydroelectric Projects, Inc. Farmington Hills, USA 100.00 – –
Coventry Lane Holdings, L.L.C. Farmington Hills, USA 100.00 – –
DAF Investments, Ltd. Farmington Hills, USA 100.00 – –
Daimler AC Leasing, d.o.o. Ljubljana, Slovenia 52.00 – –
Daimler Australia/Pacific Pty. Ltd. Melbourne, Australia 100.00 – –
Daimler Automotive de Venezuela C.A. Valencia, Venezuela 100.00 – –
Daimler Buses North America Inc. Oriskany, USA 100.00 – –
Daimler Buses North America Ltd. Mississauga, Canada 100.00 – –
Daimler Buses North Carolina LLC Oriskany, USA 100.00 – –
Daimler Canada Finance Inc. Montreal, Canada 100.00 203 1 11
Daimler Canada Investments Company Halifax, Canada 100.00 – –
Daimler Capital Services LLC Farmington Hills, USA 100.00 – –
Daimler Colombia S. A. Bogota D.C., Colombia 100.00 – –
Daimler Export and Trade Finance GmbH Berlin, Germany 100.00 – – 7, 8
Daimler Finance North America LLC Wilmington, USA 100.00 – –
Daimler Financial Services AG Stuttgart, Germany 100.00 1,715 – 7, 8, 10
Daimler Financial Services India Private Limited Chennai, India 100.00 – –
Daimler Financial Services Japan Co., Ltd. Kawasaki, Japan 100.00 55 11 10
Daimler Financial Services México, S. de R.L. de C.V. Mexico City, Mexico 100.00 – –
Daimler Financial Services, S.A. de C.V., S.O.F.O.M., E.N.R. Mexico City, Mexico 100.00 – –
Daimler Fleet Management GmbH Stuttgart, Germany 100.00 1 – 7, 8, 10
Daimler Fleet Management Singapore Pte. Ltd. Singapore, Singapore 100.00 – –
Daimler Fleet Management South Africa (Pty.) Ltd. Centurion, Republic of South Africa 65.00 29 10
Daimler Fleet Management UK Limited Milton Keynes, United Kingdom 100.00 – –
Daimler Fleet Services A.S. Istanbul, Turkey 100.00 – –
Daimler FleetBoard GmbH Stuttgart, Germany 100.00 – – 7, 8
Daimler Greater China Ltd. Beijing, PR China 100.00 889 245
Daimler India Commercial Vehicles Private Limited Chennai, India 100.00 177 -164 12
Daimler Insurance Agency LLC Farmington Hills, USA 100.00 – –
Daimler Insurance Services GmbH Stuttgart, Germany 100.00 – – 7, 8
Daimler Insurance Services Japan Co., Ltd. Tokyo, Japan 100.00 – –
Daimler Insurance Services UK Limited Milton Keynes, United Kingdom 100.00 – –
Daimler International Finance B.V. Utrecht, Netherlands 100.00 27 -10 10
Daimler Investments US Corporation Montvale, USA 100.00 15,163 -54 11
Daimler Luft- und Raumfahrt Holding AG Stuttgart, Germany 100.00 3,445 – 7, 8
Daimler Manufactura, S. de R.L. de C.V. Mexico City, Mexico 100.00 – –
Daimler Mexico, S.A. de C.V. Mexico City, Mexico 100.00 387 56 11
Daimler Motors Investments LLC Farmington Hills, USA 100.00 – –
Daimler Nederland B.V. Utrecht, Netherlands 100.00 833 3 11
E.96

274
Name of the Company Domicile, Country Capital share in %1
Equity in millions
of €
Net income (loss) in
millions of €
Footnote
Daimler North America Corporation Montvale, USA 100.00 5,308 827 11
Daimler North America Finance Corporation Newark, USA 100.00 36,917 342 11
Daimler Northeast Asia Parts Trading and Services Co., Ltd. Beijing, PR China 100.00 85 20
Daimler Parts Brand GmbH Stuttgart, Germany 100.00 – – 7, 8
Daimler Re Brokers GmbH Bremen, Germany 74.90 – – 7, 8
Daimler Re Insurance S.A. Luxembourg Luxembourg, Luxembourg 100.00 – –
Daimler Real Estate GmbH Berlin, Germany 100.00 – – 7, 8
Daimler Retail Receivables LLC Farmington Hills, USA 100.00 – –
DAIMLER SERVICIOS CORPORATIVOS MEXICO S. DE R.L. DE C.V.
Mexico City, Mexico 100.00 – –
Daimler South East Asia Pte. Ltd. Singapore, Singapore 100.00 119 38 11
Daimler Trucks and Buses (China) Ltd. Beijing, PR China 100.00 – –
Daimler Trucks Canada Ltd. Mississauga, Canada 100.00 60 15 11
Daimler Trucks Korea Ltd. Seoul, South Korea 100.00 – –
Daimler Trucks North America LLC Portland, USA 100.00 2,035 1,013 11
Daimler Trucks Remarketing Corporation Portland, USA 100.00 – –
Daimler Trust Holdings LLC Farmington Hills, USA 100.00 – –
Daimler Trust Leasing Conduit LLC Farmington Hills, USA 100.00 – –
Daimler Trust Leasing LLC Farmington Hills, USA 100.00 – –
Daimler UK Limited Milton Keynes, United Kingdom 100.00 599 115
Daimler Vans Hong Kong Limited Hong Kong, PR China 67.55 – –
Daimler Vans Manufacturing, LLC Ladson, USA 100.00 – –
Daimler Vans USA, LLC Montvale, USA 100.00 – –
Daimler Vehículos Comerciales Mexico S. de R.L. de C.V. Mexico City, Mexico 100.00 – –
Daimler Vermögens- und Beteiligungsgesellschaft mbH Stuttgart, Germany 100.00 8,815 – 7, 8
Daimler Verwaltungsgesellschaft für Grundbesitz mbH Schönefeld, Germany 100.00 3,697 – 7, 8
Daimler Vorsorge und Versicherungsdienst GmbH Berlin, Germany 100.00 – – 7, 8
Daimspain S.L. Madrid, Spain 100.00 1,620 39
Daiprodco Mexico S. de R.L. de C.V. Mexico City, Mexico 100.00 – –
DCS UTI LLC, Mercedes Series Farmington Hills, USA 100.00 – –
Detroit Diesel Corporation Detroit, USA 100.00 182 158 11
Detroit Diesel Remanufacturing LLC Detroit, USA 100.00 60 17 11
Detroit Diesel Remanufacturing Mexicana, S. de R.L. de C.V. Toluca, Mexico 100.00 – –
Detroit Diesel-Allison de Mexico, S. de R.L. de C.V. San Juan Ixtacala, Mexico 100.00 – –
Deutsche Accumotive GmbH & Co. KG Kirchheim unter Teck, Germany 100.00 – – 7
EHG Elektroholding GmbH Stuttgart, Germany 100.00 1,130 – 7, 8
EvoBus (Schweiz) AG Kloten, Switzerland 100.00 – –
EvoBus (U.K.) Ltd. Coventry, United Kingdom 100.00 – –
EvoBus Austria GmbH Wiener Neudorf, Austria 100.00 – –
EvoBus Belgium N.V. Kobbegem-Asse, Belgium 100.00 – –
EvoBus Ceská republika s.r.o. Prague, Czech Republic 100.00 – –
EvoBus Danmark A/S Koege, Denmark 100.00 – –
EvoBus France S.A.S. Sarcelles, France 100.00 – –
EvoBus GmbH Kirchheim unter Teck, Germany 100.00 173 – 7, 8
EvoBus Ibérica, S.A. Sámano, Spain 100.00 – –
EvoBus Italia S.p.A. Bomporto, Italy 100.00 – –
EvoBus Nederland B.V. Nijkerk, Netherlands 100.00 – –
EvoBus Polska Sp. z o.o. Wolica, Poland 100.00 – –
EvoBus Portugal, S.A. Mem Martins, Portugal 100.00 – –
EvoBus Sverige AB Vetlanda, Sweden 100.00 – –
Freightliner Custom Chassis Corporation Gaffney, USA 100.00 35 70 11
Freightliner Holding Ltd. Calgary, Canada 100.00 51 18 11
Freightliner Ltd. Portland, USA 100.00 62 -16 11
Grundstücksverwaltungsgesellschaft Daimler AG & Co. Alpha 1 OHG
Schönefeld, Germany 100.00 1,769 27 7
Grundstücksverwaltungsgesellschaft Daimler AG & Co. Alpha 3 OHG
Schönefeld, Germany 100.00 – – 7
Grundstücksverwaltungsgesellschaft Daimler AG & Co. Alpha 4 OHG
Schönefeld, Germany 100.00 340 4 7
Grundstücksverwaltungsgesellschaft Daimler AG & Co. Alpha 5 OHG
Schönefeld, Germany 100.00 584 20 7
Grundstücksverwaltungsgesellschaft Daimler AG & Co. Alpha 6 OHG
Schönefeld, Germany 100.00 – – 7

275
E | Consolidated Financial Statements | Notes to the Consolidated Financial Statements
Name of the Company Domicile, Country Capital share in %1
Equity in millions
of €
Net income (loss) in
millions of €
Footnote
Grundstücksverwaltungsgesellschaft Daimler AG & Co. Beta OHG
Schönefeld, Germany 100.00 271 1 7
Grundstücksverwaltungsgesellschaft Daimler AG & Co. Delta OHG
Schönefeld, Germany 100.00 420 1 7
Grundstücksverwaltungsgesellschaft Daimler AG & Co. Epsilon OHG
Schönefeld, Germany 100.00 325 1 7
Grundstücksverwaltungsgesellschaft Daimler AG & Co. Gamma 1 OHG
Schönefeld, Germany 100.00 1,002 2 7
Grundstücksverwaltungsgesellschaft Daimler AG & Co. Gamma 2 OHG
Schönefeld, Germany 100.00 – – 7
Grundstücksverwaltungsgesellschaft Daimler AG & Co. Gamma 3 OHG
Schönefeld, Germany 100.00 – – 7
Grundstücksverwaltungsgesellschaft EvoBus GmbH & Co. OHG
Schönefeld, Germany 100.00 145 15 7, 9
Grundstücksverwaltungsgesellschaft Henne-Unimog GmbH & Co. OHG
Schönefeld, Germany 100.00 – – 7
Henne-Unimog GmbH Kirchheim-Heimstetten, Germany 100.00 – – 7, 8
Intelligent Apps GmbH Hamburg, Germany 100.00 – –
Intrepid Insurance Company Farmington Hills, USA 100.00 – –
Invema Assessoria Empresarial Ltda São Paulo, Brazil 100.00 – –
Koppieview Property (Pty) Ltd Zwartkop, Republic of South Africa 100.00 – –
Li-Tec Battery GmbH Kamenz, Germany 100.00 – – 7, 8
MBarc Credit Canada Inc. Mississauga, Canada 100.00 – –
MBV Projektmanagement AG Stuttgart, Germany 100.00 – – 7, 8
MDC Power GmbH Kölleda, Germany 100.00 8 – 7, 8
MDC Technology GmbH Arnstadt, Germany 100.00 – – 7, 8
Mercedes AMG High Performance Powertrains Ltd Brixworth, United Kingdom 100.00 106 11
Mercedes-AMG GmbH Affalterbach, Germany 100.00 21 - 7, 8
Mercedes-Benz - Aluguer de Veículos, Unipessoal Lda. Mem Martins, Portugal 100.00 – –
Mercedes-Benz (China) Ltd. Beijing, PR China 75.00 1,920 1,501
Mercedes-Benz (Thailand) Limited Bangkok, Thailand 100.00 171 103
Mercedes-Benz (Yangzhou) Parts Distribution Co., Ltd. Yangzhou, PR China 100.00 – –
Mercedes-Benz Accessories GmbH Stuttgart, Germany 100.00 5 – 7, 8
Mercedes-Benz AG & Co. Grundstücksvermietung Objekt Franken KG
Schönefeld, Germany 90.00 – – 4, 9
Mercedes-Benz AG & Co. Grundstücksvermietung Objekt Germersheim Betriebsvorrichtungen OHG
Schönefeld, Germany 99.00 – – 4, 6, 9
Mercedes-Benz AG & Co. Grundstücksvermietung Objekt Germersheim KG
Schönefeld, Germany 99.00 – – 4, 6
Mercedes-Benz AG & Co. Grundstücksvermietung Objekt Südwest KG
Schönefeld, Germany 99.00 – – 4, 6
Mercedes-Benz AG & Co. Grundstücksvermietung Objekte Baden-Baden und Dresden OHG
Düsseldorf, Germany 100.00 – – 4, 9
Mercedes-Benz AG & Co. Grundstücksvermietung Objekte Leipzig und Magdeburg KG
Düsseldorf, Germany 100.00 – – 4
Mercedes-Benz AG & Co. Grundstücksvermietung Objekt Rhein-Main OHG
Schönefeld, Germany 90.00 – – 4
Mercedes-Benz Antwerpen N.V. Antwerp, Belgium 100.00 – –
Mercedes-Benz Argentina S.A. Buenos Aires, Argentina 100.00 182 66 10
Mercedes-Benz Asia GmbH Stuttgart, Germany 100.00 – – 7, 8
Mercedes-Benz Australia/Pacific Pty Ltd Melbourne, Australia 100.00 395 51 11
Mercedes-Benz Auto Finance Ltd. Beijing, PR China 100.00 475 36
Mercedes-Benz Auto Lease Trust 2013-A Wilmington, USA 0.00 – – 4
Mercedes-Benz Auto Lease Trust 2013-B Wilmington, USA 0.00 – – 4
Mercedes-Benz Auto Lease Trust 2014-A Wilmington, USA 0.00 – – 4
Mercedes-Benz Auto Receivables Trust 2012-1 Wilmington, USA 0.00 – – 4
Mercedes-Benz Auto Receivables Trust 2013-1 Wilmington, USA 0.00 – – 4
Mercedes-Benz Auto Receivables Trust 2014-1 Wilmington, USA 0.00 – – 4
Mercedes-Benz Bank AG Stuttgart, Germany 100.00 1,416 – 8, 10
Mercedes-Benz Bank Polska S.A. Warsaw, Poland 100.00 – –
Mercedes-Benz Bank Rus OOO Moscow, Russian Federation 100.00 90 17 10
Mercedes-Benz Bank Service Center GmbH Berlin, Germany 100.00 – –
Mercedes-Benz Banking Service GmbH Saarbrücken, Germany 100.00 – – 7, 8

276
Mercedes-Benz Belgium Luxembourg S.A. Brussels, Belgium 100.00 93 23
Mercedes-Benz Bordeaux S.A.S. Begles, France 100.00 – –
Mercedes-Benz Broker Biztositási Alkusz Hungary Kft. Budapest, Hungary 100.00 – –
Mercedes-Benz Brooklands Limited Milton Keynes, United Kingdom 100.00 – –
Mercedes-Benz Canada Inc. Toronto, Canada 100.00 27 59
Mercedes-Benz Capital Rus OOO Moscow, Russian Federation 100.00 – –
Mercedes-Benz Ceská republika s.r.o. Prague, Czech Republic 100.00 – –
Mercedes-Benz CharterWay España, S.A. Alcobendas, Spain 100.00 – –
Mercedes-Benz CharterWay Gesellschaft mit beschränkter Haftung
Berlin, Germany 100.00 1 – 7, 8, 10
Mercedes-Benz CharterWay S.A.S. Le Chesnay, France 100.00 – –
Mercedes-Benz CharterWay S.r.l. Trento, Italy 100.00 – –
Mercedes-Benz Comercial, Unipessoal Lda. Mem Martins, Portugal 100.00 – –
Mercedes-Benz Compañía Financiera Argentina S.A. Buenos Aires, Argentina 100.00 – –
Mercedes-Benz Corretora de Seguros Ltda São Paulo, Brazil 99.98 – –
Mercedes-Benz Côte d'Azur SAS Villeneuve-Loubet, France 100.00 – –
Mercedes-Benz CPH A/S Horsholm, Denmark 100.00 – –
Mercedes-Benz Credit Pénzügyi Szolgáltató Hungary Zrt. Budapest, Hungary 100.00 – –
Mercedes-Benz Danmark A/S Copenhagen, Denmark 100.00 – –
Mercedes-Benz Dealer Bedrijven B.V. The Hague, Netherlands 100.00 – –
Mercedes-Benz Desarrollo de Mercados, S. de R.L. de C.V. Mexico City, Mexico 100.00 – –
Mercedes-Benz do Brasil Assessoria Comercial Ltda. São Paulo, Brazil 100.00 – –
Mercedes-Benz do Brasil Ltda. São Bernardo do Campo, Brazil 100.00 786 -155
Mercedes-Benz Drogenbos N.V. Drogenbos, Belgium 100.00 – –
Mercedes-Benz Espana, S.A. Alcobendas, Spain 99.96 402 60
Mercedes-Benz Finance China Ltd. Hong Kong, PR China 100.00 – –
Mercedes-Benz Finance Co., Ltd. Tokyo, Japan 90.00 144 18
Mercedes-Benz Financial Services Australia Pty. Ltd. Melbourne, Australia 100.00 134 28 11
Mercedes-Benz Financial Services Austria GmbH Salzburg, Austria 100.00 – –
Mercedes-Benz Financial Services BeLux NV Brussels, Belgium 100.00 – –
Mercedes-Benz Financial Services Canada Corporation Mississauga, Canada 100.00 184 63 11
Mercedes-Benz Financial Services Ceská republika s.r.o. Prague, Czech Republic 100.00 64 13
Mercedes-Benz Financial Services España, E.F.C., S.A. Alcobendas, Spain 100.00 – –
Mercedes-Benz Financial Services France S.A. Montigny-le-Bretonneux, France 100.00 234 15
Mercedes-Benz Financial Services Hellas Vehicle Sales and Rental SA
Kifissia, Greece 100.00 – –
Mercedes-Benz Financial Services Hong Kong Ltd. Hong Kong, PR China 80.00 – –
Mercedes-Benz Financial Services Italia SpA Rome, Italy 100.00 – –
Mercedes-Benz Financial Services Korea Ltd. Seoul, South Korea 80.00 107 13 10
Mercedes-Benz Financial Services Nederland B.V. Utrecht, Netherlands 100.00 72 21 11
Mercedes-Benz Financial Services New Zealand Ltd Auckland, New Zealand 100.00 – –
Mercedes-Benz Financial Services Portugal – Instituição Financeira de Crédito S.A.
Mem Martins, Portugal 100.00 – –
Mercedes-Benz Financial Services Rus OOO Moscow, Russian Federation 100.00 – –
Mercedes-Benz Financial Services Schweiz AG Schlieren, Switzerland 100.00 72 14
Mercedes-Benz Financial Services Singapore Ltd. Singapore, Singapore 85.00 – –
Mercedes-Benz Financial Services Slovakia s.r.o. Bratislava, Slovakia 75.00 – –
Mercedes-Benz Financial Services South Africa (Pty) Ltd Centurion, Republic of South Africa 100.00 119 18
Mercedes-Benz Financial Services Taiwan Ltd. Taipei, Taiwan 100.00 – –
Mercedes-Benz Financial Services UK Limited Milton Keynes, United Kingdom 100.00 405 97 10
Mercedes-Benz Financial Services USA LLC Farmington Hills, USA 100.00 1,781 349 11
Mercedes-Benz Finans Danmark A/S Copenhagen, Denmark 100.00 – –
Mercedes-Benz Finans Sverige AB Malmö, Sweden 100.00 – –
Mercedes-Benz Finansal Kiralama Türk A.S. Istanbul, Turkey 100.00 – –
Mercedes-Benz Finansman Türk A.S. Istanbul, Turkey 100.00 167 51
Mercedes-Benz Försäljnings AB Malmö, Sweden 100.00 – –
Mercedes-Benz France S.A.S. Montigny le Bretonneux, France 100.00 320 29
Mercedes-Benz Gent N.V. Gent, Belgium 100.00 – –
Mercedes-Benz Grand Prix Ltd. Brackley, United Kingdom 60.00 -112 -99
Mercedes-Benz Hellas S.A. Kifissia, Greece 100.00 – –
Mercedes-Benz Hong Kong Limited Hong Kong, PR China 100.00 61 26
Name of the Company Domicile, Country Capital share in %1
Equity in millions
of €
Net income (loss) in
millions of €
Footnote

277
E | Consolidated Financial Statements | Notes to the Consolidated Financial Statements
Mercedes-Benz India Private Limited Pune, India 100.00 123 24 12
Mercedes-Benz Insurance Broker SRL Bucharest, Romania 100.00 – –
Mercedes-Benz Insurance Services Nederland B.V. Utrecht, Netherlands 100.00 – –
Mercedes-Benz Insurance Services Taiwan Ltd. Taipei, Taiwan 100.00 – –
Mercedes-Benz Italia S.p.A. Rome, Italy 100.00 189 40
Mercedes-Benz Japan Co., Ltd. Tokyo, Japan 100.00 341 33 10
Mercedes-Benz Korea Limited Seoul, South Korea 51.00 146 73
Mercedes-Benz Leasing (Thailand) Co., Ltd. Bangkok, Thailand 100.00 – –
Mercedes-Benz Leasing Co., Ltd. Beijing, PR China 100.00 16 -12
Mercedes-Benz Leasing do Brasil Arrendamento Mercantil S.A.
Barueri, Brazil 100.00 – –
Mercedes-Benz Leasing GmbH Stuttgart, Germany 100.00 36 - 7, 8, 10
Mercedes-Benz Leasing Hrvatska d.o.o. Zagreb, Croatia 100.00 – –
Mercedes-Benz Leasing IFN S.A. Bucharest, Romania 100.00 – –
Mercedes-Benz Leasing Kft. Budapest, Hungary 100.00 – –
Mercedes-Benz Leasing Polska Sp. z o.o. Warsaw, Poland 100.00 – –
Mercedes-Benz Leasing Taiwan Ltd. Taipei, Taiwan 100.00 – –
Mercedes-Benz Leasing Treuhand GmbH Stuttgart, Germany 100.00 – – 7, 8
Mercedes-Benz Ludwigsfelde GmbH Ludwigsfelde, Germany 100.00 14 – 7, 8
Mercedes-Benz Luxembourg S.A. Luxembourg, Luxembourg 90.00 – –
Mercedes-Benz Lyon S.A.S. Lyon, France 100.00 – –
Mercedes-Benz Malaysia Sdn. Bhd. Kuala Lumpur, Malaysia 51.00 32 43
Mercedes-Benz Manhattan, Inc. New York, USA 100.00 – –
Mercedes-Benz Manufacturing (Thailand) Limited Bangkok, Thailand 100.00 – –
Mercedes-Benz Manufacturing Hungary Kft. Kecskemét, Hungary 100.00 229 64 11
Mercedes-Benz Master Owner Trust Wilmington, USA 0.00 – – 4
Mercedes-Benz Mexico, S. de R.L. de C.V. Mexico City, Mexico 100.00 15 12
Mercedes-Benz Milano S.p.A. Milan, Italy 100.00 – –
Mercedes-Benz Minibus GmbH Dortmund, Germany 100.00 – – 7, 8
Mercedes-Benz Mitarbeiter-Fahrzeuge Leasing GmbH Stuttgart, Germany 100.00 – – 7, 8
Mercedes-Benz Molsheim S.A.S. Molsheim, France 100.00 – –
Mercedes-Benz Nederland B.V. Utrecht, Netherlands 100.00 179 11 10
Mercedes-Benz New Zealand Ltd Auckland, New Zealand 100.00 34 11
Mercedes-Benz Ninove N.V. Ninove, Belgium 100.00 – –
Mercedes-Benz Paris SAS Le Port-Marly, France 100.00 – –
Mercedes-Benz Polska Sp. z.o.o Warsaw, Poland 100.00 51 17
Mercedes-Benz Portugal, S.A. Mem Martins, Portugal 100.00 88 19
Mercedes-Benz Renting, S.A. Alcobendas, Spain 100.00 – –
Mercedes-Benz Research & Development North America, Inc. Sunnyvale, USA 100.00 – –
Mercedes-Benz Retail Group UK Limited Milton Keynes, United Kingdom 100.00 98 22
Mercedes-Benz Retail, S.A. Madrid, Spain 100.00 – –
Mercedes-Benz Risk Solutions South Africa (Pty.) Ltd. Centurion, Republic of South Africa 100.00 – –
Mercedes-Benz Roma S.p.A. Rome, Italy 100.00 – –
Mercedes-Benz Romania S.R.L. Bucharest, Romania 100.00 – –
Mercedes-Benz Russia SAO Moscow, Russian Federation 100.00 169 21 10
Mercedes-Benz Schweiz AG Schlieren, Switzerland 100.00 157 62
Mercedes-Benz Service Leasing SRL Bucharest, Romania 100.00 – –
Mercedes-Benz Services Correduria de Seguros, S.A. Alcobendas, Spain 100.00 – –
Mercedes-Benz Services Malaysia Sdn Bhd Petaling Jaya, Malaysia 100.00 – –
Mercedes-Benz Servizi Assicurativi Italia S.p.A. Rome, Italy 100.00 – –
Mercedes-Benz Sigorta Aracilik Hizmetleri A.S. Istanbul, Turkey 100.00 – –
Mercedes-Benz Sosnowiec Sp. z o.o. Sosnowiec, Poland 100.00 – –
Mercedes-Benz South Africa Ltd Pretoria, Republic of South Africa 100.00 652 38
Mercedes-Benz Sverige AB Malmö, Sweden 100.00 39 10
Mercedes-Benz Taiwan Ltd. Taipei, Taiwan 51.00 118 61
Mercedes-Benz Technical Center Nederland B.V. Nijkerk, Netherlands 100.00 – –
Mercedes-Benz Türk A.S. Istanbul, Turkey 66.91 930 244 11
Mercedes-Benz U.S. International, Inc. Vance, USA 100.00 163 38 11
Mercedes-Benz Ubezpieczenia Sp. z o.o. Warsaw, Poland 100.00 – –
Mercedes-Benz UK Limited Milton Keynes, United Kingdom 100.00 213 -20
Mercedes-Benz USA, LLC Montvale, USA 100.00 236 196 11
Name of the Company Domicile, Country Capital share in %1
Equity in millions
of €
Net income (loss) in
millions of €
Footnote

278
Mercedes-Benz V.I. Lille SAS Vendeville, France 100.00 – –
Mercedes-Benz V.I. Lyon SAS Genas, France 100.00 – –
Mercedes-Benz V.I. Paris Ile de France SAS Herblay, France 100.00 – –
Mercedes-Benz V.I. Toulouse SAS Fenouillet, France 100.00 – –
Mercedes-Benz Vietnam Ltd. Ho Chi Minh City, Vietnam 70.00 42 12
Mercedes-Benz Warszawa Sp. z o.o. Warsaw, Poland 100.00 – –
Mercedes-Benz Waterloo S.A. Waterloo, Belgium 100.00 – –
Mercedes-Benz Wavre S.A. Wavre, Belgium 100.00 – –
Mercedes-Benz Wemmel N.V. Wemmel, Belgium 100.00 – –
Mercedes-Benz Wholesale Receivables LLC Farmington Hills, USA 100.00 – –
MFTA Canada, Inc. Toronto, Canada 100.00 – –
Mitsubishi Fuso Truck and Bus Corporation Kawasaki, Japan 89.29 614 218 10
Mitsubishi Fuso Truck of America, Inc. Logan Township, USA 100.00 – –
MITSUBISHI TRUCKS EUROPE – Sociedade Europeia de Automóveis, S.A.
Tramagal, Portugal 100.00 – –
moovel GmbH Leinfelden-Echterdingen, Germany 100.00 12 – 7, 8
Multistate LIHTC Holdings III Limited Partnership Farmington Hills, USA 100.00 – –
MVSA COMPANY, INC. Jacksonville, USA 100.00 – –
myTaxi Iberia SL Barcelona, Spain 100.00 – –
N.V. Mercedes-Benz Aalst Erembodegem, Belgium 100.00 – –
N.V. Mercedes-Benz Mechelen Mechelen, Belgium 100.00 – –
NuCellSys GmbH Kirchheim unter Teck, Germany 100.00 – –
ogotrac S.A.S. Paris, France 100.00 – –
Outer Drive Holdings LLC Detroit, USA 100.00 – –
P.T. Mercedes-Benz Distribution Indonesia Jakarta, Indonesia 100.00 – –
P.T. Mercedes-Benz Indonesia Bogor, Indonesia 100.00 – –
P.T. Star Engines Indonesia Bogor, Indonesia 100.00 – –
Renting del Pacífico S.A.C. Lima, Peru 100.00 – –
RideScout LLC Austin, USA 100.00 – –
Sandown Motor Holdings (Pty) Ltd Bryanston, Republic of South Africa 62.62 – –
SelecTrucks of America LLC Portland, USA 100.00 – –
SelecTrucks of Toronto, Inc. Mississauga, Canada 100.00 – –
Setra of North America, Inc. Oriskany, USA 100.00 – –
Silver Arrow S.A. Luxembourg, Luxembourg 0.00 – – 4
smart France S.A.S. Hambach, France 100.00 53 30 11
smart Vertriebs gmbh Berlin, Germany 100.00 – – 7, 8
Starexport Trading S.A. São Bernardo do Campo, Brazil 100.00 301 3
Sterling Truck Corporation Portland, USA 100.00 -538 -2 11
Suffolk Leasing, Inc. Farmington Hills, USA 100.00 – –
Sumperská správa majetku k.s. Prague, Czech Republic 100.00 – –
Taunus-Auto-Verkaufs GmbH Wiesbaden, Germany 100.00 – – 7, 8
Thomas Built Buses of Canada Limited Woodstock, Canada 100.00 – –
Thomas Built Buses, Inc. High Point, USA 100.00 63 29 11
Tróia Empreendimentos Imobiliários Ltda São Paulo, Brazil 100.00 – –
Trona Cogeneration Corporation Farmington Hills, USA 100.00 – –
Western Star Trucks Sales, Inc Portland, USA 100.00 – –
3218095 Nova Scotia Company Halifax, Canada 100.00 – –
6353 Sunset Boulevard, Inc. Hollywood, USA 100.00 – –
II. Unconsolidated subsidiaries2
AEG do Brasil Produtos Eletricos e Eletronicos Ltda. São Paulo, Brazil 100.00 – –
AEG Olympia Office GmbH Stuttgart, Germany 100.00 – – 8
Anota Fahrzeug Service- und Vertriebsgesellschaft mbH Berlin, Germany 100.00 – – 8
AutomotiveTraining & Consulting GmbH Stuttgart, Germany 100.00 – – 8
Brefa Bremsen- und Fahrzeugdienst AG (in Liquidation) Niederzier, Germany 100.00 – – 6
Cúspide GmbH Stuttgart, Germany 100.00 – –
Daimler AG & Co. Anlagenverwaltung OHG Ludwigsfelde, Germany 100.00 – – 9
Daimler Culture Development Co., Ltd. Beijing, PR China 50.00 – – 4
Daimler Financial Services UK Trustees Ltd. Milton Keynes, United Kingdom 100.00 – –
Daimler FleetBoard UK Ltd. Tamworth, United Kingdom 100.00 – –
Daimler Group Services Berlin GmbH Berlin, Germany 100.00 – – 8
Name of the Company Domicile, Country Capital share in %1
Equity in millions
of €
Net income (loss) in
millions of €
Footnote

279
E | Consolidated Financial Statements | Notes to the Consolidated Financial Statements
Daimler Group Services Madrid, S.A. San Sebastián de los Reyes, Spain 100.00 – –
Daimler Group Services Philippines, Inc. Cebu City, Philippines 99.99 – –
Daimler Grund Services GmbH Schönefeld, Germany 100.00 – – 7, 8
Daimler International Assignment Services USA, LLC Farmington Hills, USA 100.00 – –
Daimler IT Retail GmbH Böblingen, Germany 100.00 – – 8
Daimler Middle East & Levant FZE Dubai, United Arab Emirates 100.00 – –
Daimler Mitarbeiter Wohnfinanz GmbH Stuttgart, Germany 100.00 – – 8
Daimler Protics GmbH Stuttgart, Germany 100.00 – – 8
Daimler Purchasing Coordination Corp. Farmington Hills, USA 100.00 – –
Daimler Starmark A/S Horsholm, Denmark 100.00 – –
Daimler TSS GmbH Ulm, Germany 100.00 – – 8
Daimler UK Share Trustee Ltd. Milton Keynes, United Kingdom 100.00 – –
Daimler UK Trustees Limited Milton Keynes, United Kingdom 100.00 – –
Daimler Unterstützungskasse GmbH Stuttgart, Germany 100.00 1,181 -61 5, 14
Deméter Empreendimentos Imobiliários Ltda. São Paulo, Brazil 100.00 – –
Deutsche Accumotive Verwaltungs-GmbH Kirchheim unter Teck, Germany 100.00 – –
EvoBus Reunion S. A. Le Port, France 94.33 – –
EvoBus Russland OOO Moscow, Russian Federation 100.00 – –
Fünfte Vermögensverwaltungsgesellschaft Zeus mbH Stuttgart, Germany 100.00 – –
Gemini-Tur Excursoes Passagens e Turismo Ltda. São Paulo, Brazil 100.00 – –
Grundstücksverwaltungsgesellschaft Taunus-Auto-Verkaufs-GmbH & Co. OHG
Schönefeld, Germany 100.00 – – 9
Lapland Car Test Aktiebolag Arvidsjaur, Sweden 100.00 – –
Legend Investments Ltd. Milton Keynes, United Kingdom 100.00 – –
MB GTC GmbH Mercedes-Benz Gebrauchtteile Center Neuhausen auf den Fildern, Germany 100.00 – – 8
MB Relationship Marketing S.r.l. Milan, Italy 100.00 – –
Mercedes-Benz Adm. Consorcios Ltda. São Bernardo do Campo, Brazil 100.00 – –
Mercedes-Benz Customer Assistance Center Maastricht N.V. Maastricht, Netherlands 100.00 – –
Mercedes-Benz Egypt S.A.E. Cairo, Egypt 100.00 – –
Mercedes-Benz G GmbH Raaba, Austria 100.00 – –
Mercedes-Benz GastroService GmbH Gaggenau, Germany 100.00 – – 8
Mercedes-Benz Hungária Kft. Budapest, Hungary 100.00 – –
Mercedes-Benz Museum GmbH Stuttgart, Germany 100.00 – – 8
Mercedes-Benz Österreich GmbH Salzburg, Austria 100.00 – –
Mercedes-Benz Project Consult GmbH Stuttgart, Germany 100.00 – – 8
Mercedes-Benz Research and Development India Private Limited
Bangalore, India 100.00 24 10
Mercedes-Benz Slovakia s.r.o. Bratislava, Slovakia 51.00 – –
Mercedes-Benz Solihull Ltd. Milton Keynes, United Kingdom 100.00 – –
Mercedes-Benz Srbija i Crna Gora d.o.o. Belgrade, Serbia 100.00 – –
Mercedes-Benz Venezuela S.A. Valencia, Venezuela 100.00 – –
Mercedes-Benz Vertrieb PKW GmbH Stuttgart, Germany 100.00 – –
Mercedes-Benz Vertriebsgesellschaft mbH Berlin, Germany 100.00 – – 8
MercedesService Card Beteiligungsgesellschaft mbH Kleinostheim, Germany 51.00 – –
MercedesService Card GmbH & Co. KG Kleinostheim, Germany 51.00 – –
Mitsubishi Fuso Bus Manufacturing Co., Ltd. Toyama, Japan 100.00 – –
Monarch Cars (Tamworth) Ltd. Milton Keynes, United Kingdom 100.00 – –
Montajes y Estampaciones Metálicas, S.L. Esparraguera, Spain 51.00 – –
MORA Grundstücks-Verwaltungsgesellschaft mbH & Co. KG Grünwald, Germany 100.00 – – 4
MYTAXI POLSKA SPÓLKA Z OGRANICZONA ODPOWIEDZIALNOSCIA
Warsaw, Poland 100.00 – –
myTaxi Swiss GmbH Zurich, Switzerland 100.00 – –
myTaxi UG Hamburg, Germany 100.00 – –
myTaxi UK Ltd. London, United Kingdom 100.00 – –
myTaxi USA Inc. Washington D.C., USA 100.00 – –
NAG Nationale Automobil-Gesellschaft Aktiengesellschaft Stuttgart, Germany 100.00 – –
PABCO Co., Ltd. Ebina, Japan 100.00 – –
Porcher & Meffert Grundstücksgesellschaft mbH & Co. Stuttgart OHG
Schönefeld, Germany 100.00 – –
R.T.C. Management Company Limited Bicester, United Kingdom 88.89 – –
Ring Garage AG Chur Chur, Switzerland 100.00 – –
Name of the Company Domicile, Country Capital share in %1
Equity in millions
of €
Net income (loss) in
millions of €
Footnote
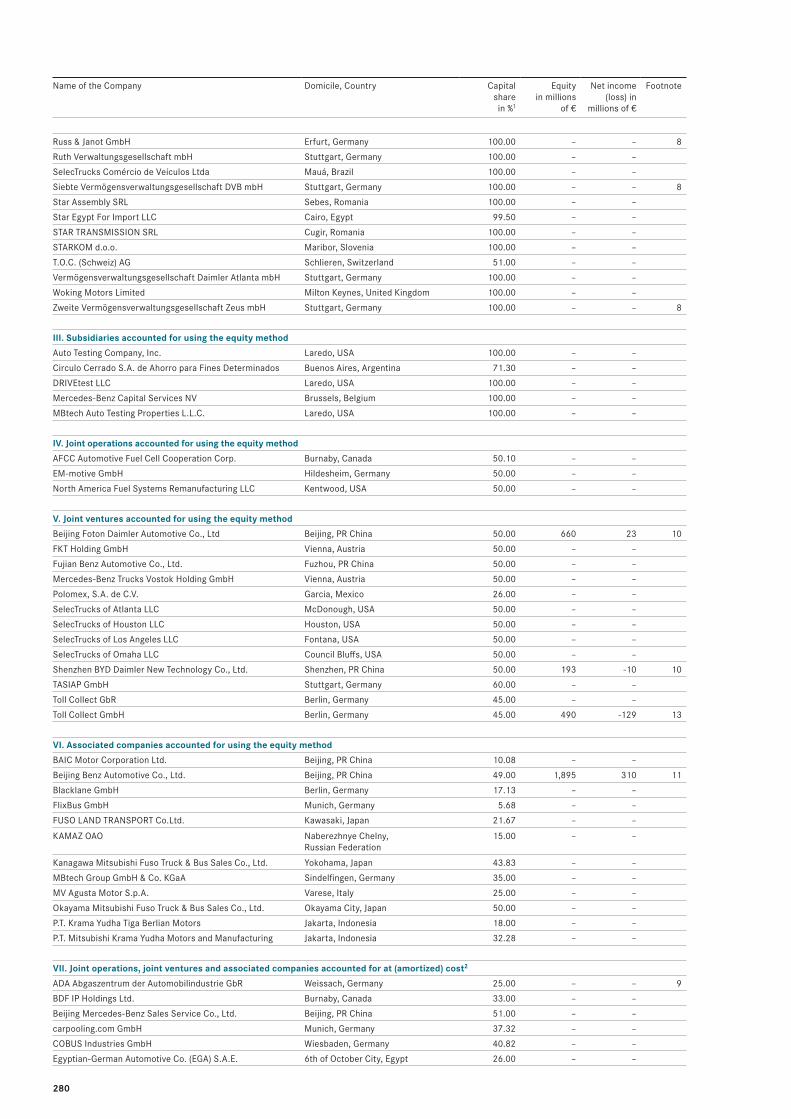
280
Russ & Janot GmbH Erfurt, Germany 100.00 – – 8
Ruth Verwaltungsgesellschaft mbH Stuttgart, Germany 100.00 – –
SelecTrucks Comércio de Veículos Ltda Mauá, Brazil 100.00 – –
Siebte Vermögensverwaltungsgesellschaft DVB mbH Stuttgart, Germany 100.00 – – 8
Star Assembly SRL Sebes, Romania 100.00 – –
Star Egypt For Import LLC Cairo, Egypt 99.50 – –
STAR TRANSMISSION SRL Cugir, Romania 100.00 – –
STARKOM d.o.o. Maribor, Slovenia 100.00 – –
T.O.C. (Schweiz) AG Schlieren, Switzerland 51.00 – –
Vermögensverwaltungsgesellschaft Daimler Atlanta mbH Stuttgart, Germany 100.00 – –
Woking Motors Limited Milton Keynes, United Kingdom 100.00 – –
Zweite Vermögensverwaltungsgesellschaft Zeus mbH Stuttgart, Germany 100.00 – – 8
III. Subsidiaries accounted for using the equity method
Auto Testing Company, Inc. Laredo, USA 100.00 – –
Circulo Cerrado S.A. de Ahorro para Fines Determinados Buenos Aires, Argentina 71.30 – –
DRIVEtest LLC Laredo, USA 100.00 – –
Mercedes-Benz Capital Services NV Brussels, Belgium 100.00 – –
MBtech Auto Testing Properties L.L.C. Laredo, USA 100.00 – –
IV. Joint operations accounted for using the equity method
AFCC Automotive Fuel Cell Cooperation Corp. Burnaby, Canada 50.10 – –
EM-motive GmbH Hildesheim, Germany 50.00 – –
North America Fuel Systems Remanufacturing LLC Kentwood, USA 50.00 – –
V. Joint ventures accounted for using the equity method
Beijing Foton Daimler Automotive Co., Ltd Beijing, PR China 50.00 660 23 10
FKT Holding GmbH Vienna, Austria 50.00 – –
Fujian Benz Automotive Co., Ltd. Fuzhou, PR China 50.00 – –
Mercedes-Benz Trucks Vostok Holding GmbH Vienna, Austria 50.00 – –
Polomex, S.A. de C.V. Garcia, Mexico 26.00 – –
SelecTrucks of Atlanta LLC McDonough, USA 50.00 – –
SelecTrucks of Houston LLC Houston, USA 50.00 – –
SelecTrucks of Los Angeles LLC Fontana, USA 50.00 – –
SelecTrucks of Omaha LLC Council Bluffs, USA 50.00 – –
Shenzhen BYD Daimler New Technology Co., Ltd. Shenzhen, PR China 50.00 193 -10 10
TASIAP GmbH Stuttgart, Germany 60.00 – –
Toll Collect GbR Berlin, Germany 45.00 – –
Toll Collect GmbH Berlin, Germany 45.00 490 -129 13
VI. Associated companies accounted for using the equity method
BAIC Motor Corporation Ltd. Beijing, PR China 10.08 – –
Beijing Benz Automotive Co., Ltd. Beijing, PR China 49.00 1,895 310 11
Blacklane GmbH Berlin, Germany 17.13 – –
FlixBus GmbH Munich, Germany 5.68 – –
FUSO LAND TRANSPORT Co.Ltd. Kawasaki, Japan 21.67 – –
KAMAZ OAO Naberezhnye Chelny, Russian Federation
15.00 – –
Kanagawa Mitsubishi Fuso Truck & Bus Sales Co., Ltd. Yokohama, Japan 43.83 – –
MBtech Group GmbH & Co. KGaA Sindelfingen, Germany 35.00 – –
MV Agusta Motor S.p.A. Varese, Italy 25.00 – –
Okayama Mitsubishi Fuso Truck & Bus Sales Co., Ltd. Okayama City, Japan 50.00 – –
P.T. Krama Yudha Tiga Berlian Motors Jakarta, Indonesia 18.00 – –
P.T. Mitsubishi Krama Yudha Motors and Manufacturing Jakarta, Indonesia 32.28 – –
VII. Joint operations, joint ventures and associated companies accounted for at (amortized) cost2
ADA Abgaszentrum der Automobilindustrie GbR Weissach, Germany 25.00 – – 9
BDF IP Holdings Ltd. Burnaby, Canada 33.00 – –
Beijing Mercedes-Benz Sales Service Co., Ltd. Beijing, PR China 51.00 – –
carpooling.com GmbH Munich, Germany 37.32 – –
COBUS Industries GmbH Wiesbaden, Germany 40.82 – –
Egyptian-German Automotive Co. (EGA) S.A.E. 6th of October City, Egypt 26.00 – –
Name of the Company Domicile, Country Capital share in %1
Equity in millions
of €
Net income (loss) in
millions of €
Footnote

281
E | Consolidated Financial Statements | Notes to the Consolidated Financial Statements
Esslinger Wohnungsbau GmbH Esslingen am Neckar, Germany 26.57 – –
European Center for Information and Communication Technologies – EICT GmbH
Berlin, Germany 20.00 – –
EvoBus Hungária Kereskedelmi Kft. Budapest, Hungary 33.33 – –
Gottapark, Inc. San Francisco, USA 18.15 – –
Grundstücksgesellschaft Schlossplatz 1 mbH & Co. KG Berlin, Germany 18.37 – –
INPRO Innovationsgesellschaft für fortgeschrittene Produktionssysteme in der Fahrzeugindustrie mbH
Berlin, Germany 20.00 – –
Institut für angewandte Systemtechnik Bremen GmbH Bremen, Germany 26.25 – –
Juffali Industrial Products Company Jeddah, Saudi Arabia 0.00 – – 3
Lackzentrum Bielefeld GmbH Bielefeld, Germany 33.33 – –
Laureus World Sports Awards Limited London, United Kingdom 50.00 – –
MBtech Verwaltungs-GmbH Sindelfingen, Germany 35.00 – –
Mercedes-Benz Buses Central Asia GmbH Stuttgart, Germany 50.00 – –
Mercedes-Benz Lackzentrum Dresden GmbH Dresden, Germany 36.00 – –
Mercedes-Benz Starmark I/S Vejle, Denmark 50.00 – –
MFTB Taiwan Co., Ltd. Taipei, Taiwan 33.40 – –
Motor Coach Holdings, LP New York, USA 10.00 – –
National Automobile Industry Company Ltd. Jeddah, Saudi Arabia 26.00 – –
Omuta Unso Co., Ltd. Omuta, Japan 33.51 – –
PDB - Partnership for Dummy Technology and Biomechanics GbR
Ingolstadt, Germany 20.00 – – 9
Reva SAS Cunac, France 34.00 – –
smart-BRABUS GmbH Bottrop, Germany 50.00 – –
STARCAM s.r.o. Most, Czech Republic 51.00 – –
tiramizoo GmbH Munich, Germany 13.86 – –
Toyo Kotsu Co., Ltd. Sannoseki, Japan 28.20 – –
01 Share pursuant to Section 16 of the German Stock Corporation Act (AktG)02 As the impact of these companies is not material for the consolidated financial statements,
they are not consolidated and not accounted for using the equity method.03 Joint control due to economic circumstances04 Control due to economic circumstances05 Control of the investment of the assets. No consolidation of the assets due to the contractual situation06 In liquidation07 Qualification for Section 264 Subsection 3 and Section 264b of the German Commercial Code (HGB)08 Profit and loss transfer agreement with Daimler AG (direct or indirect)09 Daimler AG is unlimited partner10 Financial statements 201311 Financial Statements according to IFRS12 Financial statements April 1, 2013 - March 31, 201413 Financial statements September 1, 2013 - August 31, 201414 Financial statements November 1, 2012 - October 31, 2013
Name of the Company Domicile, Country Capital share in %1
Equity in millions
of €
Net income (loss) in
millions of €
Footnote