Embed Size (px)
Citation preview

CENTRAL ALBERTA WELL SERVICES CORP. 2008 ANNUAL REPORT
E COMPREHENSIVE UNITED COLLABORATIVE INTEGRATED OPPORTUNITY SER

02 // OPERATIONS OVERVIEW
04 // MESSAGE FROM THE PRESIDENT
07 // ABOUT THE COMPANY
08 // OPERATIONS
13 // MANAGEMENT’S DISCUSSION AND ANALYSIS
25 // MANAGEMENT’S REPORT
25 // AUDITORS’ REPORT TO THE SHAREHOLDERS
26 // FINANCIAL STATEMENTS
29 // NOTES TO THE FINANCIAL STATEMENTS
Contents
Certain statements contained in this annual report, including statements which may contain such words as “could”, “should”, “believe”, “expect”, “will”, and similar expressions and statements relating to matters that are not historical facts are forward-looking statements including, but not limited to, statements as to: future capital expenditures, including the amount and nature thereof; business strategy; expansion and growth of the Company’s business and operations; and other matters.
Management has made certain assumptions and analyses which reflect their experiences and knowledge in the industry. These assumptions and analyses are believed to be accurate and truthful at the time, but the company can not assure readers that actual results will be consistent with these forward looking statements. However, whether actual results, performance, or achievements will conform to the Company’s expectations and predictions is subject to known and unknown risks and uncertainties which could cause actual results to differ materially from the Company’s expectations.
All forward-looking statements made in the annual report are qualified by these cautionary statements and there can be no assurance that the actual results or developments anticipated by the Company will be realized or, even if substantially realized that they will have the expected outcomes to or effects on the Company or its business operations. The Company does not intend, and does not assume any obligation, to update these forward-looking statements. Any forward-looking statements made previously may be inaccurate now.

1
CWC 2008 – INTEGRATE
1. TO FORM INTO ONE WHOLE; TO MAKE ENTIRE; TO COMPLETE; TO RENEW; TO RESTORE; TO PERFECT.
INTEGRATE

2
CWC 2008 – OPERAT IONS OVERV IEW
02
06
INTEGRATING BIG PICTURE THINKING
Oil and gas producers that can maximize efficiencies will be better positioned to succeed in the current economic climate. This is where CWC’s ability to provide up to 80% of the well site completion and work-over requirements of producers makes us an attractive choice.
Increasingly, the Company has been moving away from a compartmentalized approach where various divisions work as separate entities. This has been essential to a strategy of integration, as employees are being cross-trained to work seamlessly across multiple service areas.

01
04
03
05
CWC 2008 – OPERAT IONS OVERV IEW
01 / / WELL SERVICINGCWC provides service rig solutions tailored to the challenges and demands facing producers in our diverse service areas. Our well services include: completions, work-overs and remedial recovery production, along with maintenance, heavy oil, critical sour, horizontal and re-entry drilling
02 / / SNUBBING AND STRIPPING These services enable wells to perform
more efficiently in fluid-sensitive formations, under-pressured reservoirs, naturally-fractured reservoirs and low-permeability sandstone reservoirs. Production can continue during servicework, increasing well production rates and recoverable reserves, while reducing drilling and completion costs.
03 / / COIL TUBING CWC provides coil tubing services for work-over operations, shallow drill-outs and extensions into producing zones. Thisspeeds up the process of getting in and out of a well, and allows well maintenance during production. CWC’s coil tubing units mainly operate in the CBM fields and have a depth rating of up to 3,200 metres.
04 / / NITROGEN PUMPING CWC’s heat recovery nitrogen systems are employed in many of the services we offer. As a non-corrosive and non-explosive inert gas, nitrogen is safer than air and is ideal for purging pipelines, pressure testing vessels and facilitating the withdrawal of stored liquids from vessels.
05 / / WELL TESTINGCWC’s well testing and pressure control systems are used throughout completion and work-over programs. They are an essential component of the operations CWC performs.
06 / / EQUIPMENT RENTALS CWC rents a full range of specialized oilfield equipment, including: well site trailers, portable light towers, boilers, rig matting and tubing racks.
3

4
CWC 2008 – MESSAGE FROM THE PRES IDENT
Message from the President
TO BE SUCCESSFUL, IT IS IMPORTANT TO POSITION ONESELF TO BE COMPETITIVE IN BOTH TIMES OF PROSPERITY AND MOMENTS OF ADVERSITY.

5
CWC 2008 – MESSAGE FROM THE PRES IDENT
By now, we are all acutely aware that 2008 was a year of extreme fluctuation and uncertainty within the oil patch.
Oil & Gas producers were hit by dramatically declining commodity prices and increased royalty payments. As they have retrenched, service companies have felt the impact on our own businesses.
In 2008, Central Alberta Well Services Corp. (CWC) managed to persevere in a time of downward market trends. In fact, we saw increased utilization of our services by customers and witnessed significant growth in revenues.
I believe credit must be shared among the employees, management team, directors and shareholders. Allof whom have demonstrated unwavering dedication and perseverance in sticking to a long-term vision of steady growth. By wisely investing in people, technology, equipment and new markets, CWC has established a reputation as one of the industry’s most dependable, professional and versatile providers of essential well site services.
This has allowed us to pursue our goal of moving beyond merely providing well site services on an individual basis – to offering clients greater value and efficiencies through a comprehensive package of integrated services. It is an approach we are confident will put us in a better position than many of our competitors as customers increasingly seek solutions to streamline operating costs in these challenging times.
Integrated service? We prefer to think of it as “Integrated Opportunity”.
INTEGRATING CONTINUITY
CWC began the year where we left off in 2007: with a strong operational focus.
We continued to grow through acquisition. The agreement to acquire all of the assets and business operations of a southern Alberta service rig division was finalized, allowing CWC to enter the Brooks market and to further increase our service capacity.
At the end of second quarter, the Company acquired the assets of another service rig division from a Calgary-based drilling company. In the third quarter, we initiated a board-approved “build program” to increase our fleet size in time for 2009.
Throughout the year we continued to expand our fleet, increasing our fleet size by an impressive 71%.
INTEGRATING GROWTH AND STABILITY
Despite a declining demand for well site services in the industry as a whole, CWC’s revenues increased by 60% (as a year-over-year comparison).
The financial performance largely resulted from the expansion of CWC’s core service rig division and through targeted cross-selling initiatives. The Company’s full-service clientele doubled over the previous year, as a growing chorus of customers took advantage of CWC’s ability to reduce collective costs in production, safety and site management.
Fiscal responsibility is important in our current economic situation, especially at a time when access to capital is an issue facing the entire industry. In 2008, we carefully examined cost control measures – making sure we did not negatively impact the quality of our people and our product in the process.
As an example, CWC has decided to complete our previously approved build program. However, due to the downturn in the industry, we have rescheduled the delivery for two 5,000 metre skid doubles until the fourth quarter of 2009. Implementation will be staged so the new equipment comes online once demand increases.

6
CWC 2008 – MESSAGE FROM THE PRES IDENT
INTEGRATING PEOPLE
While other companies downsized in 2008, CWC expanded our employee base in an ongoing effort to develop the best team in the business. This growth occurred not only at the operations level, but also at head office, where we added senior marketing expertise to help us actively promote our integrated service offering.
An extensive effort was made to cross-train operational employees. This will allow more of our team to work seamlessly across traditional company divisions – so one crew can offer a multitude of services to customers at any given well site.
Increasingly, as we adopt this integrated business approach, the lines are being blurred between traditional company divisions (well servicing, snubbing and stripping, coil tubing, nitrogen pumping, well testing and equipment rentals). We believe this will help make us more efficient ourselves.
INTEGRATING RESPONSIBILITY
Ensuring the safety of our employees and the public remains our top priority at CWC. It is a commitment shared by every employee and director. In 2008, our veteran Safety Management Support Team continuedto introduce new policies, procedures and training programs to promote workplace safety and employee wellness. Our goal is to ensure that everyone makes it safely to and from their job each and every day.
INTEGRATING THE FUTURE
Undoubtedly, 2009 will be another tumultuous year for the industry, yet we’re confident that our strategy of integrated service is being well received by our clients. We will continue to aggressively move forward in this direction.
I, the management team and our directors all firmly believe that CWC is well positioned to maintain utilization levels above the industry average – even as the service sector continues to see potential consolidation, volatile commodity pricing and a competitive industry outlook over the coming year.
We are proud of the results we’ve achieved, the team we’ve built and the growth we’ve enjoyed. Our progress is truly driven by an employee base that is second to none. We are guided by a forward-thinking management team with the technical experience, vision and strategic ability to weather the economic downturn.
At CWC, we all look forward to a challenge... because we see a challenge as an opportunity. In our case, it is an Integrated Opportunity.
Respectively Submitted
Darryl WilsonPresident and Chief Executive Officer
7
CWC 2008 – ABOUT THE COMPANY
IN A FEW SHORT YEARS, CENTRAL ALBERTAWELL SERVICES CORP. (CWC) HAS EMERGED
AS ONE OF THE PRE-EMINENT WELL SITE SERVICE COMPANIES OPERATING IN THE
WESTERN CANADIAN SEDIMENTARY BASIN.
Today, CWC services the entire province of Alberta as well as areas of northeastern British Columbiaand western Saskatchewan. We work out of four operation centres spread throughout Alberta (Red Deer, Provost, Brooks and Whitecourt) with a new facility open in Grande Prairie. Our corporate office is located in Calgary, while operations are coordinated out of the Red Deer office.
On the surface, CWC is a relatively new entity – established as a public company in September of 2005. However, as we all know in the Oil and Gas industry, it is what is below the surface that counts.
CWC is led by a senior management team that has worked alongside one another for more than 25 years. Together, they were largely responsible for growing a small private company into the largest private well servicing company in Canada. Now they are putting this knowledge and experience to work at CWC, with measurable results.
In a few short years, CWC has become a competitive force within the Western Canadian Sedimentary Basin. We have grown via accretive acquisitions and expansion into new territories, but also by adding to the breadth of services we are able to offer clients. At present, CWC is able to provide approximately 80% of the service requirements on a well site. Our goal is to become a one-stop supplier for well site services.
As we’ve grown, CWC has also managed to assemble one of the most professional, dedicated and highly skilled work forces in the business. This remains one of our greatest strengths.
Our service fleet has grown to a level where we are able to meet customer demand throughout our territories. CWC boasts the most state of the art, cost efficient and safety-oriented technologies available. The company operates a fleet of advanced service and completion products with capacities rated from 1,500 to 5,000 metres, each designed with employee safety, customer economics and investor profitability in mind.
CWC will continue to target new business opportunities by paying meticulous attention to customers, staff and equipment – while maintaining focus on bottom line performance for shareholders.
Central Alberta Well Services Corp. trades under the symbol “CWC.A” on the TSX Venture Exchange.
About the Company

8
CWC 2008 – OPERAT IONS
CWC SERVES A LARGE AND DIVERSE GEOGRAPHY. HOWEVER, ALL OFFICES WORKCUSTOMER SERVICE, EXPERTISE, QUALITY AND DEPENDABILITY ARE PROVIDED

9
CWC 2008 – OPERAT IONS
INTEGRATING GEOGRAPHY
Calgary OperationsThis year, CWC’s senior management and growing corporate marketing team moved into a new a 5,000 sq. ft. office. We are still located in downtown Calgary, which is home to most of the nation’s large, midsize and junior oil & gas producers. Our new office allows us to remain in close contact with decision makers as we continue to market our complementary suite of well site services.
Red Deer OperationsOur Red Deer office serves customers throughout central Alberta. It is also the head office for all CWCoperating divisions, providing a number of internal functions including: finance, human resources, health and safety, environmental and technical support. We work out of two leased buildings (40,000 sq. ft. total) and a 20-acre field facility.
Provost OperationsBecause of the high degree of drilling activity on both sides of the Alberta/Saskatchewan border, Provost,Alberta, is strategically situated to serve both markets. Our Provost team serves the eastern portion of the Sedimentary Basin, providing operational support for active rigs operating in the heavy oil fields extending from north of Bonneville, Alberta, throughout the east central portion of the WCSB. CWC operates out of a 24,000 sq. ft. facility on 10-acres of land.
Brooks OperationsCWC entered southeastern Alberta with the acquisition of nine service rigs and established operations in January 2008. Located in Brooks, Alberta, this facility represents our third major service location.
This facility includes 12,750 sq. ft. of leased space situated on 5-acres. The Brooks operation provides a strategic southern location from which CWC can deliver combined services to customers located in and around southeastern Alberta and southwestern Saskatchewan.
Whitecourt OperationsEstablished in 2006, CWC’s Whitecourt, Alberta, operation initially focused on providing nitrogen pumping and delivery services in northern Alberta. This site will be reduced in the future to be a staging area only as the Company is opening a full-service facility in Grande Prairie to further grow our market into northern Alberta and the Peace River Arch and northeastern British Columbia.
Operations
IN CLOSE COLLABORATION TO ENSURE THE SAME IMPECCABLE STANDARDS OF THROUGHOUT ALL OF OUR LOCATIONS.

10
CWC 2008 – OPERAT IONS
INTEGRATING TALENT
The value of experience.CWC’s core management team has been together for over 25 years, so they are quite familiar with market downturns which unfortunately go with the territory in the resource sector.
Their philosophy throughout 2008 has been to view the current economic environment as a time of opportunity.
The ongoing growth strategy of expanding our territory and range of services has proven advantageous as producers are now actively seeking service partners who are able to help them drill for less. Seeing an opportunity to promote our integrated service offering, management has hired senior marketing and sales personnel in our Calgary office (many of whom have worked with our management team in the past). Theirdiligent work is paying off as the number of companies using multiple CWC services is steadily increasing.
People with passion.When it comes to our plans to position ourselves as a one-stop well service provider, CWC employees have taken the ball and run with it. This highly driven group has enthusiastically embraced cross-training and educational initiatives. They have thrived, eagerly welcoming new work challenges and responsibilities.
By empowering our people, management is committed to ensuring we attract and retain the best the industry has to offer. Compensation and benefit programs are structured to be among the best around. Moving forward, CWC remains committed to providing every resource available for employee training in each vocation within the Company.
INTEGRATING NEW TECHNOLOGY
We can talk all we want about an ability to offer a complete range of services and the people to provide them. However, unless our equipment is up to the challenge, the rest is inconsequential.
As a customer-focused company, our goal is to offer our clients problem-free services that improve operating performance and cost efficiency – while minimizing maintenance and replacement costs.
To remain a leading well service provider, CWC is committed to maintaining a tough and dependable service fleet that utilizes progressive technologies. CWC invests a significant amount of time and resources into engineering and designing new components for our service divisions. Not only are we constantly improving equipment performance, durability and efficiency, we are continually incorporating new safeguards to further protect our employees.
That said, management is carefully evaluating all capital decisions to ensure fiscal prudence in light of the current economic situation.
INTEGRATION NOT ONLY APPLIES TO OUR SERVICE OFFERING. IT IS A KEY STRATEGIC TO PUT THE COMPANY IN A GOOD POSITION TO SUCCEED. THERE HAS BEEN INCREDIBLE

11
CWC 2008 – OPERAT IONS
OBJECTIVE FROM A PERSONNEL PERSPECTIVE. CWC’S PEOPLE HAVE ALL PULLED TOGETHERBUY-IN AS THE ENTIRE TEAM IS SEEING THE VALUE OF THIS BIG-PICTURE STRATEGY.

12
CWC 2008 – F INANC IAL INFORMAT ION
Financial Information
13 // MANAGEMENT’S DISCUSSION AND ANALYSIS
25 // MANAGEMENT’S REPORT
25 // AUDITORS’ REPORT TO THE SHAREHOLDERS
26 // FINANCIAL STATEMENTS
29 // NOTES TO THE FINANCIAL STATEMENTS

13
CWC 2008 – MANAGEMENT ’ S D I SCUSS ION AND ANALYS I S
Management’s Discussion and Analysis
The following management’s discussion and analysis (“MD&A”) of Central Alberta Well Services Corp. (“CWC” or the “Company”) contains information concerning the Company’s vision, business strategies, capabilities, comparative financial results and an overview of its outlook for the Company and the industry as at March 16, 2009. The message to shareholders operations review and financial results for the year ended December 31, 2008, together with the accompanying note disclosures, also contain information that supplements this discussion. This MD&A should be read in conjunction with the Company’s audited financial statements as at December 31, 2008 and 2007 and for the years then ended. Additional information on the Company, including the Annual Information Form (“AIF”), can be found on the Company’s website at www.cawsc.com or on SEDAR at www.sedar.com.
This MD&A contains certain forward-looking information and statements, including statements relating to the Company’s utilization rates of equipment, anticipated length of the current economic downturn, future operating costs and the increase or decrease relating thereto, capital expenditures, the projected growth of the asset base of the Company and other statements relating to matters that are not historical facts and statements of the Company’s beliefs, expectations about developments, results and events which will or may occur in the future, which constitute “forward-looking information” within the meaning of applicable Canadiansecurities legislation. Certain statements contained in this MD&A, including statements which may contain such words as: “could”, “should”, “seek”, “may”, “intend”, “likely”, “plan”, “estimate”, “believe”, “expect”, “will”, and similar expressions suggest future outcomes or statements regarding an outlook.
Forward-looking information and statements are included throughout this MD&A, including under the headings “CorporateDevelopment”, “2008 Overview”, “Liquidity and Capital Resources”, “Outlook” and “Risk Management”. In particular, forward-looking information and statements include, but are not limited to the following, each of which is subject to significant risks and uncertainties and is based on a number of assumptions which may prove to be incorrect:
Anticipated length of the current economic downturn; The success of the multi-service marketing plan will partially insulate the Company from the effects of the current economic downturn;
Whether the expected decrease in rates will be offset by decreases in labour and fuel costs, insulating the margin for the work performed in 2009;
Ability of capital expenditures to be funded through existing debt facilities and operating cash flows;Refinancing of long-term debt by January 2010 when it is due;
Performance of the oil and natural gas industry;Demand for and status of service equipment;Costs and financial trends for companies operating in the oil and natural gas industry;
Capital expenditures, including the amount and nature thereof;Demand for products and services;
Expected cash provided by continuing operations; The Company’s business strategy and outlook for business segments; Expansion and growth of the Company’s business and operations; The maintenance of existing customer, supplier and partner relationships; Supply channels; Accounting policies and tax liabilities; Expected payments pursuant to contractual obligations; The prospective impact of recent or anticipated regulatory changes; Credit risks; and Other such matters.
Management has made certain assumptions and analyses which reflect their experience and knowledge in the industry. Theseassumptions and analyses are believed to be accurate and truthful at the time but the Company cannot assure readers that actual results will be consistent with these forward-looking statements. However, whether actual results, performance, or achievements will conform to the Company’s expectations and predictions is subject to known and unknown risks and uncertainties which could cause actual results to differ materially from the Company’s expectations. Further information regarding these risks and uncertainties may be found under the heading “Risk Management” in this MD&A, “Risk Factors” in the Company’s AnnualInformation Form and in the Company’s most recent financial statements, information circular and quarterly reports.

14
CWC 2008 – MANAGEMENT ’ S D I SCUSS ION AND ANALYS I S
Management’s Discussion and Analysis
Corporate Development Central Alberta Well Services Corp. is an oilfield services company which offers a complete range of oil and gas services throughout the Western Canadian Sedimentary Basin (“WCSB”). The Company has two reporting segments, Well Servicing and Other OilfieldServices. The Well Servicing Segment includes Service Rigs and Coil Tubing. The Other Oilfield Services Segment includes Snubbing, Nitrogen, Testing and Rental activities.
The Company’s corporate office is located in Calgary, Alberta, and the main operating center is located in Red Deer, Alberta, with branch offices in Provost, Brooks and Grande Prairie providing well services to oil and gas exploration and development companies operating in Western Canada.
The Company commenced 2008 with 24 service rigs, seven (7) snubbing units, eight (8) coil tubing units, 14 nitrogen pumpers and bulkers and 12 pressure testing packages. During 2008, management continued to focus on growing the size of the operating fleet through asset acquisition and by manufacturing key pieces of equipment. In the first quarter of 2008, the Company took possession of four (4) newly completed service rigs and related equipment, completed the acquisition of nine (9) additional service rigs and established an operation base in Brooks, Alberta. In the first quarter of 2008, the Company’s total investment in equipment was $15.5 million. In the second quarter of 2008, the Company added a newly manufactured slant rig and acquired three (3) service rigs and related equipment and personnel from an Alberta based drilling company. During the third quarter of 2008, one (1) snubbing unit was fabricated and deposits were made on an additional seven (7) service rigs now anticipated to be delivered in 2009. Delays in manufacturing of the service rig units have led the delivery dates to be revised and management has been able to delay the completion of the build program near the end of 2009. To manage cash flows, management has revised the delivery date of support equipment to correspond with anticipated delivery of the service rig units. The first of these rigs was delivered on January 23, 2009 with four (4) more following through the first and second quarters, and it is anticipated delivery of the final two rigs will be delayed by management until the third or fourth quarter of 2009. For the year ending December 31,2008, the Company operated 41 service rigs, eight (8) snubbing units, eight (8) coil tubing units, 14 nitrogen pumpers and transporters and 12 pressure testing units. Total capital expenditures in 2008 totaled $32.2 million, including deposits made to date on the equipment in progress. An estimated $20.2 million will be required to be paid on delivery of the remaining equipment under the build program. The capital expansion was funded through a combination of debt and operating cash flows.
Expansion, particularly within the service rig fleet, is a cornerstone of the Company’s marketing plan and the strategic direction of the Company. The Company has been spending considerable efforts in marketing and streamlining processes to be able to offer a “full suite” of services to each customer to better meet their demands. This results in a more efficient project and provides cost savings to the customer while increasing utilization rates among all divisions. The Company believes that the ancillary services offered to its customers directly supports the core division of service rigs which continues to grow. The Company anticipates that this combined marketing effort will minimize the impact of the global economic downturn on the Company. The goal is that a job granted in one division will evolve into a project involving as many of the divisions of the Company as is possible based on the customer’s needs.
As a result of this expansion, the Company now operates the following fleet of equipment within the WCSB:
2008 2007
UNITS OPERATING AT END OF PERIOD DEC. 31 SEPT. 30 JUNE 30 MARCH 31 DEC. 31 SEPT. 30 JUNE 30 MARCH 31
Service rigs 41 41 41 37 24 21 19 18Coil units 8 8 8 8 8 8 8 8Snubbing units 8 8 7 7 7 7 7 7Nitrogen tankers & pumpers 14 14 14 14 14 14 13 13Pressure tanks 12 12 12 12 12 12 12 12
The Company’s commitment to building a modern fleet with leading edge technology continues to stand out in an industry characterized by an ageing equipment infrastructure. As a result, used equipment acquired is currently undergoing the necessary rework to bring the rigs up to the Company’s standards.

15
CWC 2008 – MANAGEMENT ’ S D I SCUSS ION AND ANALYS I S
2008 Overview
FOR THE YEAR ENDED DECEMBER 31 2008 2007 2006 (Restated)
Revenues $ 78,810,740 $ 47,350,780 $ 39,797,325Operating costs 50,541,854 31,654,965 24,216,495Gross profit 28,268,886 15,695,815 15,580,830Gross profit % 35.9% 33.1% 39.2%General and administrative expenses 10,972,927 6,788,890 5,685,055EBITDAS (1) 17,295,959 8,906,925 9,895,775EBITDAS (1) per share:
Basic and diluted 0.62 0.40 1.03Stock based compensation 920,515 1,327,580 1,536,800Interest 5,178,449 4,093,772 2,645,780Impairment of goodwill – – 10,907,667Depreciation and amortization 12,627,675 9,588,335 7,273,309Net loss before tax (1,430,680) (6,102,762) (12,467,781)Cash flow from operating activities 10,119,995 8,649,905 357,417Less: Change in non-cash working capital (3,566,381) 3,977,395 (7,358,909)Funds from operations (2) 13,686,376 4,672,510 7,716,326Funds from operations per share (2):
Basic and diluted (3) $ 0.49 $ 0.21 $ 0.80Loss per share:
Basic and diluted (3) $ (0.07) $ (0.18) $ (1.25)Purchase of property, plant and equipment 32,171,577 $ 37,051,821 $ 40,967,537
(1) EBITDAS is calculated from the statement of income (loss) as revenue less operating costs and general and administrative expenses, exclusive of stock based compensation costs, and is used to assist management and investors in assessing the Company’s ability to generate cash from operations. EBITDAS is a non-GAAPmeasure and does not have any standardized meaning prescribed by GAAP and may not be comparable to similar measures provided by other companies.
(2) Funds from operations is defined as cash from operating activities before changes in non-cash working capital. Funds from operations and funds from operations per share are measures that provide investors additional information regarding the Company’s liquidity and its ability to generate funds to finance its operations. Fundsfrom operations and Funds from operations per share do not have any standardized meaning prescribed by GAAP and may not be comparable to similar measures provided by other companies.
(3) Per share information has been retroactively restated for prior periods to reflect the consolidation on a 1:4 basis.
Revenues for 2008 were $78.8 million, an increase of 66.4% above 2007. The increase was directly attributable to increased utilization rates as well as an increase in fleet size, particularly within the Well Services Segment. Of the $31.5 million year over year increase, $25.7 million or 81.6% is attributable to increases in the Well Servicing Segment and $5.8 million or 18.4% is attributable to increases in the Other Oilfield Services Segment. The Company’s revenues correspond directly with utilization rates of the fleet. Within the Well Servicing Segment fleet size increased by 53% year over year; while utilization rates in 2008 remained consistent with 2007 at 59% and resulted in a 81.6% year over year increase in revenues. Within the Other Oilfield Services Segment, the fleet was increased by one (1) snubbing unit and utilizations increased from 36% in 2007 to 45% in 2008 resulting in a 33.9% increase in year over year revenues.
Throughout 2009, the Company will continue to focus marketing efforts on multi-service arrangements to increase utilization rates in both segments.
Gross profit is mainly impacted by costs of direct labour, costs of running supplies for the fleet and the rates charged for the services provided. In 2008, gross profit as a percentage of revenues increased by 2.8%. The increase was consistent with an increase in rates throughout the year; however, this was partially offset by increased costs of labour seen in 2008 as well as significant fuel costs incurred in the second and third quarters. The Company anticipates the lower fuel costs to continue throughout most of 2009, consistent with the anticipated length in the current economic downturn being experienced. The Company also anticipates increased pressure to reduce rates for services that will occur throughout 2009 as market competition increases. As a result, the Company anticipates that margins will decrease slightly, as the decrease in rates will be partially offset by an anticipated corresponding decrease in costs as the downturn progresses.
Management’s Discussion and Analysis
16
CWC 2008 – MANAGEMENT ’ S D I SCUSS ION AND ANALYS I S
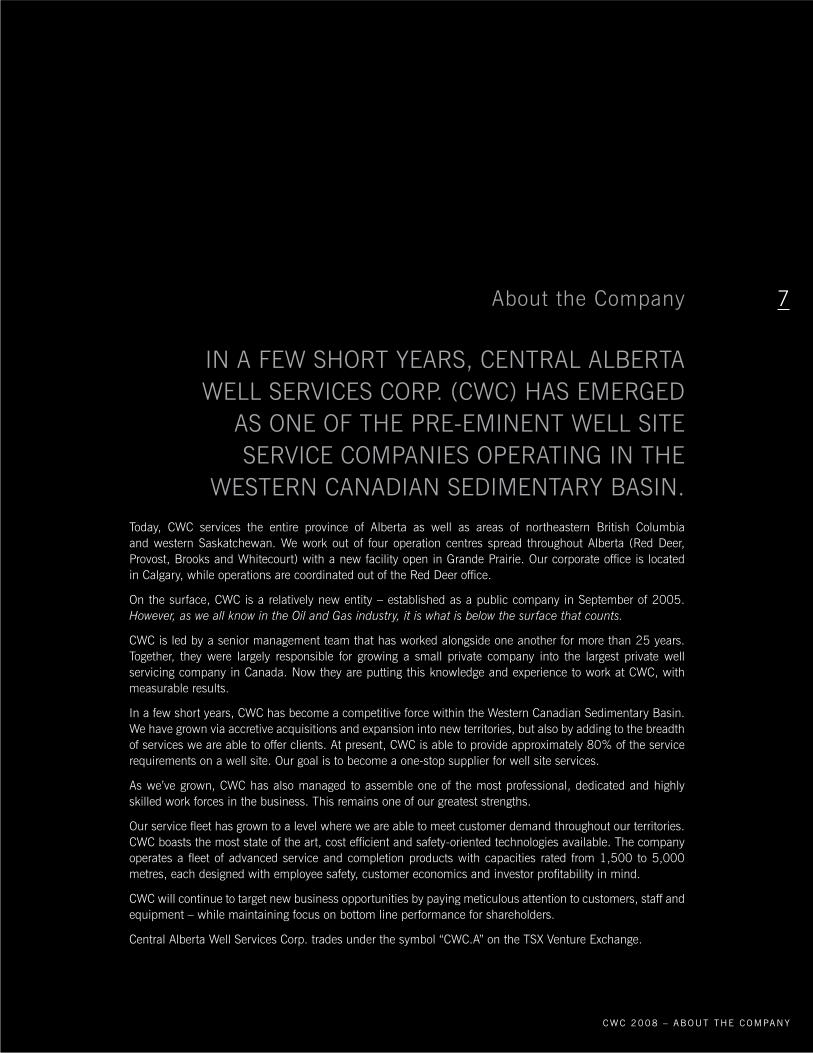
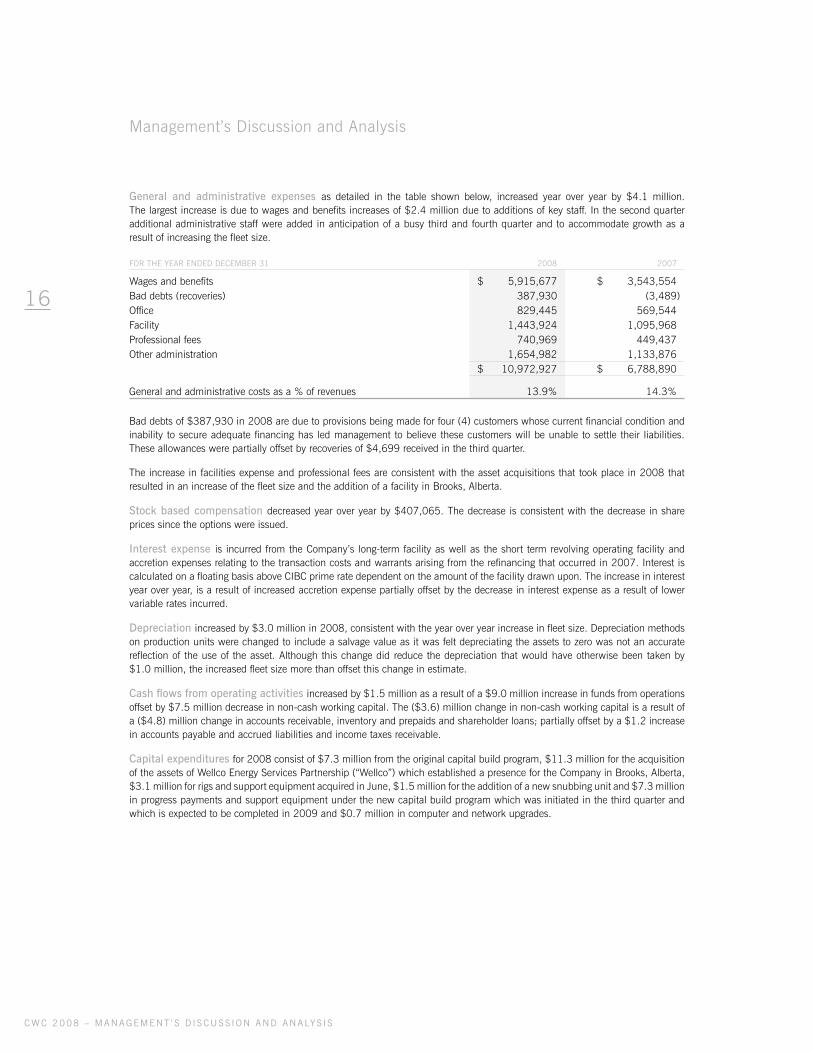
Management’s Discussion and Analysis
General and administrative expenses as detailed in the table shown below, increased year over year by $4.1 million. The largest increase is due to wages and benefits increases of $2.4 million due to additions of key staff. In the second quarter additional administrative staff were added in anticipation of a busy third and fourth quarter and to accommodate growth as a result of increasing the fleet size.
FOR THE YEAR ENDED DECEMBER 31 2008 2007
Wages and benefits $ 5,915,677 $ 3,543,554Bad debts (recoveries) 387,930 (3,489)Office 829,445 569,544Facility 1,443,924 1,095,968Professional fees 740,969 449,437Other administration 1,654,982 1,133,876
$ 10,972,927 $ 6,788,890
General and administrative costs as a % of revenues 13.9% 14.3%
Bad debts of $387,930 in 2008 are due to provisions being made for four (4) customers whose current financial condition and inability to secure adequate financing has led management to believe these customers will be unable to settle their liabilities. These allowances were partially offset by recoveries of $4,699 received in the third quarter.
The increase in facilities expense and professional fees are consistent with the asset acquisitions that took place in 2008 that resulted in an increase of the fleet size and the addition of a facility in Brooks, Alberta.
Stock based compensation decreased year over year by $407,065. The decrease is consistent with the decrease in share prices since the options were issued.
Interest expense is incurred from the Company’s long-term facility as well as the short term revolving operating facility and accretion expenses relating to the transaction costs and warrants arising from the refinancing that occurred in 2007. Interest is calculated on a floating basis above CIBC prime rate dependent on the amount of the facility drawn upon. The increase in interest year over year, is a result of increased accretion expense partially offset by the decrease in interest expense as a result of lower variable rates incurred.
Depreciation increased by $3.0 million in 2008, consistent with the year over year increase in fleet size. Depreciation methods on production units were changed to include a salvage value as it was felt depreciating the assets to zero was not an accurate reflection of the use of the asset. Although this change did reduce the depreciation that would have otherwise been taken by $1.0 million, the increased fleet size more than offset this change in estimate.
Cash flows from operating activities increased by $1.5 million as a result of a $9.0 million increase in funds from operations offset by $7.5 million decrease in non-cash working capital. The ($3.6) million change in non-cash working capital is a result of a ($4.8) million change in accounts receivable, inventory and prepaids and shareholder loans; partially offset by a $1.2 increase in accounts payable and accrued liabilities and income taxes receivable.
Capital expenditures for 2008 consist of $7.3 million from the original capital build program, $11.3 million for the acquisition of the assets of Wellco Energy Services Partnership (“Wellco”) which established a presence for the Company in Brooks, Alberta, $3.1 million for rigs and support equipment acquired in June, $1.5 million for the addition of a new snubbing unit and $7.3 millionin progress payments and support equipment under the new capital build program which was initiated in the third quarter and which is expected to be completed in 2009 and $0.7 million in computer and network upgrades.

17
CWC 2008 – MANAGEMENT ’ S D I SCUSS ION AND ANALYS I S
2008 – Quarterly Review
(In 000’s, except per share data) 2008 2007
THREE MONTHS ENDING Q4 Q3 Q2 Q1 Q4 Q3 Q2 Q1 (Restated) (Restated) (Restated) (Restated) (Restated) (Restated) (Restated)
RevenuesWell Servicing $ 12,789 $ 16,732 $ 9,165 $ 17,206 $ 8,855 $ 7,270 $ 3,968 $ 10,137Other Oilfield Services $ 5,658 $ 6,290 $ 3,591 $ 7,379 $ 3,719 $ 4,643 $ 1,998 $ 6,761
$ 18,447 $ 23,022 $ 12,756 $ 24,585 $ 12,574 $ 11,913 $ 5,966 $ 16,898Net income (loss) (1,939) 901 (2,769) 1,748 (134) 272 (3,744) (454)EPS: Basic and diluted (0.07) 0.03 (0.10) 0.06 (0.01) 0.01 (0.13) (0.04)Weighted average Class
A common shares 20,810 21,451 21,502 21,532 22,533 22,663 14,427 10,468Weighted average Class
B common shares 6,604 6,373 6,373 6,343 5,748 5,654 6,772 –Total weighted average
common shares 27,414 27,824 27,875 27,875 28,281 28,317 21,199 10,468Total assets 144,194 144,407 134,120 140,868 118,465 110,762 107,107 106,675Long-term debt 55,419 52,070 45,615 49,172 29,242 20,138 15,239 57,852Purchase of property,
plant and equipment $ 5,454 $ 6,818 $ 4,358 $ 15,543 $ 12,154 $ 5,551 $ 6,770 $ 12,577
Revenues for the fourth quarter were $18.4 million, a year over year increase of $5.9 million or 46.1%. The majority of the increase relates to the Well Servicing Segment, where an increase in fleet size from capital additions made in 2007 and throughout 2008 increased revenues by $3.9 million year over year. Increased utilization rates within the Other Oilfield Services Segment and the addition of one snubbing unit increased revenues $2.0 million year over year. The fourth quarter is generally anticipated to be better than the third quarter; however, the impact of the current economic slowdown was felt somewhat by both segments resulting in a decrease in revenues of $4.6 million or 25%. Accordingly, utilization rates for both the Well Servicing and Other Oilfield Services segments were down from the third quarter by 20% and 9% respectively.
Net income (loss) was lower in the fourth quarter as a result of lower than expected utilization rates, one time charges for bad debts and $0.5 million in future income tax liability being recorded. The fourth quarter ended with a net loss of ($1.9 million),($7.3 million) lower than the fourth quarter of 2007 and ($2.9 million) lower than the third quarter of 2008. Net income in the first quarter was the highest for the Company for the year, ending the quarter at $1.8 million as a result of utilization rates of 72% and 53% for the Well Servicing and Other Oilfield Segment respectively. Although the third quarter had similarly high utilization rates of 71% and 54% for the Well Servicing and Other Oilfield Services Segments respectively, increased overhead costs as a result of expansion into new areas resulted in a lower net income for the quarter.
Weighted average common shares have declined as a result of the Company’s Normal Course Issuer Bid (“NCIB”) program which began in August 2007 and renewed in September, 2008. Under the renewed NCIB, the Company is permitted to purchases up to a maximum of 1,073,187 Class A Shares on the open market. To date, a total of 669,600 have been repurchased at an average cost of $1.13 per share including commissions.
Long-term debt rose by $3.4 million from the third quarter of 2008 and $26.2 million from the fourth quarter of 2007. Theincreased debt has been used to fund expansion of the fleet, critical to the long-term viability of the Company. Capital expenditures for 2008 totalled $32.2 million. The remaining $6.1 million in capital expenditures were funded through funds from operations.
Management’s Discussion and Analysis

18
CWC 2008 – MANAGEMENT ’ S D I SCUSS ION AND ANALYS I S
Management’s Discussion and Analysis
Well Servicing Segment
YEAR ENDED 2008 2007
WELL SERVICING
Revenues $ 55,893,190 $ 30,229,203Income before taxes 6,003,404 3,251,101Depreciation and amortization 9,459,967 6,008,880EBITDAS (1) 15,463,371 9,259,981
(1) EBITDAS is calculated from the statement of income (loss) as revenue less operating costs and general and administrative expenses, exclusive of stock based compensation costs, and is used to assist management and investors in assessing the Company’s ability to generate cash from operations. EBITDAS is a non-GAAPmeasure and does not have any standardized meaning prescribed by GAAP and may not be comparable to similar measures provided by other companies
The Well Servicing Segment consists of a fleet of 41 service rigs and related support equipment and eight (8) coil tubing units. Thefleet operates from facilities in Red Deer, Provost, Brooks and a newly established facility in Grande Prairie. The Company’s fleet of service rigs consists mainly of rigs that have been built since the inception of the Company and provides safer, more reliable equipment than that of its competitors.
Revenues for 2008 were $55.9 million, an increase of $25.7 million or 85% over revenues of $30.2 million experienced in 2007. Expansion of the fleet has resulted in the increased revenues seen year over year as utilization rates have remained consistent at 59%.
Gross profit expressed as a percentage of revenues was 36% for 2008 versus 37.8% in 2007, the decline is mainly a result of increased direct labour costs and higher fuel costs being incurred in the year.
Income before taxes of $6.0 million is $2.8 million or 84.7% higher than the prior year, again as a result of the increased fleet resulting from completion of the capital build program and the two asset acquisitions.
Depreciation increased by $3.5 million year over year but has decreased as a percentage of revenues from 19.9% to 16.9% largely as a result of the implementation of salvage values which occurred in the third quarter.
EBITDAS increased by $6.2 million or 67% year over year, largely due to the 85% increase in revenues experienced in the year. EBITDAS as a percentage of revenues has decreased from 30.6% seen in 2007 to 27.7% in 2008 as a result of the slight decrease in profit margins.
Other Oilfield Services Segment
YEAR ENDED 2008 2007)
OTHER OILFIELD SERVICES
Revenues $ 22,917,550 $ 17,121,577Income (loss) before taxes 2,992,932 (1,219,178)Depreciation and amortization 2,784,846 3,360,440EBITDAS (1) 5,777,777 2,141,262
(1) EBITDAS is calculated from the statement of income (loss) as revenue less operating costs and general and administrative expenses, exclusive of stock based compensation costs, and is used to assist management and investors in assessing the Company’s ability to generate cash from operations. EBITDAS is a non-GAAPmeasure and does not have any standardized meaning prescribed by GAAP and may not be comparable to similar measures provided by other companies
The Other Oilfield Services Segment consists of eight (8) snubbing units, 14 nitrogen tankers and pumpers, 12 pressure testing units and rental equipment. The nitrogen pumping units are a heat recovery nitrogen system used in many applications of the services provided by the Company. Nitrogen is used in place of air whenever a risk hazard assessment dictates. Nitrogen is an inert gas that is non-corrosive and non-explosive. It is ideal for industrial type applications for purging pipelines, pressure testing vessels and facilitating withdrawing stored liquids from vessels. The nitrogen pumpers also work in conjunction with the Company’s coil tubing, well servicing and snubbing divisions and provide a synergized service for the Company’s clientele. Snubbing and stripping operations are designed to enhance efficiency and performance in completion and workovers, wireline operations and underbalanced drilling. Snubbing units have the ability to operate in a continuous, pressure-controlled environment such as fluid-sensitive formations, under-pressured reservoirs, naturally fractured reservoirs and low-permeability sandstone reservoirs.

19
CWC 2008 – MANAGEMENT ’ S D I SCUSS ION AND ANALYS I S
Revenues for 2008 were $22.9 million, an increase of $5.8 million or 33.9% over revenues of $17.1 million experienced in 2007. The increase in revenues is attributable to utilization rates for this segment increasing by 9%, to 45% in 2008 from 36% in 2007.
Gross profit expressed as a percentage of revenues was 35% for 2008 versus 25% in 2007, an increase of 10%. The increased gross profit percentage was achieved as more employees in the nitrogen division are on a fixed salary, rather than an hourly rate. Asa result, as utilization rates increase, the margin is increased as more hours of work are obtained from the same fixed salary cost.
Income before taxes of $3.0 million is $4.2 million higher than the prior year, as a result of the increased utilization rates for this segment, resulting in recovery of fixed costs incurred.
Depreciation decreased by $0.6 million year over year as a result of the implementation of salvage values on production equipment in the third quarter, which lowered depreciation. Production equipment used in the Other Oilfield Services Segment is amortized on a straight-line basis versus the units of production method used by service rigs in the Well Servicing Segment. As a result, depreciation changes little from period to period for this segment.
EBITDAS increased by $3.6 million year over year largely due to the 33.9% increase in revenues over the same period. EBITDASas a percentage of revenues has increased from 12.5% realized in 2007 to 25.2% in 2008.
Liquidity and Capital Resources
FOR THE YEAR ENDED DECEMBER 31 2008 2007 (Restated)
Working capital (deficiency) $ 12,238,602 $ 6,887,749Working capital net of restricted cash 12,238,602 6,472,749Long-term debt 55,419,098 29,241,812Shareholders’ equity 78,878,772 80,785,259Long-term debt to equity 0.70 0.36
At the end of 2008, working capital was $12.2 million an increase of $5.3 million from 2007.
The increase in long-term debt of $26.2 million year over year is a result of amounts drawn to fund expansion of the fleet, which is critical to the long-term viability of the Company. Capital expenditures for 2008 totalled $32.2 million. The remaining $6.0 million in capital expenditures was funded through funds from operations.
Shareholders’ equity is $78.9 million at December 31, 2008, a reduction of $1.9 million from 2007. The reduction in equity is a combined result of share repurchases, reducing share capital outstanding and the loss incurred in 2008.
As at December 31, 2008, the Company had 20,647,330 Class A Common Shares and 6,603,531 Class B Common Sharesissued and outstanding. As of March 13, 2008, the Company had 20,233,830 Class A Common Shares and 6,953,531 ClassB Common Shares issued and outstanding.
Long-term debt to equity is 0.70 at December 31, 2008, 0.34 higher than in 2007. This is mainly a result of increased debt being incurred to fund the expansion plans of the Company. The Company has a long-term debt facility to a maximum of $60 million available to fund growth which is due in January, 2010. The Company plans to reduce the amount outstanding throughout 2009 through funds from operations and anticipates the remainder will be refinanced before its due date.
As at December 31, 2008, the Company is committed to additional payments totalling $10.8 million to complete the capital build program initiated in the third quarter. It is anticipated that the remaining funds due will come from a combination of operating cash flows and available debt, resulting in the long-term debt rising to the full amount of $60 million prior to the end of the first quarter of 2009. No additional capital build programs or acquisitions are currently being considered for 2009.
In addition to long-term debt, the Company has an operating line available to a maximum of $15 million, marginalized for trade receivables to fund operations. No amounts are currently outstanding on this line.
Management’s Discussion and Analysis

20
Management’s Discussion and Analysis
Changes in cash are outlined as follows:
FOR THE YEAR ENDED DECEMBER 31 2008 2007 (Restated)
Cash flow from operations $ 10,119,995 $ 8,649,905Less: Change in non-cash working capital (3,566,381) 3,977,395 Funds from operations 13,686,376 4,672,510 Cash invested in acquisition of property and equipment (31,728,182) (36,941,313)Issue (repurchase) of common shares (768,587) 48,639,654Transaction costs (253,688) (1,920,426)Repayment (increase) of shareholder loans – 52,622Restructure of short-term debt – (35,000,000)Issuance of long-term debt 24,500,000 16,700,666Increase in cash $ 1,869,538 $ 181,108
Significant AgreementsThe Company completed the fabrication of all service rigs through a supply agreement that has been in place since 2005. For the last several service rigs being fabricated, some of the support equipment was completed outside of this agreement on more favorable terms to the Company. Following the delivery of the final service rig under this agreement in the second quarter of 2008, the Company has completed its capital build program for 2007 and its commitment under the supply agreement was fully satisfied.
During the third quarter, a new capital build program was initiated that will result in seven (7) additional service rigs being added to the Company’s fleet through 2009. As at December 31, 2008, the Company is committed to an estimated $20.2 million upon completion and delivery of equipment in various stages of construction. To date, the Company has made deposits and progress payments of approximately $9.4 million.
Contractual Obligations and CommitmentsThe Company is committed to the repayment of its long-term debt in January, 2010, including principal and interest. In addition, the Company has several vehicle leases, building and facility leases and has recently entered into a lease on a property in GrandePrairie, Alberta. In addition, at the beginning of February 2009, the Company moved to a larger corporate head office space in Calgary, Alberta, and has entered into a sub-lease arrangement for its former office premises.
As at December 31, 2008, the Company is committed to an estimated $20.2 million upon completion and delivery of equipment in various stages of construction which is expected to be delivered through 2009. To date, the Company has made deposits and progress payments of approximately $9.4 million.
2013 2009 2010 2011 2012 AND BEYOND
Long-term debt $ – $ 57,700,000 $ – $ – $ 24,500Capital obligations 10,817,000 – – – – Rent 1,352,708 1,245,049 830,000 600,000 238,417 Other operating leases 68,383 68,383 54,612 7,886 3,769 Total obligations $ 12,238,091 $ 59,013,432 $ 884,612 $ 607,886 $ 266,686
In addition to the commitment outlined above, the Company is also committed to pay $0.40 per outstanding warrant, which warrants expire on January 25, 2010. The maximum cost to the Company relating to the commitment to pay out the warrants is $1.2 million. The discounted value of this obligation has been reflected as a liability in the financial statements.
CWC 2008 – MANAGEMENT ’ S D I SCUSS ION AND ANALYS I S

21
Related Party TransactionsThe Company entered into various related party transactions in the regular course of operations and through acquisitions. Transactions with related parties are recorded at fair market value determined by the contracts.
2008 2007
Purchases of capital equipment $ – $ 7,976,516Amounts in accounts payable $ 4,473 $ 9,005Amounts in operating expense $ 26,544 $ 32,658Amounts in rent expense $ 240,348 $ 228,000Amounts in other general and administrative expenses $ 44,325 $ 36,000
Purchases of capital equipment were from a supplier controlled by a director of the Company. At December 31, 2007, this company was no longer controlled by the director. Amounts in rent expense include rental of property from a director of the Company and rental of a property from an ownership group that includes employees of the Company. All other related party purchases were with companies controlled by employees of the Company. In addition to the related party transactions outlined above, shareholder loan receivables totaling $394,705 are owed to the Company. Of this amount, $116,393 are secured by personal guarantees from the shareholders.
OutlookDuring the fourth quarter of 2008, utilization rates decreased and represent the beginning of a downturn in oil and gas exploration in the WCSB. Management believes that this trend will continue into 2009, resulting in a decrease in activities for all service companies. This decrease will be particularly noticeable in Alberta, due to the new royalty regime, which is anticipated to result in reduced drilling and oilfield service activities. Even with the recent revisions to the royalty program and additional incentives by the Alberta government to spur activity, the belief is that relief, if any, will come in the third and fourth quarter of 2009 for service companies.
The Company is focusing on the marketing and education of how its combined “full suite” of services can be utilized by customers to decrease the cost of work-overs on existing wells, while maintaining margins through efficient use of resources including people and equipment. The benefit is obtained by more efficient coordination of the services and the cross training of employees to be able to perform more than just one service.
The Company will complete the previously announced build program but has been able to delay delivery of several pieces of equipment with no penalties or additional costs incurred. The equipment will be staged to come into the fleet as activity and demand increases, which is anticipated to be in the third and fourth quarters of 2009.
The Company will also continue to focus on streamlining processes and rationalizing costs without compromising safety of employees or increasing risks to both the Company’s equipment and the customer’s assets.
Critical Accounting EstimatesThis MD&A of the Company’s financial condition and results of operations is based on the financial statements which are prepared in accordance with Canadian generally accepted accounting principles (“GAAP”). The presentation of these financial statements in conformity with Canadian GAAP requires management to make estimates and assumptions that affect the reported amounts of assets, liabilities and the disclosure of contingent liabilities at the date of the financial statements and the reported revenues and expenses during the reporting period. These estimates are based on experience and assumptions that are believed to be reasonable under the circumstances. Although care has been taken, anticipating future events can not be done with certainty, therefore actual results may vary from these estimates over time as more accurate information is available and as the Company’s operating environment changes.
Impairment of Long-Lived Assets: Long-lived assets, including property and equipment and intangible assets, comprise a majority of the Company’s assets. Management reviews the carrying values of these assets for impairment periodically or whenever events or changes in circumstance indicate that their carrying value may not be recoverable. When this occurs, management performs various tests to see if the net carrying value differs from fair value. If the fair value is less than the carrying value, the asset would be considered to be impaired and an impairment loss would be recognized to reduce the asset’s carrying value to its estimated fair value. The downturn in the latter part of 2008 was seen as such a circumstance and, as a result, a test for impairment of intangible assets was conducted. The result of this test for impairment indicated that no write down was required at this time. Management will continue to closely monitor the possibility of impairment throughout the downturn.
CWC 2008 – MANAGEMENT ’ S D I SCUSS ION AND ANALYS I S
Management’s Discussion and Analysis

22
Management’s Discussion and Analysis
Depreciation and Amortization: The Company’s property, plant, equipment and intangibles are depreciated and amortized over estimated useful life using both straight line and unit-of-production methods.
During 2008, a detailed review of the amortization policies of the Company was undertaken. As a result of this review, it was determined to include salvage values in the calculation of depreciation to better reflect the usage of the assets involved in core and ancillary services. Salvage values were estimated for service rigs, production equipment and supporting field equipment. Thischange has been accounted for on a prospective basis with effect from July 1, 2008.
As a result of this estimate, depreciation in 2008 was $1,033,002 lower than if no salvage values had been estimated.
The estimates may change over time as more useful information becomes available, market conditions shift or other factors change the estimated useful life of the assets.
Stock Based Compensation: Stock based compensation expense associated with the stock-option rights granted to directors and employees, is calculated based on assumptions using the Black-Scholes option pricing model to produce an estimate of compensation. This estimate may vary due to changes in the Black-Scholes variables, which include the risk free rate of return, the share price volatility and the rates of forfeiture.
Risk ManagementBusiness Risk: Activity in the oil and gas industry is subject to a range of external factors that are difficult to actively manage, including: resource demand, commodity pricing and climate. The Company seeks to mitigate these risks by maintaining a strong balance sheet and remaining responsive to changes in industry dynamics.
The Company has a comprehensive insurance policy to help safeguard its assets, operations and employees. This is reviewed annually and revised as changes in circumstances warrant.
Credit Risk: The Company’s policy is to enter into agreements with customers that are well-established and well-financed within the oil and gas industry. There is always a risk relating to the financial stability of customers and their ability to pay. Managementwill continue to periodically assess the credit worthiness of all its customers and views the credit risk on its accounts receivable as normal for its industry.
During 2008, in the opinion of management, decreased liquidity left four customers with potentially insufficient funds to settle obligations. In the third quarter, credits as a result of overpayments made by customers that were in excess of two years old reduced the year to date expense. As a result, bad debt expense of $412,179 was provided for in 2008.
It is anticipated that the current economic downturn will continue throughout most of 2009. As a result, there is a potential for increased credit risk as companies struggle to meet obligations as access to capital markets and debt financing becomes increasingly difficult. To mitigate this risk in light of current circumstances, management has focused their marketing efforts with larger companies that have strong balance sheets and positive cash flows.
Liquidity Risk: Liquidity risk relates to the risk that the Company will encounter difficulty in meeting its financial obligations. The credit facilities available consist of a long-term facility to a maximum of $60 million maturing on January 25, 2010, and a short-term operating line of credit to a maximum of $15 million. Long-term facilities are used to fund capital acquisitions, and the short-term line of credit is used to settle current obligations such as accounts payable. As a result of the long term debt facility expiring in January 2010 the Company must refinance this facility through a replacement facility, an issuance of equity or a combination of the two as the projected cash flow in 2009 will not be sufficient to pay the facility off. The Company may be exposed to liquidity risk if it is unable to collect its trade accounts receivable balances in a timely manner which could in turn impact the Company’s long-term ability to meet commitments under its current facilities. In order to manage this liquidity risk, the Company actively monitors all accounts receivable to maintain accounts outstanding over 60 days to less than 25% of the total balance. As at December 31, 2008, the balance of trade accounts receivable in excess of 90 days was $838,898, representing approximately 6% of the trade accounts receivable balance, of this amount $412,179 has been provided for as an allowance for bad debts. A structure is maintained that focuses on growth of the Company while ensuring viability for stakeholders. Finally, in an effort to combat the seasonality of the oilfield business and reduce long-term liquidity risk exposure, the Company regularly reviews its cash availability and whenever the conditions permit, the excess cash is applied to the debt outstanding.
CWC 2008 – MANAGEMENT ’ S D I SCUSS ION AND ANALYS I S

23
Market Risk: Market risk is comprised of foreign currency risk and interest rate risk.
Foreign Currency Risk: Foreign currency risk arises from the fluctuations in foreign exchange rates and the degree of volatility of these rates relative to the Canadian dollar. The Company is not significantly exposed to foreign currency risk.
Interest Rate Risk: The Company manages its exposure to interest rate fluctuations through the issuance of a combination of variable and fixed rate borrowings. During 2008, with declining interest rates occurring and being expected to continue throughout 2009, the decision was made to enter all debt into variable rate terms. This policy is expected to continue throughout 2009 and will be evaluated regularly based on changing market conditions. During 2008, a one percent change in the prime lending rate would have impacted net income by $504,182.
Supplier Risk: In the past, the Company had a large portion of its service rig and associated equipment manufactured by a single provider. In order to mitigate the risk of short-term vulnerability, should the supplier experience unusual production disruptions or labour disputes, the Company has began utilizing several suppliers to provide various components of a total package. Suppliers are selected for various components based on their reputation in their respected industry, price and quality of the product produced.
Seasonal Risk: The level of activity in the oilfield service industry is influenced by seasonal weather patterns. During the spring months, wet weather and the spring thaw make the ground unstable. Consequently, municipalities and provincial transportation departments enforce road bans that restrict the movement of service equipment, which reduces activity levels and places an increased level of importance on the location of the Company’s equipment prior to imposition of road bans. The timing and length of road bans is dependent on the weather conditions leading to the spring thaw and weather conditions during the thaw period. The Company’s business results depend, at least in part, upon the severity and duration of the Canadian winter and the spring thaw which may lead to reduced oil and gas exploration activity and corresponding declines in the demand for the Company’s service equipment during those times.
Competitive Conditions: The operating climate within the Western Canadian Sedimentary Basin is very competitive, resulting in fluctuations of price and utilization rates. The Company attempts to mitigate these risks by creating a good working relationship with its customers and focusing on longer term contracts.
Internal Control Over Financial Reporting and Evaluation of Disclosure Controls and ProceduresThe Chief Executive Officer and the Chief Financial Officer (the “Disclosure Officers”) are responsible for establishing and maintaining the Company’s disclosure controls and procedures to provide reasonable assurance that the material information relating to the Company is made known. Internal controls over financial reporting have been designed under the supervision of the Disclosure Officers to provide reasonable assurance regarding the reliability of financial reporting and preparation of financial statement for external purposes in accordance with Canadian GAAP.
RestatementDuring the year, the Company revised its accounting for warrants. The warrants contain a cash settlement provision or “put”, thereby requiring classification as a financial liability in accordance with Section 3855 “Financial Instruments – Recognition and Measurement”. The fair value of the warrants was recalculated utilizing an approximation of the binomial lattice model and prior periods have been restated to reflect this change. The effect of the restatement on the year ended December 31, 2007, is outlined below:
2007 PREVIOUSLY 2007 REPORTED ADJUSTMENTS RESTATED
Interest expense $ 5,374,958 $ (1,281,186) $ 4,093,772Deficit and net loss $ (5,341,512) $ 1,281,186 $ (4,060,326)Current liabilities $ 7,095,463 $ 1,342,783 $ 8,438,246Long-term debt $ 29,453,660 $ (211,848) $ 29,241,812Equity $ 81,916,194 $ (1,130,935) $ 80,785,259EPS $ (0.24) $ 0.06 $ (0.18)
CWC 2008 – MANAGEMENT ’ S D I SCUSS ION AND ANALYS I S
Management’s Discussion and Analysis

24
Management’s Discussion and Analysis
Changes in Accounting PoliciesOn January 1, 2008, the Company adopted CICA Handbook Sections 3130 “Inventories”, Section 3862 “Financial Instruments – Disclosures”, Section 3863 “Financial Instruments – Presentation”, and Section 1535 “Capital Disclosures”. These new standards have been adopted on a prospective basis with no restatement of prior periods.
Section 1535 requires the Company to disclose quantitative and qualitative information regarding its objectives, policies and processes for managing its capital.
Section 3031 requires inventories to be measured at the lower of cost or net realizable value and the reversal of previously recorded write downs to realizable value when the circumstances that caused the write down no longer exist. The new standard did not have a material impact on the Company’s financial statements for the year ended December 31, 2008.
The new Sections 3862 “Financial Instruments – Disclosures” and 3863 “Financial Instruments – Presentation” will prescribe the requirements for presentation and disclosure of financial instruments. These two new standards increase the Company’s disclosure regarding the nature and extent of the risks associated with financial instruments and how these risks are managed. These risks are also discussed in the Risk Management section of this report. These discussions provide insight into management’s policies and procedures for dealing with significant risks inherent in the business.
In February 2008, the Canadian Institute of Chartered Accountants issued Section 3064 “Goodwill and Intangible Assets”,replacing Section 3062, “Goodwill and other intangible assets”. The new section establishes standards for the recognition, measurement, presentation and disclosure of goodwill and intangible assets. The new standard will be applicable to the Companyon January 1, 2009. The Company is currently evaluating the impact of this new section on its financial statements. With theCanadian Accounting Standards Board’s recent announcement of January 1, 2011 as the date International Financial Reporting Standards (“IFRS”) will replace current Canadian GAAP for publicly accountable enterprises, the Company has been carefully evaluating its own implementation plan and assessing the impact the various accounting changes will have on the organization. As the final implementation date approaches, the Company will continue to monitor developments.
To date, management has created a changeover plan for IFRS conversion that has been presented to, reviewed and authorized by the Audit Committee of the Board of Directors. Hallmarks of the change-over plan include: definition of the discrete tasks required for conversion, a timeline for the completion of the discrete tasks, an estimate of the effort and duration associated with the conversion, prioritization of tasks, the assignment of key personnel within the organization and an analysis of key interdependencies relating to the conversion steps.
The conversion plan has been divided into three distinct phases and management has begun the Phase 1 planning process. The conversion began in February 2009. Completion of the conversion is expected in November 2009.
CWC 2008 – MANAGEMENT ’ S D I SCUSS ION AND ANALYS I S

25
CWC 2008 – MANAGEMENT ’ S REPORT AND AUD ITORS ’ REPORT TO THE SHAREHOLDERS
Management’s Report and Auditors’ Report to the Shareholders
Management’s Report
To the Shareholders of Central Alberta Well Services Corp.
The accompanying financial statements of Central Alberta Well Services Corp. (CWC) and all the information in the Annual Report are the responsibility of management and have been approved by the Board of Directors.
The accompanying financial statements have been prepared by management in accordance with Canadian generally accepted accounting principles and include certain estimates that reflect management’s best judgments. Financial information presented throughout the annual report is consistent with these financial statements.
Management is responsible for the reliability and integrity of the financial statements, the notes to the financial statements and other financial information contained in this report. In the preparation of these statements, estimates are sometimes necessary because a precise determination of certain assets and liabilities is dependent on future events. Management believes such estimates have been based on careful judgments and have been properly reflected in the accompanying financial statements. Management is also responsible for ensuring that management fulfills its responsibilities for financial reporting and internal control.
The Audit Committee, which consists of three non-management directors, has reviewed the financial statements with management and the external auditor. An independent firm of chartered accountants, appointed as external auditor by the shareholders, has audited the financial statements and its report is included herein.
Darryl Wilson Darcy Campbell, CMAPresident and Chief Executive Officer VP Finance, Chief Financial OfficerMarch 16, 2009 March 16, 2009
Auditors’ Report to the Shareholders
We have audited the balance sheets of Central Alberta Well Services Corporation as at December 31, 2008 and 2007 and the statements of loss, comprehensive loss and deficit and cash flows for the years then ended. These financial statements are the responsibility of the Company’s management. Our responsibility is to express an opinion on these financial statements based on our audits.
We conducted our audit in accordance with Canadian generally accepted auditing standards. Those standards require that we plan and perform an audit to obtain reasonable assurance whether the financial statements are free of material misstatement. Anaudit includes examining, on a test basis, evidence supporting the amounts and disclosures in the financial statements. An audit also includes assessing the accounting principles used and significant estimates made by management, as well as evaluating the overall financial statement presentation.
In our opinion, these financial statements present fairly, in all material respects, the financial position of the Company as at December 31, 2008 and 2007 and the results of its operations and its cash flows for the years then ended in accordance with Canadian generally accepted accounting principles.
Chartered AccountantsCalgary, CanadaMarch 16, 2009

26
CWC 2008 – F INANC IAL STATEMENTS
2008 2007 (Restated – Note 7)
ASSETS
Current assetsCash $ 3,739,572 $ 1,870,034Restricted cash – 415,000 Accounts receivable 14,565,755 10,868,117 Shareholder loans (note 8) 394,785 128,470 Inventory 2,479,950 1,676,610 Prepaid expenses and deposits 442,351 252,028 Income tax receivable – 115,736 21,622,413 15,325,995
Property and equipment (note 9) 118,603,452 98,497,905 Shareholder loans – 70,625 Intangible assets (note 10) 3,967,816 4,570,792
$ 144,193,681 $ 118,465,317
LIABILITIES AND SHAREHOLDERS’ EQUITY
Current liabilitiesAccounts payable and accrued liabilities $ 8,176,998 $ 7,095,463 Warrants (note 12) 1,206,813 1,342,783 9,383,811 8,438,246
Future income taxes 512,000 –Long-term debt (note 13) 55,419,098 29,241,812
65,314,909 37,680,058
SHAREHOLDERS’ EQUITY
Share capital (note 14 (a)) 78,858,092 80,710,016 Contributed surplus (note 14 (d)) 6,139,422 4,135,569 Deficit, as restated (note 7) (6,118,742) (4,060,326)
78,878,772 80,785,259 Commitments and contingencies (note 15)
$ 144,193,681 $ 118,465,317
See accompanying notes to financial statements.
Approved on behalf of the Board,
Lou MacEachern, Director Gary Bentham, Director
Balance SheetFor the years ended December 31, 2008 and 2007

27
CWC 2008 – F INANC IAL STATEMENTS
2008 2007 (Restated – Note 7)
REVENUE $ 78,810,740 $ 47,350,780
EXPENSES
Operating expenses 50,541,854 31,654,965General and administrative 10,972,927 6,788,890Stock based compensation 920,515 1,327,580Interest 5,178,449 4,093,772Depreciation 12,024,699 8,985,359Amortization 602,976 602,976 80,241,420 53,453,542
NET LOSS BEFORE TAXES (1,430,680) (6,102,762)
INCOME TAXES (note 16)Current 115,736 197,378Future (reduction) 512,000 (2,239,814)
627,736 (2,042,436)
NET LOSS AND COMPREHENSIVE LOSS (2,058,416) (4,060,326)
DEFICIT, BEGINNING OF YEAR, AS RESTATED (note 7) (4,060,326) (15,097,957)
APPLICATION OF PRIOR YEAR DEFICIT TO SHARE CAPITAL (note 14(a)) – 15,097,957
DEFICIT, END OF YEAR $ (6,118,742) $ (4,060,326)
NET LOSS PER SHARE (note 14 (e))Basic and diluted loss per share $ (0.07) $ (0.18)
See accompanying notes to financial statements.
Statements of Loss, Comprehensive Loss and DeficitFor the years ended December 31, 2008 and 2007

28
CWC 2008 – F INANC IAL STATEMENTS
2008 2007 (Restated – Note 7)
CASH PROVIDED BY (USED IN):
OPERATING:
Net loss $ (2,058,416) $ (4,060,326)Items not affecting cash: Stock based compensation 920,515 1,327,580 Interest on shareholder loans (7,776) (9,915) Accretion of debt financing costs and warrants 1,679,443 83,716 Loss (gain) on disposal of assets 12,936 (17,066) Future income tax (reduction) 512,000 (2,239,814)
Depreciation and amortization 12,627,674 9,588,335 13,686,376 4,672,510Change in non-cash working capital (note 20) (3,566,381) 3,977,395 10,119,995 8,649,905
INVESTING:
Purchase of property and equipment (32,171,577) (37,051,821)Proceeds on sale of assets 28,395 110,508Decrease in restricted cash 415,000 – (31,728,182) (36,941,313)
FINANCING:
Issue of long-term debt 28,500,000 76,200,000Retirement of long-term debt (4,000,000) (59,499,334)Restructure of short-term debt – (35,000,000)Transaction costs (253,688) (1,920,426)Issue (repurchase) of common shares (note 14 (a)) (768,587) 49,470,089Share issue costs – (830,435)Repayment (increase) of shareholder loans – 52,622 23,477,725 28,472,516
INCREASE IN CASH 1,869,538 181,108CASH, BEGINNING OF PERIOD 1,870,034 1,688,926CASH, END OF PERIOD $ 3,739,572 $ 1,870,034
Supplementary Information:Interest paid $ 3,548,169 $ 3,485,844Payout penalties paid on replacement of old loans – 608,071Interest received 30,880 134,667Income taxes paid – 48,824Income taxes refunded 381,381 418,437
See accompanying notes to financial statements.
Statements of Cash FlowsFor the years ended December 31, 2008 and 2007

29
CWC 2008 – NOTES TO THE F INANC IAL STATEMENTS
1. Description of Business: Central Alberta Well Services Corp. (CWC) is an oilfield services company providing production services to oil and gas
exploration and development companies throughout the Western Canadian Sedimentary Basin.
2. Basis of Presentation: The financial statements have been prepared in accordance with Canadian generally accepted accounting principles (“GAAP”).
Certain prior period amounts have been reclassified to conform to the current period’s presentation.
3. Seasonality of Operations: The Company’s operations are located in Western Canada. The ability to move heavy equipment safely and efficiently in
Western Canadian oil and natural gas fields is dependent on weather conditions. Activity levels during the first quarter are typically the most robust as the frost creates a stable ground mass that allows for easy access to well sites and easier service rig movement. The second quarter is traditionally the slowest due to road bans during spring break-up. When winter’s frost leaves the ground, it renders many secondary roads incapable of supporting the weight of heavy equipment until they have thoroughly dried out. Road bans during this time restrict service rig and support equipment access to well sites. The third quarter has more activity as the summer months are typically drier than the second quarter. The fourth quarter is again quite active as winter temperatures freeze the ground once more maximizing site access. However, there may be temporary halts to operations in extreme cold weather when the temperature falls below -35C.
4. Significant Accounting Policies: These financial statements have been prepared by management in accordance with Canadian generally accepted accounting
principles. The preparation of financial statements, in conformity with Canadian generally accepted accounting principles, requires management to make estimates and assumptions that affect the reported amounts reported in the financial statements and accompanying notes. Actual results could differ materially from those estimates. The financial statements have, in management’s opinion, been properly prepared within reasonable limits of materiality and the framework of the significant accounting policies summarized below:
a) Inventory: Inventory is comprised of operating supplies and spare parts and is carried at the lower of average cost and net realizable
value.
b) Property and equipment and intangible assets: Property and equipment and intangible assets are recorded at cost less accumulated depreciation and amortization.
Depreciation and amortization are provided taking into consideration the estimated useful lives of the assets, using the following methods and annual rates:
ASSETS METHOD RATE
Service rigs Unit of production 24,000 operating hours Production units Straight-line 3 to 10 years Other field equipment Straight-line 2 to 10 years Computer, furniture and office equipment Straight-line 3 to 5 years Intangible assets Straight-line 3 to 10 years
Assets under construction are not depreciated until they are available for use. Assets are tested for impairment as deemed necessary by changing circumstances that could indicate an impairment in the carrying value.
c) Long-term debt: Long-term debt is accounted for at its amortized cost, using the effective interest method. Transaction costs are incremental
costs that are attributable to the acquisition, issue, or disposal of a financial instrument. Transaction costs are offset against the associated debt and amortized using the effective interest method.
Notes to the Financial StatementsYears ended December 31, 2008 and 2007
30
CWC 2008 – NOTES TO THE F INANC IAL STATEMENTS
4. Significant Accounting Policies (continued):d) Income taxes: The Company follows the asset and liability method of accounting for income taxes, whereby future income tax assets
and liabilities are recognized for the future tax consequences attributable to differences between the carrying value of assets and liabilities and their tax bases. Future tax assets and liabilities are measured using enacted or substantively enacted tax rates expected to apply to taxable income in the years in which those temporary differences are expected to reverse. The effect on future tax assets and liabilities of a change in tax rates is recognized in income in the period that includes the date of enactment or substantive enactment. A valuation allowance is recorded against any future income tax asset if it is more likely than not that the asset would not be realized.
e) Revenue recognition: Revenue is recognized when services are rendered and collection is reasonably assured. The Company’s services are
generally sold based upon contracts with the customer that include fixed or determinable prices based upon daily, hourly or job rates.
f) Per share amounts: Basic per share amounts are calculated using the weighted average number of shares outstanding during the period.
Diluted per share amounts are calculated using the treasury stock method whereby the proceeds obtained on exercise of stock options and performance warrants, where market value exceeds exercise price, would be used to purchase common shares at the average price during the period. The weighted average number of shares is then adjusted by the net change.
g) Stock based compensation: The Company has equity incentive plans, which are described in notes 14(b) and 14(c). The fair value of the stock options
is calculated at the date of grant using the Black-Scholes option pricing model and the fair value of the performance warrants is measured using the Trinomial Lattice pricing model. The resulting values are recorded as compensation cost over the associated vesting period with an offsetting credit to contributed surplus. Upon exercise, the associated amounts will be reclassified from contributed surplus to share capital. Consideration paid upon exercise of options and performance warrants will be credited to share capital.
5. Changes in Accounting Estimate: During 2008, the Company evaluated the depreciation of its production equipment, service rigs and supporting field
equipment. As a result of this review, it was determined to include salvage values in the calculation of depreciation. Thischange has been accounted for on a prospective basis with effect from July 1, 2008. For the year ended December 31, 2008, depreciation is $1,033,002 lower than would have been had no salvage values been estimated. The Company has determined this will provide a more reasonable allocation of the cost of the assets.
6. Changes in Accounting Policy: On January 1, 2008, the Company adopted CICA Handbook Sections 3031 “Inventories”, Section 3862 “Financial
Instruments – Disclosures”, Section 3863 “Financial Instruments – Presentation”, and Section 1535 “Capital Disclosures”. These new standards have been adopted on a prospective basis with no restatement of prior periods.
Section 1535 requires the Company to disclose quantitative and qualitative information regarding its objectives, policies and processes for managing its capital.
Section 3031 requires inventories to be measured at the lower of cost or net realizable value and the reversal of previously recorded write downs to realizable value when the circumstances that caused the write down no longer exist. The new standard did not have a material impact on the Company’s financial statements for the year ended December 31, 2008.
The new Sections 3862 “Financial Instruments – Disclosures” and 3863 “Financial Instruments – Presentation” prescribe the requirements for presentation and disclosure of financial instruments. These two new standards increase the Company’s disclosure regarding the nature and extent of the risks associated with financial instruments and how these risks are managed.
In February 2008, the Canadian Institute of Chartered Accountants issued Section 3064 “Goodwill and Intangible Assets”, replacing Section 3062, “Goodwill and other intangible assets”. The new section establishes standards for the recognition, measurement, presentation and disclosure of goodwill and intangible assets. The new standard will be applicable to the Company on January 1, 2009. The Company is currently evaluating the impact of this new section on its financial statements.
Notes to the Financial StatementsYears ended December 31, 2008 and 2007

31
CWC 2008 – NOTES TO THE F INANC IAL STATEMENTS
7. Restatement: During the year, the Company revised the accounting for warrants disclosed in note 12. The warrants contain a cash
settlement provision or “put”, thereby requiring classification as a financial liability in accordance with Section 3855 “Financial Instruments – Recognition and Measurement”. The fair value of the warrants were recalculated utilizing an approximation of the bi-nomial lattice model and prior periods have been restated to reflect this change. The effect of the restatement on the year ended December 31, 2007 is outlined below:
2007 PREVIOUSLY 2007 REPORTED ADJUSTMENTS RESTATED
Interest expense $ 5,374,958 $ (1,281,186) $ 4,093,772Deficit and net loss $ (5,341,512) $ 1,281,186 $ (4,060,326)Current liabilities $ 7,095,463 $ 1,342,783 $ 8,438,246Long-term debt $ 29,453,660 $ (211,848) $ 29,241,812Equity $ 81,916,194 $ (1,130,935) $ 80,785,259EPS $ (0.24) $ 0.06 $ (0.18)
8. Shareholder Loans:
DECEMBER 31 2008 2007
Secured shareholder loans at 6% interest calculated semi-annually $ 104,752 $ 136,003Less long-term portion – (70,625)Plus accrued interest 11,641 7,615 Current portion of secured shareholder loans 116,393 72,993 Current portion of non-secured shareholder loans 278,392 55,477 Current portion of shareholder loans $ 394,785 $ 128,470
On March 1, 2005, the Company provided loans to certain employees to assist in the purchase of 1,165,000 common shares of the Company (291,250 shares after July 2007 share consolidation). Shareholder loans outstanding to these employees as at December 31, 2008 total $104,752 (2007: $136,003) plus accrued interest of $11,641 (2006: $7,615). Promissory notes obtained from these shareholders require equal payments of principal of $70,625 per year over a four-year period, plus interest at 6% calculated semi-annually on the anniversary of the issuance. The loans are secured by personal guarantees from the shareholders. The Company holds a security interest in these shares and 50% of the associated shares are being held in trust by the Company until the promissory notes have been paid in full. Market value of these shares at December 31, 2008 was $160,188.
The increase in the unsecured loans relates mainly to $151,000 advanced during the year as an executive relocation allowance.
9. Property and Equipment:
ACCUMULATED NET BOOK DECEMBER 31, 2008 COST AMORTIZATION VALUE
Service rigs $ 50,328,822 $ 7,329,384 $ 42,999,438Production units 30,997,528 7,157,828 23,839,700 Other field equipment 52,897,736 11,788,231 41,109,505 Computers, furniture and office equipment 1,681,453 880,253 801,201 Assets under construction 9,853,608 – 9,853,608 $ 145,759,147 $ 27,155,696 $ 118,603,452
ACCUMULATED NET BOOK DECEMBER 31, 2007 COST AMORTIZATION VALUE
Service rigs $ 35,640,471 $ 3,912,492 $ 31,727,979Production units 28,934,522 4,456,863 24,477,659 Other field equipment 42,491,729 6,379,505 36,112,224 Computers, furniture and office equipment 1,199,041 400,305 798,736 Assets under construction 5,381,307 – 5,381,307 $ 113,647,070 $ 15,149,165 $ 98,497,905
Notes to the Financial StatementsYears ended December 31, 2008 and 2007

32
CWC 2008 – NOTES TO THE F INANC IAL STATEMENTS
10. Intangibles:
ACCUMULATED NET BOOK DECEMBER 31, 2008 COST AMORTIZATION VALUE
Leasehold interest $ 55,000 $ 15,873 $ 39,127Developmental technologies 321,000 198,561 122,439 Trade name 1,300,000 357,489 942,511 Customer relationships 3,950,000 1,086,261 2,863,739 $ 5,626,000 $ 1,658,184 $ 3,967,816
ACCUMULATED NET BOOK DECEMBER 31, 2007 COST AMORTIZATION VALUE
Leasehold interest $ 55,000 $ 10,101 $ 44,899Developmental technologies 321,000 126,357 194,643 Trade name 1,300,000 227,493 1,072,507 Customer relationships 3,950,000 691,257 3,258,743 $ 5,626,000 $ 1,055,208 $ 4,570,792
11. Bank Indebtedness: During the year ended December 31, 2008, the Company entered into an agreement for a line of credit to a maximum
of $15 million at an interest rate ranging from bank prime plus 1.25% to bank prime plus 2.00%. This facility expires in November of 2009. As at December 31, 2008, no amounts were drawn.
12. Warrants: As part of the $60 million long-term credit facility entered into in January 2007, approximately 12.1 million common share
purchase warrants were issued by the Company to the lender, exercisable into common shares of the Company at a price of $0.825 per share, expiring in January 2010. The Company agreed to redeem any unexercised warrants that remain outstanding on the warrant expiry date at a price of $0.10 per warrant. In July 2007, the Company consolidated both Class A and Class B shares by issuing one (1) share for every four (4) outstanding. The warrants were consolidated as well, resulting in 3,030,303 common share purchase warrants exercisable into common shares at a price of $3.30 per share, with any unexercised warrants at the warrant expiry date to be redeemed at $0.40 per warrant. The warrants have been classified as a liability in accordance with Section 3855, “Financial Instruments – Recognition and Measurement” (see note 7). The fair value of the liability has been calculated utilizing an approximation of the bi-nomial lattice model.
13. Long-term Debt:
DECEMBER 31 2008 2007 (Restated – Note 7)
Credit facility for $60 million at interest rate of bank prime plus 2.0%, maturing on January 25, 2010. Monthly repayments of interest only, secured by a first charge on equipment and a general security agreement on all assets. $ 57,700,000 $ 33,200,000
Unsecured, interest-free loan from Government of Canada related to a patentand repayable upon commercial application of the patent. 24,500 24,500
Total debt $ 57,724,500 $ 33,224,500
Less:
Transaction costs relating to the $60 million long-term facility which includes the $35 million original short-term facility. Similar transaction charges in priorperiods were treated as an asset called deferred financing costs. (1,214,676) (1,996,408)
Cost of 3,030,303 warrants relating to the $60 million long-term facility (1,090,726) (1,986,280)
Current portion – $ 55,419,098 $ 29,241,812
Notes to the Financial StatementsYears ended December 31, 2008 and 2007

33
CWC 2008 – NOTES TO THE F INANC IAL STATEMENTS
13. Long-term Debt (continued):
At December 31, 2008, estimated principal repayments for each of the next five years are as follows:
2009 $ –2010 57,700,0002011 –2012 –2013 –Thereafter 24,500 $ 57,724,500
14. Share Capital:a) Authorized: Unlimited number of Class A and Class B common shares
Issued:
CLASS A NUMBER AMOUNT
Balance at January 1, 2007 41,873,273 $ 47,661,284 Application of prior year deficit against share capital – (15,097,957) Issued on private placement 48,814,447 34,170,113 Share issue costs (net of tax – $252,286) – (578,149) Share consolidation (1 share for every 4 outstanding) (68,015,790) – Repurchase of common shares (438,200) (1,275,162) Share transfer to Class B shares (500,000) (1,400,000) Balance at December 31, 2007 21,733,730 $ 63,480,129
Balance at January 1, 2008 21,733,730 $ 63,480,129 Repurchase of shares (636,400) (1,851,924) Share transfer to Class B shares (450,000) (1,260,000) Balance at December 31, 2008 20,647,330 $ 60,368,205
CLASS B NUMBER AMOUNT
Balance at January 1, 2007 – $ – Issued on private placement 22,614,124 15,829,887 Share consolidation (1 share for every 4 outstanding) (16,960,593) – Share transfer from Class A shares 500,000 1,400,000 Balance at December 31, 2007 6,153,531 $17,229,887
Balance at January 1, 2008 6,153,531 $ 17,229,887 Share transfer from Class A shares 450,000 1,260,000 Balance at December 31, 2008 6,603,531 $ 18,489,887
Total Share Capital as at December 31, 2008 27,250,861 $ 78,858,092
Total Share Capital as at December 31, 2007 27,887,261 $ 80,710,016
During May 2007, the Company obtained shareholders’ approval for a reduction of share capital with the deficit as of December 31, 2006 amounting to $15,097,957.
During May and June 2007, via a private placement, the Company issued 48,814,447 Class A voting common shares and 22,614,124 Class B non-voting common shares at $0.70 per share for gross proceeds of $50,000,000. Related costs of $830,435, less income taxes of $252,286, were recorded as share issue costs.
During July 2007, the Company consolidated both Class A and Class B shares by issuing one (1) share for every four (4) outstanding class A and class B common shares.
Notes to the Financial StatementsYears ended December 31, 2008 and 2007

34
CWC 2008 – NOTES TO THE F INANC IAL STATEMENTS
14. Share Capital (continued): In August 2007, the Company began repurchasing Class A shares under a Normal Course Issuer Bid (“NCIB”) program.
On September 1, 2008, the Normal Course Issuer Bid program was renewed, permitting the Company to purchase up to a maximum of 1,073,187 Class A shares on the open market. From January 1, 2008 to August 31, 2008, 30,000 Class A shares were repurchased under the initial NCIB program. From September 1, 2008 to December 31, 2008, 606,400 (2007: 438,200) Class A shares were repurchased at an average price (including commissions) of $1.21 per share under the renewed NCIB. At December 31, 2008, 571,900 of the Class A shares had been returned to treasury and cancelled.
b) Performance warrants: The Company issued 3,600,000 performance warrants on April 28, 2005 to certain of its directors and officers with a
term of five years (900,000 warrants after the July 2007 1 for 4 share consolidation). Upon vesting, the warrants were exercisable into shares of the Company at a price of $1.00 per share ($4.00 per share after the July 2007 1 for 4 share consolidation). Vesting was conditional upon the weighted average trading price of the Company’s common shares being above specified levels for 20 consecutive trading days. During the fourth quarter of 2005, the vesting conditions were met for 100% of the warrants and compensation expense was recognized. The grant date fair value at the time of issue was $0.38 per warrant. Of these warrants, 2,936,850 (82%) were subject to an escrow agreement, whereby subject to the vesting conditions, 10% of the warrants were released upon issuance and 15% of the balance are releasable every six months for three years (734,213 warrants after the July 2007, 1 for 4 share consolidation).
c) Stock option plan: Issuing shares to one major shareholder through a private placement in May and June 2007 created an effective change
in control under the stock option plan, and caused all remaining unvested options to vest. Stock based compensation expense of $893,000 was recorded to reflect accelerated vesting.
During July 2007, the Company consolidated both Class A and Class B shares by issuing one (1) share for every four (4) outstanding, thereby consolidating all options on the same basis. Per share amounts reflect retroactive consolidation of shares.
In September 2007, the Company applied to the TSX Venture to have all outstanding options cancelled and to issue new options to its employees. Approval was granted and all outstanding options were cancelled. On October 1, 2007, under the new stock option plan, 1,453,125 options to purchase Class A shares were issued to officers, senior management, employees and directors at an exercise price of $2.40 per share. The options have vesting provisions over three years and will expire five years from the date of issue.
During the year ended December 31, 2008, 666,750 were issued to officers, senior management, employees and directors at an exercise price of $1.81 per share.
WEIGHTED AVERAGE NUMBER STRIKE PRICE OF OPTIONS ($)
Outstanding, January 1, 2007 3,615,000 1.75 Granted 602,500 0.77 Forfeited (538,000) (1.78) 3,679,500 1.59 Share consolidation (1 share for every 4 outstanding) (2,759,625)
Cancellation (September 30, 2007) (919,875) (6.36) Granted, October 1, 2007 1,453,125 2.40 Outstanding, December 31, 2007 1,453,125 2.40
Outstanding, January 1, 2008 1,453,125 2.40 Granted 666,750 1.81 Forfeited (139,000) (2.33) Outstanding, December 31, 2008 1,980,875 2.21
Notes to the Financial StatementsYears ended December 31, 2008 and 2007

35
CWC 2008 – NOTES TO THE F INANC IAL STATEMENTS
14. Share Capital (continued): The fair value of the options granted was estimated as at the grant date using the Black-Scholes option pricing model.
The Company recognized compensation expense for these stock options based upon the following assumptions:
Risk-free rates of return 3.24% – 4.28% Expected life (years) 3 Volatility 50%
Dividend yield 0%
2008 WEIGHTED
RANGE OF OUTSTANDING WEIGHTED AVERAGE REMAINING EXERCISABLE AVERAGE VESTED EXERCISE PRICE STOCK OPTIONS STRIKE PRICE ($) LIFE STOCK OPTIONS EXERCISE PRICE ($)
1.15 – 1.82 654,250 1.81 4.42 – –1.83 – 2.50 1,326,625 2.40 3.75 442,210 2.40
0 – 2.50 1,980,875 2.21 3.97 442,210 2.40
2007 WEIGHTED
RANGE OF OUTSTANDING WEIGHTED AVERAGE REMAINING EXERCISABLE AVERAGE VESTED EXERCISE PRICE STOCK OPTIONS STRIKE PRICE ($) LIFE STOCK OPTIONS EXERCISE PRICE ($)
2.40 – 2.40 1,453,125 2.4 4.75 – 0.00
d) Contributed surplus:
DECEMBER 31 2008 2007
Opening balance $ 4,135,569 $ 2,062,738 Stock based compensation 920,515 1,327,580
Repurchase of common shares – adjustments to average cost 1,083,337 745,251 $ 6,139,422 $ 4,135,569
e) Basic and diluted loss per share:
YEAR ENDED DECEMBER 31 2008 2007 (Restated – Note 7)
PER SHARE PER SHARE NET LOSS SHARES AMOUNT NET LOSS SHARES AMOUNT
Basic and diluted income (loss) per share $ (2,058,416) 27,737,251 $ (0.07) $ (4,060,326) 22,533,392 $ (0.18)
Securities excluded from diluted income (loss) per share as the effect would be anti-dilutive 5,911,178 5,383,428
Per share amounts have been calculated taking into account the consolidation of shares which occurred on July 12, 2007 at a ratio of one Class A common share for each four common shares outstanding (1:4). Following the consolidation, the Company had 22,671,930 Class A common shares and 5,653,531 Class B common shares outstanding. At December 31, 2008, 636,400 shares had been repurchased from the TSX Venture Exchange and 450,000 have been converted from Class A to Class B leaving the Company with 20,647,330 class A shares available for trading and 6,603,531 Class B shares.
Notes to the Financial StatementsYears ended December 31, 2008 and 2007

36
CWC 2008 – NOTES TO THE F INANC IAL STATEMENTS
15. Commitments and Contingencies: As at December 31, 2008, the Company is committed for an estimated $20.2 million upon completion and delivery of
equipment in various stages of construction expected no later than the end of the first quarter of 2009. To date, the Companyhas made deposits and progress payments of approximately $9.4 million, resulting in an additional $10.8 million to be paid prior to delivery. The Company is also committed to rent for office, yard space, operating vehicle lease payments and operating lease costs on office equipment through to 2013 as follows:
2009 2010 2011 2012 2013 AND BEYOND
Long-term debt $ – $ 57,700,000 $ – $ – $ 24,500 Capital obligations 10,817,000 – – – –Rent 1,352,708 1,245,049 830,000 600,000 238,417 Other operating leases 68,383 68,383 54,612 7,886 3,769 Total obligations $ 12,238,090 $ 59,013,432 $ 884,612 $ 607,886 $ 266,685
The Company is sometimes named as a defendant in litigation. The nature of these claims is usually related to personal injury, labour issues or completed operations. The Company maintains insurance that management deems sufficient for such matters.
16. Income Taxes:a) The provision for income taxes differs from the amount obtained by applying the combined Federal and Provincial income
tax rate of 29.5% to the loss before income taxes. The difference relates to the following items:
DECEMBER 31 2008 2007
Statutory Rate 29.50% 32.12% Income taxes (recovery) at statutory rate $ (435,603) $ (2,371,724) Increase (decrease) in income taxes resulting from: Non-deductible expenses 44,964 24,640 Stock compensation expense 271,552 426,419 Accretion of warrants 233,434 200,459 Tax rate changes 792,569 (691,230) Other 89,820 – Valuation allowance (369,000) 369,000 $ 627,736 $ (2,042,436)
Significant components of the Company’s future income tax assets and liabilities at period end are as follows:
DECEMBER 31 2008 2007
Operating losses $ 7,671,564 $ 5,850,221 Share issue and deferred financing costs 573,014 621,872 Property and equipment (8,337,159) (5,610,455) Goodwill 76,558 83,739 Intangible assets (495,977) (576,377) (512,000) 369,000 Valuation allowance – (369,000) $ (512,000) $ –
b) The operating losses included in the future income tax assets are available for carry-forward for tax purposes to apply against future taxable income until the unused portion to expire between 2015 and 2028.
Notes to the Financial StatementsYears ended December 31, 2008 and 2007

37
CWC 2008 – NOTES TO THE F INANC IAL STATEMENTS
17. Related Party Transactions: The Company entered into various related party transactions in the regular course of operations and through acquisitions.
Transactions with related parties are recorded at fair market value determined by the contracts.
2008 2007
Purchases of capital equipment $ – $ 7,976,516Amounts in accounts payable $ 4,473 $ 9,005Amounts in operating expense $ 26,544 $ 32,658Amounts in rent expense $ 240,348 $ 228,000Amounts in other general and administrative expenses $ 44,325 $ 36,000
Purchases of capital equipment were from a supplier controlled by a director of the Company. At December 31, 2007 this company was no longer controlled by the director. Amounts in rent expense include rental of property from a director of the Company, and rental of a property from an ownership group that includes employees of the Company. All other related party purchases were with companies controlled by employees of the Company.
18. Capital Management: The Company’s strategy is to maintain a level of capital for operations and to sustain future growth of the business. The
Company strives to maintain a balance between debt and equity to ensure the continued access to capital markets to fund growth and ensure long-term viability. The Company monitors its capital balance through regular evaluation of long-term debt to equity ratio. The components of capital as well as the long-term debt to equity ratio as of December 31, 2008 and December 31, 2007 are shown in the table below.
DECEMBER 31 2008 2007 (Restated – Note 7)
Long-term debt $ 55,419,098 $ 29,241,812Shareholders’ equity 78,878,772 80,785,259Long-term debt to equity 0.70 0.36
The Company is subject to financial covenants in the debt financing agreements related to both the operating line of credit and long-term debt. The current ratio and debt service coverage ratio are two financial metrics that provide indicators as to whether the Company is in compliance with its financial covenants. The Company is presently in compliance with all financial covenants.
19. Financial Instruments: The Company has designated its financial instruments as follows: cash is classified as held-for-trading, which is measured
at fair value; accounts receivable are classified as loans and receivables which are measured at amortized cost; accounts payable and accrued liabilities and long-term debt are classified as other financial liabilities which are also measured at amortized cost. The fair value of these instruments approximates their carrying amount due to their short-term nature. Thefair value of long-term debt approximates its carrying value as stated interest rates reflect current borrowing rates available to the Company.
The Company has exposure to credit, liquidity and market risk as follows:
a) Credit risk: The Company’s policy is to enter into agreements with customers that are well-established and well-financed within the
oil and gas industry to reduce credit risk. There is always a risk relating to the financial stability of customers and their ability to pay. Management will continue to periodically assess the credit worthiness of all its customers and views the credit risk on its accounts receivable as normal for its industry.
During the year ended December 31, 2008, in the opinion of the management, decreased liquidity left four customers with potentially insufficient funds to settle obligations and recent changes in the operations of another customer resulted in increased exposure to credit risk. As a result, bad debt expense of $412,179 was provided for in the year ended December 31, 2008.
Notes to the Financial StatementsYears ended December 31, 2008 and 2007

38
CWC 2008 – NOTES TO THE F INANC IAL STATEMENTS
19. Financial Instruments (continued):b) Liquidity risk: Liquidity risk relates to the risk that the Company will encounter difficulty in meeting its financial obligations. The
credit facilities available consist of a long-term facility to a maximum of $60 million maturing on January 25, 2010 and a short-term operating line of credit to a maximum of $15 million. Long-term facilities are used to fund capital acquisitions and the short-term line of credit is used to settle current obligations such as accounts payable. As a result of the long term debt facility expiring in January 2010 the Company must refinance this facility through a replacement facility, an issuance of equity or a combination of the two as the projected cash flow in 2009 will not be sufficient to pay the facility off. The Company may be exposed to liquidity risk if it is unable to collect its trade accounts receivable balances in a timely manner, which could in turn impact the Company’s long-term ability to meet commitments under its current facilities. In order to manage this liquidity risk, the Company actively monitors all accounts receivable to maintain accounts outstanding over 60 days to less than 25 percent of the total balance. As at December 31, 2008, the balance of trade accounts receivable in excess of 90 days was $838,898, representing approximately 6% of the trade accounts receivable balance, of this amount $412,179 has been provided for as an allowance for bad debts. A structure is maintained that focuses on growth of the Company while ensuring viability for stakeholders. Finally, in an effort to combat the seasonality of the oilfield business and reduce long-term liquidity risk exposure, the Company regularly reviews its cash availability and whenever the conditions permit, the excess cash is applied to the debt outstanding.
c) Market risk: Market risk is comprised of foreign currency risk and interest rate risk.
i. Foreign currency risk: Foreign currency risk arises from the fluctuations in foreign exchange rates and the degree of volatility of these rates
relative to the Canadian dollar. The Company is not significantly exposed to foreign currency risk.
ii. Interest rate risk: The Company is exposed to sudden increases in interest rate changes as all debt facilities are on a variable rate above
prime. Although this did benefit the Company through 2008, there is a risk that prime rate could increase over time. The Company will address this risk further with the upcoming refinancing of the long term facility which expires in January 2010. For the year ended December 31, 2008, a one percent change in the prime lending rate would have impacted net income by $504,182.
20. Changes in non-cash working capital: The changes in non-cash working capital are as follows:
DECEMBER 31 2008 2007
Accounts receivable $ (3,697,637) $ 2,565,473Inventory (803,340) 52,430 Prepaid expenses and deposits (74,761) 18,316 Income taxes receivable 115,736 525,927 Shareholder loans (187,914) (200,657)Accounts payable and accrued liabilities 1,081,535 1,015,906 $ (3,566,381) $ 3,977,395
Notes to the Financial StatementsYears ended December 31, 2008 and 2007

39
CWC 2008 – NOTES TO THE F INANC IAL STATEMENTS
21. Segmented Information: The Company operates in two primary segments within the service industry in Western Canada: Well Servicing and Other
Oilfield Services. The Well Servicing Segment provides well services through the use of service rigs and coil tubing units. TheOther Oilfield Services Segment provides snubbing, nitrogen, production testing and equipment rentals, primarily providing support services to the well service business.
The accounting policies of the segments are the same as those described in note 4, significant accounting policies. TheCompany evaluates performance on net income before taxes. Inter-segment sales are recorded at current market prices and eliminated upon consolidation.
The reportable segments are distinct operations as they offer complementary services to the well service business. Once a service rig is on site, the other services are typically onsite at various times supporting the rig activity. However, these services can be sold independently of the well servicing. They are managed separately as the businesses were acquired as a unit and the Company has retained the management of each acquired company.
The amounts related to each industry segment are as follows:
WELL OTHER OILFIELDYEAR ENDED DECEMBER 31, 2008 SERVICING SERVICES CORPORATE TOTAL
Revenue 55,893,190 22,917,550 – 78,810,740Interest expense – – 5,178,449 5,178,449 Depreciation and amortization 9,459,967 2,784,846 382,861 12,627,675 Net income (loss) before income taxes 6,003,404 2,992,932 (10,427,015) (1,430,680)Income taxes – – 627,736 627,736 Net income (loss) and comprehensive loss 6,003,404 2,992,932 (11,054,751) (2,058,416)Property, plant and equipment 96,438,820 21,363,431 801,201 118,603,452 Intangibles – 3,967,816 – 3,967,816 Capital expenditures 29,367,731 2,321,434 482,413 32,171,577
WELL OTHER OILFIELDYEAR ENDED DECEMBER 31, 2007 (Restated – Note 7) SERVICING SERVICES CORPORATE TOTAL
Revenue 30,229,203 17,121,577 – 47,350,780 Interest expense – – 4,093,772 4,093,772 Depreciation and amortization 6,008,880 3,360,440 219,015 9,588,335 Net income (loss) before income taxes 3,251,101 (1,219,178) (8,134,685) (6,102,762)Income taxes – – (2,042,436) (2,042,436)Net income (loss) and comprehensive loss 3,251,101 (1,219,178) (6,092,249) (4,060,326)Property, plant and equipment 75,675,517 22,019,288 803,100 98,497,905 Intangibles – 4,570,792 – 4,570,792 Capital expenditures 32,892,638 4,032,067 127,116 37,051,821
Notes to the Financial StatementsYears ended December 31, 2008 and 2007


DIRECTORS
Robert A. Anderson (2)
Gary L. Bentham (1)
Rance E. Fisher (1) (2)
Alexander D. Greene N. Leon Layden Louis W. MacEachern (1) (2)
James (Jim) Reid (2)
Darryl E. Wilson
(1) Member of Audit Committee(2) Member of Compensation and Governance Committee
OFFICERS
Darryl E. Wilson, President & Chief Executive OfficerDarcy A. Campbell, Vice President Finance & Chief Financial OfficerFrederick (Rick) C. Dawson, Vice President, Business Development Ross O. Drysdale, Corporate Secretary
Stock Exchange Listing TSX Venture Exchange Trading Symbol: CWC.A
Auditors KPMG LLP (Calgary, Alberta)
Legal Advisors Burstall Winger LLP (Calgary, Alberta)
Registrar and Transfer Agent Olympia Trust Company (Calgary, Alberta)
CORPORATE OFFICE
Bow Valley Square IIISuite 755, 255 - 5th Avenue SWCalgary, Alberta T2P 3G6T: 1.403.264.2177 F: 1.403.264.2842 www.cawsc.com
HEAD OFFICE
6763 – 76th Street Red Deer, Alberta T4P 3R7 T: 1.877.341.3933 F: 1.403.341.3188
OTHER LOCATIONS
Brooks120 Pond Street Brooks, Alberta T1R 1B8T: 403.362.2800
Grande Prairie 8401 113th Street Grande Prairie, Alberta T8V 7B4T: 780.753.6200
Provost Box 1360, 3803 – 52nd Avenue Provost, Alberta T0B 3S0T: 780.753.6200
Technical Services Centre #5, 7957 Edgar Industrial WayRed Deer, Alberta T4P 3R2 T: 403.309.0843
Whitecourt3330 – 33 Street Whitecourt, Alberta T7S 0A2T: 780.778.2677

VICE EFFICIENT COMPETITIVE RESOURCEFUL DRIVEN COHESIVE PROGRESSIVE