Embed Size (px)
Citation preview
1
ICES CM 2004/FF:12 From sea to shore: development of a static Computable General Equilibrium Model (CGEM) for fisheries. Example of the fishing industry in Finistère (France).
By E. Chassot, C. Floros, P. Failler, P. Bernard, T. Rouyer and D. Gascuel. The PECHDEV* project aims to develop and apply computable general equilibrium models (CGEM) to the fishing industry to account for the contribution made by the activities of fishery and aquaculture to the development of regions dependent on fishing. In this paper, we mainly focus on the methodological steps that lead to the development of a static CGEM. In a first step, we present the different important data sets required to apply such a model and we particularly point out the difficulties that can be inherent when moving from a national social accounting matrix to the regional level. The main principles and hypotheses of a static CGEM are then presented and the link between biology and economy is emphasized. Finally, we illustrate the modelling choices that were made to apply the CGEM to the fishing industry in Finistère (France). For this purpose, the major fishing activities of Finistère were split into six fishing fleets according to relevant criteria. Then, the main stocks and species were selected following their importance in terms of tonnage and value landed in Finistère. Production functions based on current knowledge of fish stock dynamics were estimated following two distinct methods linked to data availability. Finally, expected effects that should arise when simulating the implementation of a moratorium on Celtic cod fisheries were described. Effects should be observed at the fish production level as well as in other sectors of the Finistère economy through the interrelationships of the CGEM. Such a management scenario should also drive to a new biological equilibrium through fishing effort reallocation. The CGEM for fisheries could be a very useful tool to assess the consequences of alternative management scenarios at the regional scale. Its application to the 5 different case study regions of the PECHDEV project under various management scenarios should eventually confirm its usefulness and encourage a wider use of such promising methods. Keywords: Computable General Equilibrium Model, Finistère, SAM, regional economy. E. Chassot, D., Gascuel and T. Rouyer. Agrocampus Rennes, UPR MESH, Département Halieutique, 65 rue de Saint Brieuc CS 84 215, 35042 Rennes cedex, France. C. Floros, P. Failler,, CEMARE, University of Portsmouth, Boathouse No. 6, College Road, H.M. Naval Base, Portsmouth, PO1 3LJ, UK. P. Bernard, LEN-CORRAIL Université de Nantes, Chemin de la Censive du Tertre, 44322 Nantes, France. * Part of the EU funded RTD project QLRT-2000-02277 “PECHDEV”.
2
Introduction The Common Fisheries Policy (CFP) has induced new orientations for the fisheries sectors in each European country. Through structural measures, the main objective of the CFP is to help the sector to better adapt to the availability of the resources. Some of the major constraints for these structural measures are the social and economic impacts that they may induce on fisheries sectors. The aim of the PECHDEV project is to assess the dependence of a few European regions on fishing activities through quantitative tools, because it has not yet been fully completed and it should eventually help managers in decision making. In this perspective, methodologies based on computable general equilibrium models (CGEM) appear as useful tools to investigate the effects of European measures in regional economy. CGEM are based on equilibrium hypotheses of the flows of money through the economic system studied. They have become popular since the 80s to analyse and describe economy, because they provide quantitative results in policy analysis (Harberger, 1962; Shoven and Whalley, 1992). In this perspective, general equilibrium theory seems an appropriate approach to better understand the interplay between ecology and economy and to assess the effects of fisheries management options at the regional level. In this paper, we mainly focus on the methodological steps that lead to the development of a static CGEM. We first present the principles of a CGEM and the data required for an application of the model. We then describe the case of the fishing industry in Finistère (France) to stress out the modelling choices that were made. Finally, we briefly describe the expected effects that could arise from simulating a moratorium on Celtic cod fisheries inorder to illustrate the interest of CGEM. Principles of the CGEM Data requirements A regional Social Accounting Matrix (SAM) A CGE model is usually based on a social accounting matrix (SAM). A SAM is a matrix of balanced expenditure and income accounts and it gives a record of interrelationships in an economy at the level of individual production sectors and factors, as well as private, public and foreign institutions. The SAM is derived from input-output (I/O) or make-use tables, which link the different industries of an economy. Each cell illustrates the purchase of an intermediate input by one sector that represents at the same time the sale of the same input by another sector. The SAM generalises this principle by integrating all transactions in the economy, not just the inter-industry flows, as in the I/O model (Bernard, 2003). Also, incomes always equal expenditures for each account and for the total in the matrix. So, the SAM requires that all markets must be balanced. By definition, the sum of revenues is equal to the sum of expenditures. Following Malvarosa and Pinello (2004), the main difficulties in constructing a sub-national SAM are related to the reference unit because the region does not have i) precise and controlled boundaries, with subsequent difficulties in monitoring income and goods interregional flows; ii) a sufficient statistic coverage in the sample surveys, which are generally conducted at national level and iii) it presents methodological problems for the estimation of some particular economic aggregates, such as those connected to the central government.
3
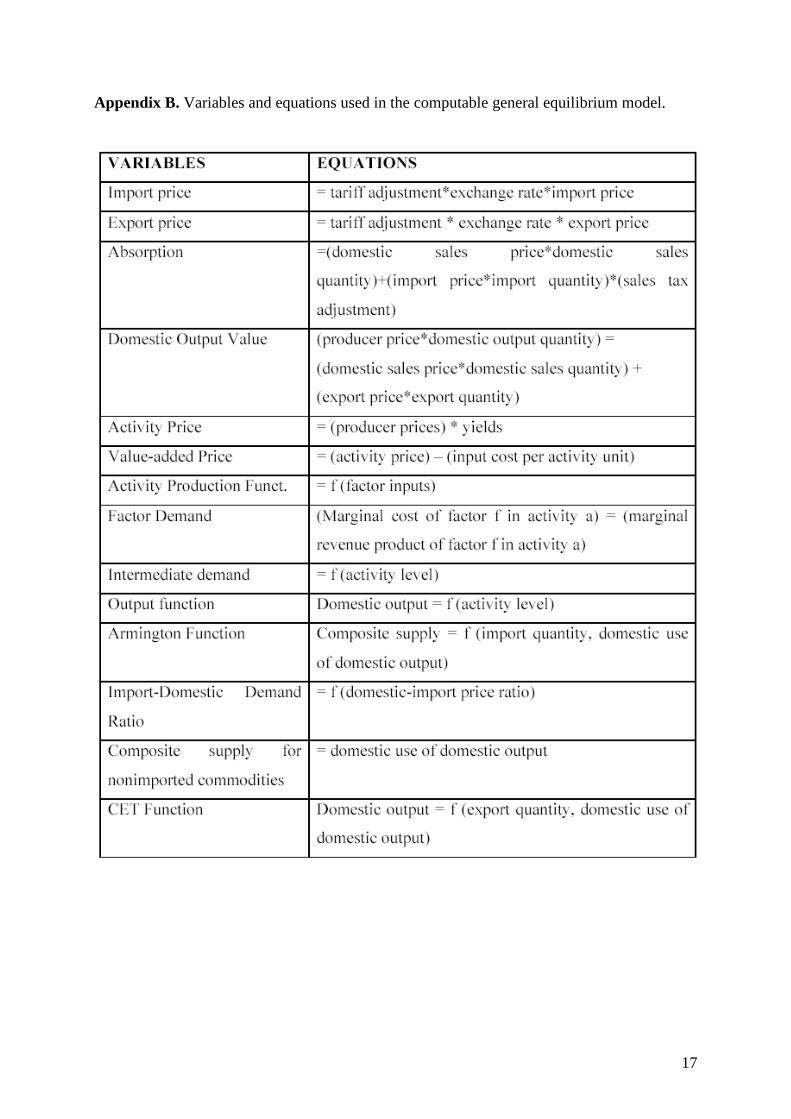
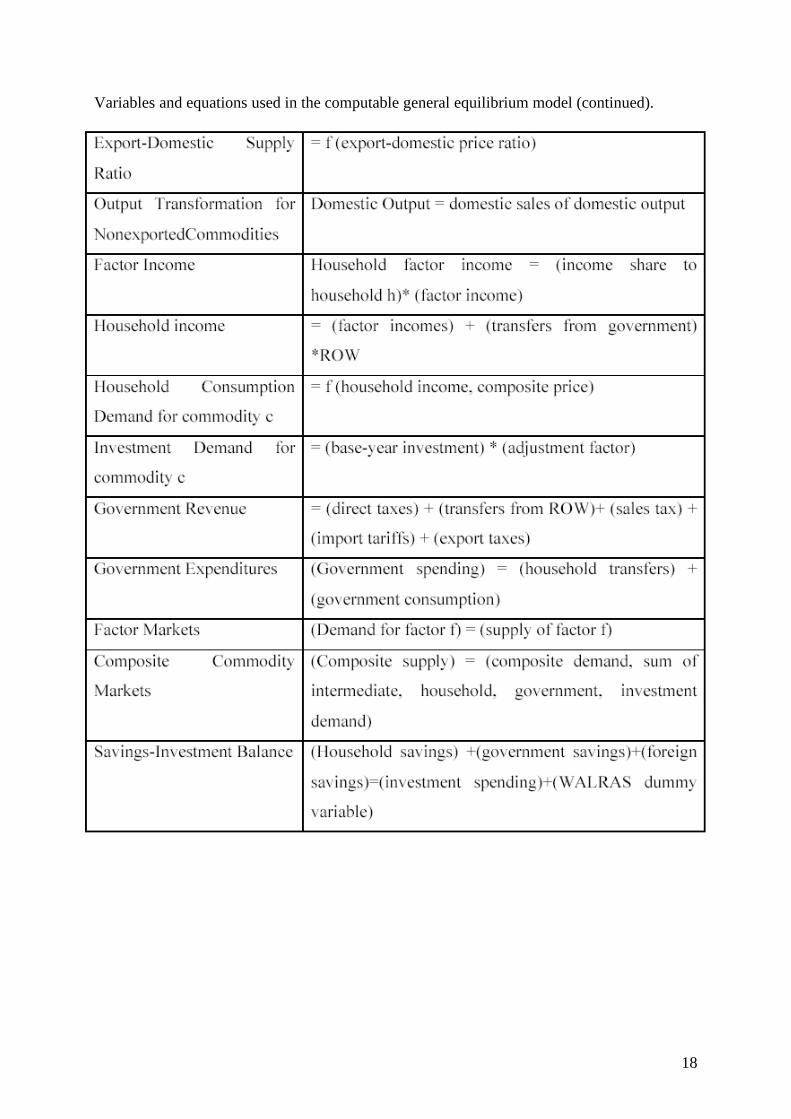
Biological data Information dealing with population dynamics is very heterogeneous among fish species and stocks in Europe. Data can be well known and annually updated for fish stocks of high commercial interest or submitted to an intense fishing pressure. On the contrary, information is very scarce and scattered for the majority of species not submitted to quota management and generally of lower commercial interest. In the biological module of the CGEM, data required to define an appropriate production function for the stocks depend on the method used (see below). Parameters estimated from stock assessment (fishing mortality, natural mortality, weight at age) that allow to make yield per recruit analyses can be used when assessments are conducted for the stock. In Europe, most of the stock assessments are conducted by international experts among the International Council for the Exploration of the Sea (ICES). All working group (WG) and Advisory Committee on Fisheries Management (ACFM) reports can be downloaded on the ICES web site (http://www.ices.dk). When no assessment is available, time-series of catch data in the geographic area of the stock and an estimate of natural mortality are required to develop a production function. Catch data for the whole stock can be extracted from the ICES database using the FAO software FishStatPlus. Economic and biological models The static CGEM The main characteristic of static CGEM is that data for modelling are either I-O tables and/or national accounts for a single year. The model then explains all payments based on the SAM. In this type of model, equilibrium is characterised by a set of prices and levels of production (i.e. market demand equals supply for all commodities). The model is based on a system of simultaneous equations, in which factors are fully utilized (e.g. Dervis et al., 1982). Appendix A and B give a summary of the variables and equations used in the static CGEM. Prices are set so that equilibrium profits of firms are zero. CGEM are based on the Walrasian general equilibrium structure (Walras, 1954). Accordingly, “for any price vector, the value of the excess demand is identically zero”. To run a CGEM, we estimate a high number of parameters from the model, so that the equilibrium solution satisfies all our equations under the method of “calibration”. The economic part of CGEM employs standard assumptions. The model assumes that producers maximize profits subject to production functions, while households maximize utility subject to budget constraints. Production and consumption behaviour are modelled using the constant elasticity of substitution (CES) family of functions, which includes Leontief, Cobb-Douglas and constant elasticity of transformation (CET) functions. Hence, substitution between regional supply and exports is given by CET, while firms smoothly substitute over primary factors through CES functions. Furthermore, factors are mobile across activities, available in fixed supplies, and demanded by producers at market-clearing prices. The model satisfies Walras’ law in that the set of commodity market equilibrium conditions is functionally dependent, while the model is homogeneous of degree of zero in prices. Other main assumptions are the following two: first, the region is treated as an open economy, implying that it faces exogenous prices for imports and exports. Second, products are differentiated according to region and Armington assumption, so that imports and exports are different from domestically produced goods. Regarding the savings, we assume that (i) household income is allocated in fixed shares to savings and consumption, (ii) the value of total investment spending is determined by the value of savings and (iii) investment spending is allocated by the commodities. Here, the set of equilibrium conditions includes the commodity market equilibrium conditions as well as the savings-investment
4
balance (including the Walras variable). Furthermore, the government of the model earns its revenues from income and sales taxes and spends it on consumption and transfers to households. Government savings is the difference between its revenues and spending. The income tax is a fixed share of the gross income of each household. Sales taxes are fixed shares of producer commodity prices. The government consumes commodity quantities, and pays market prices and taxes. The final account of our model is the rest of the world. Biological production functions Surplus production models are used as production functions in the biological module of the CGEM. A few assumptions and choices of modelling were made regarding these functions. According to the data available, two distinct cases could occur. First, generalized production models (Pella and Tomlinson, 1969) were fitted to yield per recruit curve, for all the stocks assessed by ICES for which these data were available. The fitting of the model was obtained by minimizing the square of the logarithms difference with a Runge-Kutta algorithm. We therefore assumed that recruitment is constant and independent of stock size, a strong assumption that will be discussed. The recruitment was set equal to the geometric mean given in the ICES reports and estimated on a different number of years according to the stocks. Secondly, production functions for stocks without any information available through stock assessment were estimated by an empirical approach based on time-series of catch data and exponential production models (Fox, 1970; equation 1).
( )( ) FBK
BrB
dt
dB −
−=ln
ln1 (1)
where B is the biomass, r is the intrinsic growth rate, K is the carrying capacity and F is the fishing mortality. This methodology first required to re-express the commonly used parameters r and K of the exponential model in function of the maximum sustainable yield (MSY) and the fishing mortality at MSY (FMSY) (equation 2).
( )
( )
×=
××=
MSY
MSYMSY
F
MSYK
F
MSYFr
1exp
1expln
(2)
where r is the intrinsic growth rate, K is the carrying capacity, MSY is the maximum sustainable yield and FMSY is the fishing mortality at MSY. The approach assumes that MSY and current yield (Ycurr) can be estimated from the time-series of catch data. This suggests that the stock has been exploited for a long time and that the MSY has been reached in the past. FMSY is assumed to be equal to the natural mortality of the stock (Gulland, 1971). Current fishing mortality is then estimated by solving the yield at equilibrium in the current situation (equation 3):
5
( )
×−××=
r
KFFKY curr
currcurr
lnexp (3)
where r is the intrinsic growth rate, K is the carrying capacity, Ycurr is the current yield and Fcurr is the current fishing mortality. A regional production model for fisheries In the CGEM, the regional yield (Yreg) is estimated within the economic sub-module. However, no data is provided regarding the fishing effort applied to the same stock by foreign fleets. This requires that assumptions are made on the fishing behaviour of these fleets. In this perspective, a power type function linking the fishing mortality between regional and “foreign” fleets (external to the region) was assumed. This allows to simulate different fishing behaviours between the two fleets.
β
×=
currreg
regcurroutout
F
FFF (4)
where F is the fishing mortality, out indicates the foreign fleets (other than regional), curr indicates the current situation, reg indicates the regional fleet and β is the reactivity parameter. The biological model coupled to the CGEM then becomes:
×+−+=
−
+
1
1 1)(β
γt
ttttt B
YYBgBB (5)
with
( ) ( )
−=
−=
×−=
−
−
K
BBrBgor
K
BBrBg
Y
B
m
currreg
curr
ln
ln11
1
1
1β
ααγ
where B is the biomass of the stock, t is the time step in the model (year), g is the growth function of the stock and can either be a Fox or generalized production model, Y is the yield estimated in the economic sub-module of the CGE Model, γ is a constant parameter and β is the reactivity parameter. α represents the part of regional catches on total catches for a given stock. Yreg, curr represents the current regional catch. Example of the fishing industry in Finistère A SAM for Finistère Finistère is one of France’s great maritime fishing areas that displays all fishing activities from boat construction to processing. It represents more than a quarter of total French production with 4 fishing ports being among the 6 first French ports in terms of value landed. It is considered as the most dependent region in France with 3.9% of jobs in the fishery sector (Megapesca, 2000). The Finistère SAM was compiled from distinct sources and estimated for the year 1998. Data came from the National Institute for Statistics and Economic Studies (INSEE) regarding jobs and resources for each product and activity branch. Figures dealing
6
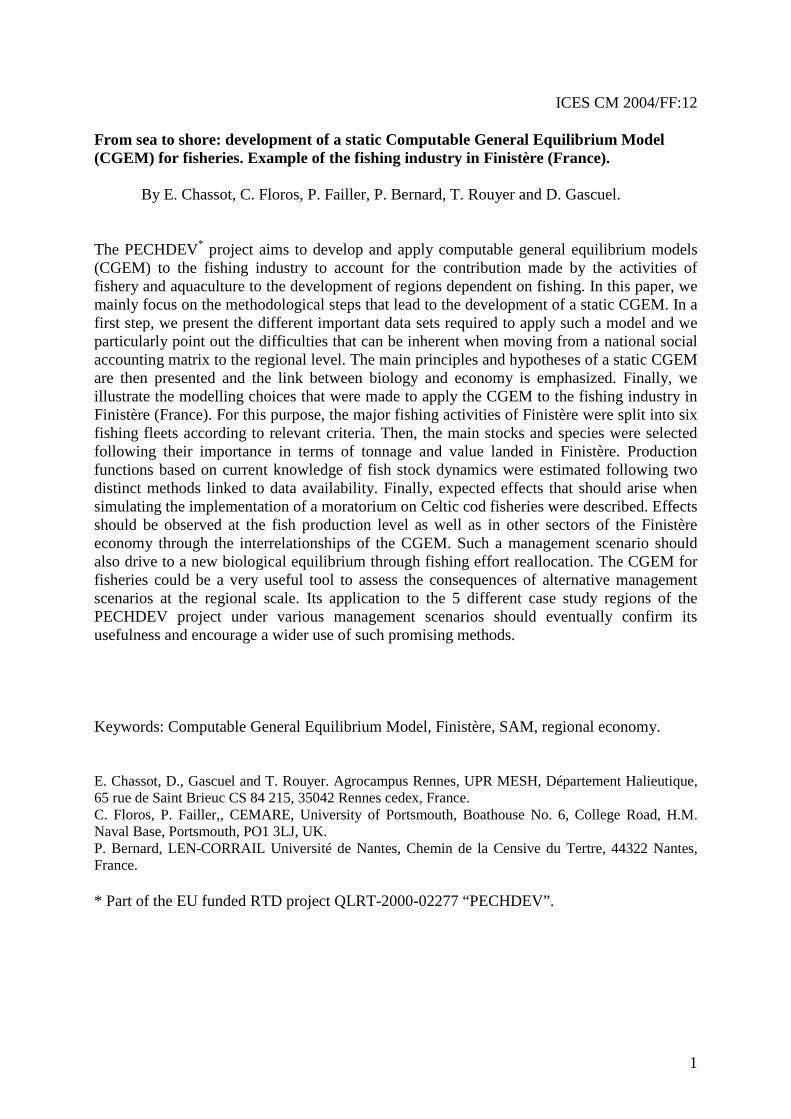
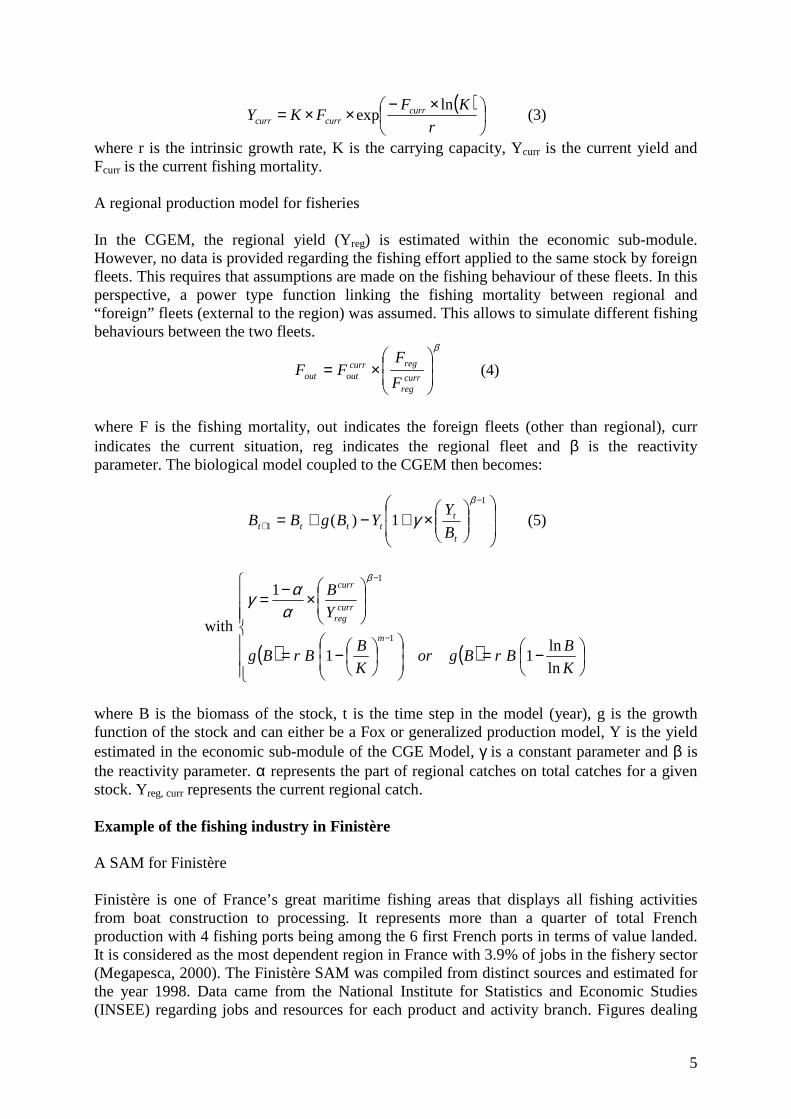
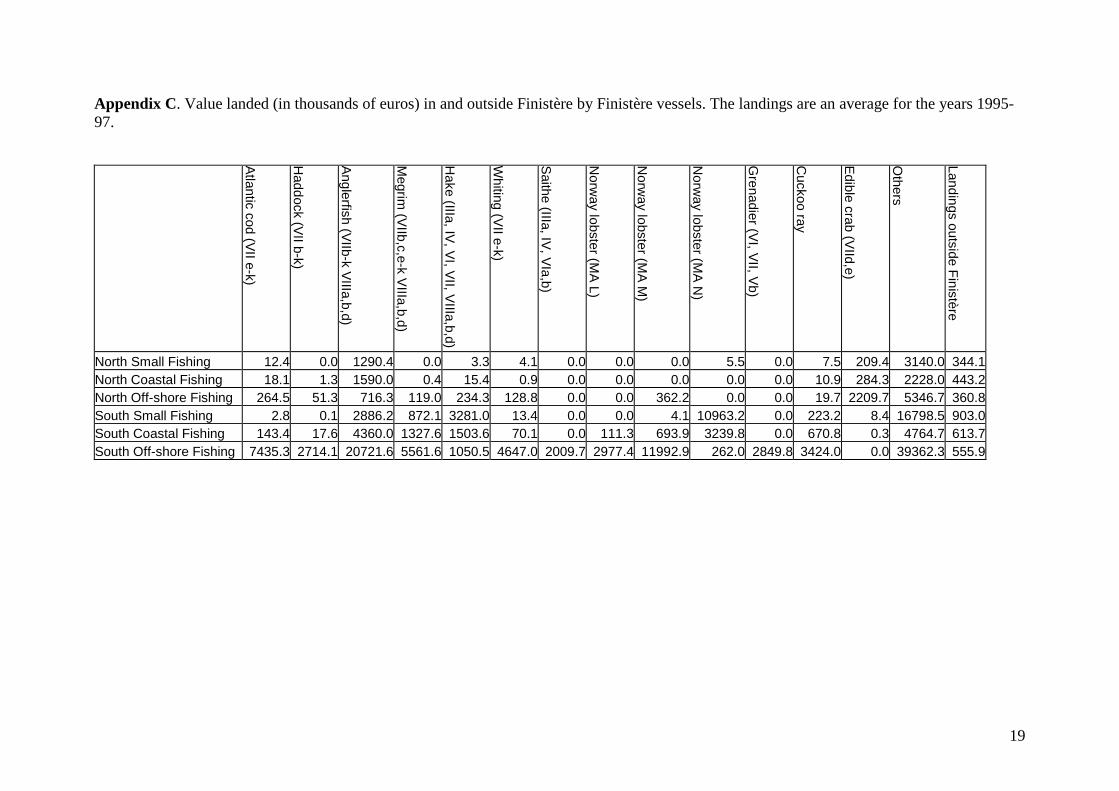
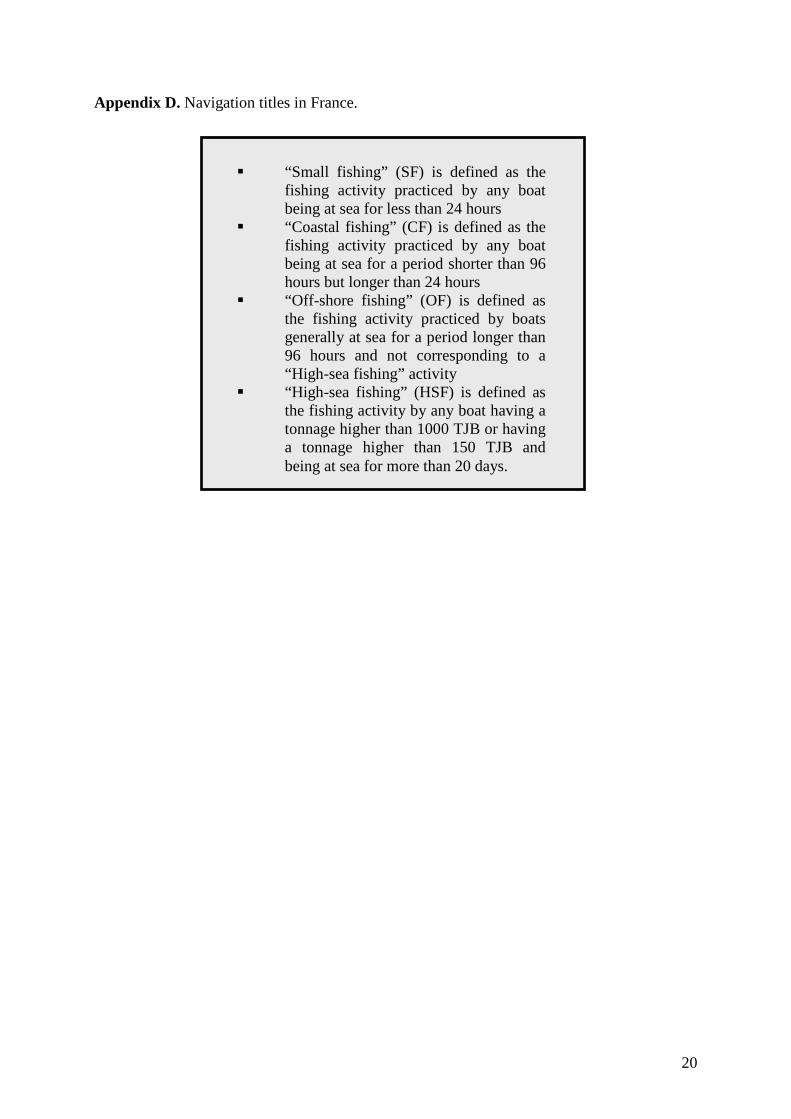
with external trade were derived from Food and Agriculture Organisation (FAO) and National Inter-professional Office of the Sea and Aquaculture Products (OFIMER) sources. Data relative to consumption were extracted from surveys conducted by the Society of Studies on Consumption, Distribution and Advertising (OFIMER-SECODIP). Regarding the fishing sector, fishermen accounts for the artisanal and industrial fleets were available through the courtesy of the Regional Economic Observatory of Maritime Fishing in Brittany (OERPMB) and the Regional Association for the Development of Fishing Industries in Brittany (AREDIPEB) respectively. The “Diane” database was used for the income statements and trading accounts of the fishing industry. For reasons of clarity, only the part of the SAM giving the landings for the stocks of interest is presented here (Appendix C). In the SAM, the production fishing sector of Finistère was segmented into distinct fishing fleets that display homogeneous characteristics in terms of factors of production and species harvested. Current typologies are based on power or size of the boats because it relates to the distance the fishing vessels can go. In France, an alternative typology exists based on the notion of ‘navigation title’. This title is a juridical status that defines the rights of fishing boats as well as fishermen according to French law. It notably establishes the time that fishing vessels can spend at sea (Appendix D) and it also defines the amount of social charges each fisherman has to pay, following the social security regime of seamen (Etablissement National des Invalides de la Marine). Based on these titles, the fishing fleet of Finistère was split into 3 fleets: small fishing, coastal fishing and off-shore fishing. The strong link between navigation title and distance of fishing make relevant their use as a fishing vessels typology (Fig. 1). Actually, a high-sea fishing fleet also exists in Finistère. It is attached to the maritime district of Concarneau but it is located most of the time in West Africa and Indian Ocean. Moreover, fish harvested by these vessels (namely tuna) are landed in African and Seychelles harbours and can be processed there, before being exported to France or other countries in the world. For these reasons, the high-sea fishing fleet of Finistère was considered in the present analysis as an import sector.
(a) (b) (c)
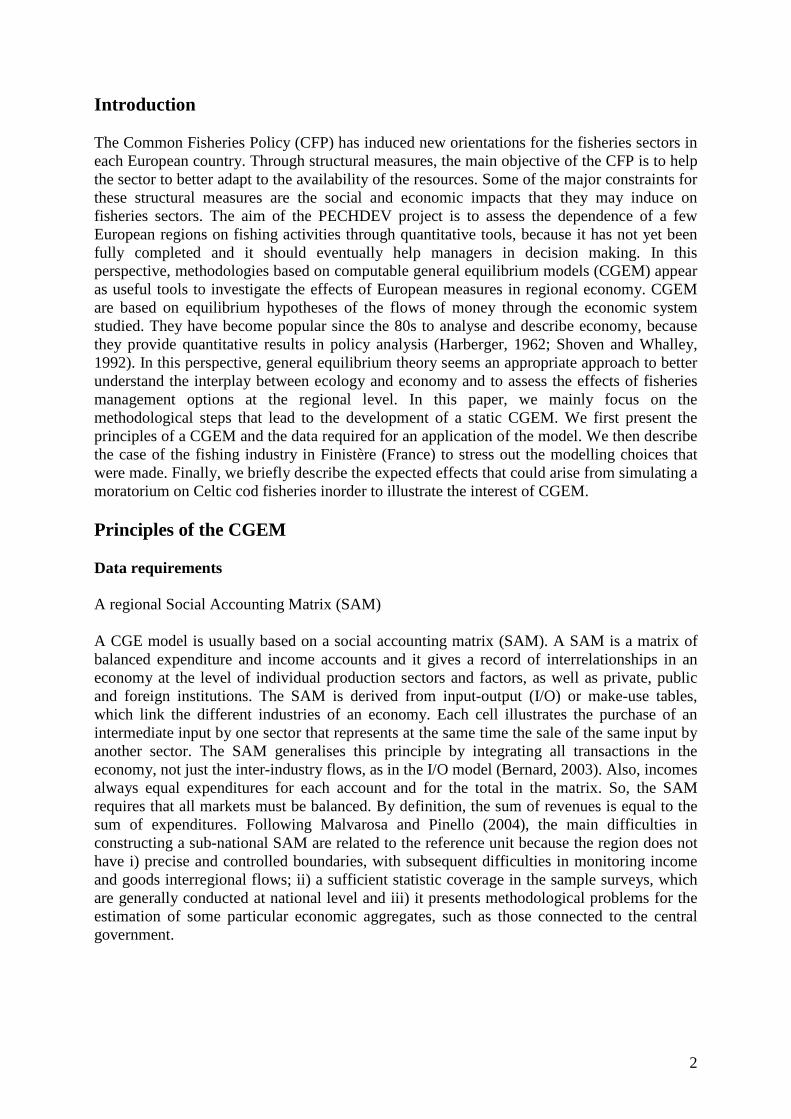
Fig. 1. Geographical distribution of the landings in value (proportion of total landings) in Finistère by Finistère fishing vessels for each navigation title (a) Small fishing (b) Coastal fishing (c) Off-shore fishing. A second criterion was added to segment the fishing activities according to their geographic location. It is generally admitted that Finistère exhibits very different types of fisheries between the northern part corresponding to the maritime districts of Morlaix, Brest and
7
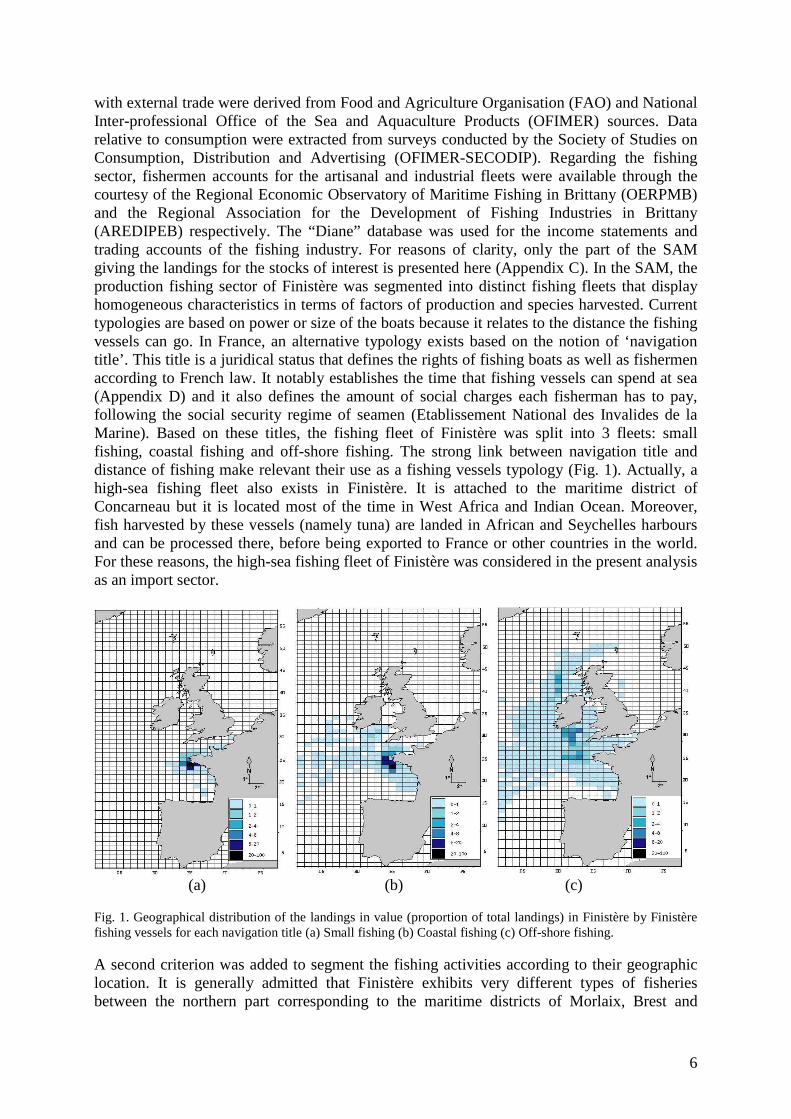
Camaret and the southern part composed by the districts of Douarnenez, Audierne, Concarneau and Le Guilvinec (Fig. 2). This distinction is globally linked to the difference in fishing grounds and hence in fish species targeted. Basically, the northern part of the Finistère is mainly characterized by small scale fisheries that mostly target crustaceans (Cancer pagurus and Maja squinado) and anglerfish (Lophius spp.). On the opposite, the southern part of Finistère is predominated by more industrial fisheries targeting a higher number of species (e.g. gadidae) and characterized by more important landings. The fishing activities in the SAM were thus finally composed of 6 fishing fleets: south small fishing, south coastal fishing, south off-shore fishing, north small fishing, north coastal fishing and north off-shore fishing. Fig. 2. Map showing the location of the 7 maritime districts of Finistère. MX = Morlaix; BR = Brest; CM = Camaret; DZ = Douarnenez; AD = Audierne; GV = Le Guilvinec; CC = Concarneau Species and stocks selection A first selection of the most important species was carried out based on total landings in Finistère for the period 1995-97, wherever the fish came from. This led to a selection of 13 species that represented at least 3% of the total Finistère landings in tonnage. They corresponded to 73% of total production in tonnage and 75% in value (Table I). European pilchard (Sardina pilchardus) and ling (Molva molva) were then excluded from the present analysis. The state of the stock of ling is highly uncertain due to the lack of information on this stock (ICES, 2002). Total catches have continuously decreased since 1998 but the available information is inadequate to evaluate spawning stock or fishing mortality. Therefore, it seemed very difficult to include this stock in the analysis and it was associated with the group ‘others’ that includes all other species and stocks not detailed in the SAM. The sardine was also gathered with the group ‘others’ because there is currently no problem of overexploitation for this species, the landings being higher than the consumers demand. The group ‘others’ was thus composed of 98 commercial species or groups of species (e.g. sandeels nei) that were landed in Finistère.
N
North Finistère
South Finistère
8
Table I. Scientific names of the major commercial resources in Finistère and their relative proportion in total landings in Finistère for the period 1995-97.
Scientific name English name Part tonnage Part value Cancer pagurus Edible crab 14% 4% Coryphaenoides rupestris Roundnose grenadier 8% 2% Gadus morhua Atlantic cod 4% 6% Lepidorhombus whiffiagonis Megrim 5% 5% Leucoraja naevus Cuckoo ray 3% 3% Lophius spp. Anglerfish 6% 22% Melanogrammus aeglefinus Haddock 4% 2% Merlangius merlangus Whiting 4% 3% Merluccius merluccius European hake 4% 5% Molva molva Ling 7% 3% Nephrops norvegicus Norway lobster 3% 18% Pollachius virens Saithe 4% 2% Sardina pilchardus European pilchard 6% 1% Others 27% 25%
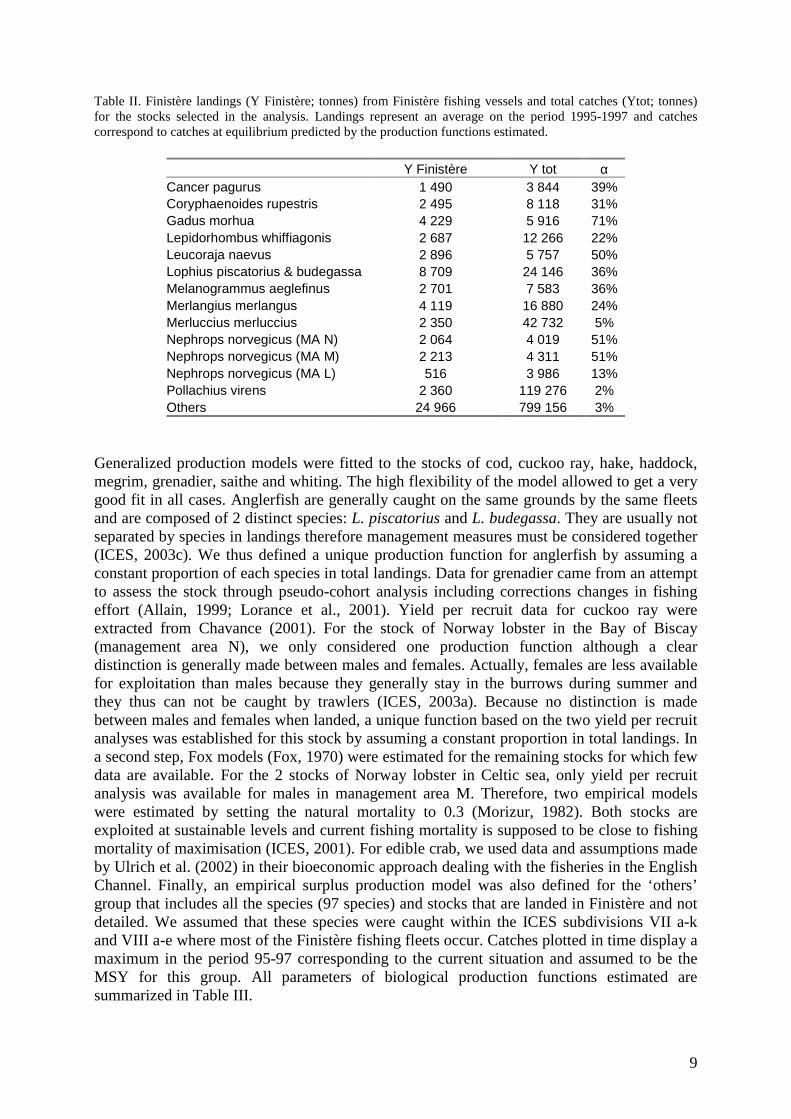
Biological production functions From the species selected in the analysis, corresponding stocks representing the majority of the geographic origin of the species landings were defined. In France, catch data per fishing boat are obtained by crossing information registered in the landing harbours (data in tonnage and value by species and commercial category) and catches declared in the European logbooks during the same period (gear, fishing effort and catches per day by statistical rectangle or ICES subdivision). All landing data are then stored in regional centres for statistical treatment (CRTS) depending on national administration. Data were available for the period 1995-97 and for the 7 maritime districts of the Finistère (Fig. 2). A database was thus compiled by including a field ‘stock’ that makes the link between species and fishing areas (statistical rectangles and ICES subdivisions) based on stock identities defined by ICES assessment working groups. This database could thus be used to extract the catch made on any stock by any Finistère fleet. This allowed to estimate the proportion of catch landed in Finistère by Finistère fishing vessels relatively to the total catches made on a given stock (Table II). The Finistère can represent a large part of total catch made on some stocks and this clearly illustrates a great dependence of the region on the state of these stocks. On the contrary, stocks distributed on a wide fishing area are generally targeted by numerous fisheries from different countries and they therefore represent a low part of Finistère landings (e.g. hake). This is also true in the case of stocks located very far from the coasts of Brittany that only concern a minority of Finistère fleets and are harvested by other fisheries.
9
Table II. Finistère landings (Y Finistère; tonnes) from Finistère fishing vessels and total catches (Ytot; tonnes) for the stocks selected in the analysis. Landings represent an average on the period 1995-1997 and catches correspond to catches at equilibrium predicted by the production functions estimated.
Y Finistère Y tot α Cancer pagurus 1 490 3 844 39% Coryphaenoides rupestris 2 495 8 118 31% Gadus morhua 4 229 5 916 71% Lepidorhombus whiffiagonis 2 687 12 266 22% Leucoraja naevus 2 896 5 757 50% Lophius piscatorius & budegassa 8 709 24 146 36% Melanogrammus aeglefinus 2 701 7 583 36% Merlangius merlangus 4 119 16 880 24% Merluccius merluccius 2 350 42 732 5% Nephrops norvegicus (MA N) 2 064 4 019 51% Nephrops norvegicus (MA M) 2 213 4 311 51% Nephrops norvegicus (MA L) 516 3 986 13% Pollachius virens 2 360 119 276 2% Others 24 966 799 156 3%
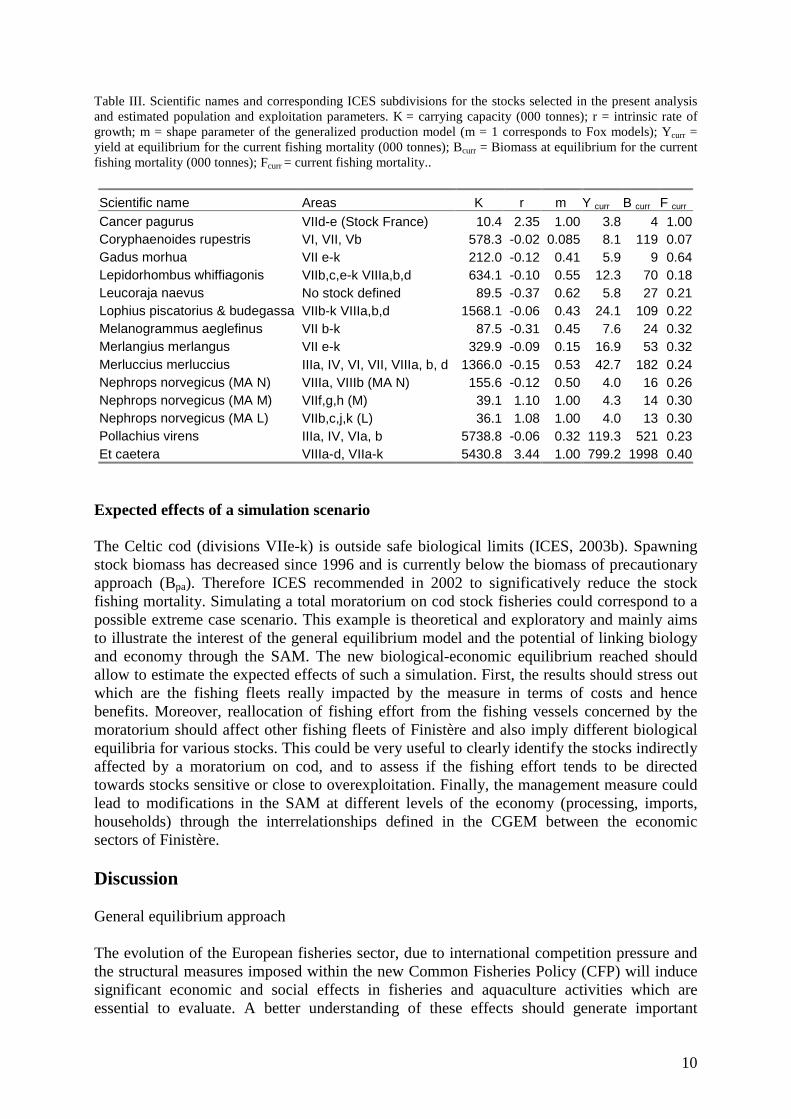
Generalized production models were fitted to the stocks of cod, cuckoo ray, hake, haddock, megrim, grenadier, saithe and whiting. The high flexibility of the model allowed to get a very good fit in all cases. Anglerfish are generally caught on the same grounds by the same fleets and are composed of 2 distinct species: L. piscatorius and L. budegassa. They are usually not separated by species in landings therefore management measures must be considered together (ICES, 2003c). We thus defined a unique production function for anglerfish by assuming a constant proportion of each species in total landings. Data for grenadier came from an attempt to assess the stock through pseudo-cohort analysis including corrections changes in fishing effort (Allain, 1999; Lorance et al., 2001). Yield per recruit data for cuckoo ray were extracted from Chavance (2001). For the stock of Norway lobster in the Bay of Biscay (management area N), we only considered one production function although a clear distinction is generally made between males and females. Actually, females are less available for exploitation than males because they generally stay in the burrows during summer and they thus can not be caught by trawlers (ICES, 2003a). Because no distinction is made between males and females when landed, a unique function based on the two yield per recruit analyses was established for this stock by assuming a constant proportion in total landings. In a second step, Fox models (Fox, 1970) were estimated for the remaining stocks for which few data are available. For the 2 stocks of Norway lobster in Celtic sea, only yield per recruit analysis was available for males in management area M. Therefore, two empirical models were estimated by setting the natural mortality to 0.3 (Morizur, 1982). Both stocks are exploited at sustainable levels and current fishing mortality is supposed to be close to fishing mortality of maximisation (ICES, 2001). For edible crab, we used data and assumptions made by Ulrich et al. (2002) in their bioeconomic approach dealing with the fisheries in the English Channel. Finally, an empirical surplus production model was also defined for the ‘others’ group that includes all the species (97 species) and stocks that are landed in Finistère and not detailed. We assumed that these species were caught within the ICES subdivisions VII a-k and VIII a-e where most of the Finistère fishing fleets occur. Catches plotted in time display a maximum in the period 95-97 corresponding to the current situation and assumed to be the MSY for this group. All parameters of biological production functions estimated are summarized in Table III.
10
Table III. Scientific names and corresponding ICES subdivisions for the stocks selected in the present analysis and estimated population and exploitation parameters. K = carrying capacity (000 tonnes); r = intrinsic rate of growth; m = shape parameter of the generalized production model (m = 1 corresponds to Fox models); Ycurr = yield at equilibrium for the current fishing mortality (000 tonnes); Bcurr = Biomass at equilibrium for the current fishing mortality (000 tonnes); Fcurr = current fishing mortality..
Scientific name Areas K r m Y curr B curr F curr Cancer pagurus VIId-e (Stock France) 10.4 2.35 1.00 3.8 4 1.00 Coryphaenoides rupestris VI, VII, Vb 578.3 -0.02 0.085 8.1 119 0.07 Gadus morhua VII e-k 212.0 -0.12 0.41 5.9 9 0.64 Lepidorhombus whiffiagonis VIIb,c,e-k VIIIa,b,d 634.1 -0.10 0.55 12.3 70 0.18 Leucoraja naevus No stock defined 89.5 -0.37 0.62 5.8 27 0.21 Lophius piscatorius & budegassa VIIb-k VIIIa,b,d 1568.1 -0.06 0.43 24.1 109 0.22 Melanogrammus aeglefinus VII b-k 87.5 -0.31 0.45 7.6 24 0.32 Merlangius merlangus VII e-k 329.9 -0.09 0.15 16.9 53 0.32 Merluccius merluccius IIIa, IV, VI, VII, VIIIa, b, d 1366.0 -0.15 0.53 42.7 182 0.24 Nephrops norvegicus (MA N) VIIIa, VIIIb (MA N) 155.6 -0.12 0.50 4.0 16 0.26 Nephrops norvegicus (MA M) VIIf,g,h (M) 39.1 1.10 1.00 4.3 14 0.30 Nephrops norvegicus (MA L) VIIb,c,j,k (L) 36.1 1.08 1.00 4.0 13 0.30 Pollachius virens IIIa, IV, VIa, b 5738.8 -0.06 0.32 119.3 521 0.23 Et caetera VIIIa-d, VIIa-k 5430.8 3.44 1.00 799.2 1998 0.40
Expected effects of a simulation scenario The Celtic cod (divisions VIIe-k) is outside safe biological limits (ICES, 2003b). Spawning stock biomass has decreased since 1996 and is currently below the biomass of precautionary approach (Bpa). Therefore ICES recommended in 2002 to significatively reduce the stock fishing mortality. Simulating a total moratorium on cod stock fisheries could correspond to a possible extreme case scenario. This example is theoretical and exploratory and mainly aims to illustrate the interest of the general equilibrium model and the potential of linking biology and economy through the SAM. The new biological-economic equilibrium reached should allow to estimate the expected effects of such a simulation. First, the results should stress out which are the fishing fleets really impacted by the measure in terms of costs and hence benefits. Moreover, reallocation of fishing effort from the fishing vessels concerned by the moratorium should affect other fishing fleets of Finistère and also imply different biological equilibria for various stocks. This could be very useful to clearly identify the stocks indirectly affected by a moratorium on cod, and to assess if the fishing effort tends to be directed towards stocks sensitive or close to overexploitation. Finally, the management measure could lead to modifications in the SAM at different levels of the economy (processing, imports, households) through the interrelationships defined in the CGEM between the economic sectors of Finistère. Discussion General equilibrium approach The evolution of the European fisheries sector, due to international competition pressure and the structural measures imposed within the new Common Fisheries Policy (CFP) will induce significant economic and social effects in fisheries and aquaculture activities which are essential to evaluate. A better understanding of these effects should generate important
11
information for policy decision in relation to the biological and bioeconomic effects of the management of the resource, but also to the economic and social effects induced at the regional level. In this perspective, the development and application of CGEM allows to draw possible consequences linked to policy decisions. It also helps to improve our vision of flows at the regional level through the data collection and SAM completion. Many previous studies of regional economic impacts of fishery used Input-Output (I-O) models (e.g. King and Shellhammer, 1982; Hushak et al., 1986). Compared to these models, CGEM provide advantages because prices are not fixed (endogenous) and the opportunity costs of factors of production can be incorporated (Houston et al., 1997). CGEM for fisheries is not a widely area of research therefore applied literature focusing on general equilibrium effect on fisheries is small. The originality of the approach lies in the explicit recognition of fish population dynamics and the strong link between biology and economics. The present study corresponds to a first step in order to assess the effects of policy analysis on regional economy through such models. Assumptions and limits First, the limits of the analysis are linked to the well-known limits inherent to the underlying restrictive assumptions of the standard economic model that permitted to construct the SAM. At this stage, the model is only a static equilibrium and deterministic model. Therefore, the approach is directed towards long-term questions, its results should be interpreted as a long-term forecast when economy and stocks will have reacted to external changes. Traditional CGE models do not deal with adjustment processes and the costs associated with them. The current development of a dynamic version of the model should eventually bring some insight on transitional situations occurring between two equilibrium states. Another important limit of the approach lies in data collection because any general equilibrium requires a substantial investment in data gathering, analysis and adjustment. Data collection for the application of the model at the regional level emphasized the discrepancy between the scale at which current statistics are generally available and the scale at which the effects of a given policy can occur. In this study, a high effort was dedicated to the data collection because the construction of a SAM is rarely conducted at this scale of interest and this matrix already consists in an important result of the analysis. Such data limitations are however not specific to CGEM and are common to any sophisticated modelling approach which requires large quantities of data. Finally, the most frequent weakness of CGEM is their lack of empirical validation, in the sense that there is no measure of the degree to which the model fits the data or tracks the historical facts. CGE models are based on parameter values estimated independently and are generally calibrated to a single data point, which is chosen to represent a situation close to general equilibrium. Because of the assumption of general equilibrium which is seldom observed in all market simultaneously, the results of the model do not pretend to forecast reality but rather indicate long-term tendencies, around which the economy will fluctuate. Therefore the model must not be seen as a relevant predictive tool but it allows to conduct comparative analyses regarding various management scenarios in order to assess their relative benefits and to output qualitative knowledge on the fishery. Biological functions All available information was used in order to define surplus production models implemented in the CGEM through equation 5. The use of a unique equation provides a good homogeneity and simplicity in terms of biological model meanwhile the two types of growth equations (i.e., Pella and Tomlinson, 1969; Fox, 1970) allowed to account for each stock specificity. The
12
biological model also includes a reactivity component that allows to make assumptions on the behaviour of fishing fleets external to Finistère and targeting similar stocks. This could be very useful when quantifying the possible effects of subsidy policies for instance, depending on whether the subsidies concern all fishing fleets or only Finistère fleets. In the same way, simulating an hypothetical increase in capital or labour of a fishing fleet will not lead to the same biological equilibrium state whether we consider or not a similar investment by the other fleets targeting the same stock. The PECHDEV project did not aim to update or carry out new stock assessments for the stocks or species considered in the analysis. Existing data showed a very heterogeneous level of quality, notably because no relevant long catch effort time series existed for non-quota species whereas a large amount of information was available for stocks assessed by ICES. In this latter case, an original approach was conducted to combine surplus production models and analytical approaches. This method allows to use the maximum of available information for stocks assessed but relies on a strong assumption of constant recruitment assumed equal to the geometric mean used in ICES working groups. This might remain adequate in the case of stocks fully exploited because recruitment is impossible to forecast and might fluctuate around a mean value, as generally assumed by deterministic stock-recruitment relationships (Beverton and Holt, 1957). This approach gives the appropriate order of magnitude for the production functions required in the CGEM and allows to visualize the maximum sustainable yield (MSY) defined for the fishing mortality of maximisation (i.e., giving the maximum yield per recruit). This hypothesis seems reasonable relatively to the other general assumptions made in the model regarding the constancy of exploitation patterns, markets, international trade,… This method might however lead to overoptimistic diagnostics in the case of stocks overexploited that can display a recruitment overexploitation. Parameters of the surplus production models could have been estimated by fitting production functions on catch and effort data time-series. However, this would have required a huge work regarding the data collect. Moreover, most of the stocks exploited in Europe have been harvested for more than a century and catch and effort data might only characterize the end of the production curve (i.e., high mortality), making difficult any model adjustment. It could be interesting to compare models parameters estimated by both methods. Some refinements of the production functions could be made through the inclusion of a possible recruitment overexploitation, leading to better define the production curve for high fishing efforts. This could be done through the use of reference fishing mortalities such as Fcrash or Flim that are currently used in ICES working groups and a direct relationship between biomass and recruitment. Empirical functions were used for all the stocks for which no information on population dynamics was available. This method required to make some strong assumptions in order to approximate the biological production functions of some fish stocks. Considering that fishing effort has slowly increased in Northwest Atlantic, we first assumed that catch time-series data approximately follow equilibrium catches. We also assumed that fishing mortality at MSY is equal to the natural mortality affecting the stock (Gulland, 1971) although Caddy and Csirke (1983) showed that this assumption does no apply in many cases, especially stocks of prey species (e.g. shrimps). Here, this method was applied to estimate the functions for Norway lobster in Celtic Sea and for the ‘others’ group. Alternative functions assuming lower mortalities at MSY could be used to estimate their possible effects on the results.
13
Policy analysis simulated A large range of policy analysis scenarios (quota, taxes, subsidies) can be simulated through CGEM compared to bioeconomic models which are mostly adapted to simulate effort measures (Ulrich et al., 2002). CGEM can notably account for possible feedback relationships between stock levels and the level of effort. From a biological point of view, simulating a moratorium on Celtic cod fisheries is conceivable because this stock is outside safe biological limits and ICES already recommended to implement recovery plans for some stocks such as the North Sea cod and northern hake. A recovery plan aims to ensure safe and rapid recovery of spawning biomass and is generally implemented through a high decrease in fishing mortality (i.e. effort). Here, the moratorium corresponds to an extreme scenario where the fishing effort is reduced of 100%. Such moratoria were implemented in the past and are based on the assumption that fish stocks can recover from high depletion when fishing pressure is reduced, a general pattern observed at the community level (Myers and Worm, in press). Technical aspects can however limit the implementation of a moratorium on a given fishery. Notably, cod in divisions VIIe-k are taken in mixed trawl fisheries and this can question the relevance of the scenario simulated. However, analysis of landings for the French gadoid trawler for the period 1996-1999 showed that cod and whiting were mixed on a trip basis but fishermen were able to well separate the species on a haul basis (ICES, 2003a). From an economic point of view, the temporary closure of a fishery can lead to disruptions in fishing and port-related activities and hence on the organisation of the fishing sector. The closure of the North Sea herring fishery in the late 1970s led to important changes in the structure of both processing and consumption patterns. Once the fishery was re-opened in 1982, substantial permanent changes had occurred following a supposedly temporary management. Again, the scenario simulated must be seen as exploratory and illustrative of the interest of the approach and not as a prospective analysis of a future policy of the European commission. The reform of the Common Fisheries Policy (CFP) will probably induce major changes in the fisheries sectors in the forthcoming years. Notably, the new CFP should progressively decrease the subsidies granted to the European fleets in order to match fishing capacity to fishing possibilities and decrease the persistent overcapacity of the fleet. At the same time, some public aids will be maintained so as to improve security and working conditions on board. This will have important consequences on the investment, labour and employment levels and global economic activities of the fishing regions. Therefore, various simulation scenarios of policy can be investigated through the CGEM to better understand the possible effects of the new CFP. Simulations carried out could also be useful to quantify the social impacts that some policy decisions can generate. However, social impact in fisheries management literature is generally centred on effects on employment and income and should be extended at others levels such as fishing unit, family units, communities… (Rey and Cunningham, unpublished). Therefore, many social questions raised by the new CFP will not be tackled by a unique model, even if it includes a maximum of complexity, and further work is needed to fully understand the social impact of this reform. Conclusion and perspectives Quantifying the expected effects of policy analysis at the regional level appears as an essential issue often raised by stakeholders and policy makers. The evaluation of these effects is a key element for the success of the measures themselves, and one possible promising approach lies in the development of complex models that define a clear link between biology and economics. However, such models are “data hungry” and the development of the CGEM for
14
the Finistère case emphasized the large discrepancy between the need to assess the impact of European reforms at the local or regional level, and the difficulty to collect and standardize data available at these levels. Encouraging the implementation of appropriate and accurate systems of data collection should eventually help for a better adjustment of the CPF to the economic and social objectives which are targeted. Acknowledgments We thank Georges Le Lec from the Regional Economic Observatory of Maritime Fishing of Brittany (OERPMB) as well as David Martineau from INSEE Nantes for their documentary help. We also thank Jérôme Guitton from Agrocampus Rennes for helpful assistance in database processing and mapping tools.
15
References Allain, V. 1999. Ecologie, biologie et exploitation des populations de poissons profonds de l'Atlantique du Nord-
Est. Thèse de doctorat de l'Université de Bretagne Occidentale. Spécialité Océanologie biologique. Bernard P. (2003), Computable General Equilibrium Model Applied to Fishery Sector, Pechdev project Working
paper No. 4. Beverton, R.J.H. and Holt, S.J. 1957. On the dynamics of exploited fish populations. Chapman and Hall,
London, 533p. Caddy, J.F. and Csirke, J. 1983. Approximations to sustainable yield for exploited and unexploited stocks.
Océanographie.tropicale 18: 3-15. Chavance, N. P. 2001. Analyse de l'exploitation et évaluation du stock de raie fleurie (Raja naevus) en Mer
Celtique et dans le Golfe de Gascogne, Mémoire de fins d’études, CESA, ENSAR, 36p Dervis, K., de Melo, J., and Robinson, S. 1982. General equilibrium models for development policy. Cambridge
University Press, New York. Fox, W.W.Jr. 1970. An exponential surplus yield model for optimizing exploited fish populations. Transactions
of the American Fisheries Society 99 (1): 80-88. Garcia, S.M., Sparre, P., and Csirke, J. 1989. Estimating surplus production and maximum sustainable yield
from biomass data when catch and effort time series are not available. Fisheries Research 8: 13-23. Gulland, J.A. 1971. The fish resources of the ocean. Fishing News Books, England, 255p. Harberger, A.C. 1962. The Incidence of the Corporation Income Tax. Journal of Political Economy 70: 215-240. Houston, L., Johnson, R., Radtke, H., Walters, E., and Gates, J. 1997. The economic impacts of reduced marine
harvests on regional economics. Working paper. Hushak, L.J., Morse, G., and Apraku, K. 1986. Regional impacts of fishery allocation to sport and commercial
interests: a case study of Ohio's portion of Lake Erie. North American Journal of Fisheries Management 6: 472-480.
ICES 2001. Report of the Working Group on Nephrops Stocks. ICES CM 2001/ACFM:16. ICES 2003a. Report of the Working Group on Nephrops Stocks. ICES CM 2003/ACFM:18. ICES 2003b. Report of the Working Group on the Assessment of Southern Shelf Demersal Stocks. ICES CM
2003/ACFM:03. ICES 2003c. Report of the Working Group on the Assessment of Southern Stocks of Hake, Monk, and Megrim.
ICES CM 2003/ACFM:01. ICES 2002. Report of the Working Group on the Biology and Assessment of Deep-Sea Fisheries Resources.
ICES CM 2002/ACFM:16. King, D.M. and Shellhammer, K.L. 1982. The California interindustry fisheries (CIF) model: an input-ouput
analysis of California fisheries and seafood industries. Vol. II, Working Paper No. P-T-6. Center for Marine Studies, San Diego State University, California.
Lorance, P., Dupouy, H., and Allain, V. 2001. Assessement of the roundnose grenadier (Coryphaenoides rupestris) stock in the Rockall Trough and neighbouring areas (ICES Subareas V-VII). Fisheries Research 51 (2-3): 151-163.
Malvarosa, L. and D. Pinello. 2004. A social accounting matrix for local fishery assessment (LF-SAM). XVIth EAFE Conference Proceedings, Rome April 2004.
MegaPesca 2000. Regional socio-economic studies on employment and the level of dependency on fishing. Lot No23: Coordination and consolidation study. DG Fisheries European Commission.
Morizur, Y. 1982. Estimation de la mortalité pour quelques stocks de langoustine, Nephrops Norvegicus (L.). ICES, Doc. Shellfish Comm., CM 1982/K:10 (mimeo).
Myers, R.A. and Worm, B. In press. Extinction, survival, or recovery of large predatory fishes. Proceedings of the Royal Society of London.
Pella, J.J. and Tomlinson, P.K. 1969. A Generalized Stock Production Model. Bull. Inter. Am. Trop. Tuna. Com 13: 420-496.
Rey, H. and Cunningham, S. Unpublished. Evaluation of the social impact of fishery management measures. Discussion paper.
Shoven, B.J. and Whalley, J. 1992. Applying general equilibrium. Cambridge University Press, Cambridge. Ulrich, C., Le Gallic, B., Dunn, M.R., and Gascuel, D. 2002. A multi-species multi-fleet bioeconomic simulation
model for the English Channel artisanal fisheries. Fisheries Research 58: 379-401. Walras, L. 1954. Theory of pure economics. George Allen & Unwin, London.
16
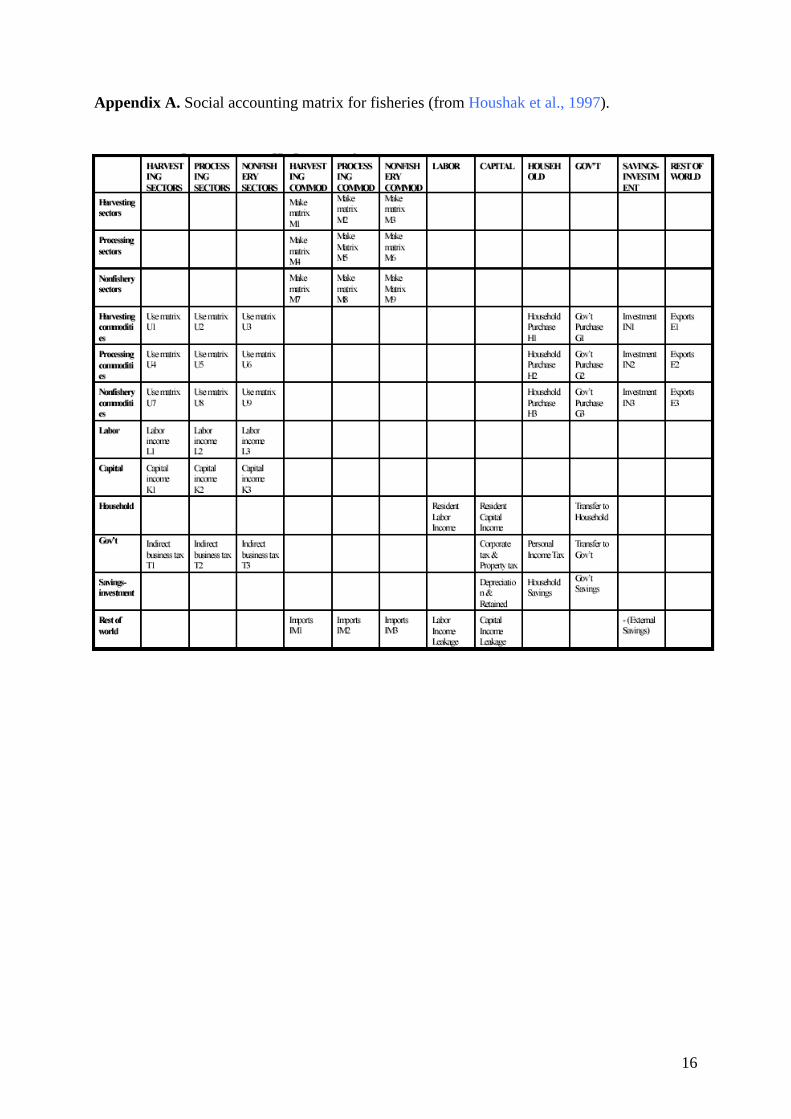
Appendix A. Social accounting matrix for fisheries (from Houshak et al., 1997).
17
Appendix B. Variables and equations used in the computable general equilibrium model.
18
Variables and equations used in the computable general equilibrium model (continued).
19
Appendix C. Value landed (in thousands of euros) in and outside Finistère by Finistère vessels. The landings are an average for the years 1995-97.
Atlantic cod (V
II e-k)
Haddock (V
II b-k)
Anglerfish (V
IIb-k VIIIa,b,d)
Megrim
(VIIb,c,e-k V
IIIa,b,d)
Hake (IIIa, IV
, VI, V
II, VIIIa,b,d)
Whiting (V
II e-k)
Saithe (IIIa, IV
, VIa,b)
Norw
ay lobster (MA
L)
Norw
ay lobster (MA
M)
Norw
ay lobster (MA
N)
Grenadier (V
I, VII, V
b)
Cuckoo ray
Edible crab (V
IId,e)
Others
Landings outside Finistère
North Small Fishing 12.4 0.0 1290.4 0.0 3.3 4.1 0.0 0.0 0.0 5.5 0.0 7.5 209.4 3140.0 344.1North Coastal Fishing 18.1 1.3 1590.0 0.4 15.4 0.9 0.0 0.0 0.0 0.0 0.0 10.9 284.3 2228.0 443.2North Off-shore Fishing 264.5 51.3 716.3 119.0 234.3 128.8 0.0 0.0 362.2 0.0 0.0 19.7 2209.7 5346.7 360.8South Small Fishing 2.8 0.1 2886.2 872.1 3281.0 13.4 0.0 0.0 4.1 10963.2 0.0 223.2 8.4 16798.5 903.0South Coastal Fishing 143.4 17.6 4360.0 1327.6 1503.6 70.1 0.0 111.3 693.9 3239.8 0.0 670.8 0.3 4764.7 613.7South Off-shore Fishing 7435.3 2714.1 20721.6 5561.6 1050.5 4647.0 2009.7 2977.4 11992.9 262.0 2849.8 3424.0 0.0 39362.3 555.9
20
Appendix D. Navigation titles in France.
� “Small fishing” (SF) is defined as the
fishing activity practiced by any boat being at sea for less than 24 hours
� “Coastal fishing” (CF) is defined as the fishing activity practiced by any boat being at sea for a period shorter than 96 hours but longer than 24 hours
� “Off-shore fishing” (OF) is defined as the fishing activity practiced by boats generally at sea for a period longer than 96 hours and not corresponding to a “High-sea fishing” activity
� “High-sea fishing” (HSF) is defined as the fishing activity by any boat having a tonnage higher than 1000 TJB or having a tonnage higher than 150 TJB and being at sea for more than 20 days.


![Meeting Notes 2002-06-13 [Part A] - COnnecting REpositories · 2017. 4. 29. · Dick Feeney Alice Rouyer Beth Wemple Thayer Rorabaugh Dean Lookingbill John Rist John Gil lam Ron Papsdorf](https://img.pdfslide.us/doc/110x75/61123ba6bd6b9e16975146e5/meeting-notes-2002-06-13-part-a-connecting-repositories-2017-4-29-dick.jpg)


![Welcome [halieutique.agrocampus-ouest.fr]halieutique.agrocampus-ouest.fr/pdf/3775.pdf · Welcome to the first edition of the GIFS newsletter. GIFS is an exciting ... Dr Tim Acott,](https://img.pdfslide.us/doc/110x75/5b9973bb09d3f29c338c55a5/welcome-welcome-to-the-first-edition-of-the-gifs-newsletter-gifs-is-an.jpg)