Embed Size (px)
Citation preview
VOLUME 42, +UMBER 2 PHYSICAL REVIEW LETTERS 8 JANUARY 1979
Dynamics of Photoexcited GaAs Band-Edge Absorption with Subpicosecond Resolution
C. V. Shank, R. L. Fork, R. F. Leheny, and Jagdeep ShahBell TelePhone Laboratories, Holmdel, Ne~ Jersey 07733
(Received 6 June 1978)
Time-resolved measurements of optically induced charges in the near —band-gap trans-mission spectrum of GaAs at 80'K, following excitation with an ultrashort laser pulse,provide a means of directly monitoring the hot-carrier distribution as it cools to the lat-tice temperature with a time constant of 4 psec. Exciton screenirg and band-gap renor-malization are observed to occur in less than 0.5 psec,
Measurements of the time-resolved absorptionspectrum in GaAs provide a unique means fordirectly observing the dynamics of an opticallyexcited hot-carrier distribution as well as the in-fluence of these carriers on exciton screeningand renormalization of the band gap. PreviouslyShah, Leheny, and Wiegman' studied the inQu-ence of photoexcited carriers on the thermalizedabsorption spectrum of GaAs. Indirect measure-ments of hot-carrier energy relaxation rates us-ing microwave' and optical techniques' ' havealso been reported. In the present work we di-rectly observe the hot-carrier distribution as itrelaxes to the lattice temperature with a timeconstant of 4 psec and show that exciton screen-and band-gap renormalization occur in less than0.5 psec. It has been possible to measure theseprocesses as a result of newly developed subpico-second optical techniques. '
Absorption of photons with h v & E~ generatescarriers with significant excess energy which re-lax to the band edge primarily by LO-phononemission. ' For GaAs this is an extremely rapidprocess and photoexcited carriers generated afew tenths of an eV above the band edge are ex-pected to relax to within an LO-phonon energy(8~ =37 meV) of the band edge in less than a fewtenths of a picosecond. Simultaneously, carrier-carrier scattering redistributes energy amongthe carriers and leads to a carrier distributiondescribed by an effective temperature higher thanthe lattice temperature for sufficiently high car-rier density. ' By observing the time evolution ofthe transmission spectrum, the cooling rate forthese carriers can be determined.
The capability of making spectral measurementswith subpicosecond time resolution is the resultof recent advances in subpicosecond optical-pulse generation. Subpicosecond pulses (0.5psec) from a passively mode-locked dye laseroperated at 6150 A were cavity dumped at a 10-Hz rate. These pulses were amplified with a dyeamplifier pumped by the frequency-doubled out-
put of a Nd: YA1G (neodimium-doped yttrium alu-minum garnet) laser to powers of 200 MW. Theoutput of the amplifier was divided to form twoseparate beams. The first beam was used topump the sample after passing through a varia-ble optical delay line driven by a stepper motorand then focused into a quartz cell containingethanol which generated a Raman-shifted pulseat 7500 A. The output was focused onto a 140-pm-diam spot on the sample at an energy densityof 3 pJ/cm'. The second beam was focused intoa cell containing water, generating a broadbandsubpicosecond continuum' which was used, toprobe the sample. Filters were used to selectthe spectral region of interest (7850-8350 A) andto attenuate the beam to an energy density belowthat which altered the optical properties of thesample (5 && 10 ' J/cm2). The probe pulses wereimaged through the region of the sample excitedby the pump pulses and onto the slits of a spec-trometer. The spectrum transmitted by the spec-trometer was detected by an optical multichannelanalyzer (OMA) [Fig. 1(c)]. Transmission spec-tra were taken by averaging 300 pulses in theOMA for various delays between the pump andprobe pulses. The transmission at selected wave-lengths was also measured as a continuous func-tion of the delay between pump and probe pulses.This was accomplished by driving the variableoptical delay path with a stepper motor while re-cording the signal from a single channel of theOMA in a signal averager.
The sample consisted of a molecular-beam-grown layer of GaAs (1.5 pm thick) supported bytwo layers of Ala»Gao „As (2&m thick) whichwere transparent to both pump and probe wave-lengths. The sample, mounted on a cold fingerwhich was in contact with liquid N2, was main-tained at a temperature of - 80'K.
The near-band-edge transmission spectra ofthe GaAs sample prior to optical pumping isshown in the trace for 7 & 0 in Fig. 1(a)~ Thespectra in Fig. 1 have been corrected for the
112 1979 The American Physical Society
VOLUME 42, NUMBER 2 P HYSICAI. RKVIK%' I, KTTKRS 8 JaNUaav 1979
{a)
1.0—
T&P T =1psee
I I
7900I I I
8100 8500 7900 8100
WAVELENGTH
EX Eg + 1LO EXI I I ~ I I I
8500 7900 8100 8300
pcoNT. - OMA
SAMPLE
(c) (b)
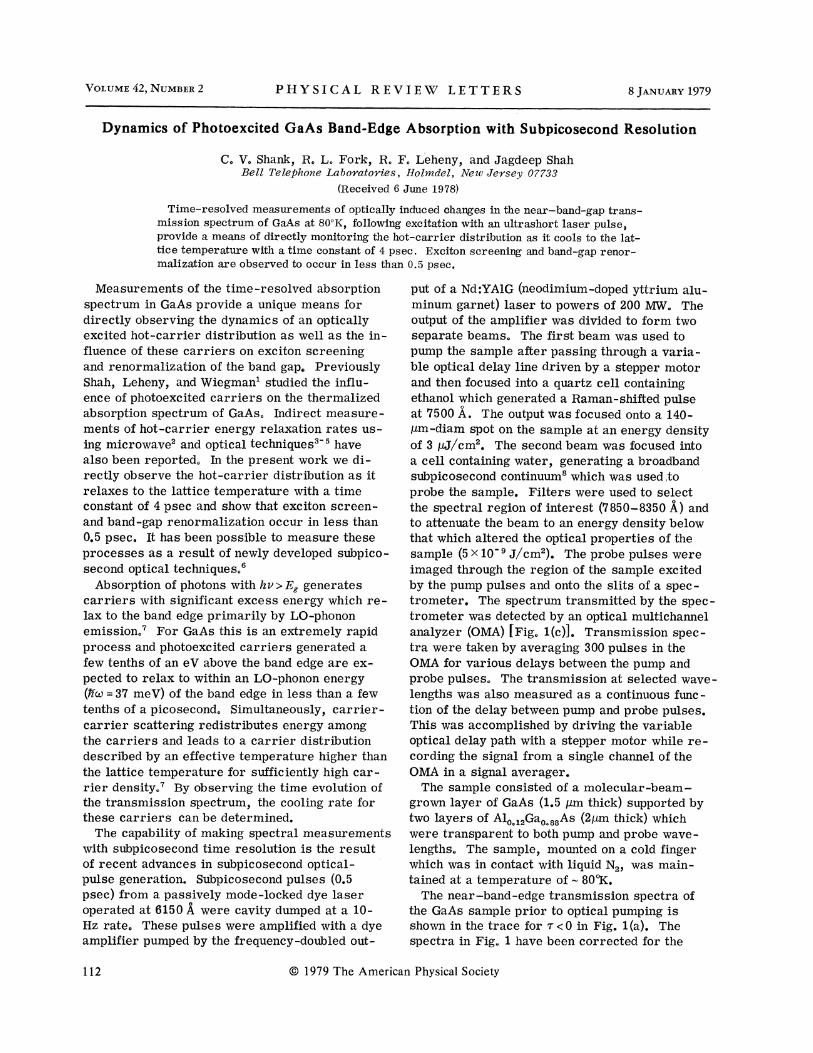
FIG. 1. (a) Transmission spectra corrected for wavelength variation of probe beam and OMA detector response.Spectra were recorded over a range of delay times between the pump and probe beams. (b) Difference spectrashowing the difference bebveen spectra obtained after a fixed delay and the spectra obtained for 7 &0. These spectrawere obtained by electronically subtracting the data stored in two memories of the multichannel analyzer. (c) Sche-matic of experiment. The OMA consisted of a spectrometer and an intensified silicon vidicon with multichannelsign31 averager.
spectral variation of the detector and probe beamand are believed to be accurate to + 10 percentover the 85-meV range of the measurement.The sharp dip in transmission near 8200 A, dueto the free-exciton absorption, is clearly re-solved. The uniform absorption extending toshorter wavelengths results from band-to-bandtransitions and at longer wavelengths the sampleis essentially transparent. Perturbed spectra[Fig. 1(a)] and difference spectra [Fig. 1(b)] areshown for delays of 1 and 12 psec following theexcitation pulse. The difference spectra are ob-tained by electronically subtracting the unper-turbed from the perturbed transmission spectra.These spectra more clearly illustrate the changein transmission.
A number of features are evident upon examina-tion of these results. For the probe delayed 1psec with respect to the pump [Fig. 1(a)], thesharp exciton resonance absorption has virtuallydisappeared. We attribute this change to ascreening of the exciton by the photoexcited car-riers. "' ln addition, the absorption edge hasshifted to an energy just below the unperturbed
free-exciton energy, consistent with a renormal-ization of the band gap due to exchange and cor-relation effects between the carriers. " For acarrier density of n = 10'7 cm ', the band-edgeshift due to these effects is expected to be 12meV at low temperature' and may be less at high-er temperatures. The difference spectrum illus-trates these screening and renormalization ef-fects, showing an increase in transmission at theexciton energy and a decrease at lower energy.For longer delays, the carriers lose additionalenergy and relax to states near the band edge.This results in a decrease in absorption at theband edge due to band-filling effects. This is il-lustrated in the trace for 12 psec where there isa significant change in transmission up to 20meV above the unperturbed gap. Again, the dif-ference spectrum provides a clear illustrationof these effects. We have calculated the expectedtransmission spectrum for an equilibrium dis-tribution of 10'7-cm ' carriers at 80'K includinga 12-meV shift in the band gap and show the re-sultant spectrum as the dotted curve in Fig. 1(a).
A complementary picutre of the dynamical
I13
VOLUME 42, NUMBER 2 PHYSICAL. REVIEW LETTERS 8 JANUARY 1979
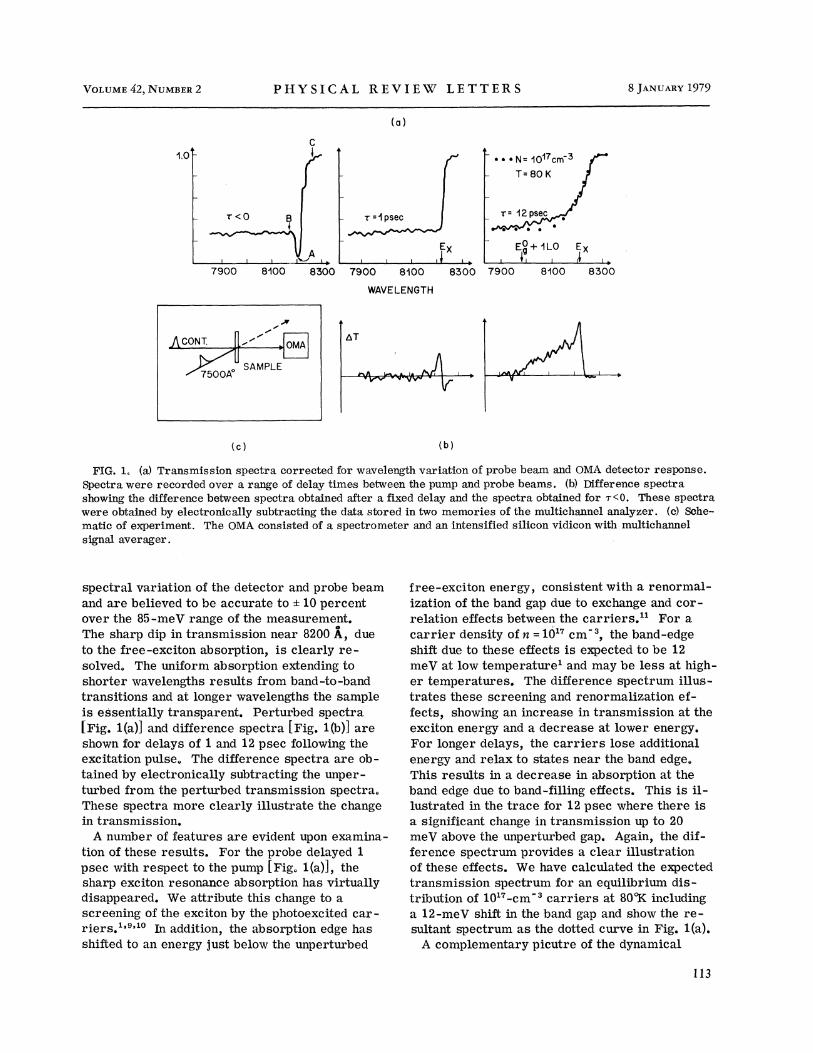
processes is obtained by scanning the time delayfor a fixed wavelength. Continuous traces of thechange in transmission with time are shown inFig. 2. These traces were measured at the wave-lengths labeled A, B, and C in Fig. 1(a). For A,corresponding to the free-exciton energy, thetrace exhibits an initial rapid increase as the ex-citon is screened within the time resolution ofthe experiment (0.5 psec), and a more gradual in-crease as the carriers come into equilibriumwith the lattice. We expect carrier screening tooccur in a time on the order of the inverse car-rier plasmon frequency (a few tenths of a pico-second for n = 10'~ cm ~) in agreement with ourobservation. At C, corresponding to the long-wavelength side of the free exciton, there is aninitial fast decrease followed by a slow increase.We attribute these changes to the band-gap re-normalization followed by band filling as the car-riers relax. At B, on the short-wavelength sideof the free exciton, band-gap renormalizationdoes not affect the density of states significantly.We therefore attribute the relatively slow in-crease in transmission to the effects of band fill-ing.
The time constant associated with the band-fill-ing effects can be related directly to the carrier-energy relaxation. Initially the photoexicted car-riers occupy states approximately 3 LO-phononenergies (8'~~=3V meV) above the band edge.For carrier densities typical of our experimentalconditions (n- 10"cm '), carrier-carrier inter-actions can thermalize the carrier distribution in
KOCOCf)
COK!KI-
-2 0 2 4 6 8 10 l2 14TIME {psec)
FIG. 2. Transmission at a fixed wavelength as a func-tion of delay time. The three traces correspond to thewavelengths indicated in the ~ &0 trace of Fig. 1(a) andrepresent detailed time evolution at the three charac-teristic energies as described in the text.
a time short compared to our measurement time.Simultaneously LO-phonon emission by carriersoccurs. As a result, at 1-psec delay, the carri-er distribution corresponds to a thermalized dis-tribution such that the average carrier energy isa significant fraction of the initial excess energy.The thermalized carrier distribution continues tocool to the lattice temperature by further interac-tions of the carriers with the lattice, with carri-er-carrier interactions maintaining a well-de-fined carrier temperature. For the case of GaAswith carrier temperatures 8 40'K, LO-phononemission by the fraction of carriers with energygreater than @(d«dominates this cooling, andthe rate of cooling by this mechanism is givenfor QaAs7 by dE/dt = 10 7 [exp(xo —x,)- 1]/[exp(x, )—1] J/sec, where x; =kelso/kT, with T, the elec-tron (e) or lattice (0) temperature. The rate de-pends on the carrier temperature, but can be nu-merically integrated to determine the time re-quired to cool from one temperature to another.We have calculated the time required to cool thecarrier distribution for GaAs for our experi-mental condition to be 3 psec, in good agreementwith the 4-psec time constant observed for theslow rise in the transmission.
In summary, time-resolved measurements ofthe absorption spectrum following injection ofoptically excited hot carriers have revealed thatscreening of the free exciton and a shift in theband edge occur in less than 0.5 psec. In addi-tion, the hot-carrier distribution approaches thelattice temperature with a time constant of ap-proximately 4 psec. A study of the temperaturedependence of the carrier equilibration rate iscontemplated for future work.
The authors acknowledge the assistance ofH. Dingle in obtaining samples and discussionswith T. M. Rice.
'J. Shah, R. F. Leheny, and W. Wiegmann, Phys.Rev. 8 15, 1577 (1977).
2K. Seeger, in Electronic Materials, edited by N. B.Hannay and U. Colombo (Plenum, New York, 1973),Chap. 5.
3C. V. Shank, D. H. Auston, E. P. Ippen, and O. Teseh-ke, to be published; D. H. Auston, S. McAfee, C. V.Shank, E. P. Ippen, and O. Teschke, Solid State Elec-tron. 21, 147 (1978}.
4R. Q. Ulbrich, Phys. Rev. 8 8, 5719 (1973).'R. Q. Ulbrich, Solid State Electron. 21, 51 (1978).E. P. Ippen and C. V. Shank, in ToPics in APP/ied
Physics, edited by S. L. Shapiro (Springer-Verlag,
114
VOLUME 42, NUMBER 2 PHYSICAL REVIEW LETTERS 8 JANUARY 1979
New York, 1977}, Vol. 18, p. 83.YJ. Shah, Solid State Electron. 21, 43 (1978).See chapter by D. H. Auston, in Topics in Applied
Physics, edited by S. L. Shapiro (Springer-Verlag,New York, 1977), Vol. 18.
J. G. Gay, Phys. Rev. B 4, 2567 {1971).
' J. D. Dow, in Proceedings of the Tceelfth International Conference on the Physics of Semiconductors,edited by M. H. Pilkuhn (B. G. Teubner, Stuttgart,1974), p. 957."W. F. Brinkman and T. M. Rice, Phys. Rev. B 7,
«508 (1973).
Electronic and Spin Structure of UTe
M. Erbudak
J. Keuer&'~-Institut fur Theoxetische Physik, Eidgenossische Technische Hochschule, 8093 Zunch, Sxoitzexland
(Received 18 September 1978)
A self-consistent cellular multiple-scattering technique is used to calculate the densityof states of uranium telluride. The 5f band is found to be highly polarized and energeti-cally localized although presenting enough itinerant character to keep its position at theFermi level. The material shows a coupling between the 5f and Gd states. This interac-tion explains the observed negative spin polarization from photoelectrons up to 7 eV abovethe photothreshold.
Negative spin polarization of photoemitted e1.ec-trons from magnetic materials, i.e. , with elec-tron magnetic moments antiparallel to the bulkmagnetization and the externally applied field,has been of considerable interest. It was ob-served in ferromagnetic nickel' where it is com-patible with both the atomic model of a more-than-half-full shell as well as with the band mod-el in the case of nearly full bands. The occur-rence of negative electron spin polarization (ESP)is restricted to within a spectral range of 80meV from the Fermi level (EF),' which is the or-der of the smallest Stoner excitation in ferro-magnetic nickel. For ferrimagnetic magnetite,Fe304, the negative ESP w as obs erved also in asmall energy range within EF. It has been ex-plained by the model of single ion in a crystalfield, originating from Fe'+ ions in octahedralsublattices which are coupled antiferromagnetic-ally to the rest of the crystal. ' Hence, it is astructural property. Recently, the measure-ments of ESP from ferromagnetic UTe haveshown a negative polarization throughout a spec-trum of 7 eV below EF.' The first attempts tointerprete this observation assumed that the 6d-electron magnetic moments were antiparallel tothe crystal magnetization with the 5f 's not beingobserved at low photon energies (hv &11.0 eV)due to vanishing matrix elements. Here, we re-
port a theoretical analysis based on a self-con-sistent cellular multiple- scattering technique.As a major result, it was found that it is not thenature of the 6d electronic states alone whichare responsible for the observed negative ESP,but the 5f resonances located near EF influenc-ing the 6d-electron density of states (d-DOS) infavor of the minority spins and thus creating atrough in the d-DOS of the majorities near photo-threshold. By virtue of this f -d interaction, theobserved ESP is negative, since, as stated earl-ier, the 5f electrons' contribution to the mea-sured spectra can be taken as negligible.
Usually, the highly localized f-level eigen-values show a large dependence on occupation.It is necessary to study f-band materials withmethods which can treat localized or itinerantlevels on equal footing. The method should alsobe practical for performing a large number ofcalculations with different assumed configura-tions in order to find self-consistently the occu-pation of the different bands. A self-consistentcellular one-electron-Green's- function techniquefor a finite cluster in condensed-matter-1. ikeboundary conditions presents these character-istics. 4
In the multiple-scattering calculation the localdensity of states for the atomic species i at en-ergy E is given by the integration over the cell
1979 The American Physical Society 115