Embed Size (px)
Citation preview

Working Papers
N°5 - September 2017
Ministry of Economy and Finance
Department of the Treasury
Dynamics of net foreign asset
components in the EMU
Tatiana Cesaroni, Roberta De Santis
ISSN 1972-411X

Working Papers
The working paper series promotes the dissemination of economic research produced in the Department of the Treasury (DT) of the Italian Ministry of Economy and Finance (MEF) or presented by external economists on the occasion of seminars organized by MEF on topics of institutional interest to the DT, with the aim of stimulating comments and suggestions. The views expressed in the working papers are those of the authors and do not necessarily reflect those of the MEF and the DT.
Copyright: © 2017, Tatiana Cesaroni, Roberta De Santis. The document can be downloaded from the Website www.dt.tesoro.it and freely used, providing that its source and author(s) are quoted.
Editorial Board: Riccardo Barbieri Hermitte, Mauro Marè, Libero Monteforte, Francesco Nucci
Organizational coordination: Cristina Gambini

3
Dynamics of net foreign asset components in the EMU1
Tatiana Cesaroni (*) and Roberta De Santis (**)
Abstract
In the last two decades, foreign capital investments have followed different paths in EMU countries. Given their importance for growth and productivity, we analyse the factors underlying the dynamics of foreign direct investments, portfolio debt investments, and portfolio equity investments in EMU countries over the years 1996-2014. We assess how the heterogeneous behavior between core and peripheral countries can be related to macroeconomic factors (business cycle, trade, financial openness and spreads) and institutional quality. Our results show that financial integration as well as interest rates spread had an impact on the main components of foreign assets which was different between core and peripheral countries. In EMU countries as a whole we find a statistical significant relationship between institutional quality and foreign capital components, which is entirely driven by core countries.
JEL Classification: F3, F4.
Keywords: Net international investment positions, PEI, FDI and PDI, Institutional quality, Euro area.
(*) Senior Economist, Banca d’Italia, Via Nazionale 91, 00185, Rome, Italy and Luiss Guido Carli. E-mail: [email protected]
(**) Senior Economist, Istat, Via Balbo 4, 00185, Rome, Italy, and Treasury Dep. MEF, Via XX Settembre 96, Rome, Italy and Luiss Guido Carli. E-mail: [email protected] 1 Thanks are due to Gian Maria Milesi Ferretti for providing us with the External Wealth of the Nations dataset, and to Andrea Brandolini, Riccardo De Bonis, Alfonso Rosolia, Roberto Tedeschi, Ottavio Ricchi, Piero Esposito, Marco Ventura, Francesco Nucci, Riccardo Barbieri Hermitte and an anonymous referee for many valuable suggestions.

4
CONTENTS
1 INTRODUCTION ................................................................................................................... 5
2 THE COMPOSITION OF INTERNATIONAL HOLDINGS AND INSTITUTIONAL QUALITY IN EMU COUNTRIES BEFORE AND AFTER EMU ............................................................. 7
3 EMPIRICAL STRATEGY .................................................................................................... 13
4 ESTIMATES RESULTS ...................................................................................................... 16
5 ROBUSTNESS TO INTRODUCING DIFFERENT CONTROL VARIABLES IN THE MODEL: THE ROLE OF INSTITUTIONAL QUALITY IN CORE AND PERIPHERAL COUNTRIES ........................................................................................................................ 19
6 CONCLUSIONS .................................................................................................................. 23
REFERENCES ............................................................................................................................ 24
APPENDIX .................................................................................................................................. 27

5
1 INTRODUCTION
The role of international capital transactions during the financial and sovereign debt crises in the EU has encouraged policy discussions on costs and benefits of capital mobility. International capital transactions can potentially support long-term growth, but at the same time they might create policy challenges associated with the adverse consequences of exchange-rate appreciation, asymmetric shocks among countries, sudden stops and moral hazard (Kirabaeva and Razin, 2009; De Gregorio, 2013).
Given the importance of foreign capitals composition for long-term growth, this paper focuses on the behaviour of three main international transactions components: Foreign Direct Investment (FDI2), Portfolio Debt Investment (PDI) and Portfolio Equity Investment (PEI) for a set of EMU countries over the years 1996-2014.
The literature on advanced economies yields a preferential order of capital components, in increasing order of riskiness and economic performance: FDI, PEI and PDI. FDI is considered to be more stable and growth-friendly and less prone to reversals (Wei, 2002; Albuquerque, 2003), while portfolio debt investment generates the greatest risk from financial openness. Furceri et al. (2011) find that for OECD countries large capital inflows that are debt driven significantly increase the probability of banking, currency, and balance of payments crises, whereas inflows that are driven by PEI or FDI have a negligible effect.
Similarly, Ahrend and Goujard (2012) find that, from 1970 to 2009 for 184 developed and emerging economies, bias in external liabilities towards debt greatly increases the risk of a systemic banking crisis. Benhima (2013) and MacDonald (2015) develop theoretical models of the role of investment risk and portfolio composition in generating the negative correlation between productivity growth and net capital inflows, especially in the case of portfolio debt investment. By contrast, in a study using a large panel of advanced, emerging and developing countries in 1970-2003, equity appears to be more stable than PDI, especially in times of financial turbulence (Levchenko and Mauro, 2006). A large share of equity in total external liabilities is also generally considered to improve a country’s ability to share risk with international investors and to counterbalance external shocks (Rogoff, 1999). Indeed, equity-type instruments, including FDI, offer greater potential for international risk sharing because the return on equity (and FDI) tends to be pro-cyclical: the return to foreign investors diminishes when the economy is in recession/stagnation and increases during a boom.3
According to the literature, the composition of foreign capital in a country depends on the latter’s economic characteristics, macroeconomic fundamentals, financial regulatory settings and institutional quality.
Faria et al. (2007), using cross-sectional data for a large sample of advanced and emerging countries, find that larger economies with a better institutional quality score have a larger share 2 The IMF classifies an investment as direct if a foreign investor holds at least 10% of a local firm’s equity while the remaining equity purchases are classified as portfolio equity investment. FDIs are both debt and equity investments. PDIs are portfolio debt investments plus other investments. PEIs are portfolio equity investments. 3 Unlike international debt flows, whose fixed interest rate is independent of the return earned in the investment project, FDI and PEI are forms of risk sharing between domestic borrowers and foreign creditors. They confer part of the risk on foreign creditors as their returns are cyclical. This feature makes them more attractive to borrowers.
6
of portfolio equity and foreign direct investment in external liabilities. These authors find that shifts in the equity share over time can be linked to the degree of financial reform undertaken. Hale (2007) shows that the funding composition of debt is affected by macro-financial fundamentals. A riskier aggregate external profile (i.e. low sovereign credit rating, higher real exchange rate, or history of debt restructuring) bias the composition of external debt issuance towards speculative-grade bonds.
Institutional quality may play a role in influencing foreign capital components in advanced countries as well (see Portes and Rey, 2005;4 Faria et al., 2007 and Lane, 2008; Buchanan, 2014). In this regard the literature shows that a better institutional quality affects both PEI and FDI positively. For PEI, better institutional quality produces less informational friction and better transaction technology in the domestic stock market, thus increasing capital inflows but also in the advanced countries fostering investments abroad as suggested by Ferrucci et al. (2004) and Kiminori (2014). For FDI, a better institutional quality may, in theory, attract more capital flows, but the empirical literature provides mixed results. Concerning PDI, the evidence is inconclusive.
Given the differentiated importance of the net foreign asset components (namely FDI, PDI end PEI) for growth and productivity, in this paper we analyse their determinants in EMU countries over the years 1996-2014.
We focus on the different role of macroeconomic factors (i.e. business cycle, , spreads, financial and trade openness, real effective exchange rate) and institutional quality indicators in explaining net foreign assets dynamics in the EMU countries as whole as well as in core and peripheral ones.5
We contribute to the existing literature in two ways: i) we study the determinants of net foreign assets components in EMU countries, focusing on the role of institutional quality for a long period 1996-2014; ii) we examine the evolution of the main components of the net international investment position considering core and peripheral countries. The paper is organized as follows. Section 2 reports the main stylized facts on net foreign assets components and on institutional quality within the EMU. Section 3 describes our dataset and our empirical strategy. Section 4 presents the econometric results, while Section 5 reports robustness checks. Conclusions follow.
4 Portes and Rey (2005) find that institutional quality is among the most important determinants of portfolio flows. 5 Since the seminal paper of Bayoumi and Eichengreen (1993) there has been a well-established view as to the existence of a core-periphery pattern in both the pre-EMU and the post-EMU periods. See also Campos and Macchiarelli (2016).

7
2 THE COMPOSITION OF INTERNATIONAL HOLDINGS AND
INSTITUTIONAL QUALITY IN EMU COUNTRIES BEFORE AND
AFTER EMU
Capital flows have increased considerably at world level in the past two decades, despite a temporary contraction during the global crisis. Gross cross-border capital flows rose from about 5% of world GDP in the mid-1990s to about 20% in 2007, about three times faster than world trade flows. Prior to the global financial crisis, the dominant components were capital flows among advanced economies. The crisis resulted in a sharp contraction in international capital flows that initially affected mainly international banking flows among advanced economies and subsequently spread to other countries. International capital flows have rebounded since the spring of 2009, driven by a bounce-back in portfolio investment from advanced to emerging-market economies and increasingly among the latter only.
In Europe, the elimination of capital controls in the 1980s and early 1990s, the introduction of the common currency in 1999, and the harmonization of financial regulations reduced transaction costs and increased the elasticity of substitution between assets issued by the individual member countries (Coeurdacier et al., 2010). The creation of the euro represented a fundamental discontinuity (see Lane, 2008). By eliminating currency risk among the member countries, a critical barrier to international financial integration was dismantled, especially in relation to debt instruments. International financial integration also lowered risk premia.
The first decade of the euro coincided with extraordinary global growth in international financial trade. Indeed, ‘‘the euro area was in the frontier of the financial globalization boom,
with the elimination of intra-area currency risk additionally stimulating international financial
integration, over and above the global factors that were at work across the set of advanced
economies’’ (Lane, 2008). This boom accelerated from 2003 onwards and was especially pronounced for international
debt flows. The high perceived substitutability of common-currency bonds in a low-risk environment increased cross-border debt transactions. In addition to the huge increase in the scale of gross flows, persistent and large-scale net financial imbalances within the euro area also emerged during this period. In the aftermath of the sovereign debt crisis, these trends have reversed.
Prices and exchange rate movements played a very significant role. The appreciation of the euro against the dollar in 2002-07 meant that euro-area economies suffered valuation losses on dollar-denominated assets (Gourinchas, 2014). Furthermore, the poor performance of the US stock market compared with European stock markets meant that the net external positions of European countries declined owing to the rise in the value of portfolio equity liabilities relative to the value of portfolio equity assets. However, the contribution of these forces differed across euro-area countries in line with the gross scale of international balance sheets and the composition of assets and liabilities across portfolio equity, debt, reserves and FDI.6
6 There is also a statistical issue ‘‘ … it is not possible to obtain a precise estimate of the contribution of valuation effects to NFA dynamics for the member countries, since most countries do not separately report valuation effects. Rather valuation effects are bundled together with other adjustments to the estimated value of foreign assets and foreign liabilities. A major problem is that shifts in data collection methods means that asset and liability positions are subject to substantial revisions. Since the historical data on capital flows are typically not revised in a proportionate manner, it is not possible to trace out a consistent set of stock-flow accounts that can accurately quantify the contribution of valuation effects’’ (Lane et al., 2014).

8
Indeed, in this paper we focus on net stocks because we are interested in the evolution of the net external financial exposure of EMU countries as a possible source of obstacles to the convergence process within the currency area. This choice is in line with the European Commission Macroeconomic Imbalances Procedure (MIP) scoreboard that includes as numerical benchmark net (and not gross) international investments to assess the financial stability and sustainability of European countries. To this end, it is worth to underline that for the advanced economies the analysis of foreign capitals role for growth has to go beyond the investigation of pure financing issues (i.e. liabilities) since also the evolution of investments abroad (assets) through the reorganization of production process at international level triggered by the globalization process (i.e. global value chains)7 and the balance between assets and liabilities represent growth channels.
Looking at the Net Foreign Assets Position (NFA) in the EMU and its main net components (FDI, PDI and PEI) as a whole (Figure 1), we can see that starting in 1999 there was on average an increase in FDI net assets as a percentage of GDP, an almost specular reduction in net PDI, and substantial stability of net PEI.8 The trends described above mask heterogeneous behaviour within the Eurozone at country level. In order to account for such differences we divide the sample of countries in two groups, ‘core’ and ‘periphery’, according to the literature (see European Commission 2010, Campos and Macchiarelli, 2016 and Hale and Obstfeld, 2014). Core countries include Germany, Austria, Finland, Belgium, the Netherlands and France, while the peripheral group contains Italy, Spain, Portugal, Ireland and Greece.
The dynamics of the ratio of net FDI, PEI and PDI to GDP for core and periphery and US are reported in Figure 1 (b, c, d). The net FDI ratio displays the same growing trend for both groups, however, with an evident slower dynamic for peripheral countries. The net PEI to GDP ratio shows asymmetric behaviour for core and periphery groups, that is an increase in PEI net assets for the core countries and an increase in liabilities for peripheral countries (Figure 1 c). Also, the net PDI to GDP ratios in the two groups of countries seem to diverge over time. This heterogeneous behaviour is even more evident looking at single countries’ trends (Figure 1 d and Figure 2: c, d).
7 For example for FDI, also the investments abroad (assets) and not only the financing (liabilities) might determine positive productivity spillovers for the investing country through the possibility to obtain technological progresses and low price production factors from the hosting country. 8 International holdings and international transactions are classified in the following broad categories: i) portfolio investment, divided into equity securities and debt securities (including bonds and money market instruments); ii) foreign direct investment, which refers to equity participations above 10%; iii) other investment (which includes debt instruments such as loans, deposits and trade credits); and iv) financial derivatives and reserve assets. For each of these broad categories, balance of payments data measure net capital inflows and outflows during a recording period, and the international investment position (IIP) data measure the stocks of external assets and liabilities at the end of the recording period. The variables in the chart are net stocks, i.e. assets minus liabilities, meaning that there was an increase in FDI outward stocks, substantial stability of PEI outward and inward stocks, and an increase in PDI inward stocks.

9
Fig. 1 Net foreign assets components in the EMU
a) net FDI, PEI and PDI to GDP ratio b) net FDI to GDP ratio
-.4
-.3
-.2
-.1
.0
.1
.2
.3
1996 1998 2000 2002 2004 2006 2008 2010 2012 2014
NFAGDP_EMU FDIGDP_EMUPDIGDP_EMU PEIGDP_EMU
-.1
.0
.1
.2
.3
.4
1996 1998 2000 2002 2004 2006 2008 2010 2012 2014
FDIGDP_CORE FDIGDP_PERIFDIGDP_US K
c) net PEI to GDP ratio d) net PDI to GDP ratio
-.3
-.2
-.1
.0
.1
.2
1996 1998 2000 2002 2004 2006 2008 2010 2012 2014
PEIGDP_COREPEIGDP_PERIPEIGDP_US
-.6
-.5
-.4
-.3
-.2
-.1
.0
1996 1998 2000 2002 2004 2006 2008 2010 2012 2014
PDIGDP_COREPDIGDP_PERIPDIGDP_US
Source: EWN database (2015).
This empirical evidence shows in most core countries an increase of sources of financing
less volatile such as foreign direct investment and a decrease of portfolio debt investment, in the sample considered. In the peripheral countries on average the opposite occurred.9
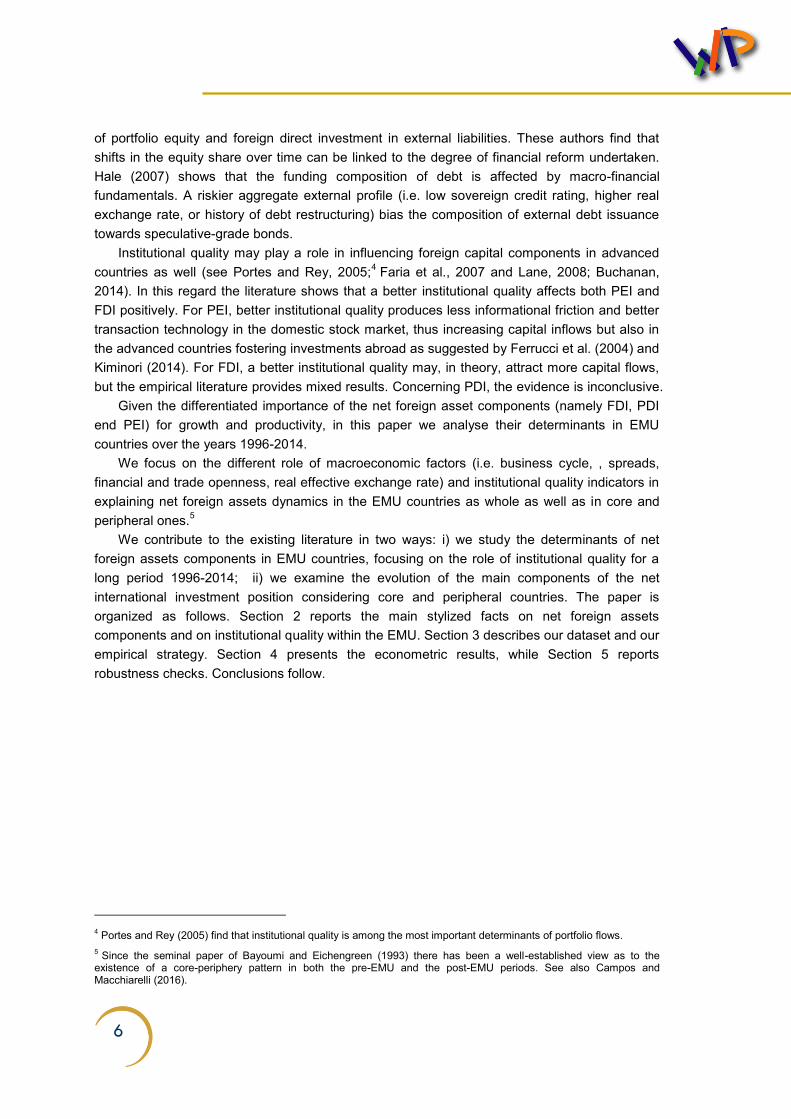
To see whether there are features particular to some countries Figure 2 reports the PDI, FDI and PEI dynamics of each country in the core and peripheral EMU groups.
For net PDI, we note that with the exception of the Netherlands all the core countries followed a common trend (Figure 2 a). The situation is different in the peripheral countries: while Spain, Italy and Portugal show a slight decreasing ratio, Greece and Ireland display an increasing one, especially after the beginning of the sovereign debt crisis in 2010 (Figure 2 b).
9 These trends can be described as part of the ‘‘core-periphery dualism’’ and potentially represent a shortcoming for the
long-run growth sustainability and endogenous triggered convergence of peripheral EU member states and for the effectiveness of centralized policies within the Eurozone. See also Cesaroni, De Santis (2016), Caporale et al. (2015), and Alfaro et al. (2014).

10
Fig. 2 Net foreign assets components in the EMU
a) PDI to GDP ratio in core group b) PDI to GDP ratio in peripheral group
-1.2
-0.8
-0.4
0.0
0.4
0.8
1996 1998 2000 2002 2004 2006 2008 2010 2012 2014
PDIGDP_AUS PDIGDP_BEPDIGDP_GER PDIGDP_FINLPDIGDP_FR PDIGDP_NETH
-1
0
1
2
3
4
1996 1998 2000 2002 2004 2006 2008 2010 2012 2014
PDIGDP_IRL PDIGDP_ITAPDIGDP_GREE PDIGDP_PERIPDIGDP_SPAIN
c) net FDI to GDP ratio in core group
d) net FDI to GDP ratio in peripheral group
-0.4
-0.2
0.0
0.2
0.4
0.6
0.8
1.0
1.2
1996 1998 2000 2002 2004 2006 2008 2010 2012 2014
FDIGDP_FR FDIGDP_GERFDIGDP_NETH FDIGDP_FINLFDIGDP_AUS FDIGDP_BE
-1.2
-0.8
-0.4
0.0
0.4
0.8
1.2
1996 1998 2000 2002 2004 2006 2008 2010 2012 2014
FDIGDP_ITA FDIGDP_SPAINFDIGDP_GREE FDIGDP_IRLFDIGDP_PORT
e) net PEI to GDP ratio in core group
f) net PEI to GDP ratio in peripheral group
-1.6
-1.2
-0.8
-0.4
0.0
0.4
0.8
1996 1998 2000 2002 2004 2006 2008 2010 2012 2014
PEIGDP_AUS PEIGDP_FINLPEIGDP_GER PEIGDP_NETHPEIGDP_BE PEIGDP_FR
-.4
-.2
.0
.2
.4
-6
-5
-4
-3
-2
-1
0
1996 1998 2000 2002 2004 2006 2008 2010 2012 2014
PEIGDP_ITA PEIGDP_IRLPEIGDP_GREE PEIGDP_PORTPEIGDP_SPAIN
Source: EWN database (2015).
For the FDI net assets to GDP ratio once again we find a common stable trend for the core
group with the exception of the Netherlands. For this country the balance is always positive with a strong upward trend starting from 2002, indicating that for that country capital outflows (assets) were higher than capital inflows (liabilities) (Figure 2 c).

11
In the peripheral countries, the situation is fairly heterogeneous: Italy displays a stability of the ratio for the whole period with a balance, while in Portugal the ratio is negative and decreases especially after 2003. The other peripheral countries display increasing trends at least before the sovereign debt crisis (Figure 2 d).
For the PEI net assets to GDP ratio (Figure 2: e, f) there appears to be a common stable trend for core countries and a slight convergence of the Netherlands and Finland with the main group after the introduction of the euro. On the other hand, in the peripheral countries Greece, Spain and Portugal show a common slightly decreasing trend while Italy and Ireland display two diverging trends (increasing and decreasing respectively). Briefly, a close look at the figures points to the following findings for the sample considered (1996-2014):
Finding 1: the ratio of net PEIs asset to GDP increased in core and decreased in some periphery countries. The core countries invested abroad while the peripheral ones attracted foreign capitals.
Finding 2: the ratio of net FDIs asset to GDP increased in core countries and remained stable in periphery countries. The core countries invested abroad while the different between inward and outward investments in peripheral ones remained constant.
Finding 3: the ratio of net PDIs asset to GDP decreased in both core and periphery countries; the decrease was sharper for the latter group. In other words, there was a strong inflow of foreign capitals in peripheral countries.
Finding 4: at country level, for all the three components emerges a convergence in the dynamics in the core group and more fragmented trends in the peripheral one. This evidence is in line with the findings of Caporale et al (2015), and Campos and Macchiarelli (2016).
In what follows, to examine how far the institutional quality of core and peripheral countries changed also with respect to the other main OECD countries, we analyse three sub-periods – before the introduction of the euro (1996-98), afterwards (1999-2008), and the aftermath of the financial crisis (2009-14).
As a measure of institutional quality in this paper we use the Worldwide Governance Indicators (WGI) published by the World Bank since 1996 and covering over 200 countries.10 The WGI comprises six governance indicators. The first two (Voice and Accountability, and Political Stability and Absence of Violence/ Terrorism) relate to the process by which governments are selected, monitored and replaced. The second two indicators (Government Effectiveness and Regulatory Quality) refer to the capacity of a government to effectively formulate and implement sound policies.
The last two indicators (Rule of Law and Control of Corruption) concern the respect of citizens and the State for the institutions that govern economic and social interactions among them. In interpreting the analysis we need to take into account all the caveats associated with the use of signals coming from qualitative survey indicators.
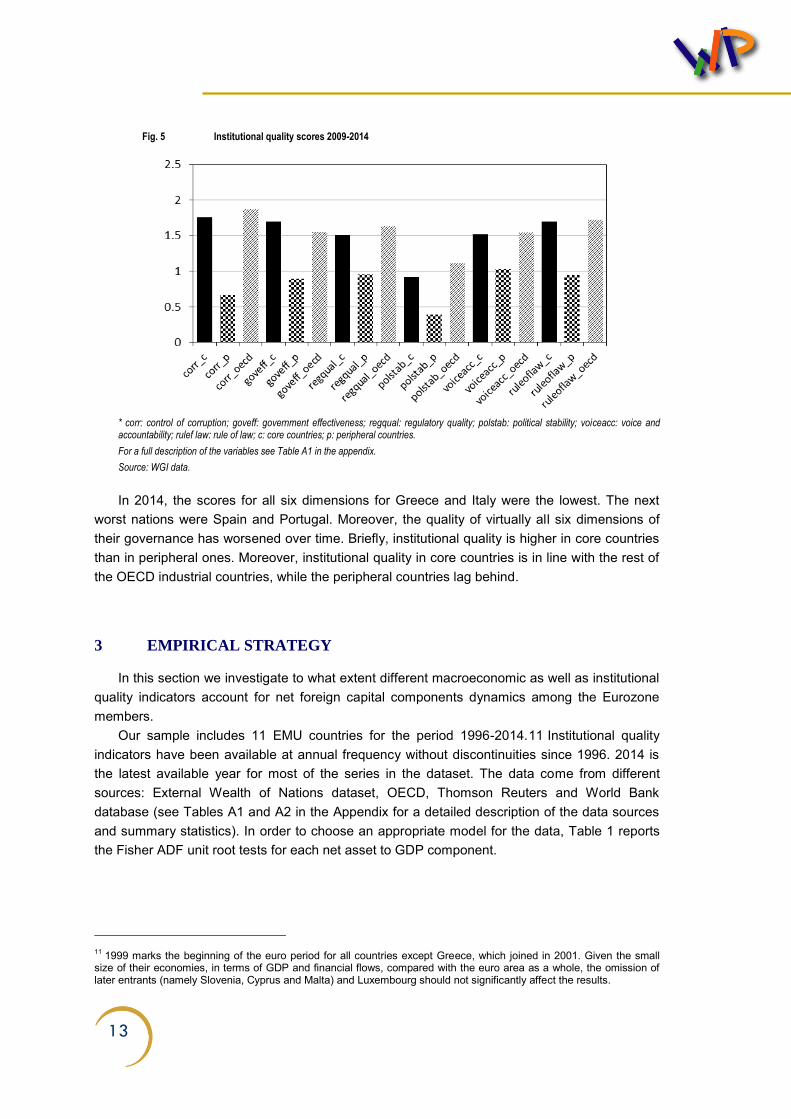
Figures 3, 4 and 5 show the average scores of six governance indicators for core and peripheral countries. The red histograms, that refer to periphery countries, are always the
10 These aggregate indicators combine the views of a large number of enterprises, citizens and expert survey respondents in industrial and developing countries. They are based on over 30 individual data sources produced by a variety of survey institutes, think tanks, non-governmental organizations, international organizations, and private sector firms. Estimates of governance ranges from approximately -2.5 (weak) to 2.5 (strong) performance. For a full methodological explanation see Kaufmann, Kraay and Mastruzzi (2010).

12
lowest. The disparity in terms of institutional quality is evident for all the six dimensions: the core countries have performed systematically better than the peripheral ones and the difference has widened both after the introduction of the euro and after the 2009 crisis.
Fig. 3 Institutional quality scores 1996-98
* corr: control of corruption; goveff: government effectiveness; regqual: regulatory quality; polstab: political stability; voiceacc: voice and accountability; rulef law: rule of law; c: core countries; p: peripheral countries.
For a full description of the variables see Table A1 in the appendix.
Source: WGI data.
Fig. 4 Institutional quality scores 1999-2008
* corr: control of corruption; goveff: government effectiveness; regqual: regulatory quality; polstab: political stability; voiceacc: voice and accountability; rulef law: rule of law; c: core countries; p: peripheral countries.
For a full description of the variables see Table A1 in the appendix.
Source: WGI data.
13
Fig. 5 Institutional quality scores 2009-2014
* corr: control of corruption; goveff: government effectiveness; regqual: regulatory quality; polstab: political stability; voiceacc: voice and accountability; rulef law: rule of law; c: core countries; p: peripheral countries.
For a full description of the variables see Table A1 in the appendix.
Source: WGI data.
In 2014, the scores for all six dimensions for Greece and Italy were the lowest. The next
worst nations were Spain and Portugal. Moreover, the quality of virtually all six dimensions of their governance has worsened over time. Briefly, institutional quality is higher in core countries than in peripheral ones. Moreover, institutional quality in core countries is in line with the rest of the OECD industrial countries, while the peripheral countries lag behind.
3 EMPIRICAL STRATEGY
In this section we investigate to what extent different macroeconomic as well as institutional quality indicators account for net foreign capital components dynamics among the Eurozone members.
Our sample includes 11 EMU countries for the period 1996-2014.11 Institutional quality indicators have been available at annual frequency without discontinuities since 1996. 2014 is the latest available year for most of the series in the dataset. The data come from different sources: External Wealth of Nations dataset, OECD, Thomson Reuters and World Bank database (see Tables A1 and A2 in the Appendix for a detailed description of the data sources and summary statistics). In order to choose an appropriate model for the data, Table 1 reports the Fisher ADF unit root tests for each net asset to GDP component.
11 1999 marks the beginning of the euro period for all countries except Greece, which joined in 2001. Given the small size of their economies, in terms of GDP and financial flows, compared with the euro area as a whole, the omission of later entrants (namely Slovenia, Cyprus and Malta) and Luxembourg should not significantly affect the results.

14
Table 1 Unit root test Fisher-ADF
N,T= (11,16) Levels First differences Number of observations
23.1*** 46.6 176
11.9*** 31.3 176
10.5*** 49.7 176
*** p<0.01, ** p<0.05, * p<0.1
The econometric unit root tests show that portfolio net equity investment, portfolio net debt
investment, and foreign net direct investment are persistent variables. For this reason in what follows we use a dynamic panel data model where the lagged dependent variable is included among the independent variables.
Considering the dynamics can create econometric problems. If the accumulation of financial capital stocks in their various components were a static process, the fixed-effect estimator would be consistent for a finite time dimension, T, and an infinite number of countries, N. But as we have to consider the evolution of the three IIP components as a dynamic process, the transformation needed to eliminate the fixed effects produces a correlation between the lagged dependent variable and the transformed error term that makes the least square estimator biased and inconsistent. To avoid the inconsistency problem, Arellano and Bond (1991) suggest transforming the model into first differences and running it with the Hansen two-step GMM estimator. 12 Arellano and Bover (1995) describe how additional moment conditions could increase efficiency if the original equations in levels are added to the system of first-differenced equations. The ‘‘System GMM’’ estimator has been refined by Blundell and Bond (1998). 13
When modelling the independent variables we follow the pull and push factors approach (Calvo et al., 1996; Chuhan et al., 1998; Montiel and Reinhart, 1999), which distinguishes between the pull factors (e.g. domestic factors in the recipient country) and the push factors (e.g. external or world factors).14 It is worth noting that the distinction between domestic and global factors has important policy implications. If international capital flows react mainly to global factors, the recipient countries are vulnerable to global shocks, even if domestic policymakers maintain prudent macro-policies. By contrast, if capital flows are predominantly driven by domestic factors, policymakers are better able to affect them.
12 They show how the two key properties of the first-differencing transformation – eliminating the time invariant individual effects without introducing disturbances for periods earlier than period t-1 into the transformed error term – can be obtained using any alternative transformation (i.e. forward orthogonal deviations). 13 To determine the best econometric strategy (i.e. difference GMM versus System GMM) we compared different dynamic panel estimators. As shown in Bond et al. (2001), when time series are highly persistent, first difference GMM can have a poor performance as the lagged values of explanatory variables can be weak instruments. 14 Starting from the seminal paper by Calvo, Leiderman and Reinhart (1996), the determinants of capital flows have been analysed extensively in the literature (see Kribaeva and Razin, 2009, for a recent survey). While earlier studies focused on foreign direct investment, attention has shifted more recently to other cross-border international transactions as well. Push factors are external determinants of capital flows such as interest rates and economic activity in lending economies, which alter the relative attractiveness of investment in borrowing countries. Pull factors are domestic determinants of foreign capital inflows. They include both economic factors – such as domestic interest rates, productivity and the rate of economic growth – as well as institutional factors – e.g. the extent of capital account liberalization, protection of property rights and/or enforcement of the law.
15
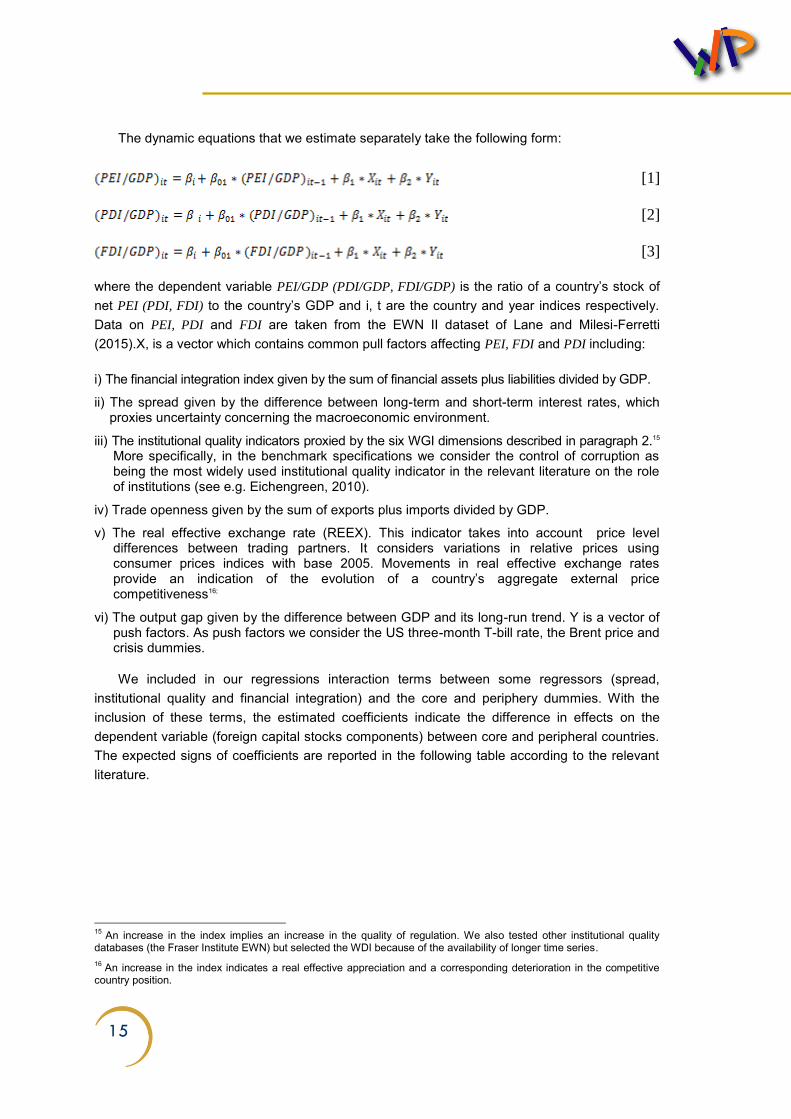
The dynamic equations that we estimate separately take the following form:
[1]
[2]
[3]
where the dependent variable PEI/GDP (PDI/GDP, FDI/GDP) is the ratio of a country’s stock of net PEI (PDI, FDI) to the country’s GDP and i, t are the country and year indices respectively. Data on PEI, PDI and FDI are taken from the EWN II dataset of Lane and Milesi-Ferretti (2015).X, is a vector which contains common pull factors affecting PEI, FDI and PDI including:
i) The financial integration index given by the sum of financial assets plus liabilities divided by GDP.
ii) The spread given by the difference between long-term and short-term interest rates, which proxies uncertainty concerning the macroeconomic environment.
iii) The institutional quality indicators proxied by the six WGI dimensions described in paragraph 2.15 More specifically, in the benchmark specifications we consider the control of corruption as being the most widely used institutional quality indicator in the relevant literature on the role of institutions (see e.g. Eichengreen, 2010).
iv) Trade openness given by the sum of exports plus imports divided by GDP.
v) The real effective exchange rate (REEX). This indicator takes into account price level differences between trading partners. It considers variations in relative prices using consumer prices indices with base 2005. Movements in real effective exchange rates provide an indication of the evolution of a country’s aggregate external price competitiveness16;
vi) The output gap given by the difference between GDP and its long-run trend. Y is a vector of push factors. As push factors we consider the US three-month T-bill rate, the Brent price and crisis dummies.
We included in our regressions interaction terms between some regressors (spread, institutional quality and financial integration) and the core and periphery dummies. With the inclusion of these terms, the estimated coefficients indicate the difference in effects on the dependent variable (foreign capital stocks components) between core and peripheral countries. The expected signs of coefficients are reported in the following table according to the relevant literature.
15 An increase in the index implies an increase in the quality of regulation. We also tested other institutional quality databases (the Fraser Institute EWN) but selected the WDI because of the availability of longer time series. 16 An increase in the index indicates a real effective appreciation and a corresponding deterioration in the competitive country position.

16
Table 2 Determinants of international holdings components in the relevant literature
Category Variable Expected sign Empirical sign found in previous works
Output gap -/+ - [1],+ [4], Pull factors Financial integration -/+ - [1], [4], +[2],[3] Trade openness + +[2], [3], [4], Crisis + +[4], Institutional quality +/- +/-[2] [6], -[3], +[4], [5], [6], Push factors US T-bill - -[4],
Note: The empirical findings in the table summarize the results of: Alfaro et al. (2014)[1], Faria et al. (2006) [2], Furceri et al. (2011)[3], Quian and Steiner (2014)[4], Wei and Wu (2002) [5], and Portes and Rey (2005) [6].
We distinguish the two groups – core (Germany, Austria, the Netherlands, Belgium, Finland
and France) and periphery (Italy, Spain, Portugal, Ireland and Greece) countries – according to the prevailing definition in the literature. The financial integration variables, the REEX, the US treasury bill interest rate and the trade openness indicator are lagged in the estimates in order to avoid endogeneity issues.
4 ESTIMATES RESULTS
In this section, we analyse the impact of institutional quality on the international holdings components in EMU countries as a whole and for core and peripheral groups over the years 1996-2014 in addition to other macroeconomic regressors (i.e. spreads, financial openness indicators) using the dynamic panel econometric model described in Section 3.
Table 3 reports the results, conventional statistical tests and diagnostics for our baseline regression that considers control of corruption as institutional quality benchmark measure, spreads, financial openness plus a set of control variables (output gap, trade openness, US Treasury bill, real effective exchange rates and dummies crisis). 17
More in detail, columns 1, 2, 3 report equation specifications, for net PEI, PDI and FDI respectively, in which the coefficient of institutional quality is aggregated for all the EMU countries, while columns 4, 5, 6 disentangle that coefficient for core and peripheral groups by considering the interaction effects of the institutional quality with the dummy for the two subsets.
Looking at the results in columns 1, 2, 3 we find, as expected, a positive and significant impact of the lagged endogenous variables for both PEI, PDI and FDI, showing that the evolution of net assets has a certain persistence. Overall, the sign and magnitude of the estimated coefficients are broadly in line with the results of the literature (see Table 2).
We find that the spread (namely the difference between long term and short term interest rate) had a negative and significant impact on net PDI and net FDI assets only in the peripheral countries showing that a higher interest rate differential stimulated relatively higher FDIs and PDIs liabilities with respect to the assets.
Concerning the role of the institutional quality indicator, namely control of corruption in the first three regressions for the whole EMU group, we find that for FDI and PDI net assets the coefficient is positive and statistically significant (columns 2, 3); on the contrary, for PEI net 17 In the various equation specifications estimated as endogenous regressors we considered the lagged dependent variables instrumented with their lags. As instrumental variables we considered the real exchange rate, contemporaneous and lagged, the lagged financial integration regressor, the three-month US Treasury bill interest rates, and the lagged spread measured as country’s long-term minus short-term interest rate on deposits.

17
assets the coefficient is negative and significant. Thus it seems that for net FDI and net PDI the decrease of corruption stimulates relatively higher investments abroad than attracting capitals from abroad showing a higher reactivity of assets with respect to liabilities. For PEI, an improvement in institutional quality works relatively more as a factor of attraction of foreign equity investments and is therefore associated with a decrease in external exposure, in line with the findings of Portes and Rey (2006) and Furceri (2011). At EMU level, the dummy for crisis 2008 is positively correlated and significant only with PEI net assets. This result confirms that a de-leveraging process occurred during the crisis: the reduction of portfolio equity liabilities in the balance sheet of the private and government sectors caused a rise in PEI net assets. The dummy for 2010 crisis (the sovereign debt one) is as expected significant only for net PDI.
In the sample considered the output gap seems to display a positive and significant impact for PEI net assets suggesting that the reactivity of speculative equity investments to business cycle is greater for assets than for liabilities. Quite the opposite, for net FDI the impact is negative; a positive cyclical phase, increasing the domestic demand, determines an greater FDI attraction for foreign investors. For, PDI the coefficient is not significant. The finding of a different sign of the output gap coefficient on net capital components is not a surprise, since the reactivity of the assets and liabilities to business cycle is different in the various capital components, also the effect on the net component can be different.
It is worth to underline that for some regressors (spread, output gap, control of corruption and financial integration) the signs of the coefficients are different for the various net foreign assets components. This apparently counterintuitive result is in line with the literature and takes into account the fact that the statistical features and the economic scope of the three foreign assets components are extremely heterogeneous (see table A2 in the Appendix).
Concerning PEI the financial integration indicator (finan.open), led to a decrease in net assets in peripheral countries (column 1) showing a greater reactivity in foreign portfolio equity investment (liabilities) over the assets in peripheral countries.18 The estimates for PEI net assets also show that the spread indicator had a positive impact (increasing net assets) only in core countries, signalling that operators regard the gap between long-term and short-term positions in deposits in core countries as an indicator of volatility and vulnerability. For PEI the crisis 2008 dummy is positive confirms a de-leveraging process, while the sovereign debt crisis of 2010 may have produced an effect on PEI in the following years.
Concerning PDI, we find that financial integration had a negative and significant impact only in the case of core countries, while for peripheral countries impact is positive. This means that in core countries an increase of financial integration produced a higher increase of PDI liabilities compared to assets. In peripheral countries financial openness produced quite the opposite an increase of debt assets over liabilities resulting in a positive impact of net debt. The results indicate that the reactivity of PDI liabilities to financial integration in core countries was higher than that of PDI assets while the opposite occurred in peripheral countries. This latter evidence suggests also that the peripheral countries experienced a process of financial integration "catching up" i.e. peripheral countries progressively intensified also the PDI Investments abroad and did not remain only receiver.
18 The fact that financial integration is not significant for the core countries could be explained by the different degree of financial development in the two country groups. In the time span considered the core countries were already well-integrated from the financial markets point of view, especially in the equity market segment, while participation in the single currency project produced a sort of ‘‘financial’’ catching up in the peripheral countries.

18
Moreover, for PDI the crisis 2010 dummy is positive confirms a de-leveraging process, This latter result is in line with the literature finding that in creditor countries with better institutional framework there is a positive effects of economic growth on international capital flows. This finding might be due to the fact that stronger growth boosts the profitability of firms, which in turn increases investment abroad (see e.g. Ferrucci et al., 2004).
Finally, for FDI we observe a no significant impact of financial integration in both core and peripheral countries net assets. The 2008 crisis dummy is not significant, in line with the literature arguing that FDI seems to be consistent in both normal and crisis periods; in fact, a financial crisis may be associated with an outflow of foreign PEI and a simultaneous inflow of FDI.
Table 3 Net PEI, PDI and FDI determinants in EU countries 1996-2014*
(1) (2) (3) (4) (5) (6)
pei_net_gdpl1 0.68***
0.60***
(0.07)
(0.08)
pdi_net_gdpl1
0.58***
0.55***
(0.12)
(0.12)
fdi_net_gdpl1
0.65***
0.58***
(0.15)
(0.15)
spread_core 0.17** 0.047 -0.01 0.12* 0.05 -0.01
(0.07) (0.11) (0.04) (0.07) (0.10) (0.04)
spread_per 0.01 -0.066*** -0.04* 0.004 -0.06*** -0.05**
(0.03) (0.02) (0.03) (0.03) (0.02) (0.03)
control of corr. -0.22*** 0.17* 0.21**
(0.06) (0.10) (0.10)
contrcorr_core
-0.22*** 0.14 0.26**
(0.05) (0.09) (0.10)
contrcorr_per
0.13 -0.07 0.13
(0.19) (0.20) (0.11)
Finan.open_core 0.01 -0.05** 0.01 0.02* -0.05** 0.01
(0.01) (0.02) (0.01) (0.01) (0.02) (0.01)
Finan.open _per -0.04*** 0.06*** 0.01 -0.06*** 0.07*** 0.02*
(0.01) (0.02) (0.01) (0.02) (0.02) (0.01)
ouput_gap 0.04*** -0.003 -0.02** 0.03** 0.003 -0.02**
(0.01) (0.01) (0.01) (0.01) (0.01) (0.01)
crisi_2008 0.44*** 0.22 -0.01 0.39*** 0.16 0.03
(0.15) (0.31) (0.09) (0.14) (0.29) (0.09)
crisi_2010 -0.11 0.49* 0.23 -0.06 0.45* 0.18
(0.13) (0.26) (0.17) (0.13) (0.25) (0.17)
trade openess -0.001 -0.003 -0.001 -0.001 -0.003 -0.002
(0.001) (0.003) (0.002) (0.001) (0.003) (0.001)
reex 0.01 -0.03*** -0.002 0.01 -0.03*** -0.01
(0.01) (0.01) (0.005) (0.01) (0.01) (0.01)
ustbill -0.03 -0.03 -0.003 -0.03* -0.03 -0.01
(0.02) (0.020 (0.01) (0.02) (0.02) (0.01)
Constant -0.40 2.94*** 0.004 -0.75 3.25*** 0.56
(0.67) (0.97) (0.53) (0.64) (0.94) (0.67)
Observations 173 173 173 173 173 173 Number of code 11 11 11 11 11 11 Wald test 4080 (0.00) 2287 (0.00) 644 (0.00) 3606 (0.00) 1741(0.00) 513(0.00) AR (1) -2.14(0.03) -2.56 (0.01) -3.59(0.00) -2.38 (0.02) -2.34(0.02) -2.15(0.03) AR(2) -1.45 (0.15) 1.27 (0.21) -1.94(0.05) -1.56 (0.12) 0.24(0.81) -2.26(0.02) Sargan 29.15 (0.14) 26.74 (0.18) 27.81(0.18) 23.80 (0.30) 25.05(0.30) 20.40(0.56) No. of instr. 35 35 35 35 36 36
PEI is the dependent variable in columns (1) and (4); PDI is the dependent variable in columns (2) and (5); FDI is the dependent variable in columns (3) and (6). Regressions (1), (2) and (3) consider all the European countries; regressions (4), (5) and (6) distinguish between core countries and periphery ones. Standard errors and p values in parentheses *** p<0.01, ** p<0.05, * p<0.1.

19
Columns 4, 5 and 6, report the same specifications as columns 1, 2 and 3 considering the interactions terms of the institutional quality indicator with the core and peripheral dummies. The estimates show that, in line with the literature (Portes and Rey, 2005), the greater control of corruption is a factor of attractiveness for foreign portfolio equity investment (PEI) only in core countries, while in the peripheral ones the regressor is not significant. The coefficient of corruption is not statistically significant for PDI while for net FDI the impact is positive as found for the whole set of EMU countries.
Surprisingly, the evidence suggests that the control of corruption increases the net assets in terms of FDI only in core countries. On the FDI side, an environment with better institutional quality theoretically attracts more FDI. However, this intuition does not garner consensus in empirical studies. Wheeler and Mody (1992) find no evidence for a significant relation between FDI and institutional quality. Further, Fernández-Arias and Hausmann (2001) indicate that a country with weaker institutions tends to attract less capital but more FDI.
A possible explanation for the non-significant relationship between institutional quality and international holding components for peripheral countries is that in some peripheral countries financial flows have been driven mostly by the expectation of high yields owing to participation in the EMU, thus favouring financial and speculative investment over FDI and PEI. In fact, peripheral countries experienced higher deficits as a result of the credit booms allowed by lower interest rates; the outcome has been asset-price bubbles, area-wide banking crises, sovereign debt problems, and collapses in some of the peripheral countries more than domestic increases in productivity and growth. Hale and Obstfeld (2014) found that after the euro's introduction, core countries of EMU increased their borrowing from outside EMU and their lending to the EMU periphery. Greater financial integration between core and peripheral EMU members had an heterogeneous effect on both sets of countries.
5 ROBUSTNESS TO INTRODUCING DIFFERENT CONTROL
VARIABLES IN THE MODEL: THE ROLE OF INSTITUTIONAL
QUALITY IN CORE AND PERIPHERAL COUNTRIES
In this paragraph we perform a robustness check for institutional quality. In Tables 4, 5 and 6, we respectively for PEI, PDI and FDI the six dimensions of the WGI indicators in the previous estimates with specific focus on the effects on core and peripheral EMU members.
Although the governance concept is widely discussed among policymakers and difficult to quantify in empirical analyses, we try to approximate it, as previously underlined, through institutional quality indicators at country level.
We note that for all the three foreign asset components the institutional quality regressors are significant only for core countries. We report the coefficients of the institutional quality indicators of then regression in table 4, 5 and 6 in Table 7.
As already suggested a possible explanation of the not significant relationship between institutional quality and foreign capital net assets for peripheral countries is the expectation of high returns in a low risk environment, due to the EMU membership, prevailed on the discouraging impact of a lower institutional quality context.
Looking specifically at the three components, for PEI in core countries the signs of the institutional quality indicators are all negative and significant (with the exception of Voice and Accountability), indicating, in line with the literature, that an improvement in institutional quality attracts foreign equity investment.

20
Table 4 Net PEI determinants in core and peripheral countries. Robustness to different institutional quality indicators
(1) (2) (3) (4) (5)
pei_net_gdpl1 0.728*** 0.729*** 0.697*** 0.760*** 0.732***
(0.107) (0.0946) (0.110) (0.0885) (0.0987)
goveff_core -0.229**
(0.110)
goveff_per -0.105
(0.252)
polstab_core
-0.186*
(0.0991)
polstab_per
0.0304
(0.116)
regqual_core
-0.242*
(0.134)
regqual_per
0.0794
(0.224)
voiceacc_core
0.00280
(0.197)
voiceacc_per
0.361
(0.322)
rulaw_core
-0.225**
(0.102)
rulaw_per
-0.00236
(0.268)
ouput_gap 0.0344* 0.0375*** 0.0270 0.0264* 0.0323*
(0.0181) (0.0131) (0.0181) (0.0160) (0.0166)
crisi_2008 0.681*** 0.662*** 0.701*** 0.605*** 0.683***
(0.178) (0.168) (0.181) (0.144) (0.174)
crisi_2010 -0.314* -0.248 -0.342* -0.310* -0.247
(0.180) (0.155) (0.190) (0.169) (0.169)
spread_core 0.313*** 0.288*** 0.317*** 0.292*** 0.290***
(0.0960) (0.0734) (0.0961) (0.0824) (0.0887)
spread_per 0.0345 0.0483*** 0.0350 0.0542* 0.0335
(0.0326) (0.0145) (0.0331) (0.0320) (0.0310)
L2.fin_core 0.00688 0.0153 0.0141 0.0225 0.0163
(0.0172) (0.0123) (0.0160) (0.0177) (0.0169)
L2.fin_per -0.0411* -0.0392** -0.0544** -0.0452** -0.0414*
(0.0235) (0.0186) (0.0254) (0.0201) (0.0227)
L.openess -0.00164 -0.00263* -0.00126 -0.00206 -0.00268
(0.00208) (0.00147) (0.00217) (0.00256) (0.00205)
L.reex -0.00337 -0.00380 -0.000449 -0.00470 -0.00512
(0.0112) (0.00909) (0.0111) (0.00996) (0.00948)
L.ustbill -0.00193 -0.000793 -0.00303 0.00735 -0.00228
(0.0275) (0.0263) (0.0271) (0.0251) (0.0263)
Constant 0.472 0.384 0.0407 0.119 0.656
(1.226) (0.938) (1.232) (0.997) (1.011)
Observations 174 174 174 174 174 Number of code 11 11 11 11 11
PEI is the dependent variable in columns (1) and (4); PDI is the dependent variable in columns (2) and (5); FDI is the dependent variable in columns (3) and (6). Regressions (1), (2) and (3) consider all the European countries; regressions (4), (5) and (6) distinguish between core countries and periphery ones. Standard errors and p values in parentheses *** p<0.01, ** p<0.05, * p<0.1.

21
Table 5 Net PDI determinants in core and periphery countries. Robustness to different institutional quality indicators
(1) (2) (3) (4) (5)
pdi_net_gdpl1 0.397** 0.442** 0.446*** 0.365* 0.712***
(0.165) (0.198) (0.159) (0.197) (0.196)
goveff_core 0.510***
(0.171)
goveff_per -0.263
(0.248)
polstab_core
0.682***
260)
polstab_per
-0.393
(0.338)
regqual_core
0.393*
(0.227)
regqual_per
-0.365
(0.312)
voiceacc_core
0.209
(0.388)
voiceacc_per
-0.747
(0.521)
rulaw_core
0.337*
(0.173)
rulaw_per
0.355
(0.387)
ouput_gap 0.00789 0.0163 0.00235 0.0324 -0.0339
(0.0180) (0.0180) (0.0180) (0.0209) (0.0277)
crisi_2008 0.361 -0.199 0.454** -0.184 1.012*
(0.275) (0.280) (0.183) (0.195) (0.533)
crisi_2010 0.178* -0.800 0.165 -0.878* 0.187
(0.105) (0.490) (0.106) (0.454) (0.200)
spread_core -0.193** -0.222 -0.139 -0.235* -0.0707
(0.0954) (0.142) (0.0958) (0.142) (0.163)
spread_per -0.0480 -0.0789** -0.0531* -0.0719** -0.0289
(0.0294) (0.0350) (0.0297) (0.0353) (0.0308)
L2.fin_core -0.117*** -0.0996*** -0.120*** -0.103*** -0.0679**
(0.0268) (0.0363) (0.0283) (0.0358) (0.0325)
L2.fin_per 0.0609** 0.0457* 0.0548** 0.0639** 0.0107
(0.0249) (0.0258) (0.0257) (0.0289) (0.0307)
L.openess 0.00911*** 0.0103** 0.00965*** 0.00896** 0.00559
(0.00270) (0.00461) (0.00288) (0.00382) (0.00371)
L.reex -0.0390*** -0.0191 -0.0318** -0.0123 -0.00895
(0.0143) (0.0170) (0.0135) (0.0164) (0.0190)
L.ustbill -0.0903** -0.0712 -0.0662* -0.0803 -0.00170
(0.0389) (0.0530) (0.0390) (0.0537) (0.0440)
Constant 3.226** 1.361 2.637** 1.255 0.104
(1.414) (1.633) (1.340) (1.591) (2.008)
Observations 174 174 174 174 174 Number of code 11 11 11 11 11
PEI is the dependent variable in columns (1) and (4); PDI is the dependent variable in columns (2) and (5); FDI is the dependent variable in columns (3) and (6). Regressions (1), (2) and (3) consider all the European countries; regressions (4), (5) and (6) distinguish between core countries and periphery ones. Standard errors and p values in parentheses *** p<0.01, ** p<0.05, * p<0.1.

22
Table 6 Net FDI determinants in core and periphery countries. Robustness to different institutional quality indicators
(1) (2) (3) (4) (5)
fdi_net_gdpl1 0.623*** 0.431*** 0.489*** 0.507*** 0.732***
(0.166) (0.115) (0.155) (0.0989) (0.132)
goveff_core 0.159*
(0.0951)
goveff_per 0.219
(0.146)
polstab_core
0.249*
(0.133)
polstab_per
-0.102
(0.105)
regqual_core
0.108
(0.120)
regqual_per
0.0790
(0.145)
voiceacc_core
0.290*
(0.159)
voiceacc_per
0.0564
(0.148)
rulaw_core
0.126
(0.170)
rulaw_per
0.0669
(0.222)
ouput_gap -0.0306** -0.0241** -0.0394*** -0.0135* -0.0214*
(0.0139) (0.00956) (0.0123) (0.00811) (0.0113)
crisi_2008 -0.0968 -0.0730 -0.0441 -0.0760 -0.350*
(0.0708) (0.0957) (0.0901) (0.0936) (0.197)
crisi_2010 0.194 0.182* 0.205 0.141* 0.0713
(0.180) (0.0967) (0.131) (0.0817) (0.138)
spread_core -0.0301 0.0223 0.0133 0.0244 -0.000216
(0.0416) (0.0414) (0.0508) (0.0353) (0.0542)
spread_per -0.0553** -0.0404*** -0.0685*** -0.0295** -0.0362**
(0.0254) (0.0139) (0.0218) (0.0143) (0.0154)
L2.fin_core 0.0232 0.0418*** 0.0297** 0.0397*** 0.0152
(0.0156) (0.0124) (0.0149) (0.0117) (0.0165)
L2.fin_per 0.0136 0.0409*** 0.0283*** 0.0460*** 0.0232**
(0.0126) (0.00814) (0.0107) (0.00861) (0.0118)
L.openess -0.00197 -0.00351*** -0.00365** -0.00538*** -0.00281*
(0.00181) (0.00132) (0.00143) (0.00155) (0.00160)
L.reex 0.00856 -0.00904** -0.00727 -0.0112** -0.00378
(0.00820) (0.00416) (0.00526) (0.00447) (0.00509)
L.ustbill 0.00971 0.0372** 0.00757 0.0116 -0.00619
(0.0165) (0.0184) (0.0176) (0.0107) (0.0183)
Constant -0.955 0.825* 0.825 1.080*** 0.466
(0.957) (0.438) (0.548) (0.409) (0.584)
Observations 174 174 174 174 174 Number of code 11 11 11 11 11
PEI is the dependent variable in columns (1) and (4); PDI is the dependent variable in columns (2) and (5); FDI is the dependent variable in columns (3) and (6). Regressions (1), (2) and (3) consider all the European countries; regressions (4), (5) and (6) distinguish between core countries and periphery ones. Standard errors and p values in parentheses *** p<0.01, ** p<0.05, * p<0.1.

23
Table 7 Institutional quality and foreign asset components in core and peripheral EMU countries
PEI PDI FDI
contrcorr_core -0.18 0.21 0.24 contrcorr_per -0.03 0.15 0.17 goveff_core -0.23 0.51 0.16 goveff_per -0.11 -0.26 0.22 polstab_core -0.19 0.68 0.25 polstab_per 0.03 -0.39 -0.10 regqual_core -0.24 0.39 0.11 regqual_per 0.08 -0.37 0.08 voiceacc_core 0.03 0.21 0.29 voiceacc_per 0.36 -0.75 0.06 rulaw_core -0.23 0.34 0.13 rulaw_per -0.002 0.10 0.10
Note: Red = not statistically significant coefficient.
As for PDI and FDI, the signs of the institutional quality regressors are positive and significant. This apparently counterintuitive result might be due, as already noted, to the fact that in creditor (core) countries with a better institutional framework there is a positive wealth effect of economic growth on international capital flows.
6 CONCLUSIONS
The influence of foreign capital components on growth, productivity and financial stability in advanced economies is widely recognized in the literature.
This paper analyses the main macroeconomic determinants (spreads, financial integration, business cycle etc.), including institutional quality indicators, of net foreign assets components (FDI, PDI and PEI) in the EMU countries. In our analysis we distinguished between domestic (pull) and global (push) factors influencing foreign capital composition. This distinction has important policy implications. In fact, if international capital components react mainly to global factors, the recipient/investing countries are vulnerable to global shocks, even if domestic policymakers maintain prudent macro-policies. By contrast, if foreign capitals composition is predominantly driven by domestic factors, policymakers are better able to affect them. Our estimates showed that for euro area countries, both pull (institutional quality, business cycle, spreads, financial openness etc.) and push factors (crisis, US interest rates) affected of foreign capital dynamics, thus suggesting that potentially there is room also for domestic policies to promote a more effective convergence among European countries.
We found that the spread (namely the difference between long term and short term interest rate) had a negative and significant impact on net PDI and net FDI only in the peripheral countries showing that a higher interest rate differential was able to stimulate also higher FDI inflows compared to outflows in addition to higher portfolio debt inflows.

24
Our empirical analysis showed that institutional quality indicators had a significant impact on core countries’ net foreign assets components, despite they did not influence significantly the peripheral countries’ behaviour. The results are robust to the use of different institutional quality indicators. It is very likely that, at least in some peripheral countries, the perceived high substitutability of bonds and equities in a low risk environment incentivized investment not fully related to the countries’ institutional regulatory settings.
Overall our findings show that even if for all the three net assets components their evolution was mostly driven by their lagged values showing a certain degree of persistence we also find that in peripheral countries foreign capitals have been driven also by the expectation of relatively higher and “safe” yields owing to participation in the EMU.
In the future, we plan to extend our analysis by exploring the impact of macroeconomic determinants on capital components in different subsamples. We also plan to further inspect the possible occurrence of capital reversal in the single countries.
REFERENCES
Albuquerque R. (2003), ‘The Composition of International Capital Flows: Risk Sharing through Foreign Direct Investment,’ Journal of International Economics, 61(2): 353-383.
Alfaro L., Chanda A., Kalemli-Ozcan S., and Sayek S. (2006), ‘How Does Foreign Direct Investment Promote Economic Growth? Exploring the Effects of Financial Markets on Linkages’, NBER Working Paper No. 12522 (September).
Alfaro L., Kalemli-Ozcan S., and Volosovych V. (2014), ‘Sovereigns, Upstream Capital Flows, and Global Imbalances’, Journal of the European Economic Association, European Economic Association, 12(5) (October): 1240-1284.
Ahrend R. and Goujard A. (2012), ‘International Capital Mobility and Financial Fragility - Part 6 - Are All Forms of Financial Integration Equally Risky in Times of Financial Turmoil?’, OECD Working Paper No. 969.
Arellano M. and Bond S. (1991), ‘Some Tests of Specification for Panel Data: Monte Carlo Evidence and an Application to Employment Equations’, The Review of Economic Studies, 58(2).
Arellano M. and Bover O. (1995), ‘Another Look at the Instrumental Variable Estimation of Error-Components Models’, Journal of Econometrics, 68: 29-51.
Benhima K. (2013), ‘Safety Traps,’ American Economic Journal: Macroeconomics, American Economic Association, 5(4) (October): 68-106.
Bayoumi T. and Eichengreen B. (1993), ‘Shocking Aspects of European Monetary Integration,’ in F. Torres and F. Giavazzi (eds), Adjustment and Growth in the European
Monetary Union, Cambridge University Press.
Blundell R. and Bond S. (1998), ‘Initial Condition and Moment Restrictions in Dynamic Panel Data Models’, Journal of Econometrics, 68: 29–51.

25
Bond S., Hoeffler A., and Temple J. (2001), ‘GMM Estimation of Empirical Growth Models’, CEPR Discussion Paper No. 3048.
Buchanan B., Quan V., and Rishi M. (2012), ‘Foreign Direct Investment and Institutional Quality: Some Empirical Evidence’, International Review of Financial Analysis, 2012, 21 (C): 81-89
Calvo G., Leiderman L., and Reinhart C. (1996), ‘Inflows of Capital to Developing Countries in the 1990s,’ Journal of Economic Perspectives, 10: 123-139.
Campos N. F. and Macchiarelli C. , (2016), Core and Periphery in the European Monetary Union: Bayoumi and Eichengreen 25 Years Later, Economic Letters, 147 (October 2016): 127–130.
Caporale G., De Santis R., and Girardi A. (2015), ‘Trade Intensity and Output Synchronization: The Endogeneity Properties of EMU’, Journal of Financial Stability, 16, C: 154-163.
Cesaroni T. and De Santis R. (2016), ‘Current Account “Core Periphery Dualism” in the EMU’, The World Economy 2016, 39(10): 1514-1538.
Chuhan P., Claessens S., and Mamingi N. (1998), ‘Equity and Bond Flows to Latin America and Asia: The Role of Global and Country Factors’, Journal of Development Economics, 55 (April): 439-63.
Coeurdacier N., Kollmann R., and Martin P., (2010). ‘International Portfolios, Capital Accumulation and Foreign Assets Dynamics’, Journal of International Economics, Elsevier, 80(1) (January): 100-112.
De Gregorio J. (2013). ‘Resilience in Latin America: Lessons from Macroeconomic Management and Financial Policies’, IMF Working Papers 13/259, International Monetary Fund.
Eichengreen B. (2010), ‘Imbalances in the Euro Area’, mimeo, Berkeley, CA: University of California, Berkeley.
European Commission (2010), ‘Capital Flows to Converging European Economies – from Boom to Drought and Beyond’, Proceedings of the workshop held on 1 October 2010.
Faria A., Lane P. R., Mauro P., and Milesi-Ferretti G.M. (2007), ‘The Shifting Composition of External Liabilities’, Journal of the European Economic Association, MIT Press, 5(2-3) (04-05): 480-490.
Ferrucci G., Herzberg V., Soussa F., and Taylor A. (2004), ‘Understanding Capital Flows to Emerging Market Economies’, Financial Stability Review, 16: 89-97.
Fernández-Arias F. and Hausmann R. (2001), ‘Is FDI a Safer Form of Financing?’, IDB Publications (Working Papers) No. 6465, Inter-American Development Bank.
Furceri et al. (2011), ‘Medium-Term Determinants of International Investment Positions’, OECD Working Paper No. 863.

26
Gourinchas P. O (2014) External Adjustment, Global Imbalances and Valuation E_ects," in Handbook of International Economics, vol IV, G. Gopinath, H. Helpman and K. Rogoff_ (eds.),Elsevier, North Holland
Hale G. (2007), ‘Bonds or Loans? The Effect of Macroeconomic Fundamentals’, The
Economic Journal, 117: 196–215.
Hale, G. and M. Obstfeld (2014), The Euro and the Geography of International Debt Flows, CEPR discussion paper n.9937.
Kaufmann, D., Aart K. and Mastruzzi, M., (2010) The Worldwide Governance Indicators: Methodology and Analytical Issues (September). World Bank Policy Research Working Paper No. 5430.
Kiminori M, 2014. "Institution-Induced Productivity Differences And Patterns Of International Capital Flows," Journal of the European Economic Association, European Economic Association, vol. 12(1), pages 1-24, 02
Kirabaeva, K. and R., Assaf, (2009), Composition of International Capital Flows: A Survey (December). NBER Working Paper No. w15599.
Lane, P. R. and McQuade, P. (2014), Domestic Credit Growth and International Capital Flows. The Scandinavian Journal of Economics, 116: 218–252.
Lane P., (2008), The Macroeconomics of Financial Integration: A European Perspective,’ The Institute for International Integration Studies Discussion Paper Series iiisdp265, IIIS
Lane, P. and G. M. Milesi-Ferretti (2015), ‘The External Wealth of Nations Mark II: Revised and Extended Estimates of Foreign Assets and Liabilities, 1970-2015’, mimeo.
Levchenko and Mauro (2006), Do some form of financial flows help to prevent from sudden stops? IMF working paper n. 202
Montiel, P. and Reinhart, C. M., (1999), ‘Do capital controls and macroeconomic policies influence the volume and composition of capital flows? Evidence from the 1990s,’ Journal of International Money and Finance, Elsevier, vol. 18(4), pages 619-635, August.
Portes, R. and Rey, H. (2005), The Determinants of Cross-Border Equity Flows. Journal of International Economics, 65, 269-296.
Rogoff K., (1999). ‘International Institutions for Reducing Global Financial Instability,’ NBER Working Papers 7265, National Bureau of Economic Research, Inc.
Wei, S. J., (2002),’How taxing is corruption on international investors?’, Review of Economics and Statistics, Vol. 82(1), pp. 1-11.
Wheeler, D. and Mody, A. (1992) International Investment Location Decisions: The Case of U.S. Firms. Journal of International Economics, 33, 57-76.

27
APPENDIX
Table A1 Data description
Indicator Description Name in the regression
Source
Net PDI, Net PEI, Net FDI
PDI is portfolio debt investment + other investment, PEI is portfolio equity investment, FDI is both debt and equity investment. The indicator is given by assets minus liabilities.
pdi_net pei_net fdi_net
EWNII Lane and Milesi Ferretti database (2015)
Output gap Openness Spread Ustbill
% deviation of GDP from its trend Exports +imports/GDP Long-term minus short-term interest rate on deposits Three-month Treasury bill interest rate
Output_gap Trade openness Spread ustbill
Source: OECD Source: OECD Source: Thomson Reuters datastream
Real effective exchange rate Percentage changes in the index are calculated by comparing the change in the consumer price index for a given country converted into US dollars at market exchange rates to a weighted average of changes in its competitors’ indices. Chain-linked index takes as base period 2005
reex Source: OECD
Real oil price in US$ Price of oil in US dollars. oil Source: Thomson Reuters
Corruption Control Voice and Accountability Political Stability
Capturing perceptions of the extent to which public power is exercised for private gain, including both petty and grand forms of corruption, as well as ‘capture’ of the State by elites and private interests Capturing perceptions of the extent to which a country's citizens are able to participate in selecting their government, as well as freedom of expression, freedom of association, and a free media. Perceptions of the likelihood that the government will be destabilized or overthrown by unconstitutional or violent means, including politically-motivated violence and terrorism
contrcorr voiceacc polstab
Source:World Bank WGI Source:World Bank WGI Source:World Bank WGI
Government Effectiveness Regulatory Quality Rule of Law
Capturing perceptions of the quality of public services, the quality of the civil service and the degree of its independence from political pressures, the quality of policy formulation and implementation, and the credibility of the government's commitment to such policies Capturing perceptions of the government’s ability to formulate and implement sound policies and regulations that permit and promote private sector development Capturing perceptions of the extent to which agents have confidence in and abide by the rules of society, and in particular the quality of contract enforcement, property rights, the police, and the courts, as well as the likelihood of crime and violence
goveff Regqual rulaw
Source:World Bank WGI Source:World Bank WGI Source:World Bank WGI
Finopen Net foreign assets+ liabilities (NFA+NFL)/GDP. Finan.open EWNII Lane and Milesi Ferretti database (2015)

28
ustbill 900 5.099967 3.452179 .05 14.85
openess 896 61.98267 31.6138 10.7299 190.782
finopent 898 2.939635 4.111793 .1875188 36.62836
brent 900 35.53733 30.07057 2.23 113.04
spread 365 1.598301 1.990855 -5.440001 21.93
reex 896 99.30089 14.44057 47.7 152.2
ogap 574 -.2897996 2.937593 -15.813 9.206
pdi_net_gdp 898 -.1149388 .4578029 -1.325101 3.96432
pei_net_gdp 883 -.0492586 .4349047 -5.908342 1.063381
fdi_net_gdp 899 .0477339 .2110826 -.9955325 1.310691
Variable Obs Mean Std. Dev. Min Max
Table A2 Descriptive statistics

Ministry of Economy and Finance
Department of the Treasury
Directorate I: Economic and Financial Analysis
Address: Via XX Settembre, 97 00187 - Rome Websites: www.mef.gov.it www.dt.tesoro.it/it/ e-mail: [email protected] Telephone: +39 06 47614202 +39 06 47614197 Fax:
+39 06 47821886