Embed Size (px)
Citation preview
i
Dynamics of arbuscular mycorrhizal fungi in pasture plants
in response to fertiliser and soil amendments
Ahmed Rashid Sukkar Alsharmani
M.Sc Agricultural Science, Kufa University (2010)
B.Sc Agricultural Science (Plant Protection), Kufa University (2003)
This thesis is presented for the degree of Doctor of Philosophy at
The University of Western Australia
UWA School of Agriculture and Environment, Faculty of Science
2019

ii
Dedication
In memory of my father and my nephew Ali
To my mother “the candle in the dark nights“
To my beloved brothers and sisters
To my loving wife “Maryam” and my sons
Abdullah, Ali and Haidarah
iii
THESIS DECLARATION
I, Ahmed Rashid Sukkar Alsharmani, certify that:
This thesis has been substantially accomplished during enrolment in the degree.
This thesis does not contain material which has been submitted for the award of any other
degree or diploma in my name, in any university or other tertiary institution.
No part of this work will, in the future, be used in a submission in my name, for any other
degree or diploma in any university or other tertiary institution without the prior approval of
The University of Western Australia and where applicable, any partner institution responsible
for the joint-award of this degree.
This thesis does not contain any material previously published or written by another person,
except where due reference has been made in the text and, where relevant, in the Declaration
that follows.
The work(s) are not in any way a violation or infringement of any copyright, trademark, patent,
or other rights whatsoever of any person.
Signature:
Date:
08/01/2019
iv
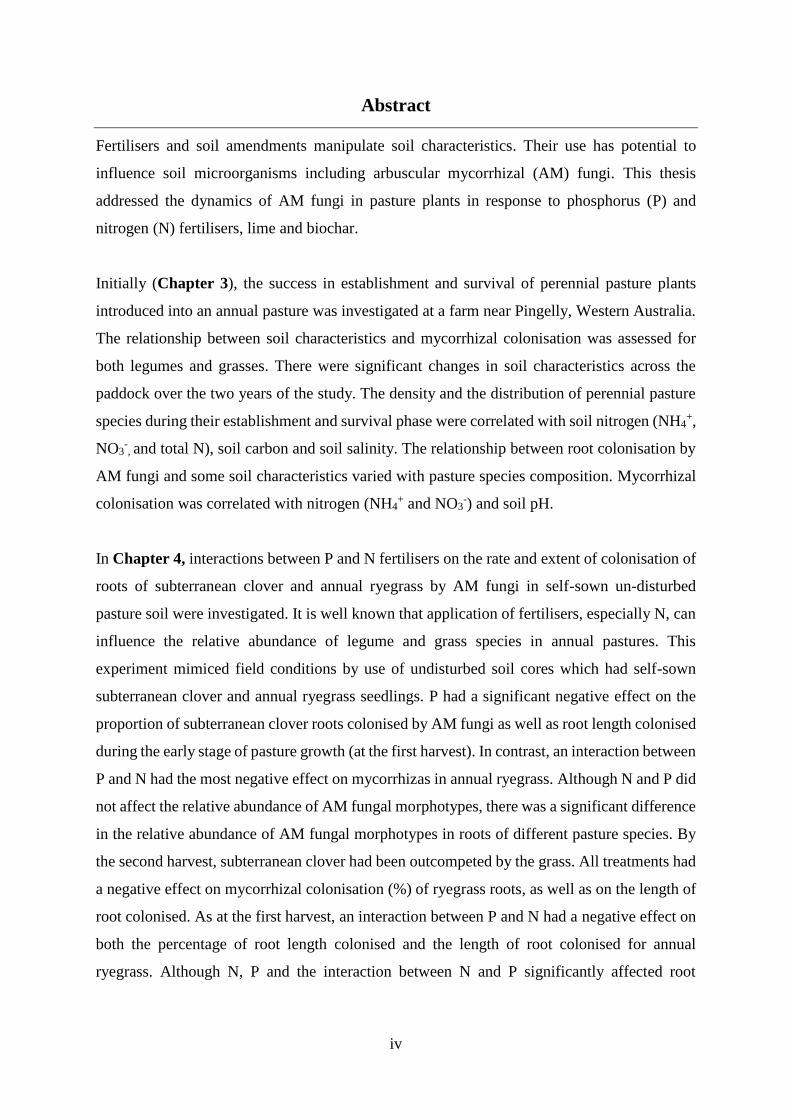
Abstract
Fertilisers and soil amendments manipulate soil characteristics. Their use has potential to
influence soil microorganisms including arbuscular mycorrhizal (AM) fungi. This thesis
addressed the dynamics of AM fungi in pasture plants in response to phosphorus (P) and
nitrogen (N) fertilisers, lime and biochar.
Initially (Chapter 3), the success in establishment and survival of perennial pasture plants
introduced into an annual pasture was investigated at a farm near Pingelly, Western Australia.
The relationship between soil characteristics and mycorrhizal colonisation was assessed for
both legumes and grasses. There were significant changes in soil characteristics across the
paddock over the two years of the study. The density and the distribution of perennial pasture
species during their establishment and survival phase were correlated with soil nitrogen (NH4+,
NO3-, and total N), soil carbon and soil salinity. The relationship between root colonisation by
AM fungi and some soil characteristics varied with pasture species composition. Mycorrhizal
colonisation was correlated with nitrogen (NH4+ and NO3
-) and soil pH.
In Chapter 4, interactions between P and N fertilisers on the rate and extent of colonisation of
roots of subterranean clover and annual ryegrass by AM fungi in self-sown un-disturbed
pasture soil were investigated. It is well known that application of fertilisers, especially N, can
influence the relative abundance of legume and grass species in annual pastures. This
experiment mimiced field conditions by use of undisturbed soil cores which had self-sown
subterranean clover and annual ryegrass seedlings. P had a significant negative effect on the
proportion of subterranean clover roots colonised by AM fungi as well as root length colonised
during the early stage of pasture growth (at the first harvest). In contrast, an interaction between
P and N had the most negative effect on mycorrhizas in annual ryegrass. Although N and P did
not affect the relative abundance of AM fungal morphotypes, there was a significant difference
in the relative abundance of AM fungal morphotypes in roots of different pasture species. By
the second harvest, subterranean clover had been outcompeted by the grass. All treatments had
a negative effect on mycorrhizal colonisation (%) of ryegrass roots, as well as on the length of
root colonised. As at the first harvest, an interaction between P and N had a negative effect on
both the percentage of root length colonised and the length of root colonised for annual
ryegrass. Although N, P and the interaction between N and P significantly affected root
v
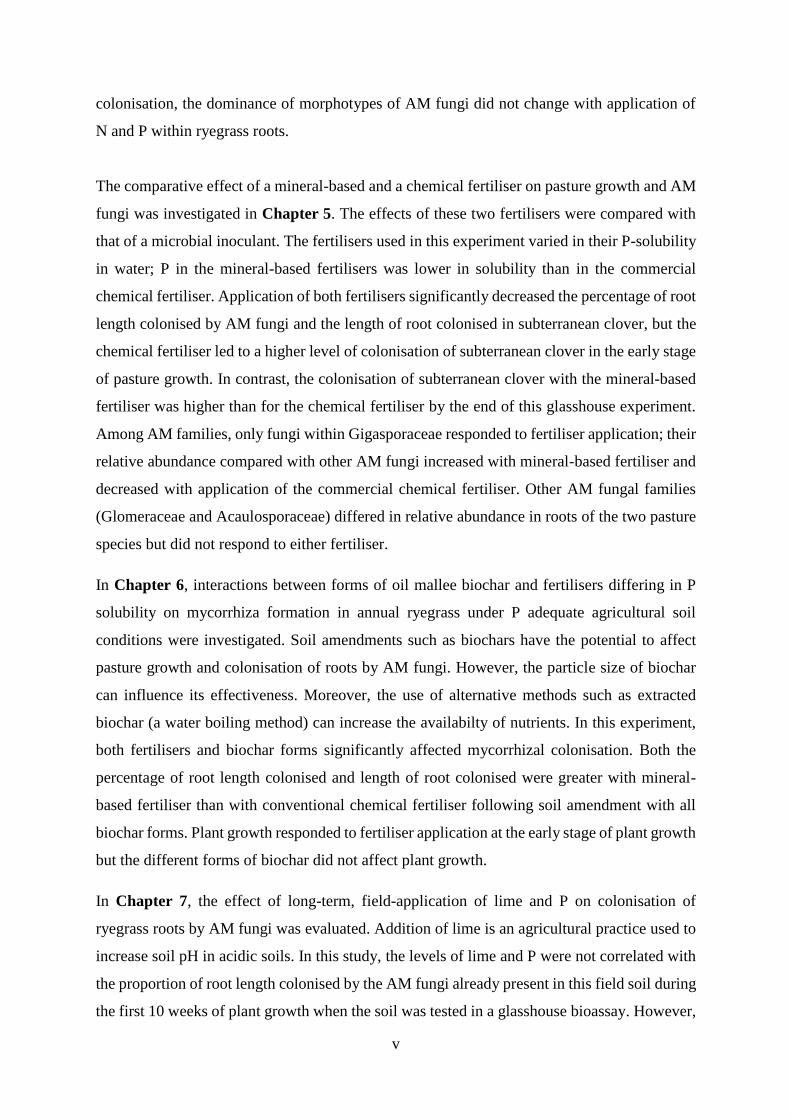
colonisation, the dominance of morphotypes of AM fungi did not change with application of
N and P within ryegrass roots.
The comparative effect of a mineral-based and a chemical fertiliser on pasture growth and AM
fungi was investigated in Chapter 5. The effects of these two fertilisers were compared with
that of a microbial inoculant. The fertilisers used in this experiment varied in their P-solubility
in water; P in the mineral-based fertilisers was lower in solubility than in the commercial
chemical fertiliser. Application of both fertilisers significantly decreased the percentage of root
length colonised by AM fungi and the length of root colonised in subterranean clover, but the
chemical fertiliser led to a higher level of colonisation of subterranean clover in the early stage
of pasture growth. In contrast, the colonisation of subterranean clover with the mineral-based
fertiliser was higher than for the chemical fertiliser by the end of this glasshouse experiment.
Among AM families, only fungi within Gigasporaceae responded to fertiliser application; their
relative abundance compared with other AM fungi increased with mineral-based fertiliser and
decreased with application of the commercial chemical fertiliser. Other AM fungal families
(Glomeraceae and Acaulosporaceae) differed in relative abundance in roots of the two pasture
species but did not respond to either fertiliser.
In Chapter 6, interactions between forms of oil mallee biochar and fertilisers differing in P
solubility on mycorrhiza formation in annual ryegrass under P adequate agricultural soil
conditions were investigated. Soil amendments such as biochars have the potential to affect
pasture growth and colonisation of roots by AM fungi. However, the particle size of biochar
can influence its effectiveness. Moreover, the use of alternative methods such as extracted
biochar (a water boiling method) can increase the availabilty of nutrients. In this experiment,
both fertilisers and biochar forms significantly affected mycorrhizal colonisation. Both the
percentage of root length colonised and length of root colonised were greater with mineral-
based fertiliser than with conventional chemical fertiliser following soil amendment with all
biochar forms. Plant growth responded to fertiliser application at the early stage of plant growth
but the different forms of biochar did not affect plant growth.
In Chapter 7, the effect of long-term, field-application of lime and P on colonisation of
ryegrass roots by AM fungi was evaluated. Addition of lime is an agricultural practice used to
increase soil pH in acidic soils. In this study, the levels of lime and P were not correlated with
the proportion of root length colonised by the AM fungi already present in this field soil during
the first 10 weeks of plant growth when the soil was tested in a glasshouse bioassay. However,

vi
available P was positively correlated with the length of root colonised by AM fungi during this
period. In contrast, available P was negatively correlated with the proportion of root length
colonised by AM fungi at the later stages of ryegrass growth but was not correlated with the
length of roots colonised. Lime residue was positively correlated with the relative abundance
of the family Glomeraceae while for the family Gigasporaceae, lime residue had a negative
correlation with their relative abundance.
In summary, this thesis provides an example of how soil management practices, such as use of
P-fertilisers with different solubilities and the use of soil amendments such as biochar and lime,
have potential to influence colonisation of roots by AM fungi in pasture ecosystems of south-
western Australia.

vii
Table of Contents
CHAPTER 1: General Introduction
1.1 General Introduction ........................................................................................ 1
1.2 Aims and Thesis Structure ............................................................................... 6
CHAPTER 2: Literature Review
2.1 Literature Review............................................................................................. 9
2.2 Factors affecting pasture establishment and productivity ................................ 9
2.2.1 Climatic conditions .......................................................................................... 9
2.2.2 Soil chemical fertility ..................................................................................... 10
2.2.2.1 Soil acidity ..................................................................................................... 10
2.2.2.2 Soil salinity .................................................................................................... 11
2.2.2.3 Soil nutrient availability ................................................................................. 12
2.2.3 Soil biological fertility ................................................................................... 13
2.3 The role of arbuscular mycorrhizal (AM) fungi in pasture ecosystems ........ 13
2.3.1 Soil nutrient effects on AM fungi .................................................................. 14
2.3.2 Other soil chemical properties influencing AM fungi ................................... 17
2.3.3 Soil amendments influencing AM fungi ........................................................ 17
2.4 AM fungi and molecular tools ....................................................................... 19
CHAPTER 3: Spatial and temporal distribution of perennial pasture species in
relation to soil characteristics and mycorrhizal root colonisation
3.1 Abstract .......................................................................................................... 22
3.2 Introduction .................................................................................................... 23
3.3 Materials and Methods ................................................................................... 25
3.3.1 Field site soil sampling .................................................................................. 25
3.3.2 Soil analysis ................................................................................................... 28
3.3.3 Pasture survival and density........................................................................... 30
3.3.4 AM colonisation............................................................................................. 30
3.3.5 Statistical analysis .......................................................................................... 30
3.4 Results ............................................................................................................ 31
3.4.1 Soil characteristics ......................................................................................... 31
3.4.2 Abundance and the diversity of pasture species ............................................ 34
3.4.3 Pasture productivity ....................................................................................... 38
3.4.4 AM colonisation............................................................................................. 39
3.5 Discussion ...................................................................................................... 42
3.6 Conclusion ..................................................................................................... 44
viii
CHAPTER 4: Interactions between phosphorus and nitrogen alter mycorrhizal
colonisation in two co-existing annual pasture species
4.1 Abstract .......................................................................................................... 45
4.2 Introduction .................................................................................................... 46
4.3 Material and methods ..................................................................................... 50
4.4 Results ............................................................................................................ 52
4.4.1 Plant Biomass................................................................................................. 52
4.4.2 Total N and P in plant tissue .......................................................................... 53
4.4.3 Soil Nutrients ................................................................................................. 56
4.4.4 AM colonisation............................................................................................. 57
4.4.5 Mycorrhizal relative abundance ..................................................................... 58
4.5 Discussion ...................................................................................................... 66
4.6 Conclusion ..................................................................................................... 69
CHAPTER 5: Effects of mineral-based and conventional chemical fertilisers on
mycorrhizal communities and nutrient uptake in pasture plants
5.1 Abstract .......................................................................................................... 70
5.2 Introduction .................................................................................................... 71
5.3 Material and methods ..................................................................................... 73
5.3.1 Soil sampling ................................................................................................. 73
5.3.2 Experimental design....................................................................................... 74
5.3.3 AM colonisation............................................................................................. 75
5.3.4 Available N, extracted P, soil acidity and soil salinity .................................. 76
5.3.5 DNA extraction and sequencing .................................................................... 76
5.3.6 Bioinformatics method................................................................................... 77
5.3.7 Statistical Analysis ......................................................................................... 77
5.4 Results ............................................................................................................ 78
5.4.1 Plant Biomass................................................................................................. 78
5.4.2 Mycorrhizal abundance .................................................................................. 81
5.4.2.1 AM colonisation............................................................................................. 81
5.4.2.2 AM fungal community composition and structure ........................................ 85
5.4.2.3 Alpha diversity and richness of AM fungi ..................................................... 87
5.4.3 Soil characteristics ......................................................................................... 90
5.4.3.1 Soil available N and P at harvests .................................................................. 90
5.4.3.2 Soil acidity and soil salinity ........................................................................... 90
5.5 Discussion ...................................................................................................... 93
5.6 Conclusion ..................................................................................................... 95
ix
CHAPTER 6: Interactions between forms of oil mallee biochar and fertilisers of
different solubility on mycorrhiza formation in annual ryegrass under
adequate phosphorus condition
6.1 Abstract .......................................................................................................... 96
6.2 Introduction .................................................................................................... 97
6.3 Material and methods ..................................................................................... 99
6.3.1 Soil sampling and preparing .......................................................................... 99
6.3.2 Biochar characterisation................................................................................. 99
6.3.3 Experimental design..................................................................................... 100
6.3.4 Plant growth and analysis ............................................................................ 101
6.3.5 AM colonisation........................................................................................... 101
6.3.6 Soil analysis ................................................................................................. 101
6.3.7 Data and statistical analyses ......................................................................... 102
6.4 Results .......................................................................................................... 102
6.4.1 Plant biomass ............................................................................................... 102
6.4.2 Root colonisation ......................................................................................... 103
6.4.3 Shoot P and N .............................................................................................. 105
6.4.4 Soil characteristics at harvests ..................................................................... 106
6.5 Discussion .................................................................................................... 110
6.6 Conclusion ................................................................................................... 112
CHAPTER 7: Evaluation of the residual effect of long-term application of lime and
phosphorus on mycorrhizal fungi and ryegrass growth
7.1 Abstract ........................................................................................................ 113
7.2 Introduction .................................................................................................. 114
7.3 Material and methods ................................................................................... 115
7.3.1 Soil sampling and the experimental design ................................................. 115
7.3.2 Plant growth and analysis ............................................................................ 116
7.3.3 Total shoot N and P...................................................................................... 117
7.3.4 AM colonisation........................................................................................... 117
7.3.5 DNA extraction and PCR amplification ...................................................... 117
7.3.6 Bioinformatics method................................................................................. 118
7.3.7 Soil analysis ................................................................................................. 118
7.3.8 Soil respiration ............................................................................................. 118
7.3.9 Data and statistical analyses ......................................................................... 118
7.4 Results .......................................................................................................... 119
7.4.1 Plant growth ................................................................................................. 119
7.4.2 AM colonisation........................................................................................... 119
7.4.3 Relative abundance of AM fungal families ................................................. 123

x
7.4.4 Alpha diversity and richness of AM fungi ................................................... 124
7.4.5 Soil respiration ............................................................................................. 128
7.4.6 Soil characteristics ....................................................................................... 128
7.5 Discussion .................................................................................................... 132
7.6 Conclusion ................................................................................................... 134
CHAPTER 8: General Discussion
8.1 Overview ...................................................................................................... 135
8.2 Key research findings .................................................................................. 135
8.3 Limitations of the research presented in this thesis ..................................... 140
Reference ……………………………………………………………………………. 142

xi
ACKNOWLEDGEMENTS
First of all, I would like to express my sincere thanks to my supervisor Emeritus Professor
Lynette Abbott for all your support during my PhD journey.
Thank you my co-supervisor Dr Zakaria Solaiman for your guidance in technical aspects and
statistical analysis.
Finally, thank you to my third supervisor Assistant Professor Matthias Leopold for your
valuable support and for your advice.
Special thanks to Dr Bede Mickan for your assistance with molecular work and statistics.
Thank you to Professor K Siddique, because I was able to join The University of Western
Australia for my PhD studies because of your recommendation.
Thank you to Michael Smirk, Darryl Roberts and Kirsty Brooks for your assistance with soil
and plant analyses.
Thank you to Mr Riley Faulds for assistance with Decipher software.
I would like to express my appreciation to my colleagues and staff members, especially Dr
Yoshi Sawada for his help and support especially during the first two years of my PhD research.
Special thanks to the higher Committee for Education Development in Iraq (HCED) for
providing a PhD scholarship for my study at The University of Western Australia.
To my family in Iraq especially my mother for her prayers, and my brother Dr Faris.
I would like to express my appreciation to my uncle Professor Majeed Dewan and his wife
Professor Sabah Alwan for their encouragement and for financial support.
Finally, I would like to extend my love and greatest gratitude to my wife Maryam for all her
prayers, mentoring and support throughout this research. Without your support, I would not be
able to finish my PhD. I am very lucky to have someone like you to support me during all the
hard times of my life and putting yourself behind me without any expectation.
xii
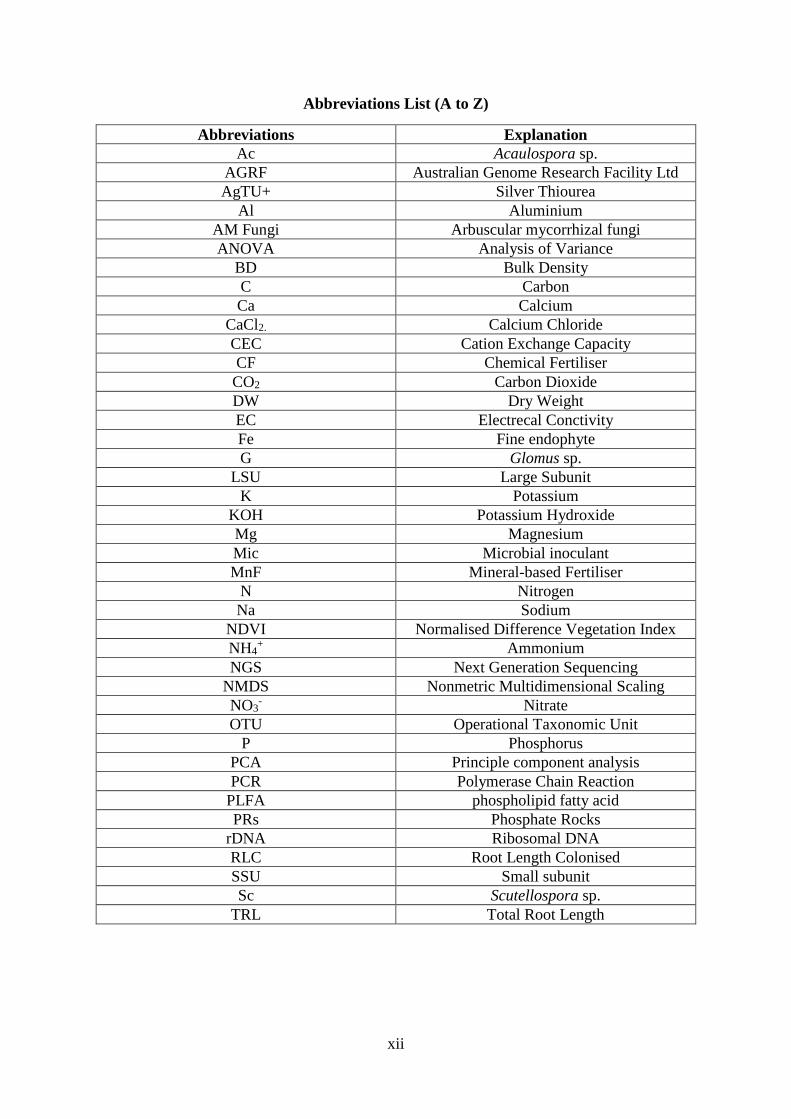
Abbreviations List (A to Z)
Abbreviations Explanation
Ac Acaulospora sp.
AGRF Australian Genome Research Facility Ltd
AgTU+ Silver Thiourea
Al Aluminium
AM Fungi Arbuscular mycorrhizal fungi
ANOVA Analysis of Variance
BD Bulk Density
C Carbon
Ca Calcium
CaCl2. Calcium Chloride
CEC Cation Exchange Capacity
CF Chemical Fertiliser
CO2 Carbon Dioxide
DW Dry Weight
EC Electrecal Conctivity
Fe Fine endophyte
G Glomus sp.
LSU Large Subunit
K Potassium
KOH Potassium Hydroxide
Mg Magnesium
Mic Microbial inoculant
MnF Mineral-based Fertiliser
N Nitrogen
Na Sodium
NDVI Normalised Difference Vegetation Index
NH4+ Ammonium
NGS Next Generation Sequencing
NMDS Nonmetric Multidimensional Scaling
NO3- Nitrate
OTU Operational Taxonomic Unit
P Phosphorus
PCA Principle component analysis
PCR Polymerase Chain Reaction
PLFA phospholipid fatty acid
PRs Phosphate Rocks
rDNA Ribosomal DNA
RLC Root Length Colonised
SSU Small subunit
Sc Scutellospora sp.
TRL Total Root Length

xiii
Chapter One: General Introduction
1
1 CHAPTER 1
1.1 General Introduction
In sustainable agriculture, pastures play a crucial role beyond providing livestock feed by
improving soil in crop rotations. Appropriate management strategies in pastures can reduce
greenhouse gases emission which can help mitigate and adapt to the consequences of climate
change (Carvalho et al. 2014). Since the 1900s, Australia has used annual and perennial
pastures intensively to improve soil characteristics and increase the availability of nitrogen (N)
(Morley and Katznelson 1965) in addition to control plant diseases and weeds (Howieson et al.
2000). Climate conditions in south-western Australia and soil properties play important roles
in the establishment of annual and perennial pastures (Howieson et al. 2000; Hutchings 1972).
In this region of Australia, perennial pastures have been given increasing attention due to their
tolerance of summer dry periods in providing out-of-season green feed for livestock (Bell et al.
2006; Cocks 2001; Ward 2006). Perennial pastures can also play important roles in increasing
water use efficiency and minimising deep drainage to groundwater in addition to reducing soil
wind erosion by maintaining plant cover over summer (Moore et al. 2006). The establishment
of pasture plants can be affected by many factors including climate conditions (Hutchings
1972), soil chemical physical and characteristics (de Moraes et al. 1996) and soil amendments
(Chapman et al. 2003; Ryan and Ash 1999; Taghizadeh-Toosi et al. 2011).
South-western Australia has a Mediterranean climate with a strong winter dominant rainfall
especially between May and October when 70-75% of rainfall received in (Moore et al. 2006).
The enrichment of CO2 has potential to promote growth in field and controlled conditions
(Tubiello et al. 2007). Enrichment of CO2 can also directly affect photosynthesis in addition to
improving water and nutrient cycles (Ainsworth and Long 2005). In general, pasture plants are
considered more responsive than crops with regards to CO2 enrichment (Ainsworth and Long
2005; Long et al. 2006; Nowak et al. 2004). Under a Mediterranean climate, annual pasture
species are generally more suitable than perennial species due to the long dry period over
summer. Nevertheless, under some conditions, perennial pasture has an advantage. For
instance, early autumn rain can lead to false breaks which can reduce annual pasture seed bank
which is not a problem for perennial pastures under the same condition (Rogers and Beresford
1970). Late rain in spring or early summer can negatively affect and reduce the quality and
bulk of dry annual pasture, but they can also promote perennial pasture growth especially in
warm climate conditions (Moore et al. 2006).

Chapter One: General Introduction
2
The establishment of effective pastures depends on soil chemical and physical properties. Soil
acidity has an important influence on the establishment of legumes within pastures. Soil acidity
can alter nutrient forms, especially for P and N, which in turn affects plant diversity (Wang et
al. 2012). Communities of soil microorganisms can also be altered by soil acidity (Fierer and
Jackson 2006; Jenkins et al. 2009; Rousk et al. 2010). Variation in relative abundance of soil
microorganisms can affect both the establishment and diversity of plant species (Dhillion and
Gardsjord 2004).
Soil salinity is another factor affecting the establishment of pastures. Salinity can disrupt cell
function, either through toxic effects of specific ions, osmatic effects, or both (Munns 2002;
Munns 2005). In saline soil, seed germination and seedling establishment can be restricted in
pastures, especially in annual legumes, and this process is repeated each year (Smith and
Stoneman 1970). In contrast, some perennial pasture plants show increased tolerance of soil
salinity and are even used to reduce the spread of salinity by increasing water use via their deep
root systems (Halvorson and Reule 1980; White et al. 2003). Studies in south-western Australia
have shown that species of Phalaris can use more water than annual pasture species, especially
in the medium rainfall zone (Dolling 2001; Scott and Sudmeyer 1993).
Nutrient availability can affect the establishment and growth of pastures. In general, increasing
nutrient availability can reduce species richness depending on nutrient capture and
accumulation of biomass (Al-Mufti et al. 1977; Grime 1979). Previous studies have shown that
in some soils, nutrient deficiency can limit both pasture productivity and diversity (Thurston et
al. 1976; Willems et al. 1993). With regards to nutrient effects, N has the greatest impact on
pasture productivity and diversity (Mountford et al. 1993). N can affect and alter the diversity
of grasslands (Bobbink and Willems 1991; Willems 2001). The change in pasture species
diversity by N enrichment may vary depending on the inherent variation of pasture species to
N-use efficiency in addition to soil N content (Standish et al. 2012; Xia and Wan 2008; Xu et
al. 2015) and the N addition level (Niu et al. 2018). This is consistent with other studies which
have shown that N enrichment can affect forbs and grasses species (Henry et al. 2006;
Huenneke et al. 1990). This is mainly due to competition for light between plants growing at
high levels of productivity, which can lead to competitive exclusion and decline in species
richness, giving grasses an advantage over other species, especially N-fixing species (Weiss
1999; Zavaleta et al. 2003). P deficiency can lead to a higher maximum number of plant
species, as demonstrated in a soil with low (5 mg/100 g dry soil) available P (Janssens et al.
1998). Some pasture species have special adaptation for N or P accessibility, and a limitation
Chapter One: General Introduction
3
in N and/or P can affect species richness by affecting their productivity (Venterink et al. 2003).
Hence, the diversity of pasture species can be manipulated using different sources of nutrients
including N, P, K and Ca based on their requirements (Pianka 2011).
Soil amendments such as lime continue to receive attention as essential components of
agricultural management practices. The use of lime for ameliorating soil acidity has been
widely used (Lundström et al. 2003). Lime application has potential to increase soil pH and
base cation (calcium and magnesium) as well as decrease soil toxicity by heavy metals
(Ingerslev 1997; Zezschwitz 1998). Lime has also been shown to influence the dissolution of
organic carbon, and this, in turn, can modify soil organic matter decomposition (Chan and
Heenan 1999). The region of south-western Australia has widely used lime as a soil amendment
in pasture and crop ecosystems (Grover et al. 2017; Wang et al. 2016) to improve plant growth
and the functioning of soil microorganisms (Coventry and Hirth 1992b; Pritchard et al. 2010).
Lime has been used in combination with agricultural practices (Coventry and Hirth 1992a) or
fertilisers and other soil amendments (Cann 2000; Hamza and Anderson 2002) to maximise
the beneficial effects on pasture growth and soil microorganisms.
In contrast to lime, biochars currently receive less attention but are attracting interest within
some sections of the farming community. Biochars are produced by anaerobic thermal
degradation of organic matter (Lehmann and Joseph 2009). Use of some sources of biochars
can reduce greenhouse gases emission especially CO2 (Zhang et al. 2012). In agriculture, some
biochars can increase the availability of soil nutrients by changing soil pH or by increasing the
cation exchange capacity (Lehmann and Joseph 2012). Important attributes of pyrolysed
biochars affecting biochemical cycling of nutrients are: high surface area (which has the
prospect to increase soil water holding capacity), pH, nutrient content and cation exchange
capacity (CEC) (Bélanger et al. 2004; Glaser et al. 2002; Keech et al. 2005; Liang et al. 2006).
Application of biochar has been widely studied not just as a soil amendment that improves
plant growth but also as a practice to reduce greenhouse gases (Macdonald et al. 2014; Maucieri
et al. 2017). Moreover, some biochars have potential to enhance the performance of soil
microorganisms, including arbuscular mycorrhizal (AM) fungi (Mickan et al. 2016).
AM fungi are symbiotic associations which are believed to be as ancient as land plants (Nath
et al. 2017; Pirozynski and Malloch 1975; Stubblefield et al. 1987). They are ubiquitous soil
fungi that form associations with more than three-quarters of terrestrial plant species and can
facilitate nutrient uptake especially P (Smith and Read 2008) and resistance to biotic and
Chapter One: General Introduction
4
abiotic stress (Mickan et al. 2016; Nadeem et al. 2014). Therefore, AM fungi are integral
components of plant ecosystems, with potential to alter plant growth, plant diversity and
ecosystem processes (Allen 1991; Read 1991; Rillig 2004). Although AM fungi can improve
nutrient uptake plants, P and N can also affect the abundance and functioning of AM fungi
(Johnson et al. 2010). When P is at a sufficient level in soil for plant growth, the application of
P can negatively affect the abundance and the functioning of mycorrhizal fungi (Propster and
Johnson 2015). Ryan and Ash (1999) showed that adding P reduced AM colonisation (%) of
white clover roots, and this reduction was associated with changes in phospholipid content in
root cells which can affect the permeability of cell membrane and the carbohydrates exudation.
N enrichment can negatively affect biodiversity of both above and underground organisms
(Phoenix et al. 2012; Tilman and Cowan 1989). As for P, when N is sufficient, N enrichment
can negatively affect the abundance and functioning of AM fungi (Johnson et al. 2010). This
is because plants tend to allocate more photosynthate to above ground parts and less
photosynthate to roots and AM fungi, and this in turn influences the amount of carbon received
by AM fungi (Jakobsen and Rosendahl 1990; Marschner et al. 1996). However, the abundance
of AM fungi can increase, decrease or remain stable following addition of N (Eom et al. 1999;
Kårén and Nylund 1997; Treseder and Allen 2000). Bradley et al. (2006) elucidated that
increasing N availability in a grassland soil reduced the abundance of AM fungi and increased
the proportion of bacteria. Other experimental N enrichment studies have shown that
colonisation of roots by AM fungi can vary from positive to negative but there may also be no
effect (Johnson et al. 2003). Many mechanisms have been proposed to explain the decline in
fungal biomass with N application (Bääth et al. 1981). One theory suggested that adding
fertilisers can increase the toxicity of some ions in the soil solution and these ions can inhibit
microbial growth directly (Broadbent 1965). The decline soil pH is another mechanism that
can result from N enrichment, and this decrease can accelerate Mg and Ca leaching in addition
to affecting aluminium mobilisation; in this case, microorganisms may suffer Mg or Ca
limitation, or may suffer Al toxicity (Vitousek et al. 1997). However, the most important
mechanism of N enrichment is inhibition of carbon allocation to the AM fungi (Axel et al.
2005).
Agricultural practices such as P and N enrichment, use of slow-release compared to more
soluble conventional fertilisers, and soil amendments (such as biochars and lime) applied in
different combinations can all alter the productivity and diversity pasture plants as well as alter
AM fungal community. Therefore, to enhance pasture productivity and minimise negative
Chapter One: General Introduction
5
ecological consequences, options for farm management practices include: (i) use of selected
levels of P and N that promote pasture growth (legumes and grasses) with less negative
consequences on soil microorganisms (Høgh-Jensen and Schjoerring 2010; Mendoza et al.
2016), (ii) use of slow-release and conventional (soluble) fertilisers for promoting pasture
growth and maintaining functional associations with symbiotic microorganisms such as
rhizobia and AM fungi (Van Geel et al. 2016), (iii) use of biochars in combination with
fertilisers (Alburquerque et al. 2013; Lou et al. 2015) which contribute to nutrient and soil pH,
and reduce nutrient leaching, and (iv) use of lime to manage soil pH which can affect the
availability of soil nutrients (Lundström et al. 2003), legume root nodule bacteria and AM
fungi. Interactions among these soil management practices investigated in this thesis are listed
in Figure 1-1.
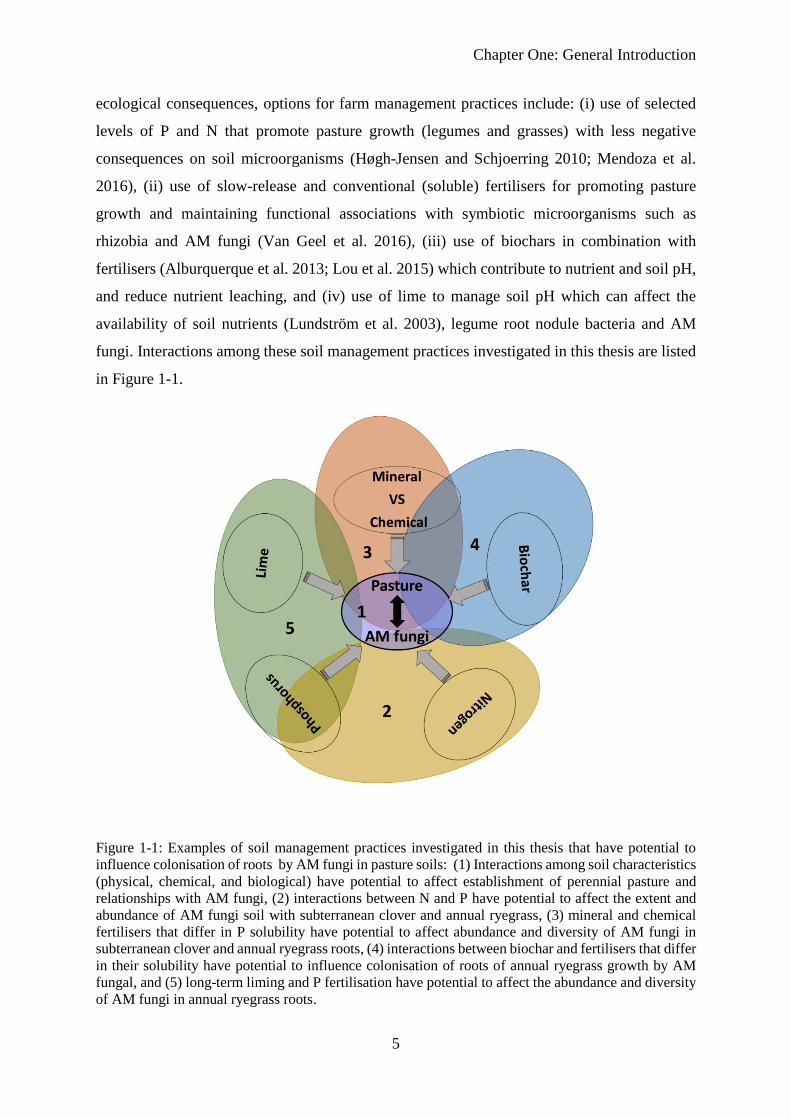
Figure 1-1: Examples of soil management practices investigated in this thesis that have potential to
influence colonisation of roots by AM fungi in pasture soils: (1) Interactions among soil characteristics
(physical, chemical, and biological) have potential to affect establishment of perennial pasture and
relationships with AM fungi, (2) interactions between N and P have potential to affect the extent and
abundance of AM fungi soil with subterranean clover and annual ryegrass, (3) mineral and chemical
fertilisers that differ in P solubility have potential to affect abundance and diversity of AM fungi in
subterranean clover and annual ryegrass roots, (4) interactions between biochar and fertilisers that differ
in their solubility have potential to influence colonisation of roots of annual ryegrass growth by AM
fungal, and (5) long-term liming and P fertilisation have potential to affect the abundance and diversity
of AM fungi in annual ryegrass roots.
Chapter One: General Introduction
6
1.2 Aims and Thesis Structure
The overall objectives and hypotheses of the thesis are summarised in Table 1-1.
Chapter 1 introduces factors that affect the establishment and productivity of pastures and the
formation of mycorrhizas. Research objectives and aims are introduced.
Chapter 2. Literature review is divided into two main sections: (i) the importance of pastures
in south-western Australia and factors affecting the establishment and productivity of pastures,
and (ii) factors affecting the abundance and diversity of AM fungi including fertilisers and
other soil amendments.
Chapter 3 is the first experimental chapter. It is a field study (i) monitoring the distribution of
perennial pasture species during establishment and maintenance phases of a mixed perennial-
annual pasture, in relation to soil characteristics (physical, chemical, and biological), and (ii)
evaluating the relationship between AM fungi in roots of perennial and annual pasture plants
and soil characteristics. A two-year monitoring study was conducted to assess the establishment
of perennial grasses sown into an annual pasture mixture. The density of perennial grasses was
assessed in 2015 (establishment phase) and 2016 (maintenance phase). Root colonisation for
annual and perennial pastures was assessed during these two phases to identify any
relationships between soil characteristics and the formation of mycorrhizas.
Chapter 4 is the second experimental chapter. It investigated how interactions between P and
N applied to a pasture alter the rate and extent of colonisation of roots of subterranean clover
and annual ryegrass by AM fungi indirectly via of effects on root growth. Undisturbed soil
cores were collected from an annual pasture and P and N fertiliser treatments were applied
under glasshouse conditions. Self-sown subterranean clover and annual ryegrass seedlings
grew in the soil cores (mimicking field conditions), and plants were harvested at 5 and 8 weeks
after cores were collected from the field.
Chapter 5 is the third experimental chapter. It evaluated effects of fertilisers of different
elemental solubility in comparison to a microbial inoculant with respect to the relative
abundance of AM fungi in relation to root growth of subterranean clover and annual ryegrass
in an agricultural soil. A commercial mineral-based fertiliser and a commercial chemical
fertiliser were each applied at ~5.6 kgha-1 P. The effects of these soil amendments on the
diversity of AM fungi was assessed.
Chapter One: General Introduction
7
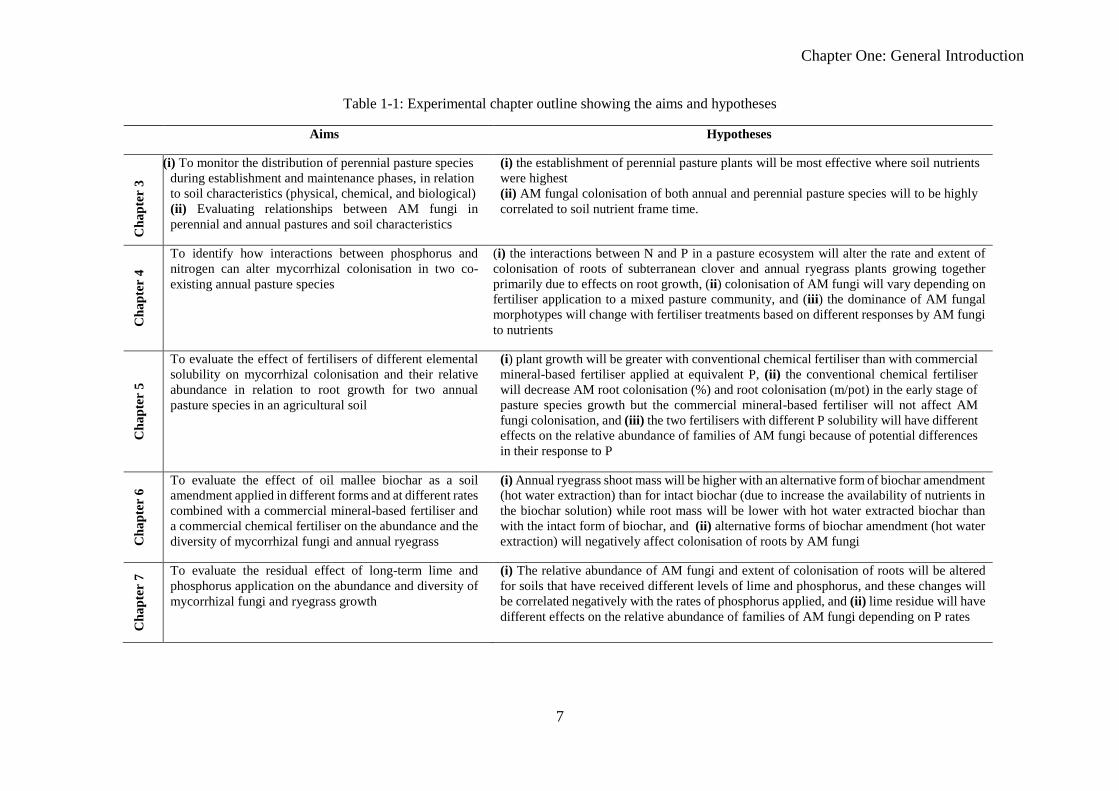
Table 1-1: Experimental chapter outline showing the aims and hypotheses
Aims Hypotheses C
ha
pte
r 3
(i) To monitor the distribution of perennial pasture species
during establishment and maintenance phases, in relation
to soil characteristics (physical, chemical, and biological)
(ii) Evaluating relationships between AM fungi in
perennial and annual pastures and soil characteristics
(i) the establishment of perennial pasture plants will be most effective where soil nutrients
were highest
(ii) AM fungal colonisation of both annual and perennial pasture species will to be highly
correlated to soil nutrient frame time.
Ch
ap
ter
4
To identify how interactions between phosphorus and
nitrogen can alter mycorrhizal colonisation in two co-
existing annual pasture species
(i) the interactions between N and P in a pasture ecosystem will alter the rate and extent of
colonisation of roots of subterranean clover and annual ryegrass plants growing together
primarily due to effects on root growth, (ii) colonisation of AM fungi will vary depending on
fertiliser application to a mixed pasture community, and (iii) the dominance of AM fungal
morphotypes will change with fertiliser treatments based on different responses by AM fungi
to nutrients
Ch
ap
ter
5
To evaluate the effect of fertilisers of different elemental
solubility on mycorrhizal colonisation and their relative
abundance in relation to root growth for two annual
pasture species in an agricultural soil
(i) plant growth will be greater with conventional chemical fertiliser than with commercial
mineral-based fertiliser applied at equivalent P, (ii) the conventional chemical fertiliser
will decrease AM root colonisation (%) and root colonisation (m/pot) in the early stage of
pasture species growth but the commercial mineral-based fertiliser will not affect AM
fungi colonisation, and (iii) the two fertilisers with different P solubility will have different
effects on the relative abundance of families of AM fungi because of potential differences
in their response to P
Ch
ap
ter
6 To evaluate the effect of oil mallee biochar as a soil
amendment applied in different forms and at different rates
combined with a commercial mineral-based fertiliser and
a commercial chemical fertiliser on the abundance and the
diversity of mycorrhizal fungi and annual ryegrass
(i) Annual ryegrass shoot mass will be higher with an alternative form of biochar amendment
(hot water extraction) than for intact biochar (due to increase the availability of nutrients in
the biochar solution) while root mass will be lower with hot water extracted biochar than
with the intact form of biochar, and (ii) alternative forms of biochar amendment (hot water
extraction) will negatively affect colonisation of roots by AM fungi
Ch
ap
ter
7 To evaluate the residual effect of long-term lime and
phosphorus application on the abundance and diversity of
mycorrhizal fungi and ryegrass growth
(i) The relative abundance of AM fungi and extent of colonisation of roots will be altered
for soils that have received different levels of lime and phosphorus, and these changes will
be correlated negatively with the rates of phosphorus applied, and (ii) lime residue will have
different effects on the relative abundance of families of AM fungi depending on P rates
Chapter One: General Introduction
8
Chapter 6 is the fourth experimental chapter. It investigated the response of AM fungi and
annual ryegrass growth and nutrition following application of oil mallee biochar (OMB) in
different forms and at different rates in combination with a commercial mineral-based fertiliser
and a commercial chemical fertiliser. Intact, powdered and hot water extracted OMB were
applied at rate of 10 and 20 t/h. Fertilisers were applied at rate ~5.6 kgha-1 P for all treatments
including the control.
Chapter 7 is the fifth experimental chapter. It investigated the effect of residual lime and
phosphorus on AM fungi and ryegrass growth in soil collected from a field experiment which
had been established 5 years previously. In this experiment, the relative abundance of AM fungi
and their diversity in ryegrass roots was assessed.
Chapter 8 is the general discussion which integrates knowledge from the experimental
chapters in relation to the literature and identifies potential future research.
Chapter Two: Literature review
9
2 CHAPTER 2
2.1 Literature Review
Pasture plants play a significant role in livestock production and the management of crop
rotations, and they can contribute to reducing greenhouse gas emissions which are a primary
cause of climate change (Carvalho et al. 2014; Dickhoefer et al. 2010). Australia has used
annual and perennial pastures in crop rotations not just for fixing nitrogen and enhancing soil
properties, but also for controlling diseases, pests and weeds (Howieson et al. 2000; Morley
and Katznelson 1965). The Mediterranean climate in south-western Australia and the
properties of soil in this region play significant roles in establishment of annual and perennial
pastures (Howieson et al. 2000; Hutchings 1972). However, climate change and associated
increases in global temperature are reducing the patterns of rainfall (Howden et al. 2008).
Annual pastures have traditionally been grown in these conditions, but perennial pastures offer
the opportunity of providing a feed gap in summer periods (Bell et al. 2006; Cocks 2001; Ward
2006). Hence, researchers have tried to identify strategies to enhance pasture productivity using
combinations of fertilisers, pasture species and soil amendments (Chapman et al. 2003; Ryan
and Ash 1999; Taghizadeh-Toosi et al. 2011).
2.2 Factors affecting pasture establishment and productivity
Pasture growth and distribution, as for other plants, are affected by many factors that impact
on their productivity and spatial distribution.
Climatic conditions
Plant production and development of both crops and pastures are affected by the atmospheric
conditions such as the concentration of CO2, change in temperature and rainfall (Change 2007;
Griggs and Noguer 2002). During the last four decades, hundreds of studies have shown the
impacts of CO2 enrichment on plant growth. These studies have illustrated that the increase in
CO2 concentration can promote plant growth both in field conditions or under controlled
(glasshouse) conditions (Tubiello et al. 2007). The concentration of CO2 can influence and
improve water and nutrient cycles, in addition to increasing photosynthesis by 10-50%
depending on the plant species, and all these factors contribute to producing higher biomass
(Ainsworth and Long 2005). Previous studies have shown that the response of crops to the
Chapter Two: Literature review
10
concentration of CO2 was lower than for the response of pasture species (Ainsworth and Long
2005; Long et al. 2006; Nowak et al. 2004).
Temperature is another factor that impacts both crop and pasture growth, and this will be
greater when combined with other determinates such as CO2 (Tubiello et al. 2007). This may
have a greater effect during particular periods; for example, increasing temperature during the
flowering time of crops can minimise the positive effect of high concentrate of CO2 and reduce
the quality and quantity of yield (Caldwell et al. 2005; Thomas et al. 2003). Moreover, when
temperatures increase during periods of more rapid growth, the effect of CO2 may have an
indirect influence by maximising water demand (Aranjuelo et al. 2005). Meanwhile, in
pastures, increasing temperatures combined with high CO2, rainfall, and N deposition can
increase productivity. This can also influence the distribution of pasture species (Aranjuelo et
al. 2005; Shaw et al. 2002).
Soil chemical fertility
Soil properties, including soil acidity, salinity and nutrient availability, can influence both plant
growth and plant distribution.
2.2.2.1 Soil acidity
Soil acidity plays a significant role in regulating and determining plant growth via a number of
different mechanisms. First, pH can determine the dominant forms of some soil nutrients which
are essential to plant growth. For instance, pH can impact P forms in soil (Wang et al. 2012).
In acidic soil, the dominant forms are Fe, Al phosphates, and they can be bound to Fe and Al
oxidase and mobilised by organic anion by ligand exchange, while in the alkaline soil, the
dominant forms are Ca-bound phosphates that can mobilise by acidification (Hinsinger 2001;
Sommers and Lindsay 1979). Another role of pH is related to the distribution and abundance
of soil microorganisms. Previous studies have shown that in particular circumstances soil
acidity has a strong effect on bacterial communities and can affect the spatial distribution and
bacterial biomass of specific bacterial groups in grassland (Fierer and Jackson 2006; Jenkins
et al. 2009; Rousk et al. 2010). In contrast, fungal distribution and biomass were either less
affected or unaffected by the change in soil pH (Rousk et al., 2010). Soil pH can control soil
microbial communities either directly or indirectly, by affecting other soil factors such as
Chapter Two: Literature review
11
nutrients, moisture, organic matter or plant species (Lauber et al. 2008; Rousk et al. 2010). The
sensitivity of bacterial communities toward soil acidity may vary due to the majority of
bacterial taxa occurring across a relatively narrow range in pH (3-5) (Rosso et al. 1995), while
fungal species have wider pH optima between 5-9 units without exhibiting significant
inhibition in growth (Rousk et al. 2010). Soil acidity can also affect one or more factors that
influence the availability of soil nutrients.
2.2.2.2 Soil salinity
Soil salinity is a major problem restricting agricultural productivity in Australia. Nearly 6Mha
have been recorded as being at risk from the salinity as a result of shallow water tables and this
area is expected to grow up to 17Mha by mid of the 21st Century (Dolling et al. 2001). Western
Australia has the greatest salt-lands among all Australian States. In the middle of last century,
there was considerable interest in revegetation salt-lands using perennial pastures (Smith and
Malcolm 1959). The two mechanisms associated with the effect of salinity on plant cell
functioning are (i) the toxicity (inside the roots) of specific ions, and (ii) the osmotic effect
(outside the roots) (Munns 2002; Munns 2005). For the ion toxicity mechanism, specific ions
can reduce metabolic activity, and as a result of an increase the concentration of these ions in
plant cells, the plants may die when salinity exceeds a critical level (Munns 2005). The osmotic
effect occurs as a result of water deficit, which in turn is due to a reduction in cell turgor (Munns
2002). Soil salinity plays an important role in affecting the germination of pasture especially
for annual pasture legumes (Smith and Stoneman 1970) compared with perennial pasture
species (Nichols et al. 2008b). Rainfall has been reported to have the greatest influence through
leaching of salts from the soil surface and this can directly enhance germination of seeds of
pasture plants so that the most salt–sensitive pasture species will not be able to establish
(Nichols et al. 2008a).
Subterranean clover can vary in its tolerance to salinity. For example, during the vegetation
growth stage of some annual pasture legumes, there can be reduced initial seed germination for
species that are more salt tolerant (Rogers and Noble 1991). Furthurmore, West and Taylor
(1981) showed that pasture dry matter yield decreased significantly with an increase the salinity
of soil. Previous study showed that some perennial pasture species such as Lotus maroccanus
have more than 75% growth in 120mol/m3 compared to with lucerne at 50-70% (Greub et al.
1985; Rogers et al. 1996). Legume pasture plants such as Trifolium fragiferum and white clover
appear to show less tolerance of salinity than lucerne (Schachtman and Kelman 1991). In
Chapter Two: Literature review
12
general for salinity responses, the more tolerant grasses show greater tolerance than the more
tolerant legumes (Greub et al. 1985; Rogers et al. 1996).
2.2.2.3 Soil nutrient availability
Nutrients can limit pasture productivity and diversity (Thurston et al. 1976; Willems et al.
1993). However, increasing nutrient availability can reduce species richness depending on the
ability of these species to capture nutrients and accumulation of biomass rapidly (Al-Mufti et
al. 1977; Grime 1979). Other agricultural practices such as grazing and manipulation of
hydrological properties also affect pastures (Oomes et al. 1996; Smith et al. 1996; Smith et al.
2000).
N often has a significant impact on either on pasture productivity or plant species diversity
(Mountford et al. 1993). Despite the fact that N enrichment is used to increase pasture
productivity (Báez et al. 2007), it can also negatively affect the abundance and diversity of
plants, especially native plants and associated soil microorganisms (Báez et al. 2007; Erland
and Taylor 2003). Previous studies have proposed explanations by which N can affect the
diversity of plants (Goldberg and Miller 1990; Grime 1973; Huston and DeAngelis 1994) and
the majority proposed that competition for light between living plants at high levels of
productivity lead to more competitive exclusion and decline species richness (Abrams 1995).
However, these theories do not take into account the possible effects of accumulated plant litter
in contributing to diminishing the diversity particularly in productivity of plants. Therefore,
diversity can also be influenced by the depth of litter layer which can inhibit the establishment
of plant species either mechanically or via shading effects (Carson and Peterson 1990; Facelli
1994; Goldberg and Werner 1983; Tilman and Pacala 1993).
P can also affect pasture growth in some soils, as well as the maximum number of species when
there is low available P (Janssens et al. 1998). Differences among plant species in their ability
to exploit limiting nutrients can impact the coexistence of different species (Tilman 1981). As
some plant species are adapted to efficient use of N and P, a limitation in one of them can affect
species richness by affecting their productivity (Venterink et al. 2003). Hence, the diversity of
pasture species can be altered by varying application rates of N, P, K, and Ca according to the
requirements of species (Pianka 2011), and soil nutrient levels.
Chapter Two: Literature review
13
Soil biological fertility
Microbial diversity is a critical parameter of soil health and soil function associated with soil
structure, organic matter decomposition and remediation of toxins, in addition to cycling of P,
N and C (Garbeva et al. 2004). Agricultural soils contain diverse microbial communities, with
common groups like bacteria within the genera Bacillus and Pseudomonas, fungi like
Penicillium and Aspergillus spp. (Kucey 1983), protists (Osler and Sommerkorn 2007), yeasts
(Botha 2011) and archaea (Philippot et al. 2013). Arbuscular mycorrhizal (AM) fungi are also
common in most soils and provide beneficial effects for plants (Linderman 1988). These
microorganisms do not just offer plants many services, but may affect the diversity of plants,
especially in grasslands (Dhillion and Gardsjord 2004). The range of these effects vary from
positive (Gange et al. 1993) to negative (Smith et al. 1999) but no effects are also recorded
(Šmilauer and Šmilauerová 2000). Previous studies have explained the ways that AM fungi
can improve plant growth, associated with improved uptake of inorganic nutrients (Bolan 1991;
Koide 1991). This can be important during seedling establishment, especially in nutrient
limiting conditions because it can determine the diversity of plant species (Read 1991).
Newman and Reddell (1988) showed that the richness of some herb species has a positive
correlation with the abundance of AM fungi. They proposed that seedlings germinating in the
presence of AM fungi were more likely to establish compared those without AM fungi. Allen
(1991) suggested that AM fungi increase plant species diversity because the variation in fungal
infectivity present in field soils allows non-mycotrophic species to establish in the presence of
low levels of AM fungi and mycotrophic species to recruit under conditions with higher levels
of AM fungi. AM fungi can contribute to reducing plant competitive exclusion and increase
the diversity of species in tallgrass pastures (Hartnett and Wilson 1999). AM fungal hyphae
can explore soil for available nutrients, especially P, and play a significant role to transport it
to plants equally regardless of the patterns of P distribution (Cui and Caldwell 1996). This in
turn, can maintain the population of less competitive plant species because underground
competition is minimised.
2.3 The role of arbuscular mycorrhizal (AM) fungi in pasture ecosystems
AM fungi (Division Glomeromycota) are obligate symbionts that have relationships with more
than 80% of plant species (Smith and Read 2008). Plants supply carbon sources as
carbohydrates to AM fungi, and on the other hand, AM fungi provide many services to plants
such as induced systemic resistance against pathogens and increased drought resistance by
Chapter Two: Literature review
14
improving water uptake. However, improving nutrient uptake especially P, is the most
significant advantage of these fungi in soils deficient in P (Allen et al. 2003; Nouri et al. 2014;
Smith and Smith 2012). Examples of direct effects of AM fungi on pasture growth are
presented in Table 2-1.
The uptake of nutrients can occur via two pathways: either (i) directly by plant roots, depending
on the concentration of nutrients in the soil solution and the volume of the root system (George
et al. 1995; Kothari et al. 1990), or (ii) indirectly through the extraradical hyphae of AM fungi
(Li et al. 2013; Marschner and Dell 1994; Smith and Smith 2011). In most plant families, plants
rely on this pathway to acquire nutrients. As a rule, the limitation in these resources not only
has the ability to control the path used to acquire some nutrients from soil (Allen et al. 2003),
but also some nutrients such as P have the capacity to shape the relationship between plant
roots and AM fungi (Johnson et al. 2010). The abundance and the functions of AM fungi can
be affected by many factors as discussed below.
Soil nutrient effects on AM fungi
Although AM fungi can improve P uptake in particular (Smith and Read 2008), both P and N
can affect the functioning and abundance of AM fungi (Johnson et al. 2010). Nutrient
enrichment of grassland, especially with N, can significantly affect productivity. For example,
N enrichment can affect the soil biodiversity of above and underground organisms negatively
(Phoenix et al. 2012; Tilman and Cowan 1989). With N enrichment, plants tend to allocate
more photosynthate to aboveground parts (shoots, leaves, and stems) and less photosynthate to
plant root and mycorrhizal fungi, and this in turn influences the amount of carbon received by
AM fungi (Jakobsen and Rosendahl 1990; Marschner et al. 1996). However, adding N to the
agricultural system can produce inconsistent impacts on hyphal biomass of AM fungi. The
abundance of AM fungi can increase, decrease or stay stable by adding N (Eom et al. 1999;
Kårén and Nylund 1997; Treseder and Allen 2000). Bradley et al. (2006) elucidated that the
increase in N availability in grassland soil can reduce the abundance of AM fungi and increase
the proportion of bacteria. Other experimental N enrichment studies have also shown that AM
colonisation of plant roots vary from positive, no respond, to negative (Johnson et al. 2003).
Such variation among studies may be due to the differences in climatic condition, primary soil
N:P, and plant community (Klironomos et al. 1996). Many mechanisms have been proposed to
explain the decline in fungal biomass with N application (Bääth et al. 1981). The first theory

Chapter Two: Literature review
15
suggests that adding fertilisers can increase the toxicity of some ions in soil solution and these
ions can inhibit microbial growth directly (Broadbent 1965).
16
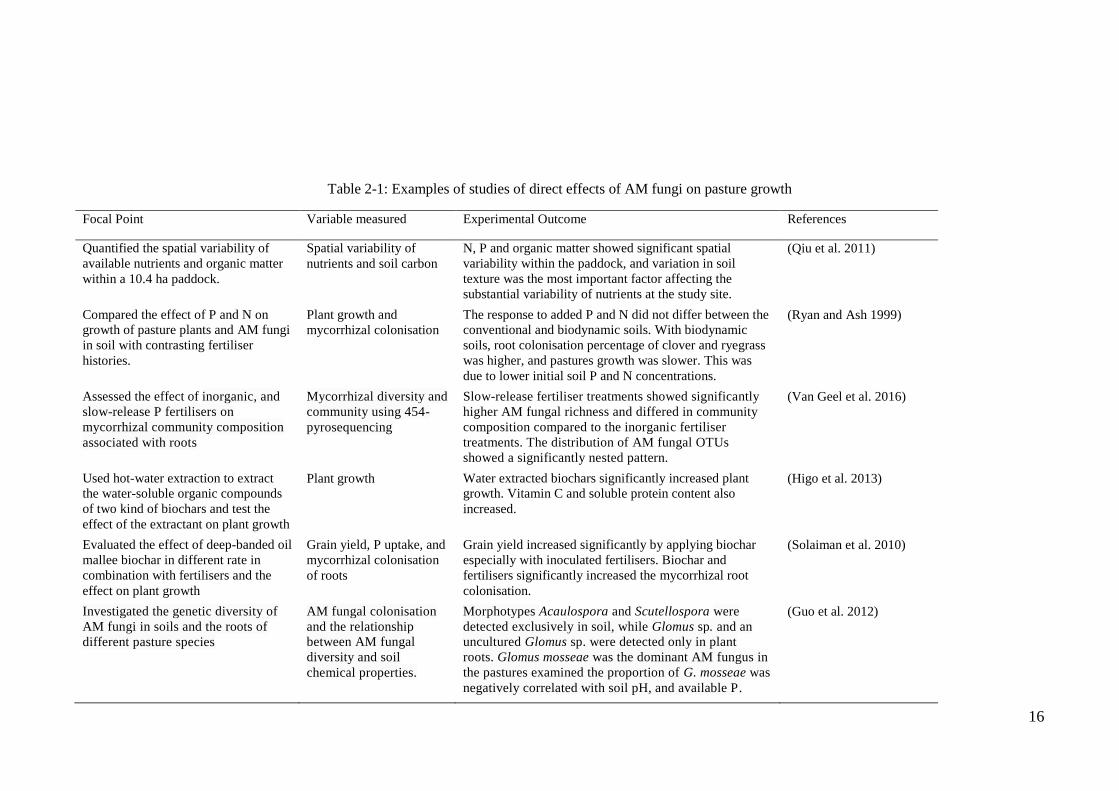
Table 2-1: Examples of studies of direct effects of AM fungi on pasture growth
Focal Point Variable measured Experimental Outcome References
Quantified the spatial variability of
available nutrients and organic matter
within a 10.4 ha paddock.
Spatial variability of
nutrients and soil carbon
N, P and organic matter showed significant spatial
variability within the paddock, and variation in soil
texture was the most important factor affecting the
substantial variability of nutrients at the study site.
(Qiu et al. 2011)
Compared the effect of P and N on
growth of pasture plants and AM fungi
in soil with contrasting fertiliser
histories.
Plant growth and
mycorrhizal colonisation
The response to added P and N did not differ between the
conventional and biodynamic soils. With biodynamic
soils, root colonisation percentage of clover and ryegrass
was higher, and pastures growth was slower. This was
due to lower initial soil P and N concentrations.
(Ryan and Ash 1999)
Assessed the effect of inorganic, and
slow-release P fertilisers on
mycorrhizal community composition
associated with roots
Mycorrhizal diversity and
community using 454- pyrosequencing
Slow-release fertiliser treatments showed significantly
higher AM fungal richness and differed in community
composition compared to the inorganic fertiliser
treatments. The distribution of AM fungal OTUs
showed a significantly nested pattern.
(Van Geel et al. 2016)
Used hot-water extraction to extract
the water-soluble organic compounds
of two kind of biochars and test the
effect of the extractant on plant growth
Plant growth
Water extracted biochars significantly increased plant
growth. Vitamin C and soluble protein content also
increased.
(Higo et al. 2013)
Evaluated the effect of deep-banded oil
mallee biochar in different rate in
combination with fertilisers and the
effect on plant growth
Grain yield, P uptake, and
mycorrhizal colonisation
of roots
Grain yield increased significantly by applying biochar
especially with inoculated fertilisers. Biochar and
fertilisers significantly increased the mycorrhizal root
colonisation.
(Solaiman et al. 2010)
Investigated the genetic diversity of
AM fungi in soils and the roots of
different pasture species
AM fungal colonisation
and the relationship
between AM fungal
diversity and soil
chemical properties.
Morphotypes Acaulospora and Scutellospora were
detected exclusively in soil, while Glomus sp. and an
uncultured Glomus sp. were detected only in plant
roots. Glomus mosseae was the dominant AM fungus in
the pastures examined the proportion of G. mosseae was
negatively correlated with soil pH, and available P.
(Guo et al. 2012)
Chapter Two: Literature review
17
Other soil chemical properties influencing AM fungi
Soil pH significantly affects abiotic soil factors such as the availability of soil carbon (Aciego
Pietri and Brookes 2008b; Kemmitt et al. 2006), in addition to nutrient availability (Aciego
Pietri and Brookes 2008a; Kemmitt et al. 2005), and the solubility of metals (Firestone et al.
1983; Flis et al. 1993). This, in turn, affects biotic soil factors, especially the biomass
composition of bacteria and fungi in agricultural soils (Arao 1999; Bardgett et al. 2001). With
regard to AM fungi, Abbott and Robson (1977) illustrated that pH of soil could affect the
number of AM spores without affecting the abundance of different spore types in Western
Australian agricultural soils. The number of spores in that study was higher in the soil with
high pH than the soil with low pH. The distribution of AM fungi can be limited by the acidity
or the alkalinity of soil (Porter et al. 1987a; Porter et al. 1987b). However, some AM fungal
species can grow in both conditions (Abbott and Robson 1991). With regards to root
colonisation, pH has some effects and although growth of AM fungi ranges between 4.5-7.7,
some species can grow at extreme pH levels (Porter et al. 1987b; Wang et al. 1993).
Furthermore, Bardgett et al. (2001) demonstrated that the composition and structure of the AM
fungal community can be affected by a change in soil pH and this influence of soil pH was
strongly affected when interacting with other abiotic factors especially C/N ratio and soil P.
Soil salinity is another factor may influence AM growth and activity. Although the fact that
salinity can promote the dependency of plants on AM fungi, previous studies have shown that
soil salinity can inhibit mycorrhizal colonisation by reducing spore germination (Hirrel 1981),
reducing hyphal growth and hyphal spreading (McMillen et al. 1998), and reduce arbuscule
number (Pfetffer and Bloss 1988).
Soil amendments influencing AM fungi
Biochars are produced by anaerobic thermal degradation of organic matter, and it can be used
in the amendment of agricultural soil (Lehmann and Joseph 2009). They have been used in
modern agricultural practice for many reasons. First, some sources of biochars can reduce
greenhouse gas emissions, especially carbon dioxide (Zhang et al. 2012). Furthermore, some
biochars can affect the availability of nutrients by manipulating pH in acidic soil or by
increasing the cation exchange capacity (Lehmann and Joseph 2012). However, biochars can
also be associated with improving the diversity and abundance of microorganisms in
rhizospheres (Lehmann et al. 2011; Solaiman et al. 2010). Previous studies have highlighted
Chapter Two: Literature review
18
that biochar particles can serve as a habitat for soil microorganisms that protects them from
predators and parasites (Lehmann et al. 2011; Steinbeiss et al. 2009). As a source of energy or
mineral nutrients, use of biochar can induce changes in soil community composition (Ameloot
et al. 2013; Saito and Marumoto 2002; Warnock et al. 2007). Biochars may also modify the
communication among soil biota by adsorbing essential signalling molecule(s) (Masiello et al.
2013). Although some studies demonstrated that biochars can have negative or no effect on
plant growth and AM fungi in particular circumstances (Warnock et al. 2007), other studies
have shown that that some can improve plant production by increasing nutrients availability
(Blackwell et al. 2010).
Biochars have potential to play significant roles in changing physico-chemical soil properties.
This in turn, can increase the availability of soil nutrients and may lead to improved plant
performance and increased nutrient concentrations in plant tissue, and in addition, elevate plant
root colonisation by AM fungi (Ishii and Kadoya 1994). Biochars may also affect the ability
of AM fungi to colonise plant seedlings and promote seedling growth. In addition, biochars
can help to accelerate colonisation (Warnock et al. 2007). Moreover, Yao et al. (2012)
illustrated that some sources of biochar can reduce the leaching of both N and P by up to 34
and 21% respectively. This in turn, can eliminate the cost of agricultural production and
maximise productivity especially when biochar is combined with slow release fertilisers and
AM fungi.
The negative effects of some kinds of biochar under particular circumstances may be due to
their impact on the availability of nutrients. For instance, use of biochars limited the P uptake
by plants compared with plants grown in river sand or clay-brick (Gaur and Adholeya 2000).
This study proposed that P was less available in the presence of biochar (Gaur and Adholeya
2000). Furthermore, Wallstedt et al. (2002) demonstrated that biochar can decrease the bio-
availability of organic C and N in the mycorrhizal system they investigated.
For plant benefit, liming soil increases the availability of phosphate and reduces the toxicity of
soil by some ions (Haynes 1982). Acid soil syndrome occurs due to phytotoxicity by some ions
such as aluminium (Al+3), and manganese (Mn2+) and hydrogen (H+), and with a deficiency in
potassium (K), calcium (Ca) and P (Whelan and Alexander 1986). Lime can interact with P
fertiliser to augment plant growth. However, this effect is not always obvious (Maddox and
Soileau 1991). Lime application can directly affect the distribution of AM fungi by affecting
soil pH but Abbott and Robson (1985) found that in acid soil (pH<5.3), the colonisation of
Chapter Two: Literature review
19
roots by Glomus sp. in clover roots was reduced while the effect of pH was less for Glomus
fasciculatum.
These findings are consistent with other studies that showed that effects of soil pH on the
distribution of AM fungi vary depending on the mycorrhizal fungus species (Dumbrell et al.
2009; Göransson et al. 2008; Guo et al. 2012; Postma et al. 2007). This variation is due to the
differing sensitivity of AM fungi to soil pH (described above) and variation in plant tolerance
changes in soil pH (Clark 1997; Lux and Cumming 2001). Thus, it is possible that some AM
fungi can moderate soil pH stress in plants by improving nutrient uptake or by sequestering Al
(Clark and Zeto 1996; Lux and Cumming 2001; Yano and Takaki 2005). However, where AM
fungi are sensitive to low pH and/or high concentrations of Al, the range of soil pH that enables
plants to get a beneficial effect from AM fungi may be narrow (Aarle et al. 2002; Bartolome-
Esteban and Schenck 1994; Clark 1997).
2.4 AM fungi and molecular tools
AM fungi (Phylum Glomeromycota) are classified as a species-poor group of root symbionts
despite the fact that the appearance of this group coincided with the first appearance of land
plants (Bonfante and Genre 2008). Morphologically, more than 250 morphotypes have been
defined compared to 350 to 1000 molecularly defined (Kivlin et al. 2011; Öpik et al. 2013a).
In order to evaluate the spatial distribution of AM fungi, conventional approaches such as
estimation of root colonisation by AM fungi as a whole community (Giovanetti and Mosse
1980) or by morphotypes of AM fungi within the community (Abbott 1982) and estimation of
the diversity of spores (Picone 2000) have been used. However, the density and diversity of
spores may not correlate with root colonisation (Wilde et al. 2009). Moreover, the density of
root colonised by morphotypes can vary within the same root system (Gazey et al. 1992). The
use of DNA sequencing technology allows detection of changes in the abundance of AM fungi
(Dumbrell et al. 2010b; Lekberg et al. 2011). However, the global AM diversity based on
classification approaches that generate operational taxonomic units (OTUs) which cannot be
used easily to compare among studies in different areas (Öpik et al. 2013a; Opik et al. 2010).
In many geographic regions and ecosystems, communities of AM fungi have not been studied
yet (Öpik et al. 2013b; Tedersoo et al. 2014). Furthermore, morphotype and DNA sequencing
based assessment of AM fungi may not always be well aligned (Shi et al. 2012).
Chapter Two: Literature review
20
Since the 1990s, more attention has been given to use molecular and phylogenetic sequence
analysis techniques especially cloning and Sanger sequencing (Opik et al. 2008) in
quantification, identification and comparing of AM fungal community (Gamper et al. 2009;
Shi et al. 2012). Thus, many polymerase chain reaction (PCR) primers have been designed and
used specifically to quantify and identify AM fungi (Alkan et al. 2004; Krüger et al. 2009;
Liang et al. 2017). Although these primers were designed using either large subunit (LSU) or
small subunit (SSU) rDNA sequencing, the majority of research relies on a fragment of SSU
rDNA marker (Simon et al. 1992) to identify AM fungi and encompass many different
approaches (Gollotte et al. 2004; Krüger et al. 2009; Lee et al. 2008; Simon et al. 1993).
By the 2000s, further advances such as use of 454 sequencing and next generation sequencing
(NGS) enabled sequencing depth (the number of sequences per sample) to be maximised to
thousands of sequences per sample (Shokralla et al. 2012). This allowed investigation of
changes in AM fungal communities and other fungi (Hart et al. 2015; Lindahl et al. 2013;
Taylor et al. 2017). With regard to AM fungal diversity, 454 sequencing has been replaced by
high resolution sequencing platforms such as Illumina, Ion Torrent and PacBio SMRT
sequencing (Johansen et al. 2016; Schlaeppi et al. 2016). The precision of Illumina sequencing
compared to 454 sequencing, in addition to increasing sequencing depth per sample (“up to
two orders of magnitude”), allowed this approach to be used widely in AM fungal community
and ecology (Shokralla et al. 2012). One limitation about Illumina sequencing is that the
maximum sequence length returned by this approach is relatively short which causes a
limitation when this approach uses in AM fungal diversity studies that usually using amplicon
lengths range 540 to 1500 bp (Öpik and Davison 2016). To overcome this limitation, the
increase in Illumina MiSeq read length up to 2x300bp can be used in addition to other
approaches such as tagmentation which permit sequencing of longer DNA fragments
(Schlaeppi et al. 2016).
AM fungal diversity in grassland communities has been examined in both field and glasshouse
conditions using Illumina sequencing approach (Cui et al. 2016; Johansen et al. 2016; Orchard
et al. 2017a). Cui et al (2016) demonstrated that in some cases the diversity of AM fungi was
lower compared with the levels typical of 454 sequencing which may occur due to an effect of
extreme environmental conditions in the sites studied. A study conducted by Johansen et al.
(2016) in dune grass roots recovered AM fungi from the majority of root samples sequenced
using Illumina sequencing with a broad phylogenetic coverage of clades.
Chapter Two: Literature review
21
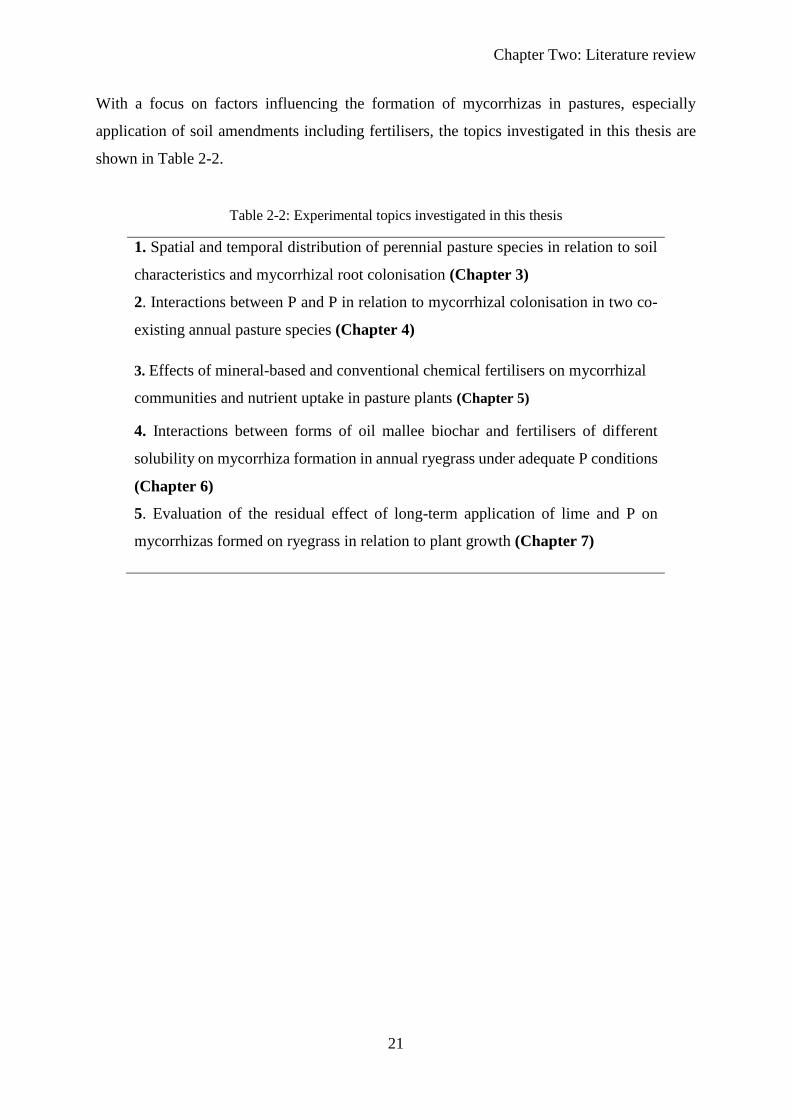
With a focus on factors influencing the formation of mycorrhizas in pastures, especially
application of soil amendments including fertilisers, the topics investigated in this thesis are
shown in Table 2-2.
Table 2-2: Experimental topics investigated in this thesis
1. Spatial and temporal distribution of perennial pasture species in relation to soil
characteristics and mycorrhizal root colonisation (Chapter 3)
2. Interactions between P and P in relation to mycorrhizal colonisation in two co-
existing annual pasture species (Chapter 4)
3. Effects of mineral-based and conventional chemical fertilisers on mycorrhizal
communities and nutrient uptake in pasture plants (Chapter 5)
4. Interactions between forms of oil mallee biochar and fertilisers of different
solubility on mycorrhiza formation in annual ryegrass under adequate P conditions
(Chapter 6)
5. Evaluation of the residual effect of long-term application of lime and P on
mycorrhizas formed on ryegrass in relation to plant growth (Chapter 7)
Chapter Three
22
3 CHAPTER 3
Spatial and temporal distribution of perennial pasture species in relation
to soil characteristics and mycorrhizal root colonisation
3.1 Abstract
The use of annual pastures within cropping systems of south-western Australia has
contributed benefits including nitrogen fixation, plant disease control and enhancement of
soil properties. In contrast, perennial pastures have rarely been used in the Wheatbelt in
Western Australia (WA). Soil characteristics influence the selection of suitable annual
pasture species but the extent to which this occurs for perennial pasture species is not well
known for temperate areas of south-western Australia. Therefore, a field study was carried
out at Ridgefield Farm, Pingelly, WA to investigate the success of establishment and
survival of perennial pasture species when introduced into an annual pasture. The
relationship between pasture plant species distribution in this mixed annual-perennial
pasture and soil properties was also investigated. The hypotheses examined were: (i) the
establishment of perennial pasture grasses would be most effective where soil nutrients were
highest, and (ii) arbuscular mycorrhizal (AM) fungal colonisation of both annual and
perennial pasture species would be highest where soil nutrients were lowest. Seven plots
25×25 m within a 9 ha pasture were monitored and the occurrence of pasture plants was
assessed twice in 2015 and twice in 2016. At each sampling time, soil samples were collected
at two depths (0-10 cm) and (10-30 cm) with ten samples per plot at each depth. Survival
and density of perennial and annual pasture species were measured during winter and spring.
Mycorrhizal colonisation was determined for root samples collected from different pasture
species. There were significant changes in soil characteristics such as available nitrogen
(NH4+ and NO3
-), extractable phosphorus (P), soil acidity (pH), soil salinity (EC), cation
exchange capacity (CEC) and bulk density across the paddock during the time of the study.
The density of perennial grasses and subterranean clover was highly correlated to soil NO3-
and EC but not for annual ryegrass. In contrast, the densities of subterranean clover and the
perennial grasses were highly correlated to NH4+, soil carbon and total N, while that of
annual ryegrass was only correlated to NO3- during the maintenance phase. Colonisation of
perennial grass roots varied among the plots and during the establishment phase. In contrast,
there was considerable variation in root colonisation of subterranean clover and annual
ryegrass during the maintenance phase. Root AM colonisation of perennial and annual
Chapter Three
23
grasses was highly correlated to soil available N (both NH4+ and NO3
-) and soil EC whereas
AM colonisation of subterranean root was correlated to soil C and total N during the
establishment phase. Meanwhile, AM colonisation of perennial grasses was weakly
correlated to soil NO3- and soil acidity compared to annual ryegrass which was correlated to
soil CEC. Soil characteristics varied within the timeframe of this monitoring study and
variation in soil nutrients influenced the spatial distribution of perennial grasses within this
mixed perennial/annual pasture. The influence of some soil characteristics appeared to
restrict the establishment of perennial grasses in this pasture as well as colonisation of roots
of these plants by AM fungi.
3.2 Introduction
In recent decades, interest in understanding and evaluating the environmental changes
especially the change in regard of collecting temporal landscape information for the change
in soil properties has increased significantly (Weindorf and Zhu 2010). This highlights the
importance of soil management to ensure the environmental and economic sustainability of
agricultural system (Bouma 2014). In Australia, farmers have traditionally used annual
pastures in crop rotations not just for fixing nitrogen and enhancing soil properties, but also
for controlling diseases and other pests and weeds (Morley and Katznelson 1965; Howieson
et al. 2000). The Mediterranean climate in south-western Australia and the properties of the
soil in this region impose significant constraints on the establishment of both annual and
perennial pasture plants (Hutchings 1972; Howieson et al. 2000). Although annual pastures
have traditionally been grown in these conditions, perennial pastures offer the opportunity
of providing a feed gap in summer periods (Cocks 2001; Bell et al. 2006; Ward 2006). In
addition to the climate conditions, the establishment of pasture can be restricted by many
other factors such as soil chemical and physical properties (Wang et al. 2012; Grime et al.
1997) and soil microrganisms including AM fungi (Dhillion and Gardsjord 2004).
Soil acidity can regulate and restrict plant growth by determining the dominant forms of soil
nutrients, which are essential to plant growth. For instance, pH can impact P forms in the
soil which, together with N is commonly a limiting nutrient in soil (Wang et al. 2012). Soil
pH can also influence the distribution and abundance of soil microorganisms in grassland
(Fierer and Jackson 2006; Jenkins et al. 2009; Rousk et al. 2010). Nevertheless, fungal
distribution and biomass may be less or not affected by the change in soil pH than bacteria
Chapter Three
24
(Rousk et al., 2010). Soil pH can influence soil microbial communities either directly
through impacts of hydrogen ions (Rousk et al. 2008), or indirectly when soil pH affects
other soil factors such as nutrient concentration, soil moisture, organic matter decomposition
and plant species (Lauber et al. 2008; Rousk et al. 2010).
Nutrients can limit pasture productivity and diversity (Thurston et al. 1976; Willems et al.
1993). However, increasing nutrient availability can reduce species richness depending on
the ability of these species to capture nutrients and accumulation of biomass rapidly (Al-
Mufti et al. 1977; Grime 1979). Other agricultural practices such as grazing and
manipulation of soil hydrology also affect pastures (Oomes et al. 1996; Smith et al. 1996;
Smith et al. 2000).
N often has the greatest impact on pasture productivity or diversity (Mountford et al. 1993).
Despite the fact that N enrichment is used to increase pasture productivity (Báez et al. 2007),
it can also negatively affect the abundance and diversity of plants, especially native plants
and associated soil microorganisms (Báez et al. 2007; Erland and Taylor 2003). Previous
studies have proposed explanations by which N can affect the diversity of plants (Goldberg
and Miller 1990; Grime 1973; Huston and DeAngelis 1994) and the majority proposed that
competition for light between plants at high levels of productivity leads to competitive
exclusion and decline species richness (Abrams 1995). Diversity can also be influenced by
the depth of litter layer which can inhibit the establishment of species either mechanically
or via shading effects (Carson and Peterson 1990; Facelli 1994; Goldberg and Werner 1983;
Tilman and Pacala 1993).
P deficiency can limit pasture growth, including the maximum species number (Janssens et
al. 1998). Differences among species in their ability to exploit limiting nutrients can impact
the coexistence of different species (Tilman 1981). As some plant species are adapted to
efficient use of N and P, a limitation in one of them can affect species richness by affecting
their productivity (Venterink et al. 2003). Hence, the diversity of pasture species can be
altered by varying application rates of N, P, K, and Ca according to the requirements of
species (Pianka 2011).
As some plant species can be adapted to N or P availability, the limitation in one of them
can affect species richness by affecting the productivity of these species (Venterink et al.
2003). Hence, diversity of pasture species can be moderated by fertiliser use (Pianka 2011).
Chapter Three
25
Although AM fungi offer plants many services, they can affect the diversity of plants
especially in grassland (Dhillion and Gardsjord 2004). For instance, AM fungi improve the
uptake of inorganic nutrients (Bolan 1991; Koide 1991) that can be especially important for
plants during seedling establishment in nutrient limitation conditions, and this can influence
the diversity of plant species (Read 1991). Newman and Reddell (1988) showed that the
richness of some herb species has a positive correlation with the abundance of AM fungi.
They proposed that seedlings emerging in the presence of AM fungal inoculation are more
likely to establish compared to the areas without AM fungal inoculation. Allen (1991)
suggested that AM fungi increase plant species diversity. AM fungi can also play a
significant role in reducing competitive exclusion between species and Hartnett and Wilson
(1999) have elucidated that AM fungi can increase the diversity of species in tallgrass
pastures.
The objective of this study was to investigate the relationships between soil properties and
the establishment of perennial and annual pasture species in a newly sown pasture. This was
done by evaluating the spatial and temporal distribution of perennial pasture grasses during
the establishment (2015) and maintenance (2016) phases of the pasture in relation to soil
characteristics. In addition, the presence of AM fungi in the perennial and annual pasture
species was assessed in relation to soil characteristics. This study tested the following
hypotheses:
i. The establishment of perennial pasture plants will be most effective where soil
nutrients are highest.
ii. AM fungal colonisation of both annual and perennial pasture species will be highly
correlated to soil nutrients.
3.3 Materials and Methods
Field site soil sampling
This study was conducted within a 9 ha pasture at The University of Western Australia’s
Farm (Ridgefield) near Pingelly, WA (-32.50674N, 116.97865E). The paddock had a history
of growing annual pastures (annual ryegrass and subterranean clover). Rainfall and
temperature at the site are shown in Figure 3-1 and Figure 3-2 respectively.
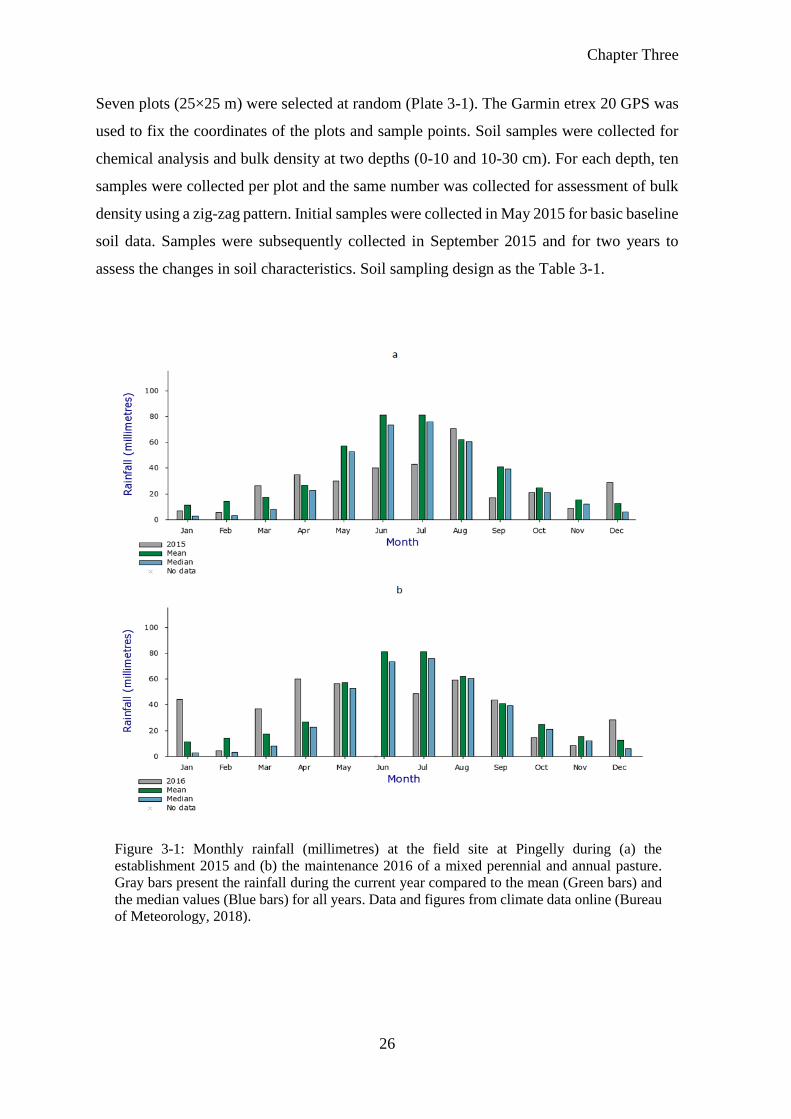
Chapter Three
26
Seven plots (25×25 m) were selected at random (Plate 3-1). The Garmin etrex 20 GPS was
used to fix the coordinates of the plots and sample points. Soil samples were collected for
chemical analysis and bulk density at two depths (0-10 and 10-30 cm). For each depth, ten
samples were collected per plot and the same number was collected for assessment of bulk
density using a zig-zag pattern. Initial samples were collected in May 2015 for basic baseline
soil data. Samples were subsequently collected in September 2015 and for two years to
assess the changes in soil characteristics. Soil sampling design as the Table 3-1.
Figure 3-1: Monthly rainfall (millimetres) at the field site at Pingelly during (a) the
establishment 2015 and (b) the maintenance 2016 of a mixed perennial and annual pasture.
Gray bars present the rainfall during the current year compared to the mean (Green bars) and
the median values (Blue bars) for all years. Data and figures from climate data online (Bureau
of Meteorology, 2018).
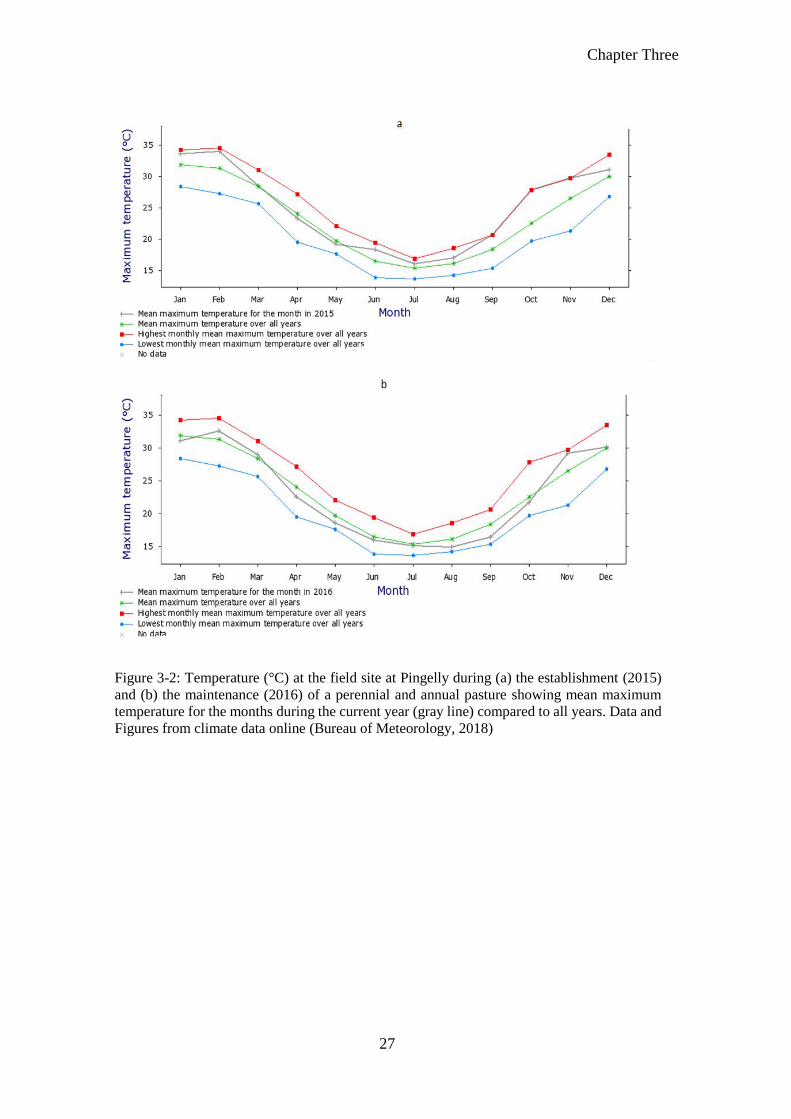
Chapter Three
27
Figure 3-2: Temperature (°C) at the field site at Pingelly during (a) the establishment (2015)
and (b) the maintenance (2016) of a perennial and annual pasture showing mean maximum
temperature for the months during the current year (gray line) compared to all years. Data and
Figures from climate data online (Bureau of Meteorology, 2018)
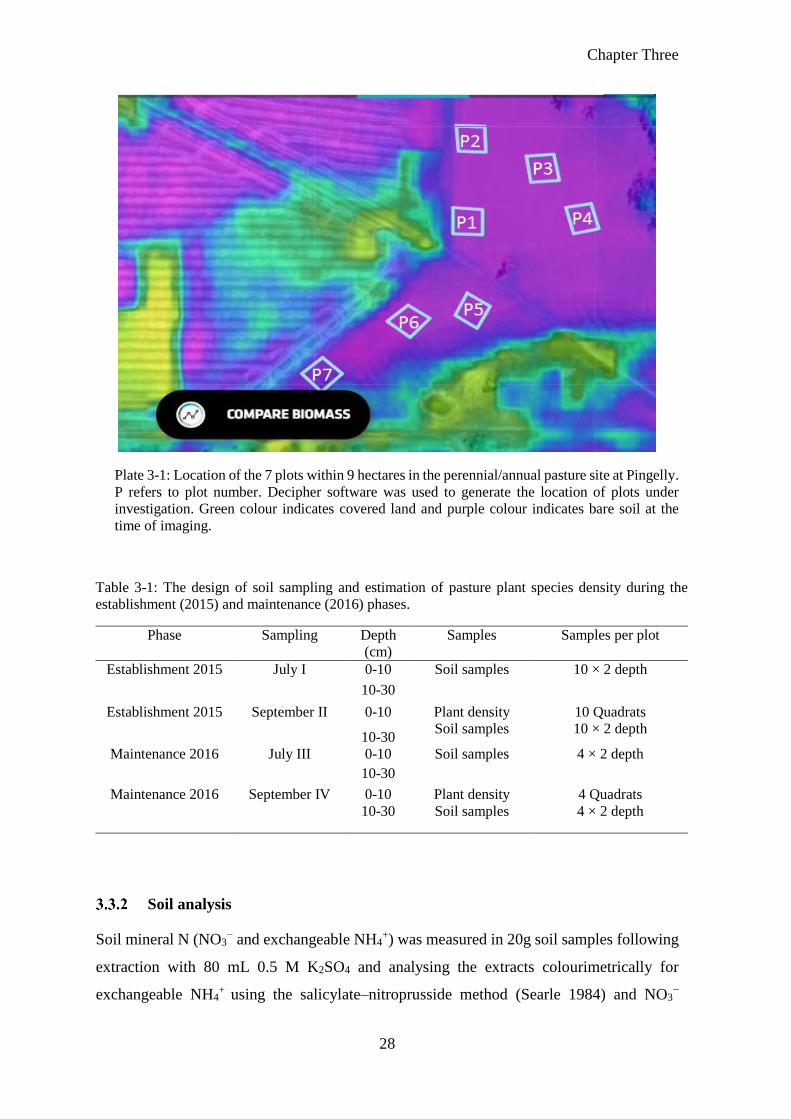
Chapter Three
28
Plate 3-1: Location of the 7 plots within 9 hectares in the perennial/annual pasture site at Pingelly.
P refers to plot number. Decipher software was used to generate the location of plots under
investigation. Green colour indicates covered land and purple colour indicates bare soil at the
time of imaging.
Soil analysis
Soil mineral N (NO3− and exchangeable NH4
+) was measured in 20g soil samples following
extraction with 80 mL 0.5 M K2SO4 and analysing the extracts colourimetrically for
exchangeable NH4+ using the salicylate–nitroprusside method (Searle 1984) and NO3
−
Table 3-1: The design of soil sampling and estimation of pasture plant species density during the
establishment (2015) and maintenance (2016) phases.
Phase Sampling Depth
(cm)
Samples Samples per plot
Establishment 2015 July I 0-10 Soil samples 10 × 2 depth
10-30
Establishment 2015 September II 0-10 Plant density
Soil samples
10 Quadrats
10 × 2 depth 10-30
Maintenance 2016 July III 0-10 Soil samples 4 × 2 depth
10-30
Maintenance 2016 September IV
0-10 Plant density
Soil samples
4 Quadrats
4 × 2 depth 10-30
Chapter Three
29
concentration using the hydrazine reduction method (Kempers and Luft 1988) on an
automated flow injection Skalar AutoAnalyser (San plus, Skalar Analytical, The
Netherlands). Extractable Colwell P was determined by extracting air-dried soils in 0.5 M
sodium bicarbonate solution at pH 8.5 using the colourimetric methods of Rayment and
Higginson (1992).
Air-dried soils were used to determine soil pH and soil salinity (EC). To determine pH and
EC in water suspension, 5 g of air dried soil was suspended in 25 mL deionised water (1:5)
and shacked for one hour. Additionally, pH was measured in 0.01 M of CaCl2. Cation
exchange capacity (CEC) was determined using silver thiourea soil extraction method. Air-
dried soils were extracted in 0.01 M AgTU+ and shacked for 16 h, with end-over-end
shaking, followed by centrifugation and analysis of exchangeable bases of Al, Ca, K, Mg,
and Na were included in the analysis using the ICP-OES machine.
Soil bulk density (BD) samples were taken using a stainless steel ring (8.5 cm height, 7.5
cm diameter) to quantify two depth zones vertically; 0-10, 10-30 cm. Samples were dried
(105 °C, 72 h) prior to calculation of bulk density. Soil moisture content was also calculated.
The dried bulk density samples were sieved to <2 mm and sub-sampled to provide sediment
for organic matter content.
For soil carbon (C), samples were air dried and passed through 2mm sieve and ground. Total
C and N (%) were calculated following combustion using an Elementar Analyser (Vario
Macro CNS; Elementar, Germany). To calculate C stocks the following equation used
(Sanderman et al. 2011):
Soil C stock (t C/ha) = Soil C concentration (mg C/g soil) x soil layer depth (cm) x
bulk density (mg soil/cm3 soil) x (1 – gravel content) x correction for units (108 cm2/ha
x t/109 mg)
where the soil C concentration was reported as mg C/g soil (equal to 10 x %C), the soil layer
depth was entered in cm, the bulk density was the value measured for the sample of soil
analysed and the gravel content is the proportional mass of the soil material >2mm (g >2mm
soil/g soil).
Chapter Three
30
Pasture survival and density
The pasture species sown were: Holdfast GT Phalaris, Tyrell Tall Wheat Grass, Mission
Veldt Grass, Dalkeith subterranean clover, Frontier Balansa clover and annual ryegrass. To
evaluate the survival and density of the pasture species, ten quadrates (30×30 cm) were
scored per plot and data were calculated as plant/m2. The quadrates were taken at the same
points used to collect soil. The density of pasture species was calculated based on the number
of each species per quadrate. The density of pasture was assessed during both the
establishment phase (September 2015) and the maintenance phase (September 2016). The
data for perennial grasses species were combined because it was not possible to distinguish
among the perennial grass species because they had formed seed heads at the time of
sampling.
Decipher software was used to calculate the Biomass Normalised Difference Vegetation
Index (NDVI) over time (Decipher 2018).
AM colonisation
Plants of each pasture species were collected from the seven plots within the paddock. Four
replicates (per plot) of pasture roots for each species were sub-sampled for mycorrhizal
colonisation. To determine the percentage of the root length colonised by AM fungi, further
sub-samples of (0.5 g) fresh roots were cut into ~1 cm length, cleared in 10% KOH, stained
with Trypan blue (0.05%) in lactoglycerol (1:1:1.2) lactic acid:glycerol:water and destained
in lactoglycerol (Abbott and Robson 1981). The percentage colonisation of roots by AM
fungi was estimated by visual observation of stained root segments mounted in lactoglycerol
by the grid-line intersection counting method (Giovannetti and Mosse 1980).
Statistical analysis
Analysis of variance (GeStat V.12.1) presented in ANOVA (Two-way Design ) tables was
used to examine plots and depth effect on Colwell P, NH4+, NO3
- (mg/kg), pH in water, pH
in CaCl2 EC and CEC during the establishment and maintenance phases. ANOVA (One-
way) tables design was used to test the distribution of pasture species among the plots. The
treatment means were compared using least significant differences (LSD). R software
version 3.4.3 (2017) used to plot and test the principal component analysis (PCA).
Chapter Three
31
3.4 Results
Soil characteristics
During the establishment (I and II) and maintenance (III and IV) phases of the
perennial/annual pasture, there was considerable variation in soil characteristics among plots
and between sampling depths (Table 3.2 and Table 3-3).
Soil P varied between sampling times (I, II, III and IV), with location in the paddock and
with soil depth (Table 3-2 and Table 3.3). In general, soil P concentration was higher at 0-
10 cm depth compared to the lower depth in 2015 and 2016. In July, P concentration was
higher in 2015 than in 2016 at both 0-10 and 10-30 cm (P ≤ 0.05; 79 and 47 mg/kg soil
respectively). In September, P concentration was higher during in 2016 than in 2015 at both
depths (P ≤ 0.05; 88 and 55 mg/kg soil respectively).
In July (I and II; Table 3.1), neither plot location nor depth had a significant effect on soil
available N (NH4+) during 2015 and 2016 sampling. In contrast, there was a significant
variation in September (II and IV) for both years. At the upper depth, soil NH4+ was
significantly higher in 2015 (5.77 mg/kg soil) than in 2016 (4.76 mg/kg soil) while there
was no change in soil NH4+ at the lower (10-30cm) depth (Table 3-3).
Soil available N (NO3−) was higher in the upper depth compared to the lower depth in July
(2015 and 2016) at 6.33 and 5.23 mg/kg soil respectively. The concentration of soil NO3−
significantly decreased during the September in both 2015 and 2016 compared to July. The
concentration of NO3− at both depths was lower in 2015 than in 2016, being 0.22 and 0.12
mg/kg soil respectively compared to 4.02 and 2.62 mg/kg soil respectively recorded at the
upper and lower depth in the 2015 sampling (Table 3.3).
Soil pH values were significantly higher in the upper depth compared to the lower depth for
all samples in both 2015 and 2016. In 2015, pH was higher (5.78) in September in the upper
depth compared to July (5.56) (Table 3.3). While in 2016, soil pH was higher (5.83) in July
than in September (5.29).
Soil salinity values were significantly lower at the lower depth (10-30) cm at all sampling
times. In July, EC was higher in the upper depth. However, soil EC was higher in 2015 than
in 2016 (Table 3.3). In September (both II and IV), soil EC was higher (P ≤ 0.05; 120 µS/cm)
in 2016 in the upper depth and lower (46 µS/cm) in the lower depth compared 2015 where
it was 16 and 88 µS/cm respectively.

Chapter Three
32
Table 3-2: ANOVA results for soil Colwell P, NH4+, NO3
- (mg/kg), pH in water, pH in CaCl2 EC and CEC (cmol (+)/kg) in the pasture during the establishment and
maintenance phases. LSD value is given if P≤0.05. NS= not significant
P NH4+
NO3−
pH Water
pH
CaCl2 EC CEC
ANOVA P value LSD P value LSD P value LSD P value LSD P value LSD P value LSD P
value LSD
July 2015
Plot Number <0.001 11.85 0.341 NS 0.293 NS <0.001 0.138 <0.001 0.121 <0.001 25.95 <0.001 0.42
Depth <0.001 6.33 0.140 NS <0.001 0.678 <0.001 0.074 <0.001 0.064 <0.001 13.87 <0.001 0.22
Plot number×Depth <0.001 16.76 0.043 0.063 0.820 NS 0.050 0.195 <0.031 0.170 <0.001 36.7 <0.001 0.59
September 2015
Plot Number <0.001 12.615 0.002 0.447 <0.001 0.041 <0.001 0.1442 <0.001 0.1663 <0.001 32.22 <0.001 0.39
Depth <0.001 6.743 <0.001 0.239 <0.001 0.022 <0.001 0.0771 <0.001 0.0889 <0.039 17.22 <0.001 0.21
Plot number×Depth <0.001 17.84 0.084 NS 0.972 NS 0.995 NS <1.000 NS <0.998 NS <0.003 0.56
July 2016
Plot Number <0.001 7.92 0.698 0.014 <0.001 0.222 <0.001 0.113 <0.001 0.082 <0.001 3.768 <0.001 0.1361
Depth <0.001 14.82 0.014 0.026 <0.001 0.416 <0.001 0.211 <0.001 0.153 <0.001 3.493 <0.001 0.2546
Plot number×Depth <0.001 20.96 0.011 0.037 <0.001 0.588 0.027 0.299 <0.688 NS <0.139 NS <0.001 0.3601
September 2016
Plot Number <0.001 11.151 0.367 NS <0.001 0.083 <0.001 0.127 <0.001 0.113 <0.001 24.203 <0.001 0.0437
Depth <0.001 20.862 0.234 NS <0.001 0.1552 <0.002 0.237 <0.001 0.212 <0.012 45.28 <0.001 0.0818
Plot number×Depth <0.001 29.504 0.599 NS <0.001 0.2195 0.578 NS <0.848 NS <0.110 NS <0.003 0.1156
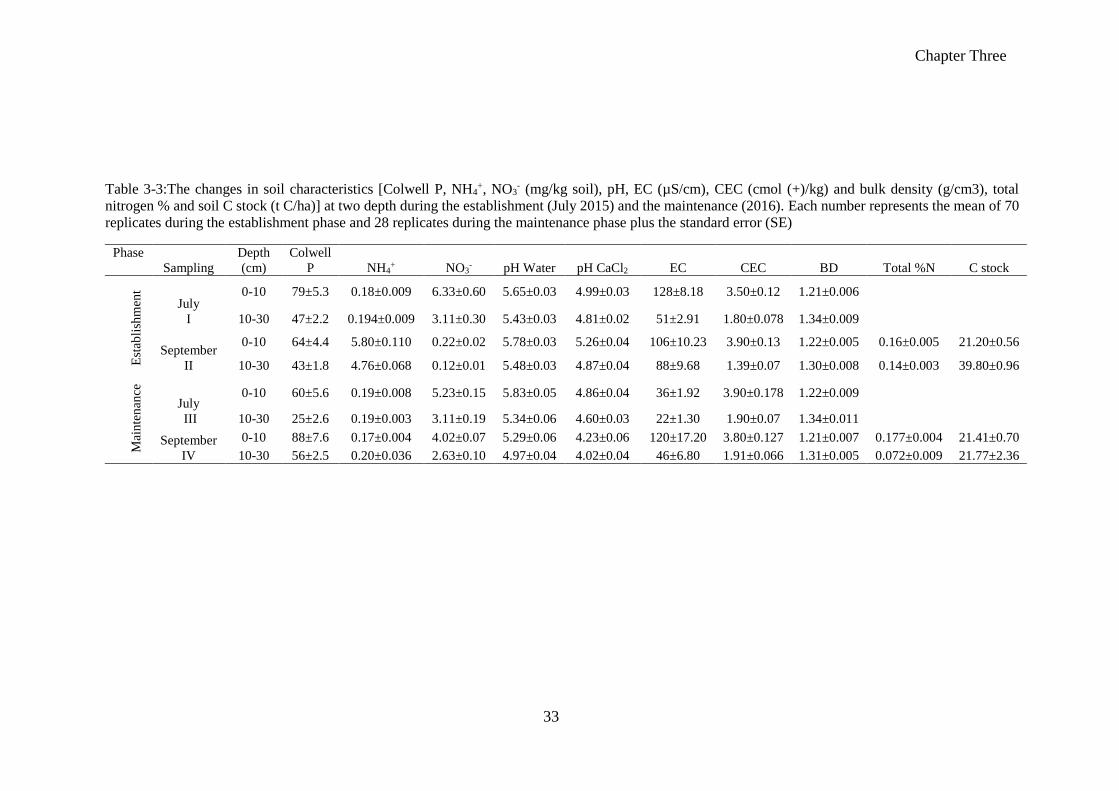
Chapter Three
33
Table 3-3:The changes in soil characteristics [Colwell P, NH4+, NO3
- (mg/kg soil), pH, EC (µS/cm), CEC (cmol (+)/kg) and bulk density (g/cm3), total
nitrogen % and soil C stock (t C/ha)] at two depth during the establishment (July 2015) and the maintenance (2016). Each number represents the mean of 70
replicates during the establishment phase and 28 replicates during the maintenance phase plus the standard error (SE)
Phase
Sampling
Depth
(cm)
Colwell
P NH4+ NO3
- pH Water pH CaCl2 EC CEC BD Total %N C stock
Est
abli
shm
ent
July
I
0-10 79±5.3 0.18±0.009 6.33±0.60 5.65±0.03 4.99±0.03 128±8.18 3.50±0.12 1.21±0.006
10-30 47±2.2 0.194±0.009 3.11±0.30 5.43±0.03 4.81±0.02 51±2.91 1.80±0.078 1.34±0.009
September
II
0-10 64±4.4 5.80±0.110 0.22±0.02 5.78±0.03 5.26±0.04 106±10.23 3.90±0.13 1.22±0.005 0.16±0.005 21.20±0.56
10-30 43±1.8 4.76±0.068 0.12±0.01 5.48±0.03 4.87±0.04 88±9.68 1.39±0.07 1.30±0.008 0.14±0.003 39.80±0.96
Mai
nte
nan
ce
July
III
0-10 60±5.6 0.19±0.008 5.23±0.15 5.83±0.05 4.86±0.04 36±1.92 3.90±0.178 1.22±0.009
10-30 25±2.6 0.19±0.003 3.11±0.19 5.34±0.06 4.60±0.03 22±1.30 1.90±0.07 1.34±0.011
September
IV
0-10 88±7.6 0.17±0.004 4.02±0.07 5.29±0.06 4.23±0.06 120±17.20 3.80±0.127 1.21±0.007 0.177±0.004 21.41±0.70
10-30 56±2.5 0.20±0.036 2.63±0.10 4.97±0.04 4.02±0.04 46±6.80 1.91±0.066 1.31±0.005 0.072±0.009 21.77±2.36
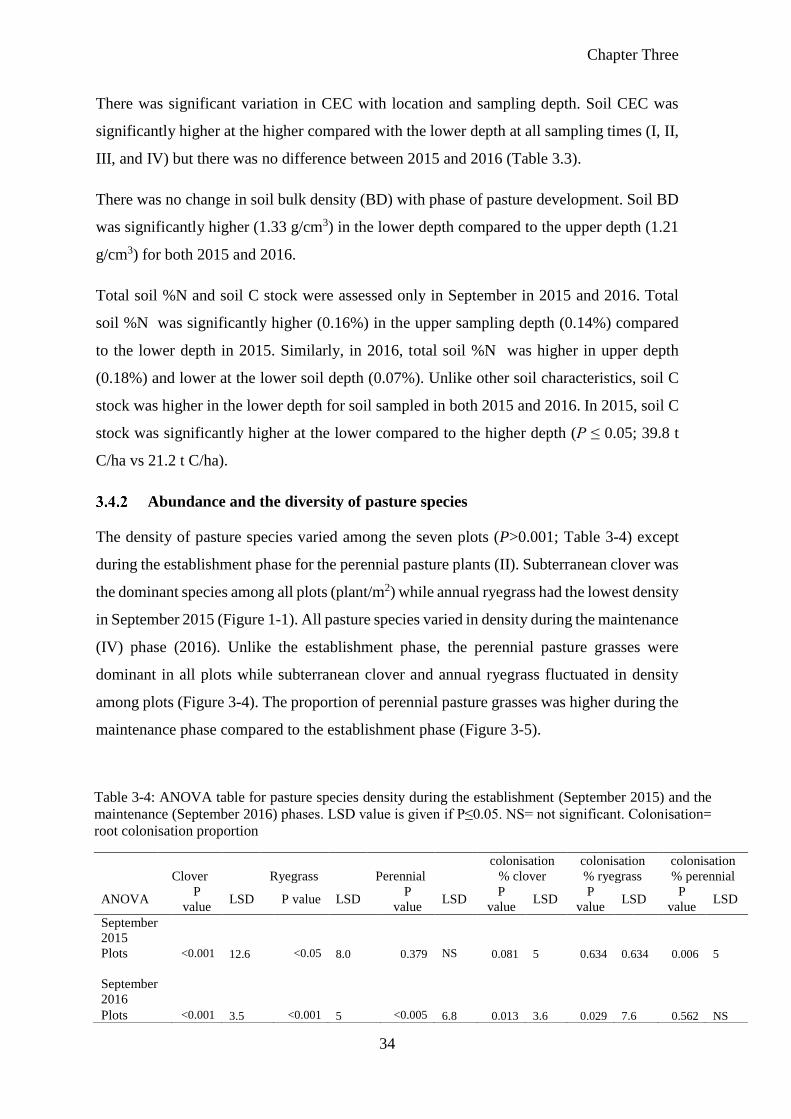
Chapter Three
34
There was significant variation in CEC with location and sampling depth. Soil CEC was
significantly higher at the higher compared with the lower depth at all sampling times (I, II,
III, and IV) but there was no difference between 2015 and 2016 (Table 3.3).
There was no change in soil bulk density (BD) with phase of pasture development. Soil BD
was significantly higher (1.33 g/cm3) in the lower depth compared to the upper depth (1.21
g/cm3) for both 2015 and 2016.
Total soil %N and soil C stock were assessed only in September in 2015 and 2016. Total
soil %N was significantly higher (0.16%) in the upper sampling depth (0.14%) compared
to the lower depth in 2015. Similarly, in 2016, total soil %N was higher in upper depth
(0.18%) and lower at the lower soil depth (0.07%). Unlike other soil characteristics, soil C
stock was higher in the lower depth for soil sampled in both 2015 and 2016. In 2015, soil C
stock was significantly higher at the lower compared to the higher depth (P ≤ 0.05; 39.8 t
C/ha vs 21.2 t C/ha).
Abundance and the diversity of pasture species
The density of pasture species varied among the seven plots (P>0.001; Table 3-4) except
during the establishment phase for the perennial pasture plants (II). Subterranean clover was
the dominant species among all plots (plant/m2) while annual ryegrass had the lowest density
in September 2015 (Figure 1-1). All pasture species varied in density during the maintenance
(IV) phase (2016). Unlike the establishment phase, the perennial pasture grasses were
dominant in all plots while subterranean clover and annual ryegrass fluctuated in density
among plots (Figure 3-4). The proportion of perennial pasture grasses was higher during the
maintenance phase compared to the establishment phase (Figure 3-5).
Table 3-4: ANOVA table for pasture species density during the establishment (September 2015) and the
maintenance (September 2016) phases. LSD value is given if P≤0.05. NS= not significant. Colonisation=
root colonisation proportion
Clover Ryegrass
Perennial
colonisation
% clover
colonisation
% ryegrass
colonisation
% perennial
ANOVA P
value LSD P value LSD
P
value LSD
P
value LSD
P
value LSD
P
value LSD
September
2015
Plots <0.001 12.6 <0.05 8.0 0.379 NS 0.081 5 0.634 0.634 0.006 5
September
2016
Plots <0.001 3.5 <0.001 5 <0.005 6.8 0.013 3.6 0.029 7.6 0.562 NS
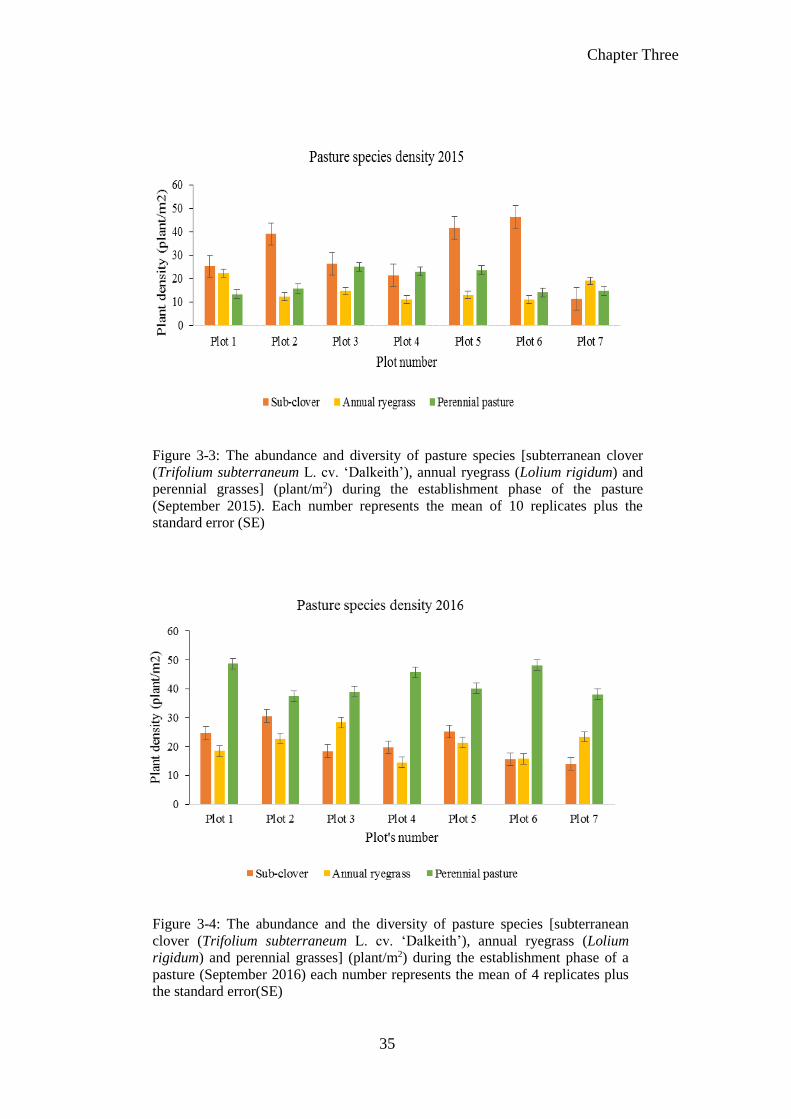
Chapter Three
35
Figure 3-3: The abundance and diversity of pasture species [subterranean clover
(Trifolium subterraneum L. cv. ‘Dalkeith’), annual ryegrass (Lolium rigidum) and
perennial grasses] (plant/m2) during the establishment phase of the pasture
(September 2015). Each number represents the mean of 10 replicates plus the
standard error (SE)
Figure 3-4: The abundance and the diversity of pasture species [subterranean
clover (Trifolium subterraneum L. cv. ‘Dalkeith’), annual ryegrass (Lolium
rigidum) and perennial grasses] (plant/m2) during the establishment phase of a
pasture (September 2016) each number represents the mean of 4 replicates plus
the standard error(SE)
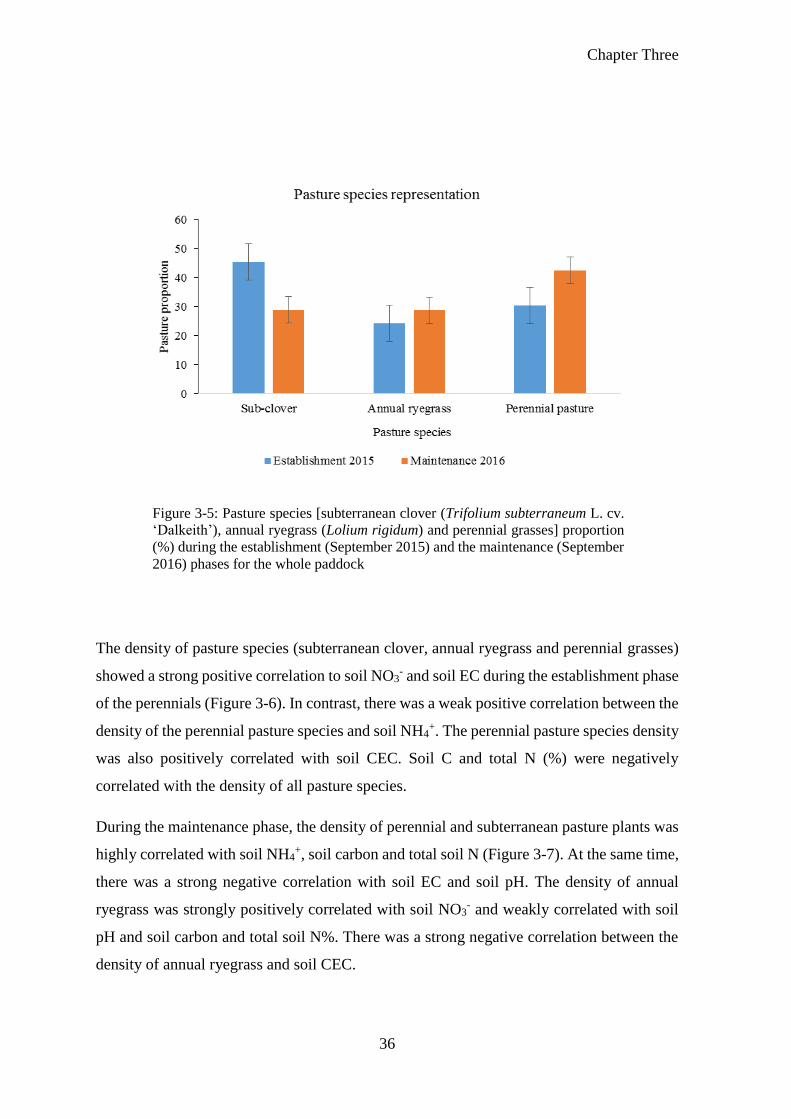
Chapter Three
36
The density of pasture species (subterranean clover, annual ryegrass and perennial grasses)
showed a strong positive correlation to soil NO3- and soil EC during the establishment phase
of the perennials (Figure 3-6). In contrast, there was a weak positive correlation between the
density of the perennial pasture species and soil NH4+. The perennial pasture species density
was also positively correlated with soil CEC. Soil C and total N (%) were negatively
correlated with the density of all pasture species.
During the maintenance phase, the density of perennial and subterranean pasture plants was
highly correlated with soil NH4+, soil carbon and total soil N (Figure 3-7). At the same time,
there was a strong negative correlation with soil EC and soil pH. The density of annual
ryegrass was strongly positively correlated with soil NO3- and weakly correlated with soil
pH and soil carbon and total soil N%. There was a strong negative correlation between the
density of annual ryegrass and soil CEC.
Figure 3-5: Pasture species [subterranean clover (Trifolium subterraneum L. cv.
‘Dalkeith’), annual ryegrass (Lolium rigidum) and perennial grasses] proportion
(%) during the establishment (September 2015) and the maintenance (September
2016) phases for the whole paddock
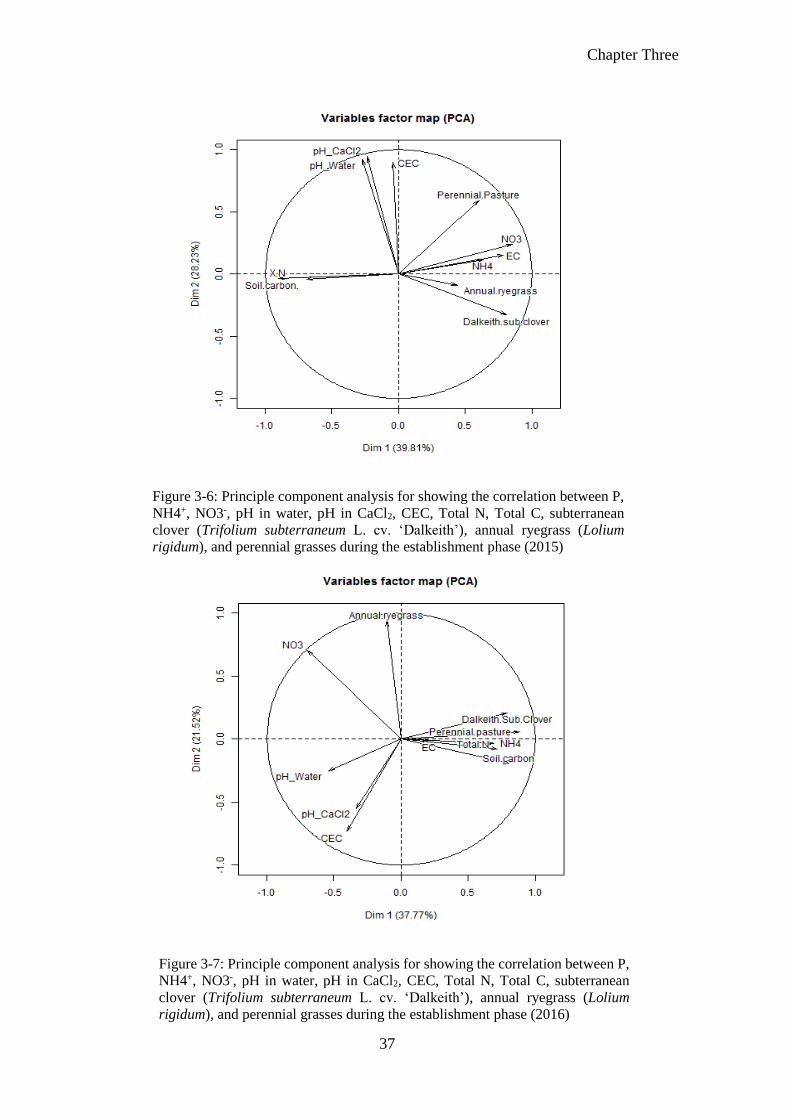
Chapter Three
37
Figure 3-6: Principle component analysis for showing the correlation between P,
NH4+, NO3-, pH in water, pH in CaCl2, CEC, Total N, Total C, subterranean
clover (Trifolium subterraneum L. cv. ‘Dalkeith’), annual ryegrass (Lolium
rigidum), and perennial grasses during the establishment phase (2015)
Figure 3-7: Principle component analysis for showing the correlation between P,
NH4+, NO3-, pH in water, pH in CaCl2, CEC, Total N, Total C, subterranean
clover (Trifolium subterraneum L. cv. ‘Dalkeith’), annual ryegrass (Lolium
rigidum), and perennial grasses during the establishment phase (2016)
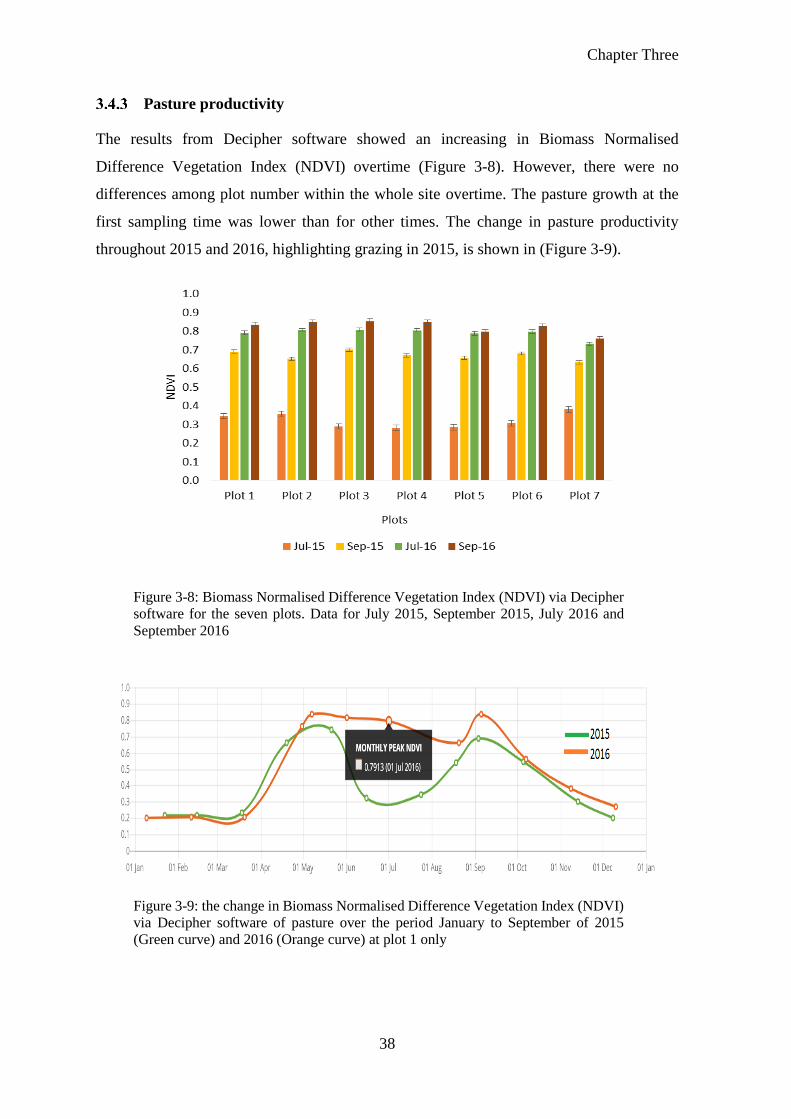
Chapter Three
38
Pasture productivity
The results from Decipher software showed an increasing in Biomass Normalised
Difference Vegetation Index (NDVI) overtime (Figure 3-8). However, there were no
differences among plot number within the whole site overtime. The pasture growth at the
first sampling time was lower than for other times. The change in pasture productivity
throughout 2015 and 2016, highlighting grazing in 2015, is shown in (Figure 3-9).
Figure 3-8: Biomass Normalised Difference Vegetation Index (NDVI) via Decipher
software for the seven plots. Data for July 2015, September 2015, July 2016 and
September 2016
Figure 3-9: the change in Biomass Normalised Difference Vegetation Index (NDVI)
via Decipher software of pasture over the period January to September of 2015
(Green curve) and 2016 (Orange curve) at plot 1 only
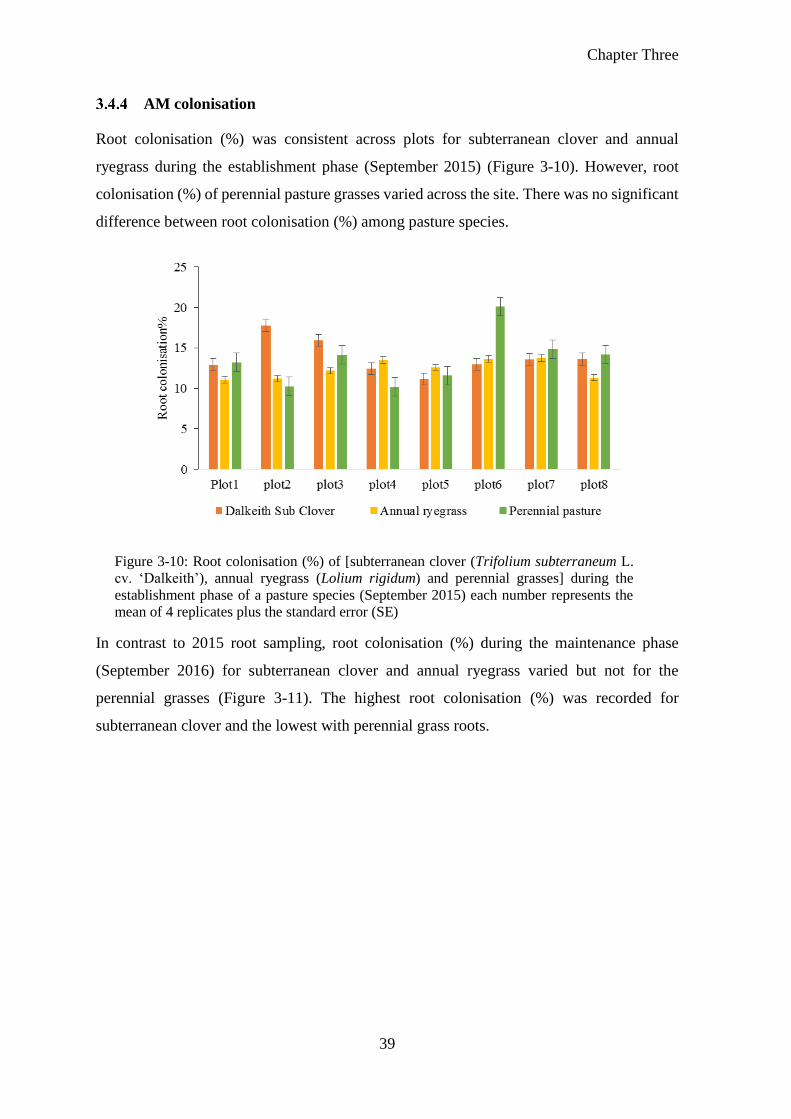
Chapter Three
39
AM colonisation
Root colonisation (%) was consistent across plots for subterranean clover and annual
ryegrass during the establishment phase (September 2015) (Figure 3-10). However, root
colonisation (%) of perennial pasture grasses varied across the site. There was no significant
difference between root colonisation (%) among pasture species.
Figure 3-10: Root colonisation (%) of [subterranean clover (Trifolium subterraneum L.
cv. ‘Dalkeith’), annual ryegrass (Lolium rigidum) and perennial grasses] during the
establishment phase of a pasture species (September 2015) each number represents the
mean of 4 replicates plus the standard error (SE)
In contrast to 2015 root sampling, root colonisation (%) during the maintenance phase
(September 2016) for subterranean clover and annual ryegrass varied but not for the
perennial grasses (Figure 3-11). The highest root colonisation (%) was recorded for
subterranean clover and the lowest with perennial grass roots.
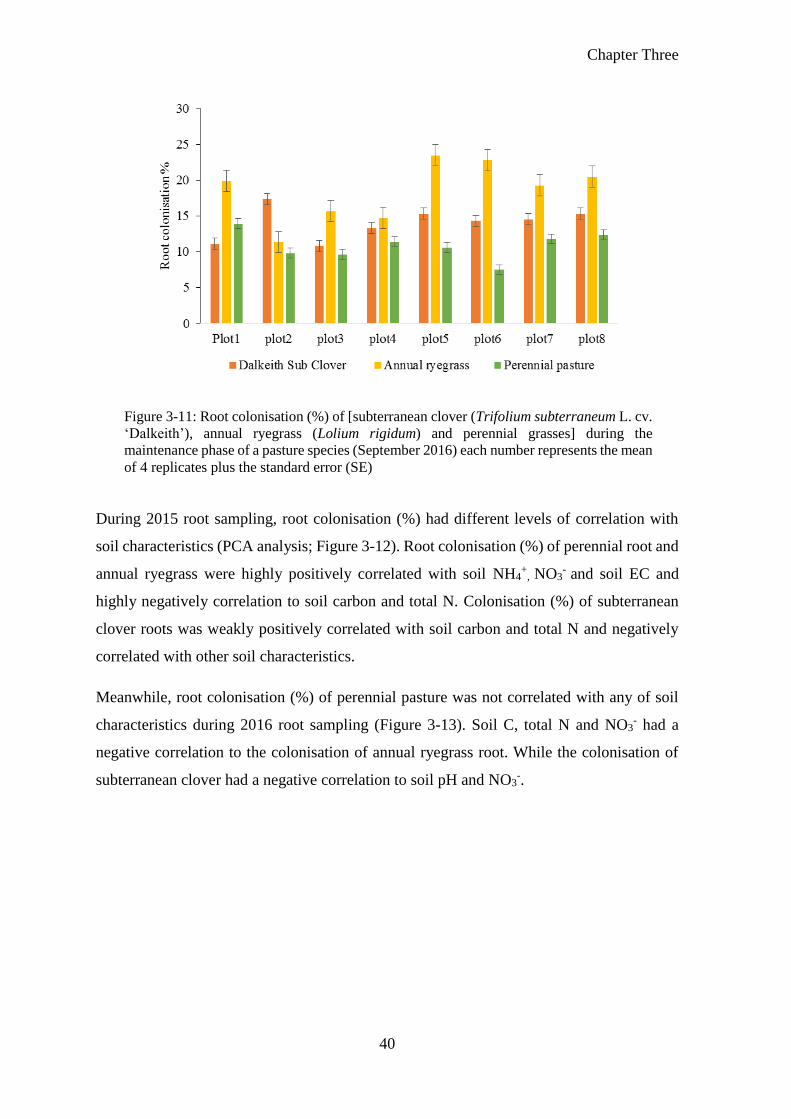
Chapter Three
40
During 2015 root sampling, root colonisation (%) had different levels of correlation with
soil characteristics (PCA analysis; Figure 3-12). Root colonisation (%) of perennial root and
annual ryegrass were highly positively correlated with soil NH4+
, NO3- and soil EC and
highly negatively correlation to soil carbon and total N. Colonisation (%) of subterranean
clover roots was weakly positively correlated with soil carbon and total N and negatively
correlated with other soil characteristics.
Meanwhile, root colonisation (%) of perennial pasture was not correlated with any of soil
characteristics during 2016 root sampling (Figure 3-13). Soil C, total N and NO3- had a
negative correlation to the colonisation of annual ryegrass root. While the colonisation of
subterranean clover had a negative correlation to soil pH and NO3-.
Figure 3-11: Root colonisation (%) of [subterranean clover (Trifolium subterraneum L. cv.
‘Dalkeith’), annual ryegrass (Lolium rigidum) and perennial grasses] during the
maintenance phase of a pasture species (September 2016) each number represents the mean
of 4 replicates plus the standard error (SE)
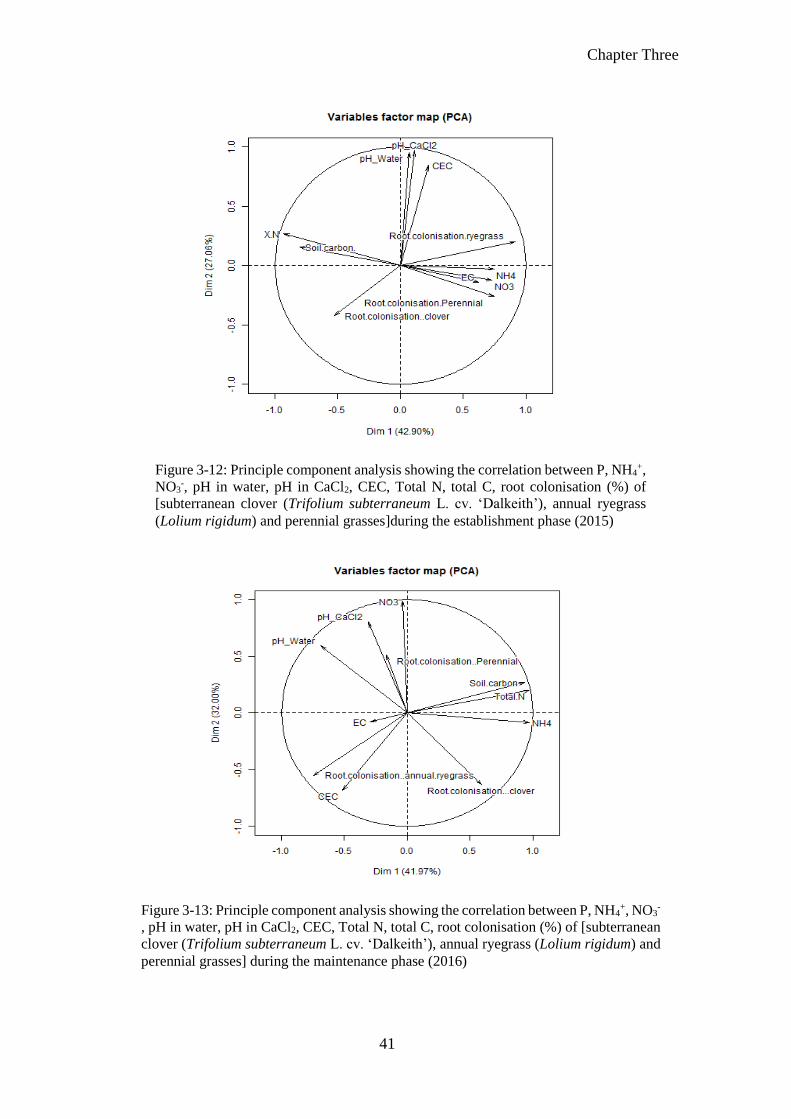
Chapter Three
41
Figure 3-12: Principle component analysis showing the correlation between P, NH4+,
NO3-, pH in water, pH in CaCl2, CEC, Total N, total C, root colonisation (%) of
[subterranean clover (Trifolium subterraneum L. cv. ‘Dalkeith’), annual ryegrass
(Lolium rigidum) and perennial grasses]during the establishment phase (2015)
Figure 3-13: Principle component analysis showing the correlation between P, NH4+, NO3
-
, pH in water, pH in CaCl2, CEC, Total N, total C, root colonisation (%) of [subterranean
clover (Trifolium subterraneum L. cv. ‘Dalkeith’), annual ryegrass (Lolium rigidum) and
perennial grasses] during the maintenance phase (2016)
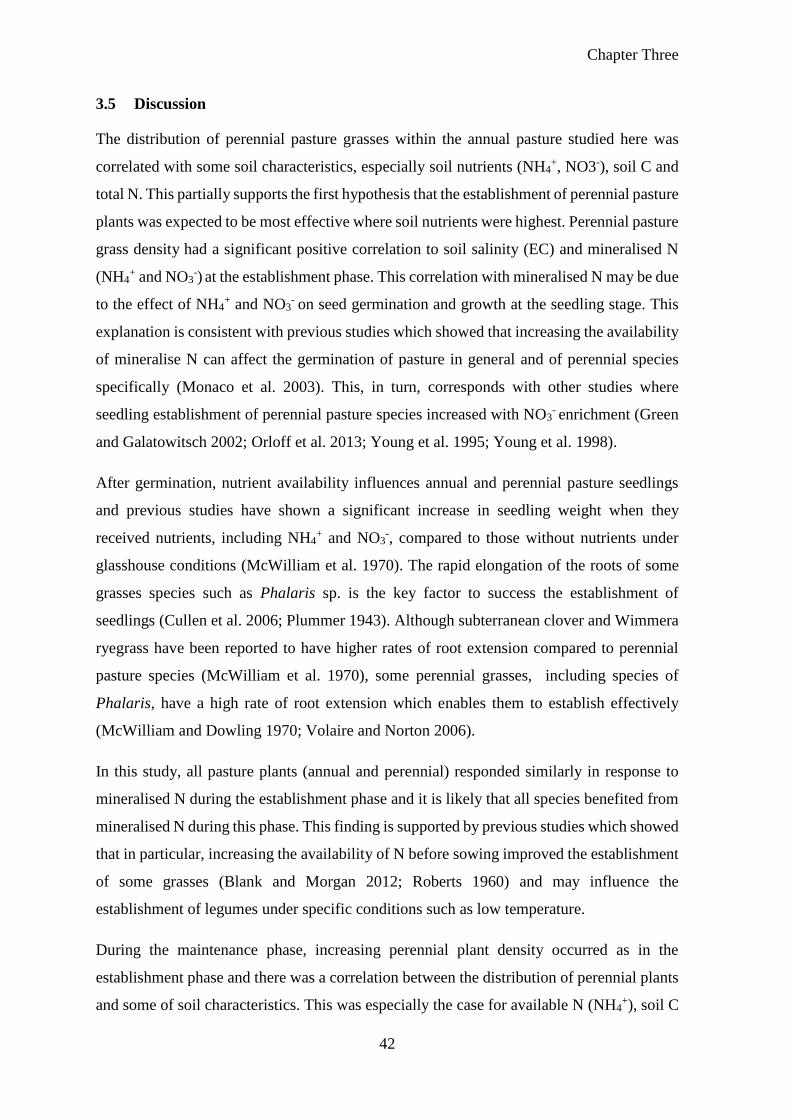
Chapter Three
42
3.5 Discussion
The distribution of perennial pasture grasses within the annual pasture studied here was
correlated with some soil characteristics, especially soil nutrients (NH4+, NO3-), soil C and
total N. This partially supports the first hypothesis that the establishment of perennial pasture
plants was expected to be most effective where soil nutrients were highest. Perennial pasture
grass density had a significant positive correlation to soil salinity (EC) and mineralised N
(NH4+ and NO3
-) at the establishment phase. This correlation with mineralised N may be due
to the effect of NH4+ and NO3
- on seed germination and growth at the seedling stage. This
explanation is consistent with previous studies which showed that increasing the availability
of mineralise N can affect the germination of pasture in general and of perennial species
specifically (Monaco et al. 2003). This, in turn, corresponds with other studies where
seedling establishment of perennial pasture species increased with NO3- enrichment (Green
and Galatowitsch 2002; Orloff et al. 2013; Young et al. 1995; Young et al. 1998).
After germination, nutrient availability influences annual and perennial pasture seedlings
and previous studies have shown a significant increase in seedling weight when they
received nutrients, including NH4+ and NO3
-, compared to those without nutrients under
glasshouse conditions (McWilliam et al. 1970). The rapid elongation of the roots of some
grasses species such as Phalaris sp. is the key factor to success the establishment of
seedlings (Cullen et al. 2006; Plummer 1943). Although subterranean clover and Wimmera
ryegrass have been reported to have higher rates of root extension compared to perennial
pasture species (McWilliam et al. 1970), some perennial grasses, including species of
Phalaris, have a high rate of root extension which enables them to establish effectively
(McWilliam and Dowling 1970; Volaire and Norton 2006).
In this study, all pasture plants (annual and perennial) responded similarly in response to
mineralised N during the establishment phase and it is likely that all species benefited from
mineralised N during this phase. This finding is supported by previous studies which showed
that in particular, increasing the availability of N before sowing improved the establishment
of some grasses (Blank and Morgan 2012; Roberts 1960) and may influence the
establishment of legumes under specific conditions such as low temperature.
During the maintenance phase, increasing perennial plant density occurred as in the
establishment phase and there was a correlation between the distribution of perennial plants
and some of soil characteristics. This was especially the case for available N (NH4+), soil C
Chapter Three
43
and total N. The improvement in perennial grass plant density may be due to the competitive
ability of these plants which results from an increase in root system growth by the second
year of the study. Another explanation for the correlation between mineral N and perennial
grass distribution may be due to the ability of perennial plants to take up NH4+ and NO3
-
rapidly as their root system has the potential to grow rapidly especially during the
establishment phase (Gao et al. 2008; Hook et al. 1994; Kang et al. 2007). Some perennial
pasture plants such as species of Phalaris have a higher root extension rate than other pasture
species (McWilliam et al. 1970) and this may facilitate nutrient uptake, especially N.
Moreover, the response of plant roots towards changes in soil nutrients vary among plant
species and some pasture species can display fast root proliferation under high soil nutrient
availability (Jackson and Caldwell 1989; Robinson 1994; Robinson and Rorison 1983).
AM fungal root colonisation of the annual ryegrass and perennial grasses were highly
correlated to soil available N (NH4+, NO3
-) during the establishment phase while during the
maintenance phase, perennial pasture was highly correlated to soil C and N (total N and
NH4+). This supported the second hypothesis that AM fungal colonisation of both annual
and perennial pasture species was expected to be highly correlated to soil nutrients. This
may due to the change in soil N which increased allocation of C to AM fungi and this
allocation may vary depending on soil N:P ratio. Soil NH4+ and P data support this
explanation as in the establishment phase, soil NH4+ was higher than in the maintenance
phase while the concentration of soil P was higher in the maintenance phase than the
establishment. This partially corresponds with previous studies which showed that soil N
can change AM root colonisation and the changes are restricted by soil N:P ratio (Bääth et
al. 1981; Johnson et al. 2003; Liu et al. 2000; Sylvia and Neal 1990). In these studies, N
enrichment increased colonisation of roots by AM fungi when soil P was low and limited
plant growth and decreased colonisation when P is not limited. In this study, soil N affected
root colonisation even when soil P was high during the establishment and the maintenance
phases. This, in turn, may be due to the adaptation of indigenous AM fungi to high P
concentration exposure under the field conditions (Ryan et al. 2000).
The correlation between root colonisation and soil N may also be due to a change in AM
fungal communities with variation in soil N. Previous studies showed N enrichment could
alter AM species composition by affecting spore formation (Johnson et al. 2003). Grasslands
can contain a many AM fungal species (Eom et al. 2000; Johnson et al. 1991; Walker et al.
1982) and species vary in their morphology and life history (Abbott and Robson 1985; Hart
Chapter Three
44
et al. 2001). Some AM fungal species such as the species in the family Gigasporaceae are
sensitive to N and a change in soil N can increase or decrease the composition and spore
formation of these species (Eom et al. 1999; Johnson 1993). In a field trial, Gigasporaceae
spores increased significantly in number with addition of N to a grassland with low soil P
while in the same field trial, addition of N to soil with high P significantly deceased the
sporulation of Gigasporaceae (Johnson et al. 2003).
3.6 Conclusion
During the study timeframe, the distribution of perennial pasture grasses was positively
correlated to soil available N (NH4+ and NO3
-), total N and soil C. There was a variation in
perennial and annual root colonisation by AM fungi between the establishment and the
maintenance phases of this pasture. In general, there was a significant positive correlation
between mycorrhizal colonisation and available N (NH4+ and NO3
-), total N, soil C and soil
EC. The effect of other agricultural practices including grazing and application of soil
amendments should be taken into account in further study.
Chapter Four
45
4 CHAPTER 4
Interactions between phosphorus and nitrogen alter mycorrhizal
colonisation in two co-existing annual pasture species
4.1 Abstract
Arbuscular mycorrhizal (AM) fungi form associations with most pasture plants. Colonisation
of roots by AM fungi varies among these plants in relation to soil conditions, plant nutrition,
and root growth. Both phosphorus (P) and nitrogen (N) influence the formation and functioning
of mycorrhizas and interactions between P and N can also occur. This study investigated how
interactions between P and N applied to a pasture alter the rate and extent of colonisation of
roots by AM fungi in a pasture sward dominated by subterranean clover and annual ryegrass.
A glasshouse experiment was conducted using undisturbed field soil cores collected from an
annual pasture with subsequent application of P and N fertilisers. The soil cores, which had
self-sown subterranean clover and annual ryegrass seedlings, were collected from the UWA
Farm near Pingelly, Western Australia. Fertilisers equivalent to 100 kg/ha N and 25 kg ha-1 P
were applied separately and together to the soil cores. Plants were harvested five and eight
weeks after fertiliser application. At the first harvest (5 weeks), P decreased % root length
colonised by AM fungi for subterranean clover roots by 10% and annual ryegrass roots by about
20%. The length of root colonised also declined with P applied in both subterranean clover and
annual ryegrass (by about 40 and 30% respectively). Although N application did not affect
either the % root length colonised or the length of root colonised for subterranean clover, it
reduced both % root length colonised and root length colonised by 25% in annual ryegrass.
Similarly, the N+P treatment had no effect on either the % root length colonised or root length
colonised in subterranean clover, but it reduced both % root length colonised and root length
colonised in annual ryegrass. By the second harvest (8 weeks), subterranean clover had been
out-competed by the annual ryegrass and eliminated in all soil cores. At this time, both % root
length colonised and root length colonised for annual ryegrass were reduced by all fertiliser
treatments. The combined application of P and N decreased in % root length colonised by 40%
and root length colonised by 54%. The addition of both P and N, either separately or together,
altered the rate and extent of mycorrhizal colonisation of roots of these two annual pasture
species and this was mediated primarily by responses of root growth to fertiliser application.
Chapter Four
46
4.2 Introduction
Grasslands cover about 20% of the Earth’s land surface and the majority results from human
activities such as deforestation and pasture establishment (Parton et al. 1993). Pasture plants
play a significant role in livestock production and management of crop rotations in addition to
reducing greenhouse gases emission (Carvalho et al. 2014; Dickhoefer et al. 2010). Australia
has traditionally combined pastures within crop rotations to improve soil fertility, to reduce
pests and weeds population (Flower et al. 2012; Howieson et al. 2000; Lemaire et al. 2015;
Morley and Katznelson 1965) and to control plant disease (King 1984). The Mediterranean
climate in south-western Australia and soil properties in this region impose significant
constraints on the establishment of both annual and perennial pasture plants (Howieson et al.
2000; Hutchings 1972). Considerable research has been undertaken to identify the best
strategies for enhancing pasture productivity with combinations of fertilisers, pasture species
and soil amendments to achieve this goal (Chapman et al. 2003; Ryan and Ash 1999;
Taghizadeh-Toosi et al. 2011).
Pasture productivity is affected by many factors related to soil properties and plant species, and
some of these can be optimised using selected agricultural practices (Böhme and Böhme 2006;
Nash et al. 2014; Serrano et al. 2013; Šímová et al. 2013; Socher et al. 2013). Nutrient addition,
especially nitrogen N and P, can alter plant growth depending on their availability in the soil.
For example, previous studies have sought to identify conditions that ensure the efficiency of
nutrient uptake by plants (During et al. 1973; George et al. 1995; Gyaneshwar et al. 2002;
Hobbie 1992; Marschner and Dell 1994). However, nutrient addition can also affect soil
microorganisms, including arbuscular mycorrhizal (AM) fungi, which may alter their
effectiveness in contributing to sustainable agricultural production via soil biological processes
(Asimi et al. 1980; Jorquera et al. 2014; Li et al. 2015; Ryan and Ash 1999).
Competition among pasture species can affect productivity. It can occur either within species
or between species (Aarssen and Turkington 1985). Previous studies demonstrated that
increasing the diversity of plant species in pasture ecosystem can improve productivity,
especially when there are constraints to plant growth (Minns et al. 2001; Tilman 1999).
Nevertheless, it is hard to generalise that soil biodiversity has positive effects on pasture
productivity as it can be influenced by other factors (Huston et al. 2000; Sanderson et al. 2004;
Wardle et al. 2000). The benefits of increasing pasture biodiversity can contribute to survival
during harsh conditions such as those that may occur in summer which is necessary for livestock
Chapter Four
47
production (Spehn et al. 2000). Furthermore, higher pasture species richness assists in weed
control (Fargione et al. 2003; Tracy and Sanderson 2000; Zavaleta and Hulvey 2004). On the
other hand, improving biodiversity can increase competition for sunlight and competition
between root systems, especially during drought (Skinner et al. 2006). Donald (1963)
demonstrated that some clovers were less competitive than grasses in regard to the uptake of P,
K and S.
AM fungi do not generally display specificity toward their hosts (Smith and Read 2008) except
through ecological specificity (McGonigle and Fitter 1990). They may also differ in the
colonisation of roots of some plant species compared to others when they are growing together
(Li et al. 2014). Previous studies investigating interactions between AM fungi and plant species
in grasslands and other agricultural systems have demonstrated that the abundance and diversity
of AM fungi are often higher in grasslands than in crops (Johnson et al. 2004; Verbruggen et
al. 2010). This is likely to be because the more diverse plants in grasslands may create greater
habitat diversity for different AM fungi to co-exist (Johnson et al. 2004).
In plant mixtures, AM fungi can play a crucial role in plant coexistence (Chagnon et al. 2012;
Hart et al. 2003; Stein et al. 2009) by changing competitive capability between plants
(Scheublin et al. 2007; Wagg et al. 2011). The effect of AM fungi on plant community may be
caused by variation in AM fungal effects on competing plant species and could be negative,
neutral or positive (Hart et al. 2003; Johnson et al. 1997; Smith et al. 2011). This variation
depends on many factors such as the compatibility between AM fungi and the host plant,
nutrient availability and interactions between plant species (Johnson 2010; Mariotte et al.
2013). Smith et al. (2011) suggested that variation among AM fungal effects on plant growth
may due to the variation in the cost of C for nutrient benefit between AM fungi-plant
association. In a legume-grass mixture, the hyphal network of AM fungi may play a role in N
transformation from legumes to grasses (Klabi et al. 2014). AM fungi can influence the
competitive ability of legumes in the mixture as some legumes can be more responsive to AM
fungi than grasses (Scheublin et al. 2007; Wagg et al. 2011). However, in some cases, AM fungi
promote competitiveness of grasses instead of legumes by exploiting N2-fixed and released by
degradation of legume biomass in soil (Hamel et al. 1991). Many studies have suggested that
effects of AM fungi on competition between grasses and legumes depend on the relative
efficiency of the symbiosis formed by legume-grass component plant community (Hamel et al.
1991; Hamel et al. 1992; Scheublin et al. 2007).
Chapter Four
48
Legumes and grasses can have different AM fungal communities when they grow together in
a natural ecosystem and this may be expected because legumes and grasses belong to very
different families (Vandenkoornhuyse et al. 2002). For example, Eom et al.(2000) found that
the abundance of AM fungal species was higher with the legume Beilschmiedia bracteata than
in other grasses under field conditions. High N concentrations in legume soil or the reciprocal
benefits between AM fungi and rhizobia could result in higher abundance of AM fungi (Azcon-
Aguilar and Barea 1992; Eom et al. 1994). However, Vandenkoornhuyse et al. (2003)
demonstrated that AM fungal communities might differ even among closely related species.
The relationship beween plant and AM fungi is a controlled process and both plants and fungi
may have the ability to recognise and control diversity present in their potential symbiotic
partners (Bever et al. 1996; Bidartondo et al. 2002; Eom et al. 2000; Helgason et al. 2002;
Johnson et al. 1991a).
Both P and N can affect the abundance and functioning of AM fungi (Johnson et al. 2010).
Nutrient enrichment of grassland, especially with N, can significantly affect productivity in the
short term (Bonanomi et al. 2006). However, N enrichment can also negatively affect
biodiversity of above and belowground organisms (Phoenix et al. 2012; Tilman and Cowan
1989). With regard to plants, the dominance of pasture plants may change with increasing N
availability and this change may depend on the architecture of the root system of the plant
species present (Mendoza et al. 2016). For instant, in grass-legume mixtures, N enrichment
tends to favour the dominance of grasses over legumes which, in turn, can affect species
diversity (Aydin and Uzun 2005; Høgh-Jensen and Schjoerring 2010). With N enrichment,
plants tend to allocate more photosynthate to aboveground parts (shoots, leaves, and stems) and
less photosynthate to roots and AM fungi, and this, in turn, influences the amount of C received
by AM fungi (Jakobsen and Rosendahl 1990; Marschner et al. 1996). The abundance of AM
fungi has been demonstrated to increase, decrease or remain stable following the addition of N
(Eom et al. 1999; Kårén and Nylund 1997; Treseder and Allen 2000). Bradley et al. (2006)
showed that increasing N availability in grassland soil can reduce the abundance of AM fungi.
Variation among previous studies may be due to the differences in climatic condition, primary
soil N:P, and plant communities (Klironomos et al. 1996). However, the method of assessment
of mycorrhizal colonisation of roots also needs to be taken into account. For example, the
proportion of roots colonised (%) and the length of root colonised are both considered to be
important when assessing mycorrhizal colonisation (Giovannetti and Mosse 1980; McGonigle
et al. 1990). They may show different facets of root colonisation for the same plants. This
Chapter Four
49
breadth in quantification of colonisation of roots takes account of differences in root
architecture, such as root length and diameter, and a good example of this is the contrast in the
structure of root systems of subterranean clover and annual ryegrass.
Several mechanisms have been proposed to explain the decline in fungal biomass with N
application. Bääth et al. (1981) provided evidence that toxicity is one mechanism leading to
negative effects of N enrichment. This claim is based on the premise that adding fertilisers can
increase the toxicity of some ions in the soil solution, and these ions can inhibit microbial
growth directly (Broadbent 1965). Soil pH decline is another mechanism that can result from
N enrichment, and the increase in acidity can accelerate magnesium and calcium leaching in
addition to affecting aluminium mobilisation,whereby microorganisms may suffer magnesium
or calcium deficiency or aluminium toxicity (Vitousek et al. 1997). However, the most
important mechanism of N enrichment is the limitation in C allocated to AM fungi, and N
enrichment can reduce ligninase production by some fungal species (Keyser et al. 1978;
Waldrop and Zak 2006).
P nutrition can be correlated with the abundance and function of AM fungi (Koide 1991; Mosse
et al. 1973). Plants can gain maximum mycorrhizal benefits when P is limiting, whereas if P is
ample in supply, the cost of C to the symbiosis can override P benefits, and this can affect plant
growth negatively (Bethlenfalvay et al. 1983; Peng et al. 1993). Propster and Johnson (2015)
showed that adding P to high-P soil can reduce the abundance of AM fungi while the abundance
increased when P was added to low-P soil. Several field studies have shown that the abundance
of AM fungi either inside roots or in soil usually increases when plants are not limited by
nutrients especially N and P (Blanke et al. 2011; Johnson et al. 2003; Liu et al. 2012). Ryan and
Ash (1999) showed that adding P inhibited AM fungal colonisation significantly for white
clover, and this decline was correlated with a change in phospholipid content in root cells
potentially affecting the permeability of cell membranes and carbohydrate exudation. However,
P has been shown to have a less negative effect on root colonisation with grasses compared to
legumes (Ryan et al. 2000). This variation could be due to root hair length because Schweiger
et al. (1995) found an adverse relationship between root hair length and mycorrhizal benefit.
Soil disturbance can affect plant growth (and plant P) and AM fungal colonisation by breaking
up the mycorrhizal intraradical mycelium from the previous season (Evans and Miller 1990;
Jasper et al. 1989). The composition of AM fungal communities can be affected by soil
disturbance and land use (Jansa et al. 2002; Lumini et al. 2010; Oehl et al. 2010). Indeed, van
Chapter Four
50
der Heyde et al. (2017) demonstrated that mechanical disturbance of agricultural soil affected
AM fungal abundance. This, in turn, is consistent with the observation that soils with low
disturbance had higher root colonisation, spore abundance and spore viability (Trejo et al.
2016).
In this experiment, undisturbed cores of pasture soil were used to test the hypothesis that
interactions between N and P in a pasture ecosystem alter the rate and extent of colonisation of
roots of the subterranean clover and annual ryegrass plants present primarily due to effects on
root growth. Mycorrhizal root colonisation has been attributed to variation plant root properties
(Schweiger et al. 1995). Elevating nutrient availability can minimise the benefit provided by
AM fungi by decreasing fine roots when nutrients are limited. It was expected that the
colonisation of roots by AM fungi would vary depending on fertiliser application to the mixed
pasture community. It was also predicted that the dominant AM fungal morphotypes present
would change with the fertiliser treatments based on differential responses of AM fungi to
nutrients (Liu et al. 2012; Treseder 2004). The effect of N and P applied separately and together
was considered in relation to interactions among pasture species and the naturally occurring
AM fungi present in the pasture soil. Pasture growth was used as an indicator (bioassay) to
assess the effects of nutrients on pasture productivity during the early phase of growth.
Mycorrhizas were assessed as both the % root length colonised and the length or root colonised
for both subterranean clover and annual ryegrass growing together in the pasture sward as these
two pasture species differ in root architecture and structure.
4.3 Material and methods
Undisturbed soil cores (11cm in diameter and 15 cm in height) were collected from an annual
pasture which had a self-sown mixture of subterranean clover (Trifolium subterraneum L. cv.
‘Dalkeith’) and Wimmera ryegrass (Lolium rigidum) seedlings at The University of Western
Australia Farm (Ridgefield) near Pingelly, WA (S 32° 30’ 23”, E 116° 59’ 31”) in August 2014.
A grid of 12×12 m was selected to collect cores using a metallic core. Undisturbed soil cores
were achieved using a custom designed metal cage that housed a PVC pipe, 100 mm in diameter
by 150 mm depth. The metal cage with cutting edge of same internal diameter as the PVC pipe
used as pots was driven into field soil to the required depth, then dug out where the metal cage
was removed leaving the PVC housing. The bottom of the PVC housing was capped carefully
to create an undisturbed soil core. Four nutrient treatments (Nil, N, P, and NP) were applied to
cores, and each treatment had six replicates. A basal nutrient solution (without N and P) was
Chapter Four
51
applied to all cores. There were two harvests. The particle size analysis of soil was 12.3% clay,
11.3% silt and 76.4% sand (McArthur 1991) and pH 4.65 in H2O. The available nutrients were
36.9 (mg kg-1 soil) Colwell P (Colwell 1963), 11.8 (mg kg-1 soil) NO3--N and 35.9 (Kempers
and Luft 1988) (mg/kg soil) NH4+-N (Searle 1984).
Nutrients were added to the cores in solution four days after their collection from the field and
all received basal nutrients as a Hoagland solution, including the Nil treatment (with the
exclusion of N and P). N and P treatments were added to the soil surface five days after placing
the cores in the glasshouse; N was applied as NH4NO3 at a rate equivalent to 100 kg N ha-1 and
P was added as NaH2PO4.2H20 at a rate equivalent to 25 kg P ha-1. Pots were watered following
weighing daily to maintain water soil content close to 70% of field capacity.
The experiment included harvests at five and eight weeks after fertiliser addition when plants
were removed from the cores and shaken gently to remove soil. Subterranean clover and
Wimmera ryegrass were separated for each treatment. Shoots and roots were collected and
weighed separately. A subsample of roots (0.5 g fresh weight) was retained for staining to
quantify mycorrhizas. Shoots and the remaining roots were dried at 60 oC for 72 h to determine
shoot and root dry weights (DW). Root mass ratio was calculated:
Root mass ratio = (Root DW/ Shoot DW) x100
To determine the percentage of the root length colonised by AM fungi, Sub-samples of fresh
roots was cut into 1 cm lengths, cleared in 10% KOH, stained with Trypan blue (0.05%) in
lactoglycerol (1:1:1.2) lactic acid:glycerol:water and destained in lactoglycerol (Abbott and
Robson 1981). The percentage colonisation of roots by AM fungi was estimated by visual
observation of stained root segments mounted in lactoglycerol by the grid-line intersection
counting method which is also used for assessing total root length (Giovannetti and Mosse
1980). The length of root colonised was assessed simultaneously (Giovannetti and Mosse 1980)
after estimating root length (Newman 1966). AM fungal morphotype colonisation was
estimated after preparing microscope slides with 30 root segments (1 cm). The intercepts
between roots and the hairline were viewed using a compound microscope at x 200
magnification. Based on the previous descriptions for AM fungi in soils of south-western
Australia, morphotypes were classified into four major morphotypes representing the genera
Glomus, Acaulospora, Scutellospora and fine endophyte (Abbott 1982; Abbott and Robson
1977; Orchard et al. 2017a; Shi et al. 2012; Solaiman and Abbott 2003; Thippayarugs et al.
Chapter Four
52
1999). Total root length and length of root colonised were calculated on both a per soil core and
per plant basis, as the plant number was unequal in the naturally occurring pasture sward.
Soil mineral N (NO3− and exchangeable NH4
+) were measured by extracting 20 g with 80 mL
0.5 M K2SO4 and analysing the extracts colourimetrically for exchangeable NH4+ using the
salicylate–nitroprusside method (Searle 1984) and NO3− concentration using the hydrazine
reduction method (Kempers and Luft 1988) on an automated flow injection Skalar
AutoAnalyser (San plus, Skalar Analytical, The Netherlands). Extractable P was determined by
extracting air-dried soils in 0.5 M sodium bicarbonate solution at pH 8.5 using the colourimetric
methods of Rayment and Higginson (1992).
Total N and P in plant tissue were determined using a Kjeldahl digest (Bremner and Mulvaney
1982). Total N was determined using an ammonium N in green method Na-Nitroprusside, and
total P was calculated using molybdenum blue colorimetry (Blakemore et al. 1972).
Analysis of variance (GeStat V.12.1) presented in ANOVA (Two-way Design ) tables were
used to examine clover and ryegrass dry weights, roots diameters, total and available nutrients
concentration, AM colonisation (%) and root length colonised for (i) the effects of N addition
when no P was added, (ii) the effects of P addition when no N was added, and (iii) the
interactions between P and N comparing with no N and P treatment. The treatment means were
compared using least significant differences (LSD).
4.4 Results
Plant Biomass
By the first harvest (5 weeks), none of the treatments (N, N+P, and P) had affected shoot dry
weight (Figure 4-1a), but all had influenced root dry weight (Figure 4-1b). The highest root
weight occurred for the Nil treatment for both clover and ryegrass (Table 4-1). For root length,
no treatments had a significant effect (Figure 4-1c).
Subterranean clover plants had been outcompeted by the second harvest (Figure 4-1). All
treatments had a significant effect (P ≤ 0.05) on ryegrass shoot growth (Figure 4-1d), and dry
root weights (Figure 4-1e). The highest shoot and root dry weight were recorded for the N+P
treatment (P ≤ 0.05; 18.33 and 3.41 g/soil core) respectively (Figures 4-1a,b). While all the
treatments significantly reduced root length per core. The lowest root length was recorded with
P treatment (P ≤ 0.05; 245.8 m/ soil core). Root mass ratio did not respond to nutrient treatments
at the first harvest (Figure 4-2a). However, treatments had a significant effect on root mass ratio
Chapter Four
53
in the second harvest. The highest root mass ratio was recorded for the Nil treatment (29%),
while the lowest ratio (18%) was recorded for both N and N+P treatments (Figure 4-2b).
Total N and P in plant tissue
There was no significant effect of the treatments on %P (P > 0.05) at 5 weeks, but there was a
significant effect among pasture species (P ≤ 0.05). The highest P% for both clover and ryegrass
was with P treatment (0.4 and 0.5 %) respectively, while the lowest P% was for N treatment
(0.2%) (Figure 4.3a). At 8 weeks, %P of ryegrass shoots decreased significantly compared to
the Nil treatment (P ≤ 0.05). The highest %P was recorded with Nil and P treatments (0.3%)
for both, and the lowest %P was recorded for the N treatment (0.1%) Figure 4.3b. No correlation
was observed between %P and dry shoot weight at both harvests.
For the percentage of N, all treatments had a significant effect on %N at 5 weeks. The highest
was recorded for N+P for both clover and ryegrass (2.7%) (P ≤ 0.05). While the lowest %N for
clover and ryegrass was recorded for the P treatment (2.1 and 1.6 % respectively). At 8 weeks,
the treatments did not affect the %N (P > 0.05) (data not shown).
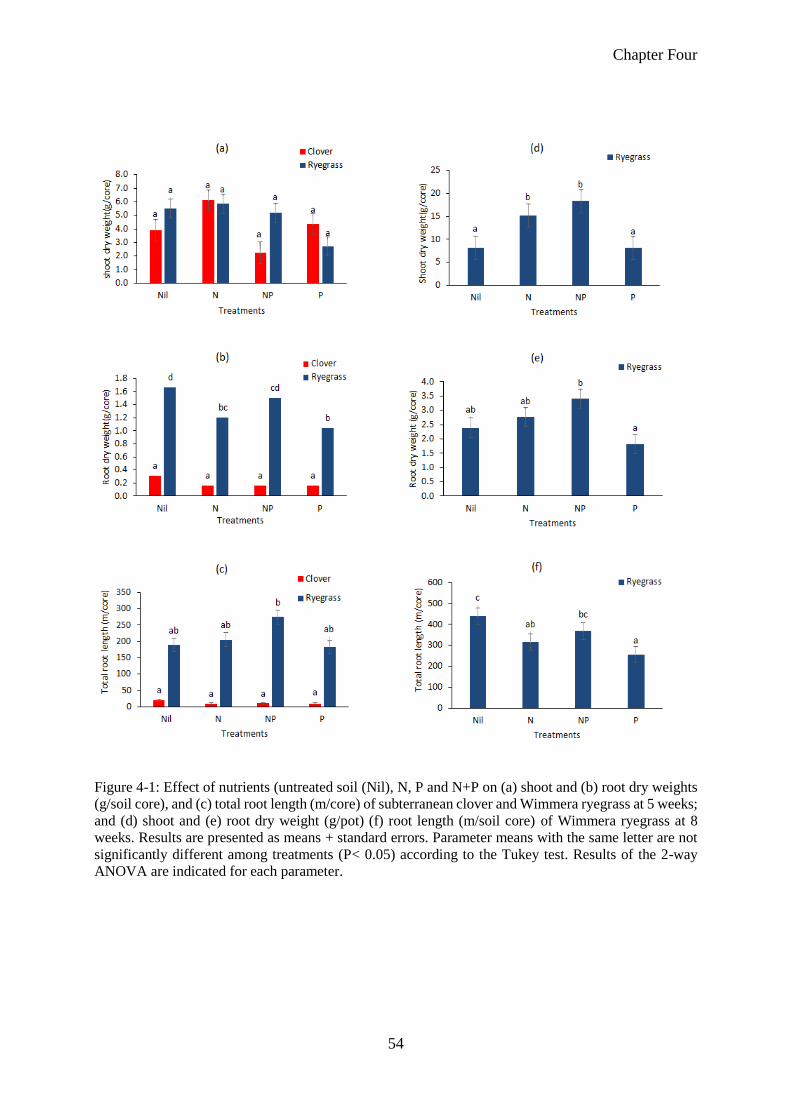
Chapter Four
54
Figure 4-1: Effect of nutrients (untreated soil (Nil), N, P and N+P on (a) shoot and (b) root dry weights
(g/soil core), and (c) total root length (m/core) of subterranean clover and Wimmera ryegrass at 5 weeks;
and (d) shoot and (e) root dry weight (g/pot) (f) root length (m/soil core) of Wimmera ryegrass at 8
weeks. Results are presented as means + standard errors. Parameter means with the same letter are not
significantly different among treatments (P< 0.05) according to the Tukey test. Results of the 2-way
ANOVA are indicated for each parameter.
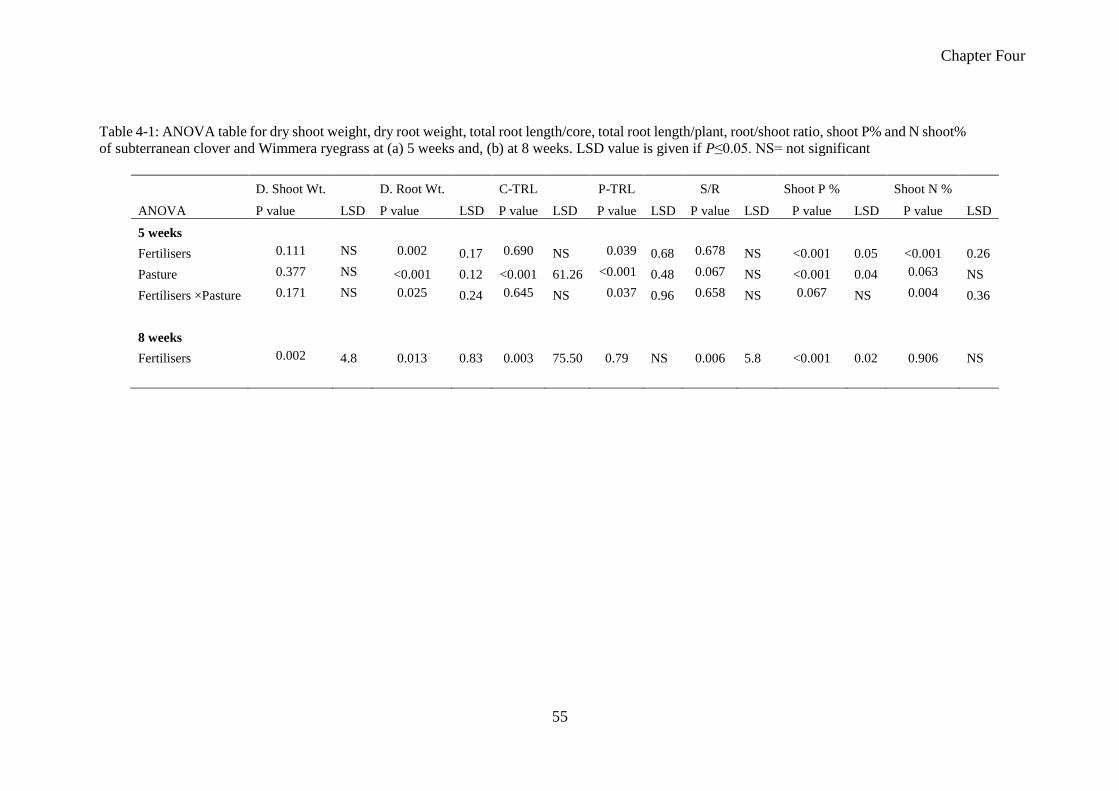
Chapter Four
55
Table 4-1: ANOVA table for dry shoot weight, dry root weight, total root length/core, total root length/plant, root/shoot ratio, shoot P% and N shoot%
of subterranean clover and Wimmera ryegrass at (a) 5 weeks and, (b) at 8 weeks. LSD value is given if P≤0.05. NS= not significant
D. Shoot Wt. D. Root Wt. C-TRL P-TRL S/R Shoot P % Shoot N %
ANOVA P value LSD P value LSD P value LSD P value LSD P value LSD P value LSD P value LSD
5 weeks
Fertilisers 0.111 NS 0.002 0.17 0.690 NS 0.039 0.68 0.678 NS <0.001 0.05 <0.001 0.26
Pasture 0.377 NS <0.001 0.12 <0.001 61.26 <0.001 0.48 0.067 NS <0.001 0.04 0.063 NS
Fertilisers ×Pasture 0.171 NS 0.025 0.24 0.645 NS 0.037 0.96 0.658 NS 0.067 NS 0.004 0.36
8 weeks
Fertilisers 0.002 4.8 0.013 0.83 0.003 75.50 0.79 NS 0.006 5.8 <0.001 0.02 0.906 NS

Chapter Four
56
Soil Nutrients
The effects of treatments on soil N (NO3- and NH4
+) and available soil P at the time of harvests
are shown in Table 4-2. At the first harvest, the highest concentration of NO3--N was for the N
Figure 4-2: Effect of nutrients (untreated soil (Nil), N, P and N+P) on root/shoot mass ratio of subterranean
clover and Wimmera ryegrass at (a) 5 weeks and, (b) at 8 weeks. Results are presented as means + standard
errors. Parameter means with the same letter are not significantly different among treatments (P< 0.05)
according to the Tukey test. Results of the 2-way ANOVA are indicated for each parameter.
Figure 4-3: Shoot P (%) of subterranean clover and Wimmera ryegrass shoot at (a) 5 weeks and (b) 8
weeks. Results are presented as means + standard errors. Parameter means with the same letter are not
significantly different among treatments (P<0.05) according to the Tukey test. Results of the 2-way
ANOVA are indicated for each parameter.
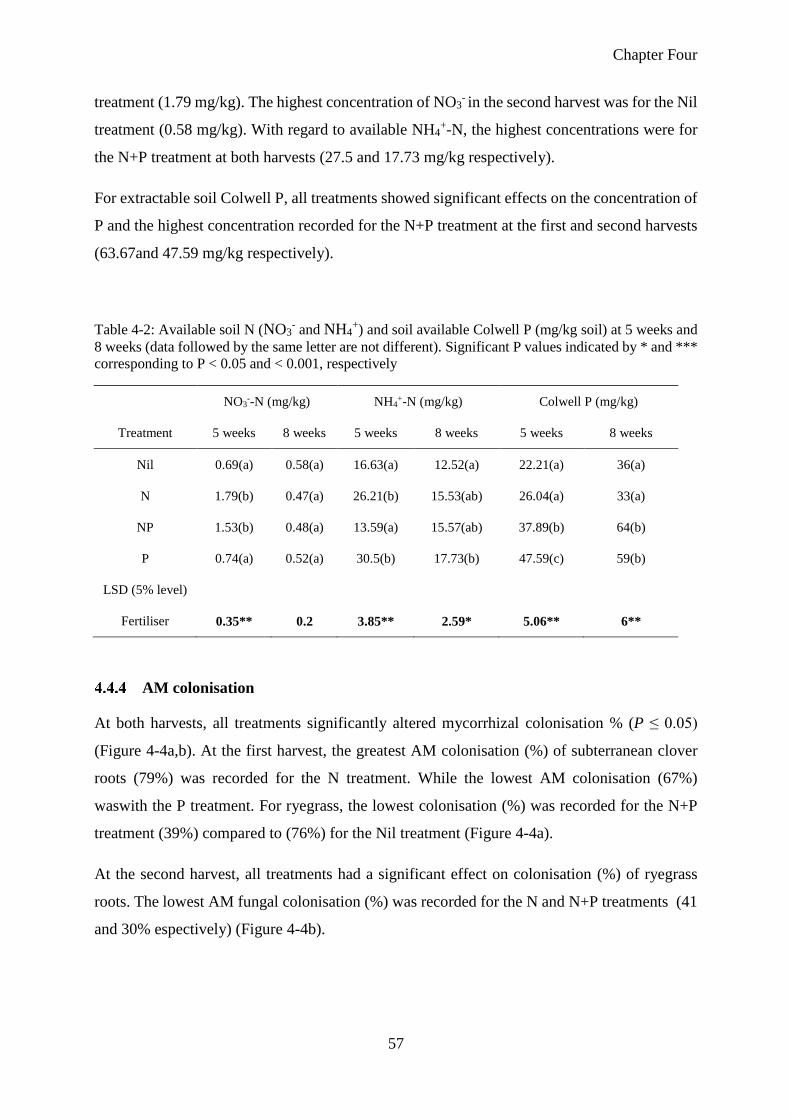
Chapter Four
57
treatment (1.79 mg/kg). The highest concentration of NO3- in the second harvest was for the Nil
treatment (0.58 mg/kg). With regard to available NH4+-N, the highest concentrations were for
the N+P treatment at both harvests (27.5 and 17.73 mg/kg respectively).
For extractable soil Colwell P, all treatments showed significant effects on the concentration of
P and the highest concentration recorded for the N+P treatment at the first and second harvests
(63.67and 47.59 mg/kg respectively).
Table 4-2: Available soil N (NO3- and NH4
+) and soil available Colwell P (mg/kg soil) at 5 weeks and
8 weeks (data followed by the same letter are not different). Significant P values indicated by * and ***
corresponding to P < 0.05 and < 0.001, respectively
NO3--N (mg/kg) NH4
+-N (mg/kg) Colwell P (mg/kg)
Treatment 5 weeks 8 weeks 5 weeks 8 weeks 5 weeks 8 weeks
Nil 0.69(a) 0.58(a) 16.63(a) 12.52(a) 22.21(a) 36(a)
N 1.79(b) 0.47(a) 26.21(b) 15.53(ab) 26.04(a) 33(a)
NP 1.53(b) 0.48(a) 13.59(a) 15.57(ab) 37.89(b) 64(b)
P 0.74(a) 0.52(a) 30.5(b) 17.73(b) 47.59(c) 59(b)
LSD (5% level)
Fertiliser 0.35** 0.2 3.85** 2.59* 5.06** 6**
AM colonisation
At both harvests, all treatments significantly altered mycorrhizal colonisation % (P ≤ 0.05)
(Figure 4-4a,b). At the first harvest, the greatest AM colonisation (%) of subterranean clover
roots (79%) was recorded for the N treatment. While the lowest AM colonisation (67%)
waswith the P treatment. For ryegrass, the lowest colonisation (%) was recorded for the N+P
treatment (39%) compared to (76%) for the Nil treatment (Figure 4-4a).
At the second harvest, all treatments had a significant effect on colonisation (%) of ryegrass
roots. The lowest AM fungal colonisation (%) was recorded for the N and N+P treatments (41
and 30% espectively) (Figure 4-4b).
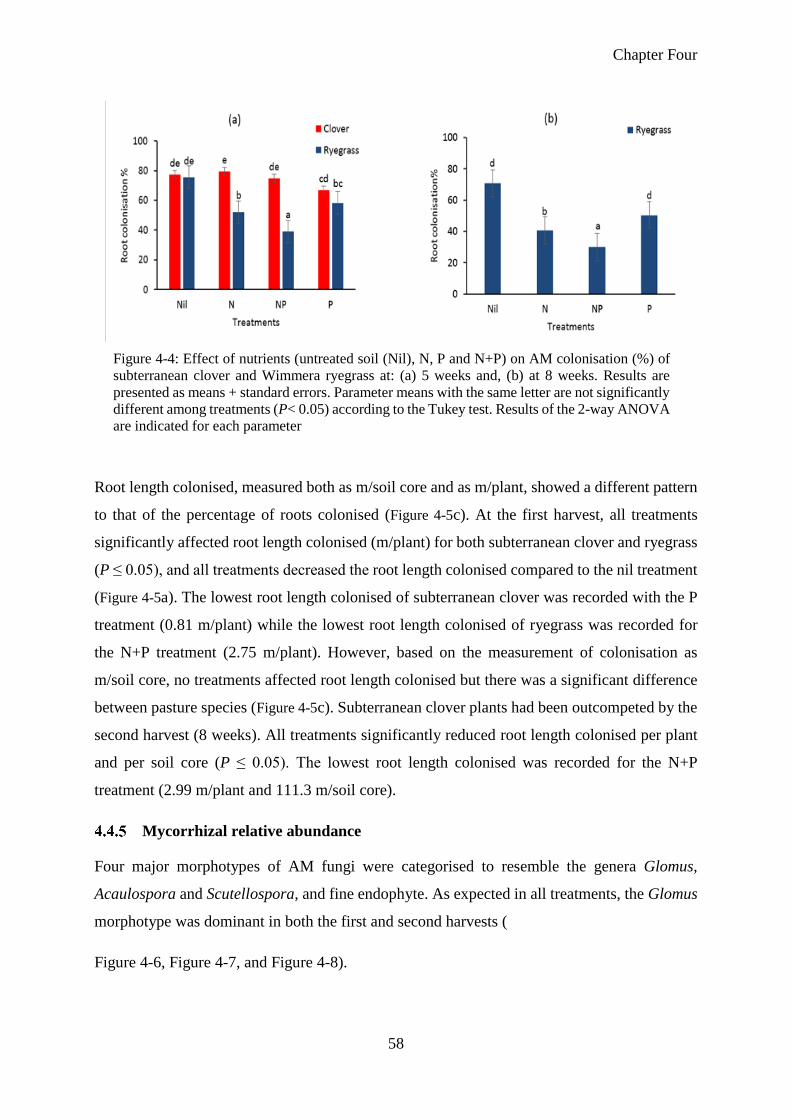
Chapter Four
58
Root length colonised, measured both as m/soil core and as m/plant, showed a different pattern
to that of the percentage of roots colonised (Figure 4-5c). At the first harvest, all treatments
significantly affected root length colonised (m/plant) for both subterranean clover and ryegrass
(P ≤ 0.05), and all treatments decreased the root length colonised compared to the nil treatment
(Figure 4-5a). The lowest root length colonised of subterranean clover was recorded with the P
treatment (0.81 m/plant) while the lowest root length colonised of ryegrass was recorded for
the N+P treatment (2.75 m/plant). However, based on the measurement of colonisation as
m/soil core, no treatments affected root length colonised but there was a significant difference
between pasture species (Figure 4-5c). Subterranean clover plants had been outcompeted by the
second harvest (8 weeks). All treatments significantly reduced root length colonised per plant
and per soil core (P ≤ 0.05). The lowest root length colonised was recorded for the N+P
treatment (2.99 m/plant and 111.3 m/soil core).
Mycorrhizal relative abundance
Four major morphotypes of AM fungi were categorised to resemble the genera Glomus,
Acaulospora and Scutellospora, and fine endophyte. As expected in all treatments, the Glomus
morphotype was dominant in both the first and second harvests (
Figure 4-6, Figure 4-7, and Figure 4-8).
Figure 4-4: Effect of nutrients (untreated soil (Nil), N, P and N+P) on AM colonisation (%) of
subterranean clover and Wimmera ryegrass at: (a) 5 weeks and, (b) at 8 weeks. Results are
presented as means + standard errors. Parameter means with the same letter are not significantly
different among treatments (P< 0.05) according to the Tukey test. Results of the 2-way ANOVA
are indicated for each parameter
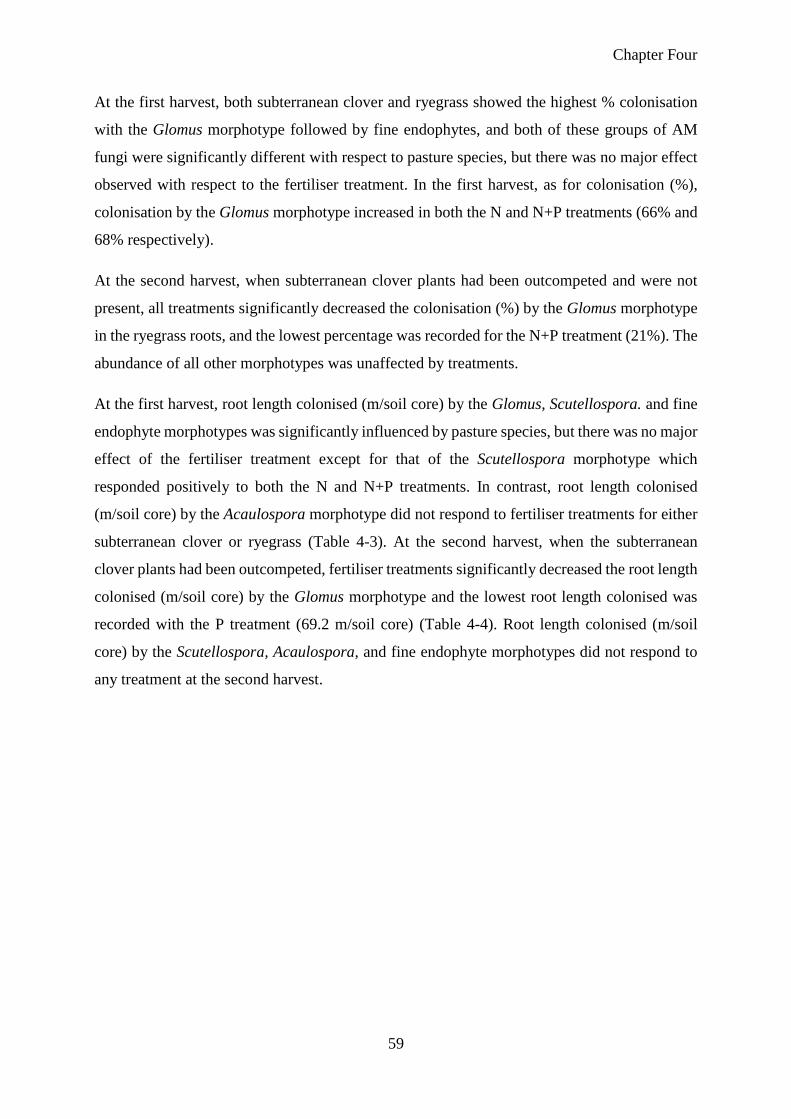
Chapter Four
59
At the first harvest, both subterranean clover and ryegrass showed the highest % colonisation
with the Glomus morphotype followed by fine endophytes, and both of these groups of AM
fungi were significantly different with respect to pasture species, but there was no major effect
observed with respect to the fertiliser treatment. In the first harvest, as for colonisation (%),
colonisation by the Glomus morphotype increased in both the N and N+P treatments (66% and
68% respectively).
At the second harvest, when subterranean clover plants had been outcompeted and were not
present, all treatments significantly decreased the colonisation (%) by the Glomus morphotype
in the ryegrass roots, and the lowest percentage was recorded for the N+P treatment (21%). The
abundance of all other morphotypes was unaffected by treatments.
At the first harvest, root length colonised (m/soil core) by the Glomus, Scutellospora. and fine
endophyte morphotypes was significantly influenced by pasture species, but there was no major
effect of the fertiliser treatment except for that of the Scutellospora morphotype which
responded positively to both the N and N+P treatments. In contrast, root length colonised
(m/soil core) by the Acaulospora morphotype did not respond to fertiliser treatments for either
subterranean clover or ryegrass (Table 4-3). At the second harvest, when the subterranean
clover plants had been outcompeted, fertiliser treatments significantly decreased the root length
colonised (m/soil core) by the Glomus morphotype and the lowest root length colonised was
recorded with the P treatment (69.2 m/soil core) (Table 4-4). Root length colonised (m/soil
core) by the Scutellospora, Acaulospora, and fine endophyte morphotypes did not respond to
any treatment at the second harvest.
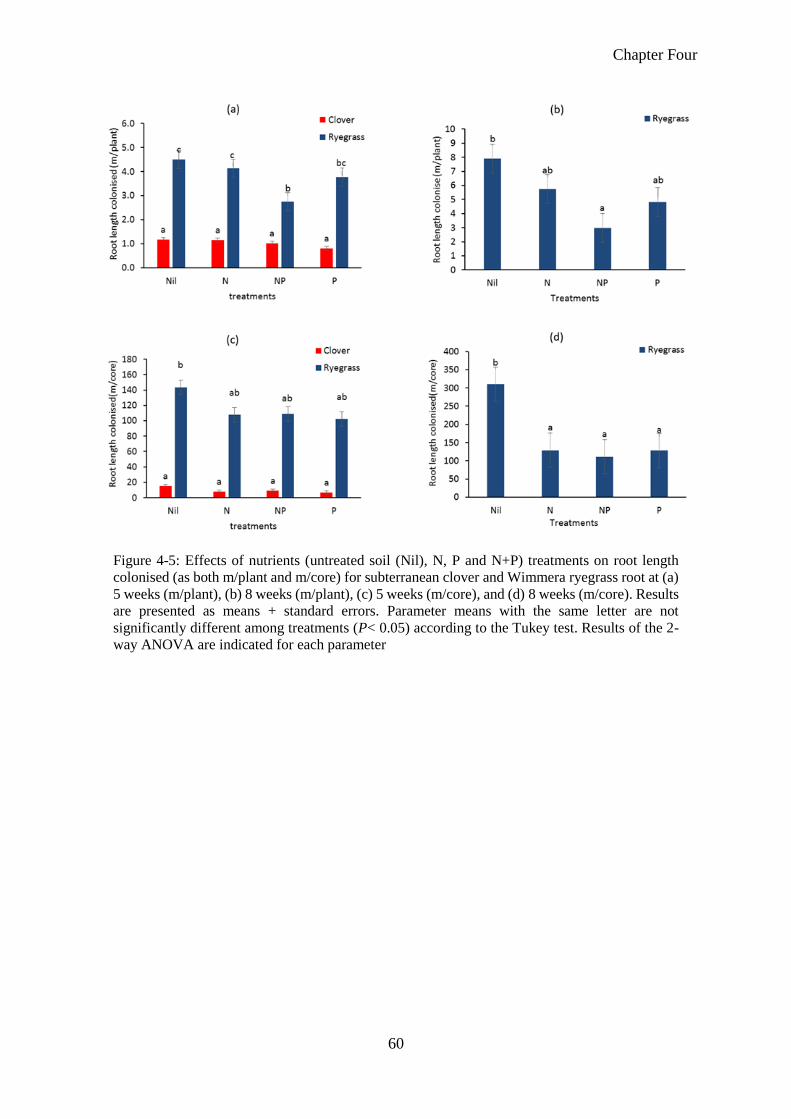
Chapter Four
60
Figure 4-5: Effects of nutrients (untreated soil (Nil), N, P and N+P) treatments on root length
colonised (as both m/plant and m/core) for subterranean clover and Wimmera ryegrass root at (a)
5 weeks (m/plant), (b) 8 weeks (m/plant), (c) 5 weeks (m/core), and (d) 8 weeks (m/core). Results
are presented as means + standard errors. Parameter means with the same letter are not
significantly different among treatments (P< 0.05) according to the Tukey test. Results of the 2-
way ANOVA are indicated for each parameter
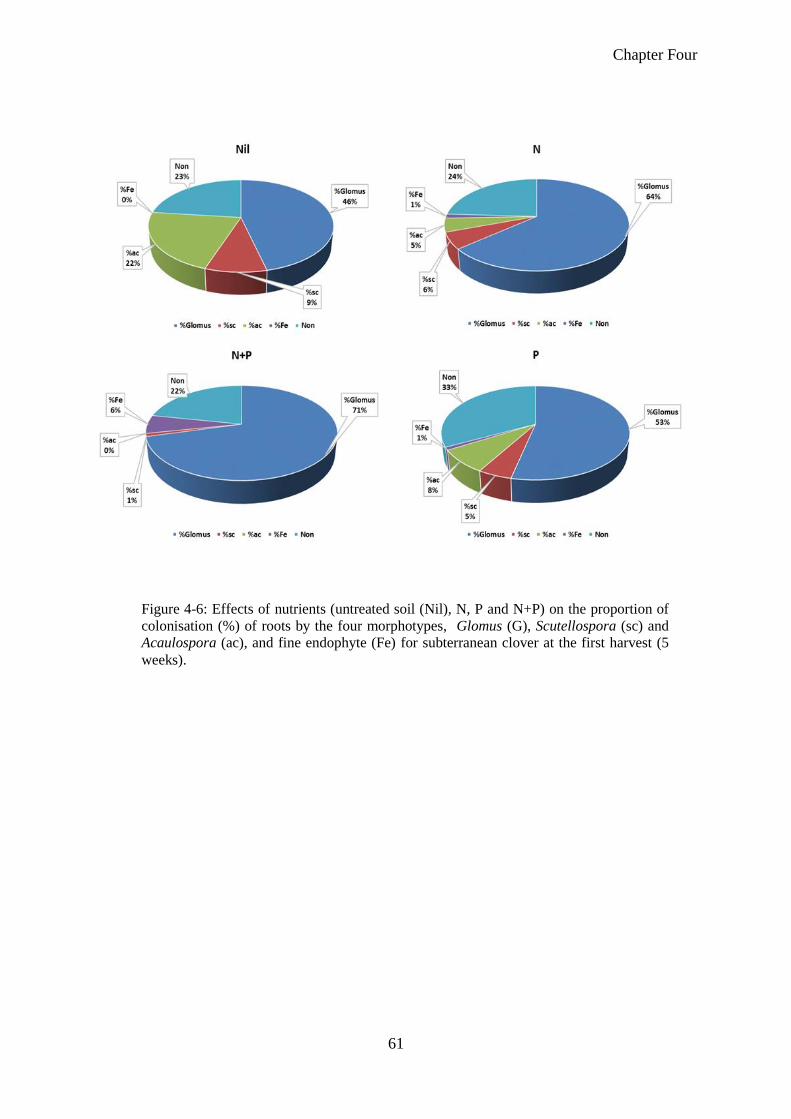
Chapter Four
61
Figure 4-6: Effects of nutrients (untreated soil (Nil), N, P and N+P) on the proportion of
colonisation (%) of roots by the four morphotypes, Glomus (G), Scutellospora (sc) and
Acaulospora (ac), and fine endophyte (Fe) for subterranean clover at the first harvest (5
weeks).
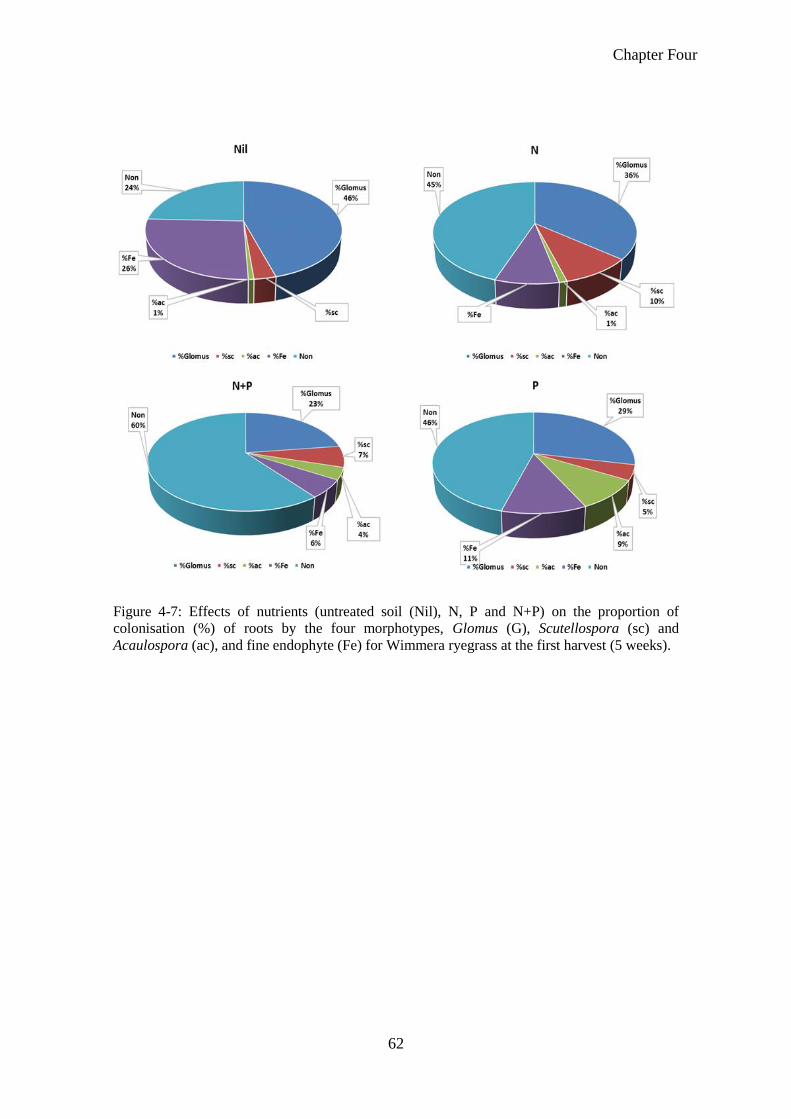
Chapter Four
62
Figure 4-7: Effects of nutrients (untreated soil (Nil), N, P and N+P) on the proportion of
colonisation (%) of roots by the four morphotypes, Glomus (G), Scutellospora (sc) and
Acaulospora (ac), and fine endophyte (Fe) for Wimmera ryegrass at the first harvest (5 weeks).
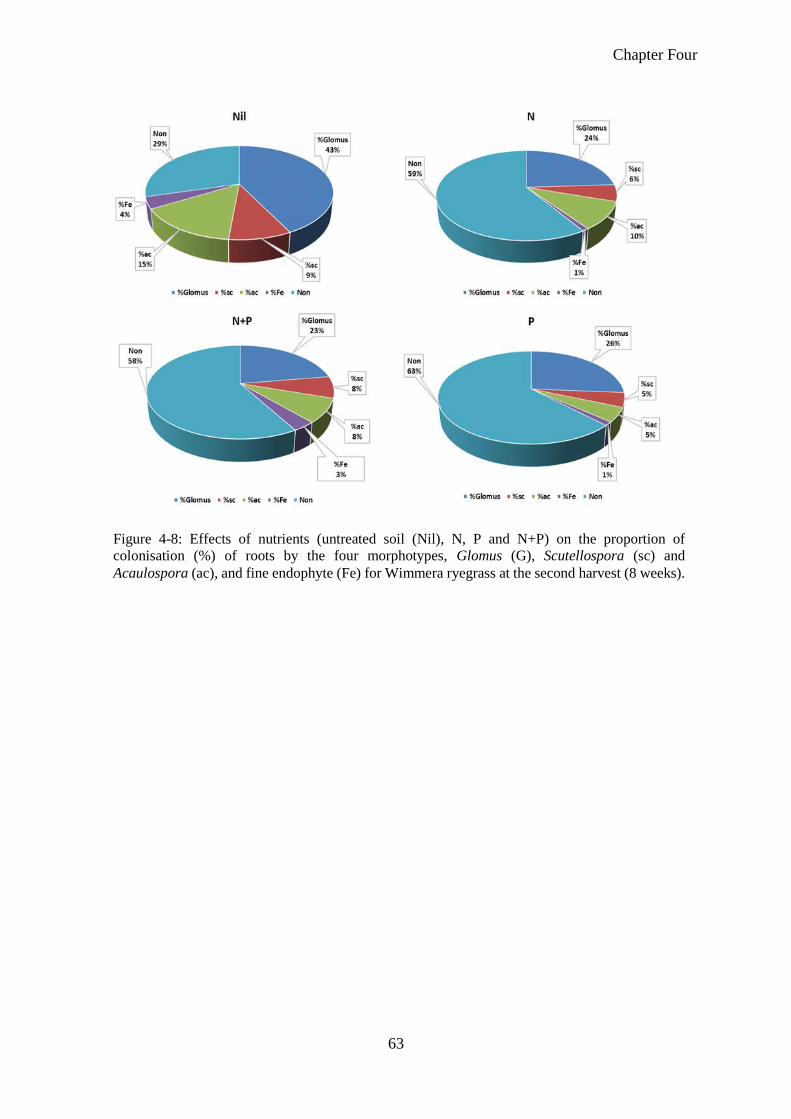
Chapter Four
63
Figure 4-8: Effects of nutrients (untreated soil (Nil), N, P and N+P) on the proportion of
colonisation (%) of roots by the four morphotypes, Glomus (G), Scutellospora (sc) and
Acaulospora (ac), and fine endophyte (Fe) for Wimmera ryegrass at the second harvest (8 weeks).
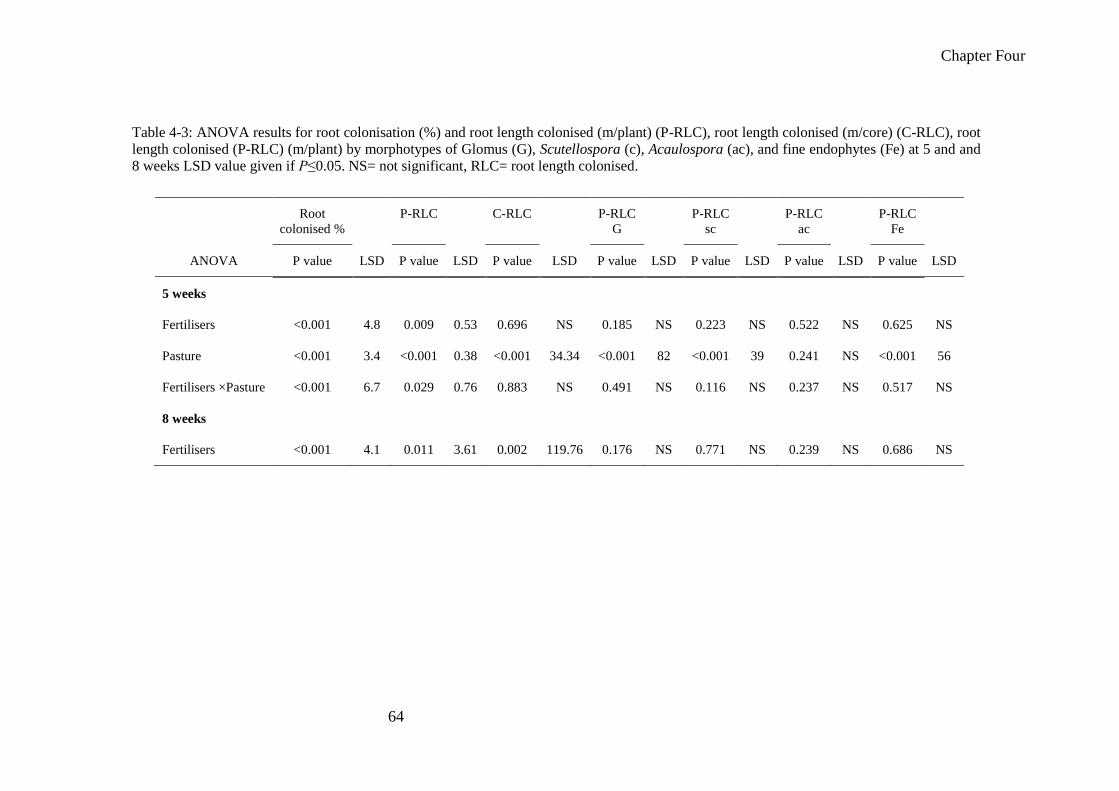
Chapter Four
64
Table 4-3: ANOVA results for root colonisation (%) and root length colonised (m/plant) (P-RLC), root length colonised (m/core) (C-RLC), root
length colonised (P-RLC) (m/plant) by morphotypes of Glomus (G), Scutellospora (c), Acaulospora (ac), and fine endophytes (Fe) at 5 and and
8 weeks LSD value given if P≤0.05. NS= not significant, RLC= root length colonised.
Root
colonised %
P-RLC
C-RLC
P-RLC
G
P-RLC
sc
P-RLC
ac
P-RLC
Fe
ANOVA P value LSD P value LSD P value LSD P value LSD P value LSD P value LSD P value LSD
5 weeks
Fertilisers <0.001 4.8 0.009 0.53 0.696 NS 0.185 NS 0.223 NS 0.522 NS 0.625 NS
Pasture <0.001 3.4 <0.001 0.38 <0.001 34.34 <0.001 82 <0.001 39 0.241 NS <0.001 56
Fertilisers ×Pasture <0.001 6.7 0.029 0.76 0.883 NS 0.491 NS 0.116 NS 0.237 NS 0.517 NS
8 weeks
Fertilisers <0.001 4.1 0.011 3.61 0.002 119.76 0.176 NS 0.771 NS 0.239 NS 0.686 NS
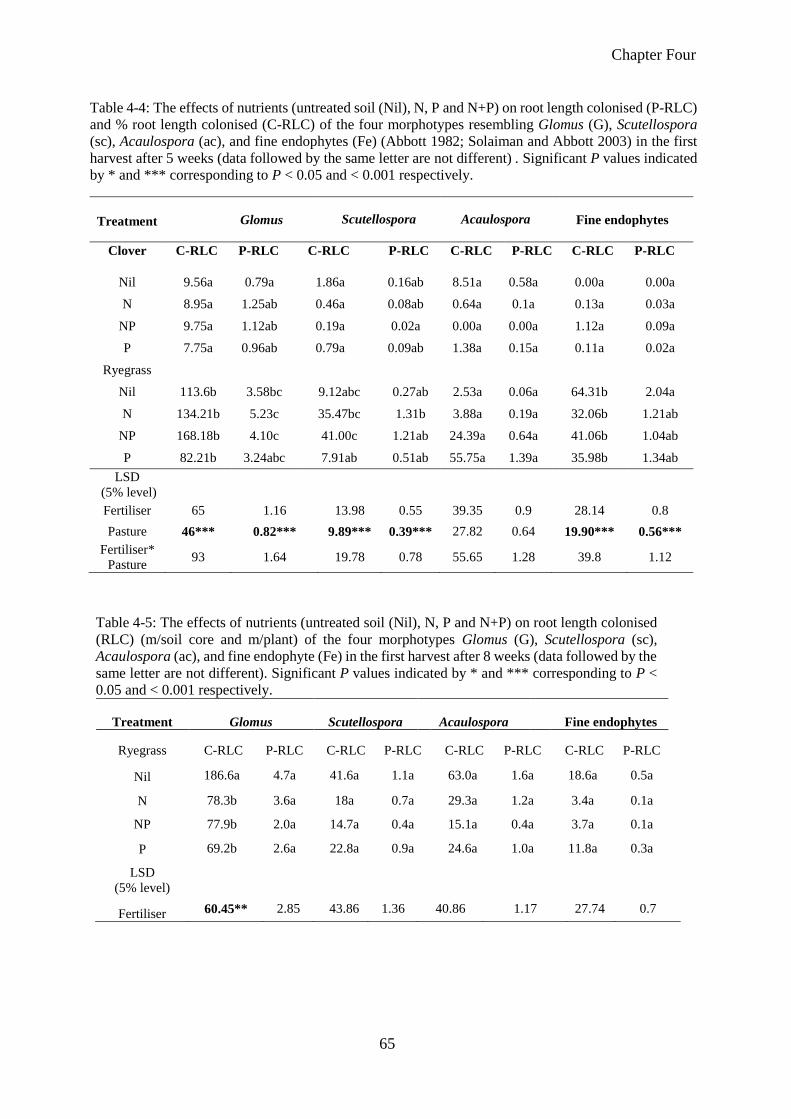
Chapter Four
65
Table 4-4: The effects of nutrients (untreated soil (Nil), N, P and N+P) on root length colonised (P-RLC)
and % root length colonised (C-RLC) of the four morphotypes resembling Glomus (G), Scutellospora
(sc), Acaulospora (ac), and fine endophytes (Fe) (Abbott 1982; Solaiman and Abbott 2003) in the first
harvest after 5 weeks (data followed by the same letter are not different) . Significant P values indicated
by * and *** corresponding to P < 0.05 and < 0.001 respectively.
Treatment Glomus Scutellospora
Acaulospora
Fine endophytes
Clover C-RLC P-RLC C-RLC P-RLC C-RLC P-RLC C-RLC P-RLC
Nil 9.56a 0.79a 1.86a 0.16ab 8.51a 0.58a 0.00a 0.00a
N 8.95a 1.25ab 0.46a 0.08ab 0.64a 0.1a 0.13a 0.03a
NP 9.75a 1.12ab 0.19a 0.02a 0.00a 0.00a 1.12a 0.09a
P 7.75a 0.96ab 0.79a 0.09ab 1.38a 0.15a 0.11a 0.02a
Ryegrass
Nil 113.6b 3.58bc 9.12abc 0.27ab 2.53a 0.06a 64.31b 2.04a
N 134.21b 5.23c 35.47bc 1.31b 3.88a 0.19a 32.06b 1.21ab
NP 168.18b 4.10c 41.00c 1.21ab 24.39a 0.64a 41.06b 1.04ab
P 82.21b 3.24abc 7.91ab 0.51ab 55.75a 1.39a 35.98b 1.34ab
LSD
(5% level)
Fertiliser 65 1.16 13.98 0.55 39.35 0.9 28.14 0.8
Pasture 46*** 0.82*** 9.89*** 0.39*** 27.82 0.64 19.90*** 0.56***
Fertiliser*
Pasture 93 1.64 19.78 0.78 55.65 1.28 39.8 1.12
Table 4-5: The effects of nutrients (untreated soil (Nil), N, P and N+P) on root length colonised
(RLC) (m/soil core and m/plant) of the four morphotypes Glomus (G), Scutellospora (sc),
Acaulospora (ac), and fine endophyte (Fe) in the first harvest after 8 weeks (data followed by the
same letter are not different). Significant P values indicated by * and *** corresponding to P <
0.05 and < 0.001 respectively.
Treatment Glomus Scutellospora
Acaulospora Fine endophytes
Ryegrass C-RLC P-RLC C-RLC P-RLC C-RLC P-RLC C-RLC P-RLC
Nil 186.6a 4.7a 41.6a 1.1a 63.0a 1.6a 18.6a 0.5a
N 78.3b 3.6a 18a 0.7a 29.3a 1.2a 3.4a 0.1a
NP 77.9b 2.0a 14.7a 0.4a 15.1a 0.4a 3.7a 0.1a
P 69.2b 2.6a 22.8a 0.9a 24.6a 1.0a 11.8a 0.3a
LSD
(5% level)
Fertiliser 60.45** 2.85 43.86 1.36 40.86 1.17 27.74 0.7
Chapter Four
66
4.5 Discussion
In this study, colonisation of roots of pasture plants in response to application of N and P, either
separately or together, was investigated in a naturally occurring sward of subterranean clover
and Wimmera ryegrass. Initially, shoot dry weight (g/core and g/plant) of both subterranean
clover and ryegrass showed no response to either N or P applied independently or together and
there was no interaction between them. This was not unexpected because the initial available
N and P in the field soil used was adequate for plant growth. However, the application of P and
N independently and the interaction between N and P may change the competitive capability
of subterranean clover and annual ryegrass pasture plants. Subterranean clover, in general, is a
weak competitor for light and soil nutrients compared to annual ryegrass in particular (Harris
1987; Haynes 1980; Soussana et al. 1995). Previous studies have explained how N and P
influence the competitive process among legume-grass mixtures (Annicchiarico and Proietti
2010; Frame and Newbould 1986; Høgh-Jensen and Schjoerring 2010; Mendoza et al. 2016).
Legumes have an advantage in N-limited soils as legumes are able to use and fix N2 from the
atmosphere (Frame and Newbould 1986). For that, the enrichment of N increases N-access and
this may give grasses an advantage over legume in legume-grass mixture compared to soil that
poor in N (Temperton et al. 2007). In contrast, P enrichment has the potential to improve the
competitive of legumes especially with clover (Trifolium repens) over annual ryegrass (Lolium
rigidum) over grasses when they grow in mixture (Høgh-Jensen and Schjoerring 2010). This
variation in completive ability under N and P enrichment conditions due to the variation in root
architecture and the ability of the associated plant species to explore the soil and facilitate the
uptake of P and N (Hinsinger et al. 2011).
By the end of the experiment (weeks 8), subterranean clover had been out-competed by the
annual ryegrass. This may be due to a higher competitive ability of annual ryegrass compared
to subterranean clover. This explanation is consistent with previous studies of legume-grass
mixtures, where subterranean clover declined rapidly in the late stages of growth because of
competition for light, soil nutrients and water in addition to heavy grazing (Frame and
Newbould 1986; Soussana et al. 1995).
Application of N and P together, and P alone, reduced colonisation (%) of roots by AM fungi
in the annual ryegrass roots but did not affect colonisation (%) of roots of subterranean clover.
Colonisation (%) in subterranean clover was higher than in ryegrass. Thus, this study partially
supported the hypothesis that interactions between N and P in a pasture ecosystem alter the rate
Chapter Four
67
and extent of colonisation of roots of the subterranean clover and annual ryegrass plants present
primarily due to effects on root growth. Similar results were reported in previous studies in a
mixed grasses-legume combination that P and N+P fertilisation significantly decreased root
colonisation (%) by AM fungi, especially in grasses (Blanke et al. 2012; Mendoza et al. 2016).
While N fertilisation either increased or did not affect subterranean clover root colonisation it
significantly decreased the colonisation (%) of ryegrass roots. This finding is also consistent
with a study conducted by Ryan and Ash (1999) which showed that adding N did not
significantly affect colonisation of clover and ryegrass, whereas Johnson et al. (2003) reported
that N enrichment remarkably decreased AM colonisation in grassland. Previous studies have
reported that plants can control AM fungal root colonisation based on their nutritional status
and it has frequently been reported that inorganic-P enrichment can inhibit the development of
mycorrhizas (Braunberger et al. 1991; Breuillin et al. 2010).
For subterranean clover, root length colonised showed a significant response to fertiliser
application (for N, P, N+P) which was related to the change in total root length. However, root
length colonised was longer for ryegrass. This variation is related to differences in root
architecture of subterranean clover and annual ryegrass (Schweiger et al. 1995). Annual
ryegrass has a longer root system with more branches that can grow rapidly to enable it to
explore soil nutrients and water (Fitter 1987).
The mechanisms that enable plants to control mycorrhizal colonisation in response to nutrient
conditions need further investigation (Carbonnel and Gutjahr 2014). However, the percentage
of photosynthate provided by plants to mycorrhizas, which will be higher in P limitation
conditions, is one of the mechanisms (Hepper 1983; Schwab et al. 1991). Johnson et al. (2003)
reported that a P limitation in soil could mediate N enrichment and consequently, N enrichment
can positively affect AM fungal colonisation, while, in P-rich soil, N enrichment can negatively
affect AM fungal colonisation. This, in turn, is consistent with other studies conducted to
evaluate the effect of N enrichment in soil with different P limitation status (Liu et al. 2000;
Smith et al. 1986; Sylvia and Neal 1990).
The variation in root colonisation observed between subterranean clover and ryegrass can be
due to variation in their dependency on mycorrhizas. Schweiger et al. (1995) reported that the
colonisation of ryegrass root was less than that of legumes because ryegrass is less dependent
on AM fungi, and that ryegrass roots have more branches and plenty of root hairs to facilitate
plant to access soil P. Moreover, AM colonisation (%) of subterranean clover roots had a highly
Chapter Four
68
negative linear correlation with the concentration of shoot P (R2= -0.92). This is consistent with
other studies showing that addition of P markedly decreased the colonisation (%) in clover
roots (Ryan and Ash 1999). The present study showed that there was a significant effect of
harvest time on ryegrass root colonisation (%) and that colonisation (%) decreased over time
(data not presented). This has not corresponded with previous studies which suggested that
over time, colonisation (%) increased significantly because an adaptation to treatments
(Alexander et al. 1988; Orchard et al. 2017b; Read 1991).
There was no difference in relative abundance of AM fungal morphotypes among P, N and
N+P treatments during the timeframe of this study. However, pasture species (subterranean
clover and annual ryegrass) significantly affected the abundance of the major morphotypes.
Colonisation of subterranean clover roots by AM fungal morphotypes was significantly higher
than in ryegrass roots except for the Acaulospora morphotype. This substantiates previous
studies which indicated that mycorrhizal colonisation and abundance of AM fungi were higher
in clover than in ryegrass in P and N fertilised soil (Mendoza et al. 2016; Ryan and Ash 1999).
Allen (2001) suggested that the variation in root colonisation within and between species
following P addition could be due to an interaction between root length and root growth. Other
studies suggested that this variation may be due to changes in abundance of AM fungi within
roots (Mendoza and Pagani 1997; Smith and Read 2008).
Contrary to our hypothesis that the dominance of AM fungal morphotypes would change with
fertiliser treatments because of different responses of AM fungi to nutrients, the relative
abundance of the major morphotypes of AM fungi present, Glomus (G), Acaulospora (ac),
Scutellospora (sc), and fine endophyte (fe), were not affected. This is may be due to the
adaptation of AM fungi in high P soil where continuous application of the fertilisers is practiced
and the fungi become P- as well as N-tolerant. This could occur especially for the Glomus
morphotype. The initial soil extractable P in this experiment was 36.9 (mg/kg soil) which was
adequate for pasture growth. This is consistent with other studies showing that in some cases,
nutrient addition can induce AM fungal growth and sporulation (Davis et al. 1984; Douds and
Schenck 1990; Solaiman and Hirata 1997; Sylvia and Schenck 1983).
Neither N nor P fertilisers significantly affected shoot dry weight at the 5 weeks harvest. This
could due to competition between subterranean clover and annual ryegrass when they grow as
a mixture. Høgh-Jensen and Schjoerring (2010) suggested three mechanisms that restrict the
interactions between the grass-clover mixture, and competition above and belowground is one
Chapter Four
69
of these mechanisms. In the grass-clover mixture, supplying N can change the competitive
balance by promoting the competitive pressure of ryegrass. However, in contradiction to earlier
findings of Høgh-Jensen and Schjoerring (2010), subterranean clover and ryegrass shoot dry
weights were not significantly increased by application of N to the clover-ryegrass mixture (at
the first harvest). Whilke Temperton et al. (2007) reported that increasing N access can promote
the dominance of grasses in the grass-clover mixture, legumes may have an advantage over
grasses when available P is present at an insufficient level (Høgh-Jensen and Schjoerring
2010).
4.6 Conclusion
Application of P and N independently or together had different effects on root colonisation (%)
and root length colonised by AM fungi in mixed pasture cores with self-sown subterranean
clover and annual ryegrass seedlings. There was no effect of P and N on the relative abundance
of mycorrhizal morphotypes. An investigation using the molecular identification of AM fungi
could be used to evaluate further the whether there is any effect of P and N on the relative
abundance of AM fungi.
Chapter Five
70
5 CHAPTER 5
Effects of mineral-based and conventional chemical fertilisers on
mycorrhizal communities and nutrient uptake in pasture plants
5.1 Abstract
Grasslands cover about 70% of the global agricultural land. Intensive fertiliser use can
influence soil microbial diversity. Arbuscular mycorrhizal (AM) fungi are abundant symbionts
in the pasture ecosystems. The solubility of fertilisers is one of the most important factors
which can affect both plants and soil microorganisms. This study was conducted to evaluate
the effect of fertilisers of different phosphorus (P) solubility on mycorrhizal colonisation in
relation to root growth for two annual pasture species in a pasture soil. The four treatments
were: a commercial mineral-based fertiliser applied at 75 kg ha-1 (~5.6 P kg ha-1) and a
commercial chemical fertiliser applied at 43kg.ha-1 (~5.6 kg.ha-1), a microbial inoculant and a
control. Subterranean clover and annual ryegrass were grown separately and roots were
examined after 5 and 10 weeks. By 5 weeks, the proportion of subterranean clover roots
colonised by AM fungi decreased by 35 and 41% with the mineral-based and chemical
fertilisers respectively. In contrast, the decrease in proportion of roots of annual ryegrass roots
colonised by AM fungi was only about 20% in each case. The length of colonised subterranean
clover roots decreased to the same extent with application of both fertilisers, especially by 10
weeks, but the reduction in length of colonised root for annual ryegrass was much less than for
subterranean clover. There was little effect of the microbial inoculant on either the proportion
or length of roots colonised. P fertilisers had less effect on root length colonised than on the
proportion of roots colonised for the two annual pasture plants grown in this agricultural soil.
The relative abundance of AM fungal families was not affected by fertiliser treatments except
for the Gigasporaceae. The OTU (Operational Taxonomic Unit) richness was markedly
influenced by fertiliser application. In general, the conventional chemical fertiliser had a
greater negative effect on OTU richness for AM fungi in subterranean clover roots while
mineral-based fertiliser had a greater negative effect for annual ryegrass. The reduction in the
proportion of roots colonised by AM fungi with the P fertilisers was not related to differences
in their elemental solubility. Differential effects of P fertilisers on the naturally occurring AM
fungi in this agricultural soil have potential to influence plant competition and pasture species
dominance.
Chapter Five
71
5.2 Introduction
In grassland systems where the aim is to promote growth and productivity of plant biomass,
application of fertilisers is the most common and important management practice. Different
kinds of fertilisers, including organic P-based fertilisers, are applied to regulate the P status of
grassland soil (Bünemann et al. 2010).
Although the use of conventional P fertilisers promotes plant growth rapidly, they are
expensive, especially in developing regions (Sanchez 2002) and in addition, they may have
adverse influences on the environment and on soil microbial communities (Luo et al. 2015;
Pan et al. 2014; Tunney et al. 1997). Thus, alternative fertilisers such as controlled-release
fertilisers or slow-release fertilisers have been used to minimise the negative consequences of
supplying unnecessarily high levels of soluble P (Hagin and Harrison 1993; Shaviv 2001; Van
Geel et al. 2016). Slow or controlled-release fertilisers should supply soil solution nutrients at
rates that enable plants to optimally maintain the expression of their genetic capability (Hagin
and Harrison 1993). The release pattern of P from any fertiliser is important to control the
concentration of phosphate ions in the soil solution and to minimise P fixing in the soil (Wild
1950). However, it is difficult to predict and determine the accuracy the pattern and the rate of
nutrient release from fertilisers in soil (Hagin and Harrison 1993). Slow-release fertilisers can
be defined as classes of fertilisers that contain moderately-soluble components, regardless of
the properties of the reaction products in the soil (Hagin and Harrison 1993).
Phosphate rocks (PRs) comprise the major components of P sources for plants in slow-release
or controlled release fertilisers (Bolan et al. 1990; Chen and Hammond 1988; Goh et al. 1990;
Hammond et al. 1986; Reijnders 2014). One of the advantages of use of PR is the low cost of
P because little or no processing is required in addition to manipulating the rate of P release by
grinding (Khasawneh and Doll 1979). Unlike annual crops which need high levels of P over a
short period of rapid growth, pastures (especially legumes) can respond to sustained, sparingly
soluble P sources and hence, PRs have been used extensively for grass-clover fertilisation in
temperate regions (Sinclair et al. 1993; van Diest 1981). The use of PRs in combination with
phosphate solubilising microorganisms and arbuscular mycorrhizal (AM) fungi has been
introduced as a low-cost and low-energy mechanism to promote the agronomic effectiveness
of PRs fertilisers (Gyaneshwar et al. 2002; Richardson 2001).
AM fungi are dominant fungi in grasslands and agricultural soils. The mycorrhizal symbiosis
can facilitate plant uptake of nutrients especially P, and to a lesser extent N, in addition to other
Chapter Five
72
soil resources such as water (Allen 1991; George et al. 1995; Mickan 2014). However, nutrient
enrichment of grassland, especially with N, can significantly affect productivity. For example,
N enrichment can affect soil biodiversity negatively (Phoenix et al. 2012; Tilman and Cowan
1989).
AM fungi have potential to locate inorganic P that is not available to plant roots (Barea et al.
2002; Cabello et al. 2005; Duponnois et al. 2005; Guissou et al. 1998). The external hyphae of
AM fungi can extend from the root surface into undepleted P zones that the plant root alone
cannot reach (Hayman 1983; Jakobsen 1986). The hyphae of some AM fungal species can
extend hundreds of times more than the length of plant root hairs (Jakobsen et al. 1992).
However, fertilisation can significantly affect the abundance, composition and the diversity of
AM fungi. The response of the AM fungal community towards fertilisers may vary depending
on the types, rate and the duration of fertilisation (Rubio et al. 2003). Fertilisation eliminates
the limitation of belowground compared to aboveground resources and will consequently
increase the allocation of resources aboveground and reduce root biomass and resources
provided to AM fungi (Johnson 2010; Johnson et al. 2013).
Previous studies have explained the effect of fertilisation on communities of AM fungi in
different plant species (Gosling et al. 2013; Santos et al. 2006). These findings support the
conclusion that the availability of soil P clarified the variation in AM fungi richness in roots of
different plants, and this supports the idea with regards to soil characteristics, that plant-
available P is the most important factor altering AM fungi communities (De Beenhouwer et al.
2015; Geel et al. 2015; Verbruggen et al. 2012). For instance, Jensen and Jakobsen (1980)
demonstrated that long-term P application boosted plant-available P and subsequently
decreased AM fungal abundance. Moreover, application of inorganic N and P for 8 years
negatively affected the abundance of some AM fungal species while it increased others
(Johnson 1993). In contrast, Kahiluoto et al. (2000) found no changes in AM fungi community
composition following application of P fertilisers although spore density and root colonisation
were decreased significantly in crop and pasture plants. However, the majority of fertiliser
effects studied have relied on microscopic examination to quantify AM fungi in roots which
does not allow full insight into AM fungi diversity (Sanders 2004). More recently, molecular
approaches to identification of AM fungi have been used (Jumpponen et al. 2005; Lin et al.
2012a; Liu et al. 2012; Porras-Alfaro et al. 2007). Nevertheless, a lack of resolution also
remains a problem in these studies (Chen et al. 2014; del Mar Alguacil et al. 2010).
Chapter Five
73
Differences among species to exploit limiting nutrients can influence the coexistence of
different species (Tilman 1981). As some plant species have special adaptation toward N or P
availability, the limitation in one of them can affect species richness by affecting the
productivity of these species (Venterink et al. 2003). Hence, it is important to maintain the
diversity of pasture species through use of appropriate nutrient combinations of N, P, K, Ca
and other nutrients (Pianka 2011).
The responses of AM fungi may vary based on the rate at which fertilisers release nutrents into
soil. Thus, slow-release fertilisers may have less negative effect on AM fungi community
structure and abundance compared to more conventional soluble fertilisers that more readily
provide nutrients to plants. However, the effect of different types of fertilisers, especially
mineral-based fertilisers, on AM fungal communities in soil and in roots of pasture plants
remains unclear. Therefore, a glasshouse experiment was conducted to evaluate the effect of
fertilisers of different elemental solubility on the community structure and abundance of AM
fungi in association with two pasture plants: subterranean clover and annual ryegrass.
The specific hypothesis for this study using soil P sources that differed in solubility were:
(i) plant growth will be greater with a conventional chemical fertiliser than with commercial
mineral-based fertiliser applied at equivalent P, (ii) the conventional chemical fertiliser will
decrease AM fungal colonisation of rots (%) and root colonisation (m/pot) in the early stage of
pasture growth but the commercial mineral-based fertiliser will not affect AM fungal
colonisation, and (iii) the two fertilisers differing in P solubility will have different effects on
the relative abundance of families of AM fungi and the abundance and richness of AM fungi
will be higher, and differ in community composition, for the mineral-based fertilisers (Rubio
et al. 2003; Van Geel et al. 2016).
5.3 Material and methods
Soil sampling
A glasshouse experiment was conducted to evaluate the effects of mineral and chemical
fertilisers (varying in P solubility) on AM fungal communities and nutrient uptake in
subterranean clover and annual ryegrass. The soil used was collected from a pasture at the
UWA Farm Ridgefield, Pingelly, WA (S 32° 30’ 23”, E 116° 59’ 31”, 116°59'48.50"E) in May
2015 at a depth of 0-10 cm. A grid 25×25 m was used to select the area where the soil was
collected using a zig-zag pattern. Bulk soil was collected in addition to 10 samples for assessing
bulk density. The soil was passed through a 2mm sieve to remove large rock and plant residue
Chapter Five
74
particles. The initial characteristics of the soil used in this experiment were: 13.6% clay, 12%
silt, 76% sand, pH 5.45 in H2O, pH 4.93 in CaCl2, and electrical conductivity (EC) 163 µS/cm.
The available nutrients were: Colwell P 65.8 mg/kg soil, NO3- 1.8 mg kg-1 soil and NH4
+ 19.52
mg/kg soil. Bulk density was 1.24 g cm3.
Experimental design
Sieved field soil (2mm) from the pasture was potted for use in a glasshouse experiment. Four
fertiliser treatments were applied: (i) no fertiliser, (ii) mineral-based fertiliser (MnF) at a P rate
of 75kg ha-1 (~5.6 P kg ha-1), (iii) chemical fertiliser (CF) at equivalent rate of P 43 kg ha1 (~5.6
P kg ha-1), and (iv) a microbial inoculant (Mic). There were two harvests of all treatments and
four replicates of each treatment.
The components of mineral-based and chemical fertilisers used in this experiment are shown
in Table 1. The mineral-based fertiliser consisted of a proprietary combination of various fine
mineral ores. These ores include micas, alkali feldspars, soft rock phosphate, iron man gypsum
(by-product from mineral sand processing, containing gypsum, iron and manganese), dolomite,
basalt, granite and crystalline silica, and are blended with sulphate of ammonia and sulphate of
potash, manganese sulphate, copper sulphate and zinc sulphate (Storer and Devlin 2012). The
chemical fertiliser used was Gusto Gold from Summit Fertilizers Australia. The multiple
species microbial inoculant is a talc-based formulation containing (per g) isolates of
Agrobacterium (1 x 10⁹), Azotobacter (1.2 x 10⁹), Azospirillum (1.1 x 10⁹), Bacillus (112 x
109), Pseudomonas (2.3 x 10⁹), Streptomyces (1 x 10⁹), Trichoderma (8 x 10⁹) and Rhizophagus
irregularies (75 spores). The microbial inoculant was provided by Australian Mineral Fertiliser
Pty Ltd as a powder form and applied at the rate of 1g pot-1. The treatments were added to the
soil surface one-day prior sowing and mixed with the soil except the microbial inoculant was
a powder, and the seeds were mixed with the powder before sowing. The water solubility of P
in the chemical fertiliser was 821 mg kg-1 P and it was 657 mg kg-1 P in the mineral-based
fertiliser. The components of conventional chemical and mineral-based fertilisers as in
Table 5-1.
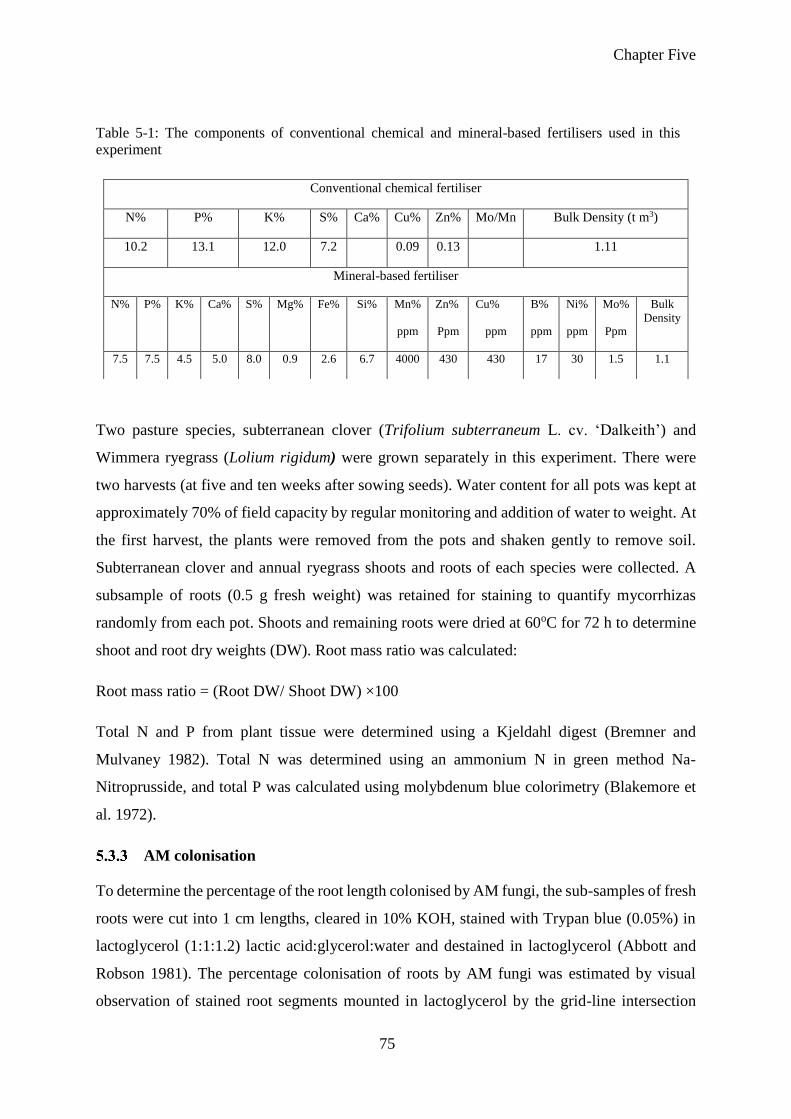
Chapter Five
75
Table 5-1: The components of conventional chemical and mineral-based fertilisers used in this
experiment
Two pasture species, subterranean clover (Trifolium subterraneum L. cv. ‘Dalkeith’) and
Wimmera ryegrass (Lolium rigidum) were grown separately in this experiment. There were
two harvests (at five and ten weeks after sowing seeds). Water content for all pots was kept at
approximately 70% of field capacity by regular monitoring and addition of water to weight. At
the first harvest, the plants were removed from the pots and shaken gently to remove soil.
Subterranean clover and annual ryegrass shoots and roots of each species were collected. A
subsample of roots (0.5 g fresh weight) was retained for staining to quantify mycorrhizas
randomly from each pot. Shoots and remaining roots were dried at 60oC for 72 h to determine
shoot and root dry weights (DW). Root mass ratio was calculated:
Root mass ratio = (Root DW/ Shoot DW) ×100
Total N and P from plant tissue were determined using a Kjeldahl digest (Bremner and
Mulvaney 1982). Total N was determined using an ammonium N in green method Na-
Nitroprusside, and total P was calculated using molybdenum blue colorimetry (Blakemore et
al. 1972).
AM colonisation
To determine the percentage of the root length colonised by AM fungi, the sub-samples of fresh
roots were cut into 1 cm lengths, cleared in 10% KOH, stained with Trypan blue (0.05%) in
lactoglycerol (1:1:1.2) lactic acid:glycerol:water and destained in lactoglycerol (Abbott and
Robson 1981). The percentage colonisation of roots by AM fungi was estimated by visual
observation of stained root segments mounted in lactoglycerol by the grid-line intersection
Conventional chemical fertiliser
N% P% K% S% Ca% Cu% Zn% Mo/Mn Bulk Density (t m3)
10.2 13.1 12.0 7.2 0.09 0.13 1.11
Mineral-based fertiliser
N% P% K% Ca% S% Mg% Fe% Si% Mn%
ppm
Zn%
Ppm
Cu%
ppm
B%
ppm
Ni%
ppm
Mo%
Ppm
Bulk
Density
7.5 7.5 4.5 5.0 8.0 0.9 2.6 6.7 4000 430 430 17 30 1.5 1.1
Chapter Five
76
counting method which is also used for assessing total root length (Giovannetti and Mosse
1980). The length of root colonised was assessed simultaneously (Giovannetti and Mosse 1980)
after estimating root length (Newman 1966).
Available N, extracted P, soil acidity and soil salinity
At each harvest, soil mineral N (NO3−) and exchangeable N (NH4
+) were measured by
extracting 20 g with 80 mL 0.5 M K2SO4 and analysing the extracts colorimetrically for
exchangeable NH4+ using the salicylate–nitroprusside method (Searle 1984) and NO3
−
concentration using the hydrazine reduction method (Kempers and Luft 1988) on an automated
flow injection Skalar AutoAnalyser (San plus, Skalar Analytical, The Netherlands).
Extractable Colwell P was determined for air-dried soils in 0.5 M sodium bicarbonate solution
at pH 8.5 using the colorimetric methods of Rayment and Higginson (1992).
Air dried soils were used to determine soil pH and EC. To determine pH and EC in water
suspension, 5 g of air-dried soil was suspended in 25 mL deionised water (1:5) and shaken for
one hour. For pH in CaCl2, 5 g of air-dried soil was suspended in 0.01 M of CaCl2 (Rayment
and Higginson 1992).
DNA extraction and sequencing
At the second harvest (ten weeks), soil was carefully removed from the roots (Mickan et al.
2017) and roots were washed with sterile milliQ water then transferred to a -20°C freezer.
DNeasy PowerLyzer PowerSoil Kit which is formerly sold by MO BIO as PowerLyzer
PowerSoil DNA Kit was used to extract and purify the AM fungal DNA. Paired-ends
sequencing on the Illumina MiSeq was performed using the primer set of 27F-519R (Lane,
1991; Lane et al. 1985). The sequencing details as in Table 5-2.
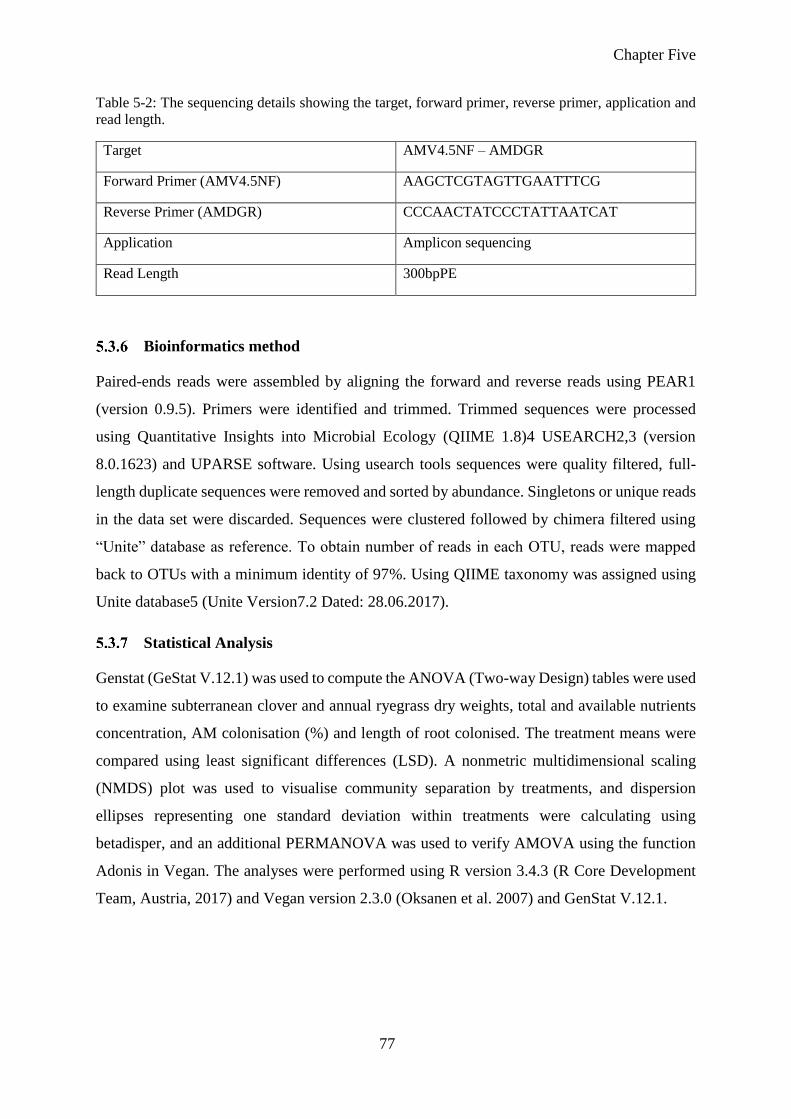
Chapter Five
77
Table 5-2: The sequencing details showing the target, forward primer, reverse primer, application and
read length.
Target AMV4.5NF – AMDGR
Forward Primer (AMV4.5NF) AAGCTCGTAGTTGAATTTCG
Reverse Primer (AMDGR) CCCAACTATCCCTATTAATCAT
Application Amplicon sequencing
Read Length 300bpPE
Bioinformatics method
Paired-ends reads were assembled by aligning the forward and reverse reads using PEAR1
(version 0.9.5). Primers were identified and trimmed. Trimmed sequences were processed
using Quantitative Insights into Microbial Ecology (QIIME 1.8)4 USEARCH2,3 (version
8.0.1623) and UPARSE software. Using usearch tools sequences were quality filtered, full-
length duplicate sequences were removed and sorted by abundance. Singletons or unique reads
in the data set were discarded. Sequences were clustered followed by chimera filtered using
“Unite” database as reference. To obtain number of reads in each OTU, reads were mapped
back to OTUs with a minimum identity of 97%. Using QIIME taxonomy was assigned using
Unite database5 (Unite Version7.2 Dated: 28.06.2017).
Statistical Analysis
Genstat (GeStat V.12.1) was used to compute the ANOVA (Two-way Design) tables were used
to examine subterranean clover and annual ryegrass dry weights, total and available nutrients
concentration, AM colonisation (%) and length of root colonised. The treatment means were
compared using least significant differences (LSD). A nonmetric multidimensional scaling
(NMDS) plot was used to visualise community separation by treatments, and dispersion
ellipses representing one standard deviation within treatments were calculating using
betadisper, and an additional PERMANOVA was used to verify AMOVA using the function
Adonis in Vegan. The analyses were performed using R version 3.4.3 (R Core Development
Team, Austria, 2017) and Vegan version 2.3.0 (Oksanen et al. 2007) and GenStat V.12.1.
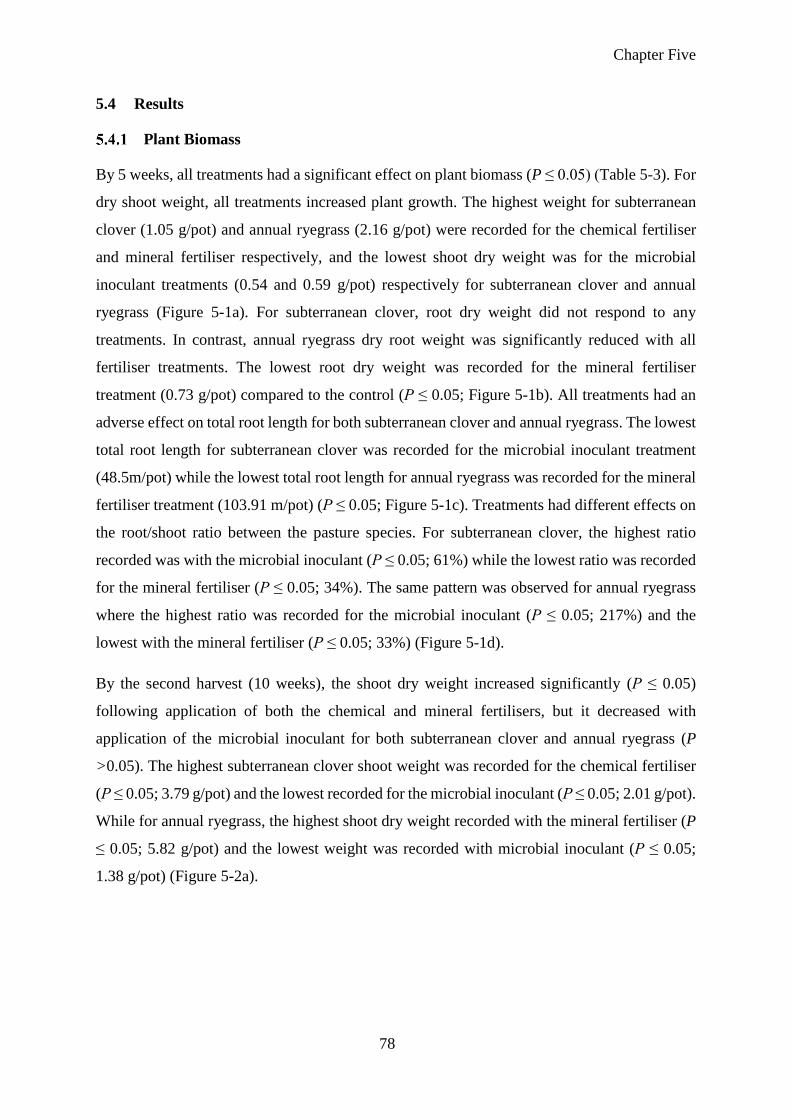
Chapter Five
78
5.4 Results
Plant Biomass
By 5 weeks, all treatments had a significant effect on plant biomass (P ≤ 0.05) (Table 5-3). For
dry shoot weight, all treatments increased plant growth. The highest weight for subterranean
clover (1.05 g/pot) and annual ryegrass (2.16 g/pot) were recorded for the chemical fertiliser
and mineral fertiliser respectively, and the lowest shoot dry weight was for the microbial
inoculant treatments (0.54 and 0.59 g/pot) respectively for subterranean clover and annual
ryegrass (Figure 5-1a). For subterranean clover, root dry weight did not respond to any
treatments. In contrast, annual ryegrass dry root weight was significantly reduced with all
fertiliser treatments. The lowest root dry weight was recorded for the mineral fertiliser
treatment (0.73 g/pot) compared to the control (P ≤ 0.05; Figure 5-1b). All treatments had an
adverse effect on total root length for both subterranean clover and annual ryegrass. The lowest
total root length for subterranean clover was recorded for the microbial inoculant treatment
(48.5m/pot) while the lowest total root length for annual ryegrass was recorded for the mineral
fertiliser treatment (103.91 m/pot) (P ≤ 0.05; Figure 5-1c). Treatments had different effects on
the root/shoot ratio between the pasture species. For subterranean clover, the highest ratio
recorded was with the microbial inoculant (P ≤ 0.05; 61%) while the lowest ratio was recorded
for the mineral fertiliser (P ≤ 0.05; 34%). The same pattern was observed for annual ryegrass
where the highest ratio was recorded for the microbial inoculant (P ≤ 0.05; 217%) and the
lowest with the mineral fertiliser (P ≤ 0.05; 33%) (Figure 5-1d).
By the second harvest (10 weeks), the shoot dry weight increased significantly (P ≤ 0.05)
following application of both the chemical and mineral fertilisers, but it decreased with
application of the microbial inoculant for both subterranean clover and annual ryegrass (P
>0.05). The highest subterranean clover shoot weight was recorded for the chemical fertiliser
(P ≤ 0.05; 3.79 g/pot) and the lowest recorded for the microbial inoculant (P ≤ 0.05; 2.01 g/pot).
While for annual ryegrass, the highest shoot dry weight recorded with the mineral fertiliser (P
≤ 0.05; 5.82 g/pot) and the lowest weight was recorded with microbial inoculant (P ≤ 0.05;
1.38 g/pot) (Figure 5-2a).
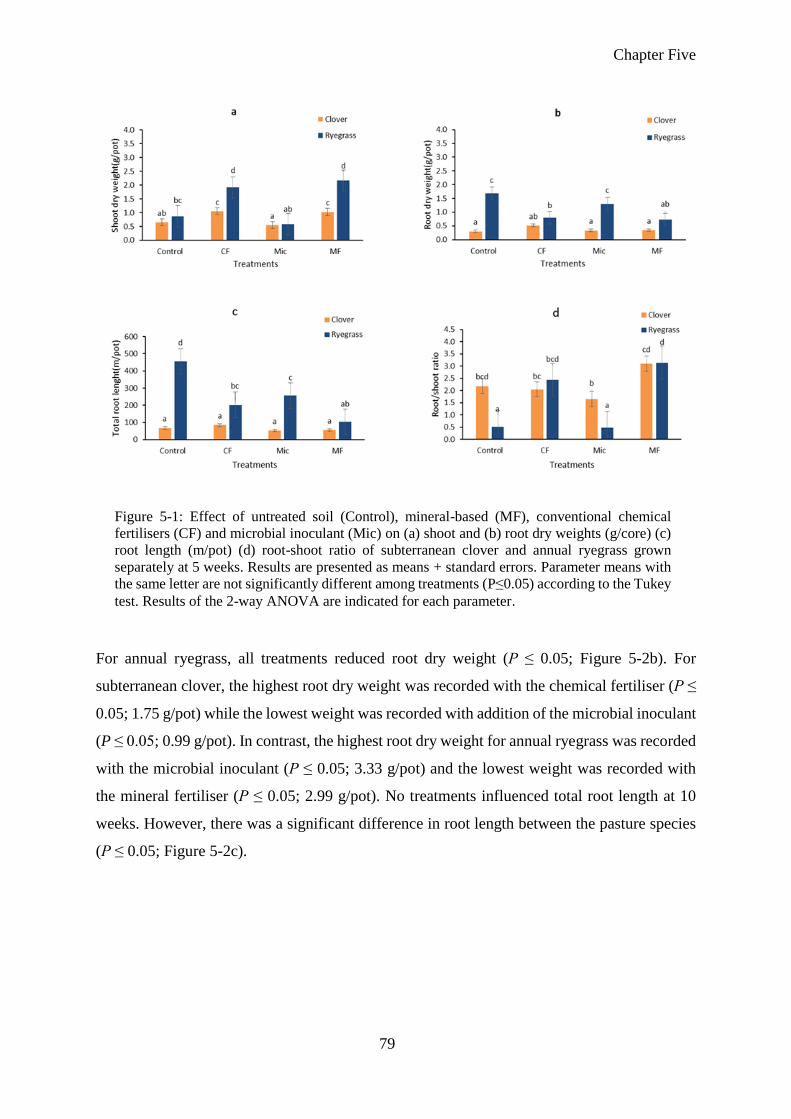
Chapter Five
79
For annual ryegrass, all treatments reduced root dry weight (P ≤ 0.05; Figure 5-2b). For
subterranean clover, the highest root dry weight was recorded with the chemical fertiliser (P ≤
0.05; 1.75 g/pot) while the lowest weight was recorded with addition of the microbial inoculant
(P ≤ 0.05; 0.99 g/pot). In contrast, the highest root dry weight for annual ryegrass was recorded
with the microbial inoculant (P ≤ 0.05; 3.33 g/pot) and the lowest weight was recorded with
the mineral fertiliser (P ≤ 0.05; 2.99 g/pot). No treatments influenced total root length at 10
weeks. However, there was a significant difference in root length between the pasture species
(P ≤ 0.05; Figure 5-2c).
Figure 5-1: Effect of untreated soil (Control), mineral-based (MF), conventional chemical
fertilisers (CF) and microbial inoculant (Mic) on (a) shoot and (b) root dry weights (g/core) (c)
root length (m/pot) (d) root-shoot ratio of subterranean clover and annual ryegrass grown
separately at 5 weeks. Results are presented as means + standard errors. Parameter means with
the same letter are not significantly different among treatments (P≤0.05) according to the Tukey
test. Results of the 2-way ANOVA are indicated for each parameter.
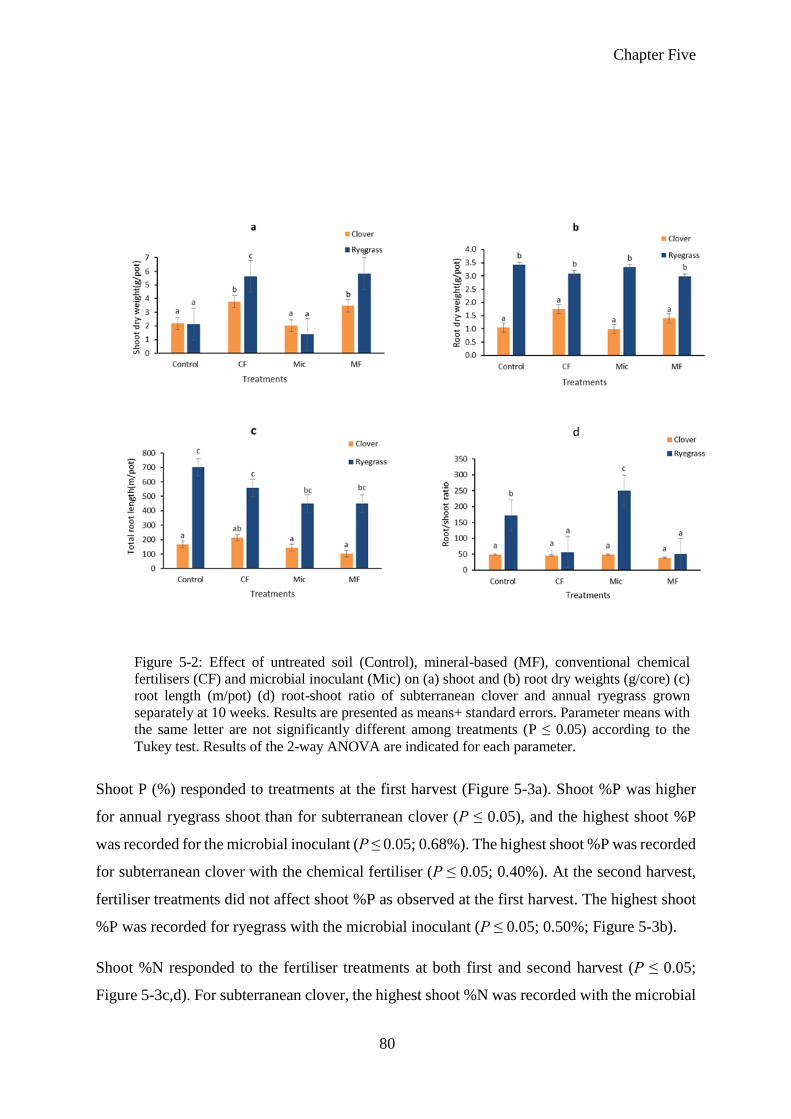
Chapter Five
80
Shoot P (%) responded to treatments at the first harvest (Figure 5-3a). Shoot %P was higher
for annual ryegrass shoot than for subterranean clover (P ≤ 0.05), and the highest shoot %P
was recorded for the microbial inoculant (P ≤ 0.05; 0.68%). The highest shoot %P was recorded
for subterranean clover with the chemical fertiliser (P ≤ 0.05; 0.40%). At the second harvest,
fertiliser treatments did not affect shoot %P as observed at the first harvest. The highest shoot
%P was recorded for ryegrass with the microbial inoculant (P ≤ 0.05; 0.50%; Figure 5-3b).
Shoot %N responded to the fertiliser treatments at both first and second harvest (P ≤ 0.05;
Figure 5-3c,d). For subterranean clover, the highest shoot %N was recorded with the microbial
Figure 5-2: Effect of untreated soil (Control), mineral-based (MF), conventional chemical
fertilisers (CF) and microbial inoculant (Mic) on (a) shoot and (b) root dry weights (g/core) (c)
root length (m/pot) (d) root-shoot ratio of subterranean clover and annual ryegrass grown
separately at 10 weeks. Results are presented as means+ standard errors. Parameter means with
the same letter are not significantly different among treatments (P ≤ 0.05) according to the
Tukey test. Results of the 2-way ANOVA are indicated for each parameter.
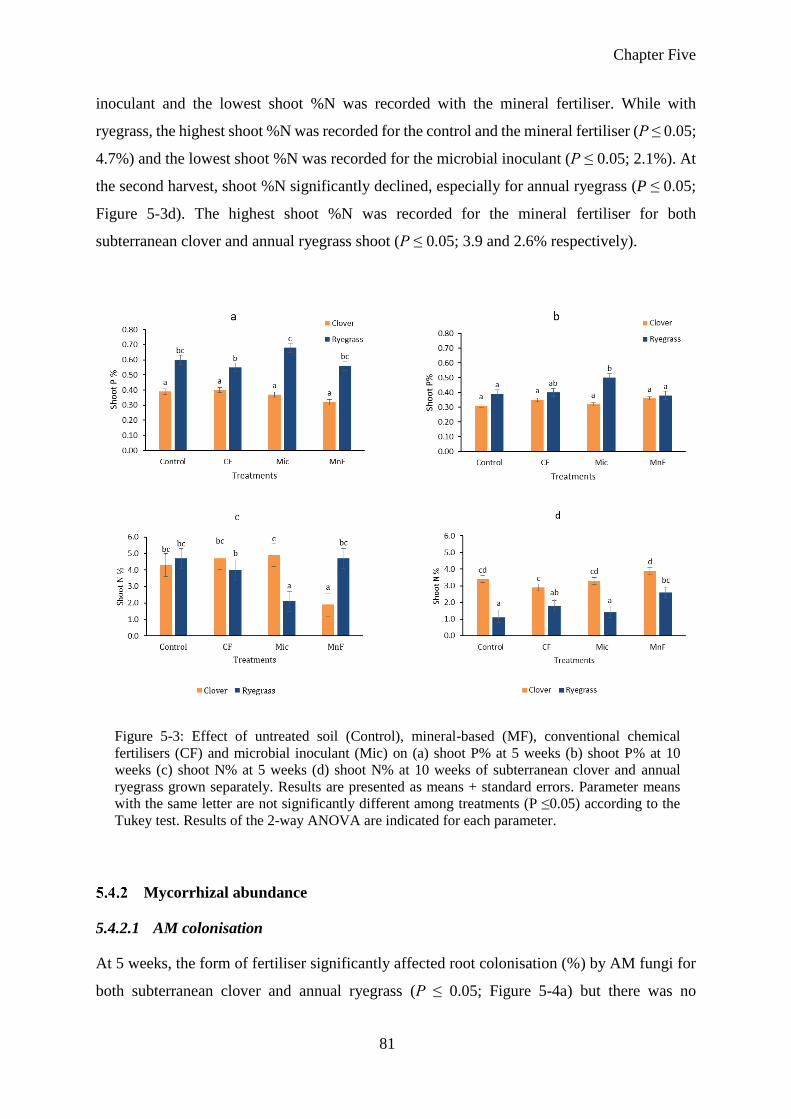
Chapter Five
81
inoculant and the lowest shoot %N was recorded with the mineral fertiliser. While with
ryegrass, the highest shoot %N was recorded for the control and the mineral fertiliser (P ≤ 0.05;
4.7%) and the lowest shoot %N was recorded for the microbial inoculant (P ≤ 0.05; 2.1%). At
the second harvest, shoot %N significantly declined, especially for annual ryegrass (P ≤ 0.05;
Figure 5-3d). The highest shoot %N was recorded for the mineral fertiliser for both
subterranean clover and annual ryegrass shoot (P ≤ 0.05; 3.9 and 2.6% respectively).
Mycorrhizal abundance
5.4.2.1 AM colonisation
At 5 weeks, the form of fertiliser significantly affected root colonisation (%) by AM fungi for
both subterranean clover and annual ryegrass (P ≤ 0.05; Figure 5-4a) but there was no
Figure 5-3: Effect of untreated soil (Control), mineral-based (MF), conventional chemical
fertilisers (CF) and microbial inoculant (Mic) on (a) shoot P% at 5 weeks (b) shoot P% at 10
weeks (c) shoot N% at 5 weeks (d) shoot N% at 10 weeks of subterranean clover and annual
ryegrass grown separately. Results are presented as means + standard errors. Parameter means
with the same letter are not significantly different among treatments (P ≤0.05) according to the
Tukey test. Results of the 2-way ANOVA are indicated for each parameter.
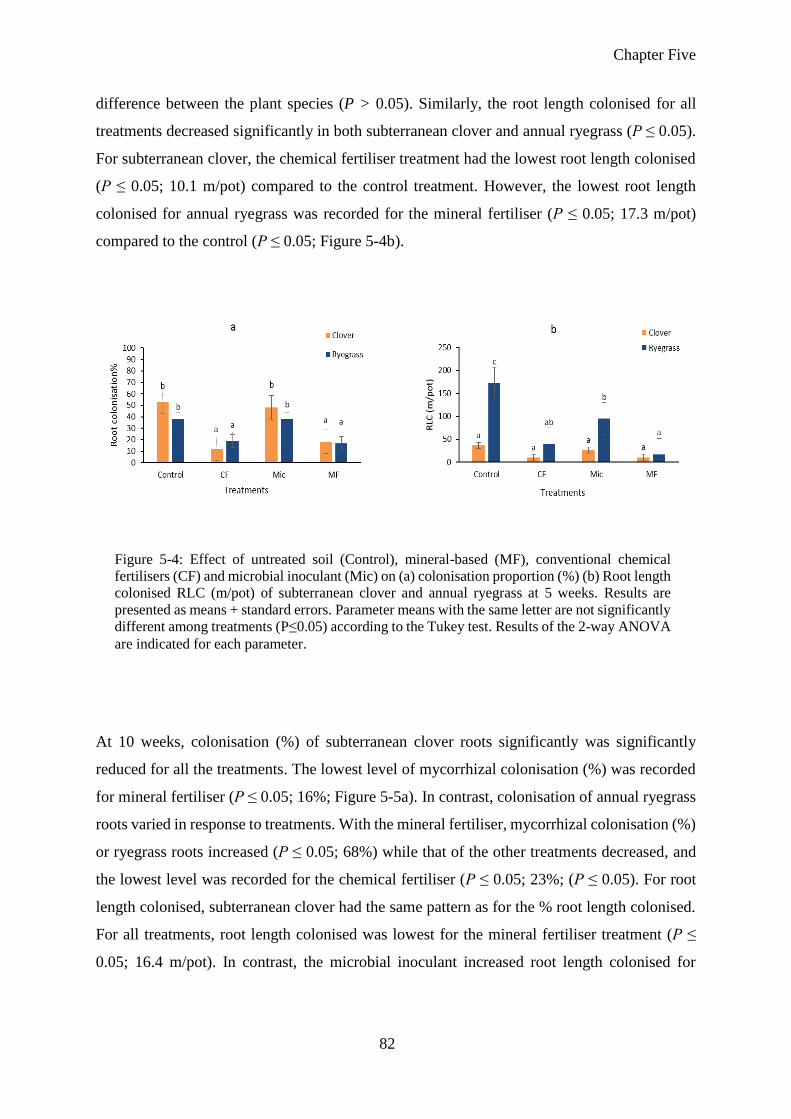
Chapter Five
82
difference between the plant species (P > 0.05). Similarly, the root length colonised for all
treatments decreased significantly in both subterranean clover and annual ryegrass (P ≤ 0.05).
For subterranean clover, the chemical fertiliser treatment had the lowest root length colonised
(P ≤ 0.05; 10.1 m/pot) compared to the control treatment. However, the lowest root length
colonised for annual ryegrass was recorded for the mineral fertiliser (P ≤ 0.05; 17.3 m/pot)
compared to the control (P ≤ 0.05; Figure 5-4b).
At 10 weeks, colonisation (%) of subterranean clover roots significantly was significantly
reduced for all the treatments. The lowest level of mycorrhizal colonisation (%) was recorded
for mineral fertiliser (P ≤ 0.05; 16%; Figure 5-5a). In contrast, colonisation of annual ryegrass
roots varied in response to treatments. With the mineral fertiliser, mycorrhizal colonisation (%)
or ryegrass roots increased (P ≤ 0.05; 68%) while that of the other treatments decreased, and
the lowest level was recorded for the chemical fertiliser (P ≤ 0.05; 23%; (P ≤ 0.05). For root
length colonised, subterranean clover had the same pattern as for the % root length colonised.
For all treatments, root length colonised was lowest for the mineral fertiliser treatment (P ≤
0.05; 16.4 m/pot). In contrast, the microbial inoculant increased root length colonised for
Figure 5-4: Effect of untreated soil (Control), mineral-based (MF), conventional chemical
fertilisers (CF) and microbial inoculant (Mic) on (a) colonisation proportion (%) (b) Root length
colonised RLC (m/pot) of subterranean clover and annual ryegrass at 5 weeks. Results are
presented as means + standard errors. Parameter means with the same letter are not significantly
different among treatments (P≤0.05) according to the Tukey test. Results of the 2-way ANOVA
are indicated for each parameter.

Chapter Five
83
annual ryegrass (P ≤ 0.05; 284 m/pot) whereas both fertilisers reduced root length colonised
(P ≤ 0.05; 128 and 137 m/pot for the mineral and chemical fertilisers respectively (Figure 5-5b).
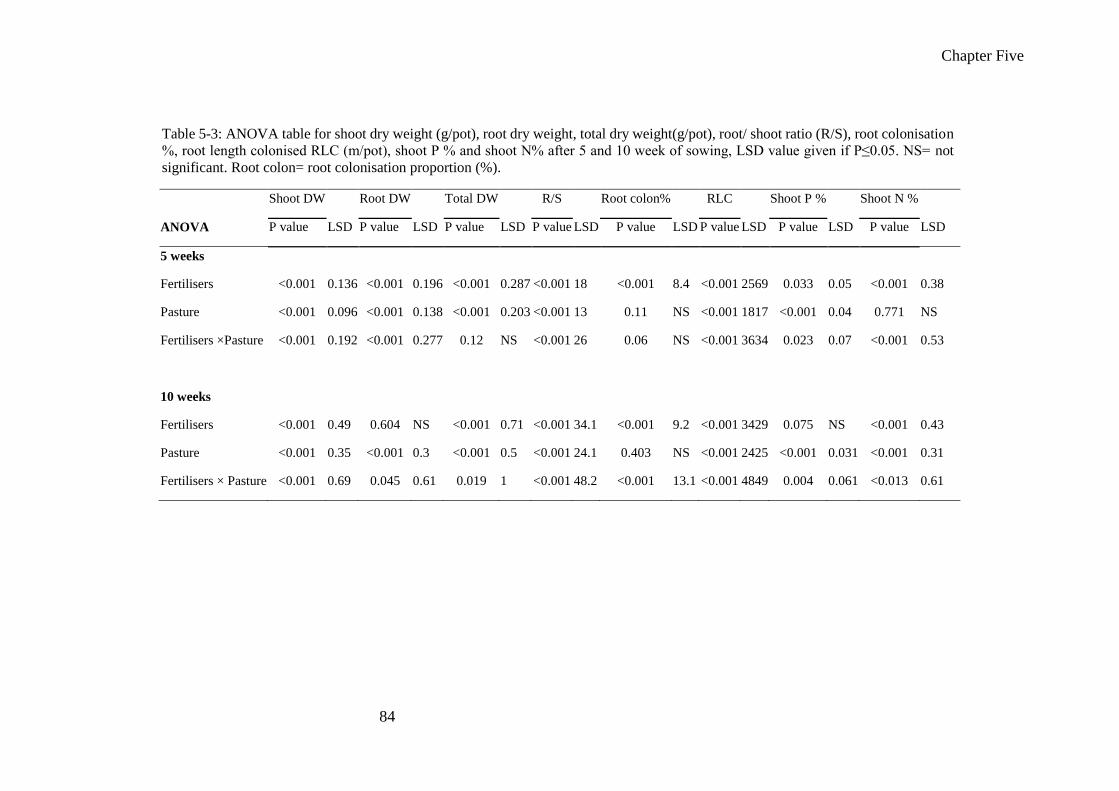
Chapter Five
84
Table 5-3: ANOVA table for shoot dry weight (g/pot), root dry weight, total dry weight(g/pot), root/ shoot ratio (R/S), root colonisation
%, root length colonised RLC (m/pot), shoot P % and shoot N% after 5 and 10 week of sowing, LSD value given if P≤0.05. NS= not
significant. Root colon= root colonisation proportion (%).
Shoot DW Root DW Total DW R/S Root colon% RLC Shoot P %
Shoot N %
ANOVA P value LSD P value LSD P value LSD P value LSD P value LSD P value LSD P value LSD P value LSD
5 weeks
Fertilisers <0.001 0.136 <0.001 0.196 <0.001 0.287 <0.001 18 <0.001 8.4 <0.001 2569 0.033 0.05 <0.001 0.38
Pasture <0.001 0.096 <0.001 0.138 <0.001 0.203 <0.001 13 0.11 NS <0.001 1817 <0.001 0.04 0.771 NS
Fertilisers ×Pasture <0.001 0.192 <0.001 0.277 0.12 NS <0.001 26 0.06 NS <0.001 3634 0.023 0.07 <0.001 0.53
10 weeks
Fertilisers <0.001 0.49 0.604 NS <0.001 0.71 <0.001 34.1 <0.001 9.2 <0.001 3429 0.075 NS <0.001 0.43
Pasture <0.001 0.35 <0.001 0.3 <0.001 0.5 <0.001 24.1 0.403 NS <0.001 2425 <0.001 0.031 <0.001 0.31
Fertilisers × Pasture <0.001 0.69 0.045 0.61 0.019 1 <0.001 48.2 <0.001 13.1 <0.001 4849 0.004 0.061 <0.013 0.61
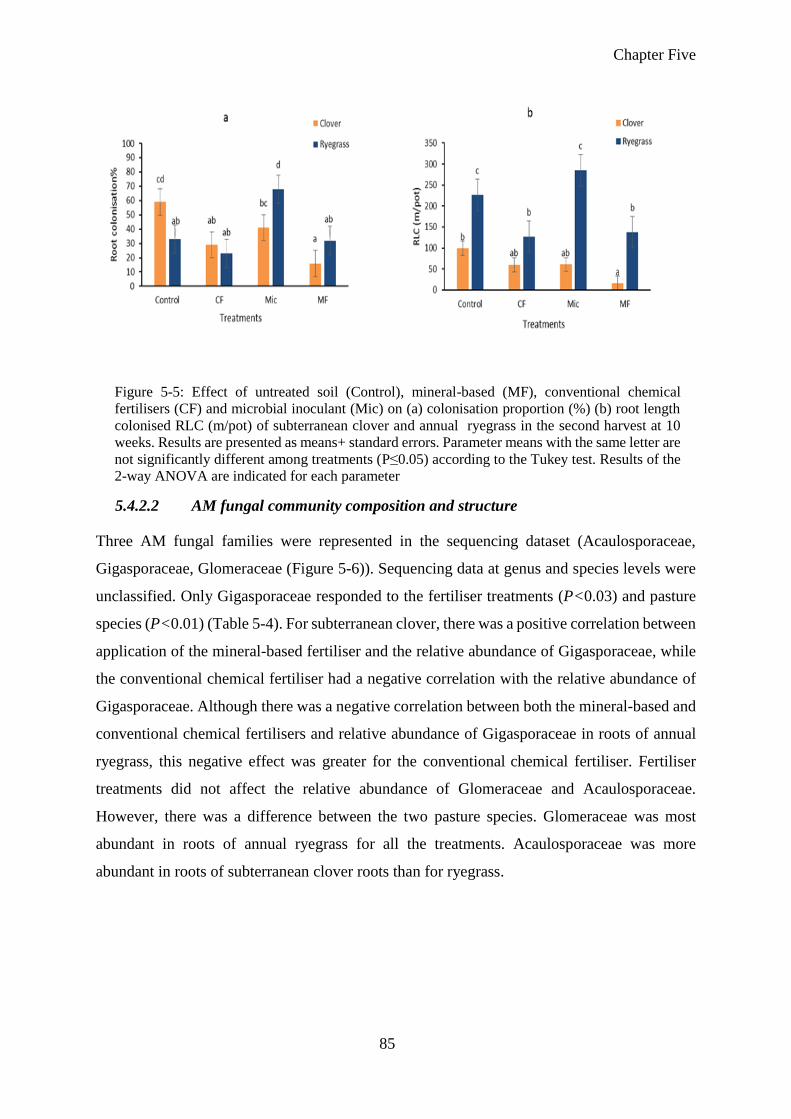
Chapter Five
85
5.4.2.2 AM fungal community composition and structure
Three AM fungal families were represented in the sequencing dataset (Acaulosporaceae,
Gigasporaceae, Glomeraceae (Figure 5-6)). Sequencing data at genus and species levels were
unclassified. Only Gigasporaceae responded to the fertiliser treatments (P<0.03) and pasture
species (P<0.01) (Table 5-4). For subterranean clover, there was a positive correlation between
application of the mineral-based fertiliser and the relative abundance of Gigasporaceae, while
the conventional chemical fertiliser had a negative correlation with the relative abundance of
Gigasporaceae. Although there was a negative correlation between both the mineral-based and
conventional chemical fertilisers and relative abundance of Gigasporaceae in roots of annual
ryegrass, this negative effect was greater for the conventional chemical fertiliser. Fertiliser
treatments did not affect the relative abundance of Glomeraceae and Acaulosporaceae.
However, there was a difference between the two pasture species. Glomeraceae was most
abundant in roots of annual ryegrass for all the treatments. Acaulosporaceae was more
abundant in roots of subterranean clover roots than for ryegrass.
Figure 5-5: Effect of untreated soil (Control), mineral-based (MF), conventional chemical
fertilisers (CF) and microbial inoculant (Mic) on (a) colonisation proportion (%) (b) root length
colonised RLC (m/pot) of subterranean clover and annual ryegrass in the second harvest at 10
weeks. Results are presented as means+ standard errors. Parameter means with the same letter are
not significantly different among treatments (P≤0.05) according to the Tukey test. Results of the
2-way ANOVA are indicated for each parameter
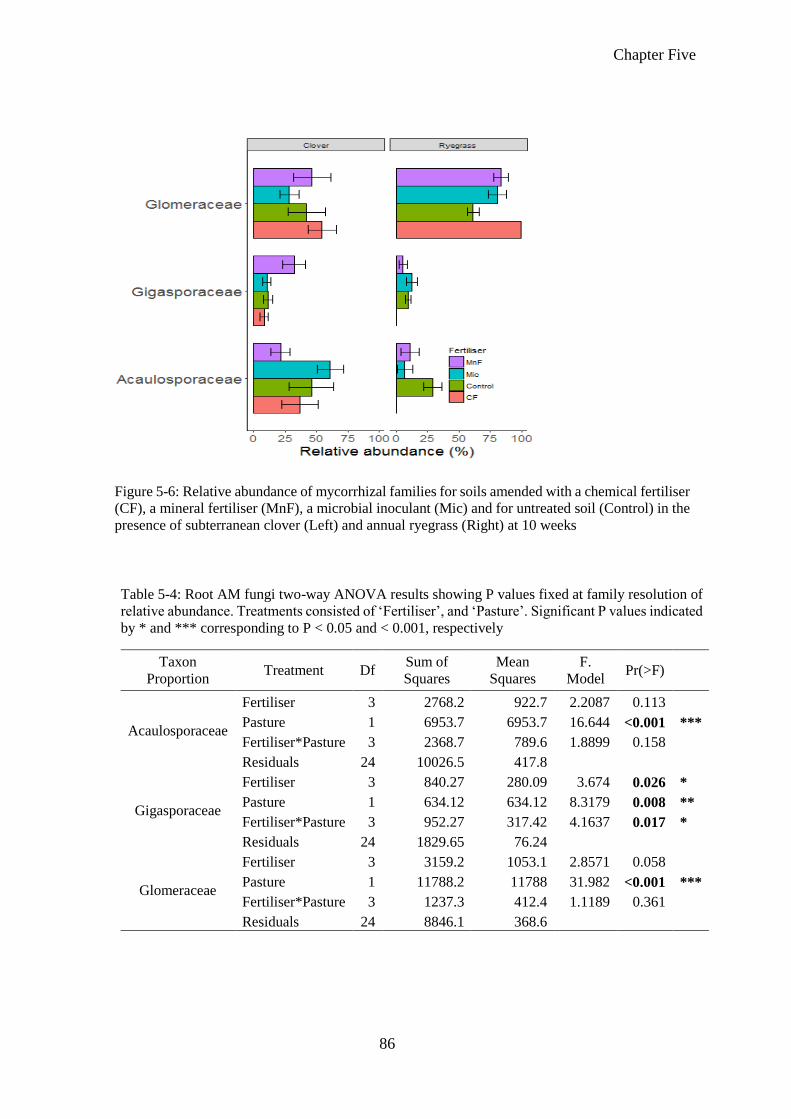
Chapter Five
86
Figure 5-6: Relative abundance of mycorrhizal families for soils amended with a chemical fertiliser
(CF), a mineral fertiliser (MnF), a microbial inoculant (Mic) and for untreated soil (Control) in the
presence of subterranean clover (Left) and annual ryegrass (Right) at 10 weeks
Table 5-4: Root AM fungi two-way ANOVA results showing P values fixed at family resolution of
relative abundance. Treatments consisted of ‘Fertiliser’, and ‘Pasture’. Significant P values indicated
by * and *** corresponding to P < 0.05 and < 0.001, respectively
Taxon
Proportion Treatment Df
Sum of
Squares
Mean
Squares
F.
Model Pr(>F)
Acaulosporaceae
Fertiliser 3 2768.2 922.7 2.2087 0.113
Pasture 1 6953.7 6953.7 16.644 <0.001 ***
Fertiliser*Pasture 3 2368.7 789.6 1.8899 0.158
Residuals 24 10026.5 417.8
Gigasporaceae
Fertiliser 3 840.27 280.09 3.674 0.026 *
Pasture 1 634.12 634.12 8.3179 0.008 **
Fertiliser*Pasture 3 952.27 317.42 4.1637 0.017 *
Residuals 24 1829.65 76.24
Glomeraceae
Fertiliser 3 3159.2 1053.1 2.8571 0.058 Pasture 1 11788.2 11788 31.982 <0.001 ***
Fertiliser*Pasture 3 1237.3 412.4 1.1189 0.361
Residuals 24 8846.1 368.6
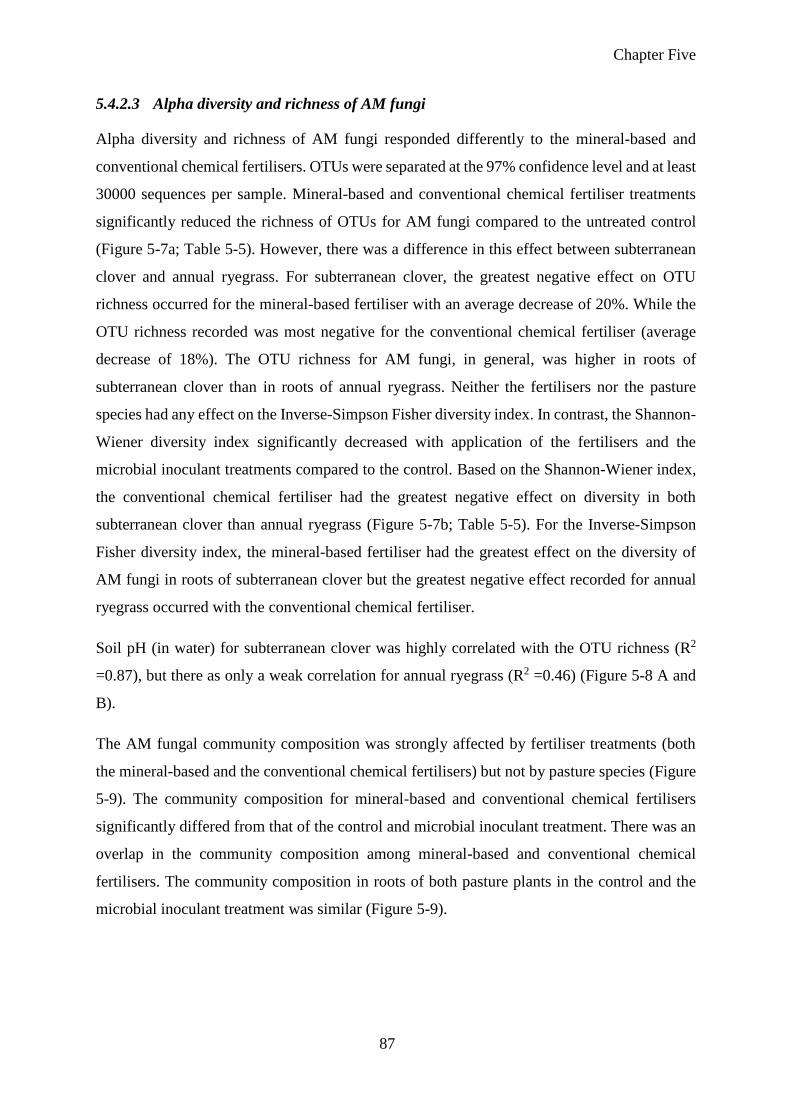
Chapter Five
87
5.4.2.3 Alpha diversity and richness of AM fungi
Alpha diversity and richness of AM fungi responded differently to the mineral-based and
conventional chemical fertilisers. OTUs were separated at the 97% confidence level and at least
30000 sequences per sample. Mineral-based and conventional chemical fertiliser treatments
significantly reduced the richness of OTUs for AM fungi compared to the untreated control
(Figure 5-7a; Table 5-5). However, there was a difference in this effect between subterranean
clover and annual ryegrass. For subterranean clover, the greatest negative effect on OTU
richness occurred for the mineral-based fertiliser with an average decrease of 20%. While the
OTU richness recorded was most negative for the conventional chemical fertiliser (average
decrease of 18%). The OTU richness for AM fungi, in general, was higher in roots of
subterranean clover than in roots of annual ryegrass. Neither the fertilisers nor the pasture
species had any effect on the Inverse-Simpson Fisher diversity index. In contrast, the Shannon-
Wiener diversity index significantly decreased with application of the fertilisers and the
microbial inoculant treatments compared to the control. Based on the Shannon-Wiener index,
the conventional chemical fertiliser had the greatest negative effect on diversity in both
subterranean clover than annual ryegrass (Figure 5-7b; Table 5-5). For the Inverse-Simpson
Fisher diversity index, the mineral-based fertiliser had the greatest effect on the diversity of
AM fungi in roots of subterranean clover but the greatest negative effect recorded for annual
ryegrass occurred with the conventional chemical fertiliser.
Soil pH (in water) for subterranean clover was highly correlated with the OTU richness (R2
=0.87), but there as only a weak correlation for annual ryegrass (R2 =0.46) (Figure 5-8 A and
B).
The AM fungal community composition was strongly affected by fertiliser treatments (both
the mineral-based and the conventional chemical fertilisers) but not by pasture species (Figure
5-9). The community composition for mineral-based and conventional chemical fertilisers
significantly differed from that of the control and microbial inoculant treatment. There was an
overlap in the community composition among mineral-based and conventional chemical
fertilisers. The community composition in roots of both pasture plants in the control and the
microbial inoculant treatment was similar (Figure 5-9).
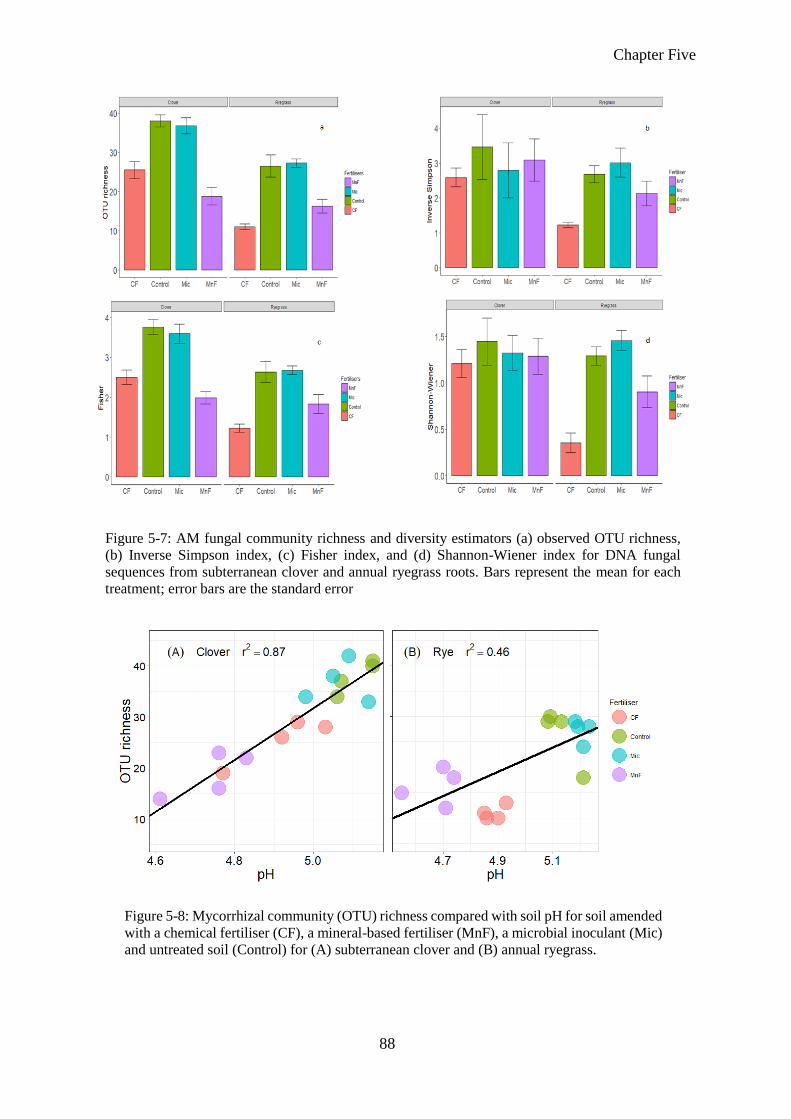
Chapter Five
88
Figure 5-7: AM fungal community richness and diversity estimators (a) observed OTU richness,
(b) Inverse Simpson index, (c) Fisher index, and (d) Shannon-Wiener index for DNA fungal
sequences from subterranean clover and annual ryegrass roots. Bars represent the mean for each
treatment; error bars are the standard error
Figure 5-8: Mycorrhizal community (OTU) richness compared with soil pH for soil amended
with a chemical fertiliser (CF), a mineral-based fertiliser (MnF), a microbial inoculant (Mic)
and untreated soil (Control) for (A) subterranean clover and (B) annual ryegrass.
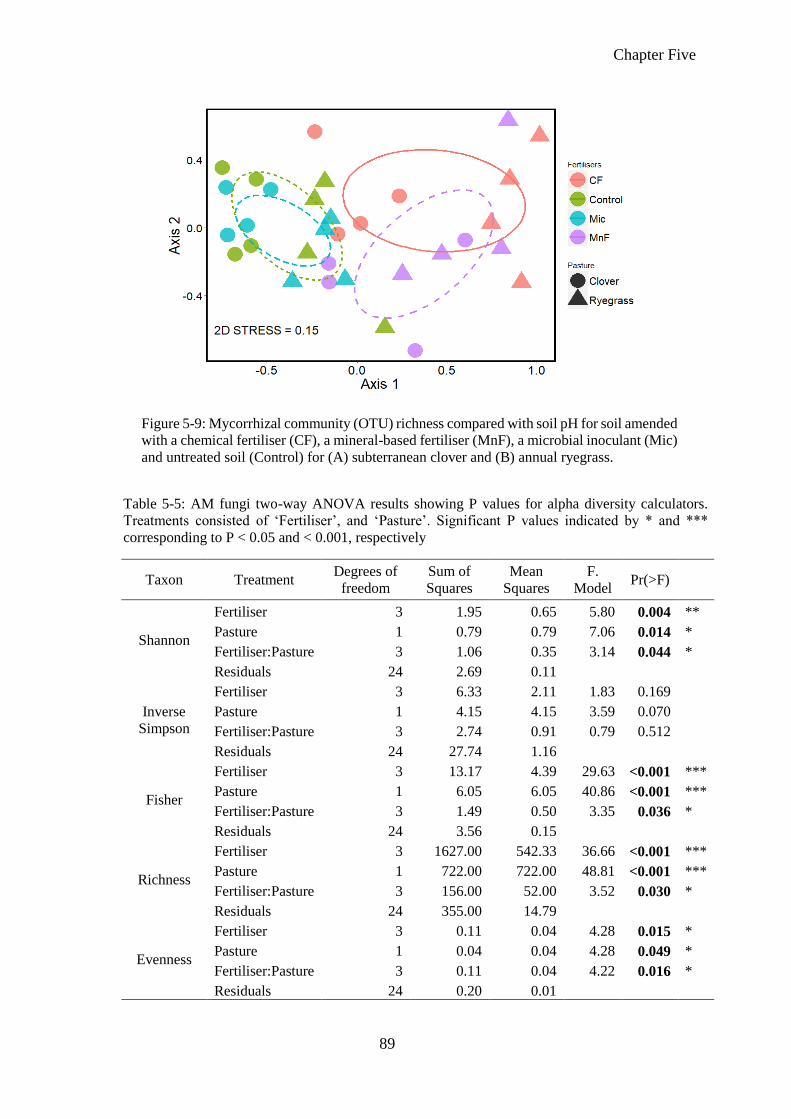
Chapter Five
89
Table 5-5: AM fungi two-way ANOVA results showing P values for alpha diversity calculators.
Treatments consisted of ‘Fertiliser’, and ‘Pasture’. Significant P values indicated by * and ***
corresponding to P < 0.05 and < 0.001, respectively
Taxon Treatment Degrees of
freedom
Sum of
Squares
Mean
Squares
F.
Model Pr(>F)
Shannon
Fertiliser 3 1.95 0.65 5.80 0.004 **
Pasture 1 0.79 0.79 7.06 0.014 *
Fertiliser:Pasture 3 1.06 0.35 3.14 0.044 *
Residuals 24 2.69 0.11
Inverse
Simpson
Fertiliser 3 6.33 2.11 1.83 0.169
Pasture 1 4.15 4.15 3.59 0.070 Fertiliser:Pasture 3 2.74 0.91 0.79 0.512
Residuals 24 27.74 1.16
Fisher
Fertiliser 3 13.17 4.39 29.63 <0.001 ***
Pasture 1 6.05 6.05 40.86 <0.001 ***
Fertiliser:Pasture 3 1.49 0.50 3.35 0.036 *
Residuals 24 3.56 0.15
Richness
Fertiliser 3 1627.00 542.33 36.66 <0.001 ***
Pasture 1 722.00 722.00 48.81 <0.001 ***
Fertiliser:Pasture 3 156.00 52.00 3.52 0.030 *
Residuals 24 355.00 14.79
Evenness
Fertiliser 3 0.11 0.04 4.28 0.015 *
Pasture 1 0.04 0.04 4.28 0.049 *
Fertiliser:Pasture 3 0.11 0.04 4.22 0.016 *
Residuals 24 0.20 0.01
Figure 5-9: Mycorrhizal community (OTU) richness compared with soil pH for soil amended
with a chemical fertiliser (CF), a mineral-based fertiliser (MnF), a microbial inoculant (Mic)
and untreated soil (Control) for (A) subterranean clover and (B) annual ryegrass.
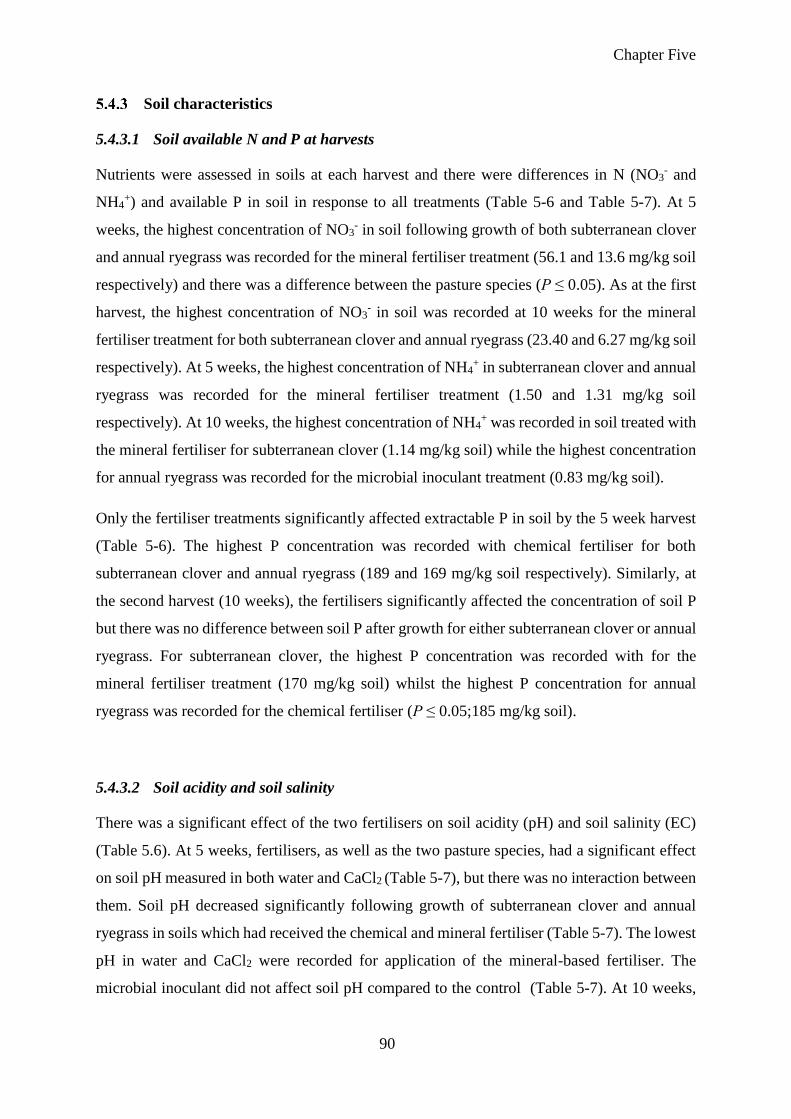
Chapter Five
90
Soil characteristics
5.4.3.1 Soil available N and P at harvests
Nutrients were assessed in soils at each harvest and there were differences in N (NO3- and
NH4+) and available P in soil in response to all treatments (Table 5-6 and Table 5-7). At 5
weeks, the highest concentration of NO3- in soil following growth of both subterranean clover
and annual ryegrass was recorded for the mineral fertiliser treatment (56.1 and 13.6 mg/kg soil
respectively) and there was a difference between the pasture species (P ≤ 0.05). As at the first
harvest, the highest concentration of NO3- in soil was recorded at 10 weeks for the mineral
fertiliser treatment for both subterranean clover and annual ryegrass (23.40 and 6.27 mg/kg soil
respectively). At 5 weeks, the highest concentration of NH4+ in subterranean clover and annual
ryegrass was recorded for the mineral fertiliser treatment (1.50 and 1.31 mg/kg soil
respectively). At 10 weeks, the highest concentration of NH4+ was recorded in soil treated with
the mineral fertiliser for subterranean clover (1.14 mg/kg soil) while the highest concentration
for annual ryegrass was recorded for the microbial inoculant treatment (0.83 mg/kg soil).
Only the fertiliser treatments significantly affected extractable P in soil by the 5 week harvest
(Table 5-6). The highest P concentration was recorded with chemical fertiliser for both
subterranean clover and annual ryegrass (189 and 169 mg/kg soil respectively). Similarly, at
the second harvest (10 weeks), the fertilisers significantly affected the concentration of soil P
but there was no difference between soil P after growth for either subterranean clover or annual
ryegrass. For subterranean clover, the highest P concentration was recorded with for the
mineral fertiliser treatment (170 mg/kg soil) whilst the highest P concentration for annual
ryegrass was recorded for the chemical fertiliser (P ≤ 0.05;185 mg/kg soil).
5.4.3.2 Soil acidity and soil salinity
There was a significant effect of the two fertilisers on soil acidity (pH) and soil salinity (EC)
(Table 5.6). At 5 weeks, fertilisers, as well as the two pasture species, had a significant effect
on soil pH measured in both water and CaCl2 (Table 5-7), but there was no interaction between
them. Soil pH decreased significantly following growth of subterranean clover and annual
ryegrass in soils which had received the chemical and mineral fertiliser (Table 5-7). The lowest
pH in water and CaCl2 were recorded for application of the mineral-based fertiliser. The
microbial inoculant did not affect soil pH compared to the control (Table 5-7). At 10 weeks,

Chapter Five
91
fertilisers had a significant effect on soil pH. However, there was no effect among pasture
species. The value of soil pH decreased significantly with CF and MnF and the lowest pH
recorded with MnF for both subterranean clover and annual ryegrass soils. Mic treatment had
no effect on the value of soil pH with subterranean clover while Mic increased the pH of annual
ryegrass soil significantly compared to the control treatment.
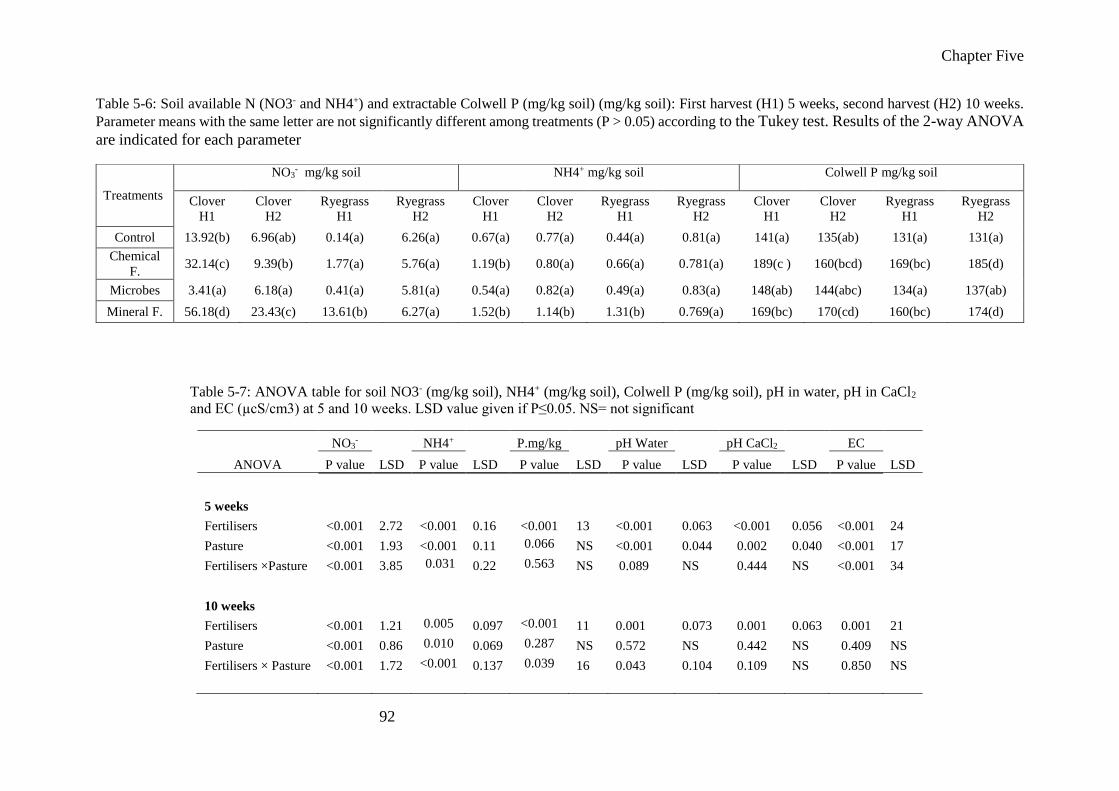
Chapter Five
92
Table 5-6: Soil available N (NO3- and NH4+) and extractable Colwell P (mg/kg soil) (mg/kg soil): First harvest (H1) 5 weeks, second harvest (H2) 10 weeks.
Parameter means with the same letter are not significantly different among treatments (P > 0.05) according to the Tukey test. Results of the 2-way ANOVA
are indicated for each parameter
Table 5-7: ANOVA table for soil NO3- (mg/kg soil), NH4+ (mg/kg soil), Colwell P (mg/kg soil), pH in water, pH in CaCl2
and EC (µcS/cm3) at 5 and 10 weeks. LSD value given if P≤0.05. NS= not significant
NO3- NH4+ P.mg/kg pH Water pH CaCl2 EC
ANOVA P value LSD P value LSD P value LSD P value LSD P value LSD P value LSD
5 weeks
Fertilisers <0.001 2.72 <0.001 0.16 <0.001 13 <0.001 0.063 <0.001 0.056 <0.001 24
Pasture <0.001 1.93 <0.001 0.11 0.066 NS <0.001 0.044 0.002 0.040 <0.001 17
Fertilisers ×Pasture <0.001 3.85 0.031 0.22 0.563 NS 0.089 NS 0.444 NS <0.001 34
10 weeks
Fertilisers <0.001 1.21 0.005 0.097 <0.001 11 0.001 0.073 0.001 0.063 0.001 21
Pasture <0.001 0.86 0.010 0.069 0.287 NS 0.572 NS 0.442 NS 0.409 NS
Fertilisers × Pasture <0.001 1.72 <0.001 0.137 0.039 16 0.043 0.104 0.109 NS 0.850 NS
Treatments
NO3- mg/kg soil NH4+ mg/kg soil Colwell P mg/kg soil
Clover
H1
Clover
H2
Ryegrass
H1
Ryegrass
H2
Clover
H1
Clover
H2
Ryegrass
H1
Ryegrass
H2
Clover
H1
Clover
H2
Ryegrass
H1
Ryegrass
H2
Control 13.92(b) 6.96(ab) 0.14(a) 6.26(a) 0.67(a) 0.77(a) 0.44(a) 0.81(a) 141(a) 135(ab) 131(a) 131(a)
Chemical
F. 32.14(c) 9.39(b) 1.77(a) 5.76(a) 1.19(b) 0.80(a) 0.66(a) 0.781(a) 189(c ) 160(bcd) 169(bc) 185(d)
Microbes 3.41(a) 6.18(a) 0.41(a) 5.81(a) 0.54(a) 0.82(a) 0.49(a) 0.83(a) 148(ab) 144(abc) 134(a) 137(ab)
Mineral F. 56.18(d) 23.43(c) 13.61(b) 6.27(a) 1.52(b) 1.14(b) 1.31(b) 0.769(a) 169(bc) 170(cd) 160(bc) 174(d)
Chapter Five
93
5.5 Discussion
During the timeframe of this study, shoot dry weight showed a significantly positive
response to both the commercial chemical and mineral-based fertiliser application at the 5
and 10 week harvests. The chemical fertiliser and mineral-based fertilisers had similar
effects on shoot dry weight of subterranean clover, whereas for annual ryegrass, shoot dry
weight was significantly higher with mineral-based fertiliser than with chemical fertiliser.
Root dry weight was significantly decreased by applying the chemical fertiliser and the
mineral-based fertiliser for annual ryegrass but not for subterranean clover. These findings
partially support the first part of the first hypothesis that plant growth would be greater with
the conventional chemical fertiliser than with the commercial mineral-based fertiliser
applied at equivalent P levels. This finding was expected as the solubility of the conventional
chemical fertiliser in water was higher than that of the mineral-based fertiliser (821 mg/kgP
and 657 mg/kg respectively). Furthermore, extractable soil P was higher with the chemical
fertiliser treatment for subterranean clover and annual ryegrass.
The response of annual ryegrass shoot growth may also be due to the ability of the root
system to uptake soil P efficiently compared to the subterranean clover root system
(Jackman and Mouat 1972). This is consistent with previous studies which found that
ryegrass has the ability to take up P more effectively than subterranean clover due to the
greater area surface area of annual ryegrass roots and the ability to decrease P concentration
on the root surface to a lower threshold concentration level (Barrow 1975). This has been
reported to be different between plant species (Barber et al. 1980). Root hairs in general
grow longer and more densely when plants are growing in P-deficient soil (Bates and Lynch
1996; Foehse and Jungk 1983; Gahoonia and Nielsen 1997; Ma et al. 2001) and corresponds
with the present study where shoot growth increased with increasing P availability whereas
root dry weight and total root length significantly decreased. Unexpected, there was no
difference between fertilisers effects on root and shoot dry weight which may be due to the
high initial soil P in this agricultural soil.
The mineral-based and conventional chemical fertilisers both significantly decreased the
proportion (%) and root length colonised (m/pot) for subterranean clover and annual
ryegrass at 5 and 10 weeks. Unexpectedly, there were no differences between the two
fertilisers on root colonisation (%) and root length colonised (m/pot). This does not support
the second hypothesis that the conventional chemical fertiliser was expected to decrease AM
Chapter Five
94
fungi root colonisation (%) and root colonisation (m/pot) in the early stage of pasture species
growth but that the commercial mineral-based fertiliser was not expected to affect AM fungi
colonisation. Although P in the conventional chemical and mineral-based fertiliser vary in
solubility, there was no difference between the concentration of soil P (mg/kg soil) with both
subterranean clover and annual ryegrass during the experiment frame time (at either
harvest). This may be due to an effect of soil pH (Pote et al. 1996). The responses were
consistent with other studies which have shown that high P concentration has a negative
effect on root colonisation level and spore abundance in pasture ecosystems (Dann et al.
1996; Mårtensson and Carlgren 1994; Ryan et al. 2000; Schweiger et al. 1995). High P
concentration may decrease exudation of carbohydrates from root and this, in turn, can
negatively affect colonisation level (Graham et al. 1981). When soil P is sufficient for plant
growth, less energy will be available for AM fungi and this may influence their growth
(Ryan et al. 2000).
Fertilisers affected the relative abundance of AM fungi in the family Gigasporaceae based
on fungal DNA sequences from pasture roots. However, there was no difference in the
relative abundance at the family level for Acaulosporaceae and Glomeraceae among fungal
DNA sequences from roots of either pasture species. Nevertheless, the relative abundance
of AM fungi overall was different for the two pasture species. This partially supports the
hypothesis that the two fertilisers with different P solubility would have different effects on
the relative abundance of families of AM fungi because of potential differences in their
response to P. This is likely to be due to the sensitivity of Gigasporaceae to high soil P
concentration while Acaulosporaceae and Glomeraceae may be more tolerant of high soil P;
the soil used in this study was an agricultural soil with high initial P. So this is consistent
with other studies that showed that some Glomus species are tolerant to high soil P and these
species have the ability to colonise plant roots and produce more spores under high soil P
conditions (Mosse 1973; Sylvia and Schenck 1983) compared to some species from the
family Gigasporaceae which are sensitive to high soil P (Douds and Schenck 1990; Thomson
et al. 1986; Thomson et al. 1990). The variation in fungal sensitivity to P may be due to
differences in requirement for soluble carbohydrates (Johnson 1993) and that P plays a
crucial role in reducing the concentration in root exudates (Graham et al. 1981; Ratnayake
et al. 1978). The intra-cortical sporulation of tolerant species has the capability to shorten
carbon flow path in high P concentration (Douds and Schenck 1990).
Chapter Five
95
Both the conventional chemical and commercial mineral-based fertiliser applications
significantly decreased OTU richness (Shannon, Fisher, Richness and Evenness). In general,
the richness of OTUs was lower when the conventional chemical fertiliser was applied to
annual ryegrass. In contrast, the richness of OTUs was lower when the commercial mineral-
based fertiliser was applied to subterranean clover. This reduction may be due to the direct
effect of P on out richness, or to the effect of fertilisers on soil chemical properties, especially
soil pH. There was highly significant correlation between OTU richness and soil pH for
subterranean clover roots (R2=0.82) and a weaker correlation with annual ryegrass roots
(R2=0.46) which support this explanation. The findings of the present study are consistent
with previous studies showing a negative effect of fertiliser application (mainly P and N) on
AM fungal richness in grasslands (Johnson 1993; Santos et al. 2006). The negative effect of
fertilisers on AM fungal richness may either be due to competition for C allocated by plant
in nutrient efficient conditions, and in this case, the dominant fungi should be high
competitors (Douds and Schenck 1990; Johnson 1993; Johnson 2010), or to increasing soil
nutrient availability that promote dominance of certain AM fungal species (Dumbrell et al.
2010a; Tilman 1993).
5.6 Conclusion
Both fertilisers investigated here decreased the proportion of roots of subterranean clover
and annual ryegrass colonised by AM fungi when grown in an agricultural soil. This
reduction in the proportion of roots colonised by AM fungi with P fertilisers was not related
to differences in their elemental solubility. Differential effects of P fertilisers on naturally
occurring AM fungi in this agricultural soil have potential to influence plant competition
and pasture species dominance. Fertilisers did not affect the relative abundance of
Acaulosporaceae and Glomeraceae but did affect those in the family Gigasporaceae. Further
investigation using lower rates of fertilisers is essential to evaluate differences in P solubility
related to the optimum rate that can promote pasture growth without affecting soil microbial
diversity and function, especially for AM fungi.
Chapter Six
96
6 CHAPTER 6
Interactions between forms of oil mallee biochar and fertilisers of different
solubility on mycorrhiza formation in annual ryegrass under adequate
phosphorus conditions
6.1 Abstract
In sustainable plant production and ecosystem restoration, both biochar and arbuscular
mycorrhizal (AM) fungi are potentially important. It is, therefore necessary to understand and
exploit potential interactions between biochar and AM fungi to achieve any advantageous
outcomes in agroecosystems. Biochar incorporated into agricultural soil has been known to
influence the availability of soil nutrients as well as act as a habitat for soil microorganisms. In
terms of habitat, biochar particle size is a possible factor that can shape soil microbial
community structure and function. A glasshouse experiment was conducted to investigate
interactions between forms of oil mallee biochar applied to soil with fertilisers of different
solubility on mycorrhiza formation in annual ryegrass under P-adequate soil conditions. Three
forms of oil mallee biochar: (i) intact, (ii) powdered and (iii) hot water extracted, were
combined with two fertilisers which differed in P solubility. The pasture soil used had a
relatively high initial P content (75.8 mg P/kg soil). The three forms of biochar were applied at
two levels equivalent to 10 and 20 t/ha in addition to no biochar as a control (soil+fertiliser
only). A conventional chemical fertiliser and a mineral-based fertiliser were used at a rate of
5.6 P kg ha-1 for all treatments, including the control without added biochar. Plants were
harvested 5 and 10 weeks after sowing. Initially (at 5 weeks), biochar forms did not affect dry
shoot weight. Both fertilisers and biochar forms significantly affected mycorrhizal colonisation
(%) and root length colonised. In the early stage (5 weeks), there was a negative effect of
conventional chemical fertiliser on root colonisation (%) which was greater than the effect of
mineral-based fertiliser. Intact biochar had the highest positive effect on root colonisation (%).
Subsequently, fertilisers had a similar effect on both mycorrhizal colonisation (%) and root
length colonised. The combination of each biochar form and mineral-based fertiliser
significantly increased mycorrhizal colonisation (%) but the conventional chemical fertiliser
only had an effect with the intact biochar form. Use of alternative biochar forms with mineral-
based fertiliser may have the potential to promote pasture growth without detrimental effects
on mycorrhizas.
Chapter Six
97
6.2 Introduction
Most agricultural soils are limited in their capability to provide adequate nutrients especially N
and P to plants. This limitation can be caused by leaching, transformation to gaseous forms and
fixation or precipitation reactions (Ding et al. 2010; Heckrath et al. 1995). To meet plant
nutrient demands, inorganic fertilisers such as N and P are widely used (Galloway et al. 2014).
However, the fluctuation in fertiliser prices can markedly increase, such as in 2007-2008, which
affects their use by farmers (Blackwell et al. 2010). Another problem is environmental
consequences of inefficient nutrient recovery from inorganic fertilisers as influenced by
processes such as soil acidification and factors associated with climate change (Galloway et al.
2014). All these problems highlight the need for developing new or alternative strategies to
reduce the expense of inputs to aid plant nutrition. The use biochar individually or combined
with fertilisers is a potential alternative practice which could affect the chemical, physical and
biological properties of soil (Chan and Xu 2009; Thies and Rillig 2009).
Biochar is a soil amendment with potential to enhance recycling of N and P in agricultural
ecosystems. It is produced through heating either plant or animal biomass at (300 to 700 °C)
under oxygen-deficient conditions through slow and fast pyrolysis (Antal and Grønli 2003;
Brewer and Brown 2012). This produces highly aromatic organic C material (Lehmann and
Joseph 2012; Lehmann et al. 2011). The attributes of pyrolysed biochars that can affect
biochemical cycling of N and P can be due to high surface area with the potential to increase
soil water holding capacity, pH, nutrient content and cation exchange capacity (CEC) (Bélanger
et al. 2004; Glaser et al. 2002; Keech et al. 2005; Liang et al. 2006). These characteristics vary
among biochars depending on the feedstock and the temperature used to produce biochars
(Bornemann et al. 2007; Gundale and DeLuca 2006). Biochars produced from manure and crop
residues are richer in nutrient content and tend to have higher pH and have greater surface areas
than biochars produced from lingo-cellulosic feedstock such as wood (Gul et al. 2015; Mohanty
et al. 2013; Novak et al. 2013; Singh et al. 2010). Similarly, biochars produced at high
temperature (≥550°C) also tend to have greater surface area and higher pH but less available
nutrients for plants than biochars produced with lower temperature (Al-Wabel et al. 2013;
Cantrell et al. 2012; Mukherjee et al. 2011; Singh et al. 2010).
The physico-chemical properties of biochar can change soil properties and alter the activities
of soil microorganisms. In the soil matrix, biochar surfaces and pores can provide habitat to the
soil microorganisms (Jaafer et al. 2014) by improving bulk density, aeration, water and nutrients
Chapter Six
98
(Zackrisson et al. 1996). There are many chemical properties of biochar that facilitate growth
of microorganisms on biochar surfaces and within the pores such as the surface charge which
interacts with microbial cells and the concentration of nutrients and dissolved organic C which
are desorbed or solubilised from the biochar (Gul et al. 2015). Modification of soil physico-
chemical properties can be manipulated by interactions between soil and biochar, depending on
the particle size, which has potential to affect soil microbial communities (Farrell et al. 2013;
Gomez et al. 2014). These studies suggest that the labile C contained in biochar can induce the
increases of soil microbial biomass. However, the adsorption of labile soil organic C by biochar
can minimise the available nutrient supply to soil microorganisms and this can negatively affect
their activities (Prayogo et al. 2014; Zimmerman et al. 2011). Soil microbial diversity and
activity can be influenced by the rate and the type of biochar applied to the soil (Lehmann et al.
2006; Thies and Suzuki 2003). Furthermore, biochars can be used as an inoculum carrier for
AM fungi (Saito and Marumoto 2002), and accelerate nutrient cycling from soil organic matter
and uptake by plant roots.
A new direction for using biochar is the use of water extraction of biochar as an alternative
method of biochar application (Lin et al. 2012b; Lin et al. 2012c; Lou et al. 2015). This is
because of the cost of biochar production can limit biochar marketing and use (Clare et al.
2014). This, in turn, has lead the researchers to investigate new methods to exploit waste water
produced in the scrubbing and cooling stages of biochar production because this water contains
high concentrations of organic nutrients as well as both cations and anions (Lou et al. 2015).
During pyrolysis process of biochars, outputs such as wood vinegar have potential to improve
vegetables growth as it contains many organic components such as olefins, ketones and phenols
(Yu et al. 2011). For example, Arabidopsis seedlings growth under P deficient conditions
improved when treated with humic-like extracted from biochar (Graber et al. 2015).
The effects of biochars on plant growth, soil properties and soil microorganisms under crop
systems have been widely investigated (Asai et al. 2009; Blackwell et al. 2010; Gaskin et al.
2008; Yuan et al. 2011). However, there is potential for benefits from biochar in less disturbed
pasture systems but an understanding of the effect of application biochar in different forms and
rates in combination with fertilisers has not been studied.
A pot experiment was established to evaluate the effect of oil mallee biochar used in different
forms combined with a commercial mineral-based fertiliser and a commercial chemical
Chapter Six
99
fertiliser on annual ryegrass growth and the abundance of mycorrhizal fungi. To investigate
these interactions, soil was collected from a pasture paddock.
The following hypotheses were tested:
Annual ryegrass shoot mass will be higher with an alternative form of biochar
amendment (hot water extraction) than for intact biochar (due to increase the availability
of nutrients in the biochar solution) while root mass will be lower with hot water
extracted biochar than with the intact form of biochar.
An alternative form of biochar amendment (hot water extraction) will negatively affect
colonisation of roots by AM fungi, especially in the early stage of plant growth, while
intact biochar will increase root colonisation (%) by AM fungi.
6.3 Material and methods
Soil sampling and preparing
The soil used in this glasshouse experiment was collected from The University of Western
Australia (UWA) farm Ridgefield, near Pingelly, Western Australia in May 2015 at a depth of
0-10 cm. The soil was from the same pasture as that used in a previous experiment (Chapter 5).
Biochar characterisation
Jarrah wood (trunks and large branches; Eucalyptus marginata Donn ex Sm.) was pyrolysed at
600°C for 24 h in a Lambiotte carbonisation reactor by Simcoa Ltd, Bunbury, Western
Australia. Total C and N were determined by combustion analysis (vario Macro CNS;
Elementar, Germany). Ammonium (NH4+) and nitrate (NO3
−) content of soil were determined
by extracting with 0.5 M K2SO4 and analysing the extract colorimetrically for NH4+ (Krom
1980; Searle 1984) and NO3− (Kamphake et al. 1967; Kempers and Luft 1988) on an automated
flow injection Skalar Auto-analyser (Skalar San plus). The electrical conductivity (EC) and pH
of the biochar were determined in 1:5 (w/v; g cm-3) soil to water or 0.01 M CaCl2 mixtures,
respectively. The basic chemical characteristics of soil and biochar used in this experiment are
shown in Table 6-1.
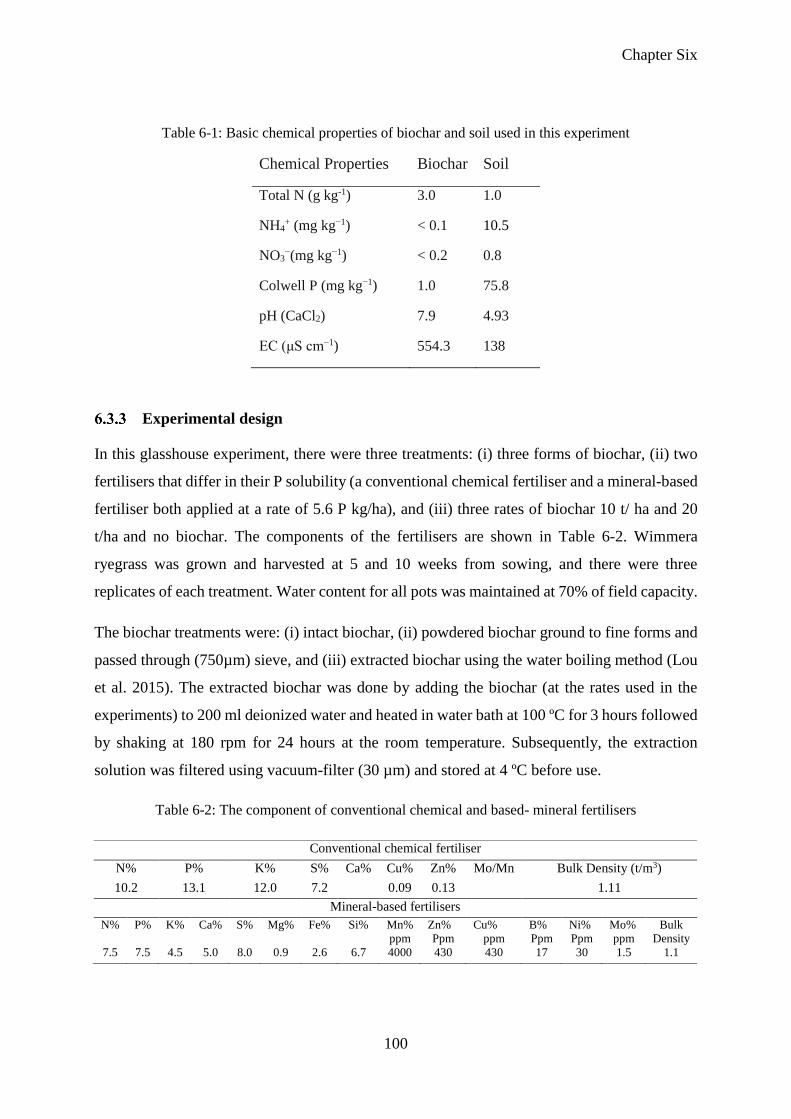
Chapter Six
100
Table 6-1: Basic chemical properties of biochar and soil used in this experiment
Chemical Properties Biochar Soil
Total N (g kg-1) 3.0 1.0
NH4+ (mg kg−1) < 0.1 10.5
NO3−(mg kg−1) < 0.2 0.8
Colwell P (mg kg−1) 1.0 75.8
pH (CaCl2) 7.9 4.93
EC (μS cm−1) 554.3 138
Experimental design
In this glasshouse experiment, there were three treatments: (i) three forms of biochar, (ii) two
fertilisers that differ in their P solubility (a conventional chemical fertiliser and a mineral-based
fertiliser both applied at a rate of 5.6 P kg/ha), and (iii) three rates of biochar 10 t/ ha and 20
t/ha and no biochar. The components of the fertilisers are shown in Table 6-2. Wimmera
ryegrass was grown and harvested at 5 and 10 weeks from sowing, and there were three
replicates of each treatment. Water content for all pots was maintained at 70% of field capacity.
The biochar treatments were: (i) intact biochar, (ii) powdered biochar ground to fine forms and
passed through (750µm) sieve, and (iii) extracted biochar using the water boiling method (Lou
et al. 2015). The extracted biochar was done by adding the biochar (at the rates used in the
experiments) to 200 ml deionized water and heated in water bath at 100 ºC for 3 hours followed
by shaking at 180 rpm for 24 hours at the room temperature. Subsequently, the extraction
solution was filtered using vacuum-filter (30 µm) and stored at 4 ºC before use.
Table 6-2: The component of conventional chemical and based- mineral fertilisers
Conventional chemical fertiliser
N% P% K% S% Ca% Cu% Zn% Mo/Mn Bulk Density (t/m3)
10.2 13.1 12.0 7.2 0.09 0.13 1.11
Mineral-based fertilisers
N% P% K% Ca% S% Mg% Fe% Si% Mn%
ppm Zn%
Ppm Cu%
ppm B%
Ppm Ni%
Ppm Mo%
ppm Bulk
Density 7.5 7.5 4.5 5.0 8.0 0.9 2.6 6.7 4000 430 430 17 30 1.5 1.1
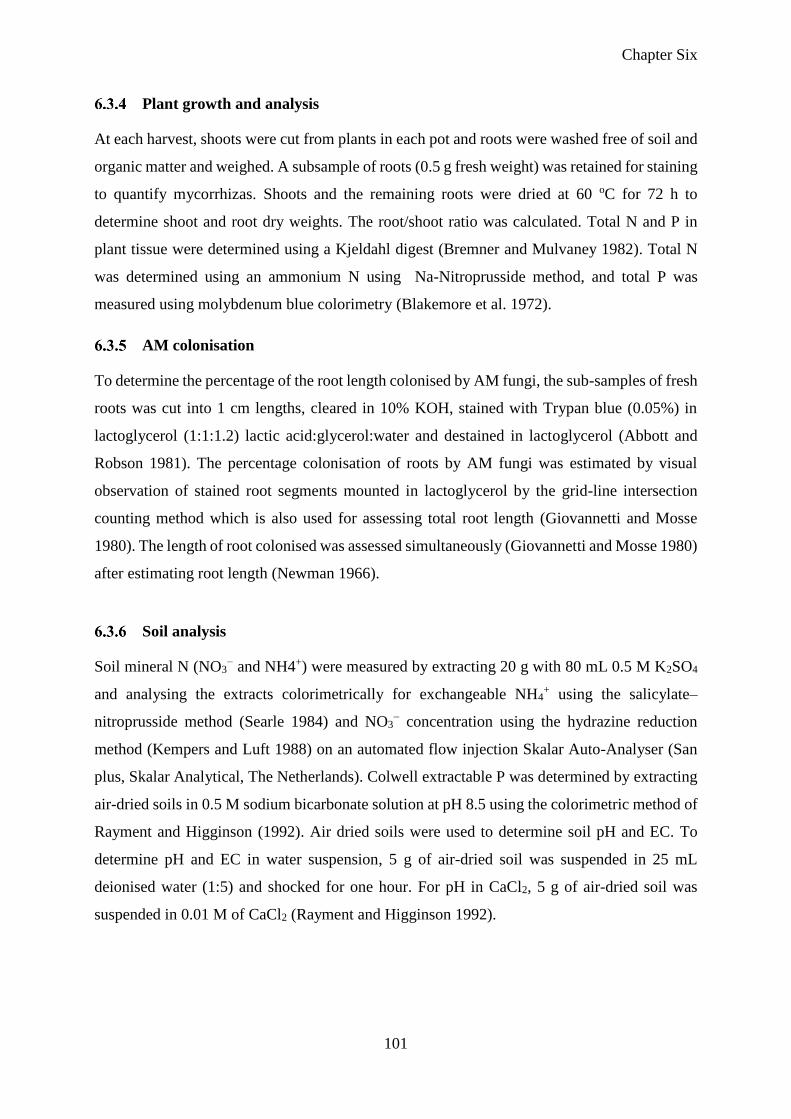
Chapter Six
101
Plant growth and analysis
At each harvest, shoots were cut from plants in each pot and roots were washed free of soil and
organic matter and weighed. A subsample of roots (0.5 g fresh weight) was retained for staining
to quantify mycorrhizas. Shoots and the remaining roots were dried at 60 oC for 72 h to
determine shoot and root dry weights. The root/shoot ratio was calculated. Total N and P in
plant tissue were determined using a Kjeldahl digest (Bremner and Mulvaney 1982). Total N
was determined using an ammonium N using Na-Nitroprusside method, and total P was
measured using molybdenum blue colorimetry (Blakemore et al. 1972).
AM colonisation
To determine the percentage of the root length colonised by AM fungi, the sub-samples of fresh
roots was cut into 1 cm lengths, cleared in 10% KOH, stained with Trypan blue (0.05%) in
lactoglycerol (1:1:1.2) lactic acid:glycerol:water and destained in lactoglycerol (Abbott and
Robson 1981). The percentage colonisation of roots by AM fungi was estimated by visual
observation of stained root segments mounted in lactoglycerol by the grid-line intersection
counting method which is also used for assessing total root length (Giovannetti and Mosse
1980). The length of root colonised was assessed simultaneously (Giovannetti and Mosse 1980)
after estimating root length (Newman 1966).
Soil analysis
Soil mineral N (NO3− and NH4+) were measured by extracting 20 g with 80 mL 0.5 M K2SO4
and analysing the extracts colorimetrically for exchangeable NH4+ using the salicylate–
nitroprusside method (Searle 1984) and NO3− concentration using the hydrazine reduction
method (Kempers and Luft 1988) on an automated flow injection Skalar Auto-Analyser (San
plus, Skalar Analytical, The Netherlands). Colwell extractable P was determined by extracting
air-dried soils in 0.5 M sodium bicarbonate solution at pH 8.5 using the colorimetric method of
Rayment and Higginson (1992). Air dried soils were used to determine soil pH and EC. To
determine pH and EC in water suspension, 5 g of air-dried soil was suspended in 25 mL
deionised water (1:5) and shocked for one hour. For pH in CaCl2, 5 g of air-dried soil was
suspended in 0.01 M of CaCl2 (Rayment and Higginson 1992).
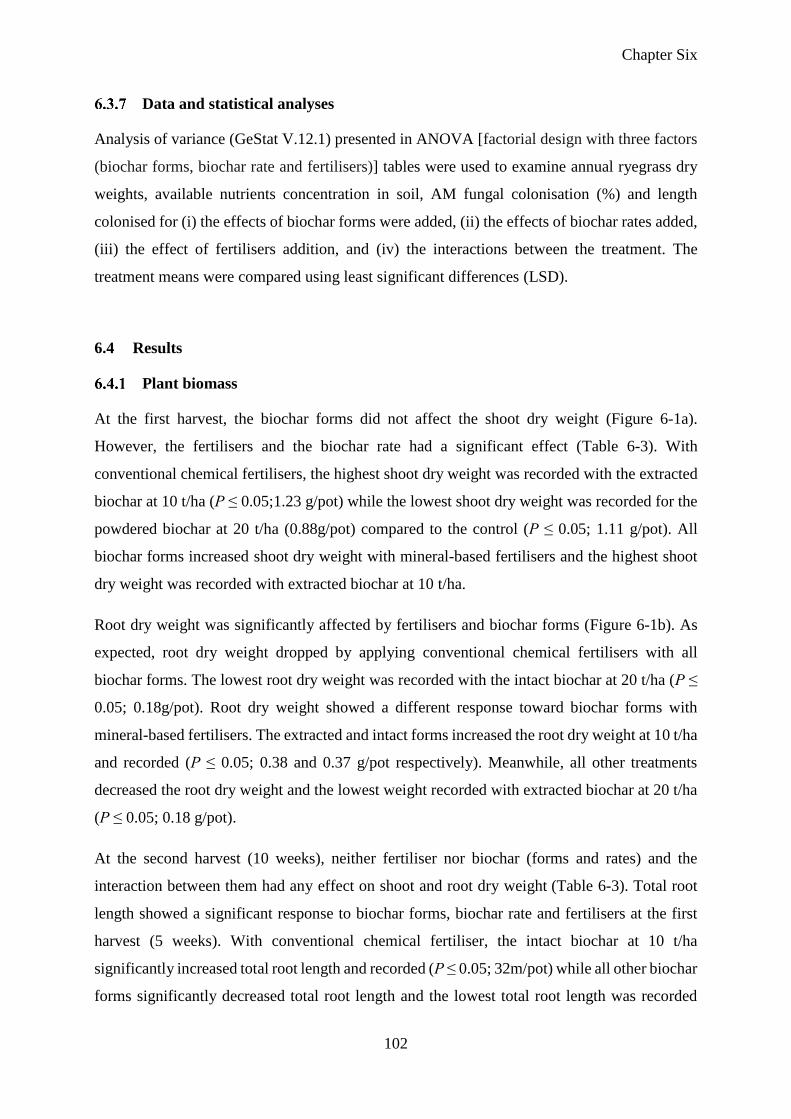
Chapter Six
102
Data and statistical analyses
Analysis of variance (GeStat V.12.1) presented in ANOVA [factorial design with three factors
(biochar forms, biochar rate and fertilisers)] tables were used to examine annual ryegrass dry
weights, available nutrients concentration in soil, AM fungal colonisation (%) and length
colonised for (i) the effects of biochar forms were added, (ii) the effects of biochar rates added,
(iii) the effect of fertilisers addition, and (iv) the interactions between the treatment. The
treatment means were compared using least significant differences (LSD).
6.4 Results
Plant biomass
At the first harvest, the biochar forms did not affect the shoot dry weight (Figure 6-1a).
However, the fertilisers and the biochar rate had a significant effect (Table 6-3). With
conventional chemical fertilisers, the highest shoot dry weight was recorded with the extracted
biochar at 10 t/ha (P ≤ 0.05;1.23 g/pot) while the lowest shoot dry weight was recorded for the
powdered biochar at 20 t/ha (0.88g/pot) compared to the control (P ≤ 0.05; 1.11 g/pot). All
biochar forms increased shoot dry weight with mineral-based fertilisers and the highest shoot
dry weight was recorded with extracted biochar at 10 t/ha.
Root dry weight was significantly affected by fertilisers and biochar forms (Figure 6-1b). As
expected, root dry weight dropped by applying conventional chemical fertilisers with all
biochar forms. The lowest root dry weight was recorded with the intact biochar at 20 t/ha (P ≤
0.05; 0.18g/pot). Root dry weight showed a different response toward biochar forms with
mineral-based fertilisers. The extracted and intact forms increased the root dry weight at 10 t/ha
and recorded (P ≤ 0.05; 0.38 and 0.37 g/pot respectively). Meanwhile, all other treatments
decreased the root dry weight and the lowest weight recorded with extracted biochar at 20 t/ha
(P ≤ 0.05; 0.18 g/pot).
At the second harvest (10 weeks), neither fertiliser nor biochar (forms and rates) and the
interaction between them had any effect on shoot and root dry weight (Table 6-3). Total root
length showed a significant response to biochar forms, biochar rate and fertilisers at the first
harvest (5 weeks). With conventional chemical fertiliser, the intact biochar at 10 t/ha
significantly increased total root length and recorded (P ≤ 0.05; 32m/pot) while all other biochar
forms significantly decreased total root length and the lowest total root length was recorded
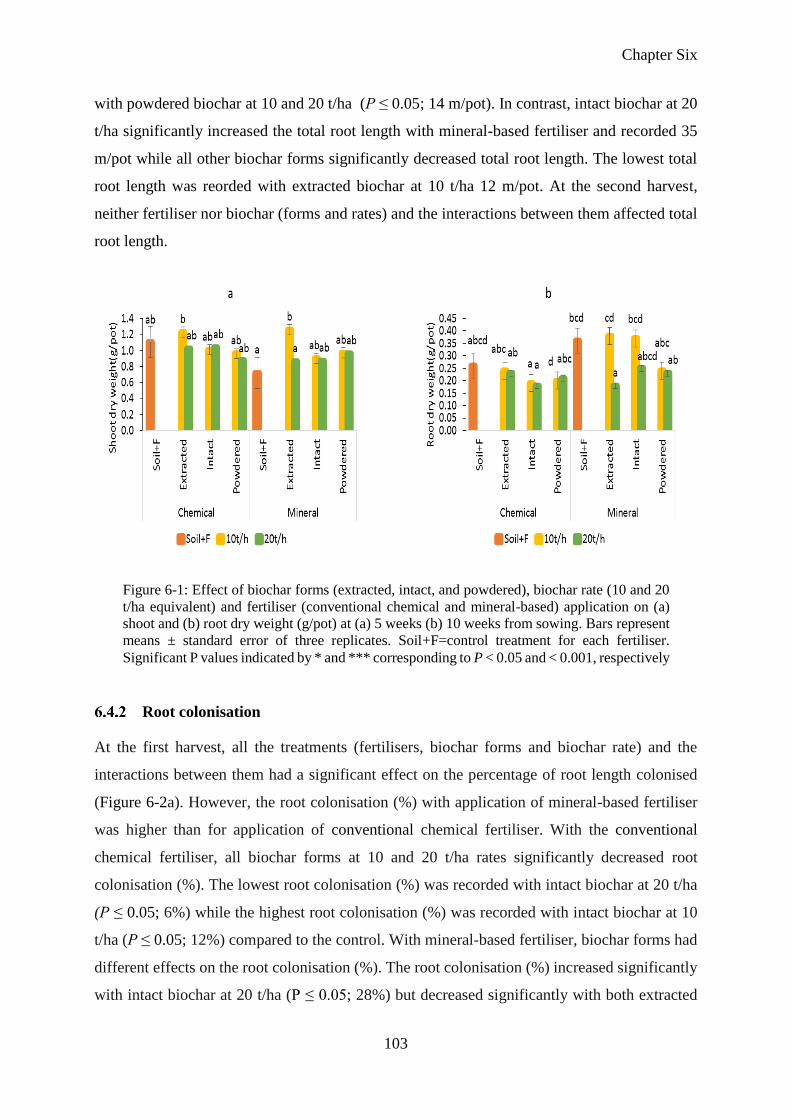
Chapter Six
103
with powdered biochar at 10 and 20 t/ha (P ≤ 0.05; 14 m/pot). In contrast, intact biochar at 20
t/ha significantly increased the total root length with mineral-based fertiliser and recorded 35
m/pot while all other biochar forms significantly decreased total root length. The lowest total
root length was reorded with extracted biochar at 10 t/ha 12 m/pot. At the second harvest,
neither fertiliser nor biochar (forms and rates) and the interactions between them affected total
root length.
Root colonisation
At the first harvest, all the treatments (fertilisers, biochar forms and biochar rate) and the
interactions between them had a significant effect on the percentage of root length colonised
(Figure 6-2a). However, the root colonisation (%) with application of mineral-based fertiliser
was higher than for application of conventional chemical fertiliser. With the conventional
chemical fertiliser, all biochar forms at 10 and 20 t/ha rates significantly decreased root
colonisation (%). The lowest root colonisation (%) was recorded with intact biochar at 20 t/ha
(P ≤ 0.05; 6%) while the highest root colonisation (%) was recorded with intact biochar at 10
t/ha (P ≤ 0.05; 12%) compared to the control. With mineral-based fertiliser, biochar forms had
different effects on the root colonisation (%). The root colonisation (%) increased significantly
with intact biochar at 20 t/ha (P ≤ 0.05; 28%) but decreased significantly with both extracted
Figure 6-1: Effect of biochar forms (extracted, intact, and powdered), biochar rate (10 and 20
t/ha equivalent) and fertiliser (conventional chemical and mineral-based) application on (a)
shoot and (b) root dry weight (g/pot) at (a) 5 weeks (b) 10 weeks from sowing. Bars represent
means ± standard error of three replicates. Soil+F=control treatment for each fertiliser.
Significant P values indicated by * and *** corresponding to P < 0.05 and < 0.001, respectively
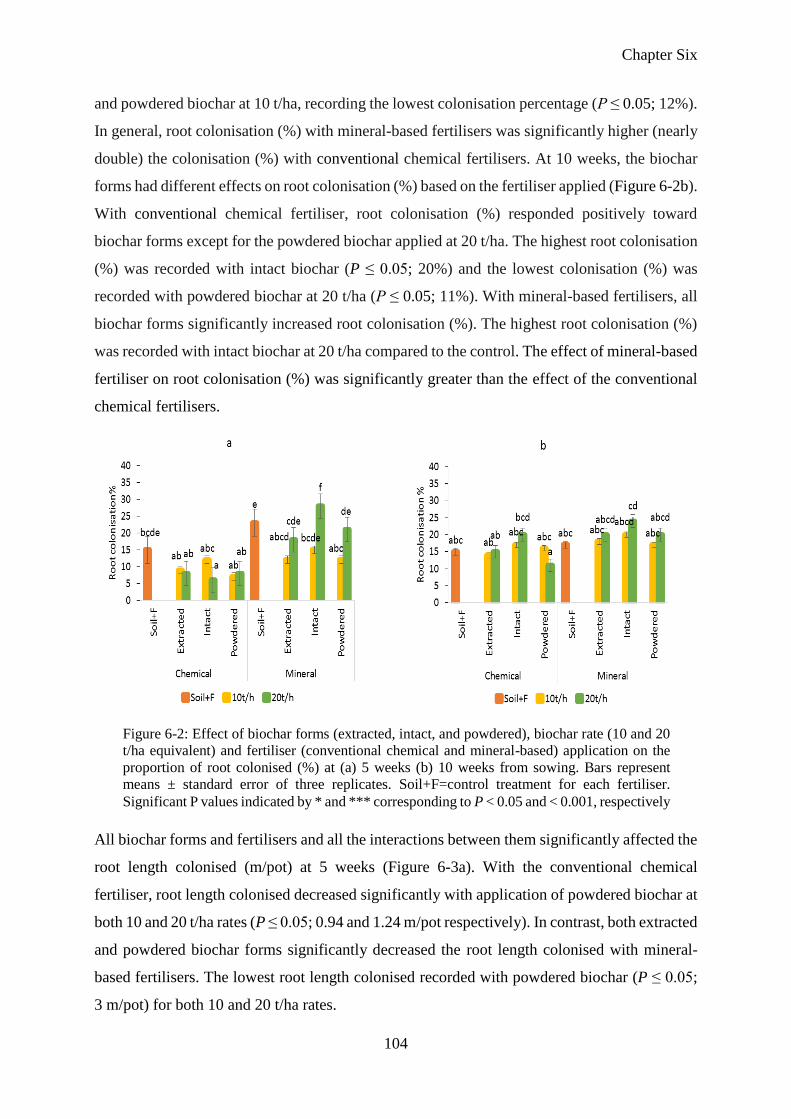
Chapter Six
104
and powdered biochar at 10 t/ha, recording the lowest colonisation percentage (P ≤ 0.05; 12%).
In general, root colonisation (%) with mineral-based fertilisers was significantly higher (nearly
double) the colonisation (%) with conventional chemical fertilisers. At 10 weeks, the biochar
forms had different effects on root colonisation (%) based on the fertiliser applied (Figure 6-2b).
With conventional chemical fertiliser, root colonisation (%) responded positively toward
biochar forms except for the powdered biochar applied at 20 t/ha. The highest root colonisation
(%) was recorded with intact biochar (P ≤ 0.05; 20%) and the lowest colonisation (%) was
recorded with powdered biochar at 20 t/ha (P ≤ 0.05; 11%). With mineral-based fertilisers, all
biochar forms significantly increased root colonisation (%). The highest root colonisation (%)
was recorded with intact biochar at 20 t/ha compared to the control. The effect of mineral-based
fertiliser on root colonisation (%) was significantly greater than the effect of the conventional
chemical fertilisers.
All biochar forms and fertilisers and all the interactions between them significantly affected the
root length colonised (m/pot) at 5 weeks (Figure 6-3a). With the conventional chemical
fertiliser, root length colonised decreased significantly with application of powdered biochar at
both 10 and 20 t/ha rates (P ≤ 0.05; 0.94 and 1.24 m/pot respectively). In contrast, both extracted
and powdered biochar forms significantly decreased the root length colonised with mineral-
based fertilisers. The lowest root length colonised recorded with powdered biochar (P ≤ 0.05;
3 m/pot) for both 10 and 20 t/ha rates.
Figure 6-2: Effect of biochar forms (extracted, intact, and powdered), biochar rate (10 and 20
t/ha equivalent) and fertiliser (conventional chemical and mineral-based) application on the
proportion of root colonised (%) at (a) 5 weeks (b) 10 weeks from sowing. Bars represent
means ± standard error of three replicates. Soil+F=control treatment for each fertiliser.
Significant P values indicated by * and *** corresponding to P < 0.05 and < 0.001, respectively
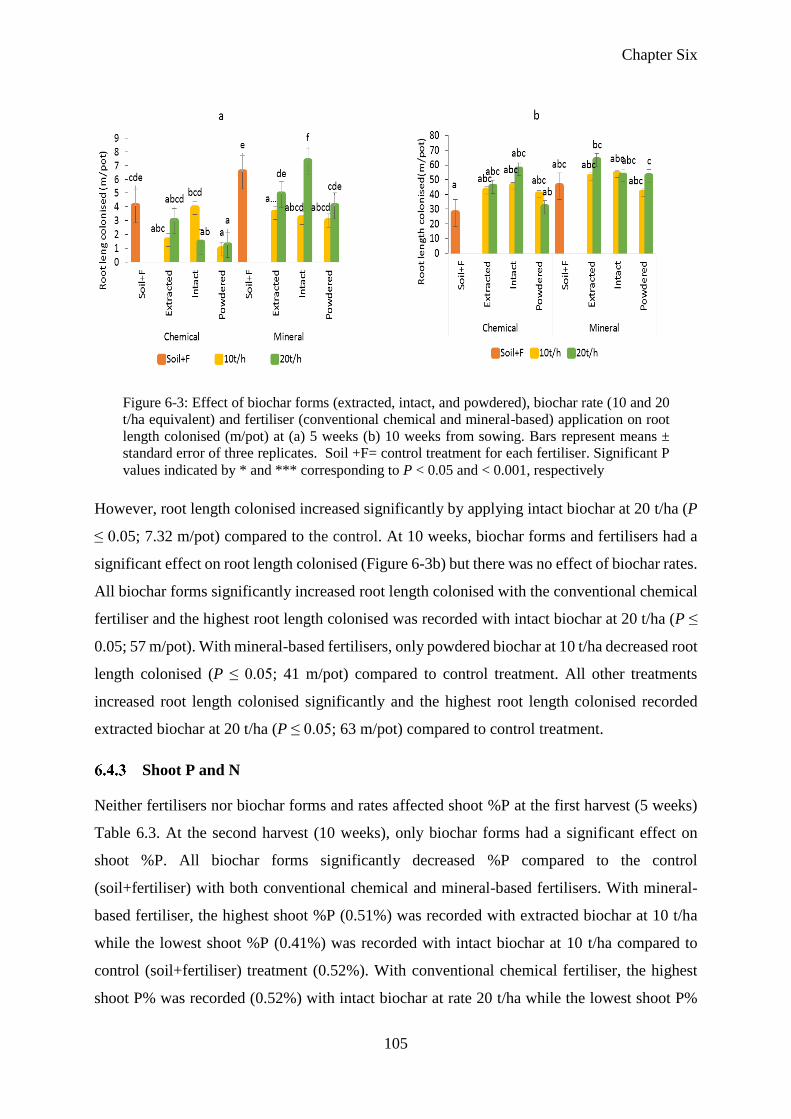
Chapter Six
105
However, root length colonised increased significantly by applying intact biochar at 20 t/ha (P
≤ 0.05; 7.32 m/pot) compared to the control. At 10 weeks, biochar forms and fertilisers had a
significant effect on root length colonised (Figure 6-3b) but there was no effect of biochar rates.
All biochar forms significantly increased root length colonised with the conventional chemical
fertiliser and the highest root length colonised was recorded with intact biochar at 20 t/ha (P ≤
0.05; 57 m/pot). With mineral-based fertilisers, only powdered biochar at 10 t/ha decreased root
length colonised (P ≤ 0.05; 41 m/pot) compared to control treatment. All other treatments
increased root length colonised significantly and the highest root length colonised recorded
extracted biochar at 20 t/ha (P ≤ 0.05; 63 m/pot) compared to control treatment.
Shoot P and N
Neither fertilisers nor biochar forms and rates affected shoot %P at the first harvest (5 weeks)
Table 6.3. At the second harvest (10 weeks), only biochar forms had a significant effect on
shoot %P. All biochar forms significantly decreased %P compared to the control
(soil+fertiliser) with both conventional chemical and mineral-based fertilisers. With mineral-
based fertiliser, the highest shoot %P (0.51%) was recorded with extracted biochar at 10 t/ha
while the lowest shoot %P (0.41%) was recorded with intact biochar at 10 t/ha compared to
control (soil+fertiliser) treatment (0.52%). With conventional chemical fertiliser, the highest
shoot P% was recorded (0.52%) with intact biochar at rate 20 t/ha while the lowest shoot P%
Figure 6-3: Effect of biochar forms (extracted, intact, and powdered), biochar rate (10 and 20
t/ha equivalent) and fertiliser (conventional chemical and mineral-based) application on root
length colonised (m/pot) at (a) 5 weeks (b) 10 weeks from sowing. Bars represent means ±
standard error of three replicates. Soil +F= control treatment for each fertiliser. Significant P
values indicated by * and *** corresponding to P < 0.05 and < 0.001, respectively
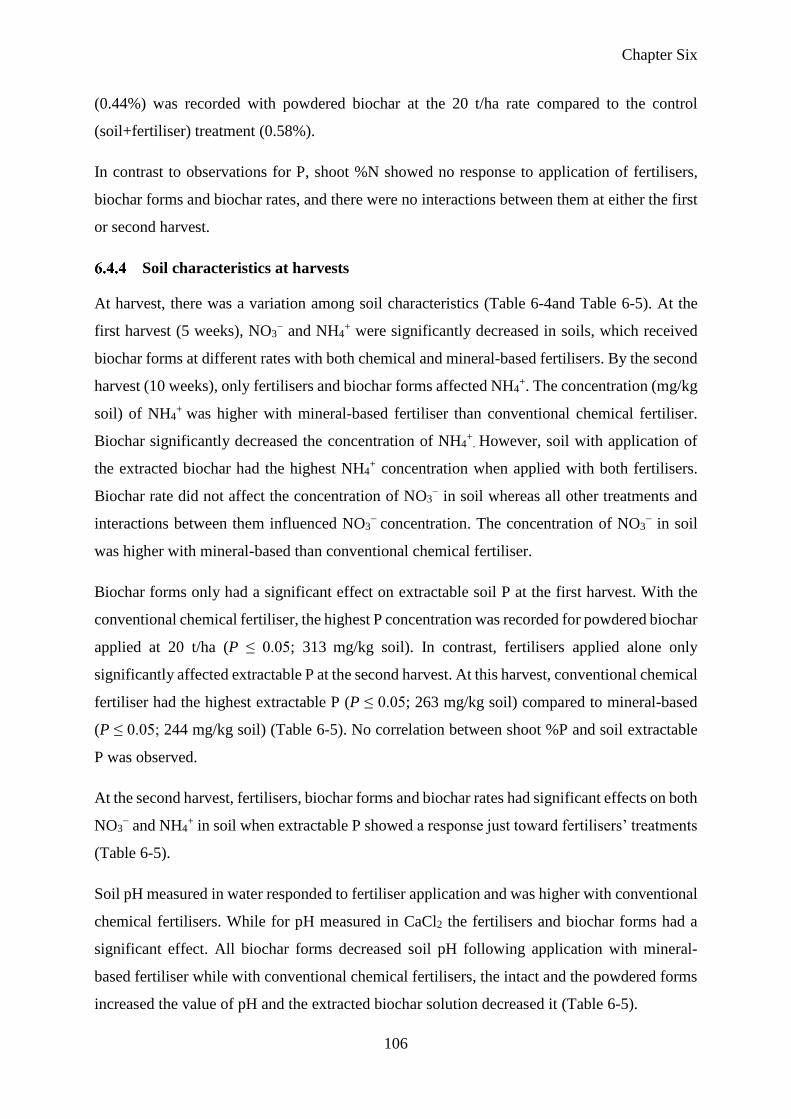
Chapter Six
106
(0.44%) was recorded with powdered biochar at the 20 t/ha rate compared to the control
(soil+fertiliser) treatment (0.58%).
In contrast to observations for P, shoot %N showed no response to application of fertilisers,
biochar forms and biochar rates, and there were no interactions between them at either the first
or second harvest.
Soil characteristics at harvests
At harvest, there was a variation among soil characteristics (Table 6-4and Table 6-5). At the
first harvest (5 weeks), NO3− and NH4
+ were significantly decreased in soils, which received
biochar forms at different rates with both chemical and mineral-based fertilisers. By the second
harvest (10 weeks), only fertilisers and biochar forms affected NH4+. The concentration (mg/kg
soil) of NH4+
was higher with mineral-based fertiliser than conventional chemical fertiliser.
Biochar significantly decreased the concentration of NH4+
. However, soil with application of
the extracted biochar had the highest NH4+ concentration when applied with both fertilisers.
Biochar rate did not affect the concentration of NO3− in soil whereas all other treatments and
interactions between them influenced NO3− concentration. The concentration of NO3
− in soil
was higher with mineral-based than conventional chemical fertiliser.
Biochar forms only had a significant effect on extractable soil P at the first harvest. With the
conventional chemical fertiliser, the highest P concentration was recorded for powdered biochar
applied at 20 t/ha (P ≤ 0.05; 313 mg/kg soil). In contrast, fertilisers applied alone only
significantly affected extractable P at the second harvest. At this harvest, conventional chemical
fertiliser had the highest extractable P (P ≤ 0.05; 263 mg/kg soil) compared to mineral-based
(P ≤ 0.05; 244 mg/kg soil) (Table 6-5). No correlation between shoot %P and soil extractable
P was observed.
At the second harvest, fertilisers, biochar forms and biochar rates had significant effects on both
NO3− and NH4
+ in soil when extractable P showed a response just toward fertilisers’ treatments
(Table 6-5).
Soil pH measured in water responded to fertiliser application and was higher with conventional
chemical fertilisers. While for pH measured in CaCl2 the fertilisers and biochar forms had a
significant effect. All biochar forms decreased soil pH following application with mineral-
based fertiliser while with conventional chemical fertilisers, the intact and the powdered forms
increased the value of pH and the extracted biochar solution decreased it (Table 6-5).
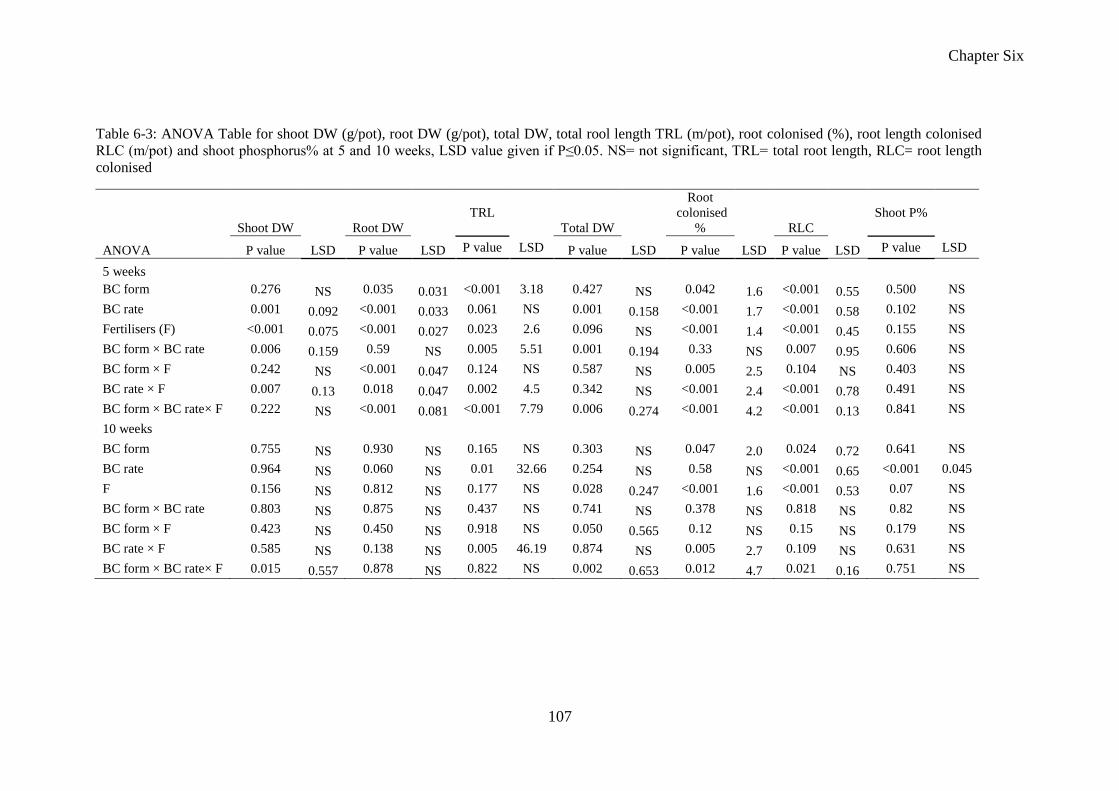
Chapter Six
107
Table 6-3: ANOVA Table for shoot DW (g/pot), root DW (g/pot), total DW, total rool length TRL (m/pot), root colonised (%), root length colonised
RLC (m/pot) and shoot phosphorus% at 5 and 10 weeks, LSD value given if P≤0.05. NS= not significant, TRL= total root length, RLC= root length
colonised
Shoot DW Root DW
TRL
Total DW
Root
colonised
% RLC
Shoot P%
ANOVA P value LSD P value LSD P value LSD P value LSD P value LSD P value LSD P value LSD
5 weeks
BC form 0.276 NS 0.035 0.031 <0.001 3.18 0.427 NS 0.042 1.6 <0.001 0.55 0.500 NS
BC rate 0.001 0.092 <0.001 0.033 0.061 NS 0.001 0.158 <0.001 1.7 <0.001 0.58 0.102 NS
Fertilisers (F) <0.001 0.075 <0.001 0.027 0.023 2.6 0.096 NS <0.001 1.4 <0.001 0.45 0.155 NS
BC form × BC rate 0.006 0.159 0.59 NS 0.005 5.51 0.001 0.194 0.33 NS 0.007 0.95 0.606 NS
BC form × F 0.242 NS <0.001 0.047 0.124 NS 0.587 NS 0.005 2.5 0.104 NS 0.403 NS
BC rate × F 0.007 0.13 0.018 0.047 0.002 4.5 0.342 NS <0.001 2.4 <0.001 0.78 0.491 NS
BC form × BC rate× F 0.222 NS <0.001 0.081 <0.001 7.79 0.006 0.274 <0.001 4.2 <0.001 0.13 0.841 NS
10 weeks
BC form 0.755 NS 0.930 NS 0.165 NS 0.303 NS 0.047 2.0 0.024 0.72 0.641 NS
BC rate 0.964 NS 0.060 NS 0.01 32.66 0.254 NS 0.58 NS <0.001 0.65 <0.001 0.045
F 0.156 NS 0.812 NS 0.177 NS 0.028 0.247 <0.001 1.6 <0.001 0.53 0.07 NS
BC form × BC rate 0.803 NS 0.875 NS 0.437 NS 0.741 NS 0.378 NS 0.818 NS 0.82 NS
BC form × F 0.423 NS 0.450 NS 0.918 NS 0.050 0.565 0.12 NS 0.15 NS 0.179 NS
BC rate × F 0.585 NS 0.138 NS 0.005 46.19 0.874 NS 0.005 2.7 0.109 NS 0.631 NS
BC form × BC rate× F 0.015 0.557 0.878 NS 0.822 NS 0.002 0.653 0.012 4.7 0.021 0.16 0.751 NS
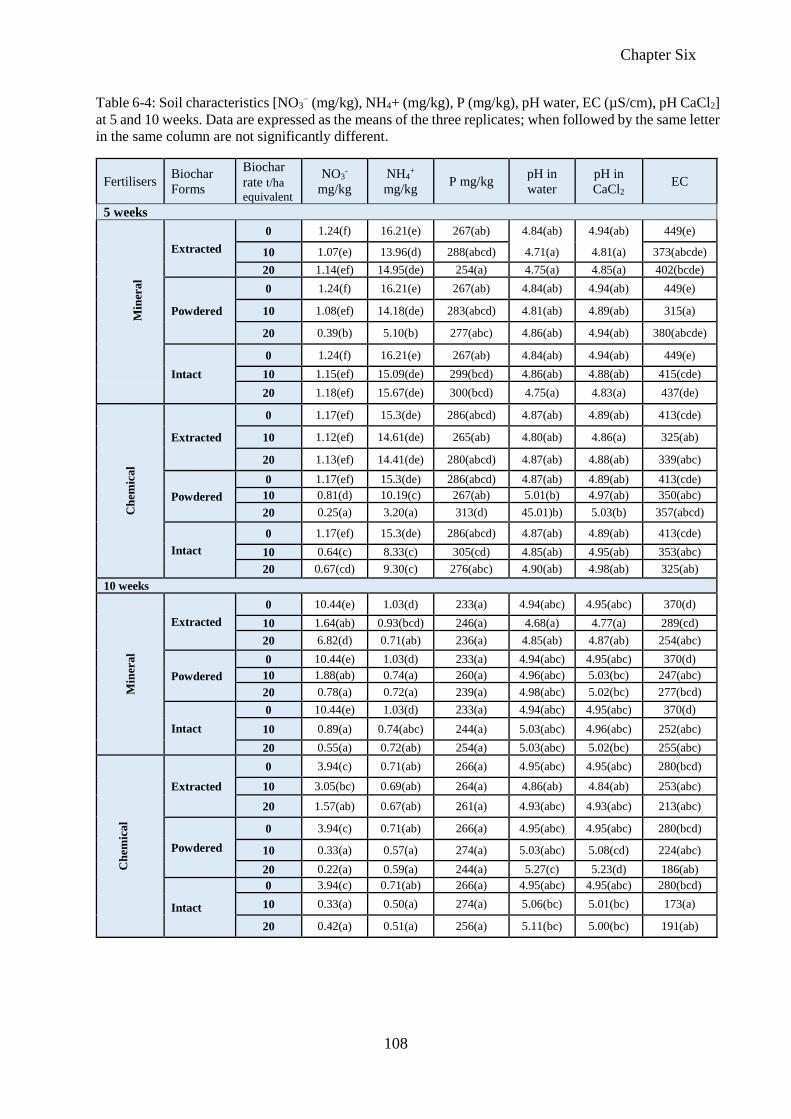
Chapter Six
108
Table 6-4: Soil characteristics [NO3− (mg/kg), NH4+ (mg/kg), P (mg/kg), pH water, EC (µS/cm), pH CaCl2]
at 5 and 10 weeks. Data are expressed as the means of the three replicates; when followed by the same letter
in the same column are not significantly different.
Fertilisers Biochar
Forms
Biochar
rate t/ha
equivalent
NO3-
mg/kg
NH4+
mg/kg P mg/kg
pH in
water
pH in
CaCl2 EC
5 weeks
Min
era
l
Extracted
0 1.24(f) 16.21(e) 267(ab) 4.84(ab) 4.94(ab) 449(e)
10 1.07(e) 13.96(d) 288(abcd) 4.71(a) 4.81(a) 373(abcde)
20 1.14(ef) 14.95(de) 254(a) 4.75(a) 4.85(a) 402(bcde)
Powdered
0 1.24(f) 16.21(e) 267(ab) 4.84(ab) 4.94(ab) 449(e)
10 1.08(ef) 14.18(de) 283(abcd) 4.81(ab) 4.89(ab) 315(a)
20 0.39(b) 5.10(b) 277(abc) 4.86(ab) 4.94(ab) 380(abcde)
Intact
0 1.24(f) 16.21(e) 267(ab) 4.84(ab) 4.94(ab) 449(e)
10 1.15(ef) 15.09(de) 299(bcd) 4.86(ab) 4.88(ab) 415(cde)
20 1.18(ef) 15.67(de) 300(bcd) 4.75(a) 4.83(a) 437(de)
Ch
emic
al
Extracted
0 1.17(ef) 15.3(de) 286(abcd) 4.87(ab) 4.89(ab) 413(cde)
10 1.12(ef) 14.61(de) 265(ab) 4.80(ab) 4.86(a) 325(ab)
20 1.13(ef) 14.41(de) 280(abcd) 4.87(ab) 4.88(ab) 339(abc)
Powdered
0 1.17(ef) 15.3(de) 286(abcd) 4.87(ab) 4.89(ab) 413(cde)
10 0.81(d) 10.19(c) 267(ab) 5.01(b) 4.97(ab) 350(abc)
20 0.25(a) 3.20(a) 313(d) 45.01)b) 5.03(b) 357(abcd)
Intact
0 1.17(ef) 15.3(de) 286(abcd) 4.87(ab) 4.89(ab) 413(cde)
10 0.64(c) 8.33(c) 305(cd) 4.85(ab) 4.95(ab) 353(abc)
20 0.67(cd) 9.30(c) 276(abc) 4.90(ab) 4.98(ab) 325(ab)
10 weeks
Min
era
l
Extracted
0 10.44(e) 1.03(d) 233(a) 4.94(abc) 4.95(abc) 370(d)
10 1.64(ab) 0.93(bcd) 246(a) 4.68(a) 4.77(a) 289(cd)
20 6.82(d) 0.71(ab) 236(a) 4.85(ab) 4.87(ab) 254(abc)
Powdered
0 10.44(e) 1.03(d) 233(a) 4.94(abc) 4.95(abc) 370(d)
10 1.88(ab) 0.74(a) 260(a) 4.96(abc) 5.03(bc) 247(abc)
20 0.78(a) 0.72(a) 239(a) 4.98(abc) 5.02(bc) 277(bcd)
Intact
0 10.44(e) 1.03(d) 233(a) 4.94(abc) 4.95(abc) 370(d)
10 0.89(a) 0.74(abc) 244(a) 5.03(abc) 4.96(abc) 252(abc)
20 0.55(a) 0.72(ab) 254(a) 5.03(abc) 5.02(bc) 255(abc)
Ch
emic
al
Extracted
0 3.94(c) 0.71(ab) 266(a) 4.95(abc) 4.95(abc) 280(bcd)
10 3.05(bc) 0.69(ab) 264(a) 4.86(ab) 4.84(ab) 253(abc)
20 1.57(ab) 0.67(ab) 261(a) 4.93(abc) 4.93(abc) 213(abc)
Powdered
0 3.94(c) 0.71(ab) 266(a) 4.95(abc) 4.95(abc) 280(bcd)
10 0.33(a) 0.57(a) 274(a) 5.03(abc) 5.08(cd) 224(abc)
20 0.22(a) 0.59(a) 244(a) 5.27(c) 5.23(d) 186(ab)
Intact
0 3.94(c) 0.71(ab) 266(a) 4.95(abc) 4.95(abc) 280(bcd)
10 0.33(a) 0.50(a) 274(a) 5.06(bc) 5.01(bc) 173(a)
20 0.42(a) 0.51(a) 256(a) 5.11(bc) 5.00(bc) 191(ab)
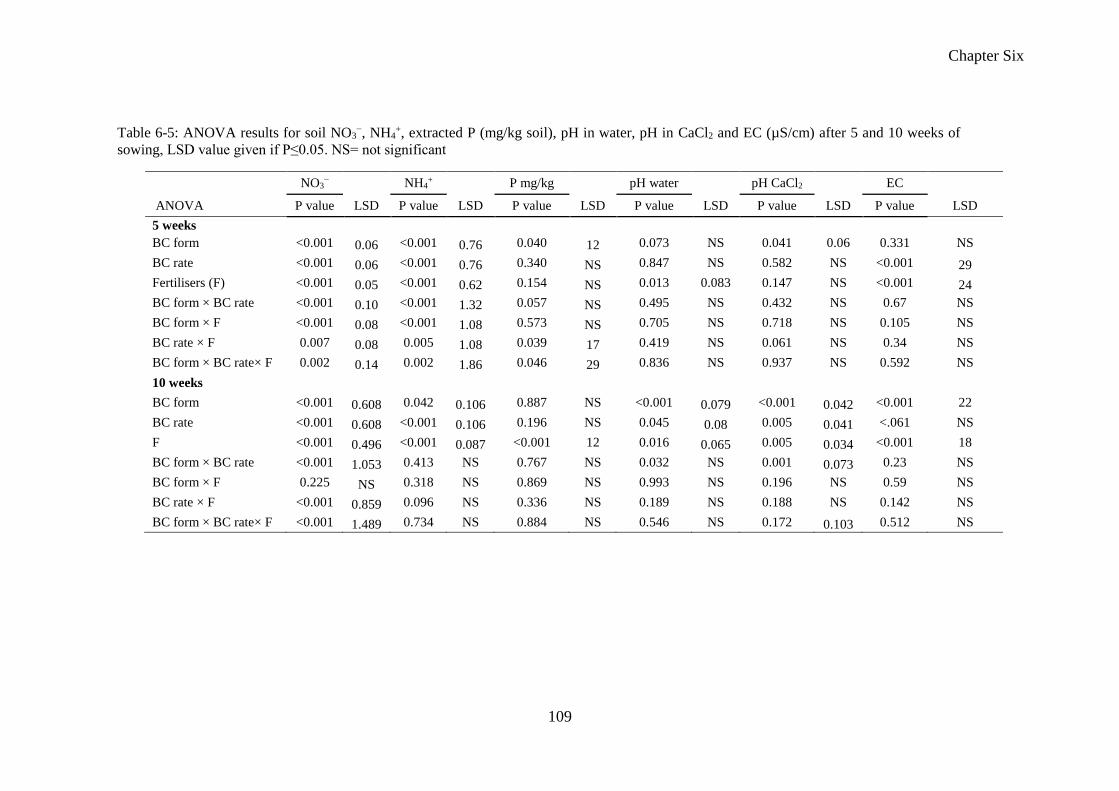
Chapter Six
109
Table 6-5: ANOVA results for soil NO3−, NH4
+, extracted P (mg/kg soil), pH in water, pH in CaCl2 and EC (µS/cm) after 5 and 10 weeks of
sowing, LSD value given if P≤0.05. NS= not significant
NO3− NH4
+ P mg/kg pH water pH CaCl2 EC
ANOVA P value LSD P value LSD P value LSD P value LSD P value LSD P value LSD
5 weeks
BC form <0.001 0.06 <0.001 0.76 0.040 12 0.073 NS 0.041 0.06 0.331 NS
BC rate <0.001 0.06 <0.001 0.76 0.340 NS 0.847 NS 0.582 NS <0.001 29
Fertilisers (F) <0.001 0.05 <0.001 0.62 0.154 NS 0.013 0.083 0.147 NS <0.001 24
BC form × BC rate <0.001 0.10 <0.001 1.32 0.057 NS 0.495 NS 0.432 NS 0.67 NS
BC form × F <0.001 0.08 <0.001 1.08 0.573 NS 0.705 NS 0.718 NS 0.105 NS
BC rate × F 0.007 0.08 0.005 1.08 0.039 17 0.419 NS 0.061 NS 0.34 NS
BC form × BC rate× F 0.002 0.14 0.002 1.86 0.046 29 0.836 NS 0.937 NS 0.592 NS
10 weeks
BC form <0.001 0.608 0.042 0.106 0.887 NS <0.001 0.079 <0.001 0.042 <0.001 22
BC rate <0.001 0.608 <0.001 0.106 0.196 NS 0.045 0.08 0.005 0.041 <.061 NS
F <0.001 0.496 <0.001 0.087 <0.001 12 0.016 0.065 0.005 0.034 <0.001 18
BC form × BC rate <0.001 1.053 0.413 NS 0.767 NS 0.032 NS 0.001 0.073 0.23 NS
BC form × F 0.225 NS 0.318 NS 0.869 NS 0.993 NS 0.196 NS 0.59 NS
BC rate × F <0.001 0.859 0.096 NS 0.336 NS 0.189 NS 0.188 NS 0.142 NS
BC form × BC rate× F <0.001 1.489 0.734 NS 0.884 NS 0.546 NS 0.172 0.103 0.512 NS
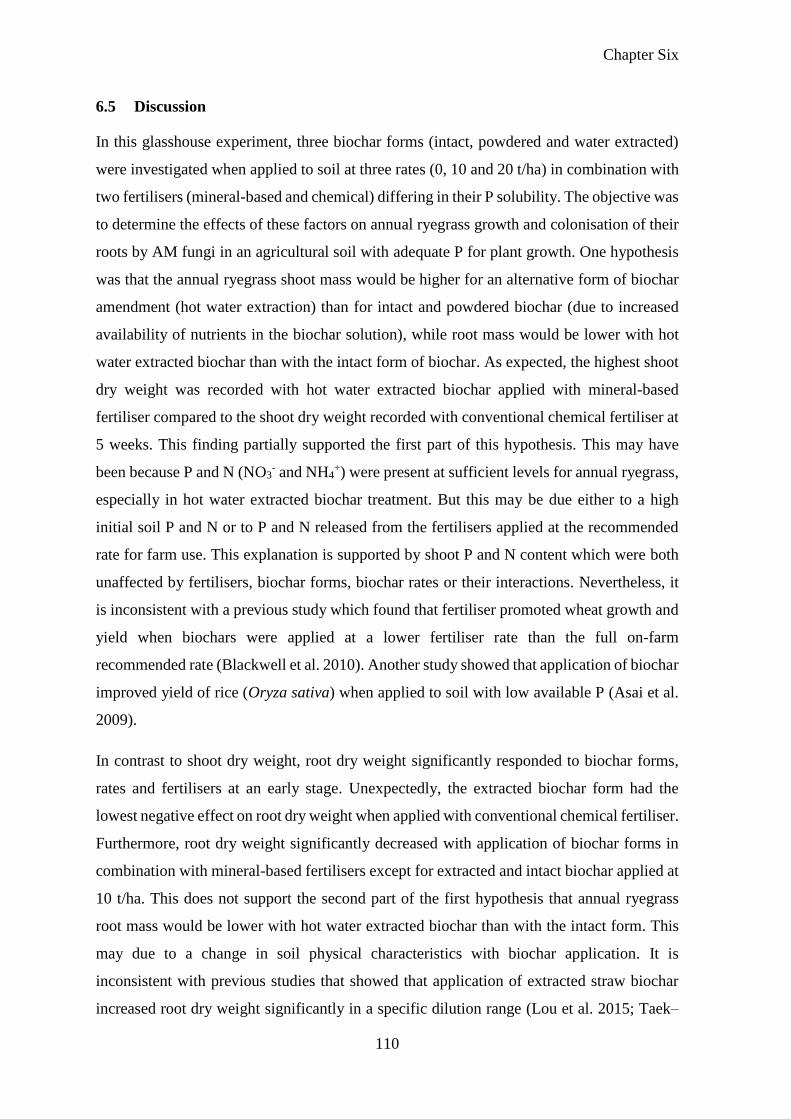
Chapter Six
110
6.5 Discussion
In this glasshouse experiment, three biochar forms (intact, powdered and water extracted)
were investigated when applied to soil at three rates (0, 10 and 20 t/ha) in combination with
two fertilisers (mineral-based and chemical) differing in their P solubility. The objective was
to determine the effects of these factors on annual ryegrass growth and colonisation of their
roots by AM fungi in an agricultural soil with adequate P for plant growth. One hypothesis
was that the annual ryegrass shoot mass would be higher for an alternative form of biochar
amendment (hot water extraction) than for intact and powdered biochar (due to increased
availability of nutrients in the biochar solution), while root mass would be lower with hot
water extracted biochar than with the intact form of biochar. As expected, the highest shoot
dry weight was recorded with hot water extracted biochar applied with mineral-based
fertiliser compared to the shoot dry weight recorded with conventional chemical fertiliser at
5 weeks. This finding partially supported the first part of this hypothesis. This may have
been because P and N (NO3- and NH4
+) were present at sufficient levels for annual ryegrass,
especially in hot water extracted biochar treatment. But this may be due either to a high
initial soil P and N or to P and N released from the fertilisers applied at the recommended
rate for farm use. This explanation is supported by shoot P and N content which were both
unaffected by fertilisers, biochar forms, biochar rates or their interactions. Nevertheless, it
is inconsistent with a previous study which found that fertiliser promoted wheat growth and
yield when biochars were applied at a lower fertiliser rate than the full on-farm
recommended rate (Blackwell et al. 2010). Another study showed that application of biochar
improved yield of rice (Oryza sativa) when applied to soil with low available P (Asai et al.
2009).
In contrast to shoot dry weight, root dry weight significantly responded to biochar forms,
rates and fertilisers at an early stage. Unexpectedly, the extracted biochar form had the
lowest negative effect on root dry weight when applied with conventional chemical fertiliser.
Furthermore, root dry weight significantly decreased with application of biochar forms in
combination with mineral-based fertilisers except for extracted and intact biochar applied at
10 t/ha. This does not support the second part of the first hypothesis that annual ryegrass
root mass would be lower with hot water extracted biochar than with the intact form. This
may due to a change in soil physical characteristics with biochar application. It is
inconsistent with previous studies that showed that application of extracted straw biochar
increased root dry weight significantly in a specific dilution range (Lou et al. 2015; Taek–
Chapter Six
111
Keun et al. 2012). Biochar applied at the higher rate of 20 t/ha significantly decreased the
root dry weight at the early stage of plant growth. A reduction in root dry weight can be due
to unwanted compounds available in biochars that inhibit root growth especially when
applied at higher rates (Garnett et al. 2004; Hille and Den Ouden 2005). This is consistent
with that of Solaiman et al. (2012) where an application of some biochars at high rates
inhibited the seed germination and root growth of wheat.
For mycorrhizal colonisation, both root colonisation (%) and root length colonised (m/pot)
were significantly affected by the application of biochar forms and fertilisers. All biochar
forms significantly deceased mycorrhizal colonisation (%) at 5 weeks when combined with
the chemical fertiliser. In contrast, application of intact biochar significantly increased the
colonisation (%) with mineral–based fertiliser. With regards to mineral fertiliser, the the
second hypothesis was partially supported; that is, the negative effect of hot water extracted
biochar was greater on AM fungi colonisation especially in the early stage of the study while
intact biochar increased root colonisation (%). The reduction in root colonisation at the early
stage of plant growth with chemical fertiliser may be due to the rapid nutrient release to soil
that increased the nutrient pool. This study differs from a previous study which showed that
the application of different kinds of biochars significantly decreased colonisation of roots
by AM fungi at higher biochar rates (Warnock et al. 2010). In the same study, application
of lower rates of biochars did not significantly alter AM fungal colonisation.
Another explanation for the reduction in AM fungal colonisation observed here is that
biochars may contain organic pyrolytic by-products such as phenolics and polyphenolics
that act as inhibitors of soil microorganisms, including AM fungi. The concentration of such
inhibitor compounds may vary with the material from which biochar is generated and with
the pyrolysis temperature (Antal and Grønli 2003; Gundale and DeLuca 2006). The effect
of these inhibitor compounds may further differ in their effect on AM fungal colonisation
depending on the biochar pyrolysis temperature (Warnock et al. 2010). In the present study,
the release of inhibitor substances to soil may vary with biochar form (but this was not
measured) and inhibition may have been higher in the early stage of plant growth.
At the late stage of plant growth, there was slight increase in AM fungal root colonisation
compared to the early stage. Root colonisation with intact biochar was higher than for other
biochar forms. This was expected as the available nutrients in soil decreased in the later
stage. Soil available N and extracted P decreased at 10 weeks (Table 6.4) compared to 5
weeks harvest. However, this inconsistent with previous studies which showed a negative
Chapter Six
112
effect of P and N enrichment on AM functioning in crops and pastures (Bradley et al. 2006;
Nielsen et al. 1998; Vejsadová et al. 1990). Another explanation for the increase in AM
fungal colonisation at the later harvest is that there may have been a decline in release of
inhibitors from biochar into the soil over time.
6.6 Conclusion
Under P-adequate conditions in soil, AM fungal root colonisation varied in response to
application of different forms and rates of biohar when applied to soil in combination with
mineral and chemical fertilisers, and varied with pasture growth. Both fertilisers and biochar
forms significantly affected mycorrhizal colonisation (%) and root length colonised (m/pot)
during the early stage of plant growth. In contrast, the influence of the conventional chemical
and mineral-based fertilisers on AM root colonisation was similar at the later stage in plant
growth. Further studies in different soils which vary in nutrient concentrations are needed to
fully understand these effects. Use of alternative biochar forms in combination with mineral-
based fertiliser may have potential to promote pasture growth without detrimental effects on
mycorrhizas. Consequently, use of biochar in combination with a lower rate of mineral-
based fertiliser could increase the efficiency of fertiliser use reduce the use of fertiliser.
Chapter Seven
113
7 CHAPTER 7
Evaluation of the residual effect of long-term application of lime and
phosphorus on mycorrhizal fungi and ryegrass growth
7.1 Abstract
Soil acidity is one of the major problems negatively affecting crop production worldwide.
Soil acidity results from the phytotoxicity of some of soil elements such as aluminium (Al3+),
manganese (Mn2+), and hydrogen (H+) ions in addition to nutrient deficiency. In order to
improve soil fertility, lime application has been widely used to alleviate soil acidity by
reducing Al3+ and Mn2+ phytotoxicity and improving the availability of some soil nutrient
such as phosphorus (P). However, lime applied at high rates may also reduce the availability
of soil P and this can be offset by combining application of lime with P fertiliser. The
combination of lime and P-based fertiliser has widely been used to promote plant growth by
increasing the availability of soil nutrients and influencing soil microorganisms. This study
investigated the residual effect of five years of application of lime and P on arbuscular
mycorrhizal (AM) fungi in addition to the effect on ryegrass growth. A glasshouse
experiment was established using an agricultural soil from a field trial with a history of
application of two lime treatments (Nil and 2.0+2.5 t/ha) and four P treatments (nil, 9, 18,
36 kg/ha P). Plants were harvested at 10 and 24 weeks after sowing. Initially, there was only
a positive affect shoot and root dry weight at the highest rate of P application. Although
there was a significant change in soil pH, lime and P residue did not affect root colonisation
(%) by AM fungi while available P significantly increased root length colonised (m/pot).
Subsequently, neither P nor lime residue affected shoot dry weight where residual P but not
lime affected root colonisation (%), decreasing it significantly without influencing root
length colonised (m/pot). The relative abundance of AM fungi in the family Glomeraceae
was significantly higher in roots of plants growing in limed soils than in soil receiving no
lime, regardless P rate. In contrast, only lime residue had a negative effect on the relative
abundance of AM fungi in the family Gigasporaceae while those in the family
Acaulosporaceae did not change with either lime or P residue. The AM fungal OTU richness
in roots was affected by P but not by lime residue, and in general, the richness of OTUs was
higher for soil receiving P compared with the nil treatment. Only P residue corresponded
Chapter Seven
114
with changes in inverse Simpson and Fisher indexes. Colonisation of roots by AM fungi
varied depending on the sensitivity of AM fungal families to the change with soil pH.
7.2 Introduction
Soil acidity, one of the most important and complicated agricultural constraints, can cause
losses in plant production. Soil acidity can also lead to plant nutrient deficiencies and
toxicity, inhibition of some of the beneficial microorganisms, and alterations in plant root
structure and growth which limit absorption of water and nutrients (Fageria and Baligar
2003). Some soil amendments have potential to improve pasture growth as well as
improving soil fertility, especially soil pH which can control nutrient availability. In the last
three decades, use of lime for soil restoration has been widely used (Lundström et al. 2003).
Lime application has potential to increase soil pH and base cations (calcium and magnesium)
as well as decreasing soil toxicity caused by heavy metals (Ingerslev 1997; Zezschwitz
1998). Lime has also been shown to influence the dynamics of dissolved of organic carbon
(C), and this, in turn, can modify soil organic matter composition (Zezschwitz 1998). All
the changes in soil chemical properties mentioned above may modify plant root system and
soil microbial communities and activities.
Long-term acidification and heavy metals toxicity can influence the ecosystem functioning
and soil microbial communities which are essential for nutrient availability and soil-plant
health. Previously, it has been reported an increase in soil acidity can reduce both the number
and the size of bacterial cells (Baath et al. 1980) and change the recycling of nutrients
(Francis 1982). Previous studies have shown that soils untreated with lime can have lower
microbial activity compared to soil treated with lime, and application of lime can increase
soil microbial respiration and nitrogen (N) recycling (Badalucco et al. 1992; Illmer and
Schinner 1991; Shah et al. 1990; Smolander and Mälkönen 1994). Xue et al. (2010) reported
that when phospholipid fatty acid (PLFA) analysis was used, the structural diversity index
of the soil microbial community increased significantly by applying lime at several rates in
tea orchards. With regards to arbuscular mycorrhizal (AM) fungi, Newbould and Rangeley
(1984) reported that application of lime and phosphorus (P) increased the effectiveness of
AM fungal inoculation and root colonisation (%) of white clover doubled. Meanwhile,
Kucey and Gamal Eldin (1984) demonstrated that applying P and lime decreased root
Chapter Seven
115
colonisation by indigenous AM fungi in alfalfa at the highest pH level when AM fungi were
added as inoculum.
Previous studies have shown different effects of lime application on soil microorganisms
when combined with P. Raznikiewicz et al. (1994) demonstrated that application of lime
had an adverse effect on the number of AM fungal spores when pH increased by one unit in
a Sweden grassland, while in contrast, application of lime increased AM fungal colonisation
of barley roots (Hamel et al. 1996). Moreover, Newbould and Rangeley (1984) found that
application of lime and P promoted nodulation and an increase in colonisation of white
clover by 200% under field conditions.
This study was designed to determine the long-term effect of combined application of P and
lime on AM fungi in annual ryegrass in relation to shoot and root growth. The research was
conducted in a glasshouse experiment using an agricultural soil that had received lime and
P at different rates for five years in the field. The hypotheses of this study were (i) AM fungal
root colonisation will be higher for soils which had received lime, and a reduction in
colonisation will be higher in soils receiving P in combination with lime, and (ii) P and lime
residues will have different effects on the relative abundance of families of AM fungi
depending on P rates.
7.3 Material and methods
Soil sampling and the experimental design
The field trial was established on a farm at Dewars Pool Road, Bindoon about 5km east on
the Great Northern Highway, WA in 2010. The property is owned by the Bindoon
Agricultural College. The site was a forest gravel. Plant rotations in the trial were:
subterranean clover pasture in 2010-2011, wheat in 2012, canola in 2013, wheat in 2014,
and canola in 2015.
The soil was collected from the field site based on the lime and P treatments. The glasshouse
experiment was established in May 2016, and field collected soil samples from each
replicate of each treatment (without sieving) were used to fill 3 kg capacity pots. The history
of application of lime and P from 2010 to 2015 is listed in Table 7-1. The treatments applied
in the field trial were: two lime levels (i) Nil and (ii) 2.0+2.5 t/ha; four rates of P (i) the
commercial fertiliser ‘Big Phos’ applied at 9 kg/ha P annually, (ii) the commercial P
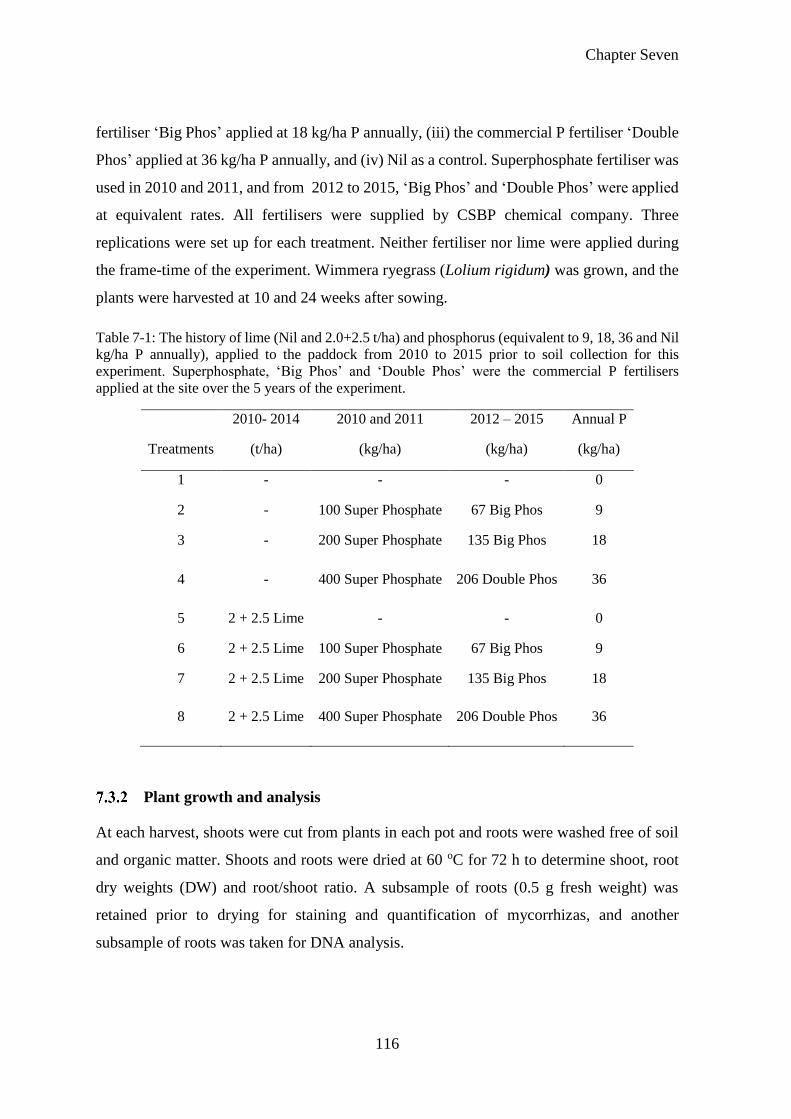
Chapter Seven
116
fertiliser ‘Big Phos’ applied at 18 kg/ha P annually, (iii) the commercial P fertiliser ‘Double
Phos’ applied at 36 kg/ha P annually, and (iv) Nil as a control. Superphosphate fertiliser was
used in 2010 and 2011, and from 2012 to 2015, ‘Big Phos’ and ‘Double Phos’ were applied
at equivalent rates. All fertilisers were supplied by CSBP chemical company. Three
replications were set up for each treatment. Neither fertiliser nor lime were applied during
the frame-time of the experiment. Wimmera ryegrass (Lolium rigidum) was grown, and the
plants were harvested at 10 and 24 weeks after sowing.
Table 7-1: The history of lime (Nil and 2.0+2.5 t/ha) and phosphorus (equivalent to 9, 18, 36 and Nil
kg/ha P annually), applied to the paddock from 2010 to 2015 prior to soil collection for this
experiment. Superphosphate, ‘Big Phos’ and ‘Double Phos’ were the commercial P fertilisers
applied at the site over the 5 years of the experiment.
2010- 2014 2010 and 2011 2012 – 2015 Annual P
Treatments (t/ha) (kg/ha) (kg/ha) (kg/ha)
1 - - - 0
2 - 100 Super Phosphate 67 Big Phos 9
3 - 200 Super Phosphate 135 Big Phos 18
4 - 400 Super Phosphate 206 Double Phos 36
5 2 + 2.5 Lime - - 0
6 2 + 2.5 Lime 100 Super Phosphate 67 Big Phos 9
7 2 + 2.5 Lime 200 Super Phosphate 135 Big Phos 18
8 2 + 2.5 Lime 400 Super Phosphate 206 Double Phos 36
Plant growth and analysis
At each harvest, shoots were cut from plants in each pot and roots were washed free of soil
and organic matter. Shoots and roots were dried at 60 oC for 72 h to determine shoot, root
dry weights (DW) and root/shoot ratio. A subsample of roots (0.5 g fresh weight) was
retained prior to drying for staining and quantification of mycorrhizas, and another
subsample of roots was taken for DNA analysis.
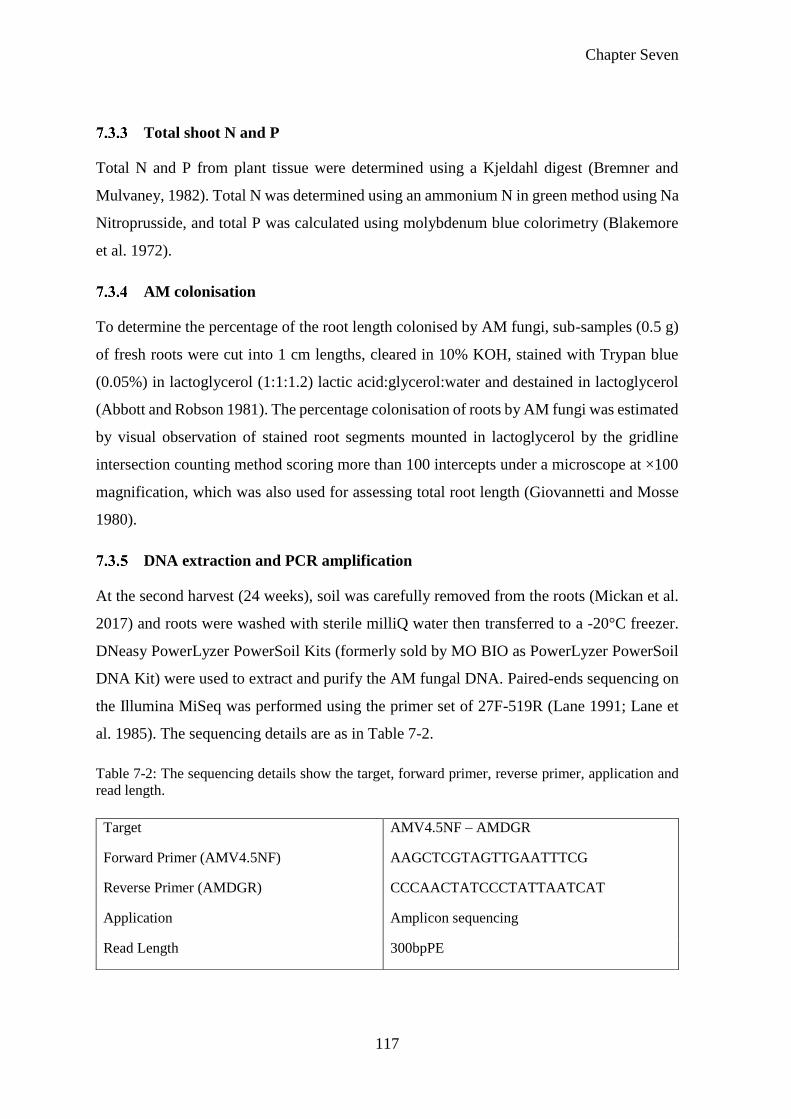
Chapter Seven
117
Total shoot N and P
Total N and P from plant tissue were determined using a Kjeldahl digest (Bremner and
Mulvaney, 1982). Total N was determined using an ammonium N in green method using Na
Nitroprusside, and total P was calculated using molybdenum blue colorimetry (Blakemore
et al. 1972).
AM colonisation
To determine the percentage of the root length colonised by AM fungi, sub-samples (0.5 g)
of fresh roots were cut into 1 cm lengths, cleared in 10% KOH, stained with Trypan blue
(0.05%) in lactoglycerol (1:1:1.2) lactic acid:glycerol:water and destained in lactoglycerol
(Abbott and Robson 1981). The percentage colonisation of roots by AM fungi was estimated
by visual observation of stained root segments mounted in lactoglycerol by the gridline
intersection counting method scoring more than 100 intercepts under a microscope at ×100
magnification, which was also used for assessing total root length (Giovannetti and Mosse
1980).
DNA extraction and PCR amplification
At the second harvest (24 weeks), soil was carefully removed from the roots (Mickan et al.
2017) and roots were washed with sterile milliQ water then transferred to a -20°C freezer.
DNeasy PowerLyzer PowerSoil Kits (formerly sold by MO BIO as PowerLyzer PowerSoil
DNA Kit) were used to extract and purify the AM fungal DNA. Paired-ends sequencing on
the Illumina MiSeq was performed using the primer set of 27F-519R (Lane 1991; Lane et
al. 1985). The sequencing details are as in Table 7-2.
Table 7-2: The sequencing details show the target, forward primer, reverse primer, application and
read length.
Target AMV4.5NF – AMDGR
Forward Primer (AMV4.5NF) AAGCTCGTAGTTGAATTTCG
Reverse Primer (AMDGR) CCCAACTATCCCTATTAATCAT
Application Amplicon sequencing
Read Length 300bpPE
Chapter Seven
118
Bioinformatics method
Paired-ends reads were assembled by aligning the forward and reverse reads using PEAR1
(version 0.9.5). Primers were identified and trimmed. Trimmed sequences were processed
using Quantitative Insights into Microbial Ecology (QIIME 1.8)4 USEARCH2,3 (version
8.0.1623) and UPARSE software. Using usearch tools, sequences were quality filtered, full
length duplicate sequences were removed and sorted by abundance. Singletons or unique
reads in the data set were discarded. Sequences were clustered followed by chimera filtered
using “Unite” database as reference. To obtain number of reads of each OTU, reads were
mapped back to OTUs with a minimum identity of 97%. QIIME taxonomy was used to
assigned Unite database5 (Unite Version7.2 Dated: 28.06.2017).
Soil analysis
For soil chemical characteristics, soil samples were passed through a 2 mm sieve and
prepared for soil analysis including available nutrients (Mulvaney 1996). The soil was dried
at 105 °C for 72 h prior to determining soil moisture. For extractable P, the air-dried soil
was extracted in 0.5 M sodium bicarbonate solution at pH 8.5 using the colorimetric methods
(Colwell 1963). Soils were air-dried prior to measuring soil pH and EC. To determine pH
and EC in water, 5 g of air-dried soil was suspended in 25 mL deionised water (1:5) and
shaken for one hour. For pH in CaCl2, 5 g of air-dried soil was suspended in 0.01 M of CaCl2
(Rayment and Higginson 1992).
Soil respiration
For soil respiration, fresh soil was passed through 2 mm sieve to remove large roots and 50g
soils were placed into 120 mL plastic tubes and sealed with parafilm and put in 1 L jar with
a rubber stopper. The soil moisture was maintained at 40% of the field capacity by adding
water. Soil was incubated at 25 ºC for 14 days. The CO2 respired was measured at 3, 7, 10
and 14 days (Matthias et al. 1980; Mariko et al. 2000).
Data and statistical analyses
Genstat (GenStat V.12.1) ANOVA (Two-way Design) tables were used to examine annual
ryegrass dry weights, total and available nutrient concentrations, AM fungal colonisation
(%) and length of root colonised (m/pot). Treatment means were compared using least
significant differences (LSD) at P ≤ 0.05. A nonmetric multidimensional scaling (NMDS)
Chapter Seven
119
plot was used to visualise community separation by treatments, and dispersion ellipses
representing one standard deviation within treatments were calculating using betadisper, and
an additional PERMANOVA was used to verify AMOVA using the function Adonis in
Vegan. The analyses were performed using R version 3.4.3 (R Core Development Team,
Austria, 2017) and Vegan version 2.3.0 (Oksanen et al. 2007) and GenStat V.12.1.
7.4 Results
Plant growth
At the first harvest, residual P had a significant effect on shoot dry weight but neither lime
nor the interaction between lime and P affected shoot dry weight (Table 7-3). The highest
shoot dry weight (p≤0.05; 1.627 g) was recorded with lime applied at 36 kg/ha P compared
to 0.452 g for the control (nil×nil) treatment (Figure 7-1a). At the second harvest, neither
lime nor P influenced shoot dry weight (Figure 7-1a).
Neither the residue of lime nor any interaction between the residue of lime and P affected
root dry weight at 10 weeks, but application of P altered on root dry weight (Figure 7-1b).
The highest root dry weight (P≤0.05; 1.39 g/pot) was recorded when lime was added with
36 kg/ha P compared to the control (nil×nil) treatment (0.29 g/pot). Meanwhile, at 24 weeks,
only lime treatments influenced root dry weight. The highest root dry weight (p≤0.05; 7.70
g/pot) was recorded for lime + P (2.0+2.5 t/ha ×nil) compared to the control (nil×nil) (4.06
g/pot). Root/shoot ratio did not respond to lime or P application at either 10 and 24 weeks
(Table 7-1).
AM colonisation
AM fungal root colonisation significantly responded to P application only at the early stage
of plant growth (10 weeks), while the residue of lime and the interaction between lime × P
had no effect (Figure 7-2). All P rates significantly decreased the colonisation (%) and the
lowest (P≤0.05; 27%) was recorded for soil that received no lime with P applied at the rate
of 18 kg/ha P compared to root colonisation (%) recorded in the nil×nil treatment (P≤0.05;
39%). At the later harvest (24 weeks), only the P treatments had a significant effect on root
colonisation (%) (Figure 7-2; Table 7-3).
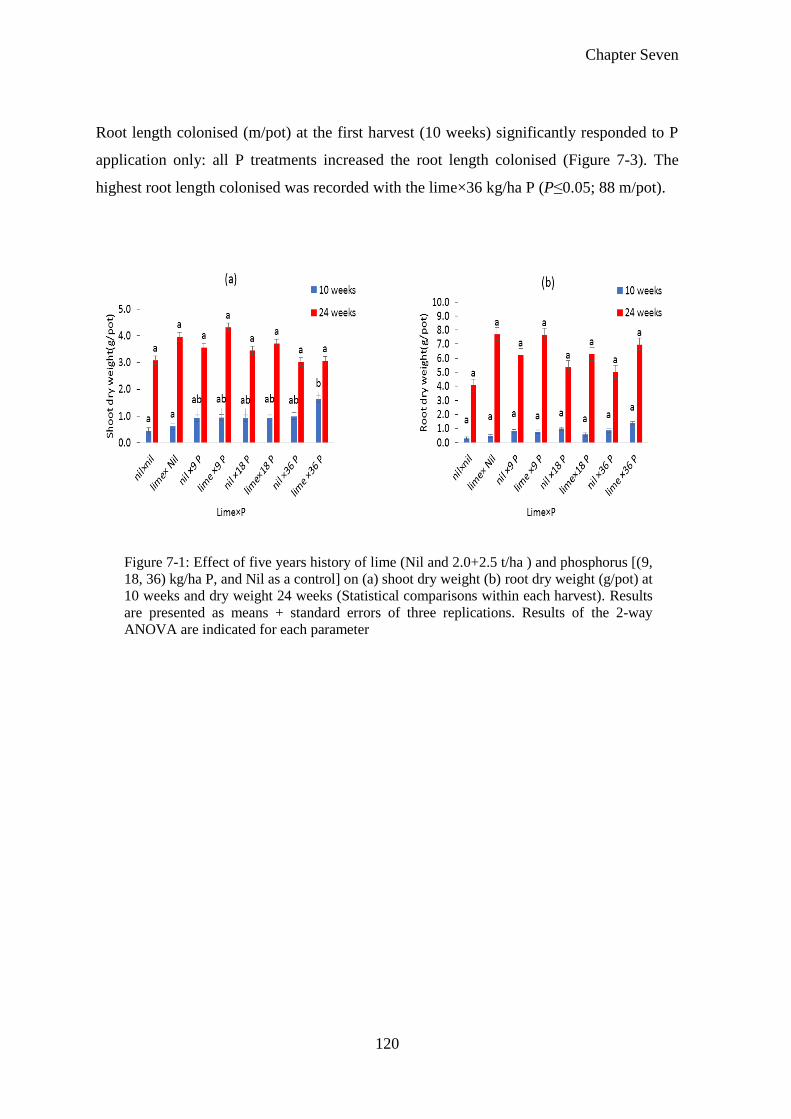
Chapter Seven
120
Root length colonised (m/pot) at the first harvest (10 weeks) significantly responded to P
application only: all P treatments increased the root length colonised (Figure 7-3). The
highest root length colonised was recorded with the lime×36 kg/ha P (P≤0.05; 88 m/pot).
Figure 7-1: Effect of five years history of lime (Nil and 2.0+2.5 t/ha ) and phosphorus [(9,
18, 36) kg/ha P, and Nil as a control] on (a) shoot dry weight (b) root dry weight (g/pot) at
10 weeks and dry weight 24 weeks (Statistical comparisons within each harvest). Results
are presented as means + standard errors of three replications. Results of the 2-way
ANOVA are indicated for each parameter
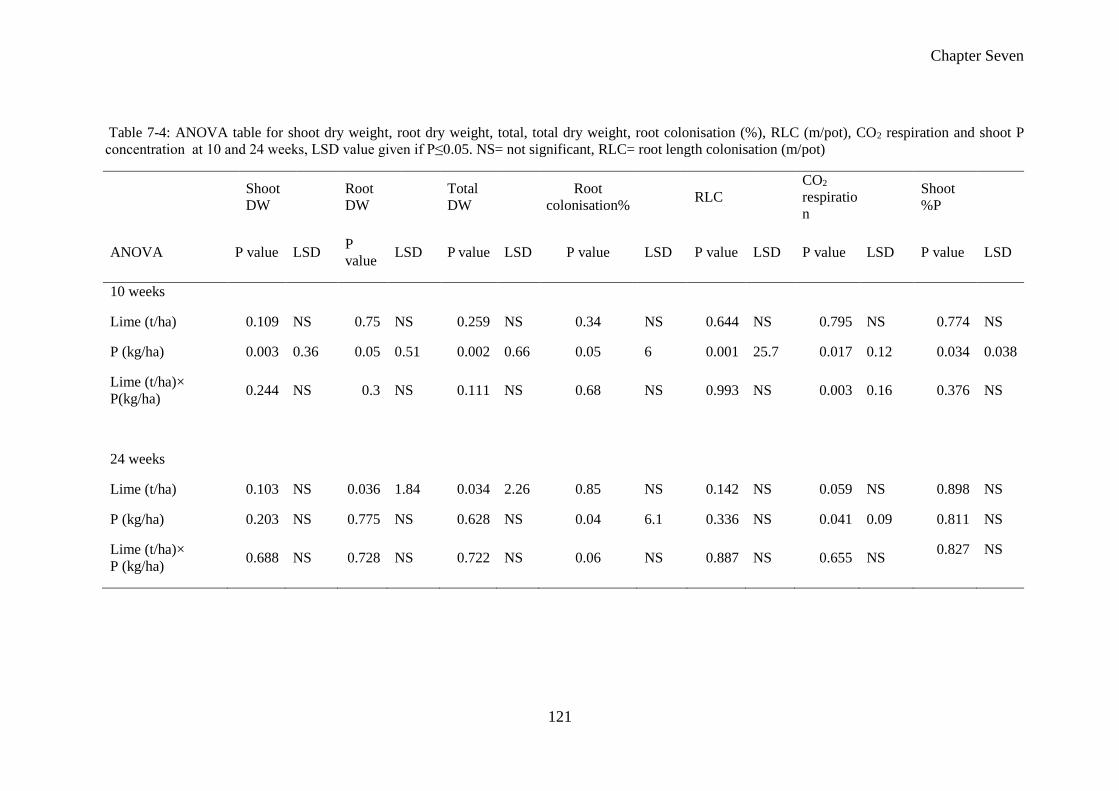
Chapter Seven
121
Table 7-4: ANOVA table for shoot dry weight, root dry weight, total, total dry weight, root colonisation (%), RLC (m/pot), CO2 respiration and shoot P
concentration at 10 and 24 weeks, LSD value given if P≤0.05. NS= not significant, RLC= root length colonisation (m/pot)
Shoot
DW
Root
DW
Total
DW
Root
colonisation%
RLC
CO2
respiratio
n
Shoot
%P
ANOVA P value LSD P
value LSD P value LSD P value LSD P value LSD P value LSD P value LSD
10 weeks
Lime (t/ha) 0.109 NS 0.75 NS 0.259 NS 0.34 NS 0.644 NS 0.795 NS 0.774 NS
P (kg/ha) 0.003 0.36 0.05 0.51 0.002 0.66 0.05 6 0.001 25.7 0.017 0.12 0.034 0.038
Lime (t/ha)×
P(kg/ha) 0.244 NS 0.3 NS 0.111 NS 0.68 NS 0.993 NS 0.003 0.16 0.376 NS
24 weeks
Lime (t/ha) 0.103 NS 0.036 1.84 0.034 2.26 0.85 NS 0.142 NS 0.059 NS 0.898 NS
P (kg/ha) 0.203 NS 0.775 NS 0.628 NS 0.04 6.1 0.336 NS 0.041 0.09 0.811 NS
Lime (t/ha)×
P (kg/ha) 0.688 NS 0.728 NS 0.722 NS 0.06 NS 0.887 NS 0.655 NS
0.827 NS
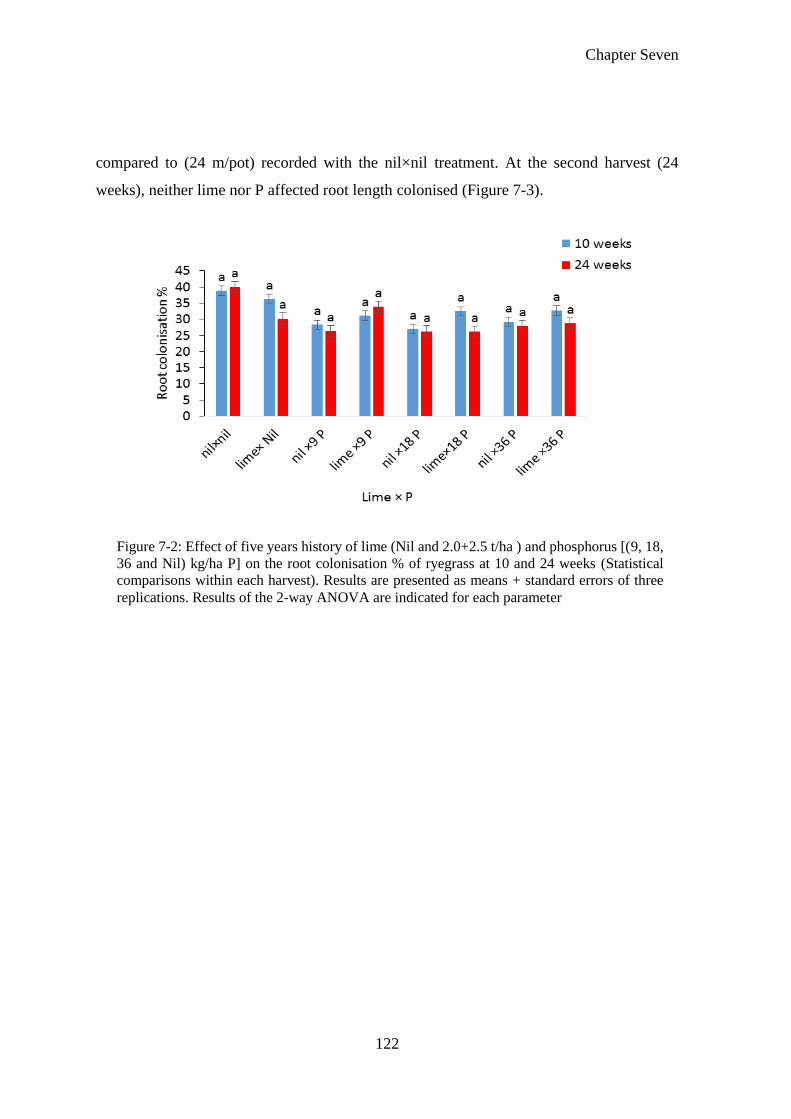
Chapter Seven
122
compared to (24 m/pot) recorded with the nil×nil treatment. At the second harvest (24
weeks), neither lime nor P affected root length colonised (Figure 7-3).
Figure 7-2: Effect of five years history of lime (Nil and 2.0+2.5 t/ha ) and phosphorus [(9, 18,
36 and Nil) kg/ha P] on the root colonisation % of ryegrass at 10 and 24 weeks (Statistical
comparisons within each harvest). Results are presented as means + standard errors of three
replications. Results of the 2-way ANOVA are indicated for each parameter
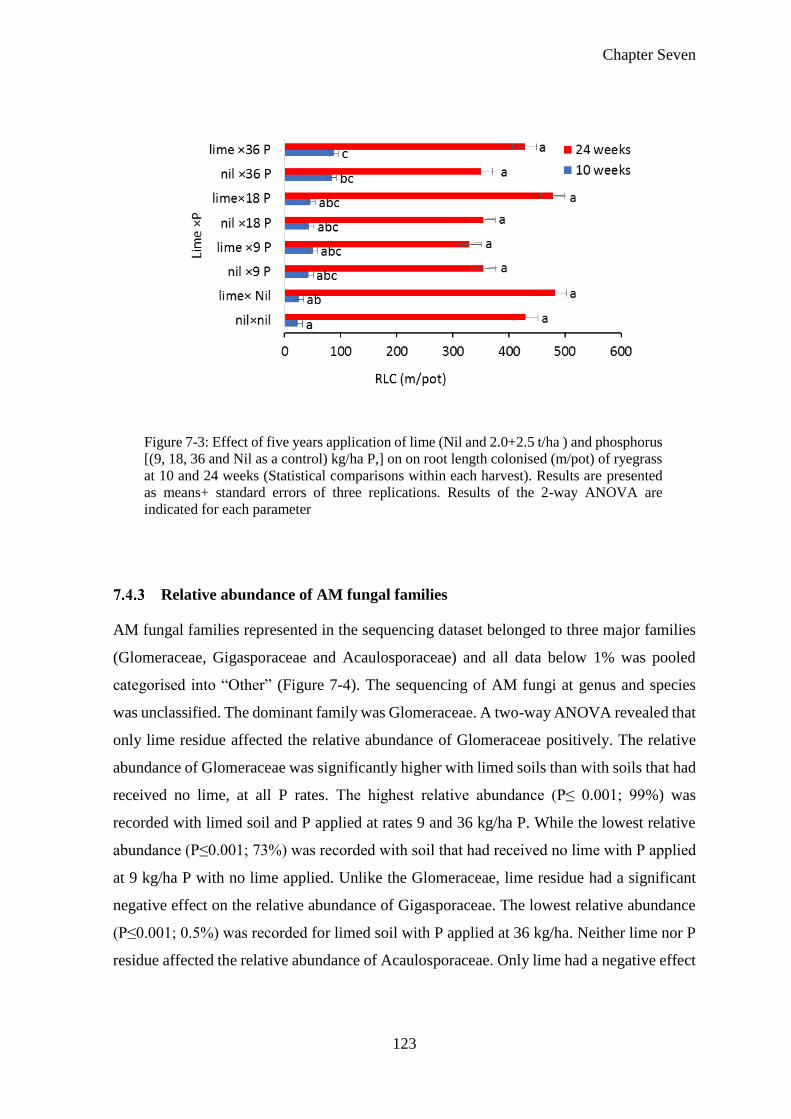
Chapter Seven
123
Relative abundance of AM fungal families
AM fungal families represented in the sequencing dataset belonged to three major families
(Glomeraceae, Gigasporaceae and Acaulosporaceae) and all data below 1% was pooled
categorised into “Other” (Figure 7-4). The sequencing of AM fungi at genus and species
was unclassified. The dominant family was Glomeraceae. A two-way ANOVA revealed that
only lime residue affected the relative abundance of Glomeraceae positively. The relative
abundance of Glomeraceae was significantly higher with limed soils than with soils that had
received no lime, at all P rates. The highest relative abundance (P≤ 0.001; 99%) was
recorded with limed soil and P applied at rates 9 and 36 kg/ha P. While the lowest relative
abundance (P≤0.001; 73%) was recorded with soil that had received no lime with P applied
at 9 kg/ha P with no lime applied. Unlike the Glomeraceae, lime residue had a significant
negative effect on the relative abundance of Gigasporaceae. The lowest relative abundance
(P≤0.001; 0.5%) was recorded for limed soil with P applied at 36 kg/ha. Neither lime nor P
residue affected the relative abundance of Acaulosporaceae. Only lime had a negative effect
Figure 7-3: Effect of five years application of lime (Nil and 2.0+2.5 t/ha ) and phosphorus
[(9, 18, 36 and Nil as a control) kg/ha P,] on on root length colonised (m/pot) of ryegrass
at 10 and 24 weeks (Statistical comparisons within each harvest). Results are presented
as means+ standard errors of three replications. Results of the 2-way ANOVA are
indicated for each parameter
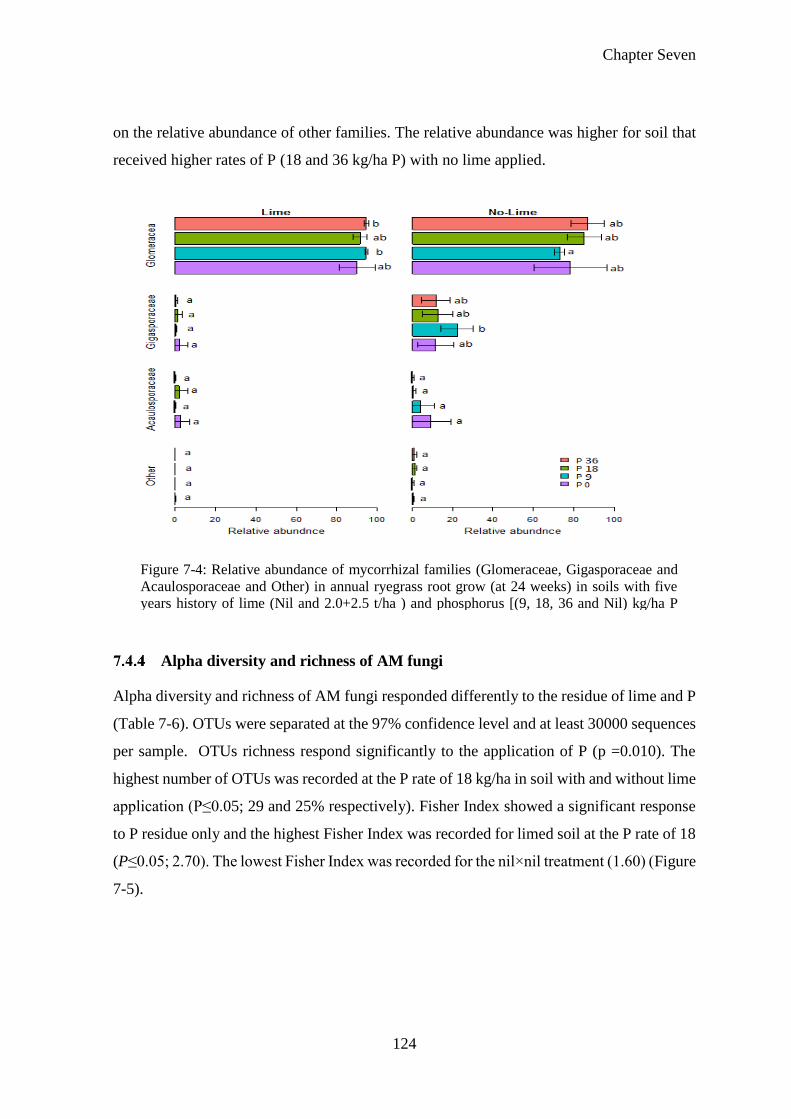
Chapter Seven
124
on the relative abundance of other families. The relative abundance was higher for soil that
received higher rates of P (18 and 36 kg/ha P) with no lime applied.
Alpha diversity and richness of AM fungi
Alpha diversity and richness of AM fungi responded differently to the residue of lime and P
(Table 7-6). OTUs were separated at the 97% confidence level and at least 30000 sequences
per sample. OTUs richness respond significantly to the application of P (p =0.010). The
highest number of OTUs was recorded at the P rate of 18 kg/ha in soil with and without lime
application (P≤0.05; 29 and 25% respectively). Fisher Index showed a significant response
to P residue only and the highest Fisher Index was recorded for limed soil at the P rate of 18
(P≤0.05; 2.70). The lowest Fisher Index was recorded for the nil×nil treatment (1.60) (Figure
7-5).
Figure 7-4: Relative abundance of mycorrhizal families (Glomeraceae, Gigasporaceae and
Acaulosporaceae and Other) in annual ryegrass root grow (at 24 weeks) in soils with five
years history of lime (Nil and 2.0+2.5 t/ha ) and phosphorus [(9, 18, 36 and Nil) kg/ha P
application. limed soil ( left) and no lime (right)
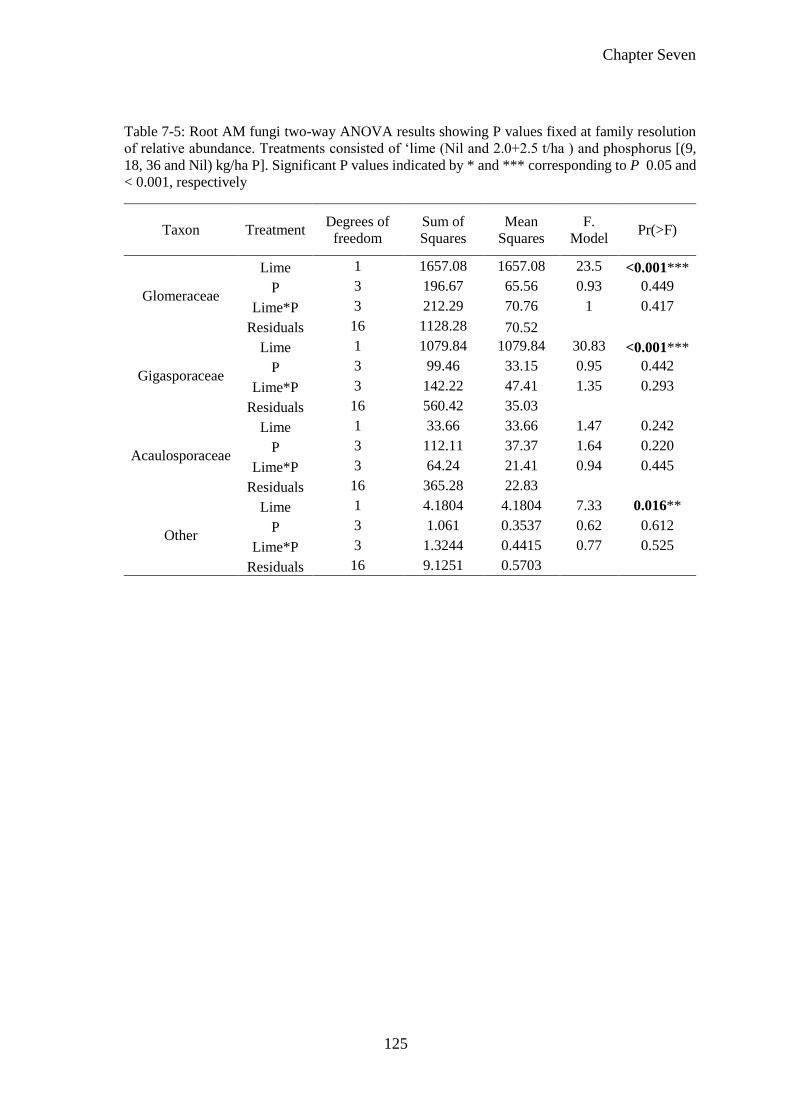
Chapter Seven
125
Table 7-5: Root AM fungi two-way ANOVA results showing P values fixed at family resolution
of relative abundance. Treatments consisted of ‘lime (Nil and 2.0+2.5 t/ha ) and phosphorus [(9,
18, 36 and Nil) kg/ha P]. Significant P values indicated by * and *** corresponding to P 0.05 and
< 0.001, respectively
Taxon Treatment Degrees of
freedom
Sum of
Squares
Mean
Squares
F.
Model Pr(>F)
Glomeraceae
Lime 1 1657.08 1657.08 23.5 <0.001***
P 3 196.67 65.56 0.93 0.449
Lime*P 3 212.29 70.76 1 0.417
Residuals 16 1128.28 70.52
Gigasporaceae
Lime 1 1079.84 1079.84 30.83 <0.001***
P 3 99.46 33.15 0.95 0.442
Lime*P 3 142.22 47.41 1.35 0.293
Residuals 16 560.42 35.03
Acaulosporaceae
Lime 1 33.66 33.66 1.47 0.242
P 3 112.11 37.37 1.64 0.220
Lime*P 3 64.24 21.41 0.94 0.445
Residuals 16 365.28 22.83
Other
Lime 1 4.1804 4.1804 7.33 0.016**
P 3 1.061 0.3537 0.62 0.612
Lime*P 3 1.3244 0.4415 0.77 0.525
Residuals 16 9.1251 0.5703
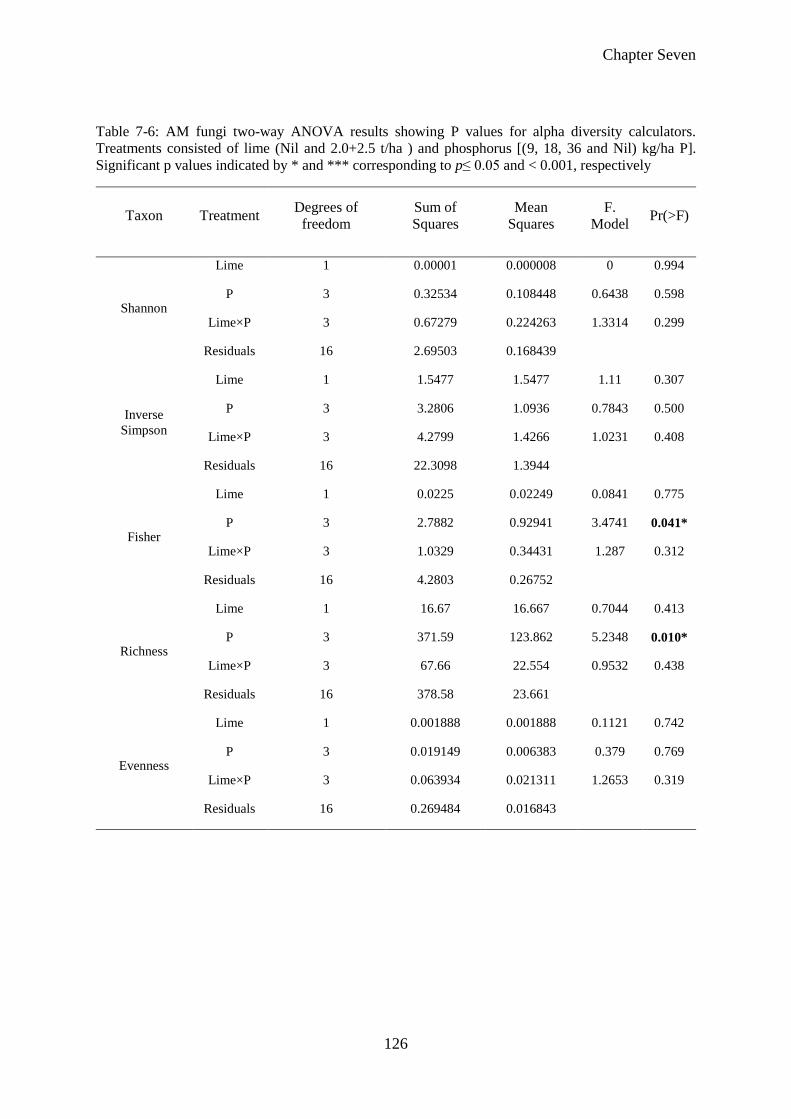
Chapter Seven
126
Table 7-6: AM fungi two-way ANOVA results showing P values for alpha diversity calculators.
Treatments consisted of lime (Nil and 2.0+2.5 t/ha ) and phosphorus [(9, 18, 36 and Nil) kg/ha P].
Significant p values indicated by * and *** corresponding to p≤ 0.05 and < 0.001, respectively
Taxon Treatment Degrees of
freedom
Sum of
Squares
Mean
Squares
F.
Model Pr(>F)
Shannon
Lime 1 0.00001 0.000008 0 0.994
P 3 0.32534 0.108448 0.6438 0.598
Lime×P 3 0.67279 0.224263 1.3314 0.299
Residuals 16 2.69503 0.168439
Inverse
Simpson
Lime 1 1.5477 1.5477 1.11 0.307
P 3 3.2806 1.0936 0.7843 0.500
Lime×P 3 4.2799 1.4266 1.0231 0.408
Residuals 16 22.3098 1.3944
Fisher
Lime 1 0.0225 0.02249 0.0841 0.775
P 3 2.7882 0.92941 3.4741 0.041*
Lime×P 3 1.0329 0.34431 1.287 0.312
Residuals 16 4.2803 0.26752
Richness
Lime 1 16.67 16.667 0.7044 0.413
P 3 371.59 123.862 5.2348 0.010*
Lime×P 3 67.66 22.554 0.9532 0.438
Residuals 16 378.58 23.661
Evenness
Lime 1 0.001888 0.001888 0.1121 0.742
P 3 0.019149 0.006383 0.379 0.769
Lime×P 3 0.063934 0.021311 1.2653 0.319
Residuals 16 0.269484 0.016843
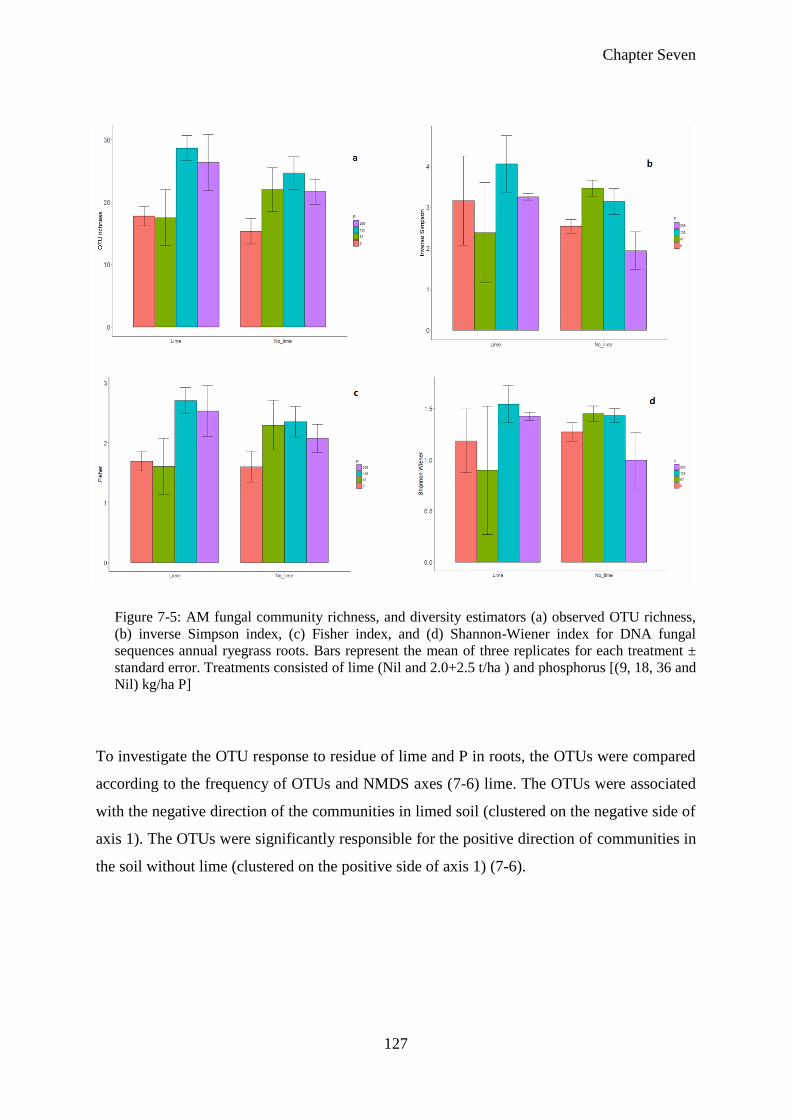
Chapter Seven
127
To investigate the OTU response to residue of lime and P in roots, the OTUs were compared
according to the frequency of OTUs and NMDS axes (7-6) lime. The OTUs were associated
with the negative direction of the communities in limed soil (clustered on the negative side of
axis 1). The OTUs were significantly responsible for the positive direction of communities in
the soil without lime (clustered on the positive side of axis 1) (7-6).
Figure 7-5: AM fungal community richness, and diversity estimators (a) observed OTU richness,
(b) inverse Simpson index, (c) Fisher index, and (d) Shannon-Wiener index for DNA fungal
sequences annual ryegrass roots. Bars represent the mean of three replicates for each treatment ±
standard error. Treatments consisted of lime (Nil and 2.0+2.5 t/ha ) and phosphorus [(9, 18, 36 and
Nil) kg/ha P]
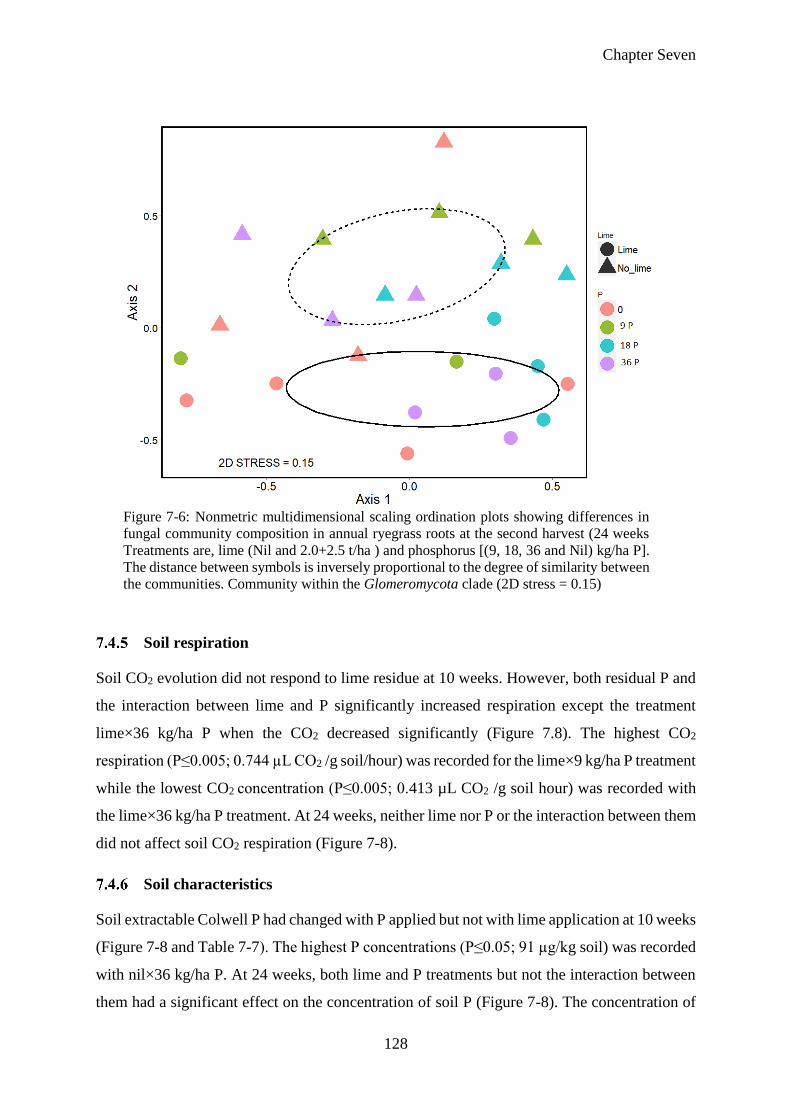
Chapter Seven
128
Soil respiration
Soil CO2 evolution did not respond to lime residue at 10 weeks. However, both residual P and
the interaction between lime and P significantly increased respiration except the treatment
lime×36 kg/ha P when the CO2 decreased significantly (Figure 7.8). The highest CO2
respiration (P≤0.005; 0.744 µL CO2 /g soil/hour) was recorded for the lime×9 kg/ha P treatment
while the lowest CO2 concentration (P≤0.005; 0.413 µL CO2 /g soil hour) was recorded with
the lime×36 kg/ha P treatment. At 24 weeks, neither lime nor P or the interaction between them
did not affect soil CO2 respiration (Figure 7-8).
Soil characteristics
Soil extractable Colwell P had changed with P applied but not with lime application at 10 weeks
(Figure 7-8 and Table 7-7). The highest P concentrations (P≤0.05; 91 µg/kg soil) was recorded
with nil×36 kg/ha P. At 24 weeks, both lime and P treatments but not the interaction between
them had a significant effect on the concentration of soil P (Figure 7-8). The concentration of
Figure 7-6: Nonmetric multidimensional scaling ordination plots showing differences in
fungal community composition in annual ryegrass roots at the second harvest (24 weeks
Treatments are, lime (Nil and 2.0+2.5 t/ha ) and phosphorus [(9, 18, 36 and Nil) kg/ha P].
The distance between symbols is inversely proportional to the degree of similarity between
the communities. Community within the Glomeromycota clade (2D stress = 0.15)
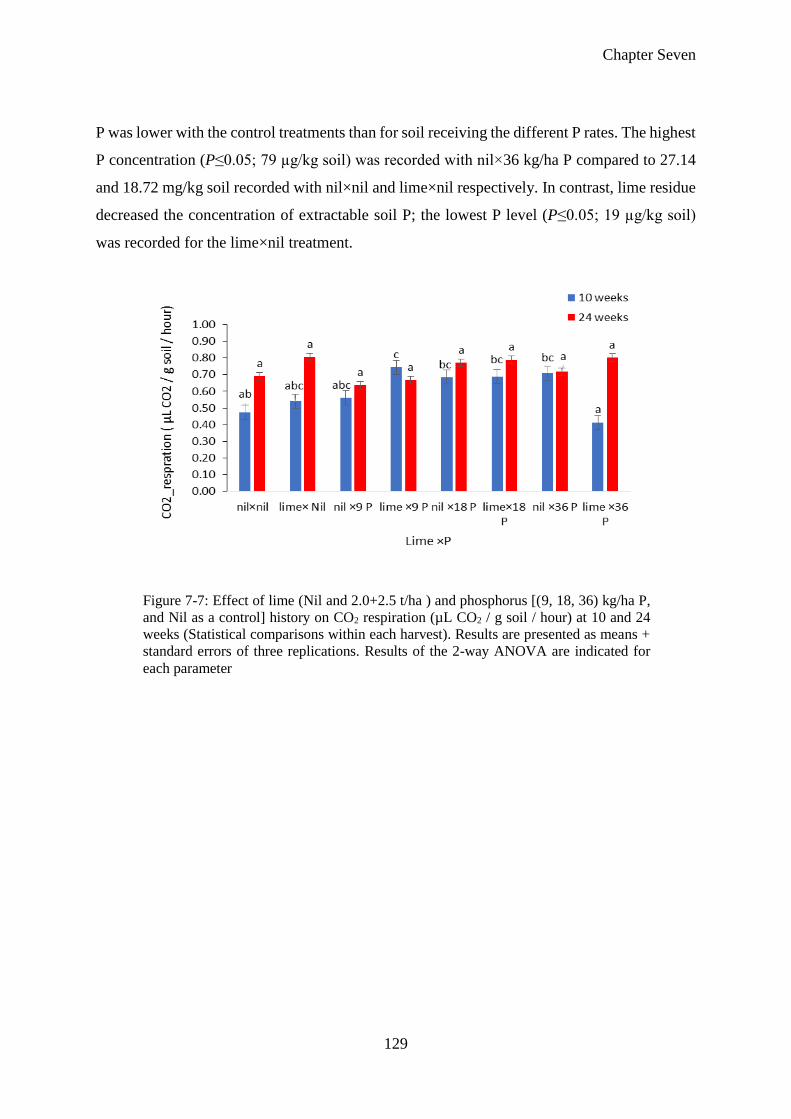
Chapter Seven
129
P was lower with the control treatments than for soil receiving the different P rates. The highest
P concentration (P≤0.05; 79 µg/kg soil) was recorded with nil×36 kg/ha P compared to 27.14
and 18.72 mg/kg soil recorded with nil×nil and lime×nil respectively. In contrast, lime residue
decreased the concentration of extractable soil P; the lowest P level (P≤0.05; 19 µg/kg soil)
was recorded for the lime×nil treatment.
Figure 7-7: Effect of lime (Nil and 2.0+2.5 t/ha ) and phosphorus [(9, 18, 36) kg/ha P,
and Nil as a control] history on CO2 respiration (µL CO2 / g soil / hour) at 10 and 24
weeks (Statistical comparisons within each harvest). Results are presented as means +
standard errors of three replications. Results of the 2-way ANOVA are indicated for
each parameter
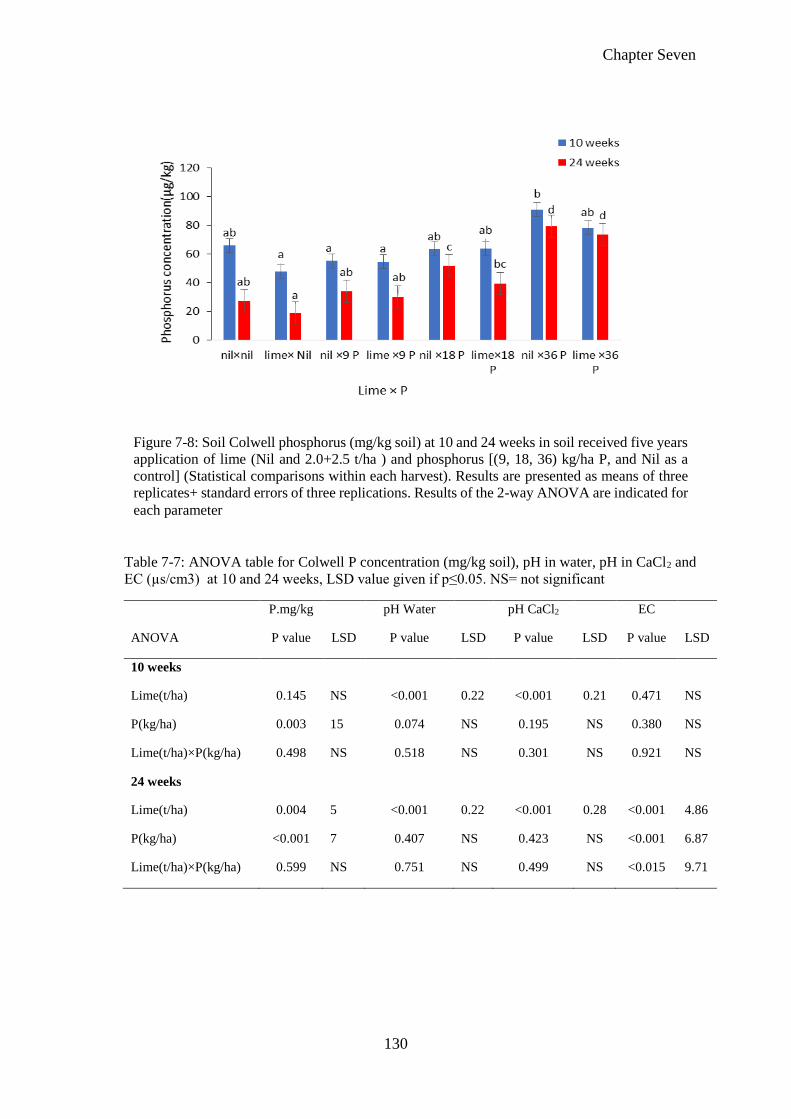
Chapter Seven
130
Table 7-7: ANOVA table for Colwell P concentration (mg/kg soil), pH in water, pH in CaCl2 and
EC (µs/cm3) at 10 and 24 weeks, LSD value given if p≤0.05. NS= not significant
P.mg/kg
pH Water
pH CaCl2
EC
ANOVA P value LSD P value LSD P value LSD P value LSD
10 weeks
Lime(t/ha) 0.145 NS <0.001 0.22 <0.001 0.21 0.471 NS
P(kg/ha) 0.003 15 0.074 NS 0.195 NS 0.380 NS
Lime(t/ha)×P(kg/ha) 0.498 NS 0.518 NS 0.301 NS 0.921 NS
24 weeks
Lime(t/ha) 0.004 5 <0.001 0.22 <0.001 0.28 <0.001 4.86
P(kg/ha) <0.001 7 0.407 NS 0.423 NS <0.001 6.87
Lime(t/ha)×P(kg/ha) 0.599 NS 0.751 NS 0.499 NS <0.015 9.71
Figure 7-8: Soil Colwell phosphorus (mg/kg soil) at 10 and 24 weeks in soil received five years
application of lime (Nil and 2.0+2.5 t/ha ) and phosphorus [(9, 18, 36) kg/ha P, and Nil as a
control] (Statistical comparisons within each harvest). Results are presented as means of three
replicates+ standard errors of three replications. Results of the 2-way ANOVA are indicated for
each parameter
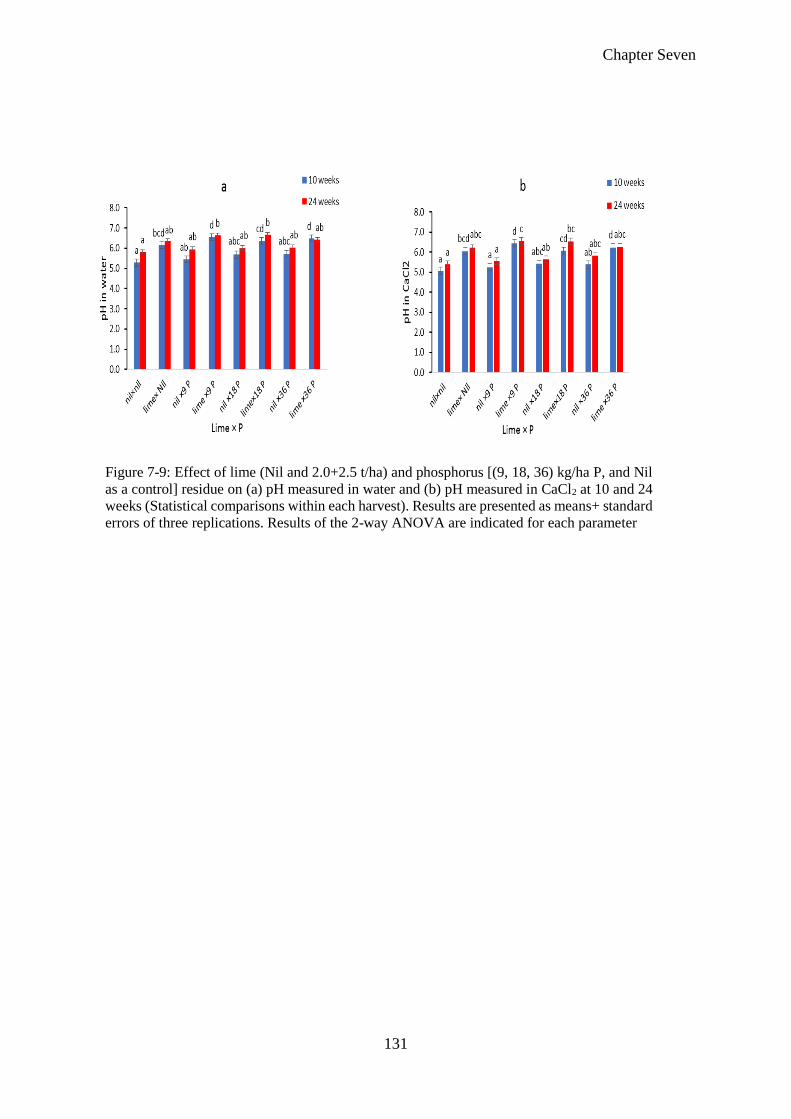
Chapter Seven
131
Figure 7-9: Effect of lime (Nil and 2.0+2.5 t/ha) and phosphorus [(9, 18, 36) kg/ha P, and Nil
as a control] residue on (a) pH measured in water and (b) pH measured in CaCl2 at 10 and 24
weeks (Statistical comparisons within each harvest). Results are presented as means+ standard
errors of three replications. Results of the 2-way ANOVA are indicated for each parameter
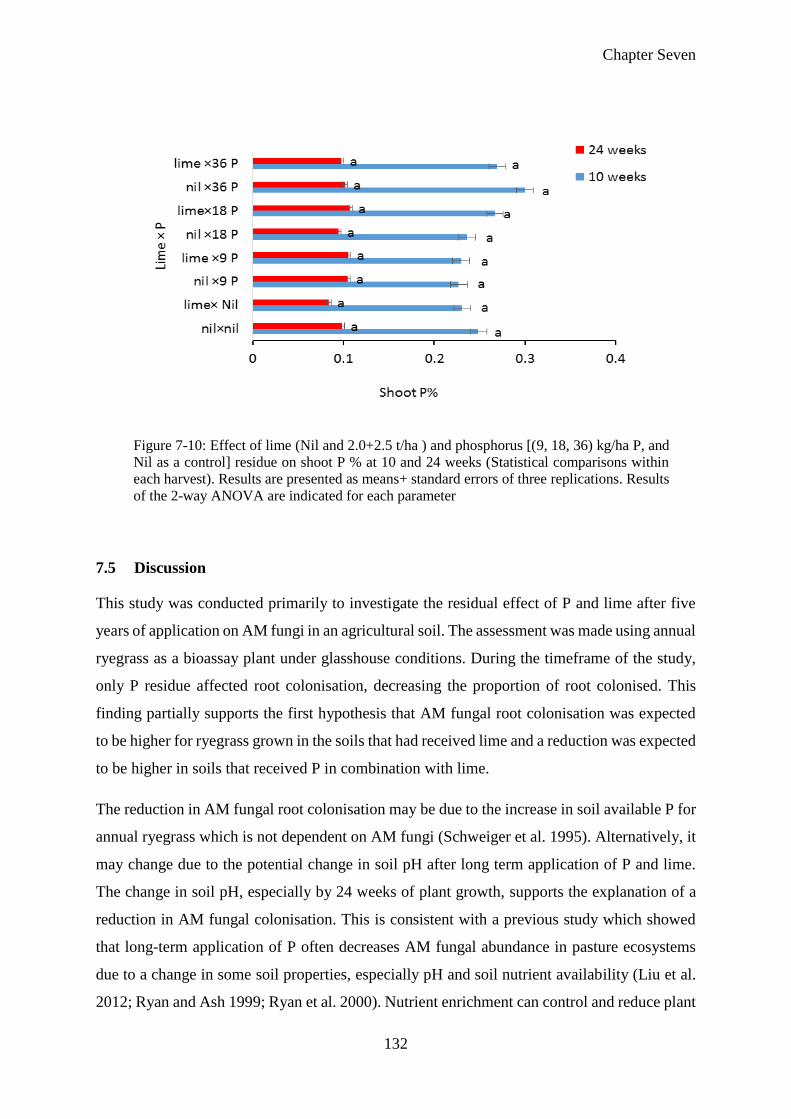
Chapter Seven
132
Figure 7-10: Effect of lime (Nil and 2.0+2.5 t/ha ) and phosphorus [(9, 18, 36) kg/ha P, and
Nil as a control] residue on shoot P % at 10 and 24 weeks (Statistical comparisons within
each harvest). Results are presented as means+ standard errors of three replications. Results
of the 2-way ANOVA are indicated for each parameter
7.5 Discussion
This study was conducted primarily to investigate the residual effect of P and lime after five
years of application on AM fungi in an agricultural soil. The assessment was made using annual
ryegrass as a bioassay plant under glasshouse conditions. During the timeframe of the study,
only P residue affected root colonisation, decreasing the proportion of root colonised. This
finding partially supports the first hypothesis that AM fungal root colonisation was expected
to be higher for ryegrass grown in the soils that had received lime and a reduction was expected
to be higher in soils that received P in combination with lime.
The reduction in AM fungal root colonisation may be due to the increase in soil available P for
annual ryegrass which is not dependent on AM fungi (Schweiger et al. 1995). Alternatively, it
may change due to the potential change in soil pH after long term application of P and lime.
The change in soil pH, especially by 24 weeks of plant growth, supports the explanation of a
reduction in AM fungal colonisation. This is consistent with a previous study which showed
that long-term application of P often decreases AM fungal abundance in pasture ecosystems
due to a change in some soil properties, especially pH and soil nutrient availability (Liu et al.
2012; Ryan and Ash 1999; Ryan et al. 2000). Nutrient enrichment can control and reduce plant
Chapter Seven
133
C allocation to root and AM fungi as well (Brouwer 1983). In P-fertilised soils, the lower AM
fungal colonisation may result from plant adjustment in their investment in symbiotic
relationship to the level of soil P availability (Smith and Read 2008). High P concentration can
decrease the exudation of carbohydrates from plant roots which reflect negatively on the
colonisation proportion by AM fungi (Graham et al. 1981). Moreover, fatty acid signature
analysis showed that less carbohydrate is allocated to plant roots leading to fewer AM spores,
as less carbohydrate is available for AM fungi (Olsson et al. 1997). The formation of
extraradical hyphae can also decrease when soil P is at a sufficient level (Olsson et al. 1999).
The negative effect of P enrichment depends on the initial P concentration in soil and previous
studies showed that the reduction in AM fungal colonisation of roots was higher when P was
applied to the soil having high initial soil P than when applied to moderate or low P soils
(Propster and Johnson 2015). Other field studies have shown that the abundance of AM fungi
either inside root or in soil usually increases when plants are not limited by nutrients especially,
N and P (Blanke et al. 2011; Johnson et al. 2003; Liu et al. 2012).
Three major families (Glomeraceae, Gigasporaceae and Acaulosporaceae) were identified
using DNA sequencing. Only lime residue affected the relative abundance of these families
and there was a variation in the effect on each family. Lime residue had a positive effect on the
relative abundance Glomeraceae while lime residue had a negative effect on the relative
abundance of Gigasporaceae and “Other” families. These findings partially supported the
second hypothesis that P and lime residue would have different effects on the relative
abundance of families of AM fungi depending on P rates. The variation in the relative
abundance of AM families may be due to their degree of sensitivity to changes in soil pH. The
results of a correlation between soil pH in CaCl2 and AM fungal families support this
explanation. There was a highly positive correlation (P≤0.001; 0.905) between soil pH and the
relative abundance of Glomeraceae. Meanwhile, highly negative correlation was observed
between soil pH and the relative abundance of Gigasporaceae (p<0.05; -0.79) and “Other”
families (P<0.05; -0.73). The finding in regard of Glomeraceae is consistent with a previous
study which showed that soil acidity (pH<5.3) reduced the colonisation of roots by some
Glomus spp. significantly in subterranean clover (Abbott and Robson 1985). Liming soil
decreased root colonisation by Acaulospora sp. and increased the root colonisation by
Gigaspora sp. in the same experiment showing that different AM fungi have different soil pH
Chapter Seven
134
optima (Sano et al. 2002). The adaptation of AM fungi to specific soil pH caused AM species
to grow and develop within specific range of soil pH (Oehl et al. 2005).
Lime residue may affect the relative abundance of AM fungi by affecting sporulation of AM
fungi. A previous study showed that lime application has the potential to alter the relationship
between mycorrhiza formation and spore production (Sano et al. 2002). Koomen et al. (1987)
demonstrated that the change in soil pH had an adverse effect on the extent of sporulation of
two Glomus spp. Similarly, increasing addition of lime has been reported to make significant
changes in the number of spores of four different AM species (Siqueira et al. 1990).
7.6 Conclusion
Phosphorus residue was the major factor determining the AM fungal root colonisation level.
The negative effect of P on AM fungal colonisation was not correlated to P rates. In contrast,
the residue of lime on the relative abundance of AM fungi was the major factor with no effect
for P residue. The change in soil pH may be an important mechanism that determines the
colonisation (%) and the relative abundance of AM fungi. Further morphological identification
is required to investigate the effect of these factors on the AM fungi at species level.
Chapter Eight: General discussion
135
8 CHAPTER 8
General Discussion
8.1 Overview
The experimental chapters within this thesis highlight how soil biotic and abiotic factors can
influence AM fungi in pasture ecosystems of south-western Australia. Use of fertilisers of
different P solubility in combination with soil amendments (lime and biochar) in different
forms and rates has potential to counteract negative ecological consequences of fertilisers on
soil microorganisms, especially AM fungi.
This thesis set out firstly to evaluate the biotic and abiotic factors that could affect AM fungal
colonisation of plants in pasture ecosystems, using an example from south-western Australia.
The experiments that were carried out were linked to agricultural practices in pastures,
including use of P and N fertilisers, and soil amendments (lime and biochar). The underlying
aim of all experiments was to investigate how all these practices can impact the colonisation
of pasture plants by AM fungi (Table 8.1). There is increasing interest in use of alternative soil
amendments, including mineral-based fertilisers, biochars and microbial inoculants, and the
experiments focused on the use of fertilisers differing in nutrient solubility in combination with
soil amendments to investigate effects on the communities of AM fungi that occur naturally in
agricultural soils. The main experimental objectives with corresponding major findings are
summarised in Table 8.1.
8.2 Key research findings
In south-western Australia, perennial pasture plant species have received little attention except
in the higher rainfall areas, but they could provide summer feed if they can be established
effectively with annual pasture species in lower rainfall regions. Therefore, Chapter 3
investigated soil chemical characteristics during the introduction of perennial grass pasture
species into an existing annual pasture system to better understand the dynamics of AM fungi
during perennial pasture establishment. There was a significant positive correlation between
plant density, soil EC and available N (NH4+ and NO3
-), and it is likely that available N had
positive effects on early growth of pasture in general and specifically on the perennial species
(Monaco et al. 2003).
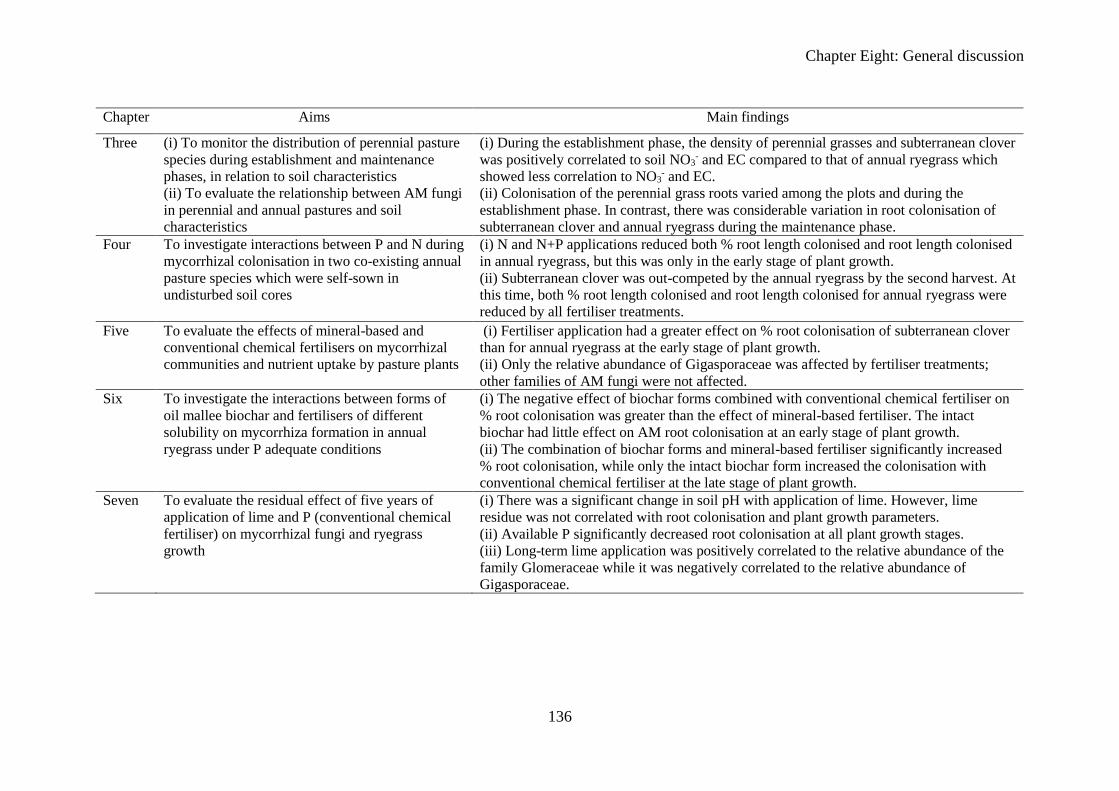
Chapter Eight: General discussion
136
Chapter Aims Main findings
Three (i) To monitor the distribution of perennial pasture
species during establishment and maintenance
phases, in relation to soil characteristics
(ii) To evaluate the relationship between AM fungi
in perennial and annual pastures and soil
characteristics
(i) During the establishment phase, the density of perennial grasses and subterranean clover
was positively correlated to soil NO3- and EC compared to that of annual ryegrass which
showed less correlation to NO3- and EC.
(ii) Colonisation of the perennial grass roots varied among the plots and during the
establishment phase. In contrast, there was considerable variation in root colonisation of
subterranean clover and annual ryegrass during the maintenance phase.
Four To investigate interactions between P and N during
mycorrhizal colonisation in two co-existing annual
pasture species which were self-sown in
undisturbed soil cores
(i) N and N+P applications reduced both % root length colonised and root length colonised
in annual ryegrass, but this was only in the early stage of plant growth.
(ii) Subterranean clover was out-competed by the annual ryegrass by the second harvest. At
this time, both % root length colonised and root length colonised for annual ryegrass were
reduced by all fertiliser treatments.
Five To evaluate the effects of mineral-based and
conventional chemical fertilisers on mycorrhizal
communities and nutrient uptake by pasture plants
(i) Fertiliser application had a greater effect on % root colonisation of subterranean clover
than for annual ryegrass at the early stage of plant growth.
(ii) Only the relative abundance of Gigasporaceae was affected by fertiliser treatments;
other families of AM fungi were not affected.
Six To investigate the interactions between forms of
oil mallee biochar and fertilisers of different
solubility on mycorrhiza formation in annual
ryegrass under P adequate conditions
(i) The negative effect of biochar forms combined with conventional chemical fertiliser on
% root colonisation was greater than the effect of mineral-based fertiliser. The intact
biochar had little effect on AM root colonisation at an early stage of plant growth.
(ii) The combination of biochar forms and mineral-based fertiliser significantly increased
% root colonisation, while only the intact biochar form increased the colonisation with
conventional chemical fertiliser at the late stage of plant growth.
Seven To evaluate the residual effect of five years of
application of lime and P (conventional chemical
fertiliser) on mycorrhizal fungi and ryegrass
growth
(i) There was a significant change in soil pH with application of lime. However, lime
residue was not correlated with root colonisation and plant growth parameters.
(ii) Available P significantly decreased root colonisation at all plant growth stages.
(iii) Long-term lime application was positively correlated to the relative abundance of the
family Glomeraceae while it was negatively correlated to the relative abundance of
Gigasporaceae.
Chapter Eight: General discussion
137
Meanwhile, during the maintenance phase, the density of perennial pastures was positively
correlated to available NO3--N, total N and soil carbon. The competitive ability of perennial
pastures due to their greater root system may be one response to soil N changes. This, in
turn, gives perennial pasture plants the ability to uptake available N rapidly from soil
compared with a smaller root system of annual pasture species (Hook et al. 1994).
Root colonisation (%) by AM fungi was positively correlated to soil available N (NH4+ and
NO3-) during the establishment of the pasture for both the annual and perennial grasses and
there was a positive correlation with available NH4+-N, total N and soil C during the
maintenance phase. A change in soil N can increase the allocation of C to AM fungi
depending on soil N:P ratio (Bääth et al. 1981; Johnson et al. 2003; Liu et al. 2000; Sylvia
and Neal 1990). In addition, the variation in sensitivity of some AM species can increase or
decrease competition among them (Eom et al. 1999a; Johnson 1993).
P and N are the most important macro-nutrients affecting crop and pasture production.
Although both P and N can promote pasture growth, their application in some soils can
negatively affect the diversity of pasture species as well as the abundance of AM fungi (Báez
et al. 2007; Erland and Taylor 2003; Janssens et al. 1998). The experiment in Chapter 4
mimicked field conditions to evaluate the effects of P and N separately and together on
pasture growth and colonisation of roots of a legume and grass by AM fungi. Interactions
between P and N altered mycorrhizal colonisation in two co-existing annual pasture species
(a grass and a legume) in a self-sown pasture community (undisturbed field soil cores). The
addition of P and N+P decreased the proportion of root length colonised and the length of
root colonised by AM fungi for subterranean clover annual ryegrass roots at 5 weeks.
However, there was variation in root colonisation between annual ryegrass and subterranean
clover. This is likely to be related to differences in root architecture of subterranean clover
and annual ryegrass (Schweiger et al. 1995). Annual ryegrass has a longer root system with
more branches that can grow rapidly to enable exploration of soil nutrients and water (Fitter
1987).
As may occur under the field conditions, subterranean clover was out-competed by the
annual ryegrass in all soil cores by the second harvest. By this time, both % root length
colonised and root length colonised (m/pot) for annual ryegrass were reduced by all fertiliser
treatments. The combined application of P and N decreased in % root length colonised and
root length colonised of ryegrass. Subterranean clover is generally a weak competitor for
Chapter Eight: General discussion
138
light and soil nutrients compared to annual ryegrass in particular (Harris 1987; Haynes 1980;
Soussana et al. 1995). The application of P and N to this pasture changed the competitive
ability of the two annual pasture plants andm led to subterranean clover being out-competed
by annual ryegrass. In addition, to these observations, the experiment showed that an overall
assessment of mycorrhizal biomass in pastures needs to take into account the relative
abundance of roots of different plant species. For example in this experiment, while there
was higher % colonisation in subterranean clover, there was less root mass of this species,
so the contribution of subterranean clover to the overall mass of AM fungi in this case was
less than that of the grass which had a lower % of its root system colonised, but had a longer
length of root.
Chapter 5 focused on the impact of fertilisers with different P solubility on the formation
of mycorrhizas in two pasture species (annual ryegrass and subterranean clover) because of
increased interest in use of alternative fertilisers. Both the mineral-based and traditional
chemical fertilisers significantly decreased the proportion (%) and length of root colonised
for subterranean clover and annual ryegrass at 5 and 10 weeks. It is likely that a change in
soil chemical properties, especially soil pH, may have affected the availability of soil P,
directly affect AM fungi. High soil P concentrations can have a negative effect on root
colonisation and spore abundance in pastures (Dann et al. 1996; Mårtensson and Carlgren
1994; Ryan et al. 2000; Schweiger et al. 1995). This may be due to a decrease in
carbohydrate exudation from roots which the fungi depend on for energy and this, in turn,
can affect negatively to the colonisation level (Graham et al. 1981). When soil P is sufficient
for plant to be acquired easily, less energy (carbohydrates) will be available for AM fungi
and this may limit their growth (Ryan et al. 2000).
DNA sequencing of AM fungi within roots showed that only fertilisers affected the relative
abundance of AM fungi within the family Gigasporaceae while there was no difference in
relative abundance at family level for Acaulosporaceae and Glomeraceae. The relative
abundance of Glomeraceae was significantly higher in annual ryegrass roots while the
relative abundance of Acaulosporaceae family was higher in subterranean clover roots. This
is possibly due to a greater sensitivity of Gigasporaceae to high soil P while Acaulosporaceae
and Glomeraceae may become more tolerant to high soil P as the soil used in this study is
agricultural soil with high initial P. For example, it has been reported that some Glomus
species are tolerant of high soil P and these species have the ability to colonise plant roots
Chapter Eight: General discussion
139
and produce more spores under high soil P conditions (Mosse 1973; Sylvia and Schenck
1983a) compared to some species in the family Gigasporaceae which are sensitive to high
soil P (Douds and Schenck 1990a; Thomson et al. 1986; Thomson et al. 1990). The findings
based on DNA analysis in Chapter 5 support the results of relative abundance of AM fungal
morphotypes in Chapter 4. In Chapter 4, the dominant Am fungi belonged to Glomus spp.
and this is consistent with the DNA sequences in Chapter 5 where Glomeraceae was the
abundant family of AM fungi.
Chapters 6 and 7 investigated soil amendments other than fertilisers. In south-western
Australia, biochar has received less attention than other soil amendments such as lime. The
effects of different forms of a biochar were investigated when applied at different rates in
combination with fertilisers that differed in P solubility on mycorrhiza formation in annual
ryegrass. In this case, the agricultural soil used was not P deficient for plant growth, as such
conditions are commonly encountered in agricultural soils. The effect of biochar forms
combined with the commercial chemical fertiliser on % root colonisation was greater than
the effect of biochar forms with mineral-based fertiliser at the early stage of plant growth. It
is possible that the reduction in AM colonisation may also be due to organic pyrolytic
products such as phenolics and polyphenolics that function as inhibitors of soil
microorganisms, including AM fungi (Antal and Grønli 2003; Gundale and DeLuca 2006b).
Additionally, the rapid nutrient release into soil from the chemical fertiliser that increases
the nutrient pool may have reduced root colonisation in the early stage of plant growth.
Nutrient enrichment especially P has reported to decrease AM root colonisation of pasture
plants (Ryan and Ash 1999). With mineral-based fertilisers, the higher biochar rate (20t/ha)
had less negative effect than the lower rate (10t/ha) on percentage root colonisation of annual
ryegrass. This is inconsistent with a previous study that showed that the application of
different kind of biochars significantly decreased the abundance and the colonisation of AM
fungi under higher biochar rates (Warnock et al. 2010). Subsequently, the combination of
each biochar form and mineral-based fertiliser significantly increased mycorrhizal
colonisation (%) but only the intact biochar form interacted with the commercial chemical
fertiliser to increase mycorrhizal colonisation (%). The combination between biochar forms
and mineral-based fertiliser had less negative effects on the mycorrhizal colonisation than
the conventional fertilisers at P adequate conditions during the timeframe of this experiment.
Chapter Eight: General discussion
140
Although the use of lime has the potential to change soil acidity, a common soil constraint
the south-western Australia (Brennan et al. 2004), application of lime at high rates can
reduce availability of soil P (Haynes 1982a; McLachlan 1980). This can be offset by
combining lime with P fertiliser. In this context, the residual effect of five years application
of lime and phosphorus on AM fungi was investigated in Chapter 7. Although there was a
significant change in soil pH, lime did not affect % root colonisation or plant growth
parameters. Available P significantly decreased root colonisation at plant growth stages
assessed. Lime residue significantly increased the relative abundance of the family
Glomeraceae while it negatively affected the relative abundance of the family
Gigasporaceae at the late stage of plant growth. High P concentration can decrease the
exudation of carbohydrates from the plant roots which can reduce colonisation of roots by
AM fungi (Graham et al. 1981). Moreover, fatty acid signature analysis showed that when
less carbohydrate was allocated to roots, fewer spores of AM fungi were produced (Olsson
et al. 1997).
In addition to indirect effects of lime on AM fungi associated with P x lime interactions,
variation in the relative abundance of families of AM fungi may also be due to differences
in their sensitivity to soil pH gradients. A previous study showed that soil acidity (pH<5.3)
reduced the mycorrhizal colonisation by some Glomus spp. in subterranean clover (Abbott
and Robson 1985). Adaptation of AM fungi to defined ranges in soil pH restricted growth
of some AM species within specific ranges of soil pH (Oehl et al. 2005). However, P residue
was the major factor that negatively affected mycorrhizal colonisation while lime residue
affected the relative abundance of families of AM fungi. There was considerable variation
in the lime residue affect (positive, negative and no effect) for the three major families of
AM fungi. Further morphological identification is required to investigate the effect of these
factors at the AM fungal species level within roots.
8.3 Limitations of the research presented in this thesis
Taken overall, grazing can substantially affect the structure of plant communities in addition
to affecting soil properties such as the distribution of soil nutrients, the decomposition of
organic matter which in turn affects the competitive ability among plant species (Fahnestock
and Detling 1999; McNaughton 1985). Additionally, grazing can also affect the AM root
colonisation (Bethlenfalvay et al. 1985). However, the pasture at the field site monitored in
Chapter Eight: General discussion
141
Chapter 3 did not include an assessment of the impact of grazing on colonisation of roots
by AM fungi. In this case, fertiliser had been applied according to local agricultural practices
for pastures. Therefore, further studies at this site could investigate how different agricultural
practices might affect both AM fungi and the establishment of perennial pasture plants in
relation to the annual pasture species at this site. There was no difference in % root
colonisation between the annual and perennial grasses during the 2015 sampling times, %
colonisation of roots of perennial grasses was lower than in annual ryegrass and subterranean
clover roots during 2016. The change in root colonisation among annual and perennial
pasture plants could be investigated further over time, especially in relation to grazing.
Although the experiment in Chapter 4 was conducted so that it was close to field conditions
with regards to pasture plant community, the soil temperature and moisture were held
constant in this glasshouse experiment. It is possible that there could be differences in the
responses of pasture plant growth and AM root colonisation in glasshouse compared to field
conditions (Braunberger et al. 1996). Therefore, extending this research to include intensive
time-course of sampling of roots from co-occurring pasture plants in the field would be
valuable.
A single fertiliser rate (i.e. the commercial recommended rate) was used for the mineral-
based and traditional chemical fertilisers in the experimental Chapter 5. Use of lower rates
of fertilisers (for both the conventional chemical and mineral-based fertilisers) could be
further studied to determine the consequences of reducing fertiliser inputs and minimising
potential negative consequences on soil microorganisms without compromising plant
growth.
The soil used in the experiment presented in Chapter 6 had a relatively high P level as it
was used commercially for agricultural production. This is common for soils that have
been used long-term for cropping. Thus, use of agricultural soils (including different soil
types) that have a wider range of P availability for investigation of the same biochar and
fertiliser combinations is required to further understand the effect of alternative forms of
biochar on pasture growth and the formation of AM fungi.
142
9 References
Aarssen LW, Turkington R (1985) Competitive relations among species from pastures of
different ages. Canadian Journal of Botany 63:2319-2325.
Abbott L, Robson A (1985) The effect of soil pH on the formation of VA mycorrhizas by
two species of Glomus. Soil Research 23:253-261.
Abbott LK (1982) Comparative Anatomy of Vesicular-Arbuscular Mycorrhizas Formed on
Subterranean Clover. Australian Journal of Botany 30:485-499.
Abbott LK, Robson AD (1977) The distribution and abundance of vesicular arbuscular
endophytes in some Western Australian soils. Australian Journal of Botany 25:515-
522.
Abbott LK, Robson AD (1981) Infectivity and effectiveness of five endomycorrhizal fungi:
competition with indigenous fungi in field soils. Crop and Pasture Science 32:621-
630.
Abbott LK, Robson AD (1991) Field management of VA mycorrhizal fungi. In: The
rhizosphere and plant growth. Springer, pp 355-362.
Abrams PA (1995) Monotonic or unimodal diversity-productivity gradients: what does
competition theory predict. Ecology 76:2019-2027.
Aciego Pietri JC, Brookes PC (2008a) Nitrogen mineralisation along a pH gradient of a silty
loam UK soil. Soil Biology and Biochemistry 40:797-802.
Aciego Pietri JC, Brookes PC (2008b) Relationships between soil pH and microbial
properties in a UK arable soil. Soil Biology and Biochemistry 40:1856-1861.
Ainsworth EA, Long SP (2005) What have we learned from 15 years of free‐air CO2
enrichment (FACE)? A meta‐analytic review of the responses of photosynthesis,
canopy properties and plant production to rising CO2. New Phytologist 165:351-372.
Al-Mufti M, Sydes C, Furness S, Grime J, Band S (1977) A quantitative analysis of shoot
phenology and dominance in herbaceous vegetation. The Journal of Ecology: 759-
791
143
Al-Wabel MI, Al-Omran A, El-Naggar AH, Nadeem M, Usman ARA (2013) Pyrolysis
temperature induced changes in characteristics and chemical composition of biochar
produced from conocarpus wastes. Bioresource technology 131:374-379.
Alburquerque JA, Salazar P, Barrón V, Torrent J, del Campillo MdC, Gallardo A, Villar R
(2013) Enhanced wheat yield by biochar addition under different mineral
fertilization levels. Agronomy for Sustainable Development 33:475-484.
Alexander T, Meier R, Toth R, Weber HC (1988) Dynamics of arbuscule development and
degeneration in mycorrhizas of Triticum aestivum L. and Avena sativa L. with
reference to Zea mays L. New Phytologist 110:363-370.
Alkan N, Gadkar V, Coburn J, Yarden O, Kapulnik Y (2004) Quantification of the
arbuscular mycorrhizal fungus Glomus intraradices in host tissue using real-time
polymerase chain reaction New Phytologist 161:877-885.
Allen M, Swenson W, Querejeta J, Egerton-Warburton L, Treseder K (2003) Ecology of
mycorrhizae: a conceptual framework for complex interactions among plants and
fungi. Annual Review of Phytopathology 41:271-303.
Allen MF (1991) The ecology of mycorrhizae. Cambridge University Press,
Allen MF (2001) Modeling arbuscular mycorrhizal infection: is % infection an appropriate
variable. Mycorrhiza 10:255–258.
Ameloot N, Graber ER, Verheijen FGA, Neve SD (2013) Interactions between biochar
stability and soil organisms: review and research needs. European Journal of Soil
Science 64:379-390..
Annicchiarico P, Proietti S (2010) White clover selected for enhanced competitive ability
widens the compatibility with grasses and favours the optimization of legume
content and forage yield in mown clover‐grass mixtures. Grass and Forage Science
65:318-324.
Antal MJ, Grønli M (2003) The art, science, and technology of charcoal production.
Industrial & Engineering Chemistry Research 42:1619-1640.
144
Aranjuelo I, Pérez P, Hernández L, Irigoyen JJ, Zita G, Martínez‐Carrasco R, Sánchez‐Díaz
M (2005) The response of nodulated alfalfa to water supply, temperature and
elevated CO2: photosynthetic downregulation. Physiologia Plantarum 123:348-358.
Arao T (1999) In situ detection of changes in soil bacterial and fungal activities by measuring
13C incorporation into soil phospholipid fatty acids from 13C acetate. Soil Biology
and Biochemistry 31:1015-1020.
Asai H et al. (2009) Biochar amendment techniques for upland rice production in Northern
Laos: 1. Soil physical properties, leaf SPAD and grain yield. Field Crops Research
111:81-84.
Asimi S, Gianinazzi-Pearson V, Gianinazzi S (1980) Influence of increasing soil phosphorus
levels on interactions between vesicular–arbuscular mycorrhizae and Rhizobium in
soybeans Agronomy for Sustainable Development 58:2200-2205 doi:10.1139/b80-
253
Audit NLaWR (2001) The National Land and Water Resources Audit Land and Water
Australia,Commonwealth of Australia, Canberra.
Axel OP, H. BS, M. VAI (2005) The influence of external nitrogen on carbon allocation to
Glomus intraradices in monoxenic arbuscular mycorrhiza. New Phytologist 168:677-
686.
Aydin I, Uzun F (2005) Nitrogen and phosphorus fertilization of rangelands affects yield,
forage quality and the botanical composition. European Journal of Agronomy 23:8-
14..
Azcon-Aguilar R, Barea J (1992) Nodulation, nitrogen fixation (nitrogen-15) and nitrogen
nutrition relationships in mycorrhizal or phosphate-amended alfalfa plants.
Symbiosis 12:33–42.
Baath E et al. (1980) Effects of experimental acidification and liming on soil organisms and
decomposition in a Scots pine forest. Pedobiologia 20:85-100.
Bääth E, Lundgren B, Söderström B (1981) Effects of nitrogen fertilization on the activity
and biomass of fungi and bacteria in a podzolic soil Zentralblatt für Bakteriologie
145
Mikrobiologie und Hygiene: I Abt Originale C: Allgemeine, angewandte und
ökologische. Mikrobiologie 2:90-98.
Badalucco L, Grego S, Dell'Orco S, Nannipieri P (1992) Effect of liming on some chemical,
biochemical, and microbiological properties of acid soils under spruce (Picea abies
L.). Biology and Fertility of Soils 14:76-83.
Báez S, Fargione J, Moore DI, Collins SL, Gosz JR (2007) Atmospheric nitrogen deposition
in the northern Chihuahuan desert: temporal trends and potential consequences.
Journal of Arid Environments 68:640-651.
Barber S, Khasawneh F, Sample E, Kamprath E (1980) Soil-plant interactions in plant
nutrition The Role of Phosphorus in Agriculture. American Society of Agronomy
Madison, WI:591-615.
Bardgett RD, Jones AC, Jones DL, Kemmitt SJ, Cook R, Hobbs PJ (2001) Soil microbial
community patterns related to the history and intensity of grazing in sub-montane
ecosystems. Soil Biology and Biochemistry 33:1653-1664.
Barea J, Toro M, Orozco M, Campos E, Azcón R (2002) The application of isotopic (32 P
and 15 N) dilution techniques to evaluate the interactive effect of phosphate-
solubilizing rhizobacteria, mycorrhizal fungi and Rhizobium to improve the
agronomic efficiency of rock phosphate for legume crops. Nutrient Cycling in
Agroecosystems 63:35-42.
Barrow N (1975) The response to phosphate of two annual pasture species. I. Effect of the
soil's ability to adsorb phosphate on comparative phosphate requirement. Australian
Journal of Agricultural Research 26:137-143.
Bartolome-Esteban H, Schenck NC (1994) Spore Germination and Hyphal Growth of
Arbuscular Mycorrhizal Fungi in Relation to Soil Aluminum Saturation. Mycologia
86:217-226.
Bates TR, Lynch JP (1996) Stimulation of root hair elongation in Arabidopsis thaliana by
low phosphorus availability. Plant, Cell & Environment 19:529-538.
146
Bélanger N, oté B, ıt, Fyles JW, Courchesne F, Hendershot WH (2004) Forest regrowth as
the controlling factor of soil nutrient availability 75 years after fire in a deciduous
forest of Southern Quebec. Plant and Soil 262:363-272.
Bell LW, Ryan MH, Moore GA, Ewing MA (2006) Comparative water use by Dorycnium
hirsutum-, lucerne-, and annual-based pastures in the Western Australian wheatbelt.
Australian Journal of Agricultural Research 57:857-865.
Bethlenfalvay G, Evans R, Lesperance A (1985) Mycorrhizal Colonization of Crested
Wheatgrass as Influenced by Grazing 1. Agronomy Journal 77:233-236.
Bethlenfalvay GJ, Bayne HG, Pacovsky RS (1983) Parasitic and mutualistic associations
between a mycorrhizal fungus and soybean: The effect of phosphorus on host plant‐
endophyte interactions. Physiologia Plantarum 57:543-548.
Bever JD, Morton JB, Antonovics J, Schultz PA (1996) Host-dependent sporulation and
species diversity of arbuscular mycorrhizal fungi in a mown grassland. Journal of
ecology:71-82
Bhadalung NN, Suwanarit A, Dell B, Nopamornbodi O, Thamchaipenet A, Rungchuang J
(2005) Effects of long-term NP-fertilization on abundance and diversity of
arbuscular mycorrhizal fungi under a maize cropping system. Plant and Soil
270:371-382.
Bidartondo MI et al. (2002) Epiparasitic plants specialized on arbuscular mycorrhizal fungi.
Nature 419:389.
Blackwell P, Krull E, Butler G, Herbert A, Solaiman Z (2010) Effect of banded biochar on
dryland wheat production and fertiliser use in south-western Australia: an agronomic
and economic perspective. Soil Research 48:531-545.
Blakemore LC, Searle PL, Daly BK (1972) Methods for chemical analysis of soils.
.Department of Scientific and Industrial Research.
Blank RR, Morgan T (2012) Suppression of Bromus tectorum L. by established perennial
grasses: potential mechanisms—part one. Applied and Environmental Soil Science
2012:9.
147
Blanke V, Bassin S, Volk M, Fuhrer J (2012) Nitrogen deposition effects on subalpine
grassland: The role of nutrient limitations and changes in mycorrhizal abundance.
Acta Oecologica 45:57-65.
Blanke V, Wagner M, Renker C, Lippert H, Michulitz M, Kuhn AJ, Buscot F (2011)
Arbuscular mycorrhizas in phosphate-polluted soil: interrelations between root
colonization and nitrogen. Plant and soil 343:379-392.
Bobbink R, Willems J (1991) Impact of different cutting regimes on the performance of
Brachypodium pinnatum in Dutch chalk grassland. Biological Conservation 56:1-
21.
Böhme L, Böhme F (2006) Soil microbiological and biochemical properties affected by
plant growth and different long-term fertilisation. European journal of soil biology
42:1-12.
Bolan N, Hedley M, Harrison R, Braithwaite A (1990) Influence of manufacturing variables
on characteristics and the agronomic value of partially acidulated phosphate
fertilizers. Fertilizer research 26:119-138.
Bolan NS (1991) A critical review on the role of mycorrhizal fungi in the uptake of
phosphorus by plants. Plant and soil 134:189-207
Bonanomi G, Caporaso S, Allegrezza M (2006) Short-term effects of nitrogen enrichment,
litter removal and cutting on a Mediterranean grassland. Acta Oecologica 30:419-
425.
Bonfante P, Genre A (2008) Plants and arbuscular mycorrhizal fungi: an evolutionary-
developmental perspective. Trends in Plant Science 13:492-498.
Bornemann LC, Kookana RS, Welp G (2007) Differential sorption behaviour of aromatic
hydrocarbons on charcoals prepared at different temperatures from grass and wood.
Chemosphere 67:1033-1042.
Botha A (2011) The importance and ecology of yeasts in soil. Soil Biology and Biochemistry
43:1-8.
148
Bouma J (2014) Soil science contributions towards Sustainable Development Goals and
their implementation: linking soil functions with ecosystem services. Journal of
plant nutrition and soil science 177:111-120.
Bradley IM, Pinto AJ, Guest JS (2016) Design and Evaluation of Illumina MiSeq-
Compatible, 18S rRNA Gene-Specific Primers for Improved Characterization of
Mixed Phototrophic Communities. Applied and Environmental Microbiology
82:5878-5891..
Bradley K, Drijber RA, Knops J (2006) Increased N availability in grassland soils modifies
their microbial communities and decreases the abundance of arbuscular mycorrhizal
fungi. Soil Biology and Biochemistry 38:1583-1595.
Braunberger PG, Abbott LK, Robson AD (1996) Early vesicular-arbuscular mycorrhizal
colonisation in soil collected from an annual clover-based pasture in a Mediterranean
environment: soil temperature and the timing of autumn rains. Australian Journal of
Agricultural Research 48:103-110.
Braunberger PG, Miller MH, Peterson RL (1991) Effect of phosphorus nutrition on
morphological characteristics of vesicular-arbuscular mycorrhizal colonization of
maize. New Phytologist 119:107-113.
Bremner JM, Mulvaney CS (1982) Nitrogen total. Methods of soil analysis, part 2 American
Society of Agronomy and Soil Science Society of America, Madison,:595–624.
Brennan RF, Bolland MDA, Bowden JW. (2004) Potassium deficiency, and molybdenum
deficiency and aluminium toxicity due to soil acidification, have become problems
for cropping sandy soils in south-western Australia. Australian Journal of
Experimental Agriculture 44, 1031-1039.
Breuillin F et al. (2010) Phosphate systemically inhibits development of arbuscular
mycorrhiza in Petunia hybrida and represses genes involved in mycorrhizal
functioning. The Plant Journal 64:1002-1017.
Brewer CE, Brown RC (2012) Biochar-5.18
149
Broadbent FE (1965) Effect of fertilizer nitrogen on the release of soil nitrogen. Soil Science
Society of America Journal 29:692-696.
Bünemann EK, Oberson A, Frossard E (2010) Phosphorus in action: biological processes in
soil phosphorus cycling vol 26.Springer Science & Business Media.
Bureau of Meteorology (2018) Bureau of Meteorology. http://www.bom.gov.au/.
Cabello M, Irrazabal G, Bucsinszky AM, Saparrat M, Schalamuk S (2005) Effect of an
arbuscular mycorrhizal fungus, Glomus mosseae, and a rock‐phosphate‐solubilizing
fungus, Penicillium thomii, on Mentha piperita growth in a soilless medium. Journal
of Basic Microbiology 45:182-189.
Caldwell CR, Britz SJ, Mirecki RM (2005) Effect of temperature, elevated carbon dioxide,
and drought during seed development on the isoflavone content of dwarf soybean
[Glycine max (L.) Merrill] grown in controlled environments. Journal of
agricultural and food chemistry 53:1125-1129.
Cann MA (2000) Clay spreading on water repellent sands in the south east of South
Australia—promoting sustainable agriculture. Journal of Hydrology 231-232:333-
341.
Cantrell KB, Hunt PG, Uchimiya M, Novak JM, Ro KS (2012) Impact of pyrolysis
temperature and manure source on physicochemical characteristics of biochar.
Bioresource technology 107:419-428.
Carbonnel S, Gutjahr C (2014) Control of arbuscular mycorrhiza development by nutrient
signals. Frontiers in Plant Science 5, 462.
Carson WP, Peterson CJ (1990) The role of litter in an old-field community: impact of litter
quantity in different seasons on plant species richness and abundance. Oecologia
85:8-13.
Carvalho JLN, Raucci GS, Frazão LA, Cerri CEP, Bernoux M, Cerri CC (2014) Crop-
pasture rotation: A strategy to reduce soil greenhouse gas emissions in the Brazilian
Cerrado. Agriculture, Ecosystems & Environment 183:167-175.
150
Chagnon P-L, Bradley RL, Klironomos JN (2012) Using ecological network theory to
evaluate the causes and consequences of arbuscular mycorrhizal community
structure. New Phytologist 194:307-312.
Chan KY, Heenan DP (1999) Lime-induced loss of soil organic carbon and effect on
aggregate stability. Soil Science Society of America Journal 63:1841-1844.
Chan KY, Xu Z (2009) Biochar: nutrient properties and their enhancement. Biochar for
environmental management: science and technology 1:67-84.
Change IPOC (2007) Climate change 2007: The physical science basis Agenda 6:333
Chapman D et al. (2003) Effects of grazing method and fertiliser inputs on the productivity
and sustainability of phalaris-based pastures in Western Victoria. Animal Production
Science 43:785-798.
Chen S, Hammond L (1988) Agronomic evaluation of Partially Acidulated Phosphate Rocks
in the Tropics IFDC's Experience IFDC 7.
Chen Y-L, Zhang X, Ye J-S, Han H-Y, Wan S-Q, Chen B-D (2014) Six-year fertilization
modifies the biodiversity of arbuscular mycorrhizal fungi in a temperate steppe in
Inner Mongolia. Soil Biology and Biochemistry 69:371-381.
Clare A, Barnes A, McDonagh J, Shackley S (2014) From rhetoric to reality: farmer
perspectives on the economic potential of biochar in China. International Journal of
Agricultural Sustainability 12:440-458.
Clark RB (1997) Arbuscular mycorrhizal adaptation, spore germination, root colonization,
and host plant growth and mineral acquisition at low pH. Plant and Soil 192:15-22.
Clark RB, Zeto SK (1996) Mineral acquisition by mycorrhizal maize grown on acid and
alkaline soil. Soil Biology and Biochemistry 28:1495-1503.
Cocks PS (2001) Ecology of herbaceous perennial legumes: a review of characteristics that
may provide management options for the control of salinity and waterlogging in
dryland cropping systems. Australian Journal of Agricultural Research 52:137-151.
151
Colwell JD (1963) The estimation of the phosphorus fertilizer requirements of wheat in
southern New South Wales by soil analysis. Australian Journal of Experimental
Agriculture 3:190-197.
Coventry D, Hirth J (1992) Effects of tillage and lime on Rhizobium trifolii populations and
survival in wheat-subterranean clover rotation in southeastern. Australia Soil and
Tillage Research 25:67-74.
Cui M, Caldwell MM (1996) Facilitation of plant phosphate acquisition by arbuscular
mycotrhizas from enriched soil patches. New Phytologist 133:453-460.
Cui X, Hu J, Wang J, Yang J, Lin X (2016) Reclamation negatively influences arbuscular
mycorrhizal fungal community structure and diversity in coastal saline-alkaline land
in Eastern China as revealed by Illumina sequencing. Applied Soil Ecology 98:140-
149.
Cullen B, Chapman D, Quigley P (2006) Comparative responses of Lolium perenne and
Phalaris aquatica to multiple growth stresses. Australian Journal of Experimental
Agriculture 46:1131-1138.
Dann P, Derrick J, Dumaresq D, Ryan M (1996) The response of organic and conventionally
grown wheat to superphosphate and reactive phosphate rock. Australian Journal of
Experimental Agriculture 36:71-78.
Davis EA, Young JL, Rose SL (1984) Detection of high-phosphorus tolerant VAM-fungi
colonizing hops and peppermint. Plant and Soil 81:29-36.
De Beenhouwer M, Van Geel M, Ceulemans T, Muleta D, Lievens B, Honnay O (2015)
Changing soil characteristics alter the arbuscular mycorrhizal fungi communities of
Arabica coffee (Coffea arabica) in Ethiopia across a management intensity gradient.
Soil Biology and Biochemistry 91:133-139.
de Moraes JF, Volkoff B, Cerri CC, Bernoux M (1996) Soil properties under Amazon forest
and changes due to pasture installation in Rondônia, Brazil. Geoderma 70:63-81.
Decipher (2018) Decipher. https://www.decipher.com.au/what-can-decipher-do/.

152
del Mar Alguacil M, Lozano Z, Campoy MJ, Roldán A (2010) Phosphorus fertilisation
management modifies the biodiversity of AM fungi in a tropical savanna forage
system. Soil Biology and Biochemistry 42:1114-1122.
Dhillion SS, Gardsjord TL (2004) Arbuscular mycorrhizas influence plant diversity,
productivity, and nutrients in boreal grasslands. Canadian Journal of Botany 82:104-
114
Dickhoefer U, Buerkert A, Brinkmann K, Schlecht E (2010) The role of pasture management
for sustainable livestock production in semi-arid subtropical mountain regions.
Journal of Arid Environments 74:962-972.
Ding Y, Liu Y-X, Wu W-X, Shi D-Z, Yang M, Zhong Z-K (2010) Evaluation of biochar
effects on nitrogen retention and leaching in multi-layered soil columns. Water, Air,
& Soil Pollution 213:47-55.
Dolling P, Moody P, Noble A, Helyar K, Hughes B, Reuter D, Sparrow L (2001) Australian
Dryland and Salinity Assessment 2000: extent, impacts, processes, monitoring and
management options. National Land and Water Resources Audit Commonwealth of
Australia: Canberra
Dolling PJ (2001) Water use and drainage under phalaris, annual pasture, and crops on a
duplex soil in Western Australia. Australian Journal of Agricultural Research
52:305-316.
Donald CM (1963) Competition among crop and pasture plants. Advances in agronomy
15:1-118.
Douds DD, Schenck NC (1990) Relationship of colonization and sporulation by VA
mycorrhizal fungi to plant nutrient and carbohydrate contents. New Phytologist
116:621-627.
Dumbrell AJ, Nelson M, Helgason T, Dytham C, Fitter AH (2010) Idiosyncrasy and
overdominance in the structure of natural communities of arbuscular mycorrhizal
fungi: is there a role for stochastic processes. Journal of Ecology 98:419-428.
153
Duponnois R, Colombet A, Hien V, Thioulouse J (2005) The mycorrhizal fungus Glomus
intraradices and rock phosphate amendment influence plant growth and microbial
activity in the rhizosphere of Acacia holosericea. Soil biology and Biochemistry
37:1460-1468.
During C, Weeda W, Dorofaeff F (1973) Some effects of cattle dung on soil properties,
pasture production, and nutrient uptake: II. Influence of dung and fertilisers on
sulphate sorption, pH, cation-exchange capacity, and the potassium, magnesium,
calcium, and nitrogen economy. New Zealand journal of agricultural research
16:431-438.
Eom A-H, Hartnett DC, Wilson GW (2000) Host plant species effects on arbuscular
mycorrhizal fungal communities in tallgrass prairie. Oecologia 122:435-444.
Eom A-H, Hartnett DC, Wilson GW, Figge DA (1999) The effect of fire, mowing and
fertilizer amendment on arbuscular mycorrhizas in tallgrass prairie. The American
Midland Naturalist 142:55-70.
Eom A, Lee S, Ahn T., Lee M (1994) Ecological roles of arbuscular mycorrhizal fungi in
two wild legume plants. Mycoscience 35:69-75.
Erland S, Taylor AFS (2003) Diversity of ecto-mycorrhizal fungal communities in relation
to the abiotic environment. In: Mycorrhizal ecology. Springer, pp 163-200.
Evans D, Miller M (1990) The role of the external mycelial network in the effect of soil
disturbance upon vesicular—arbuscular mycorrhizal colonization of maize. New
Phytologist 114:65-71.
Facelli JM (1994) Multiple indirect effects of plant litter affect the establishment of woody
seedlings in old fields. Ecology:1727-1735.
Fageria NK, Baligar VC (2003) Fertility management of tropical acid soils for sustainable
crop production. Handbook of soil acidity:359-385.
Fahnestock JT, Detling JK (1999) The influence of herbivory on plant cover and species
composition in the Pryor Mountain Wild Horse Range, USA. Plant Ecology
144:145-157.
154
Fargione J, Brown CS, Tilman D (2003) Community assembly and invasion: an
experimental test of neutral versus niche processes. Proceedings of the National
Academy of Sciences 100:8916-8920
Farrell M et al. (2013) Microbial utilisation of biochar-derived carbon. Science of The Total
Environment 465:288-297.
Fellbaum CR et al. (2012) Carbon availability triggers fungal nitrogen uptake and transport
in arbuscular mycorrhizal symbiosis. Proceedings of the National Academy of
Sciences of the United States of America 109:2666-2671.
Fierer N, Jackson RB (2006) The diversity and biogeography of soil bacterial communities.
Proceedings of the National Academy of Sciences, 103(3), 626-631.
Firestone M, Killham K, McColl J (1983) Fungal toxicity of mobilized soil aluminum and
manganese. Applied and environmental microbiology 46:758-761.
Fitter A (1987) An architectural approach to the comparative ecology of plant root systems.
New phytologist 106:61-77.
Flis S, Glenn A, Dilworth M (1993) The interaction between aluminium and root nodule
bacteria. Soil Biology and Biochemistry 25:403-417.
Flower KC, Cordingley N, Ward PR, Weeks C (2012) Nitrogen, weed management and
economics with cover crops in conservation agriculture in a Mediterranean climate.
Field Crops Research 132:63-75.
Foehse D, Jungk A (1983) Influence of phosphate and nitrate supply on root hair formation
of rape, spinach and tomato plants. Plant and Soil 74:359-368.
Frame J, Newbould P (1986) Agronomy of White Clover. Advances in Agronomy, vol 40.
Academic Press, pp 1-88.
Francis AJ (1982) Effects of acidic precipitation and acidity on soil microbial processes.
Water, Air, and Soil Pollution 18:375-394.
Gahoonia TS, Nielsen NE (1997) Variation in root hairs of barley cultivars doubled soil
phosphorus uptake. Euphytica 98:177-182.
155
Galloway JN, Winiwarter W, Leip A, Leach AM, Bleeker A, Erisman JW (2014) Nitrogen
footprints: past, present and future. Environmental Research Letters 9:115003.
Gamper HA, Walker C, Schussler A (2009) Diversispora celata sp. nov: molecular ecology
and phylotaxonomy of an inconspicuous arbuscular mycorrhizal fungus. New
phytologist 182:495-506.
Gange AC, Brown VK, Sinclair GS (1993) Vesicular-arbuscular mycorrhizal fungi: a
determinant of plant community structure in early succession. Functional Ecology:
616-622.
Gao Y, Wang D, Ba L, Bai Y, Liu B (2008) Interactions between herbivory and resource
availability on grazing tolerance of Leymus chinensis. Environmental and
Experimental Botany 63:113-122.
Garbeva P, Van Veen JA, Van Elsas JD (2004) Microbial diversity in soil: selection of
microbial populations by plant and soil type and implications for disease
suppressiveness. Annual Reviews Phytopathol 42:243-270.
Garnett E, Jonsson LM, Dighton J, Murnen K (2004) Control of pitch pine seed germination
and initial growth exerted by leaf litters and polyphenolic compounds. Biology and
fertility of soils 40:421-426.
Gaskin J, Steiner C, Harris K, Das K, Bibens B (2008) Effect of low-temperature pyrolysis
conditions on biochar for agricultural use. Transactions of the American Society of
Agricultural and Biological Engineers 51:2061-2069.
Gaur A, Adholeya A (2000) Effects of the particle size of soil-less substrates upon AM
fungus inoculum production. Mycorrhiza 10:43-48.
Gazey C, Abbott LK, Robson AD (1992) The rate of development of mycorrhizas affects
the onset of sporulation and production of external hyphae by two species of
Acaulospora. Mycological Research 96:643-650.
Geel M, Ceustermans A, Hemelrijck W, Lievens B, Honnay O (2015) Decrease in diversity
and changes in community composition of arbuscular mycorrhizal fungi in roots of

156
apple trees with increasing orchard management intensity across a regional scale.
Molecular ecology 24:941-952.
George E, Marschner H, Jakobsen I (1995) Role of arbuscular mycorrhizal fungi in uptake
of phosphorus and nitrogen from soil. Critical Reviews in Biotechnology 15:257-
270.
Giovannetti M, Mosse B (1980) An evaluation of techniques for measuring vesicular
arbuscular mycorrhizal infection in roots. New phytologist 84:489-500.
Glaser B, Lehmann J, Zech W (2002) Ameliorating physical and chemical properties of
highly weathered soils in the tropics with charcoal-a review. Biology and fertility of
soils 35:219-230.
Goh K, Condron L, Harrison R, Rajan S, Braithwaite A Plant availability of Phosphorous in
‘Longlife’and Partially Acidulated Phosphate Rock Fertilisers: A Critical Review.
In: Proceedings of New Zealand fertilizer manufacture rsresearch association
conference, 1990. pp 219-240.
Goldberg DE, Miller TE (1990) Effects of different resource additions of species diversity
in an annual plant community. Ecology 71:213-225.
Goldberg DE, Werner PA (1983) The effects of size of opening in vegetation and litter cover
on seedling establishment of goldenrods (Solidago spp.). Oecologia 60:149-155.
Gollotte A, Van Tuinen D, Atkinson D (2004) Diversity of arbuscular mycorrhizal fungi
colonising roots of the grass species Agrostis capillaris and Lolium perenne in a field
experiment. Mycorrhiza 14:111-117.
Gomez JD, Denef K, Stewart CE, Zheng J, Cotrufo MF (2014) Biochar addition rate
influences soil microbial abundance and activity in temperate soils. European
Journal of Soil Science 65:28-39..
Göransson P, Olsson PA, Postma J, Falkengren-Grerup U (2008) Colonisation by arbuscular
mycorrhizal and fine endophytic fungi in four woodland grasses – variation in
relation to pH and aluminium. Soil Biology and Biochemistry 40:2260-2265.
157
Gosling P, Mead A, Proctor M, Hammond JP, Bending GD (2013) Contrasting arbuscular
mycorrhizal communities colonizing different host plants show a similar response to
a soil phosphorus concentration gradient. New Phytologist 198:546-556.
Graber E, Tsechansky L, Mayzlish-Gati E, Shema R, Koltai H (2015) A humic substances
product extracted from biochar reduces Arabidopsis root hair density and length
under P-sufficient and P-starvation conditions. Plant and soil 395:21-30.
Graham JH, Leonard RT, Menge JA (1981) Membrane-Mediated Decrease in Root
Exudation Responsible for Phorphorus Inhibition of Vesicular-Arbuscular
Mycorrhiza Formation. Plant Physiology 68:548-552..
Green EK, Galatowitsch SM (2002) Effects of Phalaris arundinacea and nitrate-N addition
on the establishment of wetland plant communities. Journal of Applied Ecology
39:134-144.
Greub LJ, Drolsom PN, Rohweder DA (1985) Salt Tolerance of Grasses and Legumes for
Roadside Use1. Agronomy Journal 77:76-80.
Griggs DJ, Noguer M (2002) Climate change 2001: the scientific basis. Contribution of
working group I to the third assessment report of the intergovernmental panel on
climate change Weather 57:267-269.
Grime J (1979) Plant strategies and vegetation processes, and ecosystem properties John
Wiley & Sons.
Grime JP (1973) Competitive exclusion in herbaceous vegetation. Nature, UK 242:344-347
Grover SP, Butterly CR, Wang X, Tang C (2017) The short-term effects of liming on organic
carbon mineralisation in two acidic soils as affected by different rates and application
depths of lime. Biology and Fertility of Soils 53:431-443.
Guissou T, Ba A, Guinko S, Duponnois R, Plenchette C (1998) Rock phosphate and
vesicular-arbuscular mycorrhiza effects on growth and mineral nutrition of Zizyphus
mauritiana Lam. in an alkaline soil. Annales des Sciences Forestieres (France).
158
Gul S, Whalen JK, Thomas BW, Sachdeva V, Deng H (2015) Physico-chemical properties
and microbial responses in biochar-amended soils: Mechanisms and future
directions. Agriculture, Ecosystems & Environment 206:46-59.
Gundale MJ, DeLuca TH (2006) Temperature and source material influence ecological
attributes of ponderosa pine and Douglas-fir charcoal. Forest ecology and
management 231:86-93.
Guo YJ, Ni Y, Raman H, Wilson BAL, Ash GJ, Wang AS, Li GD (2012) Arbuscular
mycorrhizal fungal diversity in perennial pastures; responses to long-term lime
application. Plant and Soil 351:389-403.
Gyaneshwar P, Kumar GN, Parekh L, Poole P (2002) Role of soil microorganisms in
improving P nutrition of plants. Plant and soil 245:83-93.
Hagin J, Harrison R (1993) Phosphate rocks and partially-acidulated phosphate rocks as
controlled release P fertilizers. Fertilizer research 35:25-31.
Halvorson AD, Reule CA (1980) Alfalfa for Hydrologic Control of Saline Seeps1. Soil
Science Society of America Journal 44:370-374.
Hamel C, Barrantes-Cartín U, Furlan V, Smith DL (1991) Endomycorrhizal fungi in
nitrogen transfer from soybean to maize. Plant and Soil 138:33-40.
Hamel C, Dalpé Y, Lapierre C, Simard RR, Smith DL (1996) Endomycorrhizae in a newly
cultivated acidic meadow: Effects of three years of barley cropping, tillage, lime,
and phosphorus on root colonization and soil infectivity. Biology and fertility of soils
21:160-165.
Hamel C, Furlan V, Smith DL (1992) Mycorrhizal Effects on Interspecific Plant
Competition and Nitrogen Transfer in Legume-Grass Mixtures. Crop Science
32:991-996.
Hammond L, Chien S, Mokwunye A (1986) Agronomic value of unacidulated and partially
acidulated phosphate rocks indigenous to the tropics. In: Advances in Agronomy, vol
40. Elsevier, pp 89-140
159
Hamza MA, Anderson WK (2002) Improving soil physical fertility and crop yield on a clay
soil in Western Australia. Australian Journal of Agricultural Research 53:615-620.
Harris W (1987) Population dynamics and competition. In ‘White clover’. (Eds Baker MJ,
WM Williams) pp. 203–297. (CAB International: Wallingford, UK).
Hart MM et al. (2015) Navigating the labyrinth: a guide to sequence-based, community
ecology of arbuscular mycorrhizal fungi.New phytologist 207:235-247.
Hart MM, Reader RJ, Klironomos JN (2001) Life-history strategies of arbuscular
mycorrhizal fungi in relation to their successional dynamics. Mycologia:1186-1194.
Hart MM, Reader RJ, Klironomos JN (2003) Plant coexistence mediated by arbuscular
mycorrhizal fungi. Trends in Ecology & Evolution 18:418-423.
Hartnett DC, Wilson GWT (1999) Mycorrhizae influence plant community structure and
diversity in tallgrass prairie. Ecology 80:1187-1195.
Hayman D (1983) The physiology of vesicular–arbuscular endomycorrhizal symbiosis.
Canadian Journal of Botany 61:944-963.
Haynes R (1980) Competitive aspects of the grass-legume association. In: Advances in
agronomy, vol 33. Elsevier, pp 227-261.
Haynes R (1982) Effects of liming on phosphate availability in acid soils. Plant and soil
68:289-308.
Heckrath G, Brookes P, Poulton P, Goulding K (1995) Phosphorus leaching from soils
containing different phosphorus concentrations in the Broadbalk experiment.
Journal of environmental quality 24:904-910.
Helgason T, Merryweather J, Denison J, Wilson P, Young JPW, Fitter A (2002) Selectivity
and functional diversity in arbuscular mycorrhizas of co‐occurring fungi and plants
from a temperate deciduous woodland. Journal of Ecology 90:371-384.
Henry HA, Chiariello NR, Vitousek PM, Mooney HA, Field CB (2006) Interactive effects
of fire, elevated carbon dioxide, nitrogen deposition, and precipitation on a
California annual grassland. Ecosystems 9:1066-1075.

160
Hepper CM (1983) The effect of nitrate and phosphate on the vesicular‐arbuscular
mycorrhizal infection of lettuce. New Phytologist 93:389-399.
Higo M, Isobe K, Yamaguchi M, Drijber RA, Jeske ES, Ishii R (2013) Diversity and vertical
distribution of indigenous arbuscular mycorrhizal fungi under two soybean rotational
systems. Biology and Fertility of Soils 49:1085-1096.
Hille M, Den Ouden J (2005) Charcoal and activated carbon as adsorbate of phytotoxic
compounds–a comparative study. Oikos 108:202-207
Hinsinger P (2001) Bioavailability of soil inorganic P in the rhizosphere as affected by root-
induced chemical changes: a review. Plant and soil 237:173-195.
Hinsinger P et al. (2011) P for two, sharing a scarce resource: soil phosphorus acquisition in
the rhizosphere of intercropped species Plant Physiology 156:1078-1086.
Hirrel MC (1981) The Effect of Sodium and Chloride Salts on the Germination of Gigaspora
margarita. Mycologia 73:610-617.
Hobbie SE (1992) Effects of plant species on nutrient cycling. Trends in ecology & evolution
7:336-339.
Høgh-Jensen H, Schjoerring J (2010) Interactions between nitrogen, phosphorus and
potassium determine growth and N2-fixation in white clover and ryegrass leys.
Nutrient Cycling in Agroecosystems 87:327–338.
Hook PB, Lauenroth WK, Burke IC (1994) Spatial Patterns of Roots in a Semiarid
Grassland: Abundance of Canopy Openings and Regeneration Gaps. Journal of
Ecology 82:485-494.
Howden SM, Crimp SJ, Stokes CJ (2008) Climate change and Australian livestock systems:
impacts, research and policy issues. Australian Journal of Experimental Agriculture
48:780-788.
Howieson JG, O’Hara GW, Carr SJ (2000) Changing roles for legumes in Mediterranean
agriculture: developments from an Australian perspective. Field Crops Research
65:107-122.
161
Huenneke LF, Hamburg SP, Koide R, Mooney HA, Vitousek PM (1990) Effects of soil
resources on plant invasion and community structure in Californian serpentine
grassland. Ecology 71:478-491.
Huston MA et al. (2000) No consistent effect of plant diversity on productivity. Science
289:1255a-1255.
Huston MA, DeAngelis DL (1994) Competition and coexistence: the effects of resource
transport and supply rates. American Naturalist:954-977.
Hutchings JW (1972) Climates of Australia and New Zealand—World Survey of
Climatology, 13: J. Gentilli (Editor). Elsevier, Amsterdam, 1971, 405 pp., 141 fig.,
112 tables, Dfl. 145 Palaeoecology 11:151-154.
Illmer P, Schinner F (1991) Effects of lime and nutrient salts on the microbiological
activities of forest soils. Biology and fertility of soils 11:261-266.
Ingerslev M (1997) Effects of liming and fertilization on growth, soil chemistry and soil
water chemistry in a Norway spruce plantation on a nutrient-poor soil in Denmark.
Forest ecology and Management 92:55-66.
Ishii T, Kadoya K (1994) Effects of charcoal as a soil conditioner on citrus growth and
vesicular-arbuscular mycorrhizal development. Journal of the Japanese Society for
Horticultural Science , 63(3), 529-535.
Jackman RH, Mouat MCH (1972) Competition between grass and clover for phosphate.
New Zealand Journal of Agricultural Research 15:667-675.
Jackson R, Caldwell M (1989) The timing and degree of root proliferation in fertile-soil
microsites for three cold-desert perennials. Oecologia 81:149-153.
Jakobsen I (1986) Vesicular-arbuscular mycorrhiza in field-grown crops. III. Mycorrhizal
infection and rates of phosphorus inflow in pea plants. New Phytologist:573-581.
Jakobsen I, Abbott L, Robson A (1992) External hyphae of vesicular‐arbuscular mycorrhizal
fungi associated with Trifolium subterraneum L. New Phytologist 120:371-380.
162
Jakobsen I, Rosendahl L (1990) Carbon flow into soil and external hyphae from roots of
mycorrhizal cucumber plants. New Phytologist 115:77-83.
Jansa J, Mozafar A, Anken T, Ruh R, Sanders I, Frossard E (2002) Diversity and structure
of AMF communities as affected by tillage in a temperate soil. Mycorrhiza 12:225-
234.
Janssens F, Peeters A, Tallowin J, Bakker J, Bekker R, Fillat F, Oomes M (1998)
Relationship between soil chemical factors and grassland diversity. Plant and soil
202:69-78.
Jasper D, Abbott L, Robson A (1989) Soil disturbance reduces the infectivity of external
hyphae of vesicular—arbuscular mycorrhizal fungi. New Phytologist 112:93-99.
Jenkins SN, Waite IS, Blackburn A, Husband R, Rushton SP, Manning DC, O'Donnell AG
(2009) Actinobacterial community dynamics in long term managed grasslands
Antonie Van Leeuwenhoek 95:319-334.
Jensen A, Jakobsen I (1980) The occrrence of vesicular-arbuscular mycorrhiza in barley and
wheat grown in some Danish soils with different fertilizer treatments. Plant and Soil
55:403-414
Johansen RB, Johnston P, Mieczkowski P, Perry GLW, Robeson MS, Burns BR, Vilgalys
R (2016) A native and an invasive dune grass share similar, patchily distributed,
root-associated fungal communities. Fungal Ecology 23:141-155.
Johnson D et al. (2004) Plant communities affect arbuscular mycorrhizal fungal diversity
and community composition in grassland microcosms. New phytologist 161:503-
515.
Johnson N, Graham JH, Smith F (1997) Functioning of mycorrhizal associations along the
mutualism–parasitism continuum. New phytologist 135:575-585.
Johnson NC (1993) Can Fertilization of Soil Select Less Mutualistic Mycorrhizae?
Ecological Applications 3:749-757.
Johnson NC (2010) Resource stoichiometry elucidates the structure and function of
arbuscular mycorrhizas across scales. New Phytologist 185:631-647.
163
Johnson NC, Angelard C, Sanders IR, Kiers ET (2013) Predicting community and
ecosystem outcomes of mycorrhizal responses to global change. Ecology Letters
16:140-153.
Johnson NC, Pfleger F, Crookston R, Simmons SR, Copeland PJ (1991a) Vesicular–
arbuscular mycorrhizas respond to corn and soybean cropping history. New
Phytologist 117:657-663.
Johnson NC, Rowland DL, Corkidi L, Egerton-Warburton LM, Allen EB (2003) Nitrogen
enrichment alters mycorrhizal allocation at five mesic to semiarid grasslands.
Ecology 84:1895-1908.
Johnson NC, Wilson GW, Bowker MA, Wilson JA, Miller RM (2010) Resource limitation
is a driver of local adaptation in mycorrhizal symbioses. Proceedings of the National
Academy of Sciences 107:2093-2098.
Johnson NC, Zak DR, Tilman D, Pfleger F (1991b) Dynamics of vesicular-arbuscular
mycorrhizae during old field succession. Oecologia 86:349-358.
Jorquera M, Martínez O, Marileo L, Acuña J, Saggar S, Mora M (2014) Effect of nitrogen
and phosphorus fertilization on the composition of rhizobacterial communities of
two Chilean Andisol pastures. World Journal of Microbiology and Biotechnology
30:99-107.
Jumpponen A, Trowbridge J, Mandyam K, Johnson L (2005) Nitrogen enrichment causes
minimal changes in arbuscular mycorrhizal colonization but shifts community
composition—evidence from rDNA data. Biology and Fertility of Soils 41:217-224.
Kahiluoto H, Ketoja E, Vestberg M (2000) Promotion of utilization of arbuscular
mycorrhiza through reduced P fertilization 1. Bioassays in a growth chamber. Plant
and Soil 227:191-206.
Kamphake LJ, Hannah SA, Cohen JM (1967) Automated analysis for nitrate by hydrazine
reduction. Water research 1:205-216.
164
Kang L, Han X, Zhang Z, Sun OJ (2007) Grassland ecosystems in China: review of current
knowledge and research advancement Philosophical Transactions of the Royal
Society of London B: Biological Sciences 362:997-1008.
Kårén O, Nylund J-E (1997) Effects of ammonium sulphate on the community structure and
biomass of ectomycorrhizal fungi in a Norway spruce stand in southwestern Sweden.
Canadian Journal of Botany 75:1628-1642.
Keech O, Carcaillet C, Nilsson M-C (2005) Adsorption of allelopathic compounds by wood-
derived charcoal: the role of wood porosity. Plant and Soil 272:291-300.
Kemmitt SJ, Wright D, Goulding KWT, Jones DL (2006) pH regulation of carbon and
nitrogen dynamics in two agricultural soils. Soil Biology and Biochemistry 38:898-
911.
Kemmitt SJ, Wright D, Jones DL (2005) Soil acidification used as a management strategy
to reduce nitrate losses from agricultural land. Soil Biology and Biochemistry
37:867-875.
Kempers AJ, Luft AG (1988) Re-examination of the determination of environmental nitrate
as nitrite by reduction with hydrazine. Analyst 113:1117-1120.
Keyser P, Kirk TK, Zeikus JG (1978) Ligninolytic enzyme system of Phanaerochaete
chrysosporium: synthesized in the absence of lignin in response to nitrogen
starvation. Journal of bacteriology 135:790-797.
Khasawneh F, Doll E (1979) The use of phosphate rock for direct application to soils. In: .
Advances in agronomy, vol 30. Elsevier, pp 159-206.
King P (1984) Crop and pasture rotations at Coonalpyn, South Australia: effects on soil-
borne diseases, soil nitrogen and cereal production. Australian Journal of
Experimental Agriculture 24:555-564.
Kivlin SN, Hawkes CV, Treseder KK (2011) Global diversity and distribution of arbuscular
mycorrhizal fungi. Soil Biology and Biochemistry 43:2294-2303.
165
Klabi R, Hamel C, Schellenberg MP, Iwaasa A, Raies A, St-Arnaud M (2014) Interaction
between legume and arbuscular mycorrhizal fungi identity alters the competitive
ability of warm-season grass species in a grassland community. Soil Biology and
Biochemistry 70:176-182.
Klironomos J, Rillig M, Allen M (1996) Below-ground microbial and microfaunal responses
to Artemisia tridentata grown under elevated atmospheric CO2.Functional
Ecology:527-534.
Koide RT (1991) Nutrient supply, nutrient demand and plant response to mycorrhizal
infection. New phytologist 117:365-386.
Kothari S, Marschner H, Römheld V (1990) Direct and indirect effects of VA mycorrhizal
fungi and rhizosphere microorganisms on acquisition of mineral nutrients by maize
(Zea mays L.) in a calcareous soil. New Phytologist 116:637-645.
Krom MD (1980) Spectrophotometric determination of ammonia: a study of a modified
Berthelot reaction using salicylate and dichloroisocyanurate. Analyst 105:305-316.
Krüger M, Stockinger H, Krüger C, Schüßler A (2009) DNA-based species level detection
of Glomeromycota: one PCR primer set for all arbuscular mycorrhizal fungi. New
Phytologist 183:212-223.
Kucey RMN (1983) Phosphate-solubilizing bacteria and fungi in various cultivated and
virgin Alberta soils. Canadian Journal of Soil Science 63:671-678.
Kucey RMN, Gamal Eldin SD (1984) Effects of Lime, Phosphorus, and Addition of
Vesicular-Arbuscular (VA) Mycorrhizal Fungi on Indigenous VA Fungi and on
Growth of Alfalfa in a Moderately Acidic Soil. New Phytologist 98:481-486.
Lane DJ (1991) 16S/23S rRNA sequencing , p. 115-175. In E. Stackebrandt and M.
Goodfellow (ed.), Nucleic acid techniques in bacterial systematics. John Wiley &
Sons, New York.Lane DJ, Pace B, Olsen GJ, Stahl DA, Sogin ML, Pace NR (1985)
Rapid determination of 16S ribosomal RNA sequences for phylogenetic analyses.
Proceedings of the National Academy of Sciences 82:6955-6959.
166
Lauber CL, Strickland MS, Bradford MA, Fierer N (2008) The influence of soil properties
on the structure of bacterial and fungal communities across land-use types. Soil
Biology and Biochemistry 40:2407-2415
Lee J, Lee S, Young JPW (2008) Improved PCR primers for the detection and identification
of arbuscular mycorrhizal fungi. Federation of European Microbiological Societies
Microbiology Ecology 65:339-349.
Lehmann J, Gaunt J, Rondon M (2006) Bio-char sequestration in terrestrial ecosystems–a
review. Mitigation and adaptation strategies for global change 11:395-419.
Lehmann J, Joseph S (2009) Biochar for environmental management: science and
technology. Earthscan,
Lehmann J, Joseph S (2012) Biochar for Environmental Management : Science and
Technology
Lehmann J, Rillig MC, Thies J, Masiello CA, Hockaday WC, Crowley D (2011) Biochar
effects on soil biota – A review. Soil Biology and Biochemistry 43:1812-1836.
Lekberg Y, Meadow J, Rohr JR, Redecker D, Zabinski CA (2011) Importance of dispersal
and thermal environment for mycorrhizal communities: lessons from Yellowstone
National Park. Ecology 92:1292-1302.
Lemaire G, Gastal F, Franzluebbers A, Chabbi A (2015) Grassland–Cropping Rotations: An
Avenue for Agricultural Diversification to Reconcile High Production with
Environmental Quality. Environmental Management 56:1065-1077.
Li AR, Guan KY, Stonor R, Smith SE, Smith FA (2013) Direct and indirect influences of
arbuscular mycorrhizal fungi on phosphorus uptake by two root hemiparasitic
Pedicularis species: do the fungal partners matter at low colonization levels? Annals
Botany 112:1089-1098.
Li J et al. (2015) Effects of nitrogen and phosphorus addition on soil microbial community
in a secondary tropical forest of China. Biology and Fertility of Soils 51:207-215.
167
Li X, Gai J, Cai X, Li X, Christie P, Zhang F, Zhang J (2014) Molecular diversity of
arbuscular mycorrhizal fungi associated with two co-occurring perennial plant
species on a Tibetan altitudinal gradient. Mycorrhiza 24:95-107.
Liang B et al. (2006) Black carbon increases cation exchange capacity in soils. Soil Science
Society of America Journal 70:1719-1730.
Liang ZB, Lee DJ, Dweikat IM, Wedin DA, Yuen GY, Drijber RA (2017) Molecular
Diversity of Arbuscular Mycorrhizae in Roots of Juniperus virginiana Invasive to
Grasslands. Soil Science Society of America Journal 81:526-536.
Lin X, Feng Y, Zhang H, Chen R, Wang J, Zhang J, Chu H (2012a) Long-term balanced
fertilization decreases arbuscular mycorrhizal fungal diversity in an arable soil in
North China revealed by 454 pyrosequencing. Environmental science & technology
46:5764-5771.
Lin Y, Munroe P, Joseph S, Henderson R (2012b) Migration of dissolved organic carbon in
biochars and biochar-mineral complexes. Pesquisa Agropecuária Brasileira 47:677-
686.
Lin Y, Munroe P, Joseph S, Henderson R, Ziolkowski A (2012c) Water extractable organic
carbon in untreated and chemical treated biochars. Chemosphere 87:151-157.
Lindahl BD et al. (2013) Fungal community analysis by high-throughput sequencing of
amplified markers--a user's guide. New phytologist 199:288-299.
Linderman RG (1988) Mycorrhizal interactions with the rhizosphere microflora: the
mycorrhizosphere effect. Phytopathology 78:366-371.
Liu A, Hamel C, Hamilton R, Smith D (2000) Mycorrhizae formation and nutrient uptake
of new corn (Zea mays L.) hybrids with extreme canopy and leaf architecture as
influenced by soil N and P levels. Plant and Soil 221:157-166.
Liu Y et al. (2012) Direct and indirect influences of 8 yr of nitrogen and phosphorus
fertilization on Glomeromycota in an alpine meadow ecosystem. New Phytologist
194:523-535.
168
Long SP, Ainsworth EA, Leakey AD, Nosberger J, Ort DR (2006) Food for thought: lower-
than-expected crop yield stimulation with rising CO2 concentrations. Science
312:1918-1921.
Lou Y, Joseph S, Li L, Graber ER, Liu X, Pan G (2015) Water Extract from Straw Biochar
Used for Plant Growth Promotion: an initial test. BioResources, 11(1), 249-
266.Lumini E, Orgiazzi A, Borriello R, Bonfante P, Bianciotto V (2010) Disclosing
arbuscular mycorrhizal fungal biodiversity in soil through a land‐use gradient using
a pyrosequencing approach. Environmental microbiology 12:2165-2179.
Lundström US, Bain DC, Taylor AFS, Van Hees PAW (2003) Effects of acidification and
its mitigation with lime and wood ash on forest soil processes: a review. Water, Air
and Soil Pollution: Focus 3:5-28
Luo P, Han X, Wang Y, Han M, Shi H, Liu N, Bai H (2015) Influence of long-term
fertilization on soil microbial biomass, dehydrogenase activity, and bacterial and
fungal community structure in a brown soil of northeast China. Annals of
microbiology 65:533-542.
Lux HB, Cumming JR (2001) Mycorrhizae confer aluminum resistance to tulip-poplar
seedlings. Canadian Journal of Forest Research 31:694-702.
Ma Z, Bielenberg DG, Brown KM, Lynch JP (2001) Regulation of root hair density by
phosphorus availability in Arabidopsis thaliana. Plant, Cell & Environment 24:459-
467.
Macdonald LM, Farrell M, Zwieten LV, Krull ES (2014) Plant growth responses to biochar
addition: an Australian soils perspective. Biology and Fertility of Soils 50:1035-1045
Maddox JJ, Soileau JM (1991) Effects of phosphate fertilization, lime amendments and
inoculation with VA-mycorrhizal fungi on soybeans in an acid soil. Plant and Soil
134:83-93.
Mariko S, Nishimura N, Mo W, Matsui Y, Kibe T, Koizumi H (2000) Winter CO2 flux from
soil and snow surfaces in a cool-temperate deciduous forest. Japan Ecological
Research 15:363-372.
169
Mariotte P, Meugnier C, Johnson D, Thébault A, Spiegelberger T, Buttler A (2013)
Arbuscular mycorrhizal fungi reduce the differences in competitiveness between
dominant and subordinate plant species. Mycorrhiza 23:267-277.
Marschner H, Dell B (1994) Nutrient uptake in mycorrhizal symbiosis. Plant and Soil
159:89-102.
Marschner H, Kirkby EA, Cakmak I (1996) Effect of mineral nutritional status on shoot-
root partitioning of photoassimilates and cycling of mineral nutrients. Journal of
Experimental Botany 47:1255-1263.
Mårtensson AM, Carlgren K (1994) Impact of phosphorus fertilization on VAM diaspores
in two Swedish long-term field experiment. Agriculture, Ecosystems & Environment
47:327-334.
Masiello CA et al. (2013) Biochar and Microbial Signaling: Production Conditions
Determine Effects on Microbial Communication. Environmental Science &
Technology 47(20),11496-11503.
Matthias A, Blackmer A, Bremner J (1980) A Simple Chamber Technique for Field
Measurement of Emissions of Nitrous Oxide from Soils. Journal of Environmental
Quality 9:251-256.
Maucieri C, Zhang Y, McDaniel MD, Borin M, Adams MA (2017) Short-term effects of
biochar and salinity on soil greenhouse gas emissions from a semi-arid Australian
soil after re-wetting. Geoderma 307:267-276.
McArthur WM (1991) Reference soils of south-western Australia. Dept. of Agriculture,
Western Australia on behalf of the Australian Society of Soil Science,
McGonigle T, Fitter A (1990) Ecological specificity of vesicular-arbuscular mycorrhizal
associations. Mycological Research 94:120-122.
McGonigle T, Miller M, Evans D, Fairchild G, Swan J (1990) A New Method which Gives
an Objective Measure of Colonization of Roots by Vesicular-Arbuscular
Mycorrhizal Fungi. New Phytologist 115:495-501.
170
McLachlan K (1980) Nutrient problems in sown pasture on an acid soil. I. Survey of the
problems and suggested corrective treatments. Australian Journal of Experimental
Agriculture 20:319-326.
McMillen BG, Juniper S, Abbott LK (1998) Inhibition of hyphal growth of a vesicular-
arbuscular mycorrhizal fungus in soil containing sodium chloride limits the spread
of infection from spores. Soil Biology and Biochemistry 30:1639-1646.
McNaughton S (1985) Ecology of a grazing ecosystem: the Serengeti. Ecological
monographs 55:259-294.
McWilliam J, Clements R, Dowling P (1970) Some factors influencing the germination and
early seedling development of pasture plants. Australian journal of agricultural
research 21:19-32.
McWilliam J, Dowling P (1970) Factors influencing the germination and establishment of
pasture seed on the soil surface. Proceedings 11th int Grassld Congr, Surfers
Paradise, 1970:578-583.
Mendoza R, García I, Deplama D, López CF (2016) Competition and growth of a grass–
legume mixture fertilised with nitrogen and phosphorus: effect on nutrient
acquisition, root morphology and symbiosis with soil microorganisms. Crop and
Pasture Science 67:629-640.
Mendoza R, Pagani E (1997) Influence of phosphorus nutrition on mycorrhizal growth
response and morphology of mycorrhizae in Lotus tenuis. Journal of Plant Nutrition
20:625-639.
Mickan B (2014) Mechanisms for Alleviation of Plant Water Stress Involving Arbuscular
Mycorrhizas. In: Solaiman ZM, Abbott LK, Varma A (eds). Mycorrhizal Fungi: Use
in Sustainable Agriculture and Land Restoration. Springer Berlin Heidelberg,
Berlin, Heidelberg, pp 225-239.
Mickan BS, Abbott LK, Stefanova K, Solaiman ZM (2016) Interactions between biochar
and mycorrhizal fungi in a water-stressed agricultural soil. Mycorrhiza 26:565-574.

171
Mickan BS, Hart MM, Solaiman ZM, Jenkins S, Siddique KHM, Abbott LK (2017)
Molecular divergence of fungal communities in soil, roots and hyphae highlight the
importance of sampling strategies. Rhizosphere 4:104-111.
Minns A et al. (2001) The functioning of European grassland ecosystems: potential benefits
of biodiversity to agriculture. Outlook on AGRICULTURE, 30 (3), 179-185.
Mohanty P, Nanda S, Pant KK, Naik S, Kozinski JA, Dalai AK (2013) Evaluation of the
physiochemical development of biochars obtained from pyrolysis of wheat straw,
timothy grass and pinewood: effects of heating rate. Journal of Analytical and
Applied Pyrolysis 104:485-493.
Monaco TA, MacKown CT, Johnson DA, Jones TA, Norton JM, Norton JB, Redinbaugh
MG (2003) Nitrogen effects on seed germination and seedling growth. Journal of
Range management, 646-653.
Moore GA, Sanford P, Wiley T (2006) Perennial pastures for Western Australia
Morley F, Katznelson J (1965) Colonization in Australia by Trifolium subterraneum L The
Genetics of Colonizing Species, Academic Press,:269–282
Mosse B (1973) Advances in the study of vesicular-arbuscular mycorrhiza. Annual Review
of Phytopathology 11:171-196.
Mosse B, Hayman DS, Arnold DJ (1973) Plant growth responses to vesicular‐arbuscular
mycorrhiza v. Phosphate uptake by three plant species from p‐deficient soils labelled
with 32p. New Phytologist 72:809-815.
Mountford J, Lakhani K, Kirkham F (1993) Experimental assessment of the effects of
nitrogen addition under hay-cutting and aftermath grazing on the vegetation of
meadows on a Somerset peat moor. Journal of Applied Ecology:321-332.
Mukherjee A, Zimmerman AR, Harris W (2011) Surface chemistry variations among a
series of laboratory-produced biochars. Geoderma 163:247-255.
Munns R (2002) Comparative physiology of salt and water stress. Plant, Cell &
Environment 25:239-250.

172
Munns R (2005) Genes and salt tolerance: bringing them together. New Phytologist 167:645-
663.
Nadeem SM, Ahmad M, Zahir ZA, Javaid A, Ashraf M (2014) The role of mycorrhizae and
plant growth promoting rhizobacteria (PGPR) in improving crop productivity under
stressful environments. Biotechnology advances 32:429-448.
Nash DM et al. (2014) Using organic phosphorus to sustain pasture productivity: A
perspective. Geoderma 221-222:11-19.
Nath M, Bhatt D, Prasad R, Tuteja N (2017) Reactive Oxygen Species (ROS) Metabolism
and Signaling in Plant-Mycorrhizal Association Under Biotic and Abiotic Stress
Conditions. In: . Mycorrhiza-Eco-Physiology, Secondary Metabolites,
Nanomaterials. Springer, pp 223-232
Newbould P, Rangeley A (1984) Effect of lime, phosphorus and mycorrhizal fungi on
growth, nodulation and nitrogen fixation by white clover (Trifolium repens) grown
in UK hill soils. Plant and Soil 76:105-114.
Newman EI (1966) A method of estimating the total length of root in a sample. Journal of
applied Ecology:139-145.
Newman EI, Reddell P (1988) Relationship between mycorrhizal infection and diversity in
vegetation: evidence from the Great Smoky Mountains. Functional Ecology:259-
262.
Nichols P et al. (2008a) Production and persistence of annual pasture legumes at five saline
sites in southern Australia. Australian Journal of Experimental Agriculture 48:518-
535.
Nichols PGH, Malik AI, Stockdale M, Colmer TD (2008b) Salt tolerance and avoidance
mechanisms at germination of annual pasture legumes: importance for adaptation to
saline environments. Plant and Soil 315:241.
Nielsen KL, Bouma TJ, Lynch JP, Eissenstat DM (1998) Effects of phosphorus availability
and vesicular–arbuscular mycorrhizas on the carbon budget of common bean
(Phaseolus vulgaris). New Phytologist 139:647-656.
173
Niu D, Yuan X, Cease AJ, Wen H, Zhang C, Fu H, Elser JJ (2018) The impact of nitrogen
enrichment on grassland ecosystem stability depends on nitrogen addition level.
Science of The Total Environment 618:1529-1538.
Nouri E, Breuillin-Sessoms F, Feller U, Reinhardt D (2014) Phosphorus and Nitrogen
Regulate Arbuscular Mycorrhizal Symbiosis in Petunia hybrida PLoS One 9:1-14.
Novak JM, Cantrell KB, Watts DW (2013) Compositional and thermal evaluation of
lignocellulosic and poultry litter chars via high and low temperature pyrolysis.
Bioenergy Research 6:114-130.
Nowak RS, Ellsworth DS, Smith SD (2004) Functional responses of plants to elevated
atmospheric CO2 do photosynthetic and productivity data from FACE experiments
support early predictions? New Phytologist 162:253-280.
Oehl F, Laczko E, Bogenrieder A, Stahr K, Bösch R, van der Heijden M, Sieverding E
(2010) Soil type and land use intensity determine the composition of arbuscular
mycorrhizal fungal communities. Soil Biology and Biochemistry 42:724-738.
Oehl F, Redecker D, Sieverding E (2005) Glomus badium, a new sporocarpic mycorrhizal
fungal species from European grasslands with higher soil pH. Journal of applied
botany and food quality 79:38-43.
Oksanen J, Kindt R, Legendre P, O'Hara B, Stevens MHH, Oksanen MJ, Suggests M (2007)
The vegan package Community Ecology Package:631-637.
Olsson PA, Baath E, Jakobsen I (1997) Phosphorus effects on the mycelium and storage
structures of an arbuscular mycorrhizal fungus as studied in the soil and roots by
analysis of fatty acid signatures. Applied and Environmental Microbiology 63:3531-
3538.
Oomes M, Olff H, Altena H (1996) Effects of vegetation management and raising the water
table on nutrient dynamics and vegetation change in a wet grassland. Journal of
Applied Ecology:576-588.
Öpik M, Davison J (2016) Uniting species- and community-oriented approaches to
understand arbuscular mycorrhizal fungal diversity. Fungal Ecology 24:106-113.
174
Öpik M, Davison J, Moora M, Zobel M (2013a) DNA-based detection and identification of
Glomeromycota: the virtual taxonomy of environmental sequences. Botany 92:135-
147.
Opik M, Moora M, Zobel M, Saks U, Wheatley R, Wright F, Daniell T (2008) High diversity
of arbuscular mycorrhizal fungi in a boreal herb-rich coniferous forest New
phytologist 179:867-876
Opik M et al. (2010) The online database MaarjAM reveals global and ecosystemic
distribution patterns in arbuscular mycorrhizal fungi (Glomeromycota). New
phytologist 188:223-241.
Öpik M et al. (2013b) Global sampling of plant roots expands the described molecular
diversity of arbuscular mycorrhizal fungi. Mycorrhiza 23:411-430.
Orchard S et al. (2017a) Fine endophytes (Glomus tenue) are related to Mucoromycotina,
not Glomeromycota. New Phytologist 213:481-486.
Orchard S, Standish RJ, Nicol D, Dickie IA, Ryan MH (2017b) Sample storage conditions
alter colonisation structures of arbuscular mycorrhizal fungi and, particularly, fine
root endophyte. Plant and Soil 412:35-42.
Orloff LN, Mangold JM, Menalled FD (2013) Role of size and nitrogen in competition
between annual and perennial grasses. Invasive Plant Science and Management 6:87-
98.
Osler GH, Sommerkorn M (2007) Toward a complete soil C and N cycle: Incorporating the
soil funa. Ecology 88:1611-1621.
Pan Y et al. (2014) Impact of long-term N, P, K, and NPK fertilization on the composition
and potential functions of the bacterial community in grassland soil. Federation of
European Microbiological Societies microbiology ecology 90:195-205.
Parton WJ et al. (1993) Observations and modeling of biomass and soil organic matter
dynamics for the grassland biome worldwide. Global Biogeochemical Cycles 7:785-
809.
175
Peng S, Eissenstat DM, Graham JH, Williams K, Hodge NC (1993) Growth depression in
mycorrhizal citrus at high-phosphorus supply (analysis of carbon costs). Plant
physiology 101:1063-1071.
Pfetffer CM, Bloss HE (1988) Growth and nutrition of guayule (Parthenium argentatum) in
a saline soil as influenced by vesicular–arbuscular mycorrhiza and phosphorus
fertilization. New Phytologist 108:315-321.
Philippot L, Raaijmakers JM, Lemanceau P, van der Putten WH (2013) Going back to the
roots: the microbial ecology of the rhizosphere. Nature Reviews Microbiology
11:789.
Phoenix GK et al. (2012) Impacts of atmospheric nitrogen deposition: responses of multiple
plant and soil parameters across contrasting ecosystems in long-term field
experiments. Global change biology 18:1197-1215.
Pianka ER (2011) Evolutionary ecology. Eric R. Pianka.
Picone, C. (2000), Diversity and Abundance of Arbuscular–Mycorrhizal Fungus Spores in
Tropical Forest and Pasture. Biotropica, 32: 734-750.
Pirozynski KA, Malloch DW (1975) The origin of land plants: A matter of mycotrophism.
Biosystems 6:153-164.
Plummer AP (1943) germination and early seedling development of twelve range grasses.
Journal of the American Society of Agronomy
Porras-Alfaro A, Herrera J, Natvig D.O., Sinsabaugh RL (2007) Effect of long-term nitrogen
fertilization on mycorrhizal fungi associated with a dominant grass in a semiarid
grassland. Plant and Soil 296:65-75.
Porter W, Robson A, Abbott L (1987a) Factors controlling the distribution of vesicular-
arbuscular mycorrhizal fungi in relation to soil pH. Journal of Applied Ecology: 663-
672.
Porter WM, Robson AD, Abbott LK (1987b) Field survey of the distribution of vesicular-
arbuscular mycorrhizal fungi in relation to soil pH. Journal of Applied Ecology: 659-
662

176
Postma JWM, Olsson PA, Falkengren-Grerup U (2007) Root colonisation by arbuscular
mycorrhizal, fine endophytic and dark septate fungi across a pH gradient in acid
beech forests. Soil Biology and Biochemistry 39:400-408.
Pote DH, Daniel TC, Moore PA, Nichols DJ, Sharpley AN, Edwards DR (1996) Relating
Extractable Soil Phosphorus to Phosphorus Losses in Runoff. Soil Science Society of
America Journal 60:855-859.
Prayogo C, Jones JE, Baeyens J, Bending GD (2014) Impact of biochar on mineralisation
of C and N from soil and willow litter and its relationship with microbial community
biomass and structure. Biology and Fertility of Soils 50:695-702.
Pritchard D, Rigby H, Collins D (2010) Research studies on the impact of the agricultural
application of lime-amended biosolids. Final Report to Water Corporation CN-06-
12930.
Propster JR, Johnson NC (2015) Uncoupling the effects of phosphorus and precipitation on
arbuscular mycorrhizas in the Serengeti. Plant and Soil :1-14.
Qiu W, Curtin D, Beare M (2011) Spatial variability of available nutrients and soil carbon
under arable cropping in Canterbury. The New Zealand Institute for Plant and Food
Research Ltd (1-7).
Randle-Boggis RJ, Helgason T, Sapp M, Ashton PD (2016) Evaluating techniques for
metagenome annotation using simulated sequence data. Federation of European
Microbiological Societies Microbiology eEcology 92.
Ratnayake M, Leonard R, Menge J (1978) Root exudation in relation to supply of
phosphorus and its possible relevance to mycorrhizal formation. New Phytologist
81:543-552.
Rayment GE, Higginson FR (1992) Australian laboratory handbook of soil and water
chemical methods. Inkata Press Pty Ltd,
Raznikiewicz H, Carlgren K, Maartensson A (1994) Impact of phosphorus fertilization and
liming on the presence of arbuscular mycorrhizal spores in a Swedish long-term field
experiment Swedish. Journal of Agricultural Research (Sweden).
177
Read DJ (1991) Mycorrhizas in ecosystems Experientia 47:376-391
Reijnders L (2014) Phosphorus resources, their depletion and conservation, a review.
Resources, conservation and recycling 93:32-49.
Richardson AE (2001) Prospects for using soil microorganisms to improve the acquisition
of phosphorus by plants. Functional Plant Biology 28:897-906.
Rillig MC (2004) Arbuscular mycorrhizae and terrestrial ecosystem processes. Ecology
Letters 7:740-754.
Roberts H (1960) The delayed application of nitrogen for the establishment of surface-
seeded swards. Grass and Forage Science 15:287-290.
Robinson D (1994) The responses of plants to non‐uniform supplies of nutrients. New
Phytologist 127:635-674.
Robinson D, Rorison I (1983) A comparison of the responses of Lolium perenne L., Holcus
lanatus L. and Deschampsia flexuosa (L.) Trin. to a localized supply of nitrogen.
New Phytologist 94:263-273.
Rogers A, Beresford J (1970) Winter production and persistence of selected perennial
grasses in the medium rainfall region of southwestern Australia. Field Station
Records Division of Plant Industry, CSIRO, Australia 9:85-92.
Rogers M, Noble C (1991) The effect of NaCl on the establishment and growth of balansa
clover (Trifolium michelianum Savi var. balansae Boiss.). Australian Journal of
Agricultural Research 42:847-857.
Rogers M, Noble C, Pederick R (1996) Identifying suitable grass species for saline areas.
Australian Journal of Experimental Agriculture 36:197-202.
Rosso L, Lobry J, Bajard S, Flandrois J (1995) Convenient model to describe the combined
effects of temperature and pH on microbial growth. Applied and environmental
microbiology 61:610-616
Rousk J et al. (2010) Soil bacterial and fungal communities across a pH gradient in an arable
soil. ISME Journal 4:1340-1351.
178
Rousk J, Demoling LA, Bahr A, Bååth E (2008) Examining the fungal and bacterial niche
overlap using selective inhibitors in soil. Federation of European Microbiological
Societies Microbiology Ecology 63:350-358.
Rubio R, Borie F, Schalchli C, Castillo C, Azcón R (2003) Occurrence and effect of
arbuscular mycorrhizal propagules in wheat as affected by the source and amount of
phosphorus fertilizer and fungal inoculation. Applied Soil Ecology 23:245-255.
Ryan M, Ash J (1999) Effects of phosphorus and nitrogen on growth of pasture plants and
VAM fungi in SE Australian soils with contrasting fertiliser histories (conventional
and biodynamic). Agriculture, ecosystems & environment 73:51-62.
Ryan M, Small D, Ash J (2000) Phosphorus controls the level of colonisation by arbuscular
mycorrhizal fungi in conventional and biodynamic irrigated dairy pastures.
Australian Journal of Experimental Agriculture 40:663-670.
Saito M, Marumoto T (2002) Inoculation with arbuscular mycorrhizal fungi: the status quo
in Japan and the future prospects. In: Diversity and Integration in Mycorrhizas.
Springer, pp 273-279.
Sanchez PA (2002) Soil Fertility and Hunger in Africa. Science 295:2019-2020.
Sanderman J, Baldock J, Hawke B, Macdonald L, Puccini A, Szarvas S (2011) National soil
carbon research programme: Field and laboratory methodologies
Sanders IR (2004) Plant and arbuscular mycorrhizal fungal diversity–are we looking at the
relevant levels of diversity and are we using the right techniques? New Phytologist
164:415-418.
Sanderson MA, Skinner RH, Barker DJ, Edwards GR, Tracy BF, Wedin DA (2004) Plant
species diversity and management of temperate forage and grazing land ecosystems.
Crop Science 44:1132-1144.
Santos JC, Finlay RD, Tehler A (2006) Molecular analysis of arbuscular mycorrhizal fungi
colonising a semi‐natural grassland along a fertilisation gradient. New Phytologist
172:159-168.
179
Schachtman D, Kelman W (1991) Potential of Lotus germplasm for the development of salt,
aluminium and manganese tolerant pasture plants. Australian Journal of
Agricultural Research 42:139-149.
Scheublin TR, Van Logtestijn RSP, Van Der Heijden MGA (2007) Presence and identity of
arbuscular mycorrhizal fungi influence competitive interactions between plant
species. Journal of Ecology 95:631-638.
Schlaeppi K et al. (2016) High-resolution community profiling of arbuscular mycorrhizal
fungi. New phytologist 212:780-791.
Schwab SM, Menge JA, Tinker PB (1991) Regulation of Nutrient Transfer between Host
and Fungus in Vesicular- Arbuscular Mycorrhizas. New phytologist 117:387-398.
Schweiger PF, Robson AD, Barrow NJ (1995) Root hair length determines beneficial effect
of a Glomus species on shoot growth of some pasture species. New Phytologist
131:247-254.
Scott PR, Sudmeyer RA (1993) Evapotranspiration from agricultural plant communities in
the high rainfall zone of the southwest of Western Australia. Journal of Hydrology
146:301-319.
Searle PL (1984) The Berthelot or indophenol reaction and its use in the analytical chemistry
of nitrogen. A review. Analyst 109:549-568.
Serrano JM, Shahidian S, Marques da Silva JR (2013) Small scale soil variation and its
effect on pasture yield in southern Portugal. Geoderma 195-196:173-183.
Shah Z, Adamst WA, Haven CDV (1990) Composition and activity of the microbial
population in an acidic upland soil and effects of liming. Soil Biology and
Biochemistry 22:257-263.
Shaviv A (2001) Advances in controlled-release fertilizers. In: Advances in Agronomy, vol
71. Academic Press, pp 1-49.
Shaw MR, Zavaleta ES, Chiariello NR, Cleland EE, Mooney HA, Field CB (2002)
Grassland responses to global environmental changes suppressed by elevated CO2.
Science 298:1987-1990.
180
Shi P, Abbott LK, Banning NC, Zhao B (2012) Comparison of morphological and molecular
genetic quantification of relative abundance of arbuscular mycorrhizal fungi within
roots. Mycorrhiza 22:501-513.
Shokralla S, Spall JL, Gibson JF, Hajibabaei M (2012) Next-generation sequencing
technologies for environmental DNA research. Molecular ecology 21:1794-1805.
Simon L, Lalonde M, Bruns TD (1992) Specific amplification of 18S fungal ribosomal
genes from vesicular-arbuscular endomycorrhizal fungi colonizing roots. Applied
and Environmental Microbiology 58:291-295.
Simon L, Lévesque RC, Lalonde M (1993) Identification of endomycorrhizal fungi
colonizing roots by fluorescent single-strand conformation polymorphism-
polymerase chain reaction. Applied and Environmental Microbiology 59:4211-4215.
Šímová I, Li YM, Storch D (2013) Relationship between species richness and productivity
in plants: the role of sampling effect, heterogeneity and species pool. Journal of
Ecology 101:161-170.
Sinclair A, Johnstone P, Smith L, O'Connor M, Nguyen L (1993) Agronomy, modelling and
economics of reactive phosphate rocks as slow-release phosphate fertilizers for
grasslands. Fertilizer research 36:229-238.
Singh BP, Hatton BJ, Singh B, Cowie AL, Kathuria A (2010) Influence of biochars on
nitrous oxide emission and nitrogen leaching from two contrasting soils. Journal of
environmental quality 39:1224-1235.
Skinner RH, Sanderson MA, Tracy BF, Dell CJ (2006) Above-and belowground
productivity and soil carbon dynamics of pasture mixtures. Agronomy Journal
98:320-326.
Šmilauer P, Šmilauerová M (2000) Effect of AM symbiosis exclusion on grassland
community composition. Folia Geobotanica 35:13-25.
Smith MD, Hartnett DC, Wilson GWT (1999) Interacting influence of mycorrhizal
symbiosis and competition on plant diversity in tallgrass prairie. Oecologia 121:574-
582.
181
Smith R, Buckingham H, Bullard M, Shiel R, Younger A (1996) The conservation
management of mesotrophic (meadow) grassland in northern England. 1. Effects of
grazing, cutting date and fertilizer on the vegetation of a traditionally managed
sward. Grass and Forage Science 51:278-291.
Smith R, Shiel R, Millward D, Corkhill P (2000) The interactive effects of management on
the productivity and plant community structure of an upland meadow: an 8‐year field
trial. Journal of Applied Ecology 37:1029-1043.
Smith S, John BS, Smith F, Bromley JL (1986) Effects of mycorrhizal infection on plant
growth, nitrogen and phosphorus nutrition in glasshouse‐grown allium cepal. New
Phytologist 103:359-373.
Smith S, Malcolm C (1959) Bringing wheatbelt saltland back into production. Journal of
Agriculture Western Australia 3:263-267.
Smith S, Read D (2008) Mycorrhizal Symbiosis 3rd ed. Academic Press New York
Smith S, Stoneman T (1970) Salt movement in bare saline soils. Western Australia
Department of Agriculture.
Smith SE, Jakobsen I, Grønlund M, Smith FA (2011) Roles of arbuscular mycorrhizas in
plant phosphorus nutrition: interactions between pathways of phosphorus uptake in
arbuscular mycorrhizal roots have important implications for understanding and
manipulating plant phosphorus acquisition. Plant physiology 156:1050-1057.
Smith SE, Read DJ (1996) Mycorrhizal symbiosis. Academic press,
Smith SE, Smith FA (2011) Roles of arbuscular mycorrhizas in plant nutrition and growth:
new paradigms from cellular to ecosystem scales. Annual review of plant biology
62:227-250.
Smith SE, Smith FA (2012) Fresh perspectives on the roles of arbuscular mycorrhizal fungi
in plant nutrition and growth. Mycologia 104:1-13.
Smolander A, Mälkönen E (1994) Microbial biomass C and N in limed soil of Norway
spruce stands. Soil Biology and Biochemistry 26:503-509.
182
Socher SA et al. (2013) Interacting effects of fertilization, mowing and grazing on plant
species diversity of 1500 grasslands in Germany differ between regions. Basic and
Applied Ecology 14:126-136.
Solaiman MZ, Abbott LK (2003) Phosphorus uptake by a community of arbuscular
mycorrhizal fungi in jarrah forest. Plant and Soil 248:313-320.
Solaiman MZ, Hirata H (1997) Effect of arbuscular mycorrhizal fungi inoculation of rice
seedlings at the nursery stage upon performance in the paddy field and greenhouse
Plant and Soil 191:1-12.
Solaiman ZM, Blackwell P, Abbott LK, Storer P (2010) Direct and residual effect of biochar
application on mycorrhizal root colonisation, growth and nutrition of wheat. Soil
Research 48:546-554.
Solaiman ZM, Murphy DV, Abbott LK (2012) Biochars influence seed germination and
early growth of seedlings. Plant and Soil 353:273-287.
Sommers L, Lindsay W (1979) Effect of pH and redox on predicted heavy metal-chelate
equilibria in soils. Soil Science Society of America Journal 43:39-47.
Soussana JF, Vertès F, Arregui MC (1995) The regulation of clover shoot growing points
density and morphology during short-term clover decline in mixed swards. European
Journal of Agronomy 4:205-215.
Spehn EM, Joshi J, Schmid B, Diemer M, Korner C (2000) Above-Ground Resource Use
Increases with Plant Species Richness in Experimental Grassland Ecosystems.
Functional Ecology 14:326-337.
Standish R, Fontaine JB, Harris R, Stock W, Hobbs R (2012) Interactive effects of altered
rainfall and simulated nitrogen deposition on seedling establishment in a global
biodiversity hotspot. Oikos 121:2014-2025.
Stein C, Rißmann C, Hempel S, Renker C, Buscot F, Prati D, Auge H (2009) Interactive
effects of mycorrhizae and a root hemiparasite on plant community productivity and
diversity. Oecologia 159:191-205.
183
Steinbeiss S, Gleixner G, Antonietti M (2009) Effect of biochar amendment on soil carbon
balance and soil microbial activity. Soil Biology and Biochemistry 41:1301-1310.
Stubblefield SP, Taylor TN, Trappe JM (1987) Fossil mycorrhizae: a case for symbiosis.
Science 237:59-60.
Sylvia D, Neal L (1990) Nitrogen affects the phosphorus response of VA mycorrhiza. New
Phytologist 115:303-310.
Sylvia DM, Schenck NC (1983) Application of Superphosphate to Mycorrhizal Plants
Stimulates Sporulation of Phosphorus-Tolerant Vesicular-Arbuscular Mycorrhizal
Fungi. New phytologist 95:655-661.
Taek–Keun O, Shinogi Y, Chikushi J, Yong–Hwan L, Choi B (2012) Effect of aqueous
extract of biochar on germination and seedling growth of lettuce (Lactuca sativa
L.).Journal of the Faculty of Agriculture, Kyushu University 57:55-60
Taghizadeh-Toosi A, Clough TJ, Condron LM, Sherlock RR, Anderson CR, Craigie RA
(2011) Biochar Incorporation into Pasture Soil Suppresses in situ Nitrous Oxide
Emissions from Ruminant Urine Patches. Journal of Environment Quality 40:468.
Taylor JD, Helgason T, Öpik M (2017) 1 CHAPTER Molecular Community Ecology of
Arbuscular Mycorrhizal Fungi. The Fungal Community: Its Organization and Role
in the Ecosystem, Fourth Edition.
Tedersoo L et al. (2014) Global diversity and geography of soil fungi. Science 346.
Temperton VM, Mwangi PN, Scherer-Lorenzen M, Schmid B, Buchmann N (2007) Positive
interactions between nitrogen-fixing legumes and four different neighbouring
species in a biodiversity experiment. Oecologia 151:190-205.
Thies J, Suzuki K (2003) Amazonian dark earths biological measurements. In: Amazonian
Dark Earths. Springer, pp 287-332
Thies JE, Rillig MC (2009) Characteristics of biochar: biological properties Biochar for
environmental management. Science and technology:85-105.
184
Thippayarugs S, Bansal M, Abbott LK (1999) Morphology and infectivity of fine endophyte
in a Mediterranean environment. Mycological Research 103:1369-1379.
Thomas J, Boote K, Allen L, Gallo-Meagher M, Davis J (2003) Elevated temperature and
carbon dioxide effects on soybean seed composition and transcript abundance. Crop
Science 43:1548-1557.
Thomas T, Gilbert J, Meyer F (2012) Metagenomics - a guide from sampling to data
analysis. Microbial Informatics and Experimentation 2:3.3
Thomson BD, Robson AD, Abbott LK (1986) Effects of phosphorus on the formation of
mycorrhizas by Gigaspora calospora and Glomus fasciculatum in relation to root
carbohydrate. New Phytologist 103:751-765.
Thomson BD, Robson AD, Abbott LK (1990) Mycorrhizas formed by Gigaspora calospora
and Glomus fasciculatum on subterranean clover in relation to soluble carbohydrate
concentrations in roots. New Phytologist 114:217-225.
Thurston JM, Williams E, Johnston A (1976) Modern developments in an experiment on
permanent grassland started in 1856: effects of fertilisers and lime on botanical
composition and crop and soil analyses. Annales Agronomiques (France)
Tilman D (1981) Resource competition and community structure. Monographs in population
biology 17:1-296.
Tilman D (1993) Species richness of experimental productivity gradients: how important is
colonization limitation?. Ecology 74:2179-2191.
Tilman D (1999) The ecological consequences of changes in biodiversity: A search for
general principles. Ecology 80:1455-1474.
Tilman D, Cowan ML (1989) Growth of old field herbs on a nitrogen gradient functional.
Ecology 3:425-438.
Tilman D, Pacala S (1993) The maintenance of species richness in plant communities.
Species diversity in ecological communities:13-25.
185
Tracy BF, Sanderson MA (2000) Patterns of plant species richness in pasture lands of the
northeast United States. Plant Ecology 149:169-180
Trejo D, Barois I, Sangabriel-Conde W (2016) Disturbance and land use effect on functional
diversity of the arbuscular mycorrhizal fungi. Agroforestry systems 90:265-279.
Treseder KK (2004) A meta‐analysis of mycorrhizal responses to nitrogen, phosphorus, and
atmospheric CO2 in field studies. New Phytologist 164:347-355.
Treseder KK (2008) Nitrogen additions and microbial biomass: A meta‐analysis of
ecosystem studies. Ecology Letters 11:1111-1120.
Treseder KK, Allen MF (2000) Mycorrhizal fungi have a potential role in soil carbon storage
under elevated CO2 and nitrogen deposition. New Phytologist 147:189-200.
Treseder KK, Allen MF (2002) Direct nitrogen and phosphorus limitation of arbuscular
mycorrhizal fungi: a model and field test. New Phytologist 155:507-515.
Tubiello FN, Soussana JF, Howden SM (2007) Crop and pasture response to climate change.
Proceedings of the National Academy of Sciences, 104:19686-19690.
Tunney H, Breeuwsma A, Withers P, Ehlert P, Carton O, Brookes P, Johnston A Phosphorus
fertilizer strategies: present and future. In: Phosphorus loss from soil to water.
Proceedings of a workshop, Wexford, Irish Republic, 29-31 September 1995., 1997.
CAB INTERNATIONAL, pp 177-203
Van Aarle IM, Olsson PA, Söderström B (2002) Arbuscular mycorrhizal fungi respond to
the substrate pH of their extraradical mycelium by altered growth and root
colonization . New Phytologist 155:173-182.
van der Heyde M, Ohsowski B, Abbott LK, Hart M (2017) Arbuscular mycorrhizal fungus
responses to disturbance are context-dependent. Mycorrhiza 27:431-440.
van Diest A (1981) Rock-phosphate mobilization induced by the alkaline uptake pattern of
legumes utilizing symbiotically fixed nitrogen. Plant and soil 61:27-42.
186
Van Geel M et al. (2016) Application of slow-release phosphorus fertilizers increases
arbuscular mycorrhizal fungal diversity in the roots of apple trees. Plant and Soil
402:291-301.
Vandenkoornhuyse á, Ridgway K, Watson I, Fitter A, Young J (2003) Co‐existing grass
species have distinctive arbuscular mycorrhizal communities. Molecular Ecology
12:3085-3095.
Vandenkoornhuyse P, Husband R, Daniell T, Watson I, Duck J, Fitter A, Young J (2002)
Arbuscular mycorrhizal community composition associated with two plant species
in a grassland ecosystem. Molecular Ecology 11:1555-1564.
Vejsadová H, Hršelová H, Přikryl Z, Vančura V (1990) Effect of different phosphorus and
nitrogen levels on development of VA mycorrhiza, rhizobial activity and soybean
growth. Agriculture, Ecosystems & Environment 29:429-434.
Venterink H, Wassen M, Verkroost A, De Ruiter P (2003) Species richness-productivity
patterns differ between N-, P-, and K-limited wetlands. Ecology 84:2191-2199.
Verbruggen E, Röling WFM, Gamper HA, Kowalchuk GA, Verhoef HA, van der Heijden
MGA (2010) Positive effects of organic farming on below-ground mutualists: large-
scale comparison of mycorrhizal fungal communities in agricultural soils. New
Phytologist 186:968-979.
Verbruggen E, Van Der Heijden MG, Weedon JT, Kowalchuk GA, RoeLing WF (2012)
Community assembly, species richness and nestedness of arbuscular mycorrhizal
fungi in agricultural soils. Molecular Ecology 21:2341-2353.
Vitousek PM et al. (1997) Human alteration of the global nitrogen cycle: sources and
consequences. Ecological applications 7:737-750.
Volaire F, Norton M (2006) Summer dormancy in perennial temperate grasses. Annals of
botany 98:927-933.
Wagg C, Jansa J, Stadler M, Schmid B, van der Heijden MGA (2011) Mycorrhizal fungal
identity and diversity relaxes plant–plant competition. Ecology 92:1303-1313.
187
Waldrop MP, Zak DR (2006) Response of oxidative enzyme activities to nitrogen deposition
affects soil concentrations of dissolved organic carbon. Ecosystems 9:921-933.
Walker C, Mize CW, McNabb Jr HS (1982) Populations of endogonaceous fungi at two
locations in central Iowa. Canadian Journal of Botany 60:2518-2529.
Wallstedt A, Coughlan A, Munson AD, Nilsson M-C, Margolis HA (2002) Mechanisms of
interaction between Kalmia angustifolia cover and Picea mariana seedlings.
Canadian journal of forest research 32:2022-2031.
Wang GM, Stribley DP, Tinker PB, Walker C (1993) Effects of pH on arbuscular
mycorrhiza I. Field observations on the long‐term liming experiments at Rothamsted
and Woburn. New Phytologist 124:465-472.
Wang X, Tang C, Baldock J, Butterly C, Gazey C (2016) Long-term effect of lime
application on the chemical composition of soil organic carbon in acid soils varying
in texture and liming history. Biology and fertility of soils 52:295-306.
Wang Y, Zhang F, Marschner P (2012) Soil pH is the main factor influencing growth and
rhizosphere properties of wheat following different pre-crops. Plant and Soil
360:271-286.
Ward PR (2006) Predicting the impact of perennial phases on average leakage from farming
systems in south-western Australia. Australian Journal of Agricultural Research
57:269-280.
Wardle DA et al. (2000) Biodiversity and Ecosystem Function: An Issue in Ecology.
Bulletin of the Ecological Society of America 81:235-239.
Warnock DD, Lehmann J, Kuyper TW, Rillig MC (2007) Mycorrhizal responses to biochar
in soil–concepts and mechanisms. Plant and soil 300:9-20.
Warnock DD, Mummey DL, McBride B, Major J, Lehmann J, Rillig MC (2010) Influences
of non-herbaceous biochar on arbuscular mycorrhizal fungal abundances in roots and
soils: results from growth-chamber and field experiments. Applied Soil Ecology
46:450-456.
188
Weindorf DC, Zhu Y (2010) Spatial Variability of Soil Properties at Capulin Volcano, New
Mexico, USA: Implications for Sampling Strategy. Pedosphere 20:185-197.
Weiss SB (1999) Cars, Cows, and Checkerspot Butterflies: Nitrogen Deposition and
Management of Nutrient‐Poor Grasslands for a Threatened Species. Conservation
Biology 13:1476-1486.
West DW, Taylor JA (1981) Germination and growth of cultivars of Trifolium subterraneum
L. in the presence of sodium chloride salinity. Plant and Soil 62:221-230.
Whelan AM, Alexander M (1986) Effects of low pH and high Al, Mn and Fe levels on the
survival ofRhizobium trifolii and the nodulation of subterranean clover. Plant and
Soil 92:363-371.
White RE et al. (2003) SGS Water Theme: influence of soil, pasture type and management
on water use in grazing systems across the high rainfall zone of southern Australia.
Australian Journal of Experimental Agriculture 43:907-926.
Wild A (1950) The retention of phosphate by soil. A review. European Journal of Soil
Science 1:221-238.
Wilde P, Manal A, Stodden M, Sieverding E, Hildebrandt U, Bothe H (2009) Biodiversity
of arbuscular mycorrhizal fungi in roots and soils of two salt marshes. Environmental
Microbiology 11:1548-1561.
Willems J (2001) Problems, approaches, and results in restoration of Dutch calcareous
grassland during the last 30 years. Restoration Ecology 9:147-154.
Willems J, Peet R, Bik L (1993) Changes in chalk‐grassland structure and species richness
resulting from selective nutrient additions. Journal of Vegetation Science 4:203-212.
Xia J, Wan S (2008) Global response patterns of terrestrial plant species to nitrogen addition
New Phytologist 179:428-439
Xu X, Liu H, Song Z, Wang W, Hu G, Qi Z (2015) Response of aboveground biomass and
diversity to nitrogen addition along a degradation gradient in the Inner Mongolian
steppe, China. Scientific Reports 5:10284.
189
Xue D, Huang X, Yao H, Huang C (2010) Effect of lime application on microbial
community in acidic tea orchard soils in comparison with those in wasteland and
forest soils. Journal of Environmental Sciences 22:1253-1260.
Yano K, Takaki M (2005) Mycorrhizal alleviation of acid soil stress in the sweet potato
(Ipomoea batatas). Soil Biology and Biochemistry 37:1569-1572.
Yao Y, Gao B, Zhang M, Inyang M, Zimmerman AR (2012) Effect of biochar amendment
on sorption and leaching of nitrate, ammonium, and phosphate in a sandy soil.
Chemosphere 89:1467-1471.
Young JA, Blank RR, Longland WS (1995) Nitrogen enrichment-immobilization to control
succession in arid land plant communities. Journal Arid Land Studies S 5:57-60.
Young JA, Trent JD, Blank RR, Palmquist DE (1998) Nitrogen interactions with
medusahead (Taeniatherum caput-medusae ssp. asperum) seedbanks. Weed
Science:191-195.
Yu Y, Xinda L, Lianqing L (2011) Components of pyroligneous solution from straw
pyrolysis and its effect on growth and quality of pepper spice. Journal of Nanjing
Agricultural University.
Yuan J-H, Xu R-K, Zhang H (2011) The forms of alkalis in the biochar produced from crop
residues at different temperatures. Bioresource technology 102:3488-3497.
Zackrisson O, Nilsson M-C, Wardle DA (1996) Key ecological function of charcoal from
wildfire in the Boreal forest. Oikos:10-19.
Zavaleta ES, Hulvey KB (2004) Realistic species losses disproportionately reduce grassland
resistance to biological invaders. Science 306:1175-1177.
Zavaleta ES, Shaw MR, Chiariello NR, Thomas BD, Cleland EE, Field CB, Mooney HA
(2003) Grassland responses to three years of elevated temperature, CO2,
precipitation, and N deposition. Ecological Monographs 73:585-604.
Zezschwitz Ev (1998) Effects of forest liming on soil processes. Forstarchiv (Germany).
190
Zhang A, Liu Y, Pan G, Hussain Q, Li L, Zheng J, Zhang X (2012) Effect of biochar
amendment on maize yield and greenhouse gas emissions from a soil organic carbon
poor calcareous loamy soil from Central China Plain. Plant and Soil 351:263-275.
Zimmerman AR, Gao B, Ahn M-Y (2011) Positive and negative carbon mineralization
priming effects among a variety of biochar-amended soils. Soil Biology and
Biochemistry 43:1169-1179.