Embed Size (px)
Citation preview

Karatzia, X., Mylonakis, G., & Bouckovalas, G. (2019). Seismic isolation ofsurface foundations exploiting the properties of natural liquefiable soil. SoilDynamics and Earthquake Engineering, 121, 233-251.https://doi.org/10.1016/j.soildyn.2019.03.009
Peer reviewed version
License (if available):CC BY-NC-ND
Link to published version (if available):10.1016/j.soildyn.2019.03.009
Link to publication record in Explore Bristol ResearchPDF-document
This is the final published version of the article (version of record). It first appeared online via Elsevier athttps://doi.org/10.1016/j.soildyn.2019.03.009 . Please refer to any applicable terms of use of the publisher.
University of Bristol - Explore Bristol ResearchGeneral rights
This document is made available in accordance with publisher policies. Please cite only the publishedversion using the reference above. Full terms of use are available: http://www.bristol.ac.uk/pure/user-guides/explore-bristol-research/ebr-terms/

1
Seismic Isolation of Surface Foundations Exploiting the Properties of
Natural Liquefiable Soil
Xenia Karatziaa,1, George Mylonakisb and George Bouckovalasc
a Geotechnical Engineer, PhD, Department of Civil Engineering, University of Patras, Rio 26500,
Greece, [email protected] b Professor, Dept. of Civil Engineering, Univ. of Bristol, Queens Building, Bristol BS8 1TR, U.K.;
Professor, Dept. of Civil Engineering, Univ. of Patras, Rio 26500, Greece; Adjunct Professor, Univ. of
California at Los Angeles, CA 90095, [email protected] c Professor, School of Civil Engineering, NTUA, Greece, [email protected]
1 Present address: HOCHTIEF Eng. GmbH Consult IKS, Lyoner Str. 25, 60528 Frankfurt am Main, Germany,

2
Abstract
A novel design method has recently been proposed for the seismic protection of structures on
liquefied ground using shallow (instead of deep) foundations. Contrary to conventional
(structural) isolation approaches, which employ special mechanical devices, the proposed
(geotechnical) means exploits the presence of natural liquefiable soil, after partial remediation
of the surface ground, as a natural base isolation system which de-amplifies the seismic
ground motion and, hence, reduces the seismic demand on the superstructure. This paper
focuses on the comparative evaluation of the relevant Soil-Foundation-Structure Interaction
(SFSI) effects. Using an equivalent-linear approach based on appropriate values for the
material properties of liquefied soil, the dynamic stiffness and damping of rigid square
footings on three-layer liquefiable soil under external harmonic oscillations is first
numerically investigated. Results demonstrate that for common soil, foundation and seismic
excitation conditions, liquefaction leads to (a) significant reduction in dynamic stiffness and
(b) increase in damping of the footing over pre-liquefied conditions. Based on these results,
regression formulae for estimating static stiffness of surface footings on liquefied soil were
developed. In the second part of the paper, parametric numerical analyses are presented for
the typical case of bridge piers on liquefiable soil, with surface foundation and a remediated
surface crust. Results from both harmonic steady-state and transient analyses indicate that the
effect of soil liquefaction on the vibrational characteristics of the pier-foundation system
decreases drastically with increasing soil crust thickness and, consequently, the intended
natural base isolation of the structural system is mainly achieved by the reduction in free-field
seismic ground response.

3
1. Introduction
Contrary to current design codes and guidelines, which dictate the use of deep foundations
in soils prone to liquefaction, field observations from strong earthquakes [1, 2, 24] and a
number of experimental studies [6, 12 – 14, 18, 32, 54] suggest the possibility of using
shallow foundations on such soils, provided the existence of a competent surface layer to
protect the superstructure from excessive settlement and/or post-shaking bearing capacity
failure. Most recently, Bouckovalas et al [8] presented an integrated approach for
Performance-Based Design (PBD) of shallow foundations on liquefiable soils with a non-
liquefiable crust. The design is based on the idea of a natural or artificial crust, which needs
not extend over the whole depth of the liquefiable sand, to take advantage of the observed
benefits of settlement reduction and the seismic motion attenuation (“Natural Seismic
Isolation − NSI”) due to liquefaction of soil below the crust.
A key pre-requisite for the applicability of this new approach lies in the capacity to
estimate the settlement of footings on liquefiable soil layers with a non-liquefiable crust.
Naesgaard et al. [43] were pioneers in that direction, followed by Karamitros et al [26 – 28].
Both examined the case of a natural clay crust and used numerical analyses to correlate
seismic settlements to the degraded factor of safety, at the end of seismic shaking while the
subsoil is still liquefied, the first with the aid of design charts and the second by means of
analytical relationships. Dimitriadi et al [15, 16] extended the work of Karamitros et al. [27]
for the case of an artificial crust created by vibro-compaction of the native liquefiable soil,
giving special emphasis on the required thickness and lateral extend of ground improvement.
In parallel, Bray and Macedo [10] presented a simplified procedure for settlement
computation in the case of an artificial soil crust with infinite lateral extend, based on
regression analysis of results from 1300 nonlinear dynamic SFSI numerical analyses based on
actual seismic excitation recordings. Compared to previous similar studies, Bray and Macedo
also emphasized the effect on seismic settlements of volumetric-induced, and ejecta-induced
ground deformation, which are commonly observed in the field but cannot be adequately
captured by numerical analyses of continuous media.
Equally important for the seismic design of structures based on the new concept of NSI, is
the simplified computation of the attenuated seismic motion at the free surface of liquefiable
soil deposits. The available literature on this issue is even more limited than that for seismic
settlements. Namely, Miwa and Ikeda [38] proposed to perform equivalent linear analysis,
using strain independent values of elastic shear modulus for the liquefied soil layers
approximately equal to 1-4% of the initial values without liquefaction. This methodology is

4
fairly simple but may under-predict spectral accelerations at the low structural period range,
as it overlooks the well-established amplification effect during the pre-liquefaction part of the
seismic excitation [62]. This effect is properly taken into account by two recently proposed
methodologies, referenced in the literature as the “spectral envelope” [9] and the “spectral
interpolation” [7] method. In both methodologies, the seismic ground response is computed
twice, for liquefied and for initial non-liquefied soil conditions, and the results are combined
to provide the target ground response. The required seismic response analyses can be
performed with the widely known 1-D non-linear or equivalent linear methods, while their
results are consequently interpreted using standard in-situ estimated factors of safety against
liquefaction (FSL) as the main variable.
Other recent studies on NSI include those by Sextos et al [50], Bouckovalas et al [8] and
Vassilopoulou et al. [56] who presented a proof-of-concept study for three typical bridge
systems, with approximately 90 m total span and 10 m pier height: a statically determinate
concrete bridge, a statically indeterminate concrete bridge, and a steel overpass. Findings
from these studies suggest that all three systems can tolerate the liquefaction-induced
deformations without experiencing significant structural damage or loss of serviceability.
Furthermore, compared to conventional pile foundation design, the new design concept led to
15-50% reduction in maximum bending moments on the pier and about 45-65% reduction in
foundation cost, with the lowest reduction corresponding to the statically indeterminate
concrete bridge.
In the context of the above research, a need arises to investigate the dynamic response of
shallow foundations on liquefiable soils and its contribution to the overall structural system
response. A rigorous treatment of dynamic stiffness and damping of footings on a liquefiable
soil profile is a formidable problem due to the complexity and nonlinearity of the liquefaction
phenomenon itself. Admittedly, despite extensive research on soil liquefaction over several
decades, the mechanics of seismic wave propagation within liquefied soil remains poorly
understood. It is known that shear-induced dilation under extremely low effective stresses
leads to significant variation in excess pore pressure (and in ensuing seismic wave
propagation velocity), even within the same loading cycle. As a result, the mechanical
properties of liquefied soil are strongly time-variant during shaking, which renders the
problem difficult to analyze. Additionally, the gradual pore pressure dissipation may induce
considerable settlements and separation of the foundation from the ground in certain structural
systems. An associated difficulty in handling the dynamic impedance problem stems from the
need to consider a multilayer soil profile (i.e. at least three layers, including a non-liquefiable

5
surface layer, a middle liquefiable soil layer, and a non-liquefiable base stratum) with sharp
impedance contrasts across the interfaces, which results in strong wave reflections and
entrapment of seismic energy within the middle layer.
Most available solutions for the dynamic impedance of footings on non-liquefiable soil
assume linear or equivalent-linear soil behavior and perfect contact between footing and soil
[4, 19, 34, 37, 41, 44 – 45, 58 – 61]. Apart from convenience in application, the use of time-
independent (though frequency-dependent) stiffness coefficients provides realistic means for
developing simple engineering methodologies for the problem at hand. In the context of this
simplified approach, soil-foundation interaction is represented by means of an equivalent
spring-dashpot system connected to the footing, as shown in Fig. 1a. In the realm of standard
elastodynamic theory, these formulations are often rigorous, as the stiffness and damping
coefficients are obtained from exact numerical solutions of the corresponding boundary value
problems [21].
The main scope of this paper is to investigate the dynamic stiffness and damping of rigid
surface square footings resting on liquefiable soil under external harmonic loading. To this
end, the fundamental case of a three-layer soil profile consisting of a liquefiable layer
sandwiched between two stiff impermeable soil layers is considered. For the exploration of
the problem, equivalent-linear elastic analyses are employed in conjunction with pertinent
values for the material constants of liquefied soil. Recent experimental and analytical
evidence suggest that during liquefaction, the shear wave propagation velocity can be reduced
to 10 – 30% of its initial value [38, 53] while the soil material damping ratio may increase to
over 20% [53], in agreement with a substantial increase in the imposed shear strains in the
soil.
These observations allow for a simplification of the problem, which can be separated into
two different phases: a) the initial phase [pre-liquefaction (PL)] and b) the phase during
liquefaction [during-liquefaction (DL)] with the material properties of the liquefied soil
adjusted over those prior to liquefaction. It is further assumed that the latter case starts from
the beginning of shaking and that there is no sufficient soil permeability above and below the
liquefied layer, so that the change in soil stiffness and damping due to liquefaction may be
viewed as “permanent” during shaking. This is certainly a simplification, but can be
considered realistic for the purposes of a dynamic earthquake analysis leading to easy-to-
employ dimensionless charts and graphs regarding footing stiffness and damping. Through
this decomposition and the aforementioned assumptions, one may analyze each phase
separately by established elastodynamic theory.

6
This research concludes with parametric numerical studies of the seismic response of
bridge piers on surface footings in liquefiable soil, modeled as described above. The aim of
these proof-of-concept studies is to explore the relative effect on the superstructure response
of two liquefaction-triggered, still independent response mechanisms: the attenuation of the
seismic ground motion, briefly discussed in previous paragraphs, and the increase in
superstructure-foundation vibration period, which will result from the decrease in soil
impedances discussed herein. Results refer to both pre- and during-liquefaction cases, and are
presented in frequency and time domain for bridge and footings accelerations by means of
comparison graphs.
2. Methodology, Input Data and Assumptions
2.1 Problem Statement
The problem considered is depicted in Fig. 1.b: a massless rigid square (BB) surface
footing resting on a liquefiable soil profile, subjected to external harmonic loading. A three-
layer soil profile, including a surface clayey crust over a loose liquefiable sand layer followed
again by a stiff clayey base, is assumed to this end. The dynamic impedance functions of the
footing are numerically determined accounting for three oscillation modes (vertical,
horizontal and rocking). The analyses refer to various footing sizes used for the foundation of
both ordinary structures and bridge piers. Excitation frequencies cover the frequency range of
importance in earthquake engineering. Having determined the associated dynamic impedance
functions, one may investigate the impact of liquefaction on simple oscillators which can
simulate a variety of actual bridge piers.

7
Fig. 1. a) Physical interpretation of dynamic stiffness via frequency dependent springs and
dashpots, b) Problem under investigation
To examine the influence of liquefaction on the spring and dashpot coefficients,
elastodynamic analyses were conducted for conditions prior to and during liquefaction. Of the
few pertinent findings regarding the dynamic properties of liquefied soils, reference is made
here to the work of Miwa and Ikeda [38], who propose to perform an equivalent linear
analysis for the prediction of the seismic motion at the surface of the liquefied ground, using
strain independent reduced values of elastic shear modulus for the liquefied soil layers. The
key parameter for this kind of analyses is the shear wave velocity of the liquefied ground VS,L,
which was estimated by inverse analyses of actual recordings in liquefied sites and was
consequently related to the factor of safety against liquefaction FSL and the initial shear wave
velocity without liquefaction VS,o (Table 1). The authors do not provide any details for the
hysteretic damping ratio ξL of the liquefied soil that was used in their analyses. To fill this
gap, one may refer to previous findings obtained from reverse analysis of relevant seismic
recordings [36, 46], suggesting that the hysteretic damping ratio of liquefied sands is ξL = 20 -
30%, as well as to experimental data from cyclic triaxial tests [33] which indicate that it may
rise to a maximum of ξL = 25 - 30% at double amplitude strain γD ≈ 1% and eventually reduce
to ξL = 10 - 20% at much larger strains.
BedrockBedrock
Viscoelastic soil G, , ρ, β
Rigid footing
Peiωt
K(ω) C(ω)
Peiωt
Non liquefiable soil
Liquefiable soil layer
Non liquefiable soil
Computation of dynamic impedance functions (Svv, Shh, Srr)
Non liquefiable soil
Liquefiable soil layer
Non liquefiable soil
Seismic response
(a) (b)
h1
h2
h1
h2

8
Table 1. Proposed VS,L/VS,o ratios by Miwa and Ikeda [38]
FSL 0.3 - 0.6 0.6 - 0.9 0.9 - 1.0
VS,L/VS,o 0.10 - 0.14 0.12 - 0.16 0.14 - 0.19
To this end, it is assumed that during liquefaction the shear wave propagation velocity of the
middle liquefiable soil is reduced to about 17% of its initial value, i.e. from Vs2 = 150 m/s to
Vsliq = 25 m/s. In view of the increase in energy loss due to material damping during
liquefaction, in the present analyses material damping in the middle soil stratum is assumed to
be β2 = 3% prior to liquefaction and βliq = 20% during liquefaction. Given the impermeable
nature of the layers above and below the liquefied zone, no pore water pressure dissipation
effects are considered during shaking. The soil below the surface layer is considered fully
saturated, hence a uniform value for Poisson’s ratio (ν = 0.49) is employed corresponding to a
nearly incompressible medium.
Unless otherwise specified, the material properties of the surface layer employed in the
analyses are shear wave propagation velocity Vs1 = 100, 250 m/s, Poisson’s ratio v1 = 0.33,
material damping ratio β1 = 3%, mass density ρ1 = 2 Mg/m3. The properties of the middle
liquefiable layer are Vs2 = 150 m/s, v2 = 0.49, β2 = 3%, ρ2 = 2 Mg/m3 and the properties of the
base stratum are Vs3 = 300 m/s, v3 = 0.49, β3 = 3%, ρ3 = 2 Mg/m3. With reference to the
thicknesses of the surface crust and the liquefiable soil layer, three values are considered (h1/B
= 0.5, 1, 2 and h2/B = 0.5, 1, 2). The total thickness of the soil profile is selected so that the
presence of bedrock does not affect the dynamic response of the footing. Accordingly, the
parametric investigation is focused upon the effect of thickness of the liquefied stratum, the
thickness and stiffness of the non-liquefiable surface crust (which should meet the bearing
capacity and settlement requirements of the superstructure under gravity loading [47]).
To obtain a set of governing problem parameters, standard dimensional analysis was
employed. The problem involves six major dimensional independent parameters that have
first-order influence on the response (M = 6). These are: thickness of surface crust, h1,
thickness of liquefiable layer, h2, shear wave propagation velocity of non-liquefiable surface
crust, Vs1, corresponding velocity of liquefiable layer, Vs2, footing width, B, and excitation
frequency, f. Parameters such as the stiffness of the base layer and the total thickness of the
soil profile have second order influence on the response and are not explored parametrically
here.
In light of the two fundamental dimensions, length [L] and time [T] (N = 2) associated with
the variables at hand, application of Buckingham’s theorem [11] yields four dimensionless

9
groups (M − N = 4) controlling the response of the footing. These ratios were selected to be
(h1/B), (h2/B), (Vs1/Vs2), (ωh1/Vs1), and are explored parametrically to assess their influence on
the dynamic stiffness and damping of the footing.
2.2 Numerical methodology outline
It is briefly recalled that for static conditions, the stiffness of a rigid square or circular
foundation is expressed in the following dimensionally consistent form [44]
( )0
1 2 1 2 1 1 , , , ,
ij
ij s s sm
Kf h B h B V V h V v
G B= (1)
where K0ij denotes the force or moment along the degree of freedom i of the footing for a unit
displacement or rotation along the degree of freedom j. G denotes a pertinent soil shear
modulus (typically that of the surface crust) and B the foundation width. The exponent m is
equal to 1 for translational and 3 for rotational degrees of freedom. Finally, fij (h1/B, h2/B,
Vs1/Vs2, ωh1/Vs1, v) is a dimensionless factor dependent solely on the aforementioned
dimensionless groups and the Poisson’s ratio.
It is stressed that since this work deals with surface footings, the coupling term is
negligible and only the vertical (K0vv), horizontal (K0
hh) and rocking (K0rr) stiffnesses are
considered.
For dynamic conditions, the dynamic impedance of the foundation is written in the familiar
form
( ) ( ) ) (ij ij ijS K i C = + (2)
where Kij and Cij are the dynamic stiffness and damping coefficients, respectively, and i is the
imaginary unit (√−1), which indicates a phase lag of 90o between the maximum dashpot
force and the corresponding spring force during harmonic oscillations. Employing the familiar
dimensionless frequency factor a0 = (ω B /Vs), the dynamic impedance can be expressed as
( ) ( )0
0 0 0 0 ( )ij ij ij ijS a K k a i a c a= + (3)
where K0ij is the static stiffness and kij, cij are real-valued dimensionless stiffness and damping
coefficients, respectively, which can be written as a function of dimensionless frequency a0. It
is noted that whereas kij may become negative at times (indicating a phase lag between
excitation and response greater than 90o), cij is always positive so as to comply with
thermodynamic constraints. It is worth mentioning that whilst parameter a0 is essentially
unique for half-space conditions (where B is the only parameter carrying units of length) it
10
might not be so in the presence of bedrock at a shallow depth [5], or in the presence of a
significantly stiffer surface crust. For the interpretation of the results at hand, the alternative
parameter (ωh1/Vs1) was selected [29].
2.3 Preliminary investigation using Cone Models
The dynamic impedance problem is first analyzed using Cone Model solutions. The most
advanced version of this theory is due to Wolf and Deeks [61] who employed wave
propagation in cones in conjunction with reflection and transmission coefficients at interfaces
separating different soil layers, to develop a methodology for determining the dynamic
stiffness and damping of surface or embedded cylindrical rigid foundations. Associated
translational and rotational truncated cones (i.e., tapered beams and rods) are based on the
convenient assumption of “plane sections remain plane” and the associated one-dimensional
displacements. By means of these models, the complex three-dimensional elastodynamic
problem is simplified to a problem of one-dimensional wave propagation, which admits
closed-form solutions in homogeneous media, or in the form of infinite sums of transmitted
and reflected waves in layered media. Apart from cylindrical foundations, various foundation
shapes such as square footings of side B can be analyzed in an approximate manner, by
considering an equivalent circular radius to match footing area for translational oscillation
modes [R = B/√π], or pertinent moment of inertia for rotational oscillation modes [R = B/
4√(3π)]. A multilayer soil profile overlying a half-space or bedrock may be readily employed,
consisting of any number of horizontal layers. Dynamic stiffness and damping are evaluated
for any single frequency under vertical, horizontal, rocking and torsional degrees of freedom.
This convenient approach to foundation dynamics has been implemented in the computer
code CONAN [61]. The accuracy of the model predictions has been verified in a number of
studies, which suggest deviations in impedance functions from rigorous solutions in the range
20%, which are admissible from a geotechnical engineering viewpoint [23, 61].
2.4 Boundary-Element analysis
For verification purposes and to perform more accurate analyses of the problem at hand, a
rigorous elastodynamic Boundary Element Method in three (3) dimensions was employed,
implemented by means of the software platform ISoBEM [25]. BEM allows for the reduction
in the dimensionality of the problem (from 3D to 2D), which means that only surfaces along
boundaries need to be discretized. In these analyses, isoparametric four-noded linear
quadrilateral elements are used for meshing the surfaces. Note that ISoBEM has been

11
successfully used to explore a variety of problems in soil and applied mechanics [22, 49, 55].
Three-dimensional models simulating a rigid square footing on a three-layer liquefiable soil in
ISoBEM were set up with a dual purpose: a) to provide comparisons and b) to yield fitted
formulae for static stiffness.
3. Parametric Analyses and Results based on Cone Solutions
3.1 Results for static stiffness
Fig. 2 presents results for the dimensionless static stiffness of a square rigid footing for
both pre-liquefaction (Vs1/Vs2= 0.67 and 1.67) and during liquefaction (Vs1/Vsliq= 4 and 10)
conditions. In the vertical axis, static stiffness K0ij is normalized with the shear modulus of the
non-liquefiable surface crust (G1 = Vs12 ρ1) and the width of the footing (B) according to Eq.
(1). Results are plotted against the thickness of the surface crust (h1/B), for three values of the
thickness parameter h2/B (= 0.5, 1, 2).
h1 / B
0.5 1.0 1.5 2.0
K0
vv /
(G
1 B
)
0.0
2.0
4.0
6.0
8.0
h2 / B = 0.5 h2 / B = 1 h2 / B = 2
K0
hh /
(G
1 B
)
0.0
1.0
2.0
3.0
4.0
0.5 1.0 1.5 2.0
Vs1 / Vs2 = 0.67
1.67
4
10
0.5 1.0 1.5 2.0
K0
rr /
(G
1 B
3)
0.0
0.5
1.0pre-liquefaction
during-liquefaction
Fig. 2. Dimensionless static stiffness coefficients of square rigid footing on three-layer
liquefiable soil based on cone method analyses.

12
The following noteworthy trends are evident in these graphs:
• The stiffness degradation of the liquefiable soil stratum during liquefaction associated
with the increase in impedance contrast ρ1Vs1/ρ2Vs2 leads to a significant decrease in static
stiffness, ranging from 28% to 78% for the vertical mode, 14% to 55% for the horizontal
mode and 2% to 38% for the rocking mode. The highest decrease is observed for an initial
shear wave velocity ratio Vs1/Vs2 = 0.67.
• As the crust thickness ratio h1/B increases, static stiffness for the liquefaction case
increases, an anticipated trend given that for a thick surface layer the pressure bulb beneath
the loaded area (about 1.5 B in diameter) does not extend to the soft liquefied soil.
• An increase in thickness of the liquefied soil (h2/B) seems to further reduce the static
stiffness coefficients, though this reduction is marginal for the range of parameters examined.
3.2 Results for dynamic impedance functions
With reference to the dynamic stiffness and damping, results are depicted in the form of
the dimensionless ratios (Kij / Kij) and (Cij / Cij), as a function of the dimensionless frequency
parameter (ωh1 / Vs1), Figs. 3−5. Kij and Cij denote the dynamic stiffness and damping during
liquefaction, while Kij and Cij denote the corresponding pre-liquefied values. The specific
normalization scheme along with the logarithmic scale for the horizontal axis allow for an
insightful interpretation of the results.
Two distinct frequency regions, (I) and (II), are evident in Fig. 3. Region (I), defined for
(ωh1 / Vs1) < 2, refers to footings having small to moderate width, B = 1 3 m, (h1 is
comparable to B), profiles with a soft soil crust, Vs1 = 100 150 m/s, and low frequency
excitation range f = 0 10 Hz. On the other hand, region (II) with (ωh1 / Vs1) > 2 corresponds
to large footings, B > 4 m, profiles with a soft to moderate soil crust, Vs1 = 100 250 m/s, and
a high frequency excitation range f > 15 Hz. The same applies for the horizontal and rocking
oscillation modes (Figs. 4 and 5), with the only difference being that the bound between these
two regions for the horizontal mode is reduced to (ωh1 / Vs1) = 1. It is noteworthy that
common buildings and structures fall into region (I). It is further observed that the dynamic
stiffness is considerably reduced in region (I), while the corresponding dynamic damping
ratio (Cij / Cij) increases well above unity. In region (II), dynamic stiffness starts to exhibit
sharp undulations while (Cij / Cij) ratio tends to unity.
The following additional noteworthy trends are evident from Figs. 3−5:

13
• The variation in thickness of the surface crust has a significant effect on the dynamic
stiffness and damping coefficients. Specifically, as the h1/B ratio decreases dynamic stiffness
decreases in region (I). In region (II), h1/B ratio controls the undulations in impedance
functions.
• With reference to damping, a significant increase during liquefaction is observed
mainly due to the increase in material damping of the liquefied layer. Increase in the thickness
of the surface crust results in amplification of damping for the vertical mode, while the
opposite trend is noticed for the other two modes. Interestingly, the vertical damping
coefficient ratio (Cvv / Cvv) exhibits a peak at around (ωh1 / Vs1) 0.75, which suggests
development of a kind of “anti-resonance” at Texc 2 Ts1 (i.e. Ts1 = 4h1/Vs1), possibly due to
destructive wave interference during liquefaction. However, this behavior is not observed in
the (Kvv / Kvv) ratio.
• The variation in thickness of the liquefiable soil stratum does not affect the dynamic
stiffness of the footing, and the (Kij / Kij) curves almost coincide. On the contrary, h2/B ratio
seems to affect the damping ratio (Cij / Cij) which increases as h2/B decreases, in both the
horizontal and rocking mode.
• In Figs. 2c – 4c, it is noted that the initial shear wave velocity ratio Vs1/Vs2 remains
constant (= 2/3) while for the liquefied layer assumed Vsliq = 10, 25 and 35 m/s being 7%,
17% and 23% of the initial shear wave velocity. Surprisingly, the Vs1/Vsliq ratio appears to
affect only slightly the dynamic impedance functions.
• Regarding the vertical dynamic stiffness, it is noted that for some frequencies the (Kvv
/ Kvv) ratio admits negative values (with Kvv being negative), which suggests a phase lag
between excitation and response greater than 90o. Moreover, in the high frequency range and
for h1/B = 0.5, the dynamic stiffness coefficients are extremely high. The latter observation
might indicate that the analysis provides unstable solutions at the high frequency range. This
might lie partially on numerical instability due to the very low wave propagation velocity in
the sand layer.

14
0.1 1
Dimensionless frequency, ω h1 / V
s1
0.1 10.1 1
Cvv /
Cvv
0.0
2.0
4.0
6.0
8.0
Kvv /
Kvv
-1.0
0.0
1.0
2.0
3.0h1 / B = 0.5
1
2
h2 / B = 0.5
1
2
Vs1 / Vs2 = 2.86
4
10
(a) (b) (c)
4 4 4
1.0
( I ) ( II )
~~
Fig. 3. Vertical dynamic impedance coefficients during liquefaction of square footing
normalized with the corresponding pre-liquefied impedance coefficients; Effect of a)
thickness of surface crust, b) thickness of liquefiable soil layer, c) shear wave velocity ratio;
h1/B = 0.5, h2/B = 1, Vs1/Vs2 = 2/3 (4).

15
0.1 1
Dimensionless frequency, ω h1 / V
s1
0.1 1
h2 / B = 0.5
1
2
Kh
h /
Kh
h
0.0
0.5
1.0
1.5
2.0h1 / B = 0.5
1
2
Vs1
/V s2
=2.86
4
10
(a) (b) (c)
0.1 1
Ch
h /
Ch
h
0.0
2.0
4.0
6.0
8.0
1.0
4 4 4
( I ) ( II )
~~
Fig. 4. Horizontal dynamic impedance coefficients during liquefaction of square footing
normalized with the corresponding pre-liquefied impedance coefficients; Effect of a)
thickness of surface crust, b) thickness of liquefiable soil layer, c) shear wave velocity ratio;
h1/B = 0.5, h2/B = 1, Vs1/Vs2 = 2/3 (4).

16
h2 / B = 0.5
1
2
Krr
/ K
rr
0.0
0.5
1.0
1.5
2.0h1 / B = 0.5
1
2
Dimensionless frequency, ω h1 / V
s1
0.1 1
Vs1 / Vs2 = 2.86
4
10
0.1 1
(a) (b) (c)
0.1 1
Crr
/ C
rr
0.0
2.0
4.0
6.0
8.0
4 4 4
1.0
( I ) ( II )
~~
Fig. 5. Rocking dynamic impedance coefficients during liquefaction of square footing
normalized with the corresponding pre-liquefied impedance coefficients; Effect of a)
thickness of surface crust, b) thickness of liquefiable soil layer, c) shear wave velocity ratio;
h1/B = 0.5, h2/B = 1, Vs1/Vs2 = 2/3 (4).
4. Parametric Analyses and Results based on Boundary-Element Solutions
4.1 Check accuracy of BEM analyses
In the realm of the BEM formulation, convergence studies for foundation impedance and
dynamic soil-structure interaction problems have been conducted by several researchers [3,4].
The most significant factors in providing accurate solutions are the distance of the non-
reflecting truncation boundary and the boundary element size [52]. To select the optimum
model, various 3D configurations (half and quarter domain) and mesh sizes for each
oscillation mode were examined.
Taking advantage of the symmetry of geometry and loading, for the vertical (symmetric)
oscillation mode, only one quarter of the system needs to be analyzed. For the horizontal and
rocking (antisymmetric) modes, analyzing a half model provides more accurate results. To
this end, the footing surface and the region around the footing up to a distance 3B is

17
discretized using iso-parametric four-noded quadrilateral linear elements with element length
about 1/12 of the shear wavelength. Moreover, the surface beyond this region and up to a
distance of 5B requires a fine mesh (element length = 1/8 of shear wavelength). The same also
applies for the interface between first and second layer. In addition, discretization of the
ground surface and the interfaces up to a distance of at least 10B to 15B beyond the edge of
the foundation is necessary for obtaining accurate results. Coarser elements with lengths of
1/3 to 1/2 of the shear wavelength are adequate for distant points [4].
For the vertical and horizontal oscillation modes, a uniform unit vertical and horizontal
displacement, respectively, is applied to all element nodes of the footing and the resulting
load is computed from the tractions developed on the element nodes [29]. For the rocking
mode, a unit rotation is applied.
Because of lack of solutions for stiffness of square footings on three-layer soil profiles, the
solution was checked by a) applying to all soil layers the same properties to obtain the
stiffness of a rigid square footing on a half-space, and b) applying to the second and third
layer the same properties, forming a two-layer soil profile, and comparing the results for
stiffness with results in literature.
To verify the BEM model, comparative studies are conducted with published results. Table
2 provides the comparison of ISoBEM results for normalized static stiffness of rigid square
footing on half-space, for all three oscillation modes, with the empirical formulas from Pais
and Kausel [45]. In Table 3, results for the horizontal static stiffness of a two-layer soil profile
(v1 = v2 = 0.4) are compared against corresponding solution obtained from Ahmad and Rupani
[4]. Fig. 6 depicts the comparison of ISoBEM results for horizontal, vertical and rocking
impedance of a square footing resting on a uniform soil layer over a half-space (Vs1/Vs2 = 0.8,
H/(B/2) = 1, v1 = v2 = 0.33, ρ2/ρ1 = 1.13, β1 = 0.05, β2 =0.03) with those reported by Wong
and Luco [59]. Evidently, results obtained by analyzing the developed model in ISoBEM are
in reasonable agreement with the published results.
Table 2: Comparison of normalized static stiffness K0ij/(GBm/2) of a rigid square footing on
half-space.
K0ij /(GBm/2)
Oscillation mode [Reference 45] ISoBEM Diff. (%)
Vertical (m=1) 7.12 6.93 2.7
Horizontal (m=1) 5.75 5.64 1.9
Rocking (m=3) 6.67 6.92 -3.7

18
Table 3: Comparison of normalized horizontal static stiffness K0hh/(G1B/2) of a rigid square
footing on a two-layer soil profile.
K0hh/(G1B/2)
H/B/2 Vs1/Vs2 = 0.5 Vs1/Vs2 = 2
ISoBEM Reference
[4]
Diff.
(%)
ISoBEM
Reference
[4]
Diff.
(%)
1 7.73 7.9 -2.2 3.79 3.8 -0.3
2 6.75 6.8 -0.7 4.50 4.4 2.2
4 6.22 6.2 0.3 5.09 5.0 1.8
0.0 0.5 1.0 1.5 2.0 2.5
a0 = ωB /(2 V
s)
0.0 0.5 1.0 1.5 2.0 2.50.0 0.5 1.0 1.5 2.0 2.5
Imp
ed
an
ce
fu
nc
tio
ns
0
2
4
6
8
10
12
14
16vertical horizontal rocking
Real part
Imaginary part
Wong & Luco (1985)
ISoBEM
Fig. 6. Comparison of dynamic impedance functions of a square footing resting on a two-
layer soil profile.
4.2 Results and regression formulae for static stiffness
Results for the dimensionless static stiffness during liquefaction (K0ij /K0
ij), obtained by
means of ISoBEM, for all three degrees of freedom, are presented in Table 4. The outcome of
this analysis demonstrates a significant loss of footing stiffness during liquefaction, being in
meaningful agreement with the preliminary results using cones. In the context of these
analyses, it is worth mentioning that:
• The decrease in static stiffness ranges from 11% to 84% for the vertical mode, 11% to
56% for the horizontal mode and 1% to 59% for the rocking mode, being comparable to those
predicted from the cone analyses.
• The highest decrease understandably occurs when a very thin surface clay crust (h1/B
= 0.5) overlies a thick liquefiable sandy layer (h2/B = 2), while the lowest decrease is

19
observed in the opposite case, where a thin liquefiable sandy layer (h2/B = 0.5) underlies a
thick surface clay zone (h1/B = 2).
• It is observed that for a given set of (h1/B) and (h2/B) ratios the percentage of decrease
in stiffness is independent of (Vs1/Vsliq), which is not obvious in the preliminary results.
• With reference to the horizontal mode, it is noted that the thickness of the liquefiable
layer (h2/B) appears to not affect considerably the horizontal stiffness.
• Regarding rocking response, BEM results reveal a significant reduction in static
stiffness, especially for h1/B = 0.5. On the contrary, for h1/B = 2 the reduction is negligible.
Table 4: Static stiffness coefficients during liquefaction of square footing normalized with the
corresponding pre-liquefaction static coefficients.
K0ij /K
0ij
Vertical Horizontal Rocking
Vs1/Vsliq
h1/B h2/B 4 7 10 4 7 10 4 7 10
0.5
0.5 0.41 0.38 0.39 0.54 0.52 0.54 0.53 0.53 0.55
1 0.25 0.24 0.26 0.48 0.48 0.52 0.46 0.45 0.48
2 0.17 0.16 0.17 0.44 0.45 0.50 0.42 0.41 0.44
1
0.5 0.68 0.64 0.64 0.74 0.70 0.71 0.88 0.87 0.88
1 0.51 0.47 0.47 0.69 0.66 0.69 0.85 0.83 0.85
2 0.36 0.32 0.33 0.64 0.63 0.67 0.81 0.82 0.82
2
0.5 0.89 0.87 0.87 0.89 0.86 0.86 0.99 0.99 0.99
1 0.80 0.77 0.76 0.85 0.83 0.84 0.97 0.97 0.97
2 0.68 0.63 0.63 0.81 0.81 0.83 0.96 0.97 0.99
Fig. 7 depicts the variation of normalized static footing stiffness in the post-liquefaction
case with the thickness of the improved surface crust (h1/B), for three values of the liquefied
soil zone, (h2/B). Using non-linear regression analysis based on the results of Fig. 7, a set of
predictive equations was derived, which is provided in Appendix A. These relations, although
complex, can be used in applications for a preliminary assessment of the problem. Note that
the regression formulae are valid for during-liquefaction conditions, i.e. for (Vs1/Vsliq) > 1, and
for the parameter range 0.5 (h2/B) 2.0. Numerical values obtained from the regression
formulae are illustrated in Fig. 7.

20
0.5 1.0 1.5 2.0
K0
rr /
(G
1 B
3)
0.0
0.2
0.4
0.6
0.8
1.0
K0
vv /
(G
1 B
)
0.0
1.0
2.0
3.0
4.0
5.0h2 / B = 0.5 h2 / B = 1 h2 / B = 2
K0
hh /
(G
1 B
)
0.0
1.0
2.0
3.0
h1 / B
0.5 1.0 1.5 2.0 0.5 1.0 1.5 2.0
Vs1 / Vsliq = 4
7
10
regression
Fig. 7. Normalized static stiffness of square rigid footing on liquefied soil based on BEM
results and results obtained using regression formulae.
4.3 Comparison of cone and BEM solutions
Results obtained from the cone solution were found to be in meaningful agreement with
those obtained by the boundary element method. For horizontal oscillations, the comparisons
are summarized in Table 5. It is observed that BEM typically predicts higher values for static
stiffness. The maximum discrepancies are on the order of 20%, and are anticipated in light of
the complexity of the problem and the extremely low value of shear wave velocity considered
for the liquefied stratum (Vsliq = 25 m/s). Also, the low value of the shear wave velocity of the
crust seems to play an important role in these deviations. The same also holds for the other
two modes of oscillation [30, 31].
Regardless of the observed discrepancies in absolute stiffnesses, the reduction in static
stiffness triggered by liquefaction is comparable in the two approaches, as shown in Section
3.1. Hence, rigorous elastodynamic boundary element results confirm the significant loss of
stiffness of the foundation during liquefaction. From a geotechnical engineering viewpoint,
results are generally comparable and the results from CONAN analyses can be used for a
preliminary assessment of the effect of liquefaction on the stiffness of the footing in an
equivalent-linear sense.

21
Table 5: Comparison of horizontal static stiffness coefficients (BEM vs Conan)
K0hh (BEM) / K
0hh (Cone)
Vs1 / Vs2
h1/B h2/B 0.67 1.67 4 10
0.5
0.5 1.24 1.16 1.22 1.08
1 1.22 1.13 1.28 1.08
2 1.21 1.12 1.24 1.07
1
0.5 1.19 1.15 1.41 1.10
1 1.19 1.14 1.35 1.10
2 1.18 1.11 1.29 1.11
2
0.5 1.16 1.14 1.45 1.14
1 1.16 1.13 1.41 1.14
2 1.18 1.13 1.36 1.16
Fig. 8 depicts a comparison between dynamic stiffness and damping coefficients obtained
by means of Cone and BEM solutions. The case where (h1/B) = 1, (h2/B) = 1 and (Vs1/Vsliq) =
4 is illustrated. Spring coefficient kij and dashpot coefficient cij are plotted, in accordance
with Eq. 3, against the dimensionless frequency coefficient a0 (= ωR/Vs1) with R = B/√π being
the equivalent circular radius stemming from the cone solution, and ω(B/2)/Vs1 for results
obtained using the boundary element method. For simplicity, the same equivalent radius was
also used for the rocking mode. The agreement between Cone model and BEM predictions is
satisfactory. Similar good agreement (not shown) was observed with other cases.
kij
0
1
2
3
4
0.0 0.5 1.0 1.5 2.0
Dimensionless frequency, a0
CONAN
ISoBEM
0.0 0.5 1.0 1.5 2.0
cij
0
2
4
6
8
vertical horizontal rocking
0.0 0.5 1.0 1.5 2.0
~~
Fig. 8. Comparison between Cone model and BEM results for dynamic stiffness and damping
coefficients; h1/B = 1, h2/B = 1, Vs1/Vsliq = 4.

22
5. Parametric investigation of the seismic response of bridge piers
The structural system examined is illustrated in Fig. 9a and may be considered as an
idealized model of an actual bridge. The pier is of single-column type with diameter d = 1.3
m, founded on a spread footing resting on soil prone to earthquake liquefaction. The axial
gravity load accommodated by the system is 3500 kN, typical of a two lane highway bridge
with spans of about 35 m. The bridge deck is free to rotate. Two column heights are
considered, Hc = 5 and 10 m, to explore the influence of the proposed geotechnical isolation
method to both squat-like and slender-like structural elements. It is also assumed that the
shape of the spread footing is square of side B = 7 m while its mass is equal to 120 Mg, which
is a reasonable value for a large foundation. For simplicity and to be comparable with the
results for the dynamic impedance functions obtained in Sections 3 and 4, it is further
assumed that the foundation has no embedment and, thus, there is no kinematic effect. The
analysis is carried out using the modified version of the numerical code SFIAB developed by
the authors [40].
The properties of the liquefiable soil profile are given in Fig. 9a. Two values for the
thickness of the improved non-liquefiable surface crust, h1 = 3.5 and 7 m, and two values for
the shear wave propagation velocity, Vs1 = 100 and 250 m/s, are examined. Note that the
depth setting the rigid bedrock is assumed to be either 20 m or about 110 m, conforming to a
shallow and a deep profile, respectively. It should be mentioned that before one can rely on
the proposed approach there also needs to check whether the strength and the thickness of the
crust below the foundation is such that there will not be a punching failure of the foundation
through to the liquefied layer below, such as discussed by a number of papers ([8, 15, 16, &
28]) cited early in the manuscript.
The soil-foundation-pier system is excited by vertically propagating S-waves
corresponding to a horizontal rock outcrop motion. Both frequency- and time-domain
analyses were conducted to investigate the impact of liquefaction on: a) the vibrational
characteristics (i.e., fundamental period, overall damping) of the foundation-bridge pier
system, and b) the response of the system to recorded earthquake motions. In time-domain
analyses, the Pacoima (Northridge 1994 earthquake) excitation time history having a Peak
Ground Acceleration (PGA) of 0.42g is used. The acceleration time history and the 5 and
10% damped acceleration response spectra are shown in Fig. 9b.
Owing to the common practice by structural engineers to adopt static foundation stiffness
for design purposes, it was deemed useful to explore the possibility of using only the static

23
value of foundation stiffness, instead of the actual frequency-dependent stiffness, for
determining the bridge response.
Fig. 9. a) Bridge pier supported on a spread footing on liquefiable soil with improved non-
liquefiable surface crust. b) Acceleration time history and 5, 10% damped spectra.
5.1.Application to short bridge piers on a deep soil profile
The harmonic steady-state and transient seismic response of a short pier, Hc = 5 m, with a
“soft” improved surface zone (Vs1 = 100 m/s) prior to the onset and during the course of
liquefaction, resting on a deep soil profile (h3 = 98 m), are depicted in Figs. 10 and 11. The
following noteworthy observations can be made with the help of these graphs:
• For the pre-liquefaction case, the fundamental natural period, T1, of the soil deposit
appears to be 1.46 s, which is close to the natural period of the thick and stiff base stratum
(i.e., 4h3 / Vs3 = 498/300 1.31 s). The second natural period, T2, of the soil deposit is 0.49 s,
which is approximately 1/3 of the fundamental period T1 – as anticipated for a shear system.
The fundamental period of the pier-foundation-soil system is equal to T = 0.54 s – which is
close to the second resonance of soil – and seems to be crucial to the response of the pier. The
amplitude of pier response is about A = 11.3, corresponding to about 4.4 % [A 1/(2β )] of
Time (s)
0 2 4 6 8 10 12
Gro
un
d A
cce
lera
tio
n (
g)
-0.6
-0.4
-0.2
0.0
0.2
0.4
0.6
Pacoima, Northridge (1994)
Period (s)
0.0 0.5 1.0 1.5
Sp
ectr
al A
ccele
rati
on
(g
)
0.0
0.2
0.4
0.6
0.8
1.0
1.2
î = 5%
10%
Non-liquefiable crust
Liquefiable layer
Non-liquefiable soil
Hc = 5, 10 m
B = 7 mVs1 = 100 m/s,
250 m/s
v1= 0.33, β1 = 0.03
ms = 350 Mg
mb = 120 Mg
Vs2 = 150 m/s, β2 = 0.03
Vsliq = 25 m/s, β2 =0.20
v2 = 0.49
Vs3 = 300 m/s
v3 = 0.49
β3 = 0.03
h1 = 3.5 m
h2 = 7 m
h3 = 9.5, 98 m
(a) (b)
H =
20
, 1
08
.5 m
Bedrock
ξ = 5%10%
ΕΙ = 3.5 106 kN m2
β = 5%

24
overall damping of the pier-foundation-soil system, which seems reasonable if one considers
that the hysteretic material damping is 3%.
• For the liquefaction case, the harmonic steady-state transfer functions display two
peaks, at 1.78 s and 1.2 s. The first resonance in the soil occurs at 1.78 s and the second one at
1.2 s exhibiting a marginally greater amplification. The second peak can be associated with
resonance of the liquefiable layer (i.e., 4h2 / Vsliq = 4 7/25 1.12 s). The fundamental period
of the pier-foundation-soil system, T = 0.61 s, lies very close to the third-mode resonance
occurring at 0.59 s. The amplification factor for the bridge pier is about A = 4.74 and implies
that the effective damping of the overall system reaches up to 10.5% – mainly due to damping
in the liquefied layer. Finally, the maximum amplification in the soil is about two times
smaller compared to that in pre-liquefaction conditions.
• The increase in the fundamental period of the soil can be verified by means of a
simple analytical solution. Using the Rayleigh quotient along with a pertinent shape function
obtained from the lateral equilibrium of a soil column having the same layering and
inhomogeneity properties [42], a generalized closed-form solution is developed for the
prediction of the fundamental natural period of a three-layer soil deposit (Appendix B). The
analytical solution for pre- and during liquefaction conditions yields T1 = 1.44s and 1.64s,
respectively, which are very close to the numerically evaluated ones.
• Comparison of amplification functions reveals two important features of the
liquefaction effect on seismic response of the superstructure: a) the fundamental oscillation
period increases from T = 0.54 s to T = 0.61 s, a shift of about 11.5%, and b) the amplitude of
the response decreases considerably by 58%. For pre-liquefaction conditions, the well-known
formula of Veletsos and Meek [57] yields,
0 2 4 5 2
0 0 5 6
8.41 10 4.23 10 51 1 0.41 1 1 0.54
4.23 10 3.97 10
st hh cst
hh rr
K K HT T s s
K K
= + + = + + =
% (4)
Likewise, during liquefaction conditions,
4 5 2
5 6
8.41 10 1.95 10 50.41 1 1 0.62
1.95 10 2.55 10T s s
= + + =
% (5)
where Tst is the fixed-base fundamental period of the superstructure Tst = 2 [ms / (3EI/Hc3)]½
= 0.41 s (Fig. 10).
Evidently, the fundamental period of pier-foundation-soil system T for both pre- and
during-liquefaction is quite close to the fixed-base fundamental period of the structure. This

25
can be attributed to the compliance of the deck, which is free to rotate at the top and, thus, the
response is controlled to a greater extent by the characteristics of the superstructure.
Moreover, the dominant periods of the rock-outcrop motion are within the range 0.15 to 0.5 s,
which also plays an important role in the response.
In the time domain (Fig. 11), comparison of acceleration histories shows a remarkable de-
amplification of the seismic motion during liquefaction which has a beneficial effect on the
seismic response of the pier.
Tra
ns
fer
fun
cti
on
wrt
ro
ck
ou
tcro
p m
oti
on
0
10
20
30
40
50Free Field
Footing
Bridge
Period (sec)
0.0 0.5 1.0 1.5 2.0 2.5
Tra
ns
fer
fun
cti
on
wrt
fr
ee
-fie
ld s
urf
ac
e m
oti
on
0
2
4
6
8
10
12Footing
Bridge
Fixed-base
pre-liquefaction
during-liquefaction
(a)
(b)
Fig. 10. Harmonic steady-state transfer functions for pre- and during-liquefaction for a short
bridge pier; Hc = 5 m, B = 7 m, h1 /B = 0.5, h2 /B = 1, Vs1 /Vs2 = 2/3 (4).

26
-40
-20
0
20
40
pre-liquefaction
during-liquefaction
Acce
lera
tio
n (
m/s
ec
2)
-40
-20
0
20
40
Time (sec)
0 2 4 6 8 10
-40
-20
0
20
40
Bridge
Footing
Free-Field
Fig. 11. Comparison of acceleration histories in pre- and during-liquefaction conditions for a
short bridge pier; Hc = 5 m, B = 7 m, h1 /B = 0.5, h2 /B = 1, Vs1 /Vs2 = 2/3 (4).
5.2 Application to tall bridge piers
Results presented in this section refer to a bridge pier with height twice as large as in the
previous case (Hc = 10 m). The following noteworthy observations can be made:
• For pre-liquefaction conditions, the fundamental period of the pier-foundation-soil
system is T = 1.32 s, which is close to the first resonance of the soil layer, and the
amplification factor is equal to A 10.6, as shown in Fig. 12a. For liquefaction conditions,

27
the fundamental period shifts to T = 1.41 s and the amplification factor drops to A 8.9.
Evidently, the period shift is smaller compared to that for the short pier (an increase of about
6.4%) and the decrease in amplitude is about 16%.
• The minor effect of liquefaction on the seismic response of the pier is apparent in Fig.
12b. This is anticipated in light of the response spectrum of the rock outcrop motion (Fig. 9b).
Indeed, both fundamental periods for pre- and during-liquefaction conditions, 1.32 and 1.41s,
are far beyond the range of predominant periods of the excitation, which indicates that an
increase in natural period due to liquefaction has little impact on the pier response.
• Additionally, Fig.12 shows the transfer function and bridge acceleration history of the
fixed-base pier – a common assumption of designers – to highlight the role of geotechnical
engineering in the seismic vulnerability assessment of structures.

28
Period (sec)
0.0 0.5 1.0 1.5 2.0 2.5 3.0Tra
ns
fer
fun
cti
on
wrt
fr
ee
-fie
ld s
urf
ac
e m
oti
on
0
2
4
6
8
10
12Footing
Bridge
Fixed-base
pre-liquefaction
during-liquefaction
Ac
ce
lera
tio
n (
m/s
ec
2)
-40
-20
0
20
40pre-liquefaction
during-liquefaction
Bridge
(a)
(b)
Time (sec)
0 2 4 6 8 10
-40
-20
0
20
40
Fixed-base Bridge
Fig. 12. Comparison of a) harmonic steady-state transfer functions and b) bridge acceleration
history in pre- and during-liquefaction conditions; Hc = 10 m, B = 7 m, h1 /B = 0.5, h2 /B = 1,
Vs1 /Vs2 = 2/3 (4).
5.3 Influence of stiffness of the non-liquefiable surface crust
To elucidate the role of the surface crust on bridge response, a stiffer surface zone with
shear wave propagation velocity Vs1 = 250 m/s is considered. The analysis refers to the short
pier (Hc = 5m). Important findings from Fig. 13 are summarized below:
• The stiffness of the thin surface soil layer does not alter substantially the free-field
response. Likewise, the fundamental period of the soil deposit is almost invariant in the pre-
and during-liquefaction case. However, the increase in stiffness of the surface layer does
modify the fundamental period of the pier at T = 0.43 s and 0.45 s for pre- and during-

29
liquefaction case, respectively, bringing it closer to the fixed-base fundamental period, i.e., Tst
= 0.41 s. This indicates that the stiff surface soil layer operates essentially as a fixity condition
for the superstructure, thus cancelling out any SFSI effect of the underlying liquefiable soil
layer.
• With reference to response amplitude, for no liquefaction conditions the amplification
factor A is about 9.9, leading to a damping ratio almost identical to that of the superstructure.
For conditions during liquefaction, amplitude drops down to 8 (a 20% reduction) due to
higher overall damping.
• The bridge response is de-amplified, mainly due to the de-amplification of the free
field ground response.
Period (sec)
0.0 0.5 1.0 1.5Tra
ns
fer
fun
cti
on
wrt
fr
ee-f
ield
su
rface m
oti
on
0
2
4
6
8
10
12Footing
Bridge
Fixed-base
pre-liquefaction
during-liquefaction
Accele
rati
on
(m
/sec
2)
-40
-20
0
20
40pre-liquefaction
during-liquefaction
Bridge
(a)
(b)
Time (sec)
0 2 4 6 8 10
-40
-20
0
20
40
Fixed-base Bridge
Fig. 13. Comparison of a) harmonic steady-state transfer functions and b) bridge acceleration
history in pre- and during-liquefaction conditions; Hc = 5 m, B = 7 m, h1 /B = 0.5, h2 /B = 1,
Vs1 /Vs2 = 5/3 (10).

30
5.4 Influence of thickness of the non-liquefiable surface crust
The influence of a thicker (h1 = 7 m, Vs1 = 100 m/s) surface zone on the vibrational
characteristics of the bridge pier is presented in Fig.14, referring to a short pier. The following
trends are worthy of note:
• The elongation of the fundamental period of the SSI system upon liquefaction is
negligible.
• The decrease in bridge response amplification factor at resonance is significant, on the
order of 40% over the pre-liquefaction case. However, the discrepancy is lower compared to
the predicted one for h1 = 3.5 m. This is anticipated as the thickness of the surface zone
increases, hence liquefaction has a smaller influence on free-field response.
• Bridge acceleration histories show a substantial increase in response for the pre-
liquefaction case and a decrease during liquefaction. This is understood given that the
thickness of the soft soil overlying the stiff stratum doubles, thus the free-field motion is
amplified. On the contrary, for liquefaction conditions the increase in thickness of the surface
soft soil leads to an elongation in fundamental site period to T1 = 2.16 s, thus generating a
significant de-amplification in seismic response.

31
Period (sec)
0.0 0.5 1.0 1.5Tra
ns
fer
fun
cti
on
wrt
fr
ee-f
ield
su
rface m
oti
on
0
2
4
6
8
10
12Footing
Bridge
Fixed-base
pre-liquefaction
during-liquefactionA
ccele
rati
on
(m
/sec
2)
-40
-20
0
20
40pre-liquefaction
during-liquefaction
Bridge
(a)
(b)
Time (sec)
0 2 4 6 8 10
-40
-20
0
20
40
Fixed-base Bridge
Fig. 14. Comparison of a) harmonic steady-state transfer functions and b) bridge acceleration
history in pre- and during-liquefaction conditions; Hc = 5 m, B = 7 m, h1 / B = 1, h2 / B = 1,
Vs1 / Vs2 = 2/3 (4).
5.5 Effect of depth to bedrock
Figure 15a shows results for the harmonic steady-state transfer functions for a short bridge
pier (Hc = 5m) when the bedrock is located at a shallow depth. Results refer to a soil profile
having (h1 / B) = 0.5, (h2 / B) = 1, (Vs1 / Vs2) = 2/3, as in application 5.1, with the exception
that the total depth of the soil profile is 20m.
• Evidently, transfer functions with reference to rock outcrop motion change drastically,
and the fundamental period of the soil deposit increases from 0.35 s to 1.63 s due to the
softening of the soil caused by liquefaction. The analytical solution also predicts T1 = 0.35 s

32
and 1.64 s for pre- and during-liquefaction conditions, respectively. As a result, the de-
amplification of the free-field acceleration is substantial (Fig.15b), which hence results in
major attenuation of the bridge acceleration (not shown).
• Note that the fundamental period of the SFSI system (for both pre- and during-
liquefaction conditions) is unaffected by the presence of the shallow bedrock as the dynamic
impedance functions are hardly affected.
• It is mentioned that in case of a short soil profile, the role of SSI in the response of a
structure is more pronounced. For pre-liquefaction conditions, the fixed-base bridge
acceleration is about 55 m/s2 and upon consideration of SSI reduces to 26 m/s2, for during-
liquefaction conditions the acceleration is about 6 m/s2 and 3.4 m/s2, respectively.
• In light of the above and with reference to the impact of liquefaction on the dynamic
response of a structure, there are two important mechanisms. The first mechanism is
associated with the elongation of the site period due to the softening of the soil, which
indicates that the triggering of liquefaction may attenuate the seismic motion. The second
mechanism lies in the shift in fundamental period of the pier-foundation-soil system, which
may transfer the period of the system out of the predominant (harmful) frequency range of the
earthquake excitation. In this example, the most important mechanism seems to be the first
one, as no significant elongation in fundamental period of the system is observed.
Nevertheless, the effect of the second mechanism may be more pronounced in case of a
smaller footing. If one solves the problem at hand by utilizing a square footing of 5m wide
(instead of 7m), the increase in fundamental period of the bridge pier is an appreciable 21%.
This renders the second mechanism an important factor as well, which may affect the bridge
response upon liquefaction. In this regard, it should be mentioned that period elongation
increases the system deformations, as the fundamental period is shifted into the displacement-
sensitive region of the spectrum. This may lead to midspan bridge collapse, a failure
mechanism based on the differential elongation of fundamental period of piers supporting a
river bridge due to liquefaction, and has been observed in many cases [39]. This means that
upon the implementation of the proposed method the pier’s lateral displacements should be
always checked to be within acceptable limits.

33
Period (sec)
0.0 0.5 1.0 1.5 2.0 2.5
Tra
ns
fer
fun
cti
on
wrt
ro
ck
ou
tcro
p m
oti
on
0
5
10
15
20
25
30Free Field
Footing
Bridge
Ac
ce
lera
tio
n (
m /
se
c2) -30
-20
-10
0
10
20
30
pre-liquefaction
during-liquefaction
Free Field
-30
-20
-10
0
10
20
30Bridge
Time (sec)
0 2 4 6 8 10
-60
-40
-20
0
20
40
60Fixed-base Bridge
(a)
(b)
Fig. 15. Comparison of a) harmonic steady-state transfer functions and b) free-field and
bridge acceleration history in pre- and during-liquefaction conditions for a short pier and
shallow soil profile; Hc = 5 m, B = 7 m, h1 / B = 0.5, h2 / B = 1, Vs1 / Vs2 = 2/3 (4).
5.6 Bridge seismic response considering only static stiffness
Figure 16 presents results in case where the frequency-dependence of stiffness is ignored
and only the static value is considered, i.e., stiffness for ω = 0. Results refer to (h1 / B) = 0.5,
(h2 / B) = 1, (Vs1 / Vs2) = 2/3 (4) and Hc = 5 m, taking into account the horizontal and rocking

34
static stiffness (vertical stiffness is not part of the dynamic problem). The material damping
ratio for both pre- and during-liquefaction conditions is assumed equal to 10%, being a more
realistic value for a soft soil. For simplicity, in this example, radiation damping has been
neglected.
• Evidently, the fundamental period of the pier-foundation-soil system does not shift,
but the amplitude changes. It is observed that for both pre- and during-liquefaction conditions
the amplification factor is relatively low, due to the assumed value of soil material damping
(10%). Considering only static stiffness and no radiation damping, the decrease in amplitude
is less than about 11%.
• The high peaks in footing harmonic transfer functions in the short period range is
probably the result of a “secondary resonance” between the strong-short period part of the
excitation motion and the resonance of the first soil layer (i.e., 4h1 / Vs1 = 4 3.5/100 0.14
s). However, the impact of this part of footing motion on bridge response is insignificant.
• Comparison of bridge acceleration history in pre- and during-liquefaction conditions
shows that the bridge motion decreases under the effect of liquefaction, even without the
beneficial effect of the frequency-dependent stiffness and damping of the footing. Overall,
using static stiffness in the analysis of the specific problem may lead to conservative results.

35
Period (sec)
0.0 0.5 1.0 1.5Tra
ns
fer
fun
cti
on
wrt
fr
ee
-fie
ld s
urf
ac
e m
oti
on
0
2
4
6
8
10
12Footing
Bridge
Fixed-base
pre-liquefaction
during-liquefactionA
cc
ele
rati
on
(m
/se
c2)
-40
-20
0
20
40pre-liquefaction
during-liquefaction
Bridge
(a)
(b)
Time (sec)
0 2 4 6 8 10
-40
-20
0
20
40
Fixed-base Bridge
Fig. 16. Comparison of a) harmonic steady-state transfer functions and b) free-field
acceleration history in pre- and during-liquefaction conditions considering only static
stiffness; Hc = 5 m, B = 7 m, h1 / B = 0.5, h2 / B = 1, Vs1 / Vs2 = 2/3 (4).
5.7 Shift in natural period of the system upon liquefaction
As a final remark, one may quantify the influence of liquefaction on the natural period of the
system by using the results for static stiffness of footing and rearranging Eq. (4) by means of
the familiar equation of Veletsos and Meek [20, 44, 57]
2 22
1
41 1c hh c
st hh c st s rr
H a HT
T a H B T V a B
= + +
% (6)
36
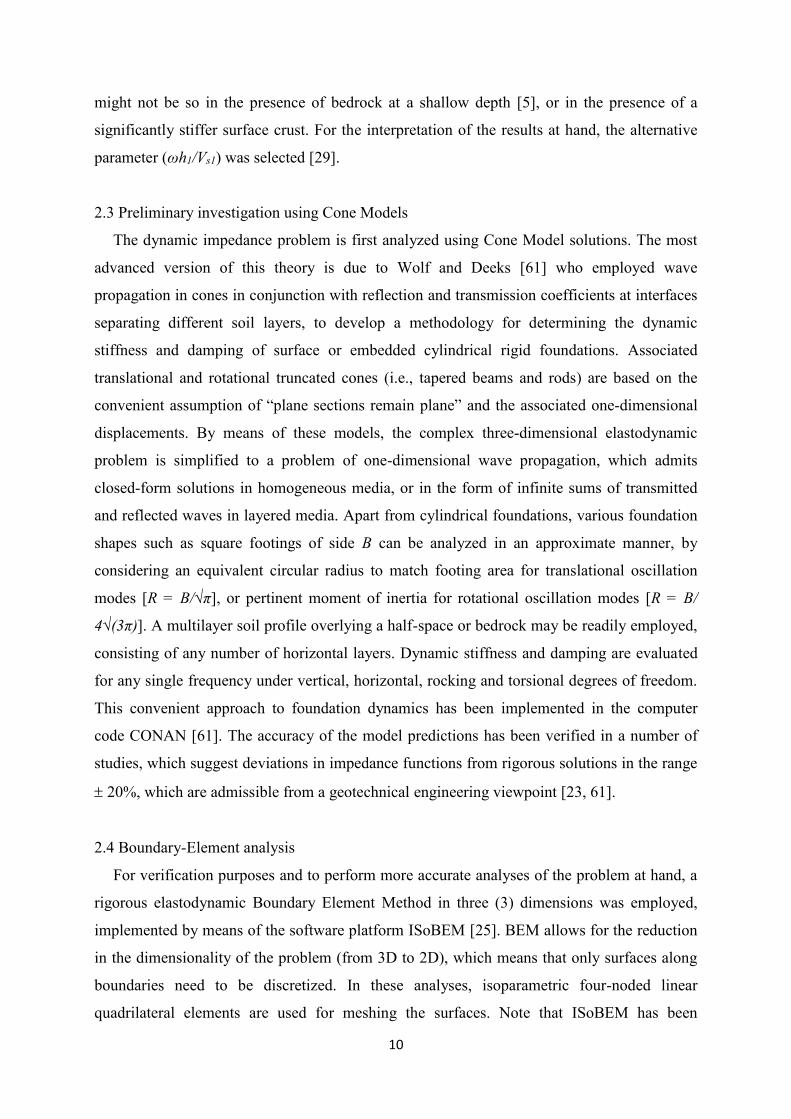
with γ (= ms /(ρ1 Hc B2)) being the relative mass density and ahh (= Khh/(G1 B)) and arr (=
Krr/(G1 B3)) the dimensionless static stiffness coefficients. Fig. 17 depicts results for the
relative natural period, Tliq/ Tpre-liq, of the pier-foundation-soil system, obtained by dividing
the right-hand side of Eq. 6 for the relevant conditions, as a function of the dimensionless
ratio Hc/(Tst Vs1). Evidently, increase in (Hc/B) ratio and decrease in (h1/h2) result in a greater
shift in the fundamental period of the system. This graph can be used to size the footing from
a seismic isolation viewpoint.
0.00 0.05 0.10 0.15 0.20 0.25
Tli
q / T
pre
-liq
1.0
1.1
1.2
1.3
1.4
1.5
0.00 0.05 0.10 0.15 0.20 0.25
Hc / (T
st V
s1)
0.00 0.05 0.10 0.15 0.20 0.25
h1 / h
2 = 1
h1 / h
2 = 0.5 h
1 / h
2 = 0.25
~
Hc / B = 2
1.5
1.0
0.5
Vs1
/ Vs2
= 2/3 (4)
h1 / B =0.5
γ = 0.714
~
Fig. 17. Relative natural period of the system upon the influence of liquefaction.
6. Conclusions
The main conclusions of this study are:
1. Under the convenient assumption of equivalent material linearity, the dynamic
impedance problem of a rigid square footing lying on a three-layer liquefiable soil profile was
numerically investigated, considering all three planar oscillation modes (vertical, horizontal
and rocking). Notwithstanding the non-linear nature of the liquefaction phenomenon, it was
demonstrated that one may employ elastodynamic analysis as an engineering approximation
to the problem in the sub-structuring sense, i.e., by assuming appropriate values for the shear
wave velocity and material damping of the liquefied soil stratum, and considering a kind of
“permanent” liquefied condition during the seismic event. This treatment facilitates the
comparison between results during liquefaction and prior to liquefaction for the impedance
functions of footing and the seismic response of bridge pier.
2. It is well known that such an approach may lead to inaccurate results when trying to
simulate liquefaction, which involves strong nonlinearities, pore pressure effects, etc. On the
other hand, a rough estimation of surface free-field motion in presence of liquefaction may be

37
possible through the viscoelastic assumption in an approximate manner, following the works
in Refs. 7, 9, 54, which obtain surface elastic response spectra combining responses of the soil
in the pre-liquefaction and during-liquefaction stages. In the same vein, it is possible to
extrapolate these concepts to the structural response (i.e. furnishing a rule which combines
two simple viscoelastic analyses to obtain the final spectrum). This is a worthy future research
task, which will take considerable effort and caution to be completed as the aforementioned
analyses are far more complicated (3D, elastoplastic, with soil and structural elements) than
the 1D soil response analyses in Refs 7, 9 and 54. In addition, it is believed by the authors that
the simplified visco-elastic analyses of this paper serve well the “proof-of-concept” aim of the
present study.
3. Results obtained from simplified cone models (CONAN analysis) compare reasonably
well with rigorous elastodynamic results for a three-layer profile using boundary elements
(ISoBEM analysis) with deviations of about 20%. From a geotechnical engineering
viewpoint, results are generally comparable and both methods demonstrate a significant
decrease in footing stiffness accompanied by a considerable increase in damping due to
liquefaction. In this light, the cone solution seems to be sufficient for a preliminary
assessment of the problem.
4. Static stiffness of the footing drops dramatically under liquefied conditions. Based on
the more rigorous BEM analyses, the decrease in static stiffness ranges from 11% to 84% for
the vertical mode, 11% to 56% for the horizontal mode, and 1% to 59% for rocking. Using the
BEM results, regression formulae for the vertical, horizontal and rocking static stiffness were
obtained, which can be used for an initial assessment of the static stiffness of surface footings
on liquefied soil.
5. The influence of liquefaction on the dynamic impedance functions is investigated
through the dimensionless ratios (Kij / Kij) and (Cij / Cij). Results demonstrate the existence of
two distinct regions: for the low frequency range and footings used for the foundation of
common structures (ωh1/Vs1 < 1 2), a significant reduction is observed in dynamic stiffness
accompanied by a considerable increase in damping. Outside this range (ωh1 / Vs1 > 2),
dynamic stiffness exhibits sharp undulations while damping ratio (Cij / Cij) tends to unity.
6. Key parameters of the problem emerging from this study are the thickness of the
surface non-liquefiable crust (h1/B), the thickness of the liquefiable soil layer (h2/B), the
relative stiffness of the surface layer (Vs1 /Vs2), and the dimensionless excitation frequency
(ωh1 / Vs1).

38
7. The (h1/B) ratio controls the undulations of the dimensionless ratios (Kij / Kij) and (Cij /
Cij), and the change in the dynamic stiffness and damping due to liquefaction. On the other
hand, The (h2/B) and the (Vs1/Vsliq) ratios affect only marginally the variation in the dynamic
impedance functions.
8. Upon liquefaction, the normalized static stiffness increases with increasing (h1/B) and
decreases with increasing (h2/B) and increasing (Vs1/Vsliq).
9. To assess the impact of liquefaction on the dynamic response of the bridge pier, two
separate analyses prior and during liquefaction were employed. In the frequency domain,
results reveal elongation in the fundamental period of the SSI system and drop in
amplification factor due to liquefaction. Time-history analyses showed significant attenuation
of both the free-field and the bridge motion.
10. In case of tall bridge piers, liquefaction does not significantly modify the vibrational
characteristics of the SFSI system. A small shift in the fundamental period of the system and a
marginal decrease in amplitude are observed, while the peak acceleration developing on the
bridge seems to be unaffected.
11. The stiffness of the non-liquefiable surface crust plays a significant role in the
dynamic response of the pier-foundation-soil system. A stiff zone appears to act as a fixity
condition for the pier and, hence, the fundamental period of the system is close to the fixed-
base value. Nevertheless, the bridge response is de-amplified due to the softening of the soil
deposit.
12. As the thickness of the surface crust increases, the elongation of the fundamental
period of the system is marginal, while the decrease in system amplitude at resonance is
decisive. Moreover, the increase in thickness of the surface soft soil leads to a lengthening in
fundamental site period, which further contributes to the de-amplification of seismic response
in both soil and structure.
13. Since engineers commonly use static foundation stiffness (instead of the actual
frequency-dependent impedance functions) for design purposes, the consequences of this
practice were examined. Zero radiation damping and the same soil material damping were
assumed for both pre- and during-liquefaction conditions. Apparently, the fundamental period
of the system is unaffected. However, the beneficial effect of the enhanced damping of the
liquefied soil was not considered, leading to conservative results. Nevertheless, during
liquefaction, the bridge motion decreases due to the softening of the soil that controls the free
field response.

39
14. Liquefaction has a threefold impact on pier response. The first mechanism is
associated with the elongation of the site period due to the softening of the soil, which
indicates that the triggering of liquefaction may attenuate the seismic motion. The second
mechanism refers to the increase in damping during liquefaction, which also dissipates
seismic energy leading to a reduced free-field motion. The third mechanism relates to the shift
in fundamental period of the pier-foundation-soil system, which may bring the period of the
system out of the harmful frequency range of the earthquake excitation. In principle, all three
mechanisms may play an important role in the modification (decrease) of seismic response
during liquefaction. However, the effect of soil liquefaction on the vibrational characteristics
of the pier-foundation system decreases drastically with increasing soil crust thickness and,
consequently, the intended natural base isolation of the structural system is mainly achieved
by the reduction in free-field seismic ground response.
It is finally noted that, contrary to common liquefaction-related hazards (e.g. lateral spreading,
settlement, etc.) where a statistically minimum value of the liquefaction resistance (CRR) is
used to define FSL, the proposed design concept relies upon the occurrence of liquefaction
and consequently it should be based on a statistically maximum CRR value. It will not be
difficult to modify the empirical charts that are presently used for this purpose, based on the
probabilistic evaluation of the corresponding field data, e.g. instead of considering the
liquefaction resistance with 95% probability of exceedance we should consider the one with
5% probability of exceedance [35]. Until then, liquefaction evaluation, in connection to the
present problem, should be based on the “un-conservative” (in the common sense of the term)
selection of soil parameters, e.g. choose the Nspt and qcpt values with probability 95% of not
being exceeded.
Appendix A
Predictive equations for the static stiffness of a surface square rigid footing on liquefied soil:
1. Vertical static stiffness
For h2/B = 0.5,
0
1 11
1
0.28 8.34 0.33 1 1.2 6.82 10.15 1 0.54vv s s
sliq sliq
K V VhExp Exp Exp
G B V B V
= − + − + − − − + − −
(A.1)
For 1 h2/B 2,

40
0
12
1
2 2 1 2 2 1
1.54 0.27 0.174 2.33 0.254
2.24 2.84 1 0.72 0.21 2.04 0.15 1 0.05 0.46
vv s
sliq
K VhExp
G B B V
h h h h h hExp Exp
B B B B B B
= − − + − +
+ + − − − − − − − +
(A.2)
2. Horizontal static stiffness
20
2 2
1
0.45
1 1 1 2
1.07 0.18 0.07
0.32 2.46 0.32 2.1 1 0.55 1 2.02 0.83
hh
s s
sliq sliq
K h h
G B B B
V V h hExp Exp Exp
V V B B
= − +
+ − + − − − − −
(A.3)
3. Rocking static stiffness
( )
0
1 2
3
1 1 11
1 1 10.01 1
0.37 0.024 1.68 0.281.26 0.006
rr
s sliq s sliqs sliq
K h hExp
G B B V V V V BV V
= + − − − + ++
(A.4)
Appendix B
Fig. B1. Inhomogeneous three-layer soil deposit over a rigid base.
G
z
G1,B G2,B G3,B
1 1,BG G=
2 2,BG G=
3 3,BG G=
H1
H2
H

41
Fig. B1 illustrates a three-layer soil deposit over a rigid base. The mass density and the
shear modulus are assumed constant within each layer, with GB being the shear modulus at the
bottom of the layer and z the depth measured from the ground surface.
Based on [17, 42] the natural frequencies of a soil deposit may be derived using the
Rayleigh quotient which, upon expressing the displacement as u(z) = u0 ψ(z), becomes
( ) ( ) ( ) ( ) ( ) ( )2 2 2 22
0 0 0 0
H H H H
G z u z dz u z G z z dz z = = (B1)
ψ(z) being a dimensionless unitary shape function representing the shape mode corresponding
to the fundamental natural frequency of the inhomogeneous soil. The mode shape is
determined as the lateral movement of the soil column under distributed load, with the origin
of displacement axis at the top of the soil column. The soil lateral displacement is
( ) ( )( )
( )0 0
z z z g zu z z dz dz
G z
= = (B2)
where γ(z) is the shear strain. The shape function is usually unitary and should be zero at the
base, to satisfy the essential boundary conditions of the problem,
( )( )( )
( )( )0 0
1z Hz g z z g z
z dz dzG z G z
= − (B3)
Specific forms of the above equation, for the single layer and the two-layer soil profile, are
provided in [17]. For a three-layer soil deposit with each layer having constant shear modulus,
Eq. B3 becomes
( )
( )
2 2 2 2 2
1 2 1 21 2 1
2 2 2
2 21 2 1 2
2
2 2
1, 0
2 2 2
11,
2 2
1, 1
2
H z H H Ha a z H
H z Hz a a H z H
D
za H z
− − −+ +
− −
= + −
% % % %% %%
% %% % %%
%% %
(B4)
with H1 = H1/H and H2 = H2/H being the dimensionless depth of the first and second layer of
the soil deposit, z = z/H is the dimensionless depth measured from ground surface, and
2 2 2 2
1 2 1 21 2
1
2 2 2
H H H HD a a
− −= + +% % % %
(B5)
( ) ( )2 2
1 1, 2, 2 1, 3,,s B s B s B s Ba V V a V V= = (B6)

42
with Vs,B = (GB/ρ)1/2 being the shear wave propagation velocity at the bottom of the layer.
Using the shape function in Eq. B4, the Rayleigh quotient (Eq. B1) yields
21 11,2 1 1 1 2 2 2 3
4 1 5 2 6
s B
n
Vk a k a k
k k k H
− − + +=
+ + (B7)
where
3 3 3 32 21 2 1 2
1 2 1 3 2
1, ,
3 3 3
H H H Hk k a k a
− −= = =% % % %
(B8)
( ) ( ) ( ) ( )5 3
22 2 2 2 2 21 1 1
4 1 1 2 2 2 1 1 2 2 2
21 1
15 3 4
H H Hk a H H a H a H H a H = − − − − + − − −
% % %% % % % % % (B9)
( ) ( )( )( ) ( )
( ) ( )
2 2 2
5 1 2 1 2 1 2 1 2 2 2 2
22 2 2
1 1 2 1 1 2 2
110 2 1 15 1
60
3 9 8
k H H a a H H H H H a H
a H H H H H H
= − − − + − + + − + +
+ − + +
% % % % % % % %
% % % %% % (B10)
( ) ( )2
32 22
6 2 2 21 8 9 360
ak H H H= − − + + +% % % (B11)
1 2 1 2 3 1, = = (B12)
Acknowledgements
This research was co-financed by the European Union (European Social Fund – ESF)
and Greek national funds through the Operational Program "Education and Lifelong
Learning" of the National Strategic Reference Framework (NSRF) - Research Funding
Program: THALES. Investing in knowledge society through the European Social Fund. The
help of Professors Demosthenes Polyzos and Dimitri Beskos of UPatras in making available
ISoBEM software to the authors is gratefully acknowledged, as well as the help of Professor
Stephanos Tsinopoulos of the Technological Institute of Patras in using the software. The
authors also benefitted from discussions with Professor Anastasios Sextos and Dr. Dimitris
Karamitros of Bristol University.
References
[1] Acacio, A., Kobayashi, Y., Towhata, I., Bautista, R., Ishihara, K., (2001). Subsidence of
building foundation resting upon liquefied subsoil; Case studies and assessment. Soils
Found (JGS);41(6); 111-128.

43
[2] Adachi, T., Iwai, S., Yasui, M. Sato, Y. (1992). Settlement and inclination of reinforced
concrete buildings in Dagupan City due to liquefaction during 1990 Philippine
Earthquake, Proceedings, 10WCEE, Balkema Rotterdam, 2; 147-152.
[3] Ahmad, S., Bharadwaj, A. (1991). Horizontal impedance of embedded strip foundations
in layered soil. J Geotech Eng;117;1021-41.
[4] Ahmad, S., Rupani, A. (1999). Horizontal impedance of square foundation in layered
soil. Soil Dyn Earthq Eng;18(1);59-69.
[5] Anoyatis, G. and Mylonakis, G. (2012). Dynamic Winkler modulus for axially loaded
piles. Geotechnique; 62;521-536.
[6] Bouckovalas, G.D., Karamitros D.K., Madabhushi, S.P.G. et al. (2015). FLIQ:
Experimental Verification of Shallow Foundation Performance under Earthquake-
induced Liquefaction. Geotech, Geolog Earthq Eng, 35;525-542.
[7] Bouckovalas, G., Tsiapas, Y., Theocharis, A., Chaloulos, Y., (2016). Liquefied ground
response: Seismic isolation or amplification? Soil Dyn Earthq Eng; 91;329-339.
[8] Bouckovalas G., Psycharis I. et al. (2017). Performance-based design of bridge piers in
liquefiable sites with shallow foundation and limited ground improvement. PBDIII:
Performance Based design in Geotech Earthq Eng, Vancouver, July 16-19.
[9] Bouckovalas, G. D., Tsiapas, Y. Z., Zontanou, V. A., Kalogeraki, C. G. (2017).
Equivalent linear computation of response spectra for liquefiable sites: The spectral
envelope method. J Geotech Geoenv Eng (ASCE);143(4):04016115.
[10] Bray J. and Macedo J. (2017). 6th Ishihara Lecture: Simplified procedure for estimating
liquefaction-induced building settlement. Soil Dyn Earthq Eng;102;215-231.
[11] Buckingham E. (1914). On physically similar systems; illustrations of the use of
dimensional equations. Physical Review;4(4);345-376.
[12] Coehlo, P., Haigh, S.K, Madabushi, S.P.G. (2005). Development, effects and mitigation
of earthquake induced liquefaction: A comprehensive study based on dynamic
centrifuge modeling, Proceedings, 16th International Conf on SMGE, Osaka, Japan.
[13] Dashti, S., Bray, J., Riemer, M., Wilson, D. (2008). Centrifuge experimentation of
building performance on liquefied ground, Geotechnical Special Publication, 181.
[14] Dashti S., Bray J.D., Pestana J.M., Riemer M., Wilson D. (2010a). Centrifuge Testing
to Evaluate and Mitigate Liquefaction-Induced Building Settlement Mechanisms. J
Geotech Geoenv Eng; 136(7);918-929.
[15] Dimitriadi V.E., Bouckovalas G.D., Papadimitriou A.G. (2017). Seismic performance
of strip foundations on liquefiable soils with a permeable crust. Soil Dyn Earthq Eng;
100;396-409.
[16] Dimitriadi V.E., Bouckovalas G.D., Chaloulos Y.K., Aggelis A.S. (2018). Seismic
liquefaction performance of strip foundations: Effect of ground improvement
dimensions. Soil Dyn Earthq Eng;106;298-307.
[17] Durante, M. G., Karamitros, D., Di Sarno, L., et al. (2015). Characterization of shear
wave velocity profiles of non-uniform bi-layer soil deposits: Analytical evaluation and
experimental validation. Soil Dyn Earthq Eng; 75;44-54.

44
[18] Farrell, T. M. and Kutter, B. L. (1993). Experimental results of Model No 12,
Verifications of Numerical Procedures for the Analysis of Soil Liquefaction Problems,
Balkema, Rotterdam, ISBN 90 5410 360 4.
[19] Gazetas, G. (1991). Formulas and charts for impedances of surface and embedded
foundations. J Geotech Eng (ASCE);117 (9);1363-1381.
[20] Givens, M. J., Mylonakis, G., & Stewart, J. P. (2016). Modular analytical solutions for
foundation damping in soil-structure interaction applications. Earthquake Spectra,
32(3), 1749-1768. DOI: 10.1193/071115EQS112M.
[21] Hatzigeorgiou, G. and Beskos, D. (2011). Dynamic inelastic structural analysis by the
BEM: A review. Engineering Analysis with Boundary Elements. 35(2). 159-169.
10.1016/j.enganabound.2010.08.002.
[22] Heidarzadeh, B., Mylonakis, G., Stewart, J.P. (2015). Stresses beneath dynamically
applied vertical point loads. 6th International Conference on Earthquake Geotechnical
Engineering ICEGE, Christchurch, New Zealand.
[23] Hiltunen, D., Dunn, P., Toros, U. (2007). Cone model predictions of dynamic
impedance functions of shallow foundations. 4th International Conference on
Earthquake Geotechnical Engineering ICEGE, Thessaloniki, Greece.
[24] Ishihara, K., Acacio, A., Towhata, I. (1993). Liquefaction-induced Ground Damage in
Dagupan in the July 16, 1990 Luzon Earthquake, Soils and Foundations, 33(1), 133-
154.
[25] ISoBEM: Boundary Element Method Package. http://bemsands.com, 2012.
[26] Karamitros, D. K., Bouckovalas, G. D., Chaloulos, Y. K. (2013a). Insight into the
seismic liquefaction performance of shallow foundations. J Geotech Geoenv Eng
(ASCE);139(4);599-607.
[27] Karamitros, D. K., Bouckovalas, G. D., Chaloulos, Y. K. (2013b). Seismic settlements
of shallow foundations on liquefiable soil with a clay crust. Soil Dyn Earthq Eng;46;64-
76.
[28] Karamitros, D. K., Bouckovalas, G. D., Chaloulos, Y. K, Andrianopoulos, K. I.
(2013c). Numerical analysis of liquefaction-induced bearing capacity degradation of
shallow foundations on a two-layered soil profile. Soil Dyn Earthq Eng;44;90-101.
[29] Karatzia, X. (2016). Theoretical investigation of geotechnical seismic isolation of
bridge piers on footings and piles. Doctoral Dissertation, Dept of Civil Eng, UPatras,
Greece.
[30] Karatzia, X., Mylonakis, G., Bouckovalas, G., (2017a). 3D Dynamic impedances of
surface footings on liquefiable soil: equivalent linear approach. 16th World Conference
on Earthquake Engineering WCEE, Santiago, Chile.
[31] Karatzia, X., Mylonakis, G., Bouckovalas, G., (2017b). Equivalent-Linear Dynamic
Stiffness of Surface Footings on Liquefiable Soil. 6th Int Conf on Computational
Methods in Structural Dyn and Earthq Eng COMPDYN, Rhodes Island, Greece.
[32] Kawasaki, K., Sakai, T., Yasuda, S., Satoh, M. (1998). Earthquake induced settlement
of an isolated footing for power transmission tower, Centrifuge 98, 271-276.
[33] Kokusho, T. (2014). Seismic base-isolation mechanism in liquefied sand in terms of
energy. Soil Dyn Earthq Eng, Elsevier BV, 63, 92–97.

45
[34] Lesgidis, N., Kwon, O., Sextos, A. (2015). A time-domain seismic SSI analysis method
for inelastic bridge structures through the use of a frequency-dependent lumped
parameter model. Earthquake Engineering & Structural Dynamics. 10.1002/eqe.2573.
[35] Liao, S.S.C., Veneziano, D., Whitman, R.V. (1988). Regression models for evaluating
liquefaction probability. J Geotech Eng, ASCE, 114(4);389-411.
[36] Lombardi D. and Bhattacharya S. (2014). Modal analysis of pile‐supported structures
during seismic liquefaction. Earthq Eng Struct Dyn; 43 (1), 119-138, 10.1002/eqe.2336.
[37] Meek, J. W., Wolf, J. P. (1992). Cone models for soil layer on rigid rock. J Geotech
Eng (ASCE);118;686–703.
[38] Miwa, S. and Ikeda, T. (2006). Shear modulus and strain of liquefied ground and their
application to evaluation of the response of foundation structures. Structural
Engineering/Earthquake Engineering (JSCE);23(1);167-179.
[39] Mohanty P., Dutta S. C., Bhattacharya S. (2017). Proposed mechanism for mid-span
failure of pile supported river bridges during seismic liquefaction. Soil Dyn Earthq
Eng;102;41-45, 10.1016/j.soildyn.2017.08.013
[40] Mylonakis, G. (1995). SFIAB (computer code for academic use).
[41] Mylonakis, G., Nikolaou, S., Gazetas, G. (2006). Footings under seismic loading:
Analysis and design issues with emphasis on bridge foundations. Soil Dyn Earthq Eng;
26(9);824-853.
[42] Mylonakis, G., Rovithis, E., Parashakis, H. (2013). 1D harmonic response of layered
inhomogeneous soil: Exact and approximate analytical solutions. Computational
Methods in Earthq Eng; Computational methods in Applied Sciences;30;1-32.
[43] Naesgaard, E., Byrne, P.M., Ven Huizen, G. (1998). Behavior of light structures
founded on soil ‘crust’ over liquefied ground, Geotech Earthq Eng & Soil Dyn III,
Proceedings of a Specialty Conference, 1, 422-434.
[44] NIST (2012). Soil-Structure Interaction for Building Structures, GCR 12-917-21,
prepared by the NEHRP Consultants Joint Venture, a partnership of the Applied
Technology Council and the Consortium for Universities for Research in Earthquake
Engineering, for the National Institute of Standards and Technology, Gaithersburg, MD.
[45] Pais, A. and Kausel, E. (1988). Approximate formulas for dynamic stiffnesses of rigid
foundations. Soil Dyn Earthq Eng;7(4);213–227.
[46] Pease, J. W., and O’Rourke, T. D. (1997). “Seismic response of liquefaction sites.” J.
Geotech. Geoenviron. Eng, 10.1061/(ASCE)1090-0241(1997)123:1(37), 37-45.
[47] Pender, M. J. (2018). Earthquake inertia effects on shallow foundation bearing strength.
Géotechnique, 68(7); 640-645, 10.1680/jgeot.17.T.006.
[48] Pitilakis, D., Moderessi-Farahmand-Razavi, A., Clouteau, D. (2013). Equivalent-Linear
Dynamic Impedance Functions of Surface Foundations. J Geotech Geoenv Eng, 139(7);
1130-1139, 10.1061/(ASCE)GT.1943-5606.0000829.
[49] Polyzos, D., Tsinopoulos, S., Beskos, D. (1998). Static and dynamic boundary element
analysis in incompressible linear elasticity. European Journal of Mechanics A/Solids;
17(3);515-536.

46
[50] Sextos, A., Psilla, N., Psycharis, I. et al (2014). Performance criteria for bridges
designed with spread footings on liquefiable soils. 2nd European Conference on
Earthquake Engineering and Seismology, Istanbul, Turkey, Aug. 25-29.
[51] Sitar, N. and Hausler, E. (2012). Influence of ground improvement on liquefaction
induced settlements: observations from case histories and centrifuge experiments.
Invited Lecture presented to the Korean Geotechnical Society, Seoul, Korea, March 22.
[52] Spyrakos, C. C. and Xu, C. J. (2004). Dynamic analysis of flexible massive strip-
foundations embedded in layered soils by hybrid BEM-FEM. Computers & Structures;
82(29–30);2541–2550.
[53] Theocharis, A. (2011). Numerical analysis of liquefied ground response under harmonic
seismic excitation-Variable thickness of liquefied layer. Diploma thesis, NTUA,
Greece.
[54] Tsiapas, Y. and Bouckovalas, G. (2019). “Equivalent linear computation of response
spectra for liquefiable sites: The spectral interpolation method.” Soil Dyn Earthq
Eng;116;541-551.
[55] Tsinopoulos, S., Kattis, S., Polyzos, D., Beskos D. (1999). An advanced boundary
element method for axisymmetric elastodynamic analysis. Computer Methods in
Applied Mechanics and Engineering;175;53-70.
[56] Vassilopoulou, I., Kaymenaki, V., Gantes, Ch., and Bouckovalas G. (2017). Criteria for
Preliminary Design of an Arched Steel Bridge on Shallow Foundation under Soil
Liquefaction Conditions. The Open Civil Engineering Journal, 11 (Suppl.-5, M10),
1170-1190
[57] Veletsos, A. S. and Meek, J. W. (1974). Dynamic behavior of building-foundation
systems. Earthq Eng Struct Dyn; 3(2);121–138.
[58] Vrettos, C. (1999). Vertical and rocking impedances for rigid rectangular foundations
on soils with bounded non-homogeneity. Earthq Eng Struct Dyn; 28(12);1525-1540.
[59] Wong, H. L. and Luco, J. E. (1985). Tables of impedance functions for square
foundation on layered media. Soil Dyn Earthq Eng; 4(2);64–81.
[60] Wolf, J P. (1994). Foundation vibrations analysis using simple physical models.
Prentice Hall.
[61] Wolf, J P. and Deeks, A.J. (2004). Foundation Vibration Analysis: A Strength-of-
Materials Approach. Elsevier, Oxford, UK.
[62] Youd, T. L., and Carter, B. L. (2005). Influence of soil softening and liquefaction on
spectral acceleration. J Geotech Geoenv Eng, 10.1061/(ASCE)1090-0241(2005)131:7
(811), 811-825.