Embed Size (px)
Citation preview

Dynamics and Attributions of Baseflow in the SemiaridLoess PlateauJingwen Wu1, Chiyuan Miao1 , Qingyun Duan1 , Xiaohui Lei2, Xiaoyan Li1 , and Hu Li3
1State Key Laboratory of Earth Surface Processes and Resource Ecology, Faculty of Geographical Science, Beijing NormalUniversity, Beijing, China, 2State Key Laboratory of Simulation and Regulation of Water Cycle in River Basin, ChinaInstitute of Water Resources and Hydropower Research, Beijing, China, 3Key Laboratory of Agricultural Non‐pointSource Pollution Control, Ministry of Agriculture/Institute of Agricultural Resources and Regional Planning, ChineseAcademy of Agricultural Sciences, Beijing, China
Abstract Baseflow is an all‐important replenishment feature of the hydrologic cycle for maintainingsurface water in basins across the world. Understanding its dynamics and the influence of climatevariability and human activities will be beneficial for developing sustainable water‐management strategies.In this study, we selected 11 basins within the Loess Plateau (a typical semiarid region in China) forassessment of the variations in baseflow and baseflow index (BFI; the ratio of baseflow volume to totalstreamflow volume) during the period 1961–2014. We compared eight baseflow separation methods andselected the median series in order to reduce the uncertainty. Results showed that values of the “Bflow” andEckhardt filter methods were higher than values of the other six methods for the period of peak discharge.Annual baseflow exhibited a statistically significant downward trend (p < 0.01) in all 11 basins exceptQingjian and Yanhe basins, while nine basins trended upward for BFI. All basins exhibited downward trendsfor seasonal baseflow in all seasons, with Yanhe and Qingjian showing the least significant trend. Variationsin both baseflow and the BFI were more sensitive to variations in potential evapotranspiration than tovariations in precipitation. Across these 11 basins for both the conservation engineering period (1971–1999)and the reforestation period (2000–2014), human activities (73% and 76%, respectively) contributed morethan climate variability (27% and 24%, respectively) to average baseflow decline. However, climatevariability was the main factor altering the BFI, with the contribution accounting for about 54% and 76%,respectively, for the two periods.
1. Introduction
Baseflow is the perennial flow portion of streamflow. In previous studies, the terminology usage is inconsis-tent, with baseflow, low flow, and drought flow commonly used interchangeably to denote either the stream-flow resulting from sustained subsurface inputs to the stream channel or the lowest annual streamflowwithin a watershed or region (Price, 2011). In this study, baseflow is generally used to denote streamflowfed from deep groundwater and from delayed shallow subsurface storage during and following precipitationand snowmelt events. It is the interconnection between groundwater and surface water and plays an impor-tant role in the health of river ecosystems (Ficklin et al., 2016). The quantity and quality of baseflow dis-charged to streams are influenced by a combination of climate and basin characteristics. Over the pastcentury, rising global temperatures have led to a more energized hydrologic cycle, particularly in semiaridregions due to the fragile nature of their eco‐hydrology (Seager et al., 2010; Yang, Jia, et al., 2019).Semiarid regions cover about 15% of the Earth's land surface and support about 20% of the global population(Huang et al., 2016); however, the water resources of these semiarid regions account for less than 2% of theglobal total (Standish‐Lee et al., 2005). In these water‐limited areas, surface water flows are mainly suppliedby baseflow, making baseflow an extremely important low‐flow hydrologic characteristic. Therefore, under-standing and quantifying the dynamic variations and contributions of baseflow to streamflow are critical forensuring appropriate water resource management (especially for drought conditions) andenvironmental protection.
Baseflow is difficult to measure directly compared with surface runoff. Numerous baseflow separationapproaches have been developed in order to quantify the baseflow, including hydrograph separation(HYSEP; e.g., slash separation method and recession curve analysis; Linsley et al., 1975; Tallaksen, 1995),
©2019. American Geophysical Union.All Rights Reserved.
RESEARCH ARTICLE10.1029/2018JD029775
Key Points:• Eight baseflow separation methods
were reviewed and applied toevaluate baseflow variations on theLoess Plateau
• Annual baseflow showed astatistically significant downwardtrend on the Loess Plateau
• Human activity contributed morethan 73% to average baseflowdecline
Supporting Information:• Supporting Information S1
Correspondence to:C. Miao,[email protected]
Citation:Wu, J., Miao, C., Duan, Q., Lei, X., Li,X., & Li, H. (2019). Dynamics andattributions of baseflow in the semiaridLoess Plateau. Journal of GeophysicalResearch: Atmospheres, 124, 3684–3701.https://doi.org/10.1029/2018JD029775
Received 6 OCT 2018Accepted 10 MAR 2019Accepted article online 18 MAR 2019Published online 2 APR 2019
Author Contributions:Conceptualization: Jingwen Wu,Xiaoyan Li, Hu LiData curation: Jingwen Wu, XiaohuiLei, Xiaoyan Li, Hu LiFormal analysis: Jingwen Wu,Qingyun Duan, Xiaohui LeiMethodology: Jingwen Wu, XiaoyanLi, Hu LiSupervision: Qingyun DuanWriting ‐ original draft: Jingwen WuWriting – review & editing: JingwenWu, Qingyun Duan, Xiaoyan Li
WU ET AL. 3684
numerical simulation (e.g., smoothed minima, HYSEP, and digital filtering methods; Nathan & McMahon,1990), water balance (e.g., reservoir assumption and parameter separation methods; Harman & Sivapalan,2009), and chemical mass balance HYSEP (Tetzlaff & Soulsby, 2008). Numerical simulations are currentlythe most widely used methods to quantify baseflow, because the models are easy to operate, can avoid thesubjectivity and arbitrariness of a manual separation method, and are suitable for long‐term hydrologic ser-ies (Xu et al., 2016). Mwakalila et al. (2002) used the baseflow index (BFI) method to examine the influenceof physical catchment properties on baseflow in these water‐limited environments; they showed that theBFI, which is the ratio of baseflow volume to total streamflow volume, has a strong relationship with thedrainage density index. Ficklin et al. (2016) used the HYSEPmethod to separate baseflow and to characterizethe impacts of climatic change on trends in baseflow and stormflow in watersheds of the United States; con-sistent trends in baseflow and stormflow were found, with increases during the fall and winter in the north-east and decreases during all seasons in the southwest. Fan et al. (2013) applied digital filtering to separatebaseflow from streamflow and then to investigate the dynamics of baseflow in four headstreams of the TarimRiver Basin, China, from 1960 to 2007; the baseflow appeared to show obvious seasonal variation, the lowestbaseflow mainly occurring in winter and the largest baseflow in summer.
With increasing awareness of the importance of baseflow to stream dynamics, more research has focused onbaseflow response to climate variability and human activities (Ahiablame et al., 2017; Juckem et al., 2008; Li,Liu, & Zhang, 2018). Baseflow is as an important replenishment resource for maintaining surface water insemiarid areas. Understanding the individual effects that climate variability and human activities have onchanges in baseflow in these water‐limited semiarid basins will be beneficial for developing sustainablewater‐management strategies and providing a dependable water source for food production.
Xu et al. (2013) used climate elasticity and the residual method to assess the relative importance of climateand land surface changes on baseflow variations at 55 unregulated watersheds in the Midwest of the UnitedStates. Baseflow was found to have increased in 58% of watersheds, and land surface change contributed 2.7times more to baseflow than climate change (74% ± 10% vs. 27% ± 10%, respectively). Christine et al. (2015)used the conductivity mass balance in the Upper Colorado River Basin and showed that baseflow was posi-tively correlated with precipitation, land surface slope, sandy soils content, and some land cover character-istics, while Zomlot et al. (2015) used the digital filter method to show that variation in vegetation cover wasthe main driver of the large spatial variation in baseflow in the northern part of Belgium.
However, most previous studies have only qualitatively analyzed the effects of climate variability and humanactivities on baseflow variation; quantitative attributions of baseflow variation at the basin scale remain rare,especially for semiarid basins. In addition, most previous studies generally employ only one method to sepa-rate baseflow from streamflow, and this may lead to uncertainty within the final results. Because the truevalues of baseflow are unknown, the method that gives the best estimates remains undetermined(Eckhardt, 2008). Thus, multiple baseflow separation methods should be used simultaneously to reducethe uncertainty of the results.
The Loess Plateau in China is a typical semiarid region with little precipitation and high potential evapotran-spiration. It has been an important agricultural region in China for thousands of years and currently sup-ports 114 million people or 8.5% of the country's total population (Kong et al., 2016). During the lastseveral decades, the Loess Plateau has undergone persistent climate warming and intensified human activ-ities. In particular, the Grain for Green program, implemented in 1999, and large‐scale reforestation pro-grams have led to obvious transformations of regional land use and land cover. Consequently, theongoing downward trend in streamflow in this region has been significant (Wu et al., 2017).
Previous studies in the region have mainly focused on the decline in surface runoff (Gao et al., 2016; Huet al., 2017; Liang et al., 2015), whereas research studies on the analysis and causes of baseflow variationare rare. Therefore, the main objectives of this study are to (1) fully document regional patterns and variationof baseflow based on multiple baseflow separation methods in 11 catchments of the Loess Plateau and (2)quantify the relative influence of climate variability and human activities on baseflow. Our study is designedto fill the gaps in our knowledge of baseflow variation and the causes of its variation within the LoessPlateau. Our findings will contribute to the development of scientific water‐resource management strategiesand the restoration of the ecological balance of the Loess Plateau and at the same time provide a deeperunderstanding of the hydrologic processes in semiarid basins.
10.1029/2018JD029775Journal of Geophysical Research: Atmospheres
WU ET AL. 3685
2. Study Area and Data Source
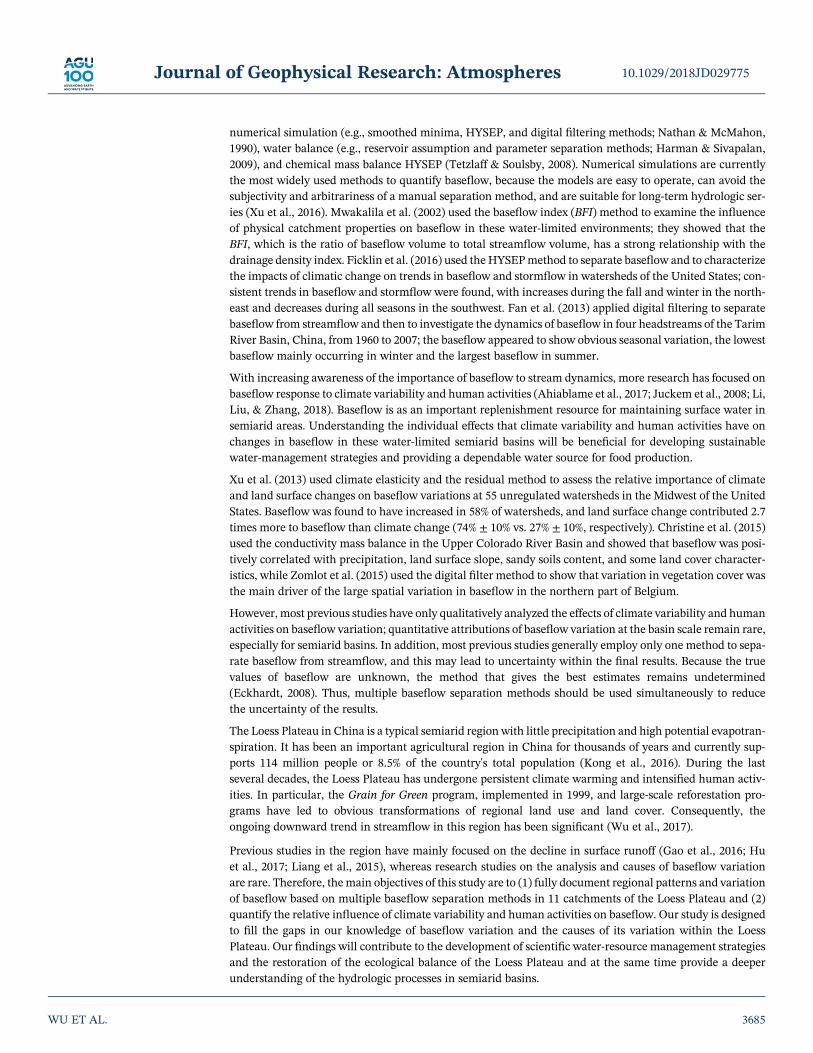
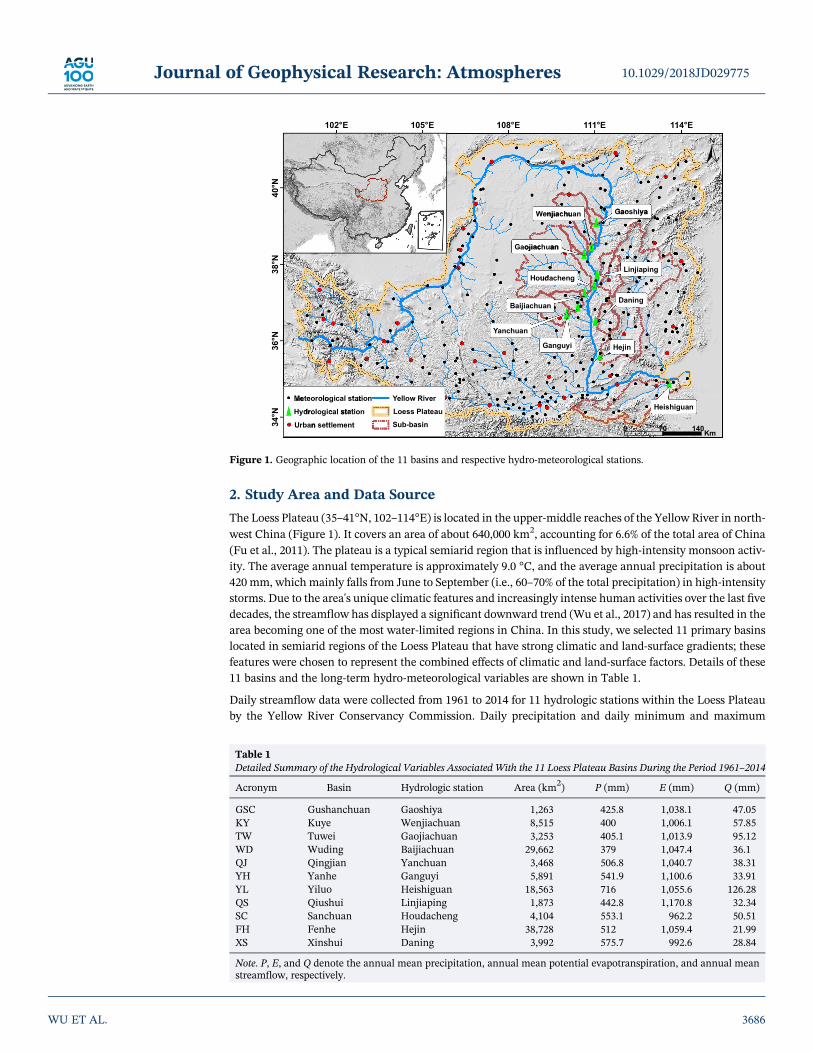
The Loess Plateau (35–41°N, 102–114°E) is located in the upper‐middle reaches of the Yellow River in north-west China (Figure 1). It covers an area of about 640,000 km2, accounting for 6.6% of the total area of China(Fu et al., 2011). The plateau is a typical semiarid region that is influenced by high‐intensity monsoon activ-ity. The average annual temperature is approximately 9.0 °C, and the average annual precipitation is about420 mm, which mainly falls from June to September (i.e., 60–70% of the total precipitation) in high‐intensitystorms. Due to the area's unique climatic features and increasingly intense human activities over the last fivedecades, the streamflow has displayed a significant downward trend (Wu et al., 2017) and has resulted in thearea becoming one of the most water‐limited regions in China. In this study, we selected 11 primary basinslocated in semiarid regions of the Loess Plateau that have strong climatic and land‐surface gradients; thesefeatures were chosen to represent the combined effects of climatic and land‐surface factors. Details of these11 basins and the long‐term hydro‐meteorological variables are shown in Table 1.
Daily streamflow data were collected from 1961 to 2014 for 11 hydrologic stations within the Loess Plateauby the Yellow River Conservancy Commission. Daily precipitation and daily minimum and maximum
Figure 1. Geographic location of the 11 basins and respective hydro‐meteorological stations.
Table 1Detailed Summary of the Hydrological Variables Associated With the 11 Loess Plateau Basins During the Period 1961–2014
Acronym Basin Hydrologic station Area (km2) P (mm) E (mm) Q (mm)
GSC Gushanchuan Gaoshiya 1,263 425.8 1,038.1 47.05KY Kuye Wenjiachuan 8,515 400 1,006.1 57.85TW Tuwei Gaojiachuan 3,253 405.1 1,013.9 95.12WD Wuding Baijiachuan 29,662 379 1,047.4 36.1QJ Qingjian Yanchuan 3,468 506.8 1,040.7 38.31YH Yanhe Ganguyi 5,891 541.9 1,100.6 33.91YL Yiluo Heishiguan 18,563 716 1,055.6 126.28QS Qiushui Linjiaping 1,873 442.8 1,170.8 32.34SC Sanchuan Houdacheng 4,104 553.1 962.2 50.51FH Fenhe Hejin 38,728 512 1,059.4 21.99XS Xinshui Daning 3,992 575.7 992.6 28.84
Note. P, E, and Q denote the annual mean precipitation, annual mean potential evapotranspiration, and annual meanstreamflow, respectively.
10.1029/2018JD029775Journal of Geophysical Research: Atmospheres
WU ET AL. 3686

temperatures in the same time period were obtained from the China Meteorological Data Sharing ServiceSystem (http://data.cma.cn). Potential evapotranspiration was calculated by the Hargreaves and Samanimethod (Hargreaves & Samani, 1985). Nearest neighbor interpolation and ArcMap software were used togenerate spatially averaged meteorological data across the entire study area.
3. Methodology3.1. Baseflow Separation
A number of numerical simulation baseflow‐separation methods have been developed to estimate the base-flow of streamflow. Although each of the methods is based on formalized algorithms for separating the base-flow component of streamflow, the methods are subjective and not based on mathematical solutions togroundwater‐flow or overland‐flow equations. As a consequence, it is beneficial to use more than one base-flow separation method to analyze a streamflow record and then to compare the results of the differentmethods. The U.S. Geological Survey (USGS) Groundwater Toolbox, which incorporates eight widely usedbaseflow separation methods (Barlow et al., 2017), has been used to separate baseflow from total streamflow(Ficklin et al., 2016; Partington et al., 2012). These methods include the Base‐Flow Index (BFI; standard andmodified; Nathan &McMahon, 1990; Wahl &Wahl, 1995), HYSEP (fixed interval, sliding interval, and localminimum; Sloto & Crouse, 1996), PART method (Rutledge, 1998), the Soil and Water Assessment Tool(SWAT) Bflow method (Arnold & Allen, 1999), and Eckhardt filter approaches (Eckhardt, 2005). The algo-rithm details of each baseflow separation method are as follows:3.1.1. BFI methodThe BFI program (Wahl & Wahl, 1995) is based on a series of procedures developed by the Institute ofHydrology and mimics two separation methods (i.e., the BFI‐standard method and BFI‐modified method).It first partitions daily streamflow into intervals of length in N days. The minimum daily streamflow duringeach N‐day interval is then identified and compared to adjacent minima to determine turning points. If theminimum is multiplied by 0.9 (a turning point test factor that has no physical meaning) and is less than bothadjacent minima, then that minimum is a turning point. The baseflow hydrograph is then identified by con-necting these turning points. In the BFI‐modified method, parameter f is replaced by a daily recession indexK, and the turning point test considers the actual number of days between turning point candidates.3.1.2. HYSEP methodHYSEP is an automated baseflow separation computer program that mimics three separation methods (i.e.,fixed interval, sliding interval, and local minimum). The three methods use different algorithms to deter-mine the baseflow hydrograph between low points of the streamflow hydrograph. Surface runoff durationis estimated from the empirical relation:
N ¼ A0:2; (1)
where N is the duration after which surface runoff ceases and A is the drainage area. The odd integerbetween 3 and 11 nearest to 2N is selected as the interval to estimate the baseflow. In the fixed‐intervalmethod, the daily streamflow hydrograph is partitioned into nonintersecting intervals. The minimum dis-charge in each interval is assigned to describe the baseflow over the entire interval. The sliding‐intervalmethod finds the lowest discharge in one‐half the interval minus 1 day. The local‐minimummethod detectseach day to determine if it is the lowest discharge in one‐half the interval minus 1 day. If it is, then it is a localminimum and is connected by straight lines to adjacent local minima.3.1.3. PART methodPART is a streamflow partitioning program developed by the USGS to estimate daily baseflow (Rutledge,1998). It implements a characteristic response time in days, similar to the HYSEP method, which is a func-tion of the drainage area of the basin (equation (1)). If daily streamflow values decrease for N or more days,then the requirement of antecedent recession is met and it is assumed that baseflow is equal to streamflowfor these days. In addition, it performs a linear interpolation between each day in the record that meets thisrequirement. However, the baseflow obtained by linear interpolation may be greater than the total stream-flow, and thus, an error check is needed to ensure that baseflow never exceeds streamflow. The criterion forstreamflow to meet the antecedent recession requirement is that streamflow never decreases by more than0.1 log cycle on days.
10.1029/2018JD029775Journal of Geophysical Research: Atmospheres
WU ET AL. 3687

3.1.4. The SWAT Bflow methodThe Bflow program (Arnold & Allen, 1999) uses a method first proposed by Lyne and Hollick (1979). Thistechnique has no true physical basis; it is objective and reproducible. The equation of the filter isexpressed as
qt ¼ βqt−1 þ1þ β2
* Qt−Qt−1ð Þ: (2)
where qt is the filtered surface runoff at the t time step,Qt is the total streamflow, and β is the filter parameter(0.925). The default value of 0.925 was determined by Nathan andMcMahon (1990). Thus, baseflow bt is esti-mated as
bt ¼ Qt−qt: (3)
The filter is passed over the streamflow data three times (forward, backward, and forward), and in this study,we used the result based on the first pass (forward).3.1.5. Eckhardt filter methodThe Eckhardt filter is a two‐parameter filter based on the assumption that aquifer outflow is linearly propor-tional to storage. The method limits the maximum ratio of baseflow to streamflow and considers runoff to bea nonnegligible low‐frequency component. The runoff component was initially proposed by Spongberg(2000) and later supported by Eckhardt (2005), who described this as potentially beneficial. The equationfor this filter is expressed by Eckhardt (2005) as
bt ¼ 1−BFImaxð Þabt−1 þ 1−að ÞBFImaxQt
1−aBFImax; (4)
where BFImax is the maximum value of the BFI and a is the baseflow recession constant. Previous studieshave generally used values ranging from 0.925 to 0.95 for a (Zhou et al., 2017); in this study, we used a valueof 0.925. Eckhardt (2005) suggests using a value of BFImax = 0.80 for perennial streams with porous aquifers,0.50 for ephemeral streams with porous aquifers, and 0.25 for perennial streams with hard rock aquifers.
In this study, we first calculated the baseflow using eight methods based on these five types and then usedthe median of the values calculated by these eight methods to indicate the baseflow. The BFI was calculatedas follows:
BFI ¼ BaseflowStreamflow
; (5)
3.2. Attribution Analysis of Baseflow
The concept of elasticity (Schaake, 1990) has been used to evaluate the sensitivity of runoff to changes in cli-mate. In this study, we used the elasticity approach to quantify the relative contributions of climate variabil-ity and human activities to changes in baseflow. The climate elasticity of baseflow (ε) is defined as the ratio ofthe baseflow variation (or BFI) rate to the variation rate of a certain climate factor (X, precipitation or poten-tial evapotranspiration in this study) and is expressed as
ε ¼ ∂Qb=Qb
∂X=X; (6)
where ε indicates the climate elasticity of baseflow, Qb indicates baseflow (or BFI), and X indicates precipita-tion or potential evapotranspiration.
We used the least squares estimator to estimate climate elasticity of the annual baseflow (Zheng et al., 2009);this is expressed as
ε ¼ X
Qb∑ Xi−X� � Qbi−Qb
� �:
∑ Xi−X� �2 ¼
ρXQCQ
CX;
(7)
where Qb is annual baseflow (or BFI), X is the annual climate variables (precipitation and potential
10.1029/2018JD029775Journal of Geophysical Research: Atmospheres
WU ET AL. 3688

evapotranspiration in this study), X and Q are the multiyear annual mean climate variables and baseflowvalues (or BFI), respectively, ρXQ is the correlation coefficient between climate variables and baseflow (orBFI), and CX and CQ are coefficients of variation in climate variables and baseflow (or BFI), respectively.To evaluate the relative contributions of climate variability and human activities on baseflow variation (orBFI), the following steps were performed:
1. Calculation of climate elasticity ε. Based on the baseflow (or BFI) data for the entire period of record andequation (7), climate elasticity (ε) with respect to precipitation (εP) and potential evapotranspiration (εE0)was calculated for baseflow (or BFI).
2. Determination of a baseline period. Based on our previous work (Wu et al., 2017), the human‐designatedmethod was used to determine the baseline period, for which the anthropogenic influence was assumedto be weaker during a preselected earlier period of time. Thus, in this study, the period 1961–1970 wasselected as the baseline period (Miao et al., 2011; Zhang et al., 2016). Next, based on the developmentof soil and water conservation measures across the Loess Plateau, the period 1971–1999 was designatedthe conservation engineering period during which many soil and water conservation engineering projectswere implemented (Gao et al., 2016; Zhang et al., 2011). The Grain for Green program was implementedafter 1999, and the period 2000–2014 was designated the reforestation period (Fu et al., 2017).
3. Based on equation (6), the climate‐induced baseflow (or BFI) variation in the conservation engineeringperiod (or reforestation period) relative to the baseline period was calculated as follows:
ΔQclimateb ¼ εPΔP=P þ εE0ΔE0=E0ð ÞQb; (8)
whereΔQclimateb is the change in the annual mean baseflow (or BFI) caused by climate variability;ΔP and ΔE0
are changes in precipitation and potential evapotranspiration, respectively; and P, E0, and Qb are long‐termmean values of precipitation, potential evapotranspiration, and baseflow (or BFI) during the baseline period,respectively. Therefore, the change in the annual mean baseflow (or BFI) caused by human activitiesΔQhuman
b
� �can be calculated as
ΔQhumanb ¼ ΔQb−ΔQ
climateb (9)
where ΔQb indicates the change in baseflow (or BFI). Thus, the percentage contribution of climate‐induced(Pc) and human‐activity‐induced (Ph) baseflow (or BFI) changes can be calculated as follows:
Pc ¼ ΔQclimateb
ΔQclimateb
������þ ΔQhuman
b
������×100% and Ph ¼ ΔQhuman
b
ΔQclimateb
������þ ΔQhuman
b
������×100%; (10)
3.3. Estimation of the Dynamic n at the Catchment Scale
Determination of dynamic (temporally changing) n in Budyko‐based Choudhury equation (EP ¼ E0=P
1þ E0=Pð Þnð Þ1=n;
Choudhury, 1999) which is popularly used in studies of the Loess Plateau (Liang et al., 2015; Liu et al., 2017),is very important and greatly affects the applicability of Budyko hypothesis (Budyko, 1974). Parameter n inChoudhury equation represents the interactions between climate and land surface properties. Variations inclimate (e.g., seasonality and storm) and basin characteristics (e.g., slope, land use change, and engineeringconstruction), which play important roles in water energy balance (Berghuijs et al., 2017; Liang et al., 2015),could cause temporal changes in n. Therefore, using dynamic (temporally changing) n, could reflect chan-ging interactions between climate and basin characteristics. In the original Budyko framework, whichwas deduced for long time scales, and water storage changes can be negligible based on the water balanceequation (Yang et al., 2008; Zhou et al., 2015). However, for shorter periods, water storage change becomesimportant in the water balance. Thus, Choudhury equation can be rewritten as
EP−ΔS
¼ E0= P−ΔSð Þ1þ E0
P−ΔS
� �n� �1=n (11)
whereΔS denotes the water storage change. At present, long‐termΔS data are not regularly available. In this
10.1029/2018JD029775Journal of Geophysical Research: Atmospheres
WU ET AL. 3689

case, we use a relatively prolonged moving windows approach (5 years) to calculate the dynamic n at thebasin scale, and thus, ΔS could be negligible compared to other hydrologic variables (i.e., precipitation,potential evapotranspiration, and runoff). The parameter n at year 1963 was calculated using mean annualprecipitation, potential evapotranspiration, and runoff during the period 1961–1965; the parameter n at year1964 was calculated using the mean annual precipitation, potential evapotranspiration, and runoff duringthe period 1962–1966. Therefore, with a 54‐year coverage of the input data (1961–2014), a total of 50 n values(1963–2012) could be obtained.
3.4. Statistical Analyses
The Mann‐Kendall nonparametric trend test (Kendall, 1975) was used to detect trends and trend signifi-cance of hydro‐climatologic variables at annual and seasonal scales from 1961 to 2014 (spring, March toMay; summer, June to August; autumn, September to November; and winter, December to February).The autocorrelation in the time series was first removed based on the methods proposed by Yue et al.(2002). The detailed process can be found in Wu, Miao, Tang, et al. (2018) and Wu, Miao, Zheng, et al.(2018). Positive values of the Mann‐Kendall statistic Z indicate an upward trend over time, whereas negativevalues indicate a downward trend. We considered trends with p < 0.05 as significant at the 95% confidencelevel and trends with p < 0.01 as significant at the 99% confidence level.
4. Results and Discussion4.1. Baseflow Separation
Comparisons of eight baseflow separation methods and the median series at monthly and annual scales for11 basins on the Loess Plateau from 1961 to 2014 are shown in Figure 2. At both the monthly scale andannual scale, the results of eight baseflow separation methods were generally consistent, especially in theTuwei, Yiluo, Sanchuan, and Fenhe basins where the streamflow was high compared to other basins onthe Loess Plateau and for all basins during the low‐flow period. However, peak maxima and duration forBflow and Eckhardt filter methods were higher than the other methods in the basin without ample stream-flow (Gushanchuan, Kuye, Wuding, Qingjian, Yanhe, and Qiushui). We suggest that in the semiarid basinswith a lower runoff coefficient, many short‐duration high‐intensity precipitation events lead to a runoff yieldthat is mostly excess infiltration that does not extend to the groundwater (i.e., lower groundwater runoffcoefficient), and the flood hydrograph is fine lines with short duration (Xu et al., 2011). For all baseflowseparation methods used in this study except Bflow and Eckhardt filter methods, determined the baseflowbased on the minimum streamflow within fixed time slots. Overall, compared the different separation prin-ciple, special climatic conditions, and geological conditions, the baseflow based on these two methods (i.e.,Bflow and Eckhardt filter methods) could be greater compared to the other methods in the high‐flow season.In order to reduce the uncertainty in the period of peak value in these eight baseflow separation methods,the median series of these eight methods was selected as the dependable baseflow value.
4.2. Temporal‐Spatial Variations in Baseflow and BFI4.2.1. Variations in Baseflow at Various Time ScalesSeasonal and annual temporal‐spatial baseflow variations during the period 1961–2014 are presented inFigure 3 and Table 2. Mann‐Kendall trend analysis of annual baseflow showed a statistically significantdownward trend (p < 0.01) in all 11 basins except Qingjian (Z= 0.54) and Yanhe (Z=−0.34), with the great-est downward trend in Tuwei (Z = −7.9). The annual mean baseflow storage varied among the 11 basins,with the highest average baseflow storage in Yiluo (5.95) and the lowest in Qiushui (0.85). In addition, theannual mean baseflow storage was, in general, greatest during the period 1961–1970 and lowest between2001 and 2014 (Figure 4). Several factors have most likely contributed to the low levels seen since 2001.Over the last five decades, potential evapotranspiration has increasingly trended upward on the LoessPlateau (Wu et al., 2017). In addition, although precipitation has not significantly declined, extreme precipi-tation events have significantly increased (Sun et al., 2015). Because the Loess Plateau typically experiencesrunoff being generated over the infiltration area (Liu et al., 2012), with the increase in extreme precipitationevents, less water has infiltrated into deep soil (Yang, Wang, et al., 2019), leading to lower baseflow storage.Furthermore, with intensifying human activities, water demand and depletion have increased and ground-water levels have decreased. This combination of events led to the smallest annual mean baseflow storagefrom 2001 to 2014. For the seasonal baseflow, most basins exhibited significant (p < 0.05 or p < 0.01)
10.1029/2018JD029775Journal of Geophysical Research: Atmospheres
WU ET AL. 3690

downward trends in all seasons (Figure 3). In contrast, Yanhe and Qingjian basins showed insignificantchanges during spring and autumn and an increasing trend in summer (Figure 3b) and winter(Figure 3d). In general, baseflow storage was greater in autumn and spring for almost all basins (Table 2).
We also investigated the long‐term monthly baseflow storage from 1961 to 2014 (Figure 5) and identified abimodal trend in the baseflow for all basins except Yiluo and Fenhe, with one peak value in March and onepeak value in October (or September). The second peak baseflow value undoubtedly results from the preci-pitation primarily occurring between June and September (Figure 5) that eventually (by October) becomespart of the baseflow. Baseflow is derived from the drainage of near‐surface valley soils and riparian zones,and water concentrates in these areas during and following precipitation events (Brutsaert, 2005).Furthermore, precipitation can seep into the soil to replenish shallow unsaturated storage and then
Figure 2. Comparison of eight baseflow separationmethods and themedian series at seasonal (upper) and annual (lower)scales in 11 basins on the Loess Plateau during the period 1961–2014.
10.1029/2018JD029775Journal of Geophysical Research: Atmospheres
WU ET AL. 3691

sustain the river channel transmitted from it (Ward & Robinson, 1990). We suggest that the March peak ismainly due to snowmelt because most precipitation during the winter falls as snow, which becomessnowmelt as temperatures rise in late winter/early spring (Wang et al., 2013). In addition, during this partof the year, the demand for irrigation is low and evapotranspiration is relatively weak, which both lead torelatively low water consumption. However, for the Yiluo and Fenhe basins, which did not have a peak inMarch, we suggest that temperature and land use are the major reasons for the lack of a March peak. Asshown in Figure S2 in the supporting information, the average monthly temperature in winter wasaround 0 °C in the Yiluo basin, the highest value across all basins on the Loess Plateau. Furthermore,
Figure 3. Spatial patterns of the Mann‐Kendall trend test for seasonal baseflow in 11 basins of the Loess Plateau duringthe period 1961–2014.
Table 2Mann‐Kendall Test and Multiyear Average Baseflow at Seasonal and Annual Scales for 11 Basins of the Loess Plateau During 1961–2014
Basin
Baseflow Z value Mean baseflow (mm)
MAM JJA SON DJF Annual MAM JJA SON DJF Annual
GSC −7.39** −3.32** −4.77** −3.01** −6.23** 1.5 0.82 1.36 0.3 1KY −6.91** −4.43** −5.36** −4.01** −6.38** 2.4 1.11 2.56 1.28 1.84TW −7.27* −7.16* −7.03* −4.36* −7.9** 6.3 4.47 6.7 5.67 5.78WD −7.63** −6.33** −6.55** −4.68** −7.72** 1.87 0.97 2.15 1.8 1.7QJ −0.87 1.4 −0.13 1.5 0.54 1.37 1.07 1.66 0.95 1.27YH −0.22 −0.73 −1.32 4.56** −0.34 1.35 0.89 1.55 0.89 1.17YL −2.1* −1.39 −3.26** −3.1** −2.82** 4.27 5.87 9 4.65 5.95QS −3.93** −1.57 −2.4* −3.27** −3.68** 0.75 0.81 1.26 0.56 0.85SC −5.28** −4** −4.83** −5.37** −5.45** 2.55 2.91 3.71 2.32 2.87FH −3.99** −3.13** −4.3** −5.67** −5.02** 0.52 0.93 1.66 0.92 1.01XS −1.86 −3.14** −2.99** −2.95** −3.65** 0.87 1.01 1.69 1 1.09
Note. March‐April‐May (MAM), June‐July‐August (JJA), September‐October‐November (SON), and December‐January‐February (DJF) are spring, summer,autumn, and winter, respectively. Basin acronyms are listed in Table 1. BFI, baseflow index.**Significance at the 99% level. *Significance at the 95% level.
10.1029/2018JD029775Journal of Geophysical Research: Atmospheres
WU ET AL. 3692

Wu, Miao, Tang, et al. (2018) and Wu, Miao, Zheng, et al. (2018) showed that the area of farmland is muchhigher in the Yiluo and Fenhe basins than in other basins, with the main crops being winter wheat andspring corn (Li, Wei, et al., 2018). Thus, more water is needed for crop irrigation at this time of year inthese basins, leading to lower baseflow during this period.4.2.2. Variations in BFI at Various Time ScalesThe temporal‐spatial analysis of seasonal and annual BFI variation from the 1961 to 2014 is presented inFigure 6 and Table 3. Upward trends were identified in nine basins, with Qingjian (Z = 3.95) showing the
Figure 4. Annual mean baseflow and baseflow index (BFI) from 1961 to 2014 in 11 basins of the Loess Plateau. Acronymson the x axis are listed in Table 1.
Figure 5. Multiannual monthly average precipitation and baseflow in 11 basins of the Loess Plateau during the period1961–2014. Acronyms are listed in Table 1.
10.1029/2018JD029775Journal of Geophysical Research: Atmospheres
WU ET AL. 3693

greatest upward trend (p < 0.01). In addition, the BFI was greater than 0.6 in the Tuwei, Wuding, andSanchuan basins, with the highest BFI in Tuwei (0.73), indicating that streamflow in these basins is mainlysupplied by baseflow. We attribute this large baseflow to the relatively large grassland and wind‐sand areasthat are characterized by a flat terrain and better vegetation cover, both of which are conducive to ground-water recharge (Qian et al., 2004). Thus, in these basins, groundwater resources are abundant, the watertable is shallow, and the amount of water supplied to the river is large. However, basins with a lower BFI(e.g., Gushanchuan, Qiushui, and Sanchuan) generally are loess hilly areas, with incised gullies and satisfac-tory drainage conditions; these basins have a limited contribution to groundwater storage but are beneficialin forming surface runoff (Li et al., 2017).
We also investigated the annual mean BFI from 1961 to 1970, 1971 to 1999, and 2000 to 2014 (Figure 4). Incontrast to baseflow, the annual mean BFI during the period 2000–2014 was greatest in all basins exceptTuwei, Wuding, and Fenhe. We attribute this to the implementation of the Grain for Green program, whichincreased vegetation coverage, and resulted in a series of ecological effects, such as reduced surface runoffand enhanced precipitation infiltration. Increasing vegetation land cover is suggested to have decreasedthe water yield (1–48 mm/year) in about 38% of the Loess Plateau (Feng et al., 2012). Feng et al. (2010) foundthe permeation performance of most tree species exceeded that of natural grassland, and some species (i.e.,sea‐buckthorn and caragana) far exceeded the average level. In addition, vegetation can also change the soilstructure and fortify soil permeability. Moreover and more important, during the period 2000–2014, thewater consumption and evaporation are the greatest; the excessive water consumption and intense evapora-tion further reduce more surface runoff. In short, although streamflow significantly decreased, more waterseeped into the soil and more surface runoff were consumed and evaporated, resulting in a relativelylarger BFI.
Figure 6. Spatial patterns of Mann‐Kendall trends for seasonal baseflow index (BFI) in 11 basins of the Loess Plateau during the period 1961–2014.
10.1029/2018JD029775Journal of Geophysical Research: Atmospheres
WU ET AL. 3694
Trends in all basins for the seasonal BFIwere more mixed and showed obvious spatial differences (Figure 6).In general, the BFI trended upward in all seasons for most basins except the Fenhe basin, which showed adownward trend during all seasons. In addition, the change to BFI was most significant in winter for all11 basins. The relatively larger mean BFI in winter and spring indicates that baseflow is an importantresource for maintaining streamflow in the dry season on the Loess Plateau (Table 3).
At the various time scales, therefore, the baseflow in all basins except Yanhe and Qingjian declined duringthe last five decades, whereas the BFI exhibited upward trends in most basins (Table 2 and Table 3).Although baseflow and observed streamflow decreased, basin characteristics were more conducive to waterseepage into the ground, and compared to the decline in baseflow, the decline in surface runoff wasmore severe.
4.3. Climate Elasticity Coefficient and Dynamic n at the Basin Scale
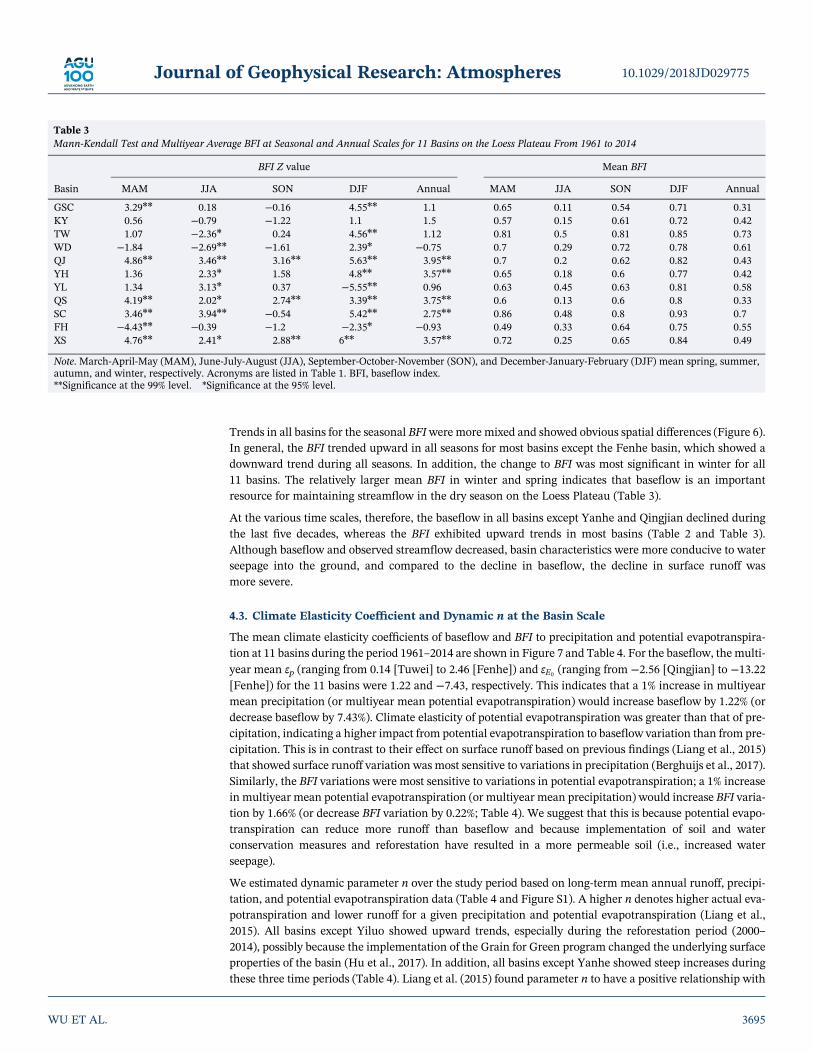
The mean climate elasticity coefficients of baseflow and BFI to precipitation and potential evapotranspira-tion at 11 basins during the period 1961–2014 are shown in Figure 7 and Table 4. For the baseflow, the multi-year mean εp (ranging from 0.14 [Tuwei] to 2.46 [Fenhe]) and εE0 (ranging from −2.56 [Qingjian] to −13.22[Fenhe]) for the 11 basins were 1.22 and −7.43, respectively. This indicates that a 1% increase in multiyearmean precipitation (or multiyear mean potential evapotranspiration) would increase baseflow by 1.22% (ordecrease baseflow by 7.43%). Climate elasticity of potential evapotranspiration was greater than that of pre-cipitation, indicating a higher impact from potential evapotranspiration to baseflow variation than from pre-cipitation. This is in contrast to their effect on surface runoff based on previous findings (Liang et al., 2015)that showed surface runoff variation was most sensitive to variations in precipitation (Berghuijs et al., 2017).Similarly, the BFI variations were most sensitive to variations in potential evapotranspiration; a 1% increasein multiyear mean potential evapotranspiration (or multiyear mean precipitation) would increase BFI varia-tion by 1.66% (or decrease BFI variation by 0.22%; Table 4). We suggest that this is because potential evapo-transpiration can reduce more runoff than baseflow and because implementation of soil and waterconservation measures and reforestation have resulted in a more permeable soil (i.e., increased waterseepage).
We estimated dynamic parameter n over the study period based on long‐term mean annual runoff, precipi-tation, and potential evapotranspiration data (Table 4 and Figure S1). A higher n denotes higher actual eva-potranspiration and lower runoff for a given precipitation and potential evapotranspiration (Liang et al.,2015). All basins except Yiluo showed upward trends, especially during the reforestation period (2000–2014), possibly because the implementation of the Grain for Green program changed the underlying surfaceproperties of the basin (Hu et al., 2017). In addition, all basins except Yanhe showed steep increases duringthese three time periods (Table 4). Liang et al. (2015) found parameter n to have a positive relationship with
Table 3Mann‐Kendall Test and Multiyear Average BFI at Seasonal and Annual Scales for 11 Basins on the Loess Plateau From 1961 to 2014
Basin
BFI Z value Mean BFI
MAM JJA SON DJF Annual MAM JJA SON DJF Annual
GSC 3.29** 0.18 −0.16 4.55** 1.1 0.65 0.11 0.54 0.71 0.31KY 0.56 −0.79 −1.22 1.1 1.5 0.57 0.15 0.61 0.72 0.42TW 1.07 −2.36* 0.24 4.56** 1.12 0.81 0.5 0.81 0.85 0.73WD −1.84 −2.69** −1.61 2.39* −0.75 0.7 0.29 0.72 0.78 0.61QJ 4.86** 3.46** 3.16** 5.63** 3.95** 0.7 0.2 0.62 0.82 0.43YH 1.36 2.33* 1.58 4.8** 3.57** 0.65 0.18 0.6 0.77 0.42YL 1.34 3.13* 0.37 −5.55** 0.96 0.63 0.45 0.63 0.81 0.58QS 4.19** 2.02* 2.74** 3.39** 3.75** 0.6 0.13 0.6 0.8 0.33SC 3.46** 3.94** −0.54 5.42** 2.75** 0.86 0.48 0.8 0.93 0.7FH −4.43** −0.39 −1.2 −2.35* −0.93 0.49 0.33 0.64 0.75 0.55XS 4.76** 2.41* 2.88** 6** 3.57** 0.72 0.25 0.65 0.84 0.49
Note. March‐April‐May (MAM), June‐July‐August (JJA), September‐October‐November (SON), and December‐January‐February (DJF) mean spring, summer,autumn, and winter, respectively. Acronyms are listed in Table 1. BFI, baseflow index.**Significance at the 99% level. *Significance at the 95% level.
10.1029/2018JD029775Journal of Geophysical Research: Atmospheres
WU ET AL. 3695
the percentage of affected area in the basin; this affected area has continued to increase during the last fivedecades, especially for slope measures. Moreover, the basin characteristics in Qiushui and Yiluo (orGushanchuan and Kuye) changed the most, while the basin characteristics in Qingjian and Yanhe (orYanhe and Yiluo) were not in evident for conservation engineering period (or for reforestation period;Table 4). We also investigated the relationship between parameter n and baseflow (Figure 8) and found asignificant (p < 0.01) negative correlation between baseflow and parameter n in all basins except Yanhe,for which the correlation was positive (p < 0.05). Moreover, the negative correlations were stronger thanthat of the one basin with a positive relationship. Therefore, in general, an increase in parameter n couldresult in reduced baseflow for most area of the Loess Plateau.
4.4. Attribution of Baseflow and BFI Variations
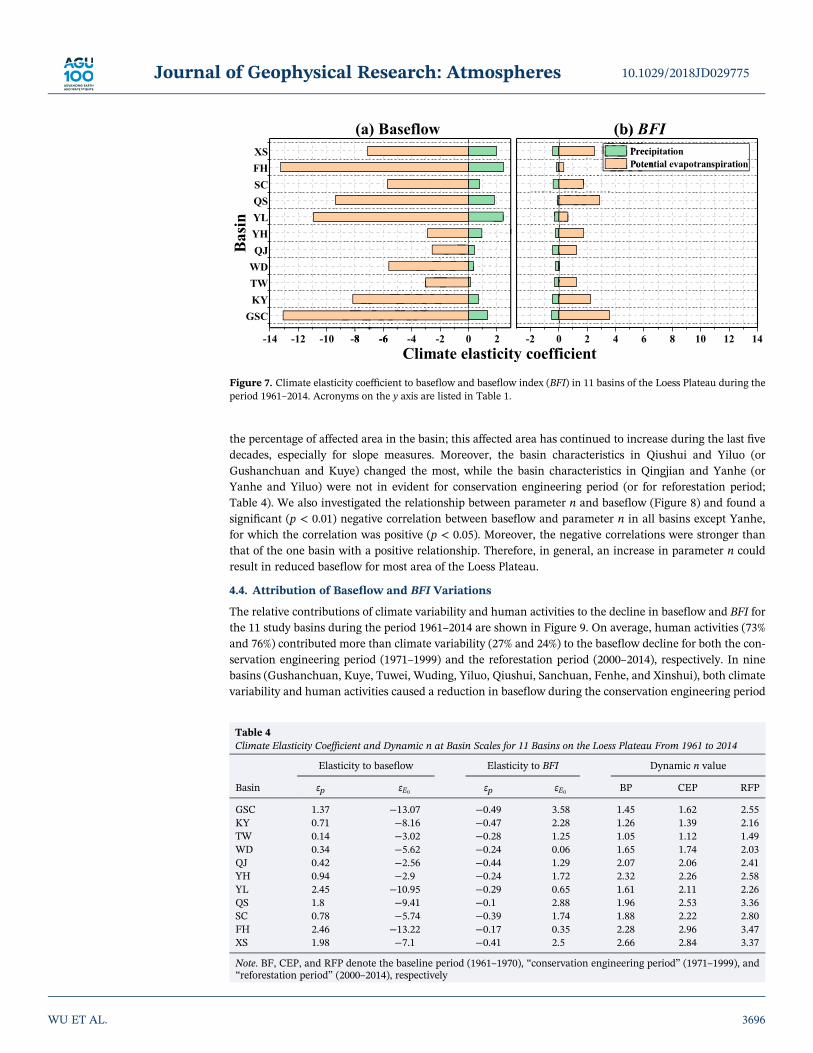
The relative contributions of climate variability and human activities to the decline in baseflow and BFI forthe 11 study basins during the period 1961–2014 are shown in Figure 9. On average, human activities (73%and 76%) contributed more than climate variability (27% and 24%) to the baseflow decline for both the con-servation engineering period (1971–1999) and the reforestation period (2000–2014), respectively. In ninebasins (Gushanchuan, Kuye, Tuwei, Wuding, Yiluo, Qiushui, Sanchuan, Fenhe, and Xinshui), both climatevariability and human activities caused a reduction in baseflow during the conservation engineering period
Figure 7. Climate elasticity coefficient to baseflow and baseflow index (BFI) in 11 basins of the Loess Plateau during theperiod 1961–2014. Acronyms on the y axis are listed in Table 1.
Table 4Climate Elasticity Coefficient and Dynamic n at Basin Scales for 11 Basins on the Loess Plateau From 1961 to 2014
Basin
Elasticity to baseflow Elasticity to BFI Dynamic n value
εp εE0 εp εE0 BP CEP RFP
GSC 1.37 −13.07 −0.49 3.58 1.45 1.62 2.55KY 0.71 −8.16 −0.47 2.28 1.26 1.39 2.16TW 0.14 −3.02 −0.28 1.25 1.05 1.12 1.49WD 0.34 −5.62 −0.24 0.06 1.65 1.74 2.03QJ 0.42 −2.56 −0.44 1.29 2.07 2.06 2.41YH 0.94 −2.9 −0.24 1.72 2.32 2.26 2.58YL 2.45 −10.95 −0.29 0.65 1.61 2.11 2.26QS 1.8 −9.41 −0.1 2.88 1.96 2.53 3.36SC 0.78 −5.74 −0.39 1.74 1.88 2.22 2.80FH 2.46 −13.22 −0.17 0.35 2.28 2.96 3.47XS 1.98 −7.1 −0.41 2.5 2.66 2.84 3.37
Note. BF, CEP, and RFP denote the baseline period (1961–1970), “conservation engineering period” (1971–1999), and“reforestation period” (2000–2014), respectively
10.1029/2018JD029775Journal of Geophysical Research: Atmospheres
WU ET AL. 3696

and reforestation period, and human activities were identified as the major factor leading to the negativetrends in the baseflow. In two basins (Qingjian and Yanhe), climate variability and human activities hadopposing effects on baseflow variation, with climate variability reducing the baseflow and human activitiesincreasing it. Furthermore, human activities had a greater impact on basins located in the northern andsouthern parts of the Loess Plateau, while climate variability played a major role in baseflow decline inthe basins of the central plateau (Qingjian, Yanhe and Qiushui). Similar findings have been reported forthe runoff (Liang et al., 2015).
The effect of climate variability (average 54%) on BFI variation was greater than the effect of human activities(−46%) during the conservation engineering period (Figure 9b), whereas they had the opposite effect. Ineight basins (Gushanchuan, Kuye, Tuwei, Wuding, Yiluo, Qiushui, Fenhe, and Xinshui), climate variabilityincreased the BFI, while human activities decreased it. In three basins (Qingjian, Yanhe, and Sanchuan),both climate variability and human activities increased the BFI value. During the reforestation period, theeffect of climate variability (76%) on BFI variation was much greater than the effect of human activities(24%). On average, however, both climate variability and human activities could increase the BFI. For boththe conservation engineering period and the reforestation period, climate variability increased the BFI in allbasins, while human activities led to the opposite effects except for basins in the central area of the LoessPlateau (Qingjian and Yanhe). In general, for both baseflow and BFI, climate variability could lead to con-sistent variation in the 11 basins, whereas the effects of human activities in these basins varied.
Figure 8. Relationship between baseflow and parameter n in 11 basins of the Loess Plateau. Acronyms are listed inTable 1.
10.1029/2018JD029775Journal of Geophysical Research: Atmospheres
WU ET AL. 3697
4.5. Underlying Explanation of Baseflow Variation
During the last five decades, the Loess Plateau (a representative semiarid region in China) has experiencedan ongoing decline in runoff and a continuously decreasing trend in baseflow. Because the baseflow of theLoess Plateau accounts for a large proportion of total streamflow, ongoing decreases in baseflow can lead to aseries of negative ecological effects, for example, exacerbating decreasing water levels in the Yellow River,which then leads to degraded river habitats, reduced lake area, and degeneration of epigenetic vegetation(Wang et al., 2008). Our findings showed human activities to be the major cause of reduced baseflow.These activities are principally the following: (1) excessive exploitation of groundwater, leading to a reducedlateral discharge of groundwater, that reduces the baseflow (Wang et al., 2006); (2) overgrazing, whichreduces the baseflow by changing the underlying surface characteristics, which in turn induce a decreasein soil water retention capacity and water storage capacity and a change in the soil vegetation that signifi-cantly reduces the conservation function of the ground water resources (Hou et al., 2001), and the miningexploitation that can destroy the aquifer and result in loss of groundwater resources; and (3) excessive affor-estation through large‐scale soil and water conservation measures, such as the Grain for Green program,which has altered the hydrologic cycle with increased vegetation cover leading to increasing rates of actualevapotranspiration that intensifies soil desiccation (Zhang et al., 2018) and eventually reduces the baseflow.In general, however, groundwater exploitation has been the most active and principal driving factor todecrease the baseflow (Wang et al., 2008). In addition, climate variability is an indispensable factor drivingreduced baseflow. The ongoing decreases in precipitation reduce the baseflow via decreased infiltration.Moreover, precipitation patterns have changed, with an increase in the frequency of high‐intensity andextreme rainfall events. These lead to infiltration excess mode (Sun et al., 2015) and a consequent reductionin overall infiltration. Furthermore, increasing evapotranspiration rates resulting from higher temperaturescan also reduce the baseflow. All of these climatic factors acting in concert have contributed to the dimin-ished baseflow on the Loess Plateau.
Our study helps fill the gaps in our knowledge of baseflow variation and the causes of its variation in theLoess Plateau. Our findings will help policy makers implement reasonable water resources managementpolicies and also provide valuable information for baseflow research in other semiarid regions all overthe world.
Figure 9. Relative contributions of climate variability and human activities to baseflow and baseflow index (BFI) variationin 11 basins of the Loess Plateau. Acronyms on the x axis are listed in Table 1.
10.1029/2018JD029775Journal of Geophysical Research: Atmospheres
WU ET AL. 3698
5. Conclusion
Baseflow is a critical freshwater dry‐season resource that plays an important role in the formation, mainte-nance, and recycle of runoff. It is important for maintaining river health, especially in water‐limited semi-arid environments. In this study, the Loess Plateau was selected as a representative semiarid region toassess the impacts of climate variability and human activities on baseflow variation.
Our major findings are as follows:
1. The eight studied baseflow separation methods were found to provide consistent results during the low‐flow period at both monthly and annual time scales. Some differences were apparent in the peak value ofbaseflow, with the results of the Bflow and Eckhardt filter methods providing higher values than those ofthe other methods.
2. The baseflow storage of all basins except Yanhe and Qingjian at the various time scales have declinedover the last five decades, whereas the BFI has exhibited upward trends in most basins. In addition,the baseflow has contributed greatly to total streamflow on the Loess Plateau.
3. Both baseflow and BFI variations were more sensitive to variations in potential evapotranspiration thanprecipitation. A 1% increase in precipitation would result in 1.22% increase in baseflow and 0.22%decrease in BFI, whereas a 1% increase in potential evapotranspiration would result in a 7.43% decreasein baseflow and 1.66% increase in BFI. The parameter n showed an upward trend over the study period;an increasing n suggests that baseflow storage could decrease for most of the Loess Plateau.
4. Human activities have played the dominant role in baseflow variation, whereas climate variability hasbeen the main factor to alter the BFI. Human activities contributed more to baseflow decline on averagefor both the conservation engineering period (73%), which extended from 1971 to 1999, and the refores-tation period (76%), which was from 2000 to 2014. The contributions of climate variability and humanactivities to BFI variations during the conservation engineering period were 54% and −46%, respectively,and were 76% and 24%, respectively during the reforestation period.
ReferencesAhiablame, L., Sheshukov, A. Y., Rahmani, V., & Moriasi, D. (2017). Annual baseflow variations as influenced by climate variability and
agricultural land use change in the Missouri River Basin. Journal of Hydrology, 551, 188–202. https://doi.org/10.1016/j.jhydrol.2017.05.055
Arnold, J. G., & Allen, P. M. (1999). Automated methods for estimating baseflow and ground water recharge from streamflow records.Journal of the American Water Resources Association, 35(2), 411–424. https://doi.org/10.1111/j.1752‐1688.1999.tb03599.x
Barlow, P. M., Cunningham, W. L., Zhai, T., & Gray, M (2017). Geological Survey Groundwater Toolbox version 1.3.1, a graphical andmapping interface for analysis of hydrologic data, U.S. Geological Survey Software Release, 26 May 2017. https://doi.org/10.5066/F5067R5078C5069G
Berghuijs, W. R., Larsen, J. R., van Emmerik, T. H. M., & Woods, R. A. (2017). A global assessment of runoff sensitivity to changes inprecipitation, potential evaporation, and other factors. Water Resources Research, 53, 8475–8486. https://doi.org/10.1002/2017wr021593
Brutsaert, W. (2005). Hydrology: An introduction (p. 605). Cambridge, UK: Cambridge University Press. https://doi.org/10.1017/CBO9780511808470
Budyko, M. I. (1974). Climate and Life. New York, CA: Academic Press.Choudhury, B. J. (1999). Evaluation of an empirical equation for annual evaporation using field observations and results from a biophysical
model. Journal of Hydrology, 216(1–2), 99–110. https://doi.org/10.1016/S0022‐1694(98)00293‐5Christine, A. R., Matthew, P. M., Susong, D. D., Tillman, F. D., & David, W. A. (2015). Regional scale estimates of baseflow and factors
influencing baseflow in the Upper Colorado River Basin. Journal of Hydrology: Regional Studies, 4, 91–107.Eckhardt, K. (2005). How to construct recursive digital filters for baseflow separation. Hydrological Processes, 19(2), 507–515. https://doi.
org/10.1002/hyp.5675Eckhardt, K. (2008). A comparison of baseflow indices, which were calculated with seven different baseflow separationmethods. Journal of
Hydrology, 352(1–2), 168–173. https://doi.org/10.1016/j.jhydrol.2008.01.005Fan, Y. T., Chen, Y. N., Liu, Y. B., & Li, W. H. (2013). Variation of baseflows in the headstreams of the Tarim River Basin during 1960–2007.
Journal of Hydrology, 487, 98–108. https://doi.org/10.1016/j.jhydrol.2013.02.037Feng, X. M., Sun, G., Fu, B. J., Su, C. H., Liu, Y., & Lamparski, H. (2012). Regional effects of vegetation restoration on water yield across the
Loess Plateau, China. Hydrology and Earth System Sciences, 16(8), 2617–2628. https://doi.org/10.5194/hess‐16‐2617‐2012Feng, X. M., Wang, Y. F., Chen, L. D., Fu, B. J., & Bai, G. S. (2010). Modeling soil erosion and its response to land‐use change in hilly
catchments of the Chinese Loess Plateau. Geomorphology, 118(3–4), 239–248. https://doi.org/10.1016/j.geomorph.2010.01.004Ficklin, D. L., Robeson, S. M., & Knouft, J. H. (2016). Impacts of recent climate change on trends in baseflow and stormflow in United States
watersheds. Geophysical Research Letters, 43, 5079–5088. https://doi.org/10.1002/2016gl069121Fu, B. J., Liu, Y., Lu, Y. H., He, C. S., Zeng, Y., & Wu, B. F. (2011). Assessing the soil erosion control service of ecosystems change in the
Loess Plateau of China. Ecological Complexity, 8(4), 284–293. https://doi.org/10.1016/j.ecocom.2011.07.003Fu, B. J., Wang, S., Liu, Y., Liu, J. B., Liang, W., & Miao, C. Y. (2017). Hydrogeomorphic ecosystem responses to natural and anthropogenic
changes in the Loess Plateau of China. Annual Review of Earth and Planetary Sciences, 45(1), 223–243. https://doi.org/10.1146/annurev‐earth‐063016‐020552
10.1029/2018JD029775Journal of Geophysical Research: Atmospheres
WU ET AL. 3699
AcknowledgmentsThis research was supported by theNational Natural Science Foundation ofChina (41622101 and 41877155), theNational Key Research andDevelopment Program of China(2016YFC0501604), Beijing HigherEducation Young Elite Teacher Project,and State Key Laboratory of EarthSurface Processes and ResourceEcology. We are grateful to the YellowRiver Conservancy Commission(YRCC) for providing the monthlyrunoff (http://www.yellowriver.gov.cn/other/hhgb/) and China MeteorologicalAdministration (CMA) for providingthe climate data sets (http://data.cma.cn/).

Gao, G. Y., Fu, B. J., Wang, S., Liang, W., & Jiang, X. H. (2016). Determining the hydrological responses to climate variability and landuse/cover change in the Loess Plateau with the Budyko framework. Science of the Total Environment, 557‐558, 331–342. https://doi.org/10.1016/j.scitotenv.2016.03.019
Hargreaves, G. H., & Samani, A. (1985). Reference crop evapotranspiration from temperature. Applied Engineering in Agriculture, 1(2),96–99. https://doi.org/10.13031/2013.26773
Harman, C., & Sivapalan, M. (2009). A similarity framework to assess controls on shallow subsurface flow dynamics in hillslopes. WaterResources Research, 45, W01417. https://doi.org/10.1029/2008WR007067
Hou, C. M., Zhang, Z. Q., & Liu, X. W. (2001). Eco‐environmental problem in Yellow River sources region and corresponding solutions insustainable development. China Population, Resources and Environment, 11, 51–53.
Hu, J., Lu, Y. H., Fu, B. J., Comber, A. J., & Harris, P. (2017). Quantifying the effect of ecological restoration on runoff and sediment yields:A meta‐analysis for the Loess Plateau of China. Progress in Physical Geography, 41(6), 753–774. https://doi.org/10.1177/0309133317738710
Huang, J. P., Ji, M. X., Xie, Y. K., Wang, S. S., He, Y. L., & Ran, J. J. (2016). Global semi‐arid climate change over last 60 years. ClimateDynamics, 46(3‐4), 1131–1150. https://doi.org/10.1007/s00382‐015‐2636‐8
Juckem, P. F., Hunt, R. J., Anderson, M. P., & Robertson, D. M. (2008). Effects of climate and land management change on streamflow inthe driftless area of Wisconsin. Journal of Hydrology, 355(1–4), 123–130. https://doi.org/10.1016/j.jhydrol.2008.03.010.
Kendall, M. G. (1975). Rank Correlation Methods. London: Griffin.Kong, D. X., Miao, C. Y., Wu, J. W., & Duan, Q. Y. (2016). Impact assessment of climate change and human activities on net runoff in the
Yellow River Basin from 1951 to 2012. Ecological Engineering, 91, 566–573. https://doi.org/10.1016/j.ecoleng.2016.02.023Li, H. J., Liu, H. J., & Zhang, Z. J. (2018). Analysis in water demand and irrigation of main crop in Fenhe irrigation area. Shanxi Water
Resources, 34(10), 7–9.Li, Q., Wei, X. H., Zhang, M. F., Liu, W. F., Giles‐Hansen, K., & Wang, Y. (2018). The cumulative effects of forest disturbance and climate
variability on streamflow components in a large forest‐dominated watershed. Journal of Hydrology, 557, 448–459. https://doi.org/10.1016/j.jhydrol.2017.12.056
Li, Z., Lin, X. Q., Xiang, W., Chen, X., &Huang, T. M. (2017). Stable isotope tracing of headwater sources in a river on China's Loess Plateau.Hydrological Sciences Journal, 62(13), 2150–2159. https://doi.org/10.1080/02626667.2017.1368519
Liang, W., Bai, D., Wang, F. Y., Fu, B. J., Yan, J. P., Wang, S., et al. (2015). Quantifying the impacts of climate change and ecologicalrestoration on streamflow changes based on a Budyko hydrological model in China's Loess Plateau. Water Resources Research, 51,6500–6519. https://doi.org/10.1002/2014wr016589
Linsley, R. K., Kohler, M. A., & Paulhus, J. L. H. (1975). Hydrology for engineers. New York: McGraw‐Hill.Liu, M. X., Xu, X. L., Xu, C. H., Sun, A. Y., Wang, K. L., Scanlon, B. R., & Zhang, L. (2017). A new drought index that considers the joint
effects of climate and land surface change. Water Resources Research, 53, 3262–3278. https://doi.org/10.1002/2016wr020178Liu, Z. P., Shao, M. A., & Wang, Y. Q. (2012). Large‐scale spatial variability and distribution of soil organic carbon across the entire Loess
Plateau, China. Soil Research, 50(2), 114–124. https://doi.org/10.1071/Sr11183Lyne, V., & Hollick, M. (1979). Stochastic time‐variable rainfall‐runoff modeling (pp. 89–93.). Conference: Aust. Natl. Conf. Publ. At: Perth,
Australia.Miao, C. Y., Ni, J. R., Borthwick, A. G. L., & Yang, L. (2011). A preliminary estimate of human and natural contributions to the changes in
water discharge and sediment load in the Yellow River. Global and Planetary Change, 76(3–4), 196–205. https://doi.org/10.1016/j.gloplacha.2011.01.008
Mwakalila, S., Feyen, J., & Wyseure, G. (2002). The influence of physical catchment properties on baseflow in semi‐arid environments.Journal of Arid Environments, 52(2), 245–258. https://doi.org/10.1006/jare.2001.0947
Nathan, R. J., & McMahon, T. A. (1990). Evaluation of automated techniques for base‐flow and recession analyses. Water ResourcesResearch, 26(7), 1465–1473. https://doi.org/10.1029/WR026i007p01465
Partington, D., Brunner, P., Simmons, C. T., Werner, A. D., Therrien, R., Maier, H. R., & Dandy, G. C. (2012). Evaluation of outputs fromautomated baseflow separation methods against simulated baseflow from a physically based, surface water‐groundwater flow model.Journal of Hydrology, 458‐459, 28–39. https://doi.org/10.1016/j.jhydrol.2012.06.029
Price, K. (2011). Effects of watershed topography, soils, land use, and climate on baseflow hydrology in humid regions: A review. Progress inPhysical Geography, 35(4), 465–492. https://doi.org/10.1177/0309133311402714
Qian, Y. P., Jiang, X. H., Jin, S. Y., & Zhang, P. D. (2004). Analysis on the characteristic and variation of base flow in loessial plateau of themiddle reaches of Huanghe River. Journal of Earth Sciences and Environment, 26(2), 88–91.
Rutledge, A. T. (1998). Computer programs for describing the recession of ground‐water discharge and for estimating mean ground‐waterrecharge and discharge from streamflow records—Update, U.S. Geological Survey Water‐Resources Investigations Report 98–4148, 43,http://pubs.usgs.gov/wri/wri984148/.
Schaake, J. C. (1990). From climate to flow. In P. E. Waggoner (Ed.), Climate change and U.S. water resources (Vol. 8, pp. 177–206). NewYork: John Wiley.
Seager, R., Naik, N., & Vecchi, G. A. (2010). Thermodynamic and dynamic mechanisms for large‐scale changes in the hydrological cycle inresponse to global warming. Journal of Climate, 23(17), 4651–4668. https://doi.org/10.1175/2010jcli3655.1
Sloto, R. A., and Crouse, M. Y (1996). HYSEP—A computer program for streamflow hydrograph separation and analysis, U.S. GeologicalSurvey Water‐Resources InvestigationsReport 96–4040 (46 pp.). Retrieved from http://pubs.er.usgs.gov/publication/wri964040
Spongberg, M. E. (2000). Spectral analysis of base flow separation with digital filters.Water Resources Research, 36(3), 745–752. https://doi.org/10.1029/1999WR900303
Standish‐Lee, P., Loboschefsky, E., & Beuhler, M. (2005). The future of water: Identifying and developing effective methods for managingwater in arid and semi‐arid regions. Sacramento, CA: Black & Veatch.
Sun, Q. H., Miao, C. Y., Duan, Q. Y., &Wang, Y. F. (2015). Temperature and precipitation changes over the Loess Plateau between 1961 and2011, based on high‐density gauge observations. Global and Planetary Change, 132, 1–10. https://doi.org/10.1016/j.gloplacha.2015.05.011
Tallaksen, L. M. (1995). A review of baseflow recession analysis. Journal of Hydrology, 165(1–4), 349–370. https://doi.org/10.1016/0022‐1694(95)92779‐D
Tetzlaff, D., & Soulsby, C. (2008). Sources of baseflow in larger catchments—Using tracers to develop a holistic understanding of runoffgeneration. Journal of Hydrology, 359(3–4), 287–302. https://doi.org/10.1016/j.jhydrol.2008.07.008
Wahl, K. L., & Wahl, T. L. (1995). Determining the flow of Comal Springs at New Braunfels, Texas. In Proceedings of Texas Water 95(pp. 77–86). San Antonio, TX: American Society of Civil Engineers.
10.1029/2018JD029775Journal of Geophysical Research: Atmospheres
WU ET AL. 3700

Wang, G. Q., Zhang, J. Y., Xuan, Y. Q., Liu, J. F., Jin, J. L. Z., Bao, X., et al. (2013). Simulating the impact of climate change on runoff in atypical river catchment of the Loess Plateau, China. Journal of Hydrometeorology, 14(5), 1553–1561. https://doi.org/10.1175/Jhm‐D‐12‐081.1
Wang, W. K., Wang, Y. L., & Duan, L. (2006). Groundwater environment evaluation and renew ability measure in the Guanzhong basin.Zhengzhou, China: Huanghe Water Resource Publishing Press.
Wang, Y. L., Wang,W. K., Qian, Y. P., Duan, L., & Yang, Z. Y. (2008). Change characteristics and driving forces of base flow of Yellow River.Journal of Natural Resources, 23(3), 479–486.
Ward, R. C., & Robinson, M. (1990). Principles of hydrology (p. 365). Maidenhead: McGraw Hill.Wu, J. W., Miao, C. Y., Tang, X., Duan, Q. Y., & He, X. J. (2018). A nonparametric standardized runoff index for characterizing hydrological
drought on the Loess Plateau, China. Global and Planetary Change, 161, 53–65. https://doi.org/10.1016/j.gloplacha.2017.12.006Wu, J. W., Miao, C. Y., Wang, Y. M., Duan, Q. Y., & Zhang, X. M. (2017). Contribution analysis of the long‐term changes in seasonal runoff
on the Loess Plateau, China, using eight Budyko‐based methods. Journal of Hydrology, 545, 263–275. https://doi.org/10.1016/j.jhydrol.2016.12.050
Wu, J. W., Miao, C. Y., Zheng, H. Y., Duan, Q. Y., Lei, X. H., & Li, H. (2018). Meteorological and hydrological drought on the Loess Plateau,China: Evolutionary characteristics, impact, and propagation. Journal of Geophysical Research: Atmospheres, 123, 11,569–11,584. https://doi.org/10.1029/2018JD029145
Xu, L. L., Liu, J. L., Jin, C. J., Wang, A. Z., Guan, D. X., Wu, J. B., & Yuan, F. H. (2011). Baseflow separationmethods in hydrological processresearch: A review. Chinese Journal of Applied Ecology, 22(11), 3073–3080.
Xu, R., Wang, X., & Zheng, W. (2016). Research progresses in baseflow separation methods. Bulletin of Soil and Water Conservation, 36(5),352–359.
Xu, X. L., Scanlon, B. R., Schilling, K., & Sun, A. (2013). Relative importance of climate and land surface changes on hydrologic changes inthe US Midwest since the 1930s: Implications for biofuel production. Journal of Hydrology, 497, 110–120. https://doi.org/10.1016/j.jhydrol.2013.05.041
Yang, H. B., Yang, D. W., Lei, Z. D., & Sun, F. B. (2008). New analytical derivation of the mean annual water‐energy balance equation.Water Resources Research, 44, W03410. https://doi.org/10.1029/2007WR006135
Yang, Y., Jia, X., Wendroth, O., Liu, B., Shi, Y., Huang, T., & Bai, X. (2019). Noise‐assisted multivariate empirical mode decomposition ofsaturated hydraulic conductivity along a south‐north transect across the Loess Plateau of China. Soil Science Society of America Journal.https://doi.org/10.2136/sssaj2018.11.0438
Yang, Y., Wang, L., Wendroth, O., Liu, B., Cheng, C., Huang, T., & Shi, Y. (2019). Is the laser diffraction method reliable for soil particle sizedistribution analysis? An evaluation by sieve‐pipette method and scanning electron microscopy. Soil Science Society of America Journal.https://doi.org/10.2136/sssaj2018.07.0252
Yue, S., Pilon, P., & Cavadias, G. (2002). Power of the Mann‐Kendall and Spearman's rho tests for detecting monotonic trends in hydro-logical series. Journal of Hydrology, 259(1–4), 254–271. https://doi.org/10.1016/S0022‐1694(01)00594‐7
Zhang, Q., Liu, J. Y., Singh, V. P., Gu, X. H., & Chen, X. H. (2016). Evaluation of impacts of climate change and human activities onstreamflow in the Poyang Lake basin, China. Hydrological Processes, 30(14), 2562–2576. https://doi.org/10.1002/hyp.10814
Zhang, Q., Sun, P., Chen, X. H., & Jiang, T. (2011). Hydrological extremes in the Poyang Lake basin, China: Changing properties, causesand impacts. Hydrological Processes, 25(20), 3121–3130. https://doi.org/10.1002/hyp.8031
Zhang, S. L., Yang, D. W., Yang, Y. T., Piao, S. L., Yang, H. B., Lei, H. M., & Fu, B. J. (2018). Excessive afforestation and soil drying onChina's Loess Plateau. Journal of Geophysical Research: Biogeosciences, 123(3), 923–935. https://doi.org/10.1002/2017JG004038
Zheng, H. X., Zhang, L., Zhu, R. R., Liu, C. M., Sato, Y., & Fukushima, Y. (2009). Responses of streamflow to climate and land surfacechange in the headwaters of the Yellow River Basin. Water Resources Research, 45, W00A19. https://doi.org/10.1029/2007WR006665
Zhou, S., Yu, B. F., Huang, Y. F., & Wang, G. Q. (2015). The complementary relationship and generation of the Budyko functions.Geophysical Research Letters, 42, 1781–1790. https://doi.org/10.1002/2015gl063511
Zhou, X., Shen, C., Ni, G. H., & Hu, H. C. (2017). Digital filter baseflow separation method based on a master recession curve. Journal ofTsinghua University (Science and Technology), 57(3), 318–323.
Zomlot, Z., Verbeiren, B., Huysmans, M., & Batelaan, O. (2015). Spatial distribution of groundwater recharge and base flow: Assessment ofcontrolling factors. Journal of Hydrology: Regional Studies, 4, 349–368.
10.1029/2018JD029775Journal of Geophysical Research: Atmospheres
WU ET AL. 3701