Embed Size (px)
Citation preview

DynamicsDynamics
April 19, 2023
Speed is defined as the distance travelled per unit time and has the units of m/s or ms-1.
DynamicsDynamics
April 19, 2023
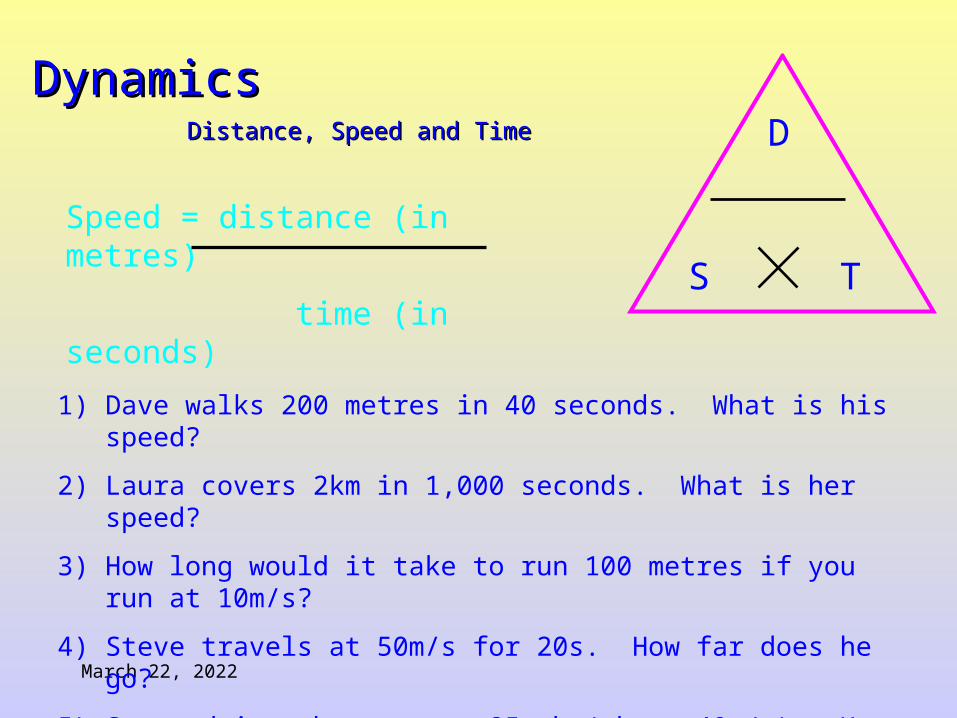
Distance, Speed and TimeDistance, Speed and Time
Speed = distance (in metres)
time (in seconds)
D
TS
1) Dave walks 200 metres in 40 seconds. What is his speed?
2) Laura covers 2km in 1,000 seconds. What is her speed?
3) How long would it take to run 100 metres if you run at 10m/s?
4) Steve travels at 50m/s for 20s. How far does he go?
5) Susan drives her car at 85mph (about 40m/s). How long does it take her to drive 20km?

DynamicsDynamics
April 19, 2023
Speed is defined as the distance travelled per unit time and has the units of m/s or ms-1.
Velocity is speed in a given direction and has the same units as speed.

DynamicsDynamics
April 19, 2023
Speed vs. VelocitySpeed vs. Velocity
Speed is simply how fast you are travelling…
Velocity is “speed in a given direction”…
This car is travelling at a speed of 20m/s
This car is travelling at a velocity of 20m/s east

DynamicsDynamics
April 19, 2023
Speed is defined as the distance travelled per unit time and has the units of m/s or ms-1.
Velocity is speed in a given direction and has the same units as speed.
To calculate speed we use the equation:
Average speed = distance travelled/time taken = d/t
Distance is measured in metres (m) and time is measured inseconds (s).
The greater the distance travelled in a given time then the greater is the speed.

DynamicsDynamics
April 19, 2023
A useful way to illustrate how the distance throughout a journey varies with time is to plot a DISTANCE AGAINST TIME graph.
This gives us a visual representation of how the journey progressedand allows us to see quickly how long each stage of the journey tookcompared with the other stages.
The steepness (gradient) will also give us the speed.
The following graphs show how the shape of distance-time graphsmay vary and how to interpret them.

DynamicsDynamics
April 19, 2023
Distance
Time00
A
B C
AB- constant speed
BC - stationary
Gradient = rise/run = speed
Rise
Run
Distance - Time GraphsDistance - Time Graphs

DynamicsDynamics
April 19, 2023
DISTANCE is a SCALAR quantity and has size only but DISPLACEMENT is a VECTOR quantity and has size (or magnitude) and DIRECTION.
10 metres is a distance (size only) but 10 metres due south (size and direction) is a vector quantity.
If we use DISPLACEMENT instead of distance then the graph will also give an indication of the direction taken with respect to its starting point.

DynamicsDynamics
April 19, 2023
Displacement
Time00
AB - constant velocity(speed & direction)
BC - stopped
CD - Returningto its starting positionat a constantvelocity
A
B C
D
Distance - Time GraphsDistance - Time Graphs
DynamicsDynamics
April 19, 2023
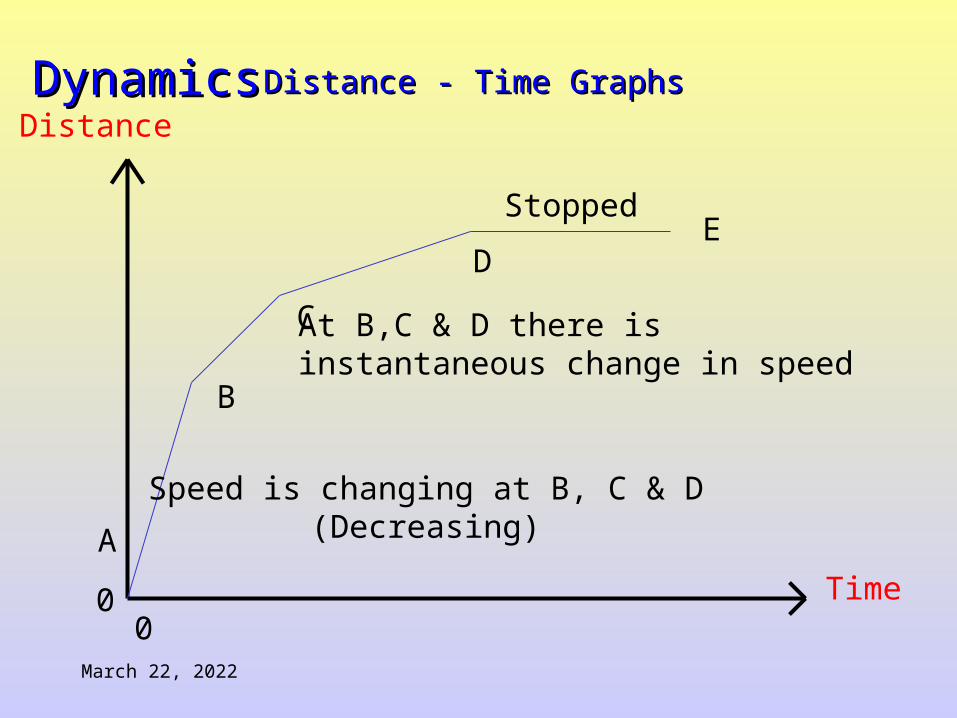
Distance
Time00
A
B
C
DE
Speed is changing at B, C & D(Decreasing)
Stopped
At B,C & D there isinstantaneous change in speed
Distance - Time GraphsDistance - Time Graphs

DynamicsDynamics
April 19, 2023
Distance
Time00
Speed is Constantly Changing(In this case speed is decreasing)
Rise
Run
A
Speed AT A = Rise/Run = Gradient of tangent AT A
Distance - Time GraphsDistance - Time Graphs
Tangent drawn at A

DynamicsDynamics
April 19, 2023
Distance
Time00
Speed is constantlychanging
(Increasing)
Rise
Run
A
Speed AT A = Rise/Run = Gradient of tangent AT A
Distance - Time GraphsDistance - Time Graphs

DynamicsDynamics
April 19, 2023
Distance-time graphsDistance-time graphs
40
30
20
10
0 20 40 60 80 100
4) Diagonal line
downwards =
3) Steeper diagonal line =1) Diagonal line =
2) Horizontal line =
Distance
(metres)
Time/s

DynamicsDynamics
April 19, 2023
40
30
20
10
020 40 60 80 100
1) What is the speed during the first 20 seconds?
2) How far is the object from the start after 60 seconds?
3) What is the speed during the last 40 seconds?
4) When was the object travelling the fastest?
Distance
(metres)
Time/s

DynamicsDynamics
April 19, 2023
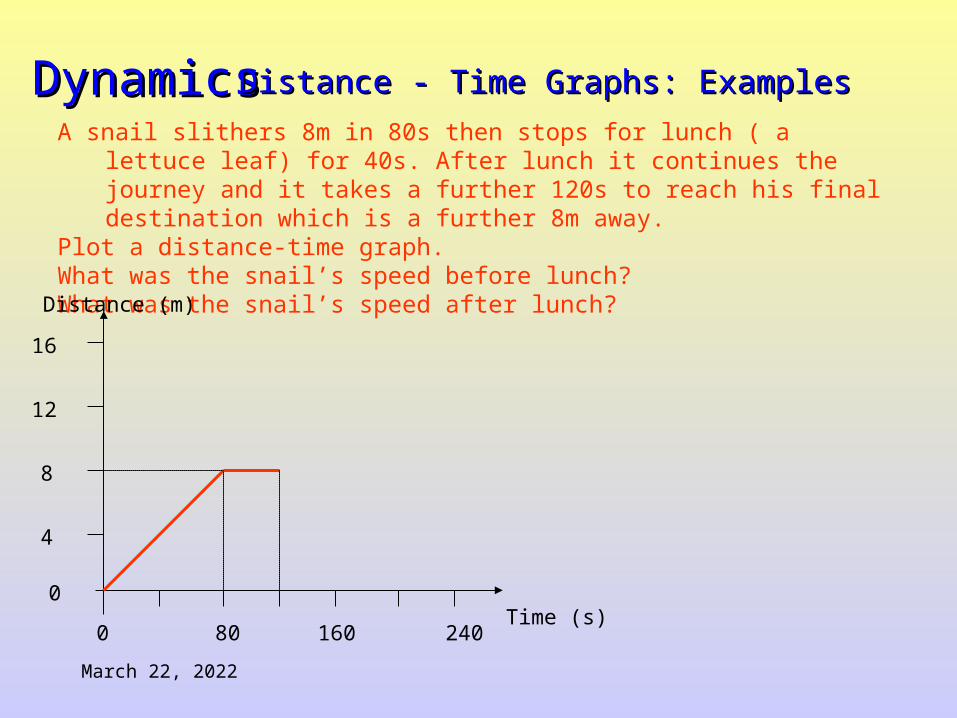
Distance - Time Graphs: ExamplesDistance - Time Graphs: Examples
A snail slithers 8m in 80s then stops for lunch ( a lettuce leaf) for 40s. After lunch it continues the journey and it takes a further 120s to reach his final destination which is a further 8m away.
(a) Plot a distance-time graph.(b) What was the snail’s speed before lunch?(c) What was the snail’s speed after lunch?

DynamicsDynamics
April 19, 2023
Distance - Time Graphs: ExamplesDistance - Time Graphs: Examples
A snail slithers 8m in 80s then stops for lunch ( a lettuce leaf) for 40s. After lunch it continues the journey and it takes a further 120s to reach his final destination which is a further 8m away.
Plot a distance-time graph.What was the snail’s speed before lunch?What was the snail’s speed after lunch?Distance (m)
Time (s)

DynamicsDynamics
April 19, 2023
Distance - Time Graphs: ExamplesDistance - Time Graphs: Examples
A snail slithers 8m in 80s then stops for lunch ( a lettuce leaf) for 40s. After lunch it continues the journey and it takes a further 120s to reach his final destination which is a further 8m away.
Plot a distance-time graph.What was the snail’s speed before lunch?What was the snail’s speed after lunch?Distance (m)
Time (s)0
4
8
12
16
800 160 240

DynamicsDynamics
April 19, 2023
Distance - Time Graphs: ExamplesDistance - Time Graphs: Examples
A snail slithers 8m in 80s then stops for lunch ( a lettuce leaf) for 40s. After lunch it continues the journey and it takes a further 120s to reach his final destination which is a further 8m away.
Plot a distance-time graph.What was the snail’s speed before lunch?What was the snail’s speed after lunch?Distance (m)
Time (s)0
4
8
12
16
0 80 160 240
DynamicsDynamics
April 19, 2023
Distance - Time Graphs: ExamplesDistance - Time Graphs: Examples
A snail slithers 8m in 80s then stops for lunch ( a lettuce leaf) for 40s. After lunch it continues the journey and it takes a further 120s to reach his final destination which is a further 8m away.
Plot a distance-time graph.What was the snail’s speed before lunch?What was the snail’s speed after lunch?Distance (m)
Time (s)0
0
4
8
12
16
80 160 240

DynamicsDynamics
April 19, 2023
Distance - Time Graphs: ExamplesDistance - Time Graphs: Examples
A snail slithers 8m in 80s then stops for lunch ( a lettuce leaf) for 40s. After lunch it continues the journey and it takes a further 120s to reach his final destination which is a further 8m away.
Plot a distance-time graph.What was the snail’s speed before lunch?What was the snail’s speed after lunch?Distance (m)
Time (s)0
0
(a) See graph(b) Speed before lunch = initial gradient
= rise/run= 8/80= 0.1m/s
(c) Speed after lunch = final gradient= rise/run = 8/120= 0.067 m/s4
8
12
16
80 160 240
DynamicsDynamics
April 19, 2023
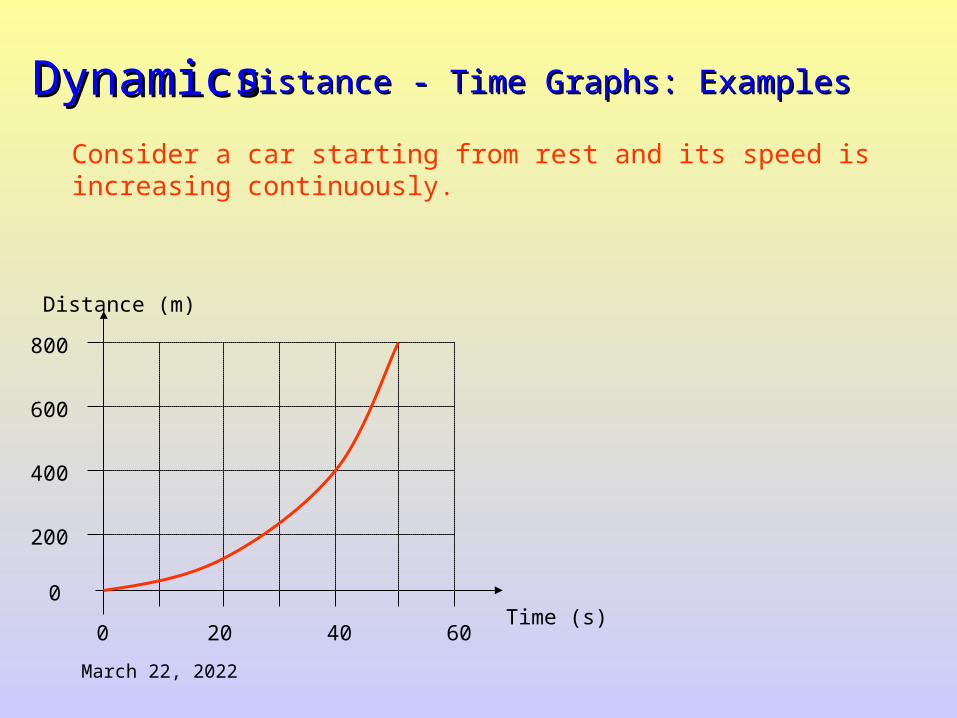
Distance - Time Graphs: ExamplesDistance - Time Graphs: Examples
Consider a car starting from rest and its speed is increasing continuously.
Distance (m)
Time (s)0
200
400
600
800
200 40 60

DynamicsDynamics
April 19, 2023
Distance - Time Graphs: ExamplesDistance - Time Graphs: Examples
Consider a car starting from rest and its speed is increasing continuously.Find the speed of the car at 40 seconds after the start of the journey.
Distance (m)
Time (s)0
200
400
600
800
200 40 60

DynamicsDynamics
April 19, 2023
Distance - Time Graphs: ExamplesDistance - Time Graphs: Examples
Consider a car starting from rest and its speed is increasing continuously.Find the speed of the car at 40 seconds after the start of the journey.
Distance (m)
Time (s)0
200
400
600
800
200 40 60

DynamicsDynamics
April 19, 2023
Distance - Time Graphs: ExamplesDistance - Time Graphs: Examples
Consider a car starting from rest and its speed is increasing continuously.Find the speed of the car at 40 seconds after the start of the journey.
Distance (m)
Time (s)0
200
400
600
800
200 40 60
Speed at 40 seconds= gradient of tangent drawn at 40s= rise/run= 800/40= 20 m/s800
40
DynamicsDynamics
April 19, 2023
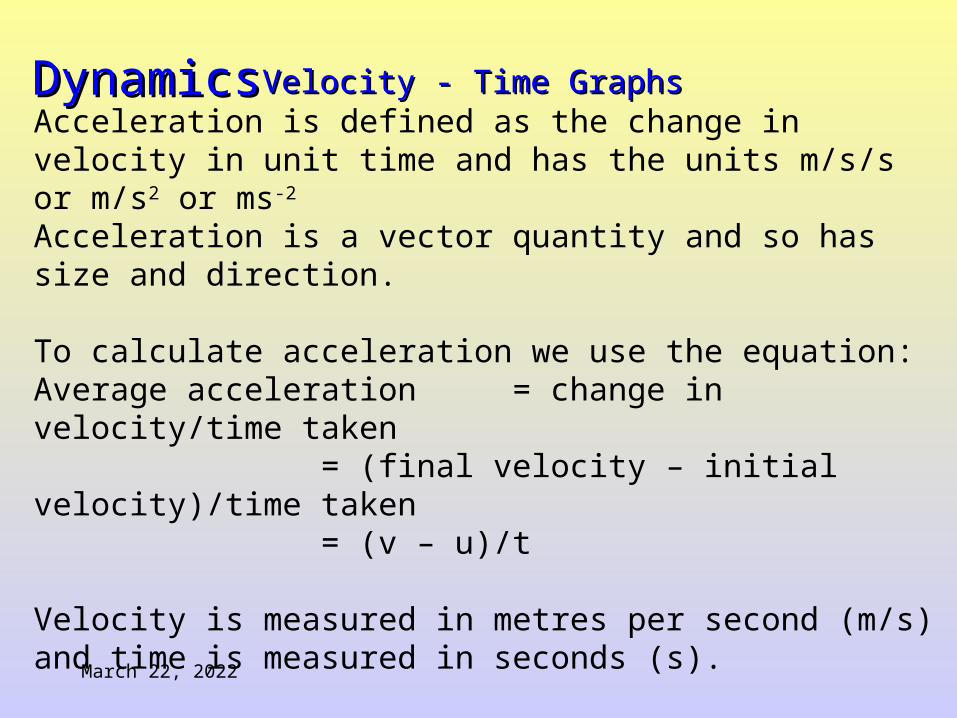
Acceleration is defined as the change in velocity in unit time and has the units m/s/s or m/s2 or ms-2
Acceleration is a vector quantity and so has size and direction.
To calculate acceleration we use the equation:Average acceleration = change in velocity/time taken
= (final velocity – initial velocity)/time taken= (v – u)/t
Velocity is measured in metres per second (m/s) and time is measured in seconds (s).
The greater the change in velocity in a given time then the greater is the acceleration.
Velocity - Time GraphsVelocity - Time Graphs

DynamicsDynamics
April 19, 2023
AccelerationAcceleration
V-U
TA
Acceleration = change in velocity (in m/s)
(in m/s2) time taken (in s)
1) A cyclist accelerates from 0 to 10m/s in 5 seconds. What is her acceleration?
2) A ball is dropped and accelerates downwards at a rate of 10m/s2 for 12 seconds. How much will the ball’s velocity increase by?
3) A car accelerates from 10 to 20m/s with an acceleration of 2m/s2. How long did this take?
4) A rocket accelerates from 1,000m/s to 5,000m/s in 2 seconds. What is its acceleration?
DynamicsDynamics
April 19, 2023
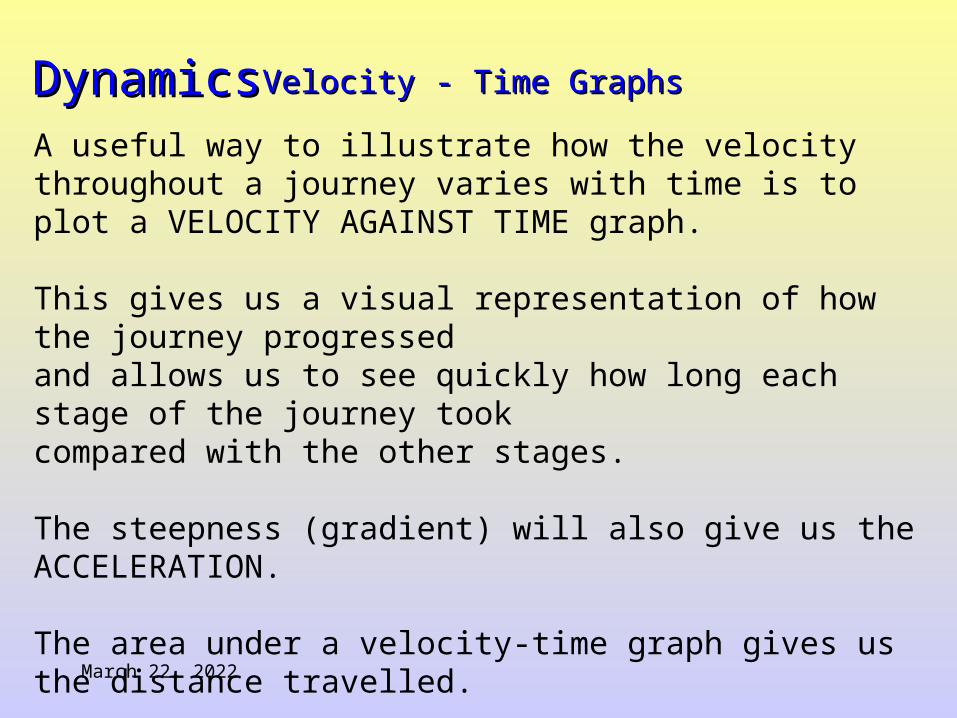
A useful way to illustrate how the velocity throughout a journey varies with time is to plot a VELOCITY AGAINST TIME graph.
This gives us a visual representation of how the journey progressedand allows us to see quickly how long each stage of the journey tookcompared with the other stages.
The steepness (gradient) will also give us the ACCELERATION.
The area under a velocity-time graph gives us the distance travelled.
The following graphs show how the shape of velocity-time graphsmay vary and how to interpret them.
Velocity - Time GraphsVelocity - Time Graphs

DynamicsDynamics
April 19, 2023
Velocity
Time00
A
B C
AB- constant acceleration
BC - constant velocity
Gradient = rise/run = acceleration (m/s2)
Rise
Run
Velocity - Time GraphsVelocity - Time Graphs

DynamicsDynamics
April 19, 2023
Velocity
Time00
A - Bconstant
acceleration
B - C Stopped accelerating(velocity is constant)
C - Dconstant
deceleration
A
B C
D
Area under Graph= Total Distance Travelled
Velocity - Time GraphsVelocity - Time Graphs
DynamicsDynamics
April 19, 2023
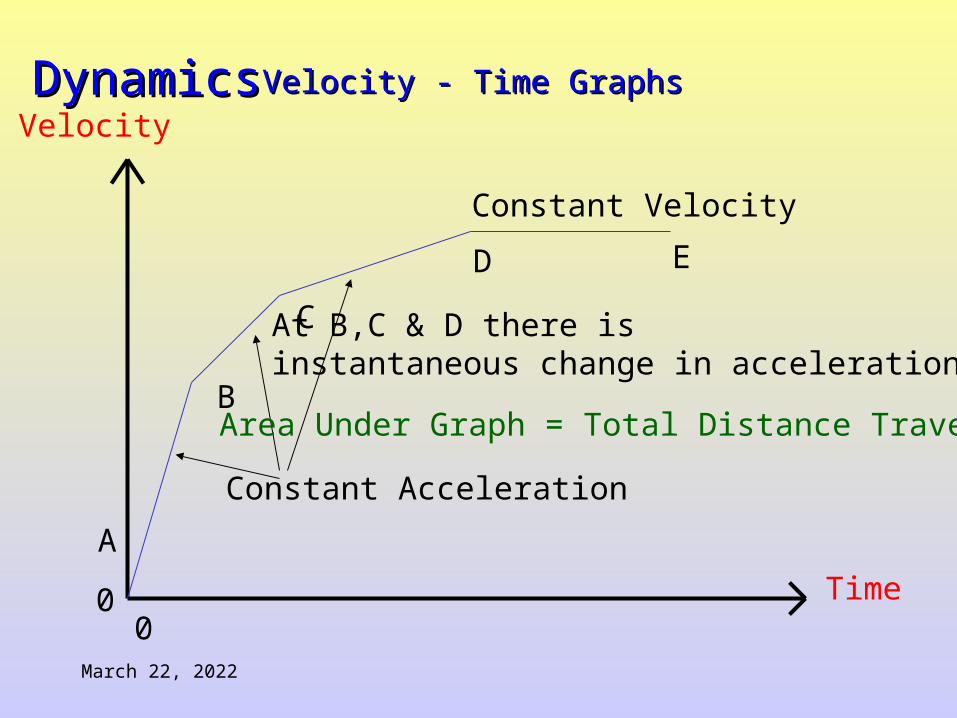
Velocity
Time00
A
B
C
D E
Constant Acceleration
Constant Velocity
At B,C & D there isinstantaneous change in acceleration
Area Under Graph = Total Distance Travelled
Velocity - Time GraphsVelocity - Time Graphs

DynamicsDynamics
April 19, 2023
Velocity
Time00
Acceleration is constantlychanging
(In this case it is decreasing)Rise
Run
A
Acceleration AT A = Rise/Run = Gradient of the tangent AT A
Velocity - Time GraphsVelocity - Time Graphs
Tangent drawn at A

DynamicsDynamics
April 19, 2023
Velocity
Time00
Acceleration isconstantlychanging
(Increasing)
Rise
Run
A
Acceleration AT A = Rise/Run = Gradient of tangent AT A
Velocity - Time GraphsVelocity - Time Graphs

DynamicsDynamics
April 19, 2023
Velocity - Time Graphs: ExamplesVelocity - Time Graphs: Examples
(a) Constant Velocity
Velocity (ms-1)
Time (s)
10
8
6
4
2
00 2 4 6 8 10

DynamicsDynamics
April 19, 2023
Velocity - Time Graphs: ExamplesVelocity - Time Graphs: Examples
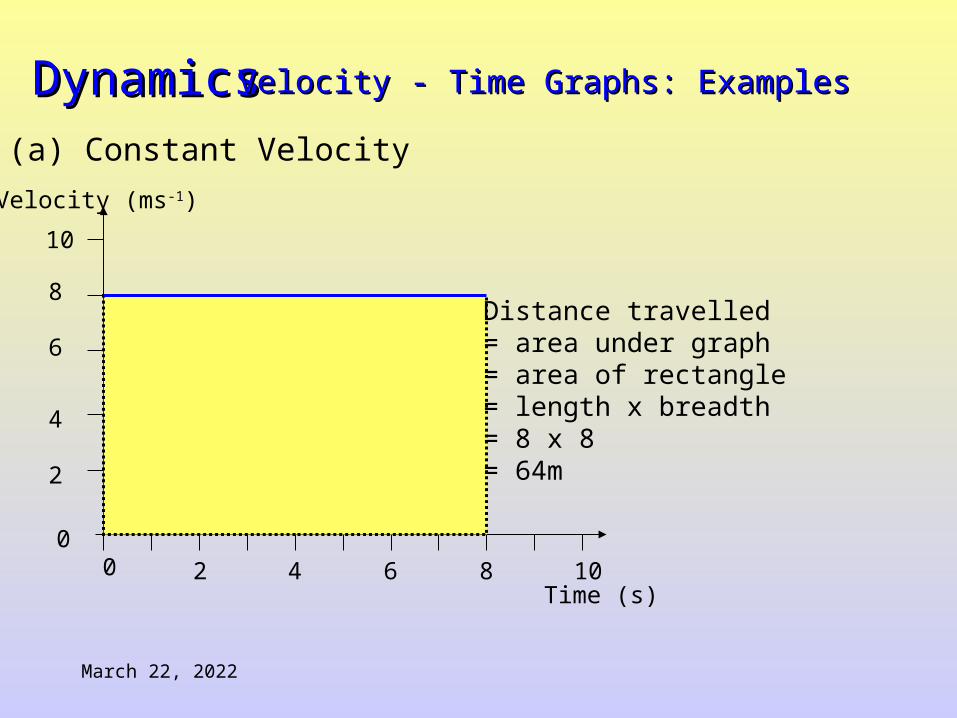
(a) Constant Velocity
Velocity (ms-1)
Time (s)
10
8
6
4
2
00 2 4 6 8 10
DynamicsDynamics
April 19, 2023
Velocity - Time Graphs: ExamplesVelocity - Time Graphs: Examples
(a) Constant Velocity
Velocity (ms-1)
Time (s)
10
8
6
4
2
00 2 4 6 8 10
Distance travelled= area under graph= area of rectangle= length x breadth= 8 x 8= 64m

DynamicsDynamics
April 19, 2023
Velocity - Time Graphs: ExamplesVelocity - Time Graphs: Examples
(b) Uniform Acceleration
Velocity (ms-1)
Time (s)
10
8
6
4
2
00 2 4 6 8 10

DynamicsDynamics
April 19, 2023
Velocity - Time Graphs: ExamplesVelocity - Time Graphs: Examples
(b) Uniform Acceleration
Velocity (ms-1)
Time (s)
10
8
6
4
2
00 2 4 6 8 10

DynamicsDynamics
April 19, 2023
Velocity - Time Graphs: ExamplesVelocity - Time Graphs: Examples
(b) Uniform Acceleration
Velocity (ms-1)
Time (s)
10
8
6
4
2
00 2 4 6 8 10
Distance travelled= area under graph= area of triangle= ½ base x height= ½ 8 x 8= 32 m

DynamicsDynamics
April 19, 2023
Velocity - Time Graphs: ExamplesVelocity - Time Graphs: Examples
(b) Uniform Acceleration
Velocity (ms-1)
Time (s)
10
8
6
4
2
00 2 4 6 8 10
Distance travelled= area under graph= area of triangle= ½ base x height= ½ 8 x 8= 32 m
Acceleration = gradient= rise/run= 8/8= 1 ms-2

DynamicsDynamics
April 19, 2023
Velocity - Time Graphs: ExamplesVelocity - Time Graphs: Examples
(c) Uniform Deceleration
Velocity (ms-1)
Time (s)
10
8
6
4
2
00 2 4 6 8 10

DynamicsDynamics
April 19, 2023
Velocity - Time Graphs: ExamplesVelocity - Time Graphs: Examples
(c) Uniform Deceleration
Velocity (ms-1)
Time (s)
10
8
6
4
2
00 2 4 6 8 10
Distance travelled= area under graph= ½ base x height= ½ 10 x 10= 50m

DynamicsDynamics
April 19, 2023
Velocity - Time Graphs: ExamplesVelocity - Time Graphs: Examples
(c) Uniform Deceleration
Velocity (ms-1)
Time (s)
10
8
6
4
2
00 2 4 6 8 10
Distance travelled= area under graph= ½ base x height= ½ 10 x 10= 50m
Acceleration = gradient= rise/run= -10/10= -1 ms-2
(Deceleration = +1 ms-2

DynamicsDynamics
April 19, 2023
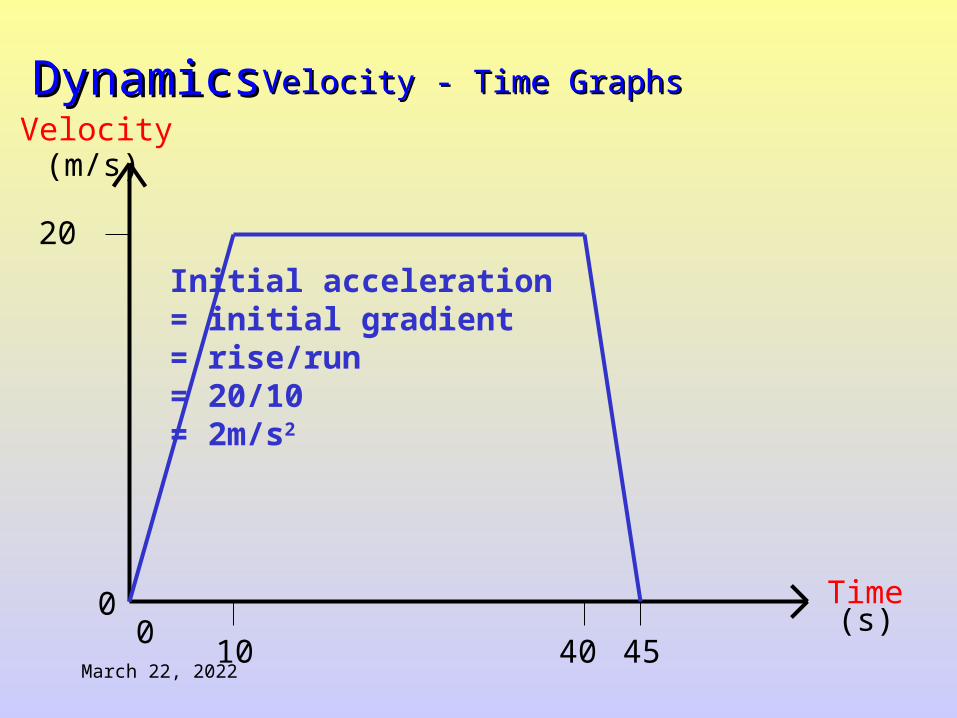
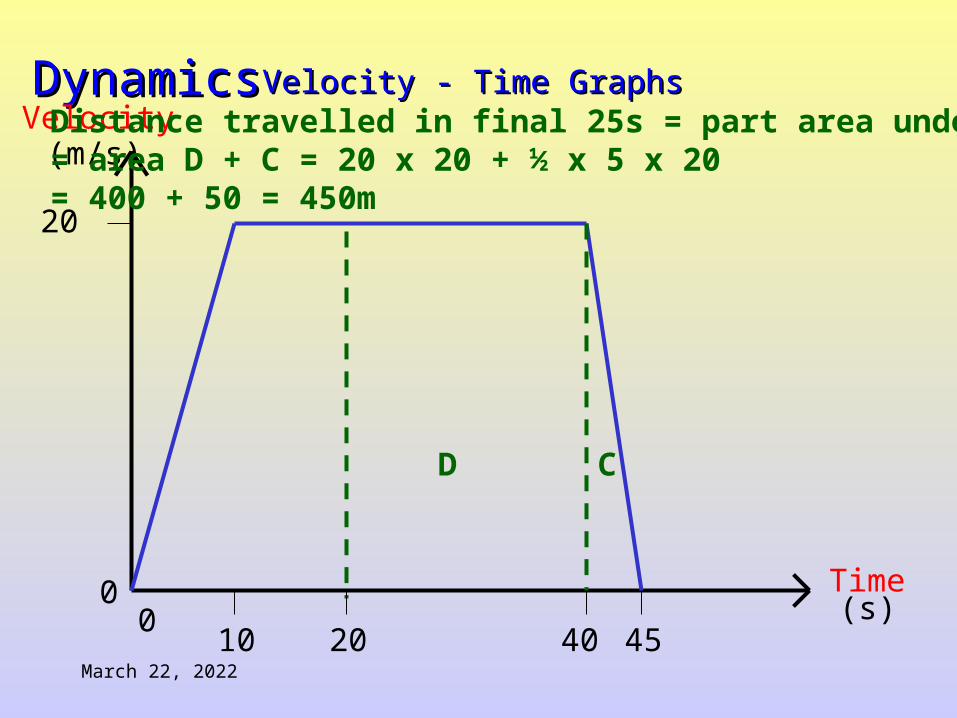
A car starts from rest and accelerates uniformly to 20m/s in 10 seconds.It travels at this velocity for a further 30 seconds before decelerating uniformly to rest in 5 seconds.(a) draw a velocity - time graph of the car’s journey(b) calculate the car’s initial acceleration(c) calculate the car’s final deceleration(d) calculate the total distance travelled by the car(e) calculate the distance travelled by the car in the final 25 seconds
Velocity - Time Graphs: ExampleVelocity - Time Graphs: Example

DynamicsDynamics
April 19, 2023
Velocity
Time00
Velocity - Time GraphsVelocity - Time Graphs

DynamicsDynamics
April 19, 2023
Velocity
Time00
20
(m/s)
(s)10 40 45
Velocity - Time GraphsVelocity - Time Graphs

DynamicsDynamics
April 19, 2023
Velocity
Time00
20
(m/s)
(s)10 40 45
Velocity - Time GraphsVelocity - Time Graphs

DynamicsDynamics
April 19, 2023
Velocity
Time00
20
(m/s)
(s)10 40 45
Velocity - Time GraphsVelocity - Time Graphs

DynamicsDynamics
April 19, 2023
Velocity
Time00
20
(m/s)
(s)10 40 45
Velocity - Time GraphsVelocity - Time Graphs
DynamicsDynamics
April 19, 2023
Velocity
Time00
20
(m/s)
(s)10 40 45
Initial acceleration= initial gradient= rise/run= 20/10= 2m/s2
Velocity - Time GraphsVelocity - Time Graphs

DynamicsDynamics
April 19, 2023
Velocity
Time00
20
(m/s)
(s)10 40 45
final acceleration= final gradient= rise/run= -20/5= -4m/s2
Velocity - Time GraphsVelocity - Time Graphs

DynamicsDynamics
April 19, 2023
Velocity
Time00
20
(m/s)
(s)10 40 45
A B C
Total distance travelled = total area under graph= area A + B + C = ½ x 10 x 20 + 30 x 20 + ½ x 5 x 20= 100 + 600 + 50 = 750m
Velocity - Time GraphsVelocity - Time Graphs
DynamicsDynamics
April 19, 2023
Velocity
Time00
20
(m/s)
(s)10 40 45
C
Distance travelled in final 25s = part area under graph= area D + C = 20 x 20 + ½ x 5 x 20= 400 + 50 = 450m
D
20
Velocity - Time GraphsVelocity - Time Graphs
DynamicsDynamics
April 19, 2023
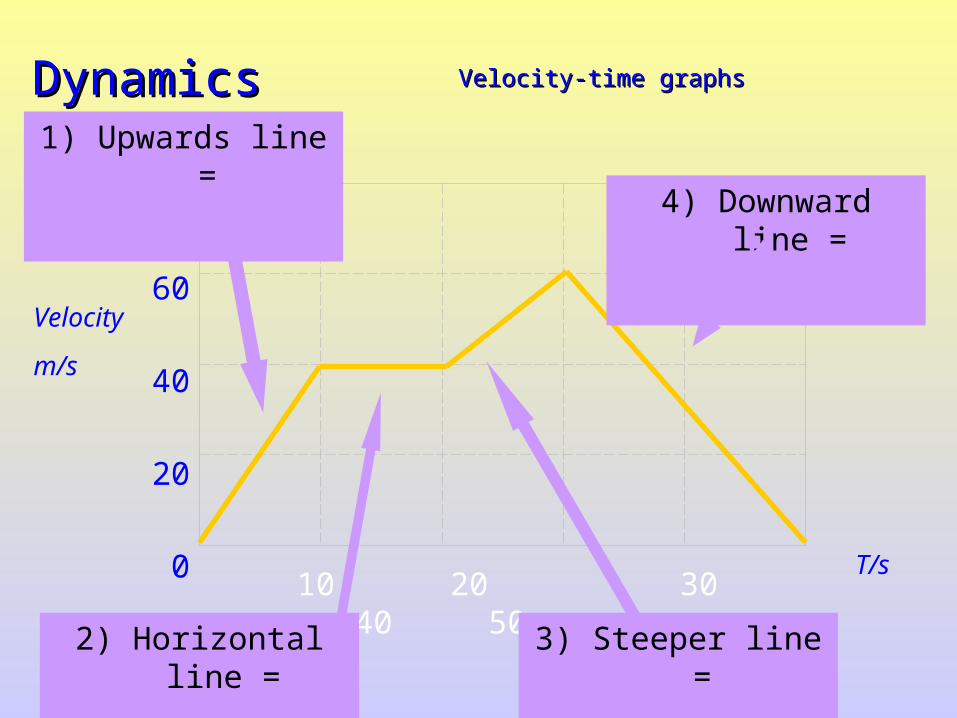
Velocity-time graphsVelocity-time graphs
80
60
40
20
0 10 20 30 40 50
Velocity
m/s
T/s
1) Upwards line =
2) Horizontal line =
3) Steeper line =
4) Downward line =

DynamicsDynamics
April 19, 2023
80
60
40
20
01) How fast was the object going after 10 seconds?
2) What is the acceleration from 20 to 30 seconds?
3) What was the deceleration from 30 to 50s?
4) How far did the object travel altogether?
10 20 30 40 50
Velocity
m/s
T/s