Embed Size (px)
Citation preview
Dynamical analysis of clustering on financial
market data
Nicolò Musmeci, PhD student, Department of Mathematics, King's College London [email protected]: Tiziana Di Matteo
Econophysics and Networks Across Scales 27-31 May 2013, Leiden
2
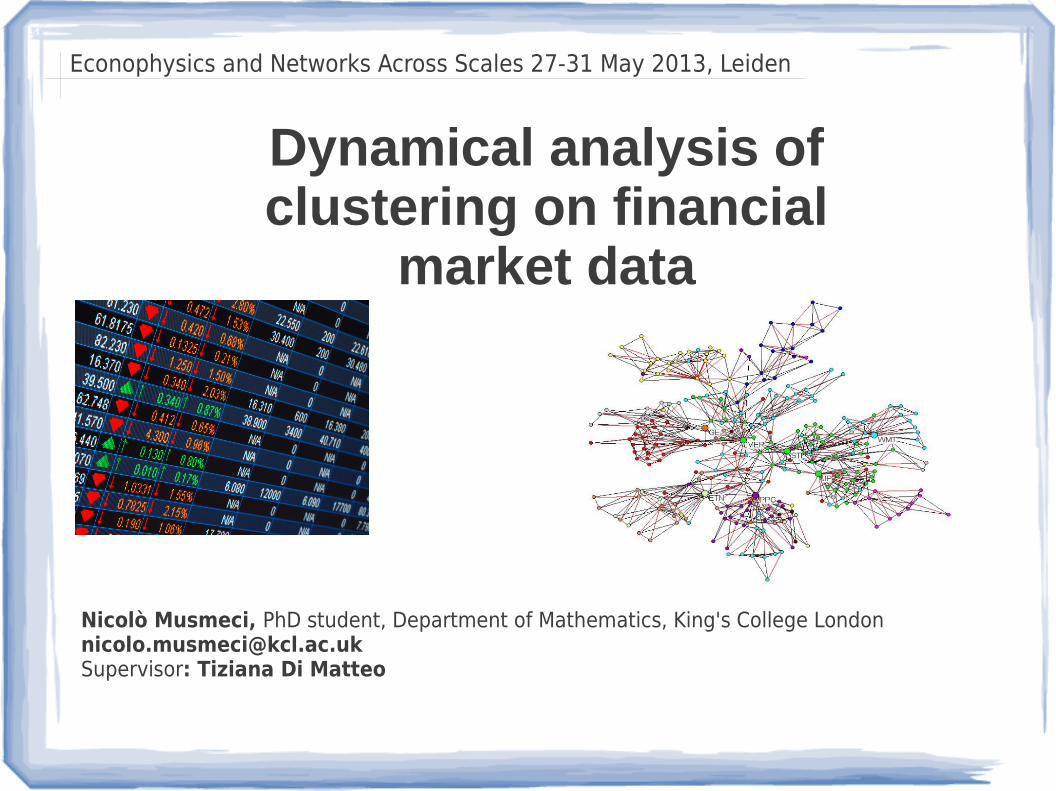
Overview and motivations
Stocks time series PMFG DBHT hierarchical clusters partition of stocks
DBHT: based on the topological properties of PMFG; it is deterministic, requires no a-priori parameters and it does not need any expert supervision.
Planar Maximally Filtered Graph
Correlation-based network
Cluster = subset of stocks with a significant cross-correlation
. Questions: – How do DBHT clusters evolve with time? – Measures of cluster persistence? – What is the relation between clusters and industrial sector classification? – How does this relation evolve with time?
. Motivations:– Description of market cycles in terms of clusters;– Portfolio diversification : do clusters perform better than industrial sectors?
[1] Won-Min Song, T. Di Matteo, T. Aste, "Hierarchical information clustering by means of topologically embedded graphs", PLoS One 7(3) (2012) e31929.
[1]
3
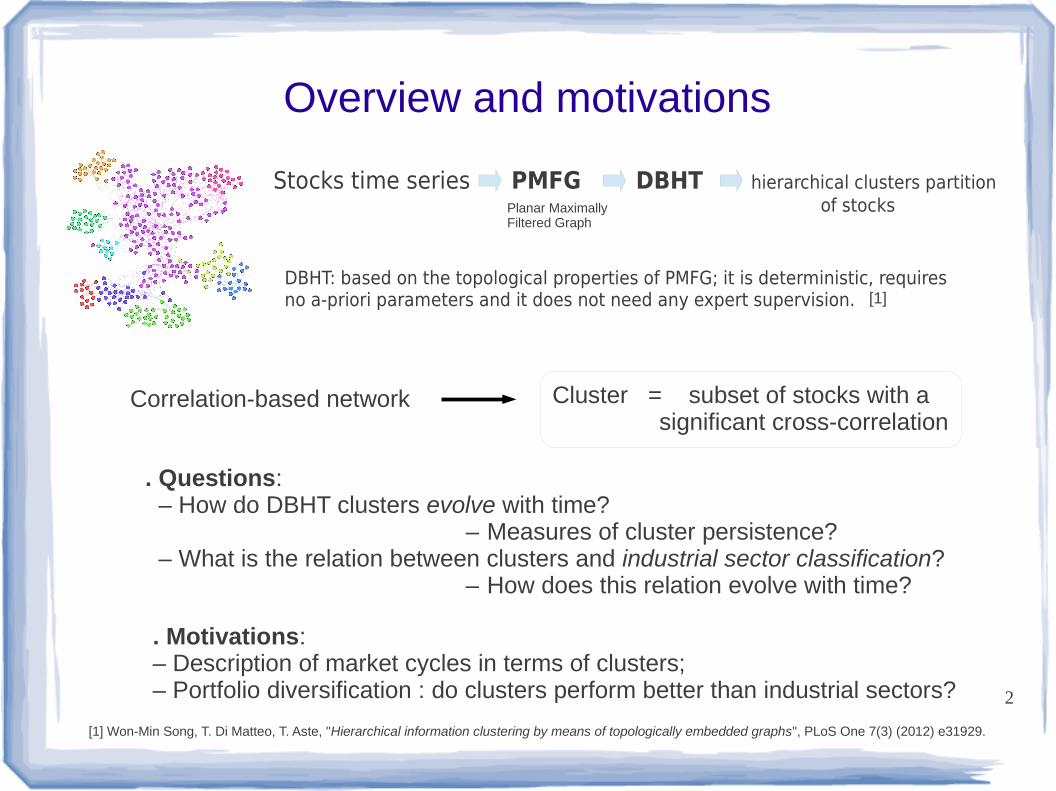
Dataset and analyses procedure
N = 342 stocks in US equity market, daily prices 1997-2012 (T=4026 trading days)
Moving time window of 3 years (750 trading days) . correlation matrix of log returns (with exponential smoothing) . PMFG . DBHT clusters
97 98 99 00 01 02 03 04
● Data from Bloomberg
…..
…..
PMFG 1
Time window 1
T
n = 100 time windows 100 PMFGs 100 clustering partitions
4
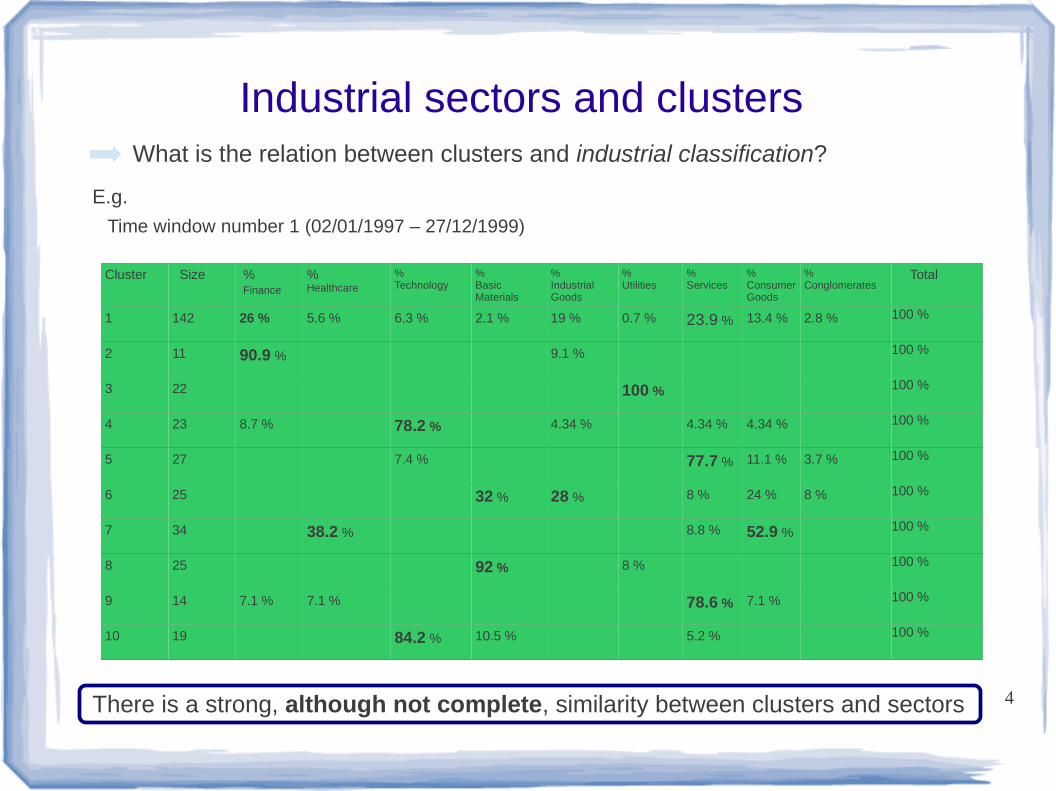
Industrial sectors and clusters What is the relation between clusters and industrial classification?
Cluster Size % Finance
%Healthcare
%Technology
%Basic Materials
%Industrial Goods
%Utilities
%Services
%Consumer Goods
%Conglomerates
Total
1 142 26 % 5.6 % 6.3 % 2.1 % 19 % 0.7 % 23.9 % 13.4 % 2.8 % 100 %
2 11 90.9 % 9.1 % 100 %
3 22 100 % 100 %
4 23 8.7 % 78.2 % 4.34 % 4.34 % 4.34 % 100 %
5 27 7.4 % 77.7 % 11.1 % 3.7 % 100 %
6 25 32 % 28 % 8 % 24 % 8 % 100 %
7 34 38.2 % 8.8 % 52.9 % 100 %
8 25 92 % 8 % 100 %
9 14 7.1 % 7.1 % 78.6 % 7.1 % 100 %
10 19 84.2 % 10.5 % 5.2 % 100 %
Time window number 1 (02/01/1997 – 27/12/1999)
E.g.
There is a strong, although not complete, similarity between clusters and sectors
5
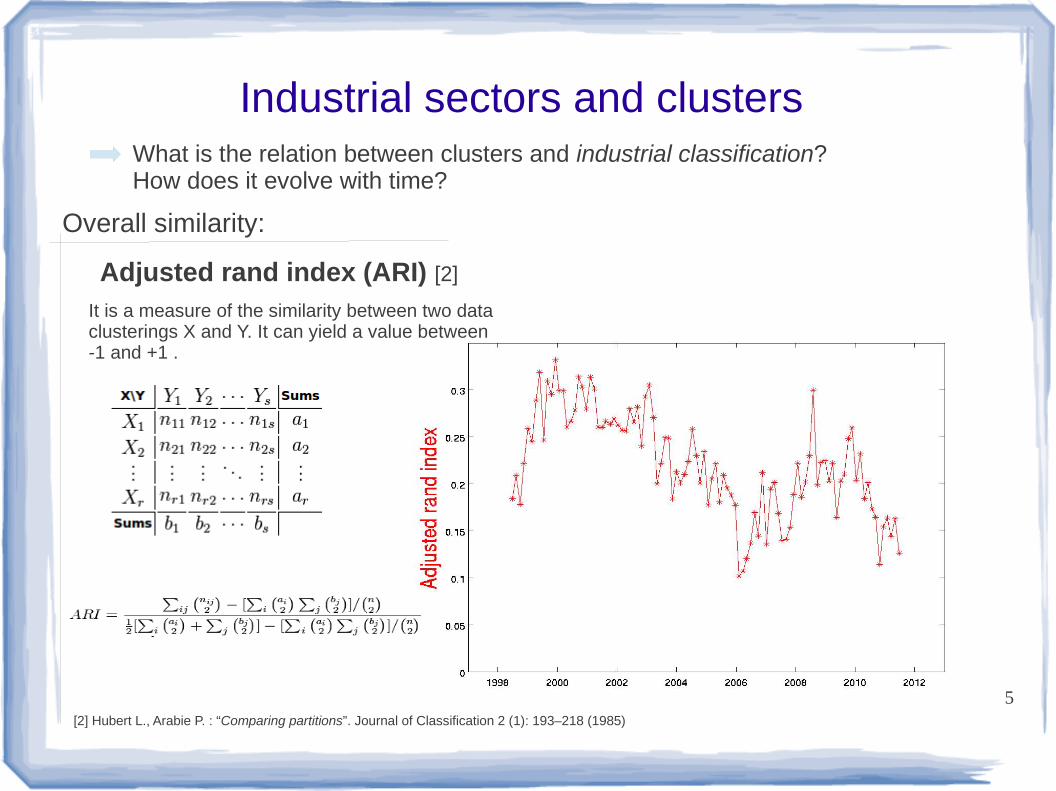
Industrial sectors and clusters What is the relation between clusters and industrial classification? How does it evolve with time?
Adjusted rand index (ARI) [2]
Overall similarity:
It is a measure of the similarity between two data clusterings X and Y. It can yield a value between -1 and +1 .
[2] Hubert L., Arabie P. : “Comparing partitions”. Journal of Classification 2 (1): 193–218 (1985)
6
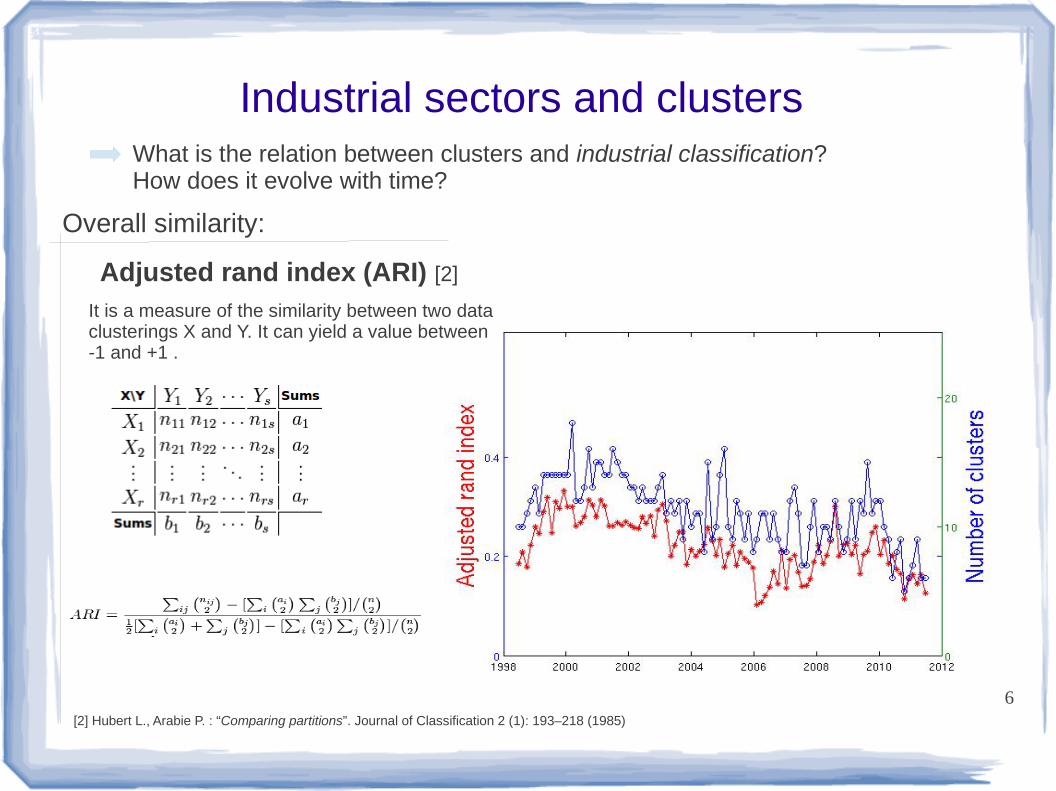
Industrial sectors and clusters What is the relation between clusters and industrial classification? How does it evolve with time?
Adjusted rand index (ARI) [2]
Overall similarity:
[2] Hubert L., Arabie P. : “Comparing partitions”. Journal of Classification 2 (1): 193–218 (1985)
It is a measure of the similarity between two data clusterings X and Y. It can yield a value between -1 and +1 .
7
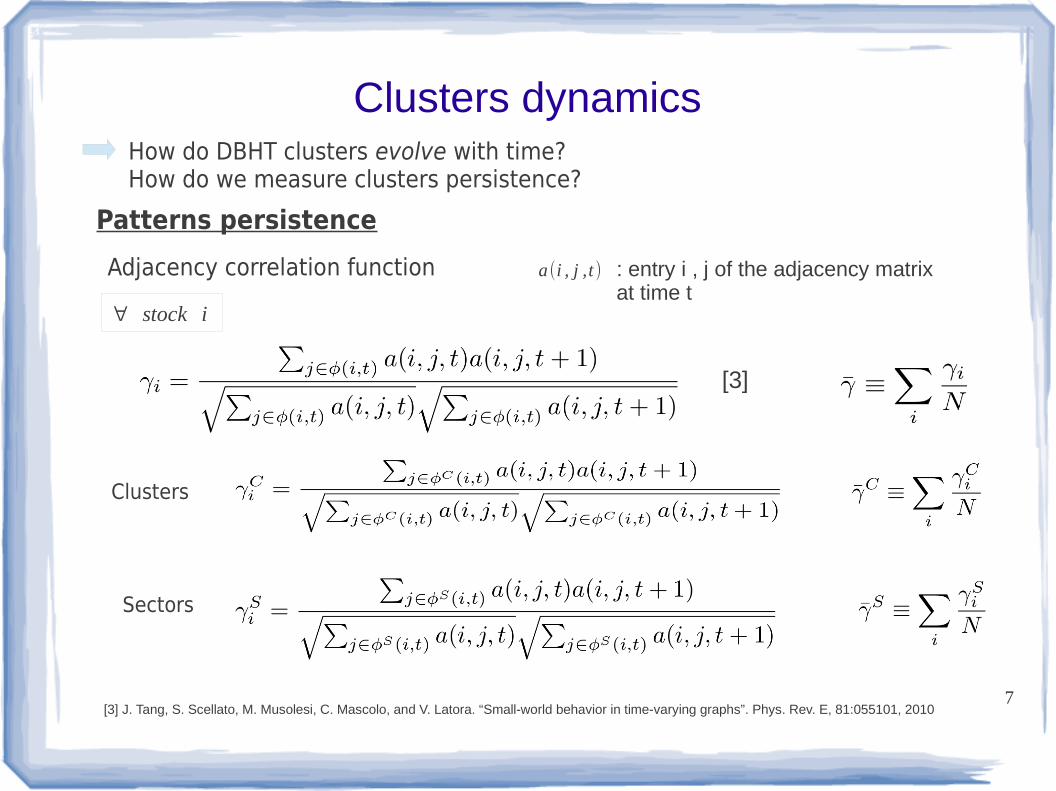
Clusters dynamicsHow do DBHT clusters evolve with time? How do we measure clusters persistence?
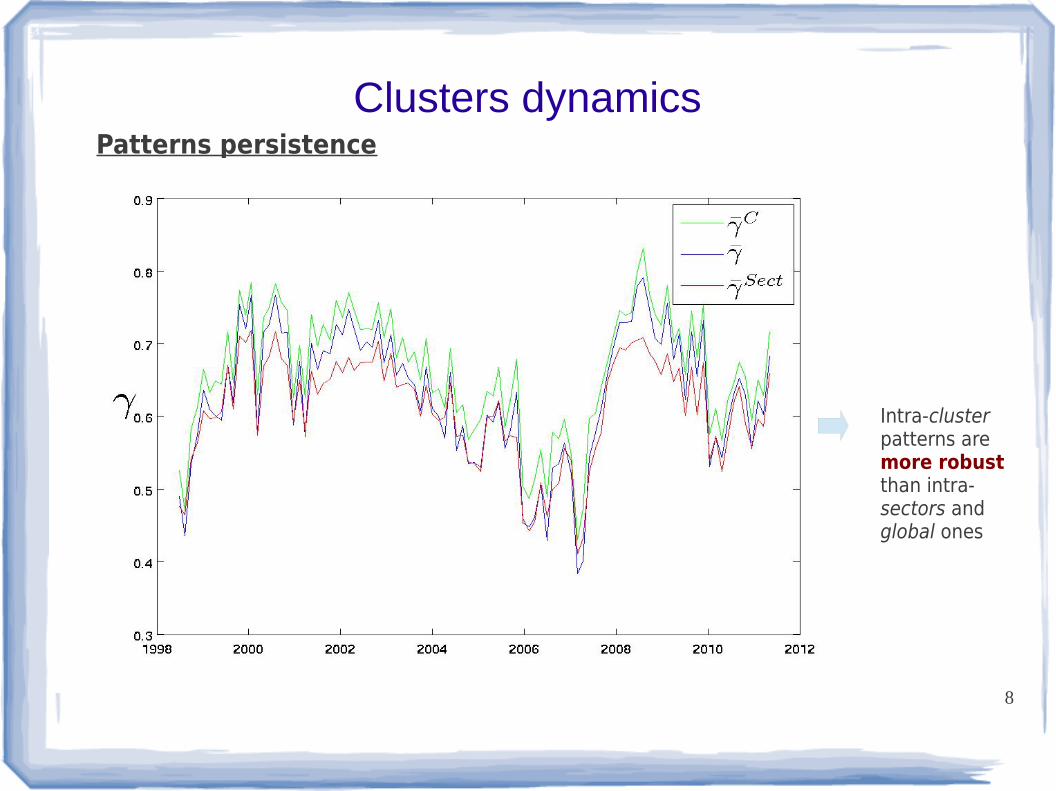
Patterns persistence
Adjacency correlation function
∀ stock i
Clusters
Sectors
[3] J. Tang, S. Scellato, M. Musolesi, C. Mascolo, and V. Latora. “Small-world behavior in time-varying graphs”. Phys. Rev. E, 81:055101, 2010
[3]
a(i , j ,t) : entry i , j of the adjacency matrix at time t
8
Clusters dynamicsPatterns persistence
Intra-cluster patterns are more robust than intra-sectors and global ones
9
Clusters dynamics
Cluster A
Cluster B
Cluster C
Cluster α
Cluster β
Cluster γ
Time window 1
Time window 10
nA nαnA ,α
N
Cluster α (time window = 10)
Cluster A (time window = 1)
All stocks
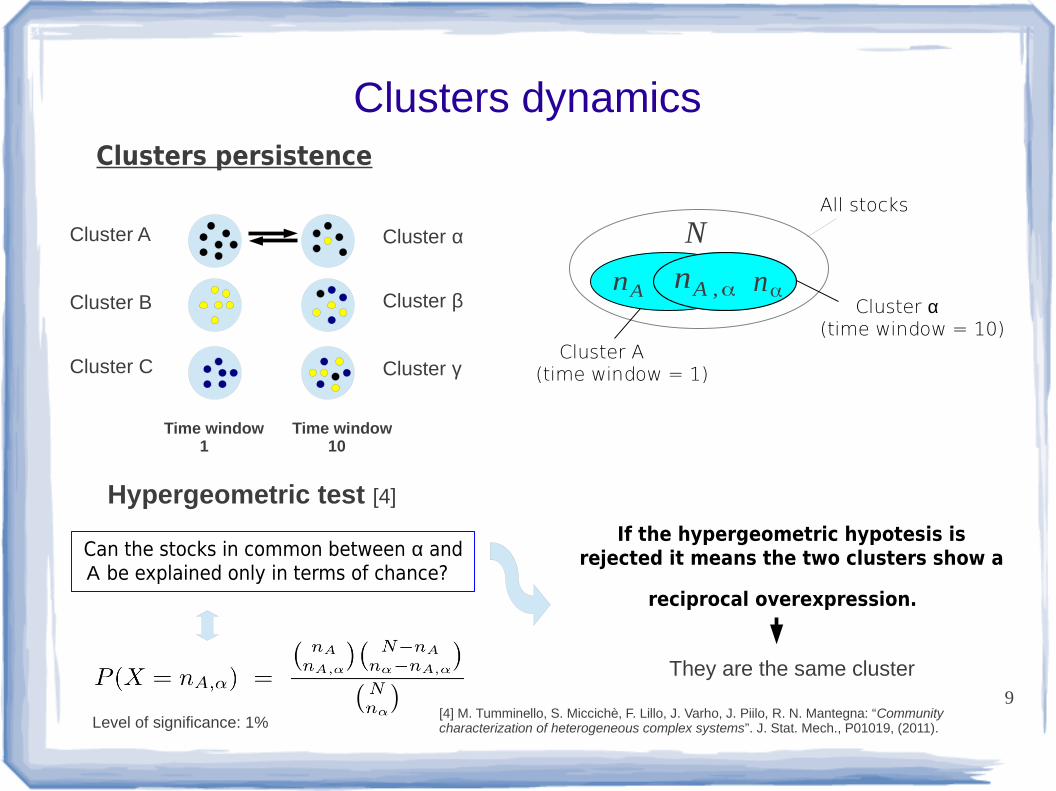
Hypergeometric test [4]
Can the stocks in common between α and Α be explained only in terms of chance?
If the hypergeometric hypotesis is rejected it means the two clusters show a
reciprocal overexpression.
They are the same cluster
[4] M. Tumminello, S. Miccichè, F. Lillo, J. Varho, J. Piilo, R. N. Mantegna: “Community characterization of heterogeneous complex systems”. J. Stat. Mech., P01019, (2011).Level of significance: 1%
Clusters persistence
10
Clusters dynamicsClusters persistence
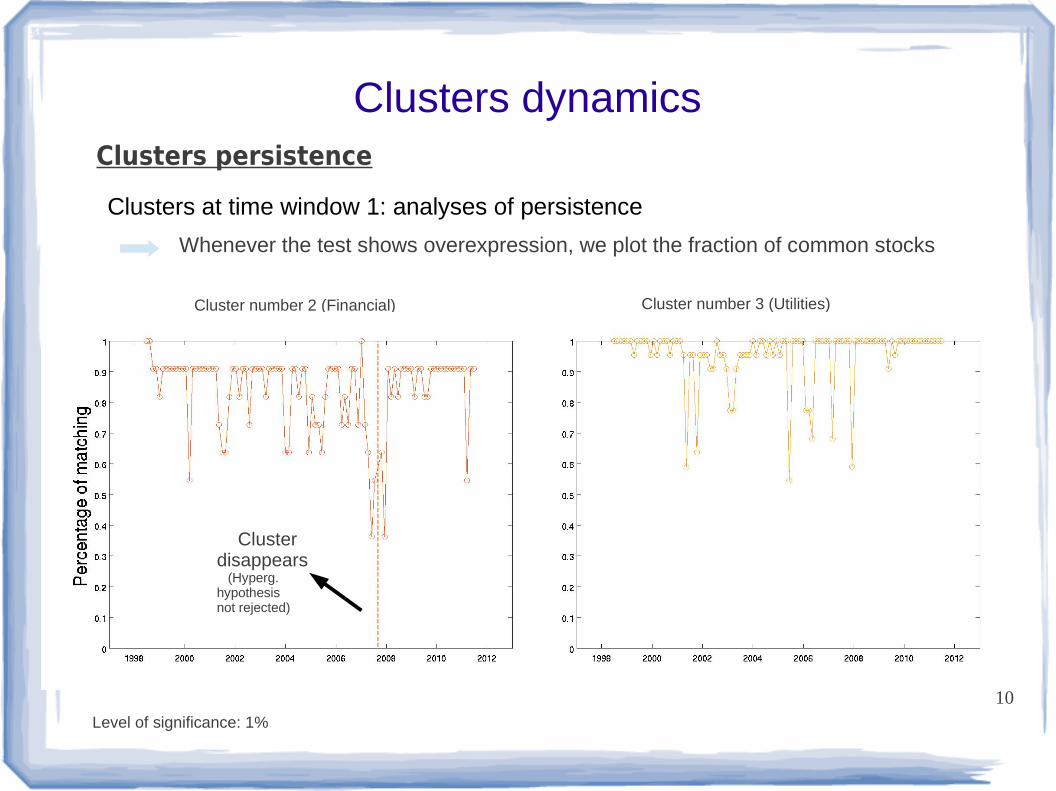
Cluster number 2 (Financial) Cluster number 3 (Utilities)
Clusters at time window 1: analyses of persistence
Cluster disappears (Hyperg.hypothesisnot rejected)
Whenever the test shows overexpression, we plot the fraction of common stocks
Level of significance: 1%
11
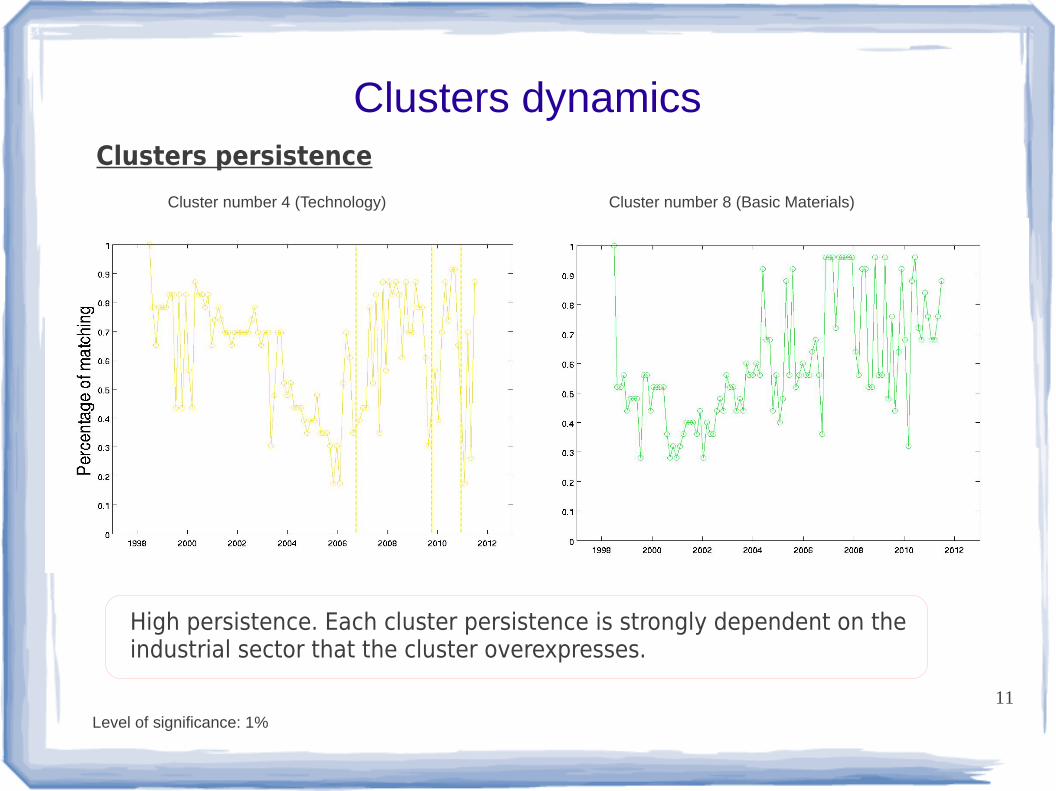
Clusters dynamicsClusters persistence
High persistence. Each cluster persistence is strongly dependent on the industrial sector that the cluster overexpresses.
Cluster number 4 (Technology) Cluster number 8 (Basic Materials)
Level of significance: 1%
12
Conclusions
We have performed a set of dynamical analyses on the DBHT clusters, throughout a time period of 15 years.
Patterns persistence varies with time. Intra-cluster patterns are more robust than intra-sector patterns.
In general clusters show high persistence. Each cluster persistence is strongly dependent on the industrial sector that the cluster overexpresses.
Similarity clusters/industrial sectors varies with time; in particular it drops during the 2007-08 crisis
Next steps...
DBHT clusters as a stock selection criterion for improve portfolio diversification
● Investment simulations: 10% decrease in portfolio volatility compared to industrial sector diversification
Clusters dynamics