Embed Size (px)
Citation preview
Dynamic Topic Modeling for Monitoring MarketCompetition from Online Text and Image Data
Hao ZhangCarnegie Mellon University
Pittsburgh, PA, [email protected]
Gunhee KimSeoul National University
Seoul, South Korea, [email protected]
Eric P. XingCarnegie Mellon University
Pittsburgh, PA, [email protected]
ABSTRACTWe propose a dynamic topic model for monitoring temporalevolution of market competition by jointly leveraging tweetsand their associated images. For a market of interest (e.g .luxury goods), we aim at automatically detecting the latenttopics (e.g . bags, clothes, luxurious) that are competitive-ly shared by multiple brands (e.g . Burberry, Prada, andChanel), and tracking temporal evolution of the brands’ s-takes over the shared topics. One of key applications of ourwork is social media monitoring that can provide companieswith temporal summaries of highly overlapped or discrimi-native topics with their major competitors. We design ourmodel to correctly address three major challenges: multi-view representation of text and images, modeling of compet-itiveness of multiple brands over shared topics, and trackingtheir temporal evolution. As far as we know, no previousmodel can satisfy all the three challenges. For evaluation,we analyze about 10 millions of tweets and 8 millions of as-sociated images of the 23 brands in the two categories ofluxury and beer. Through experiments, we show that theproposed approach is more successful than other candidatemethods for the topic modeling of competition. We alsoquantitatively demonstrate the generalization power of theproposed method for three prediction tasks.
Categories and Subject DescriptorsH.2.8 [Information Systems]: Database Applications—Data mining ; G.3 [Probability and Statistics]: Proba-bilistic Algorithms; J.4 [Computer Applications]: Socialand behavioral sciences—Economics
KeywordsDynamic topic models; Market competition; Text and im-ages
1. INTRODUCTIONThe increasing pervasiveness of the Internet has lead to a
wealth of consumer-created data over a multitude of online
Permission to make digital or hard copies of all or part of this work for personal orclassroom use is granted without fee provided that copies are not made or distributedfor profit or commercial advantage and that copies bear this notice and the full cita-tion on the first page. Copyrights for components of this work owned by others thanACM must be honored. Abstracting with credit is permitted. To copy otherwise, or re-publish, to post on servers or to redistribute to lists, requires prior specific permissionand/or a fee. Request permissions from [email protected]’15, August 10-13, 2015, Sydney, NSW, Australia.c© 2015 ACM. ISBN 978-1-4503-3664-2/15/08 ...$15.00.
DOI: http://dx.doi.org/10.1145/2783258.2783293.
platforms such as blogs, discussion forums, and social net-working sites. Such contents are valuable for companies tolisten in consumers’ candidate opinions, and thus there havebeen many recent studies on online market intelligence [10,17, 18], whose goal is collecting and analyzing online in-formation that is contributed by the general public towardcompanies’ products and services, and providing with pic-tures of ongoing brand performance in a set of given marketconditions. The online market intelligence has been one ofemerging fields in data mining research as market compe-tition becomes fierce, and consumers’ online reviews and e-valuations are considered more trustworthy and spontaneousthan other information described by vendors.
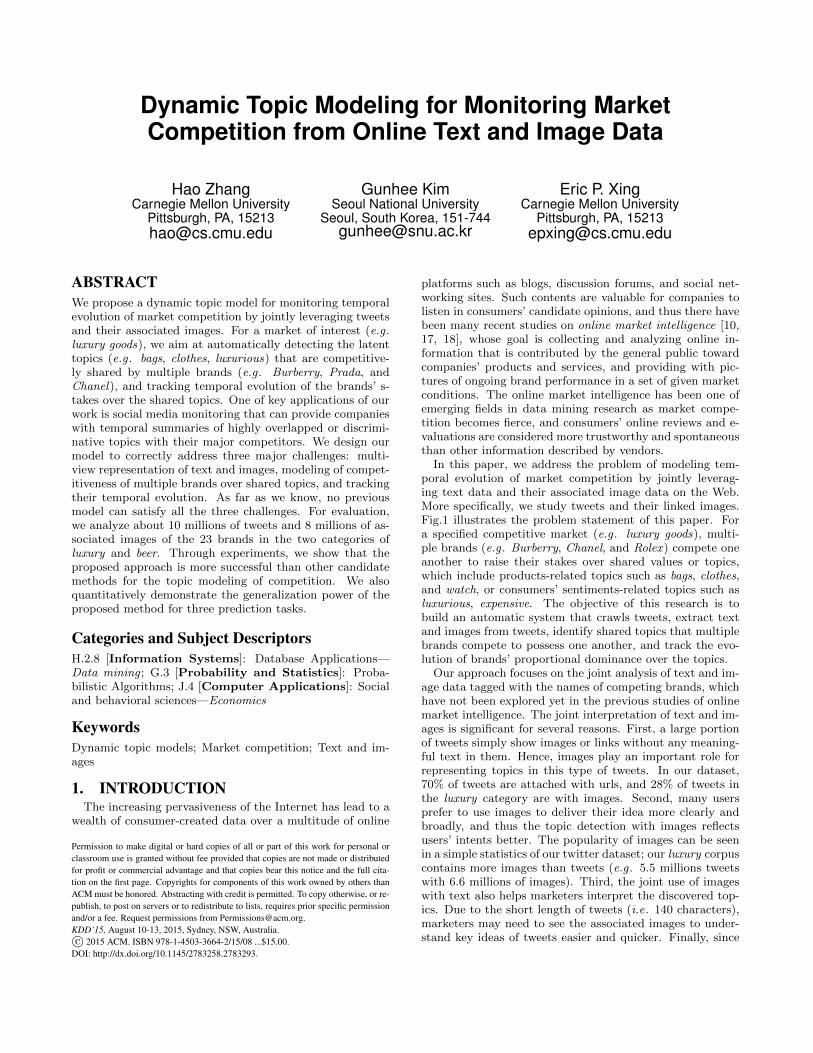
In this paper, we address the problem of modeling tem-poral evolution of market competition by jointly leverag-ing text data and their associated image data on the Web.More specifically, we study tweets and their linked images.Fig.1 illustrates the problem statement of this paper. Fora specified competitive market (e.g . luxury goods), multi-ple brands (e.g . Burberry, Chanel, and Rolex) compete oneanother to raise their stakes over shared values or topics,which include products-related topics such as bags, clothes,and watch, or consumers’ sentiments-related topics such asluxurious, expensive. The objective of this research is tobuild an automatic system that crawls tweets, extract textand images from tweets, identify shared topics that multiplebrands compete to possess one another, and track the evo-lution of brands’ proportional dominance over the topics.
Our approach focuses on the joint analysis of text and im-age data tagged with the names of competing brands, whichhave not been explored yet in the previous studies of onlinemarket intelligence. The joint interpretation of text and im-ages is significant for several reasons. First, a large portionof tweets simply show images or links without any meaning-ful text in them. Hence, images play an important role forrepresenting topics in this type of tweets. In our dataset,70% of tweets are attached with urls, and 28% of tweets inthe luxury category are with images. Second, many usersprefer to use images to deliver their idea more clearly andbroadly, and thus the topic detection with images reflectsusers’ intents better. The popularity of images can be seenin a simple statistics of our twitter dataset; our luxury corpuscontains more images than tweets (e.g . 5.5 millions tweetswith 6.6 millions of images). Third, the joint use of imageswith text also helps marketers interpret the discovered top-ics. Due to the short length of tweets (i.e. 140 characters),marketers may need to see the associated images to under-stand key ideas of tweets easier and quicker. Finally, since
#Style #Prada Black Leather & Nylon Tessuto
Saffiano Shoulder #Bag
http://dlvr.it/8WZKM2 #Forsale #Auction
Coat from @ASOS , top from @FreePeople,
jeans from Rag & Bone, boots from
#ChristianLouboutin & bag from @Prada .
What is the most beautifully-designed
perfume bottle? Tell us on the blog here:
http://smarturl.it/ie2fka and win Gucci
The latest crop of #Chanel Pre-Spring bags
have arrived! See the full collection now:
http://bit.ly/1z3PnKG
Pretty In Pink: From @Chanel to @nailsinc, the
best petal-hued make-up launches this spring
http://vogue.uk/8p6UOi
Designer Kate Spade, Invicta, Gucci & More
Watches from $22 & Extra 20% Off
http://www.dealsplus.com/t/1zr85Y
watch+diamond
rolex, watch, gold, dial,
mens, datejust, ladies,
steel, diamond, oyster,
stainless,18k
glasses
chanel, giorgio,
sunglasses, classic,
glasses, reading, women's,
#burberrygifts
bags
bag, leather, gucci,
handbag, tote, clothing,
shoulder, canvas, reading,
women's,
watch+diamond
watch, gold, white date,
ladies, dial gift, rolex
#deals_us, blue, vintage,
bracelet, omega,
glasses
chanel, sunglasses, listen,
green, funny, dark, xmas,
womens, Armani,
excellent, Havana. lacoste
bags
authentic, leather, bag,
shoes, gucci, handbag,
prada, tote, deals, brown,
wallet
t t + 1 Timeline
Chanel
Gucci
Prada
(a) Input: Tweets and associated images of competing brands (b) Output: Temporal evolution of topics and brands’ proportion over the topics
Topics (text / visual words) Brands over topics
Figure 1: Problem statement. (a) Input is a large collection of tweets and their associated images that are retrieved
by the names of competing brands in a market of interest. (b) As output we aim at identifying the topics that are
shared by multiple brands, and track the evolution of topics and proportion of brands over the topics.
the Internet is where users cannot physically interact oneanother about actual products or services, images may beessential for users to make conversation about customers’descriptions, experiences, and opinions toward the brands.
From technical viewpoints, we propose a novel dynamictopic model to correctly address the following three majorchallenges: (1) multi-view representation of text and images,(2) modeling of latent topics that are competitively sharedby multiple brands, and (3) tracking temporal evolution ofthe topics. Some of existing work attain a subset of thesechallenges (e.g . texts and images [4, 7] and dynamic mod-eling [1, 5]), but none of them satisfies all the challenges.
We evaluate our algorithm using newly collected datasetfrom Twitter from October 2014 to February 2015. Our au-tomatic crawler downloads all tweets tagged by brand namesof interest, along with attached or linked images if avail-able. Consequently, our dataset contains about 10 millionsof original tweets and 8 millions of associated images of the23 brands in the two categories of luxury and beer. Theexperiments demonstrate the superior performance of theproposed approach over other candidate methods, for dy-namic topic modeling and three prediction tasks includingprediction of the most associated brands, most-likely cre-ated time, and competition trends for unseen tweets. Notethat while we mainly deal with brands of the two categories,our approach is completely unsupervised and thus applica-ble, without any modification, to any categories once inputsets of text and image streams are collected.
The foremost application of our work is social media mon-itoring, which assists marketers to summarize their fans’ on-line tweets with sparse and salient topics of competition inan illustrative way. Especially, our algorithm can discoverand visualize the temporal progression of what topics arehighly overlapped or discriminative over other competitors.From our interaction with marketers, we observe that theyare very curious to see and track what topics emerge andwhat pictures their fans (re-)tweet the most, but there is nosuch system yet. As another application, our method can bepartly used for sentiment analysis [17] because the detectedtopics can be positive or negative. That is, multiple brandscompetes one another not only on positive topics (e.g . mul-tiple cosmetics brands compete on the health+beauty topic)but also negative topics (e.g . multiple beer brands competeon the drunk+driving topic). We do not perform in-depthanalysis on sentiment analysis because it is out of the scope,but at least marketers can observe their brands’ distribution
on both positive and negative topics, which is also useful formarket analysis. Although we mainly focus on the applica-tions of brand competitions in a market, our problem formu-lation and approach are much broader and are applicable toother domains of competition, including tourism (e.g . mul-tiple cities compete to attract more international tourists),and politics (e.g . multiple candidates contest to take leadson major issues to win an election), to name a few.
The main contributions of this paper are as follows. (1) Tothe best of our knowledge, our work is the first attempt sofar to propose a principled topic model to discover the top-ics that are competitively shared between multiple brands,and track the temporal evolution of dominance of brandsover topics by leveraging both text and image data. (2) Wedevelop a new dynamic topic model for market competitionthat achieves three major challenges of our problem; multi-view representation of text and images, modeling of competi-tiveness of multiple entities over shared topics, and trackingtheir temporal evolution. As far as we know, no previousmodel can satisfy all the challenges. (3) With experimentson more than 10 millions of tweets with 8 millions of im-ages for 23 competing brands, we show that the proposedalgorithm is more successful for the topic modeling over oth-er candidate methods. We also quantitatively demonstratethe generalization ability of the proposed method for threeprediction tasks.
2. RELATED WORKOnline Market Intelligence. One of most closely re-
lated line of work to ours is online market intelligence [17],whose objective is, broadly speaking, to mine valuable infor-mation for companies from a wealth of consumer-generatedonline data. Due to vast varieties of markets, brands, and in-formation to mine, there have been many different directionsto address the problem as follows. As one of early successfulcommercial solutions, the BrandPluse platform [10] mon-itors consumers’ buzz phrases about brands, companies, orany emerging issues from public online data. In [15], market-structure perceptual maps are automatically created to showwhich brands are jointly discussed in consumers’ forums e-specially for the two categories of market, which are sedancars and diabetes drugs. The work of [24] focuses on extract-ing comparative relations from Amazon customer reviews,and visualize the comparative relation map (e.g . Nokia N95has a better camera than iPhone). The authors of [2] al-so leverage Amazon data to discover the relations between
product sales and review scores of each product feature (e.g .battery life, image quality, or memory for digital cameras).In [22], a recommendation system on the blogosphere is de-veloped to learn historical weblog posts of users, and pre-dict which users the companies need to follow when theyrelease new products. Our work has two distinctive featuresover existing research of this direction. First, we address anunexplored problem of detecting the latent topics that arecompetitively shared by multiple brands, and automaticallytracking their temporal evolution. Second, we jointly lever-age two complementary modalities, text and images, whichhave been rare in market intelligence research.
Topic Models for Econometrics. Lately, there havebeen significant efforts to develop generative topic modelsfor modeling and prediction of economic behaviors of userson the Web. In [8], a simple LDA model is applied to stockmarket data to detect the groups of companies that tend tomove together. The work of [11] proposes a new dynamictopic model to predict the temporal changes of consumers’interests and purchasing probabilities over catalog items. In[13], a geo-topic model is developed to learn the latent topic-s of users’ interests from location log data, and recommendnew location that are potentially interesting to users. Final-ly, [14, 19] are examples of topic models that are applied tothe tasks of opinion mining and sentiment analysis, in whichthey produce fine-grained sentiment analysis from user re-views or weblog posts. Compared to previous research ofthis direction, our problem of modeling market competitionof multiple brands is novel, and our model is also uniqueas an econometric topic model that jointly leverages onlinetexts and images.
Dynamic and Multi-view Topic Models. There hasbeen a large body of work to develop dynamic topic modelsto analyze data streams [8, 11, 13, 14, 19], and multi-viewtopic models to discover the interactions between text andimages in multimedia contests [4, 7, 9, 21]. Compared to ex-isting dynamic and multi-view topic models, our approachis unique in the ability of directly modeling the competitionof multiple entities (e.g . brands) over shared topic spaces.Since previous models cannot handle with the interactionsbetween multiple entities, they are only applicable to thedataset of each brand separately. However, in this case, thedetected topics can be different in each brand; thus it is dif-ficult to elicit shared topic spaces to model the competition.
3. A DYNAMIC MODEL FOR MARKETCOMPETITION
We first discuss how to represent online documents andassociated images, and then develop a generative model formarket competition.
3.1 Representation of Text and ImagesSuppose that we are interested in a set of competing brand-
s B = {1, . . . ,BL} in the same market (e.g . Chanel, Gucci,and Prada as luxury brands). We use Bl to denote a set ofdocuments (i.e. tweets) that are downloaded by queryingbrand name l in the time range of [1, T ]. We assume thateach document d ∈ Bl consists of text and optionally URLsthat are linked to images. That is, a tweet can be text on-ly or associated with one or multiple images. Some tweetsmay be associated with multiple brand labels, if they areretrieved multiple times by different brand names. We use a
𝜃𝑑𝜃𝑑
𝜑𝑘𝑡+1𝜑𝑘
𝑡
𝛽𝑘𝑡+1𝛽𝑘
𝑡
𝛾𝑘𝑡+1𝛾𝑘
𝑡
𝑡 = 1: 𝑇𝑘 = 1: 𝐾
𝑟𝑑𝑏
𝑔𝑑𝑏
𝑟𝑑𝑏
𝑔𝑑𝑏
𝑧𝑑𝑛
𝑤𝑑𝑛
𝑦𝑑𝑚
𝑣𝑑𝑚
𝑧𝑑𝑛
𝑢𝑑𝑛
𝑦𝑑𝑚
𝑣𝑑𝑚
𝑑 = 1:𝐷 𝑑 = 1:𝐷
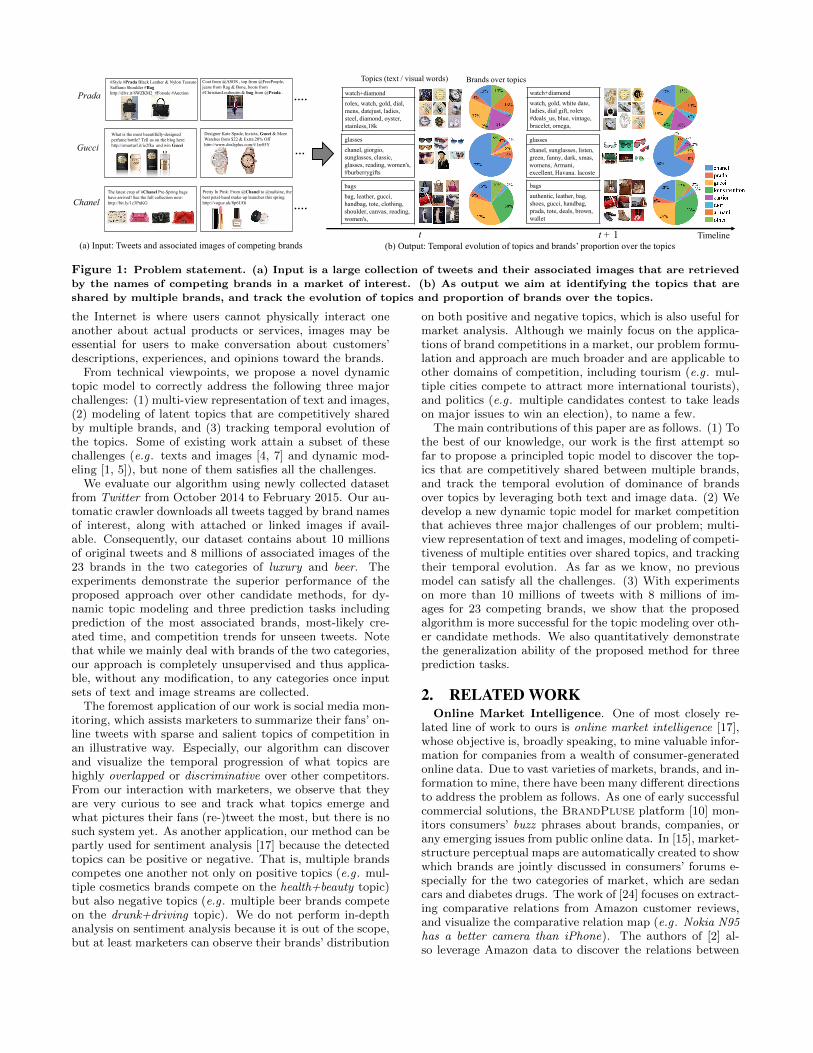
φtk Brand-topic occupation matrix at time t (∈ RK×L)βt/γt Topic distributions over text/visual words at time t
(∈ RK×G / RK×H ).θd Document code of document d (∈ RK).
zdn/ydm Word code of text/visual word n/m (∈ RK).wdn/vdm Occurrences of text/visual word n/m in document d.rdb Brand code of brand b in document d (∈ RK).gdb Indicator for each brand label b for document d.
Figure 2: Plate diagram for the proposed topic model
with a table of key random variables.
vector gd ∈ RL to denote which brands are associated withdocument d.
For the text descriptor, we use the TF-IDF weighted bag ofwords model [4], where we build a dictionary of text vocab-ularies after removing words occurred fewer than 50 times.For image descriptor, we leverage ImageNet pre-trained deeplearning features with vector quantization. Specifically, weuse Oxford VGG MatConvnet and utilize their pre-trainedmodel CNN-128 [20]1. which a compact 128-dimensional de-scriptor for each image. Then, we construct H visual clus-ters by applying K-means clustering to randomly sampled(at max) two millions of image descriptors. We assign ther-nearest visual clusters to each image with the weights ofan exponential function exp(−a2/2σ2) + ε, where a is thedistance between the descriptor and the visual cluster, σ isa spatial scale, and ε is a small positive value to prevent zerodenominator when normalization. Finally, each image is de-scribed by an H dimensional `-1 normalized vector with onlyr nonzero weights. In our experiments, we set H = 1, 024,σ = 10, and r = ‖u‖0 which is the `0-norm of its corre-sponding text descriptor, so that text and image descriptorshave the same number of nonzeros.
As a result, we can represent every document and imageas a vector. If we let U = {1, . . . , G} and V = {1, . . . , H}to denote sets of vocabularies for text and visual words re-spectively, each document d is represented by a pair of vec-tor (ud,vd), where ud = [ud1, · · · , ud|N|]T where N is theindex set of words in document d, and each udn(n ∈ N)represents the number of appearances of word n. Likewise,vd = [vd1, · · · , vd|M|]T where M is the index set of visualwords. If a document has multiple associated images, vd isrepresented by a vector sum of image descriptors. For a doc-ument with no associated image, vd becomes a null vectorand M is an empty set.
3.2 A Probabilistic Generative Process
1http://www.robots.ox.ac.uk/∼vgg/software/deep eval/.
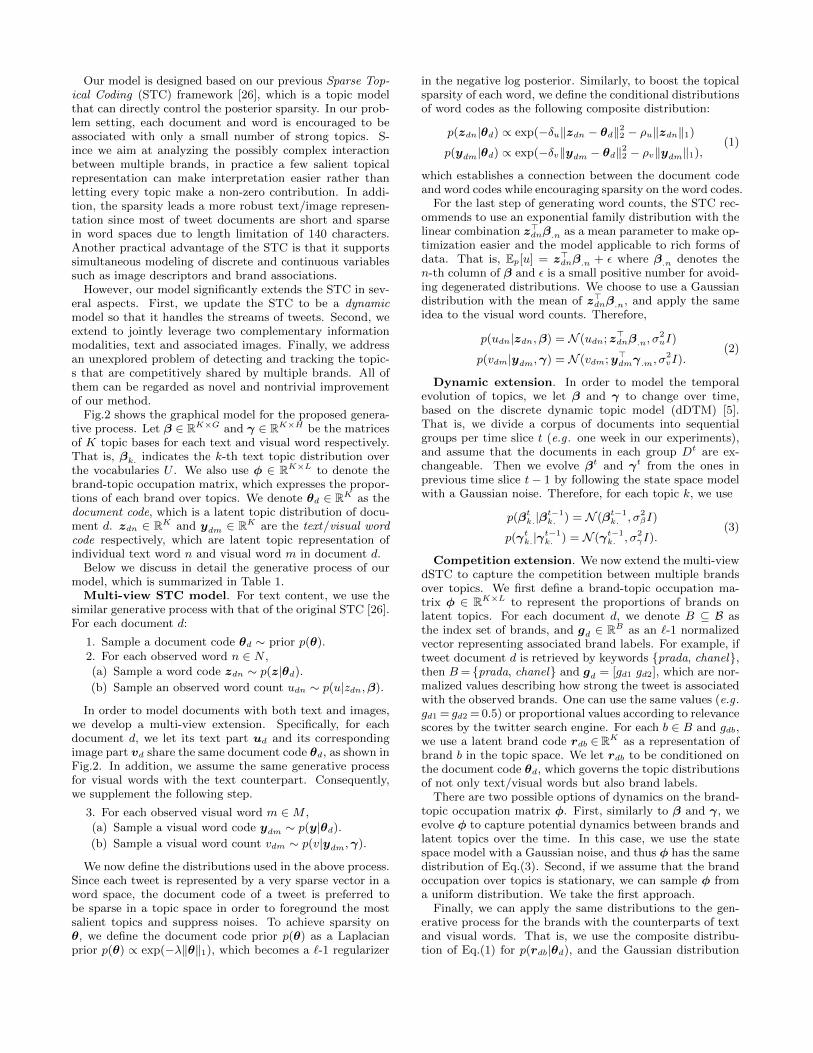
Our model is designed based on our previous Sparse Top-ical Coding (STC) framework [26], which is a topic modelthat can directly control the posterior sparsity. In our prob-lem setting, each document and word is encouraged to beassociated with only a small number of strong topics. S-ince we aim at analyzing the possibly complex interactionbetween multiple brands, in practice a few salient topicalrepresentation can make interpretation easier rather thanletting every topic make a non-zero contribution. In addi-tion, the sparsity leads a more robust text/image represen-tation since most of tweet documents are short and sparsein word spaces due to length limitation of 140 characters.Another practical advantage of the STC is that it supportssimultaneous modeling of discrete and continuous variablessuch as image descriptors and brand associations.
However, our model significantly extends the STC in sev-eral aspects. First, we update the STC to be a dynamicmodel so that it handles the streams of tweets. Second, weextend to jointly leverage two complementary informationmodalities, text and associated images. Finally, we addressan unexplored problem of detecting and tracking the topic-s that are competitively shared by multiple brands. All ofthem can be regarded as novel and nontrivial improvementof our method.
Fig.2 shows the graphical model for the proposed genera-tive process. Let β ∈ RK×G and γ ∈ RK×H be the matricesof K topic bases for each text and visual word respectively.That is, βk. indicates the k-th text topic distribution overthe vocabularies U . We also use φ ∈ RK×L to denote thebrand-topic occupation matrix, which expresses the propor-tions of each brand over topics. We denote θd ∈ RK as thedocument code, which is a latent topic distribution of docu-ment d. zdn ∈ RK and ydm ∈ RK are the text/visual wordcode respectively, which are latent topic representation ofindividual text word n and visual word m in document d.
Below we discuss in detail the generative process of ourmodel, which is summarized in Table 1.
Multi-view STC model. For text content, we use thesimilar generative process with that of the original STC [26].For each document d:
1. Sample a document code θd ∼ prior p(θ).2. For each observed word n ∈ N ,
(a) Sample a word code zdn ∼ p(z|θd).(b) Sample an observed word count udn ∼ p(u|zdn,β).
In order to model documents with both text and images,we develop a multi-view extension. Specifically, for eachdocument d, we let its text part ud and its correspondingimage part vd share the same document code θd, as shown inFig.2. In addition, we assume the same generative processfor visual words with the text counterpart. Consequently,we supplement the following step.
3. For each observed visual word m ∈M ,
(a) Sample a visual word code ydm ∼ p(y|θd).(b) Sample a visual word count vdm ∼ p(v|ydm,γ).
We now define the distributions used in the above process.Since each tweet is represented by a very sparse vector in aword space, the document code of a tweet is preferred tobe sparse in a topic space in order to foreground the mostsalient topics and suppress noises. To achieve sparsity onθ, we define the document code prior p(θ) as a Laplacianprior p(θ) ∝ exp(−λ‖θ‖1), which becomes a `-1 regularizer
in the negative log posterior. Similarly, to boost the topicalsparsity of each word, we define the conditional distributionsof word codes as the following composite distribution:
p(zdn|θd) ∝ exp(−δu‖zdn − θd‖22 − ρu‖zdn‖1)
p(ydm|θd) ∝ exp(−δv‖ydm − θd‖22 − ρv‖ydm‖1),
(1)
which establishes a connection between the document codeand word codes while encouraging sparsity on the word codes.
For the last step of generating word counts, the STC rec-ommends to use an exponential family distribution with thelinear combination z>dnβ.n as a mean parameter to make op-timization easier and the model applicable to rich forms ofdata. That is, Ep[u] = z>dnβ.n + ε where β.n denotes then-th column of β and ε is a small positive number for avoid-ing degenerated distributions. We choose to use a Gaussiandistribution with the mean of z>dnβ.n, and apply the sameidea to the visual word counts. Therefore,
p(udn|zdn,β) = N (udn;z>dnβ.n, σ2uI)
p(vdm|ydm,γ) = N (vdm;y>dmγ.m, σ2vI).
(2)
Dynamic extension. In order to model the temporalevolution of topics, we let β and γ to change over time,based on the discrete dynamic topic model (dDTM) [5].That is, we divide a corpus of documents into sequentialgroups per time slice t (e.g . one week in our experiments),and assume that the documents in each group Dt are ex-changeable. Then we evolve βt and γt from the ones inprevious time slice t− 1 by following the state space modelwith a Gaussian noise. Therefore, for each topic k, we use
p(βtk.|βt−1k. ) = N (βt−1
k. , σ2βI)
p(γtk.|γt−1k. ) = N (γt−1
k. , σ2γI).
(3)
Competition extension. We now extend the multi-viewdSTC to capture the competition between multiple brandsover topics. We first define a brand-topic occupation ma-trix φ ∈ RK×L to represent the proportions of brands onlatent topics. For each document d, we denote B ⊆ B asthe index set of brands, and gd ∈ RB as an `-1 normalizedvector representing associated brand labels. For example, iftweet document d is retrieved by keywords {prada, chanel},then B= {prada, chanel} and gd = [gd1 gd2], which are nor-malized values describing how strong the tweet is associatedwith the observed brands. One can use the same values (e.g .gd1 = gd2 = 0.5) or proportional values according to relevancescores by the twitter search engine. For each b ∈ B and gdb,we use a latent brand code rdb ∈RK as a representation ofbrand b in the topic space. We let rdb to be conditioned onthe document code θd, which governs the topic distributionsof not only text/visual words but also brand labels.
There are two possible options of dynamics on the brand-topic occupation matrix φ. First, similarly to β and γ, weevolve φ to capture potential dynamics between brands andlatent topics over the time. In this case, we use the statespace model with a Gaussian noise, and thus φ has the samedistribution of Eq.(3). Second, if we assume that the brandoccupation over topics is stationary, we can sample φ froma uniform distribution. We take the first approach.
Finally, we can apply the same distributions to the gen-erative process for the brands with the counterparts of textand visual words. That is, we use the composite distribu-tion of Eq.(1) for p(rdb|θd), and the Gaussian distribution
of Eq.(2) for p(gdb|rdb,φ). In summary,
p(rdb|θd) ∝ exp(−δb‖rdb − θd‖22 − ρb‖rdb‖1)
p(gdb|rdb,φ) = N (gdb; r>dbφ.b, σ
2bI)
p(φtk.|φt−1k. ) = N (φt−1
k. , σ2φI).
(4)
4. LEARNING AND INFERENCEIn this section, we describe the optimization for learning
and inference of the proposed model.
4.1 MAP FormulationThe generative process of Fig.2 provides a joint probabil-
ity for a document d in each time slice t:
p(θ,z,u,y,v, r, g|β,γ,φ) = p(θ)∏n∈N
p(zn|θ)p(un|zn,β)
∏m∈M
p(ym|γ)p(vm|ym,γ)∏b∈B
p(rb|φ)p(gb|rb,φ) (5)
If we add the superscript t to explicitly represent the timeslice for each variable, we can denote the parameter set as
follows: Θt = {θtd,ztd,ytd, rtd}Dt
d=1, where ztd = {ztdn}n∈Ntd,
ytd = {ytdm}m∈Mtd
and rtd = {rtdb}b∈Btd, where N t
d denotes
the word index set of document d in time slice t, and likewisefor M t
d and Btd. Although we skip the derivation due tospace limitation, it is not difficult to show the negative logposterior for time slice t satisfies
− log p(Θt,βt,γt,φt|{utd,vtd, gtd}Dt
d=1)
∝− log{p(Θt, {utd,vtd, gtd}Dt
d=1|βt,γt,φt).(6)
In the above, λ, {νi, δi, πi}3i=1 are hypeparameters, whichare chosen by cross validation in our experiments.
4.2 Parameter EstimationWe estimate the model parameters by minimizing the neg-
ative log posterior derived in previous section. Since Eq.(6)is the one for the documents in a single time slice t, we ac-cumulate the negative log posteriors of all time ranges, andseek for an optimal solution for the whole corpus of all timeslices. Therefore, the final objective is derived as
min{Θt,βt,γt,φt}Tt=1
T∑t=1
Dt∑d=1
λ‖θtd‖1 (7)
+T∑t=2
(π1‖βt − βt−1‖22 + π2‖γt − γt−1‖22 + π3‖φt − φt−1‖22)
+
T∑t=1
Dt∑d=1
∑n∈Nt
d
(ν1‖ztdn − θtd‖22 + ρ1‖ztdn‖1 + L(ztdn,βt))
+
T∑t=1
Dt∑d=1
∑m∈Mt
d
(ν2‖ytdm − θtd‖22 + ρ2‖ytdm‖1 + L(ytdm,γ
t))
+
T∑t=1
Dt∑d=1
∑b∈Bt
d
(ν3‖rtdb − θtd‖22 + ρ3‖rtdb‖1 + L(rtdb,φt))
s.t. θtd ≥ 0, ∀d, t. ztdn,ytdm, rtdb ≥ 0, ∀d, n,m, b, t.
βtk ∈ PU ,γtk ∈ PV ,φ
tk ∈ PB, ∀k, t,
where PU ,PV ,PB are the G − 1, H − 1 and L − 1 simplex,respectively (i.e. For ∀k, t, each of βtk,γ
tk and φtk should
For each time slice t:
1. Draw a text topic matrix βt|βt−1 ∼ N (βt−1, σ2βI).
2. Draw an image topic matrix γt|γt−1 ∼ N (γt−1, σ2γI).
3. Draw a brand topic matrix with two options: (i) dy-namic φt|φt−1 ∼ N (φt−1, σ2
φI), or (ii) independent
φt ∼ Unif (0, 1).
4. For each document d = (u,v) in Dt,
(a) Sample a document code θd ∼ prior p(θ).
(b) For each observed text word n ∈ N ,i. Sample a word code zdn ∼ p(zdn|θd).ii. Sample a word count udn ∼ p(u|zdn,β).
(c) If M is not an empty set:
i. For each observed visual word m ∈M ,
A. Sample a visual word code ydm ∼ p(ydm|θd).B. Sample a visual word count vdm ∼ p(v|ydm,γ).
(d) For each observed brand b ∈ B,
i. Sample a latent brand code rdb ∼ p(rdb|θd)ii. Sample a brand association gdb ∼ p(g|rdb,φ)
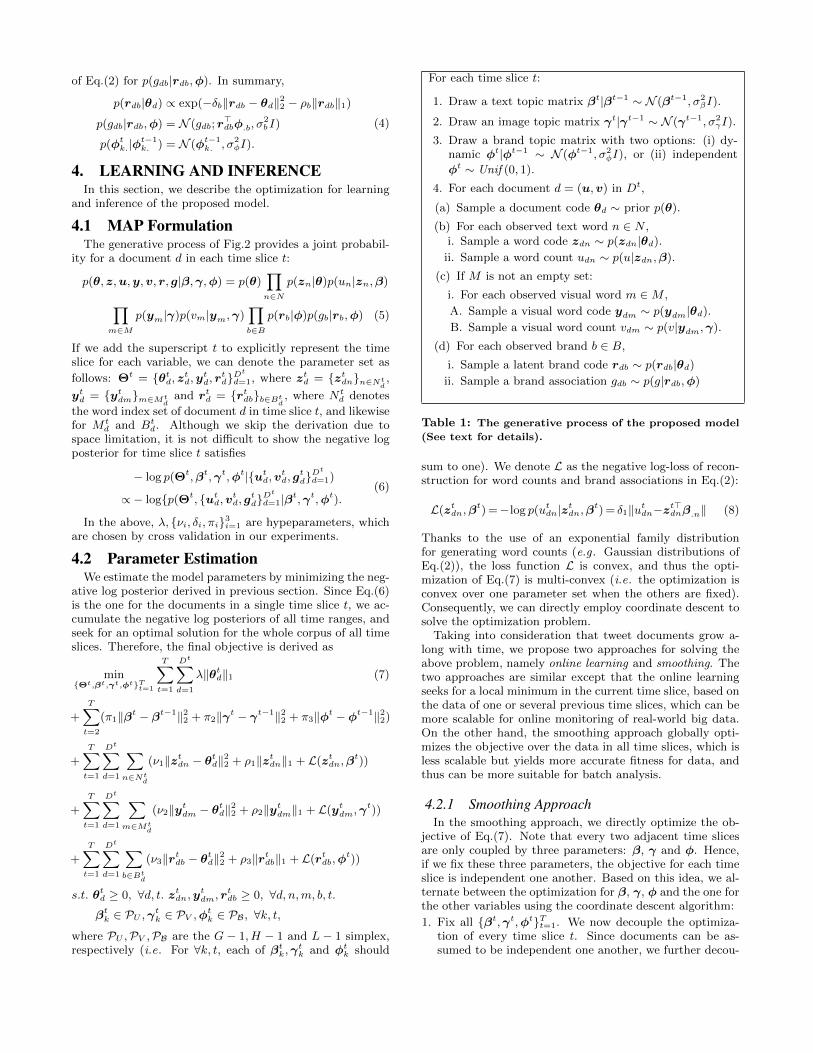
Table 1: The generative process of the proposed model
(See text for details).
sum to one). We denote L as the negative log-loss of recon-struction for word counts and brand associations in Eq.(2):
L(ztdn,βt) =−log p(utdn|ztdn,βt) = δ1‖utdn−zt>dnβ.n‖ (8)
Thanks to the use of an exponential family distributionfor generating word counts (e.g . Gaussian distributions ofEq.(2)), the loss function L is convex, and thus the opti-mization of Eq.(7) is multi-convex (i.e. the optimization isconvex over one parameter set when the others are fixed).Consequently, we can directly employ coordinate descent tosolve the optimization problem.
Taking into consideration that tweet documents grow a-long with time, we propose two approaches for solving theabove problem, namely online learning and smoothing. Thetwo approaches are similar except that the online learningseeks for a local minimum in the current time slice, based onthe data of one or several previous time slices, which can bemore scalable for online monitoring of real-world big data.On the other hand, the smoothing approach globally opti-mizes the objective over the data in all time slices, which isless scalable but yields more accurate fitness for data, andthus can be more suitable for batch analysis.
4.2.1 Smoothing ApproachIn the smoothing approach, we directly optimize the ob-
jective of Eq.(7). Note that every two adjacent time slicesare only coupled by three parameters: β, γ and φ. Hence,if we fix these three parameters, the objective for each timeslice is independent one another. Based on this idea, we al-ternate between the optimization for β, γ, φ and the one forthe other variables using the coordinate descent algorithm:
1. Fix all {βt,γt,φt}Tt=1. We now decouple the optimiza-tion of every time slice t. Since documents can be as-sumed to be independent one another, we further decou-
ple per document d. Therefore we solve
minθtd,zd,yd,rd
λ‖θtd‖1 (9)
+∑n∈Nt
d
(ν1‖ztdn − θtd‖22 + ρ1‖ztdn‖1 + L(ztdn,βt))
+∑m∈Mt
d
(ν2‖ytdm − θtd‖22 + ρ2‖ytdm‖1 + L(ytdn,γ
t))
+∑b∈Bt
d
(ν3‖rtdb − θtd‖22 + ρ3‖rtdb‖1 + L(rtdb,φt))
s.t. : θtd ≥ 0;ztdn,ytdn, r
tdb ≥ 0,∀n.
Note that for every document d ∈ Dt, if θd is fixed, zd,yd and rd are independent one another. Thus, we canuse the coordinate descent to alternatingly optimize θdand zd,yd, rd.
(a) While fixing θd, we solve each of zdn,ydm, rdb in-dependently, all of which have close-form solutions.Specifically, the solution for the kth element of ztdn
is ztdnk = max(0,utdnβ
tkn+σ1θ
tdk−β
tkn
∑j 6=k z
tdnjβ
tjn−
ρ12
βt2kn
+σ1),
where σ1 = 1.
(b) While fixing zd,yd, and rd, we solve the followingproblem to update θd:
minθtd
λ‖θtd‖1 +∑n∈Nt
d
ν1‖ztdn − θtd‖22 (10)
+∑m∈Mt
d
ν2‖ytdm − θtd‖22 +
∑b∈Bt
d
ν3‖rtdb − θtd‖22
s.t.θtd ≥ 0
The optimal θ of this problem is the truncated aver-age of ztdn,y
tdm, r
tdb [26]. We drop the term including
ytdm for the documents with no associated image.
2. While fixing all parameters of {Θt}Tt=1, we optimize
min{βt,γt,φt}Tt=1
T∑t=2
Dt∑d=1
∑n∈Nt
d
L(ztdn,βt) +
T∑t=2
π1‖βt − βt−1‖22
+T∑t=2
∑d∈Dt
∑m∈Mt
d
L(ytdm,γt) +
T∑t=2
π2‖γt − γt−1‖22
+
T∑t=2
∑d∈Dt
∑b∈Bt
d
L(rtdm,φt) +
T∑t=2
π3‖φt − φt−1‖22
s.t. βtk,γtk,φ
tk ∈ P, ∀k, t (11)
We can obtain the optimal of Eq.(11) by separately solv-ing {βt}Tt=1, {γt}Tt=1, {φt}Tt=1, because they are inde-pendent one another. When we solve each of them, forexample of {βt}Tt=1, we utilize the coordinated descentand the projected gradient descent, in which we solve ev-ery βt one by one for each t. That is, at every iterationwe fix all {βt}Tt=1 \βt, and use projected descent to solveβt. We iterate until convergence for every t.
4.2.2 Online Learning ApproachInstead of directly optimizing the objective of Eq.(7), the
online learning approach assumes that at every time t, we
only observe a new set of data at t, and have learned modelparameters from the data up to t − 1. This can be morepractical in a real-world scenario; we may not always glob-ally optimize using all the past data when we observed newdata. Instead we would better seek for a local minimal thatmay be good enough to reflect the current state of marketcompetition. Formally, we assume that at each t we onlyconsider its p previous time slices to form an evolving chain.To make our discussion easier, we set p = 1; however, it isnot difficult to derive the optimization solver for p > 1.
Given the optimization algorithm for smoothing approachin previous section, online learning optimization is readilystraightforward. At time slice t we assume that we are giv-en the MAP solutions up to t − 1, which are denoted by
βt−1
, γt−1, and φt−1
. We sample βt from the distribu-
tion p(βt|βt−1) as defined in Eq.(3). We do the same for
γt and φt as well. Once we have βt, γt, and φt, as dis-cussed in previous section, the objective of Eq.(7) for eachtime slice is independent one another. Thus, we can directlyapply the algorithm presented in previous section to solvethe decoupled objective in every time slice one by one alongwith time. At the start of the optimization, we initialize all{βt}Tt=1, {γt}Tt=1, {φt}Tt=1 using a uniform prior.
5. EXPERIMENTSWe evaluate our model from the following four aspects.
First, we qualitatively and quantitatively evaluate the qual-ity of learned text and visual topics (Section 5.2.1). Second,we show how our model can simultaneously monitor topicevolution and market competition along with time, com-pared to some baseline methods (Section 5.2.2). Third, wedesign three prediction methods based on our model, to showthe generalization power of our model for unseen documents(Section 5.3). Finally, we conduct internal comparisons andprovide some analysis on our model (Section 5.4).
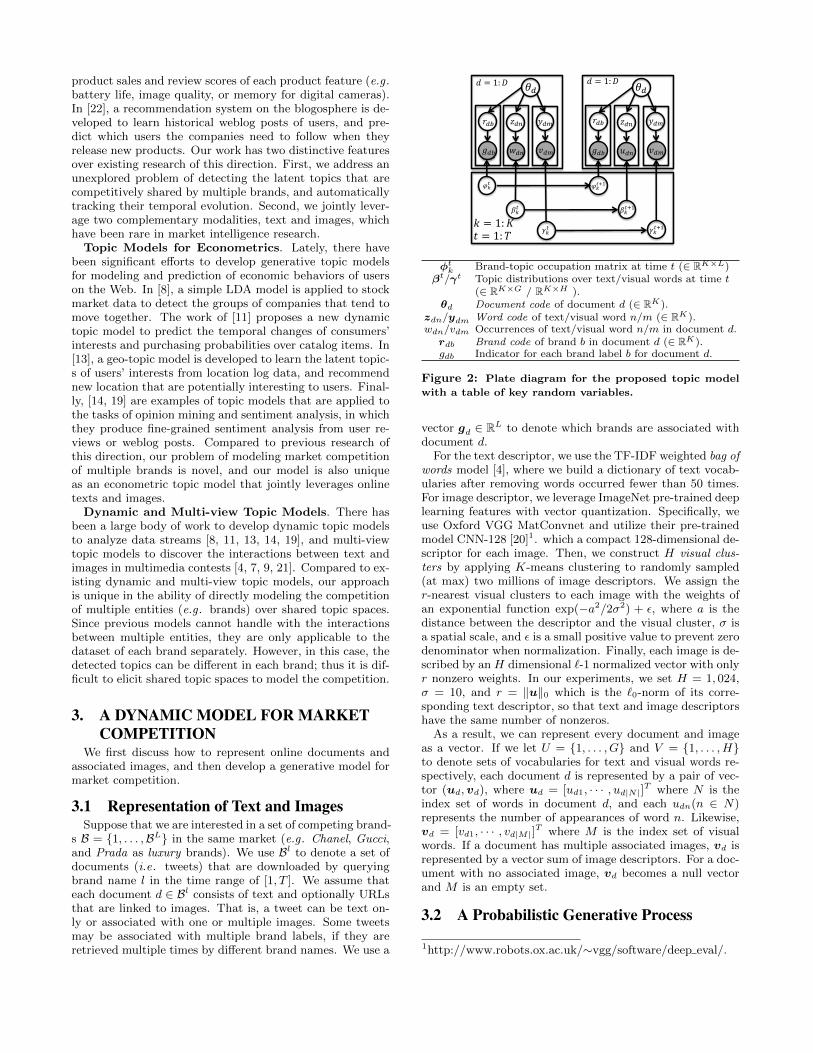
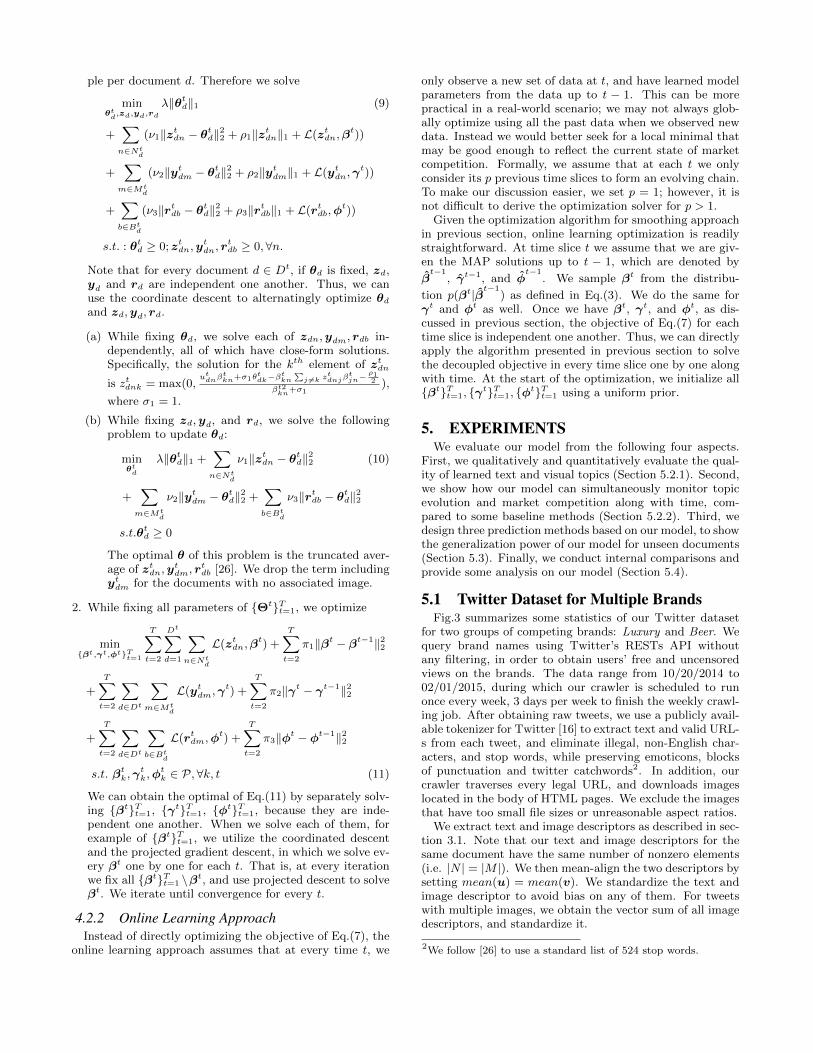
5.1 Twitter Dataset for Multiple BrandsFig.3 summarizes some statistics of our Twitter dataset
for two groups of competing brands: Luxury and Beer. Wequery brand names using Twitter’s RESTs API withoutany filtering, in order to obtain users’ free and uncensoredviews on the brands. The data range from 10/20/2014 to02/01/2015, during which our crawler is scheduled to runonce every week, 3 days per week to finish the weekly crawl-ing job. After obtaining raw tweets, we use a publicly avail-able tokenizer for Twitter [16] to extract text and valid URL-s from each tweet, and eliminate illegal, non-English char-acters, and stop words, while preserving emoticons, blocksof punctuation and twitter catchwords2. In addition, ourcrawler traverses every legal URL, and downloads imageslocated in the body of HTML pages. We exclude the imagesthat have too small file sizes or unreasonable aspect ratios.
We extract text and image descriptors as described in sec-tion 3.1. Note that our text and image descriptors for thesame document have the same number of nonzero elements(i.e. |N | = |M |). We then mean-align the two descriptors bysetting mean(u) = mean(v). We standardize the text andimage descriptor to avoid bias on any of them. For tweetswith multiple images, we obtain the vector sum of all imagedescriptors, and standardize it.
2We follow [26] to use a standard list of 524 stop words.
1 2 3 4 5 6 7 8 9 10 11 12 13
# o
f d
ocs
1# o
f d
ocs
wit
h i
mag
es#
im
ages
3
5
1
3
2
4
(x103)
(x104)
(x104)
2
0.5
1.5
2.5
1
3
2
0.5
1.5
2.5
Week(a) 1 2 3 4 5 6 7 8
# o
f d
ocs
1# o
f d
ocs
wit
h i
mag
es#
im
ages
3
5
0.5
1
1.5
2
0.5
1
1.5
2
2
4
(x104)
(x105)
(x105)
Week(b)
Figure 3: Statistics of our newly collected twitter dataset on the timeline. We report the numbers of (tweets, tweets
with images, images) from top to bottom. (a) The Beer corpus = (1,091,369, 231,318, 829,207) (b) The Luxury corpus
= (5,511,887, 935,903, 6,606,125).
Consequently, the Beer corpus involves 12 brands, yield-ing 1,101,192 raw tweets and 829,207 images. We builda dictionary of 12,488 text vocabulary words after remov-ing words occurred fewer than 50 times. Finally, we obtain1,091,369 valid tweet documents, out of which 231,318 tweet-s contain images as well. The Luxury corpus is much largerthan the beer corpus, including 5,572,017 raw tweets and6,606,125 images. Following the same preprocessing step,we obtain a dictionary of 36,023 words, and 5,511,887 tweetdocuments and 1,523,177 ones associated with images.
5.2 Model EvaluationIn this section, we evaluate the performance of topic de-
tection and tracking of our model, and demonstrate its ap-plication to the market competition monitoring.
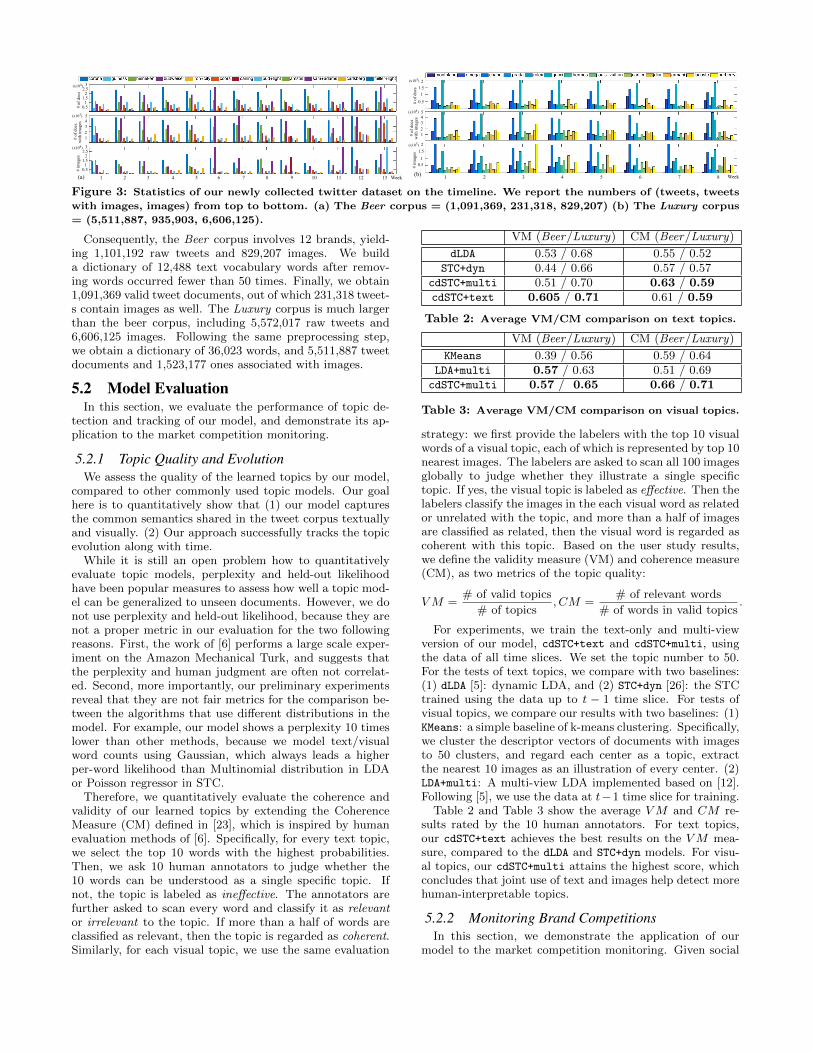
5.2.1 Topic Quality and EvolutionWe assess the quality of the learned topics by our model,
compared to other commonly used topic models. Our goalhere is to quantitatively show that (1) our model capturesthe common semantics shared in the tweet corpus textuallyand visually. (2) Our approach successfully tracks the topicevolution along with time.
While it is still an open problem how to quantitativelyevaluate topic models, perplexity and held-out likelihoodhave been popular measures to assess how well a topic mod-el can be generalized to unseen documents. However, we donot use perplexity and held-out likelihood, because they arenot a proper metric in our evaluation for the two followingreasons. First, the work of [6] performs a large scale exper-iment on the Amazon Mechanical Turk, and suggests thatthe perplexity and human judgment are often not correlat-ed. Second, more importantly, our preliminary experimentsreveal that they are not fair metrics for the comparison be-tween the algorithms that use different distributions in themodel. For example, our model shows a perplexity 10 timeslower than other methods, because we model text/visualword counts using Gaussian, which always leads a higherper-word likelihood than Multinomial distribution in LDAor Poisson regressor in STC.
Therefore, we quantitatively evaluate the coherence andvalidity of our learned topics by extending the CoherenceMeasure (CM) defined in [23], which is inspired by humanevaluation methods of [6]. Specifically, for every text topic,we select the top 10 words with the highest probabilities.Then, we ask 10 human annotators to judge whether the10 words can be understood as a single specific topic. Ifnot, the topic is labeled as ineffective. The annotators arefurther asked to scan every word and classify it as relevantor irrelevant to the topic. If more than a half of words areclassified as relevant, then the topic is regarded as coherent.Similarly, for each visual topic, we use the same evaluation
VM (Beer/Luxury) CM (Beer/Luxury)
dLDA 0.53 / 0.68 0.55 / 0.52STC+dyn 0.44 / 0.66 0.57 / 0.57
cdSTC+multi 0.51 / 0.70 0.63 / 0.59cdSTC+text 0.605 / 0.71 0.61 / 0.59
Table 2: Average VM/CM comparison on text topics.
VM (Beer/Luxury) CM (Beer/Luxury)
KMeans 0.39 / 0.56 0.59 / 0.64LDA+multi 0.57 / 0.63 0.51 / 0.69cdSTC+multi 0.57 / 0.65 0.66 / 0.71
Table 3: Average VM/CM comparison on visual topics.
strategy: we first provide the labelers with the top 10 visualwords of a visual topic, each of which is represented by top 10nearest images. The labelers are asked to scan all 100 imagesglobally to judge whether they illustrate a single specifictopic. If yes, the visual topic is labeled as effective. Then thelabelers classify the images in the each visual word as relatedor unrelated with the topic, and more than a half of imagesare classified as related, then the visual word is regarded ascoherent with this topic. Based on the user study results,we define the validity measure (VM) and coherence measure(CM), as two metrics of the topic quality:
VM =# of valid topics
# of topics, CM =
# of relevant words
# of words in valid topics.
For experiments, we train the text-only and multi-viewversion of our model, cdSTC+text and cdSTC+multi, usingthe data of all time slices. We set the topic number to 50.For the tests of text topics, we compare with two baselines:(1) dLDA [5]: dynamic LDA, and (2) STC+dyn [26]: the STCtrained using the data up to t − 1 time slice. For tests ofvisual topics, we compare our results with two baselines: (1)KMeans: a simple baseline of k-means clustering. Specifically,we cluster the descriptor vectors of documents with imagesto 50 clusters, and regard each center as a topic, extractthe nearest 10 images as an illustration of every center. (2)LDA+multi: A multi-view LDA implemented based on [12].Following [5], we use the data at t−1 time slice for training.
Table 2 and Table 3 show the average VM and CM re-sults rated by the 10 human annotators. For text topics,our cdSTC+text achieves the best results on the VM mea-sure, compared to the dLDA and STC+dyn models. For visu-al topics, our cdSTC+multi attains the highest score, whichconcludes that joint use of text and images help detect morehuman-interpretable topics.
5.2.2 Monitoring Brand CompetitionsIn this section, we demonstrate the application of our
model to the market competition monitoring. Given social
media data of multiple brands, our model can solve the fol-lowing three tasks, from easy to difficult: (1) At one timeslice, we monitor their occupations on latent topics. (2) A-long the timeline, we monitor the trend of each brand’s oc-cupation over the topics. (3) Along the timeline, we monitorthe global competition trends between multiple brands.
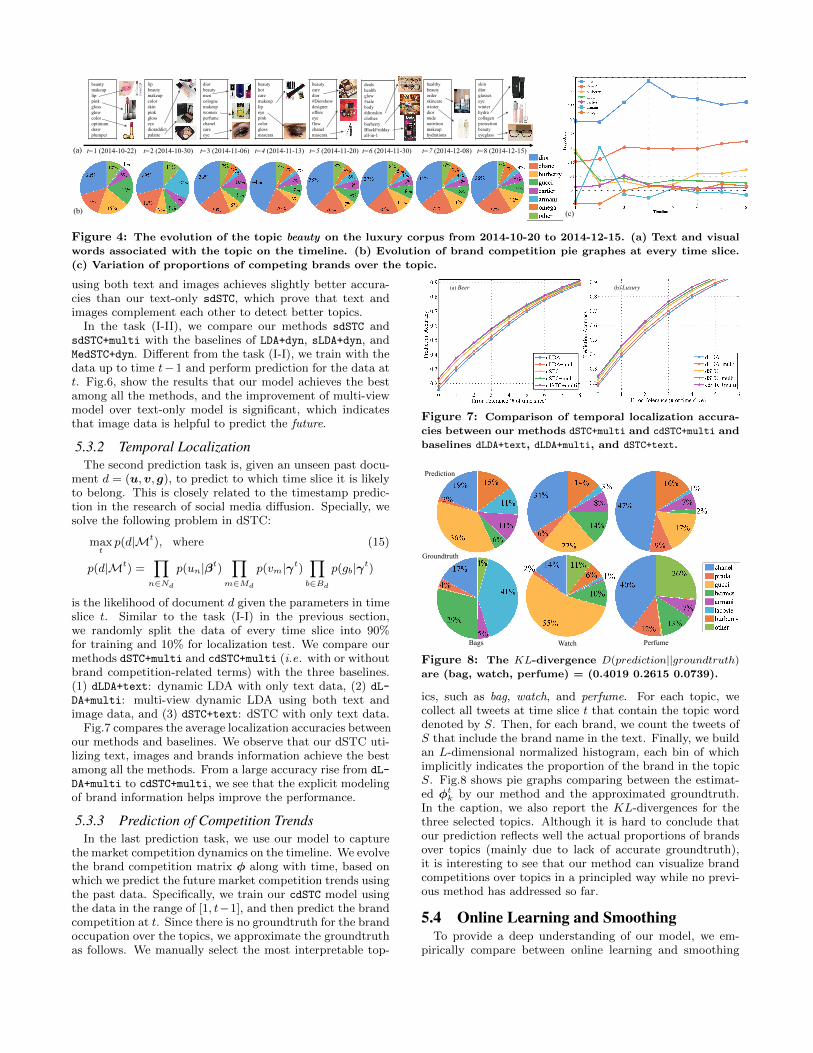
Fig.4 illustrates the evolving chain of topic beauty on theluxury corpus in eight time slices from 2014-10-20 to 2014-12-15. We also show the brand competition pie graphesand the trend curve of every brand occupation on the time-line. Our model successfully captures the topic dynamics;the beauty topic gradually evolves with time, from makeupand lip to blackfriday, order and deals, and finally steps in-to winter, involving more health-related words like skin-careand hydra-potection. The visual words also carry variationsalong with time, which are consistent with the text topics.The following eight pie graphes shows the competitions ofthe top seven brands on each time slice. We observe that(1) the dior dominates the beauty topic all the time andoverwhelm the gucci, which is the largest brand that occu-pies almost a half of our whole corpus, and (2) other brands(e.g . burberry, chanel, gucci) show dynamic up-and-downsover the topics along with the time, which can be usefulpieces of information for marketers.
5.3 Evaluation on PredictionWe further verify the generalization ability of the pro-
posed model through three prediction tasks. The first twotasks are classification problems, which have been tested forevaluation in many topic model papers (e.g . [4, 7, 25, 26]).The third task helps marketers compare between interpolat-ed trends and actual topic distribution side by side.
5.3.1 Prediction of Associated BrandsThe goal of the first prediction task is to estimate the most
associated brand for a novel tweet. Although this task canbe seen as a multi-class classification problem where a plen-ty of other methods can be applied, we perform this taskto prove the generalization power of our model on unseendata. For this prediction, we make two modifications to ourmodel. First, we drop the terms related to brand competi-tions, which are not required for classification. Second, wedevelop a supervised extension to be applicable to classifica-tion problems. We use the document code as the input of amulti-class max-margin classifier, and jointly train the laten-t representations and multi-class classifiers. The superviseddSTC (sdSTC) solves the following problem3:
min{Θt,Mt,ηt}Tt=1
T∑t=1
f(Θt,Mt, Dt) + CR(Θt,ηt) +1
2‖ηt‖22
s.t. θtd ≥ 0, ∀d, t. ztdn,ytdm ≥ 0, ∀d, n,m, t. (13)
βtk ∈ PU ,γtk ∈ PV , ∀k, t.
where Mt = {βt,γt} is a set of parameters, f(Θt,Mt, Dt)is the objective function for unsupervised dSTC in time slicet, and R is the multi-class hinge loss:
R(Θt,ηt) =1
|Dt|
Dt∑d=1
maxy
(∆(yd, y) + η>y θtd − η>ydθ
td) (14)
The above optimization problem can also be solved usingthe coordinated descent. Specifically, we alternate between
3Eq.(13) excludes brand competition terms such as φ and r.
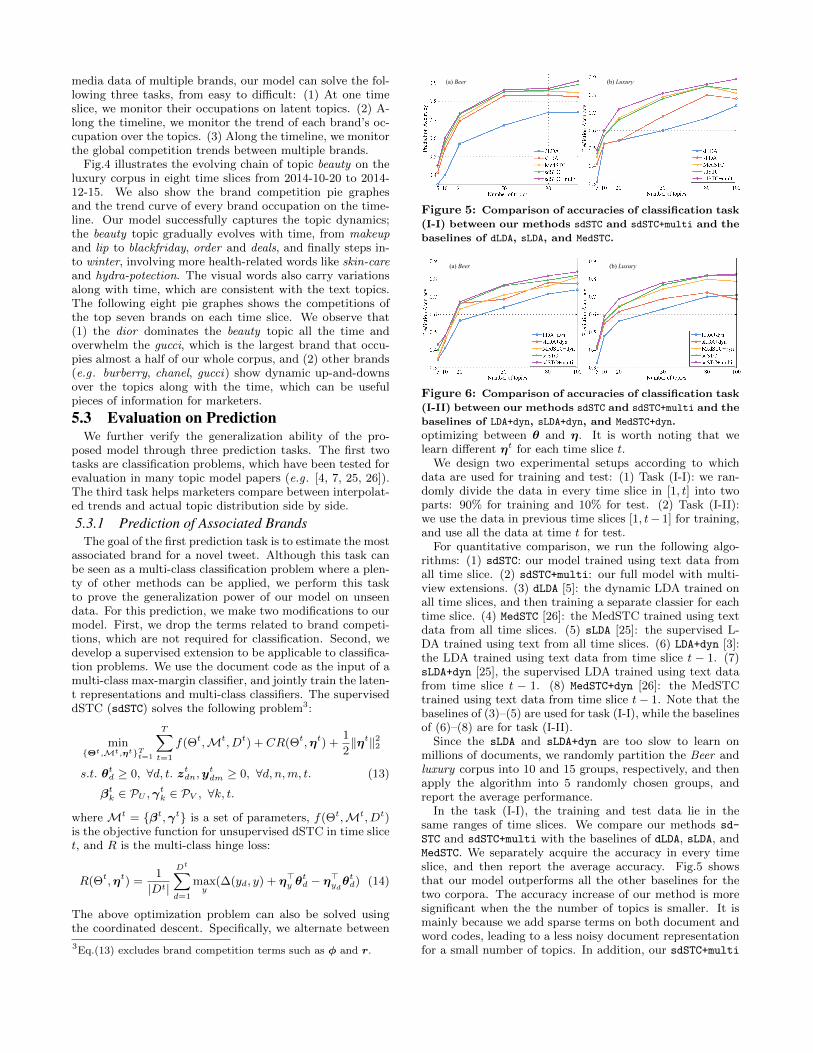
(a) Beer (b) Luxury
Figure 5: Comparison of accuracies of classification task
(I-I) between our methods sdSTC and sdSTC+multi and the
baselines of dLDA, sLDA, and MedSTC.
(a) Beer (b) Luxury
Figure 6: Comparison of accuracies of classification task
(I-II) between our methods sdSTC and sdSTC+multi and the
baselines of LDA+dyn, sLDA+dyn, and MedSTC+dyn.
optimizing between θ and η. It is worth noting that welearn different ηt for each time slice t.
We design two experimental setups according to whichdata are used for training and test: (1) Task (I-I): we ran-domly divide the data in every time slice in [1, t] into twoparts: 90% for training and 10% for test. (2) Task (I-II):we use the data in previous time slices [1, t− 1] for training,and use all the data at time t for test.
For quantitative comparison, we run the following algo-rithms: (1) sdSTC: our model trained using text data fromall time slice. (2) sdSTC+multi: our full model with multi-view extensions. (3) dLDA [5]: the dynamic LDA trained onall time slices, and then training a separate classier for eachtime slice. (4) MedSTC [26]: the MedSTC trained using textdata from all time slices. (5) sLDA [25]: the supervised L-DA trained using text from all time slices. (6) LDA+dyn [3]:the LDA trained using text data from time slice t − 1. (7)sLDA+dyn [25], the supervised LDA trained using text datafrom time slice t − 1. (8) MedSTC+dyn [26]: the MedSTCtrained using text data from time slice t− 1. Note that thebaselines of (3)–(5) are used for task (I-I), while the baselinesof (6)–(8) are for task (I-II).
Since the sLDA and sLDA+dyn are too slow to learn onmillions of documents, we randomly partition the Beer andluxury corpus into 10 and 15 groups, respectively, and thenapply the algorithm into 5 randomly chosen groups, andreport the average performance.
In the task (I-I), the training and test data lie in thesame ranges of time slices. We compare our methods sd-
STC and sdSTC+multi with the baselines of dLDA, sLDA, andMedSTC. We separately acquire the accuracy in every timeslice, and then report the average accuracy. Fig.5 showsthat our model outperforms all the other baselines for thetwo corpora. The accuracy increase of our method is moresignificant when the the number of topics is smaller. It ismainly because we add sparse terms on both document andword codes, leading to a less noisy document representationfor a small number of topics. In addition, our sdSTC+multi
beauty
makeup
lip
pink
gloss
glow
color
optimum
draw
plumper
lip
beauty
makeup
color
skin
pink
gloss
eye
dioraddict
palatte
dior
beauty
men
cologne
makeup
women
perfume
chanel
care
eye
beauty
hot
care
makeup
lip
eye
pink
color
gloss
mascara
healthy
beauty
order
skincare
winter
dior
nude
nutrition
makeup
hydrations
skin
dior
glasses
eye
winter
hydra
collagen
protection
beauty
eyeglass
t=1 (2014-10-22) t=2 (2014-10-30) t=3 (2014-11-06) t=4 (2014-11-13) t=5 (2014-11-20) t=6 (2014-11-30) t=7 (2014-12-08) t=8 (2014-12-15)
deals
health
glow
#sale
body
#diorskin
clothes
burberry
BlackFridday
all-in-1
beauty
care
dior
#Diorshow
designer
offers
eye
flow
chanel
mascara
(a)
(b) (c)
Figure 4: The evolution of the topic beauty on the luxury corpus from 2014-10-20 to 2014-12-15. (a) Text and visual
words associated with the topic on the timeline. (b) Evolution of brand competition pie graphes at every time slice.
(c) Variation of proportions of competing brands over the topic.
using both text and images achieves slightly better accura-cies than our text-only sdSTC, which prove that text andimages complement each other to detect better topics.
In the task (I-II), we compare our methods sdSTC andsdSTC+multi with the baselines of LDA+dyn, sLDA+dyn, andMedSTC+dyn. Different from the task (I-I), we train with thedata up to time t− 1 and perform prediction for the data att. Fig.6, show the results that our model achieves the bestamong all the methods, and the improvement of multi-viewmodel over text-only model is significant, which indicatesthat image data is helpful to predict the future.
5.3.2 Temporal LocalizationThe second prediction task is, given an unseen past docu-
ment d = (u,v, g), to predict to which time slice it is likelyto belong. This is closely related to the timestamp predic-tion in the research of social media diffusion. Specially, wesolve the following problem in dSTC:
maxtp(d|Mt), where (15)
p(d|Mt) =∏n∈Nd
p(un|βt)∏
m∈Md
p(vm|γt)∏b∈Bd
p(gb|γt)
is the likelihood of document d given the parameters in timeslice t. Similar to the task (I-I) in the previous section,we randomly split the data of every time slice into 90%for training and 10% for localization test. We compare ourmethods dSTC+multi and cdSTC+multi (i.e. with or withoutbrand competition-related terms) with the three baselines.(1) dLDA+text: dynamic LDA with only text data, (2) dL-
DA+multi: multi-view dynamic LDA using both text andimage data, and (3) dSTC+text: dSTC with only text data.
Fig.7 compares the average localization accuracies betweenour methods and baselines. We observe that our dSTC uti-lizing text, images and brands information achieve the bestamong all the methods. From a large accuracy rise from dL-
DA+multi to cdSTC+multi, we see that the explicit modelingof brand information helps improve the performance.
5.3.3 Prediction of Competition TrendsIn the last prediction task, we use our model to capture
the market competition dynamics on the timeline. We evolvethe brand competition matrix φ along with time, based onwhich we predict the future market competition trends usingthe past data. Specifically, we train our cdSTC model usingthe data in the range of [1, t−1], and then predict the brandcompetition at t. Since there is no groundtruth for the brandoccupation over the topics, we approximate the groundtruthas follows. We manually select the most interpretable top-
(a) Beer (b) Luxury
Figure 7: Comparison of temporal localization accura-
cies between our methods dSTC+multi and cdSTC+multi and
baselines dLDA+text, dLDA+multi, and dSTC+text.
Groundtruth
Prediction
Bags PerfumeWatch
Figure 8: The KL-divergence D(prediction||groundtruth)
are (bag, watch, perfume) = (0.4019 0.2615 0.0739).
ics, such as bag, watch, and perfume. For each topic, wecollect all tweets at time slice t that contain the topic worddenoted by S. Then, for each brand, we count the tweets ofS that include the brand name in the text. Finally, we buildan L-dimensional normalized histogram, each bin of whichimplicitly indicates the proportion of the brand in the topicS. Fig.8 shows pie graphs comparing between the estimat-ed φtk by our method and the approximated groundtruth.In the caption, we also report the KL-divergences for thethree selected topics. Although it is hard to conclude thatour prediction reflects well the actual proportions of brandsover topics (mainly due to lack of accurate groundtruth),it is interesting to see that our method can visualize brandcompetitions over topics in a principled way while no previ-ous method has addressed so far.
5.4 Online Learning and SmoothingTo provide a deep understanding of our model, we em-
pirically compare between online learning and smoothing
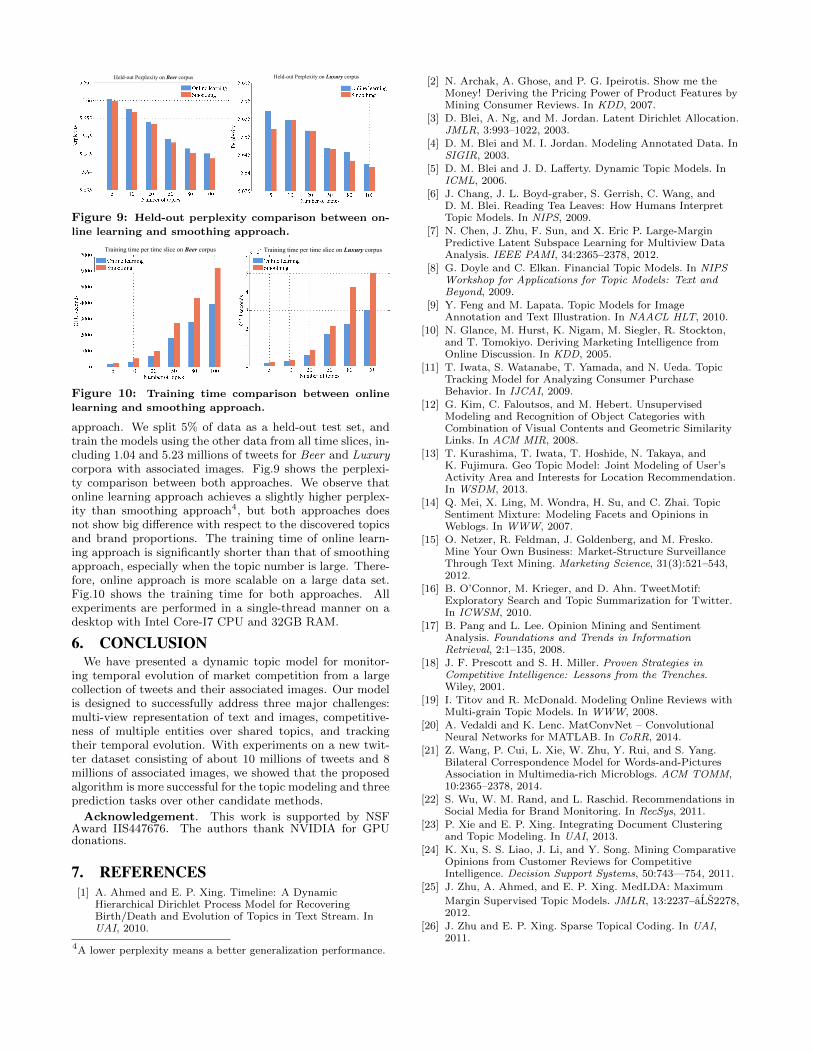
Held-out Perplexity on Beer corpus Held-out Perplexity on Luxury corpus
Figure 9: Held-out perplexity comparison between on-
line learning and smoothing approach.
Training time per time slice on Beer corpus Training time per time slice on Luxury corpus
Figure 10: Training time comparison between online
learning and smoothing approach.
approach. We split 5% of data as a held-out test set, andtrain the models using the other data from all time slices, in-cluding 1.04 and 5.23 millions of tweets for Beer and Luxurycorpora with associated images. Fig.9 shows the perplexi-ty comparison between both approaches. We observe thatonline learning approach achieves a slightly higher perplex-ity than smoothing approach4, but both approaches doesnot show big difference with respect to the discovered topicsand brand proportions. The training time of online learn-ing approach is significantly shorter than that of smoothingapproach, especially when the topic number is large. There-fore, online approach is more scalable on a large data set.Fig.10 shows the training time for both approaches. Allexperiments are performed in a single-thread manner on adesktop with Intel Core-I7 CPU and 32GB RAM.
6. CONCLUSIONWe have presented a dynamic topic model for monitor-
ing temporal evolution of market competition from a largecollection of tweets and their associated images. Our modelis designed to successfully address three major challenges:multi-view representation of text and images, competitive-ness of multiple entities over shared topics, and trackingtheir temporal evolution. With experiments on a new twit-ter dataset consisting of about 10 millions of tweets and 8millions of associated images, we showed that the proposedalgorithm is more successful for the topic modeling and threeprediction tasks over other candidate methods.
Acknowledgement. This work is supported by NSFAward IIS447676. The authors thank NVIDIA for GPUdonations.
7. REFERENCES[1] A. Ahmed and E. P. Xing. Timeline: A Dynamic
Hierarchical Dirichlet Process Model for RecoveringBirth/Death and Evolution of Topics in Text Stream. InUAI, 2010.
4A lower perplexity means a better generalization performance.
[2] N. Archak, A. Ghose, and P. G. Ipeirotis. Show me theMoney! Deriving the Pricing Power of Product Features byMining Consumer Reviews. In KDD, 2007.
[3] D. Blei, A. Ng, and M. Jordan. Latent Dirichlet Allocation.JMLR, 3:993–1022, 2003.
[4] D. M. Blei and M. I. Jordan. Modeling Annotated Data. InSIGIR, 2003.
[5] D. M. Blei and J. D. Lafferty. Dynamic Topic Models. InICML, 2006.
[6] J. Chang, J. L. Boyd-graber, S. Gerrish, C. Wang, andD. M. Blei. Reading Tea Leaves: How Humans InterpretTopic Models. In NIPS, 2009.
[7] N. Chen, J. Zhu, F. Sun, and X. Eric P. Large-MarginPredictive Latent Subspace Learning for Multiview DataAnalysis. IEEE PAMI, 34:2365–2378, 2012.
[8] G. Doyle and C. Elkan. Financial Topic Models. In NIPSWorkshop for Applications for Topic Models: Text andBeyond, 2009.
[9] Y. Feng and M. Lapata. Topic Models for ImageAnnotation and Text Illustration. In NAACL HLT, 2010.
[10] N. Glance, M. Hurst, K. Nigam, M. Siegler, R. Stockton,and T. Tomokiyo. Deriving Marketing Intelligence fromOnline Discussion. In KDD, 2005.
[11] T. Iwata, S. Watanabe, T. Yamada, and N. Ueda. TopicTracking Model for Analyzing Consumer PurchaseBehavior. In IJCAI, 2009.
[12] G. Kim, C. Faloutsos, and M. Hebert. UnsupervisedModeling and Recognition of Object Categories withCombination of Visual Contents and Geometric SimilarityLinks. In ACM MIR, 2008.
[13] T. Kurashima, T. Iwata, T. Hoshide, N. Takaya, andK. Fujimura. Geo Topic Model: Joint Modeling of User’sActivity Area and Interests for Location Recommendation.In WSDM, 2013.
[14] Q. Mei, X. Ling, M. Wondra, H. Su, and C. Zhai. TopicSentiment Mixture: Modeling Facets and Opinions inWeblogs. In WWW, 2007.
[15] O. Netzer, R. Feldman, J. Goldenberg, and M. Fresko.Mine Your Own Business: Market-Structure SurveillanceThrough Text Mining. Marketing Science, 31(3):521–543,2012.
[16] B. O’Connor, M. Krieger, and D. Ahn. TweetMotif:Exploratory Search and Topic Summarization for Twitter.In ICWSM, 2010.
[17] B. Pang and L. Lee. Opinion Mining and SentimentAnalysis. Foundations and Trends in InformationRetrieval, 2:1–135, 2008.
[18] J. F. Prescott and S. H. Miller. Proven Strategies inCompetitive Intelligence: Lessons from the Trenches.Wiley, 2001.
[19] I. Titov and R. McDonald. Modeling Online Reviews withMulti-grain Topic Models. In WWW, 2008.
[20] A. Vedaldi and K. Lenc. MatConvNet – ConvolutionalNeural Networks for MATLAB. In CoRR, 2014.
[21] Z. Wang, P. Cui, L. Xie, W. Zhu, Y. Rui, and S. Yang.Bilateral Correspondence Model for Words-and-PicturesAssociation in Multimedia-rich Microblogs. ACM TOMM,10:2365–2378, 2014.
[22] S. Wu, W. M. Rand, and L. Raschid. Recommendations inSocial Media for Brand Monitoring. In RecSys, 2011.
[23] P. Xie and E. P. Xing. Integrating Document Clusteringand Topic Modeling. In UAI, 2013.
[24] K. Xu, S. S. Liao, J. Li, and Y. Song. Mining ComparativeOpinions from Customer Reviews for CompetitiveIntelligence. Decision Support Systems, 50:743—754, 2011.
[25] J. Zhu, A. Ahmed, and E. P. Xing. MedLDA: Maximum
Margin Supervised Topic Models. JMLR, 13:2237–aLS2278,2012.
[26] J. Zhu and E. P. Xing. Sparse Topical Coding. In UAI,2011.