Embed Size (px)
Citation preview
Dynamic Stress Analysis of the effect of an Air Blast Wave on a Stainless Steel
Plate
by
Brian Cabello
A Project Submitted to the Graduate
Faculty of Rensselaer Polytechnic Institute
in Partial Fulfillment of the
Requirements for the degree of
MASTER OF MECHANICAL ENGINEERING
Approved:
_________________________________________
Professor Ernesto Gutierrez-Miravete, Project Adviser
Rensselaer Polytechnic Institute
Hartford, Connecticut
May, 2011

© Copyright 2011
by
Brian Cabello
All Rights Reserved
i
CONTENTS
LIST OF SYMBOLS ..................................................................................................................... ii
LIST OF FIGURES ...................................................................................................................... iii
ABSTRACT .................................................................................................................................... 1
1 INTRODUCTION/BACKGROUND ....................................................................................... 2
2 PROBLEM DESCRIPTION .................................................................................................... 3
2.1 AIR BLAST WAVES ....................................................................................................... 3
2.1.1 DETONATIONS ...................................................................................................... 3
2.1.2 AIR BLAST WAVES ............................................................................................. 4
2.1.3 PRESSURE-TIME DISTRIBUTION ..................................................................... 5
2.1.4 MAXIMUM/MINIMUM PRESSURE..................................................................... 6
2.1.5 IMPULSE ................................................................................................................. 7
2.1.6 NEGATIVE PHASE ................................................................................................ 7
2.1.7 WAVE FORM PARAMETER ................................................................................. 8
2.1.8 SHOCK FRONT VELOCITY ................................................................................. 9
2.1.9 SPECIFIC HEAT RATIO ........................................................................................ 9
2.2 TNT-METHOD .................................................................................................................. 9
2.3 COMPUTATIONAL METHODS ................................................................................... 12
3 METHODOLOGY/APPROACH........................................................................................... 13
3.1 ABAQUS MODELING APPROACHES AND TECHNIQUES .................................... 14
3.2 ANALSIS TYPES ........................................................................................................... 15
3.3 MATERIAL MODEL ..................................................................................................... 15
4 DISCUSSION ........................................................................................................................ 16
5 CONCLUSIONS .................................................................................................................... 18
6 REFERENCES ....................................................................................................................... 19
7 APPENDIX ................................................................................................................ 20
ii
LIST OF SYMBOLS
Symbol Eng. Unit Description
r meter Radius of explosion
W, WTNT kg TNT equivalent of the explosion
WHC kg Mass of hydrocarbons
ta sec The arrival time
td sec The positive phase duration
tn, tneg sec The duration of the negative phase
pmax Pa The peak overpressure
p0 Pa The reference pressure
pmin Pa The maximum negative pressure
pr Pa The reflected overpressure
γ N/A Ratio of specific heat of air
d meter Distance of the centre of the charge
I Pa-sec Impulse of the air blast wave
u m/sec Shock front velocity
c0 m/sec Sound velocity
cp kJ/kg K Specific heat at constant pressure
cv kJ/kg K Specific heat at constant volume
V m3
Total volume of the congested region
εp
N/A Effective plastic strain
TH Kelvin Homologous Temperature
iii
LIST OF FIGURES
Figure 1.0 Blast wave propagation
Figure 2.0 Pressure-time curve for a free air blast wave
Figure 3.0 Model of Kingery [4] with scaled distances
Figure 4.0 Different parameters for the negative phase
Figure 5.0 Peak explosion pressure (side-on) vs. distance for TNT ground burst
Figure 6.0 Peak explosion pressure (side-on) vs. distance for TNT equivalent method
Figure 7.0 Plate Boundary Condition
Figure 8.0 Blast Source
Figure 9.0 Element Mesh
Figure 10.0 Displacement of Top/Bottom Center Surface for Various Weight Charge
Figure 11.0 0.5kg TNT Charge at 1.5 millsec
Figure 12.0 1.0kg TNT Charge at 1.5 millsec
Figure 13.0 2.0kg TNT Charge at 1.5 millsec
Figure 14.0 3.0kg TNT Charge at 1.5 millsec
iv
KEYWORDS
Blast Wave
Detonations
Pressure Time Distribution
Impulse
Negative Phase
Shock Front Velocity
TNT Method
Abaqus
Finite Element Method
Dynamic stress analysis
CONWEP
Johnson-Cook Flow Stress Model
0
ABSTRACT
In this report I analyzed the effect of a blast loading on a Stainless Steel Plate. The
Dynamic analysis was performed using the Abaqus explicit finite element program. Solutions
were computed up to 1.5 milliseconds, where no further permanent deformation was observed
for all load values. The modeling of the blast was implemented using the blast modeling
software CONWEP (Conventional Weapons Effects), which is an empirically based loading
model within Abaqus. The report identified key areas needed for the modeling a CONWEP blast
load. The property of the blast load was specified using the incident wave interaction property
and the CONWEP charge property at the model level and the incident wave interaction at the
step level. The different weight charges used for the analysis were 0.5, 1, 2, and 3 kg TNT. The
Johnson-Cook flow stress model was used for the computation of the deformation due to the
impulse loading produced by the explosive detonation. Plots were created to show maximum
deflection of the plate under these loads. Calculations show that the Stainless Steel plate was
permanently deformed with 1, 2, 3 kg TNT charges but that it withstood elastically the 0.5 kg
TNT.
1
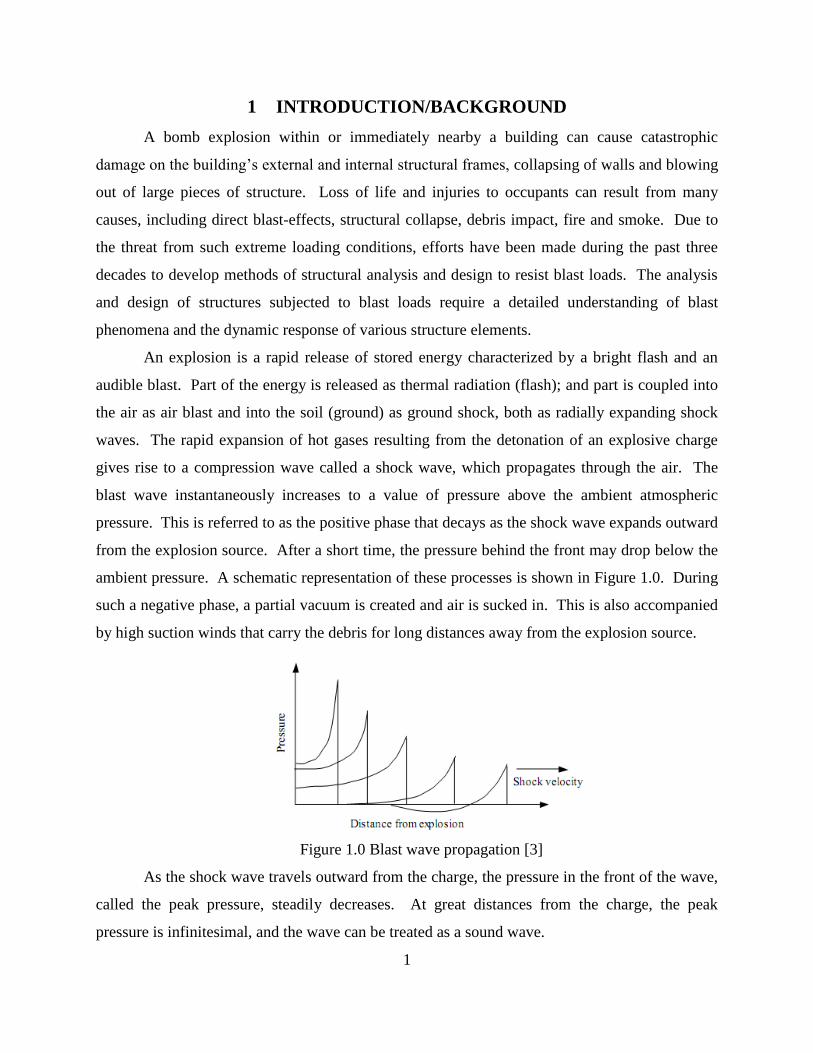
1 INTRODUCTION/BACKGROUND
A bomb explosion within or immediately nearby a building can cause catastrophic
damage on the building’s external and internal structural frames, collapsing of walls and blowing
out of large pieces of structure. Loss of life and injuries to occupants can result from many
causes, including direct blast-effects, structural collapse, debris impact, fire and smoke. Due to
the threat from such extreme loading conditions, efforts have been made during the past three
decades to develop methods of structural analysis and design to resist blast loads. The analysis
and design of structures subjected to blast loads require a detailed understanding of blast
phenomena and the dynamic response of various structure elements.
An explosion is a rapid release of stored energy characterized by a bright flash and an
audible blast. Part of the energy is released as thermal radiation (flash); and part is coupled into
the air as air blast and into the soil (ground) as ground shock, both as radially expanding shock
waves. The rapid expansion of hot gases resulting from the detonation of an explosive charge
gives rise to a compression wave called a shock wave, which propagates through the air. The
blast wave instantaneously increases to a value of pressure above the ambient atmospheric
pressure. This is referred to as the positive phase that decays as the shock wave expands outward
from the explosion source. After a short time, the pressure behind the front may drop below the
ambient pressure. A schematic representation of these processes is shown in Figure 1.0. During
such a negative phase, a partial vacuum is created and air is sucked in. This is also accompanied
by high suction winds that carry the debris for long distances away from the explosion source.
Figure 1.0 Blast wave propagation [3]
As the shock wave travels outward from the charge, the pressure in the front of the wave,
called the peak pressure, steadily decreases. At great distances from the charge, the peak
pressure is infinitesimal, and the wave can be treated as a sound wave.
2
2 PROBLEM DESCRIPTION
This project will focus on the analysis of how different blast loading (shock wave) affects
a plate of High Ductility Stainless Steel Alloy (Al-6XN). The specimen will consist of a 0.305
m x 0.305 m x 0.061 m plate. The solid plate is modeled with three-dimensional continuum
elements and is subjected to CONWEP blast loading [12] using different charge masses (0.5, 1, 2
and 3 kg TNT).
2.1 Air Blast Waves
2.1.1 Detonations
Explosions can be distinguished in detonations and deflagrations. The difference
between detonations and deflagrations is the velocity of the reaction zone in the explosive.
Deflagrations have a slower reaction zone than the sound speed. Examples for deflagrations are
the burning of gas-air-mixtures and slow explosives like gun powder.
Detonations have a faster reaction zone than the sound speed. The most common explosives
react with detonations.
To compare different explosive the TNT equivalent can be used. The TNT equivalent is
a method for quantifying the energy released in the detonation of an explosive substance, by
comparing it to that of an equal quantity of TNT. It is known that 1 kg TNT releases the energy
of 4.520x10⁶ J.
The effects of an explosion can be distinguished in three ranges:
Contact detonation: The explosive is in contact with the loaded material. The load-time
function depends on the loaded material, which, in most cases, is destroyed.
Occurrences are the blasting of concrete (demolition etc.) or terrorist attacks where the
explosive is located directly on the structure.
Near zone of the explosion: In most cases the material is also directly damaged like in the
contact zone.
Far zone. The blast wave resulting from the detonation dominates the effects on humans
and structures.
The size of all these zones depends on the quantity of the explosive charge.
3
Additional parameters for a detonation, depending on the size of the explosive, can be defined.
For example, the radius in which debris from the explosion (not from the blast wave) are
possible is give by Kinney [5] as
3
1
45Wr (1)
Where, r is expressed in m and W is the TNT equivalent of the explosive in kg.
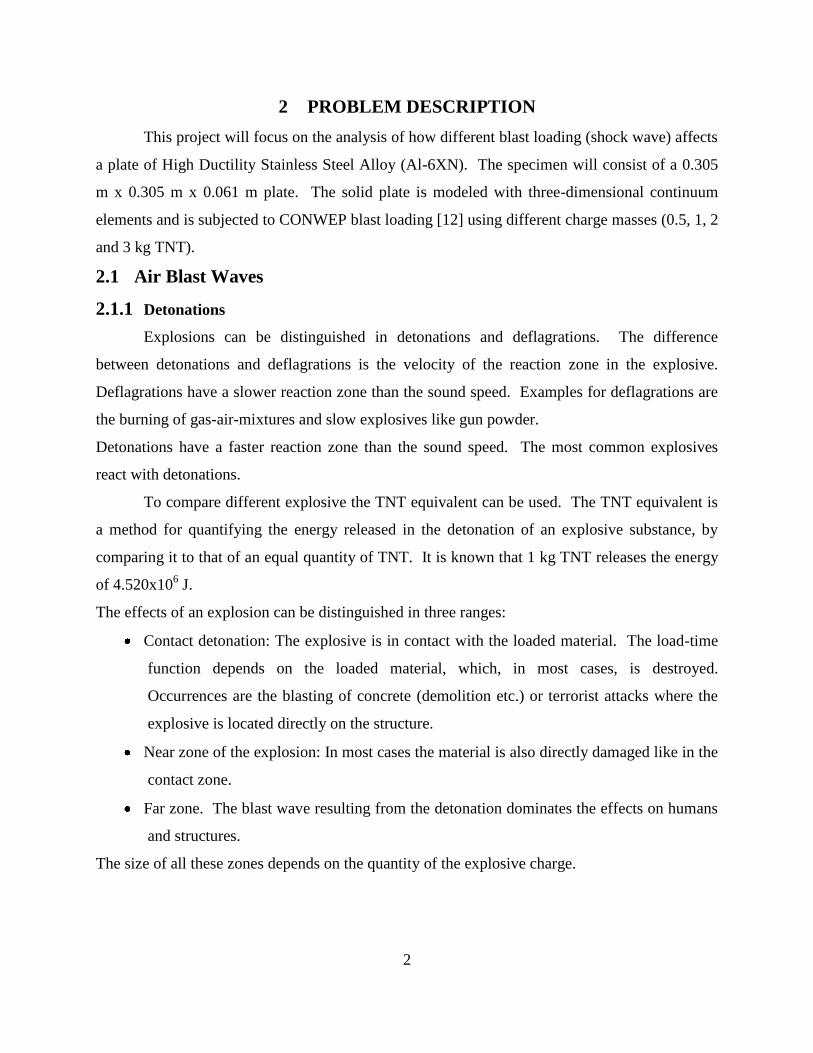
2.1.2 Air Blast Waves
The pressure that arrives at a certain point depends on the distance and on the size of the
explosive.
Figure 2.0 Pressure-time curve for a free air blast wave [5]
The main characteristics of the development of this pressure wave are the following:
The arrival time ta of the shock wave to the point under consideration. This includes the
time of the detonation wave to propagate through the explosive charge.
The peak overpressure pmax – The pressure attains its maximum very fast (extremely short
rise-time), and then starts decreasing until it reaches the reference pressure p0 (in most
cases the normal atmospheric pressure).
The positive phase duration td, which is the time for reaching the reference pressure.
After this point the pressure drops below the reference pressure until the maximum
negative pressure pmin. The duration of the negative phase is denoted as tn.
The incident overpressure impulse, which is the integral of the overpressure curve over
the positive phase td.
4
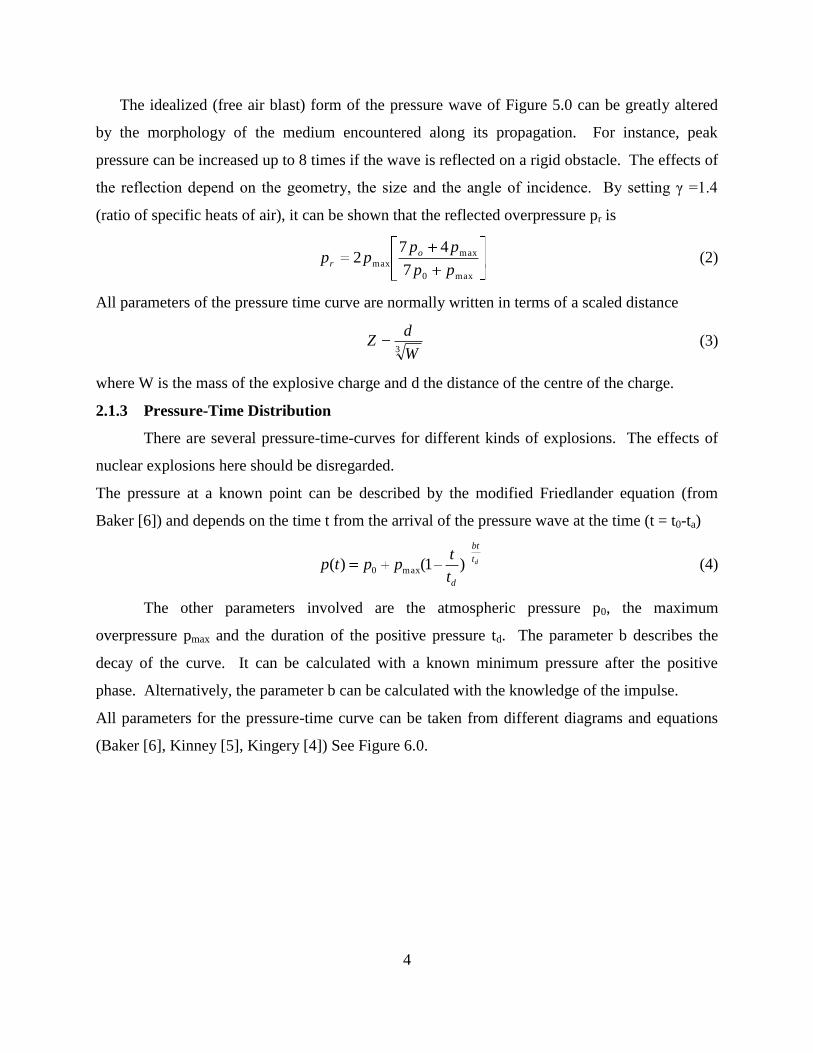
The idealized (free air blast) form of the pressure wave of Figure 5.0 can be greatly altered
by the morphology of the medium encountered along its propagation. For instance, peak
pressure can be increased up to 8 times if the wave is reflected on a rigid obstacle. The effects of
the reflection depend on the geometry, the size and the angle of incidence. By setting γ =1.4
(ratio of specific heats of air), it can be shown that the reflected overpressure pr is
max0
max
max7
472
pp
pppp o
r (2)
All parameters of the pressure time curve are normally written in terms of a scaled distance
3 W
dZ (3)
where W is the mass of the explosive charge and d the distance of the centre of the charge.
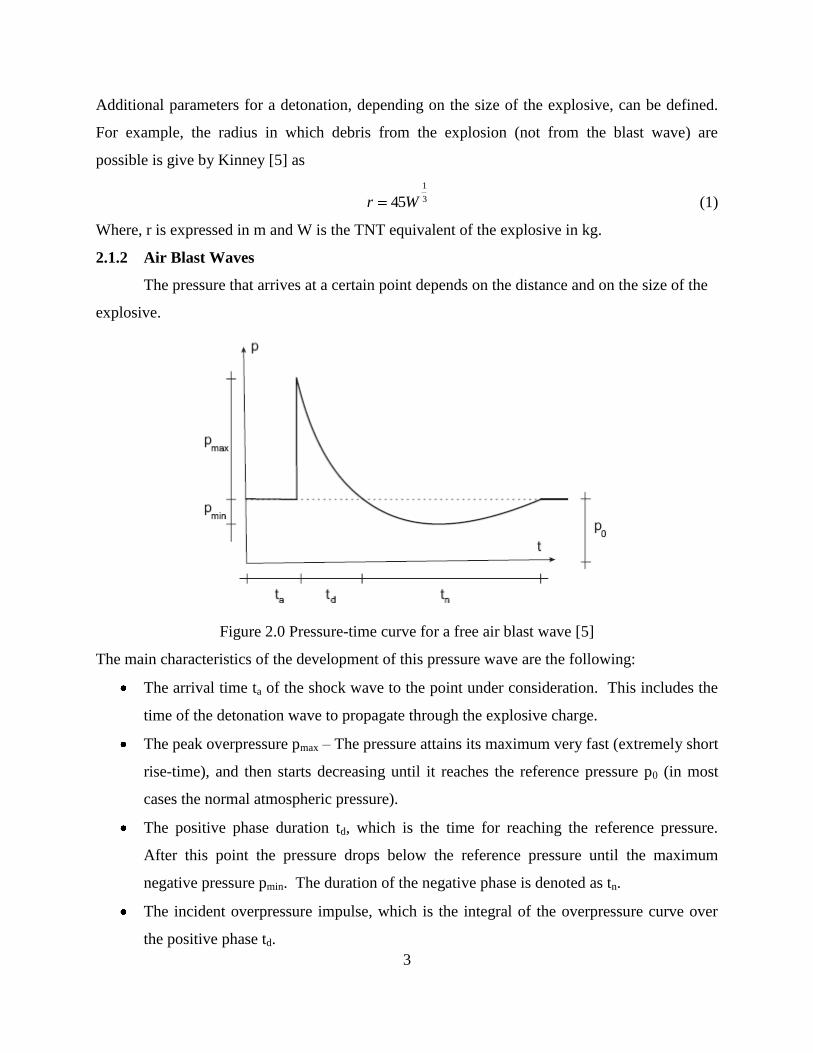
2.1.3 Pressure-Time Distribution
There are several pressure-time-curves for different kinds of explosions. The effects of
nuclear explosions here should be disregarded.
The pressure at a known point can be described by the modified Friedlander equation (from
Baker [6]) and depends on the time t from the arrival of the pressure wave at the time (t = t0-ta)
dt
bt
dt
tpptp )1()( max0 (4)
The other parameters involved are the atmospheric pressure p0, the maximum
overpressure pmax and the duration of the positive pressure td. The parameter b describes the
decay of the curve. It can be calculated with a known minimum pressure after the positive
phase. Alternatively, the parameter b can be calculated with the knowledge of the impulse.
All parameters for the pressure-time curve can be taken from different diagrams and equations
(Baker [6], Kinney [5], Kingery [4]) See Figure 6.0.
5
Figure 3.0 Model of Kingery [4] with scaled distances
2.1.4 Maximum/Minimum Pressure
Kingery [4] developed in 1984 curves for the description of the different air blast
parameters by using a rich body of experimental data, which had been properly homogenized.
6
The parameters are presented in double logarithmic diagrams with the scaled distance Z as
abscissa, but are also available as polynomial equations. These diagrams and equations enjoy the
greatest overall acceptance and are widely used as reference by most researchers. The
parameters are also implemented in different computer programs that can be used for the
calculation of air blast wave values. e.g. they are implemented in CONWEP. The same curves
are also used for an easy air blast load model in ABAQUS.
2.1.5 Impulse
The impulse of the air blast wave has a big influence on the response of the structures.
The impulse is defined here as the area under the pressure time curve with the unit of
pressure*sec. The impulse can be calculated with [5].
3 42
4
)55.1/(1
)23.0/(1067.0
ZZ
ZI (5)
2.1.6 Negative Phase
Detonations produce an overpressure peak, and afterwards the pressure decreases and
drops below the reference pressure (generally the atmospheric pressure). The influence of the
so-called negative phase depends on the scaled distance. For scaled distances Z larger than 20
and especially for Z larger than 50 the influence of the negative phase can not always be
neglected. The size of the positive impulse and of the negative impulse is then nearly the same.
If the structure can react successfully to the positive pressure but is more sensitive to negative
pressure, failure of parts of the structure can result from this negative pressure phase [8].
However, in several cases the negative phase is neglected e.g. in the air blast function of the
CONWEP-Code. Smith [7] presents the following equation to calculate the value of the negative
pressure.
5
min 1035.0
Zp Pa for Z > 1.6 (6)
The duration time of the negative pressure pmin can be calculated with
31
00125.0 Wtn [sec] (7)
Another possibility to get these parameters in a diagram (see Figure 7.0) in Krauthammer [xx].
By using this diagram the limitation of equation (7) can be overcome by assuming
5
min 1035.0
Zp Pa for Z > 3.5 (8)
7
5
min 1035.0
Zp Pa for Z < 3.5 (9)
The duration of the negative phase in the diagram of Krauthammer can be described with the
following function
31
0104.0 Wtneg [sec] for Z < 0.3 (10)
31
)01201.0)log(003125.0( WZtneg [sec] for Z < 0.3 & Z ≤ 1.9
31
0139.0 Wtneg [sec] for Z > 1.9
Figure 4.0 Different parameters for the negative phase [5]
2.1.7 Wave Form Parameter
The decay or form parameter b in the Friedlander equation (4) describes the decay of the
pressure-time curve. The Friedlander equation has the parameters pmax, td, and b. pmax and td can
be readily found as explained before. There are several possibilities to calculate the decay
parameter b by using another known value of the pressure-time curve:
1. Using the minimal pressure in the negative phase. Then, as it will be shown, the impulse
of the positive phase is not accurate.
8
2. Using the impulse of the positive phase. Then, as it will be shown, the minimal pressure
in the negative phase is not accurate. An additional equation for the negative phase
should be used to avoid a smaller underpressure than the atmospheric pressure.
2.1.8 Shock Front Velocity
The arrival time of the shock front at different points can be used to calculate the velocity
of the shock front. With the knowledge of this velocity the pressure can be obtained with the
Rankine Hugoniot relationship.
Kingergy [4] calculates also the shock front velocity depending on the pressure as
21
)2
11( max
0
op
pcu (11)
The parameter γ (ratio of specific heats of air) depends also on the overpressure and can be taken
from a table in [9]; c0 is the sound velocity in air (331 m/sec); pmax is the peak overpressure and
p0 is the atmospheric pressure (101.3 kPa).
2.1.9 Specific Heat Ratio
The specific heat ratio γ is defined as
v
p
c
c (12)
with cp being the specific heat at constant pressure and cv the specific heat at constant volume.
Both the specific heat ratio and the speed of sound depend on the temperature, the pressure, the
humidity, and the CO2 concentration. Kingery [4] defines the variation of the specific heat ratio
with a range of 1.402 to 1.176.
2.2 TNT-Method
The diagram for TNT detonations (Figure 8.0) have been used for estimations of blasts
from gas explosions, even though there are differences between the blasts from a gas explosion
and a TNT-detonations (Shepherd et al., 1991, van den Berg, 1985). In a gas explosion the local
pressure may reach values as high as a few bars. The blast pressure for TNT explosions is much
higher close to the charge. Such near-field data are therefore irrelevant for gas explosions and it
is recommended not to use TNT-data indicating pressures higher than 1 bar to estimate gas
explosion blasts.
9
Figure 5.0 Peak explosion pressure (side-on) vs. distance for TNT ground burst [4]
The so-called TNT equivalence method has been widely used for gas explosions. The TNT
equivalence method applies pressure-distance curves for TNT explosions to gas explosions and
the equivalent TNT charge is estimated from the energy content in the exploding gas cloud.
For typical hydrocarbons, such as methane, propane, butane etc., the heat of combustion is
10 times higher than the heat of reaction of TNT. The relation between the mass of
hydrocarbons WHC and the equivalent TNT charge WTNT is then
HCTNT WW **10 (13)
where h is a yield factor (η = 3%-5%), based on experience, see Gugan, 1978.
In the original TNT equivalence method, the mass of hydrocarbon WHC was based on the
total mass released and the yield factor η. In order to estimate consequences of gas explosions,
the geometrical conditions (i.e. confinement and obstructions) have to be taken into account. In
the original TNT equivalence method, the geometrical conditions are not taken into account. The
results from this type of analysis have therefore hardly any relevance and should in general not
be used.
The drawbacks of the TNT equivalence method can be listed as follows:
a non-unique yield factor is necessary
representation of weak gas explosions is a problem
positive phase duration only
gas explosion processes are not represented well
choice of "blast centre" is problematic (no well-defined and sensible method exists)
10
In order to take the geometrical effects into account in the TNT equivalence method, Harris
and Wickens (1989) proposed to use a yield factor of 20% (η = 0.2) and the mass of
hydrocarbon, WHC, contained in Stoichiometric proportions in any severely congested region of
the plant. For natural gas the equivalent mass of TNT can be estimated from (assuming
atmospheric pressure initially)
][16.0 kgVWTNT (14)
where V [m3] is the smaller of either the total volume of the congested region or the volume of
the gas cloud. Equation 14 will also hold for most hydrocarbons, since the energy content per
volume Stoichiometric mixture is approximately the same (~3.5MJ/m3).
Figure 9.0 shows the results from a TNT equivalent analysis, as suggested by Harris and
Wickens, in comparison with CMR's experimental results from 50 m3 tests.
Figure 6.0 Peak explosion pressure (side-on) vs. distance for TNT equivalent method [4]
As we can see from this figure there is fairly good agreement between the predicted values
and the experimental values as long as the explosion pressure in the cloud is in a few bars range.
Weak gas explosions (less than 0.5 bar) are not represented satisfactorily. This indicates that the
TNT equivalence method can be useful as a rough approximation if one uses a yield factor of
20% and appropriate values for WHC or V. However, for explosion pressures below 1 bar, the
TNT equivalence method will overestimate the blast. More sophisticated methods must therefore
be applied for such cases.
11
2.3 Computational Methods
Computational methods in the area of blast-effects mitigation are generally divided into
those used for prediction of blast loads on the structure and those for calculation of structural
response to the loads. Computational programs for blast prediction and structural response use
both first-principle and semi-empirical methods. Programs using the first principle method can
be categorized into uncouple and couple analyses. The uncouple analysis calculates blast loads
as if the structure were rigid and then applying these loads to a responding model of the
structure. The shortcoming of this procedure is that when the blast field is obtained with a rigid
model of the structure, the loads on the structure are often over-predicted, particularly if
significant motion or failure of the structure occurs during the loading period. For a coupled
analysis, the blast module is linked with the structural response module. In this type of analysis
the computational fluid mechanics (CFD) model for blast-load prediction is solved
simultaneously with the computational solid mechanics (CSM) model for structural response.
To account for the motion of the structure while the blast calculation proceeds, the pressures that
arise due to motion and failure of the structure can be predicted more accurately by using
ABAQUS, AUTODYN, DYNA3D AND LS-DYNA.
12
3 METHODOLOGY/APPROACH
The boundary conditions for the analysis will have all degrees of freedom including the
rotational degrees of freedom fixed at the top and bottom side of the plate (Figure 2.0).
Figure 7.0 Plate Boundary Condition
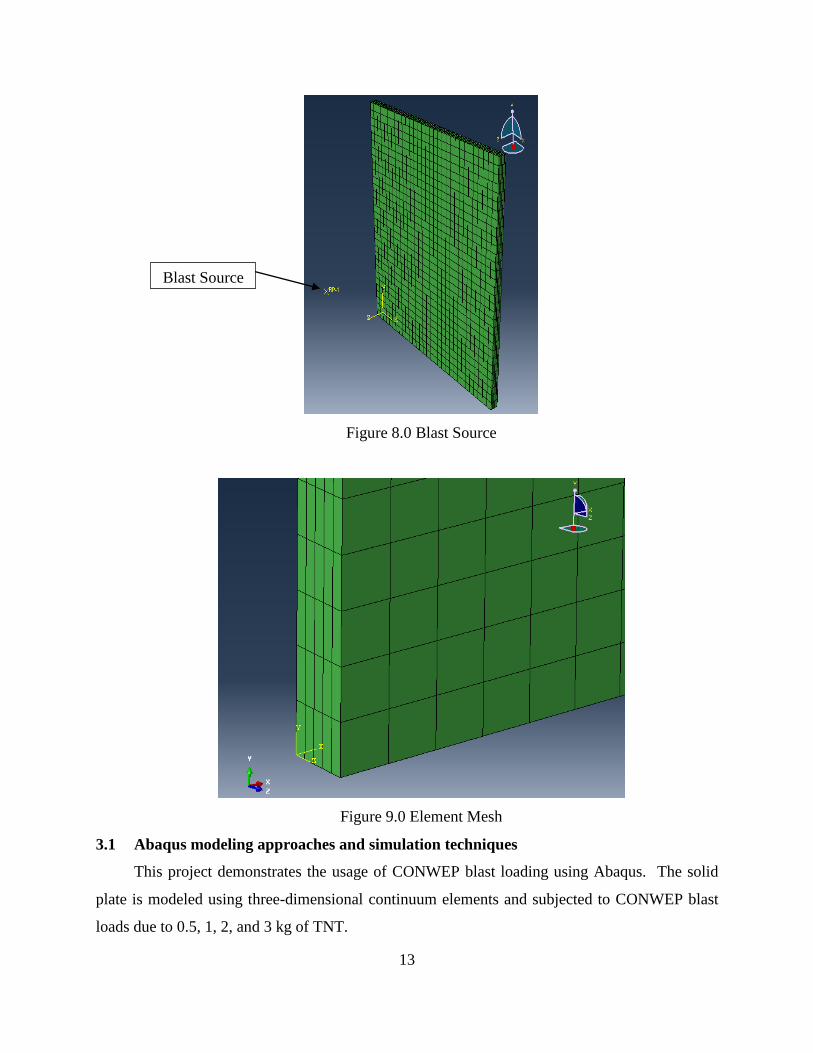
The 0.5, 1, 2 and 3 kg TNT blast source (RP-1) is kept at a standoff distance of 0.20 m from
the front surface and center of the plate (Figure 3.0). The plate surface uses a 31 x 31 C3D8R
element with five layers of elements through the thickness of the plate (Figure 4.0).
Fixed
Boundary
Condition
13
Figure 8.0 Blast Source
Figure 9.0 Element Mesh
3.1 Abaqus modeling approaches and simulation techniques
This project demonstrates the usage of CONWEP blast loading using Abaqus. The solid
plate is modeled using three-dimensional continuum elements and subjected to CONWEP blast
loads due to 0.5, 1, 2, and 3 kg of TNT.
Blast Source
14
Summary of analysis cases
Case 1 Solid plate modeled with C3D8R continuum elements under 0.5 kg TNT blast load.
Case 2 Solid plate modeled with C3D8R continuum elements under 1.0 kg TNT blast load.
Case 3 Solid plate modeled with C3D8R continuum elements under 2.0 kg TNT blast load.
Case 4 Solid plate modeled with C3D8R continuum elements under 3.0 kg TNT blast load.
3.2 Analysis Types
Dynamic analysis using Abaqus is performed for all cases. Solutions are computed up to
1.5 milliseconds, where no further permanent deformation is observed for all load values.
3.3 Material Model
The mechanical properties of the steel alloy as described in Nahshon [11] are specified as
follows: Young’s modulus of 1.61 x 10⁵ MPa, Poisson’s ratio of 0.35, density of 7.85 x 10
-9
metric tons/mm3, and coefficient of expansion of 452 x 10
6 Nmm/metric tons,K.
A Johnson-Cook model [13] is used to model the elastic–plastic behavior with the
following coefficients and constants: A=400 MPa, B=1500 MPa, C=0.045 , n=0.4, m=1.2, and
έp0=0.001 s-1
. The Johnson-Cook model is a phenomenological model, i.e. it is not based on
traditional plasticity theory that reproduces several important material responses observed in
impact and penetration of metals. The three key material responses are strain hardening, strain-
rate effects, and thermal softening.
])(1)[ln1]()([),,( * m
p
n
pppY TCBAT (15)
Where p is the equivalent plastic strain, p is the plastic strain-rate, and A, B, C, n, m are
material constants. The normalized strain-rate and temperature in equation (15) are defined as
0
*
p
p
p
(16)
)(
)(
0
0*
TT
TTT
m
(17)
Where 0p is a user defined plastic strain-rate, 0T is a reference temperature, and mT is a
reference melt temperature. For conditions where *T < 0, we assume that m = 1.
15
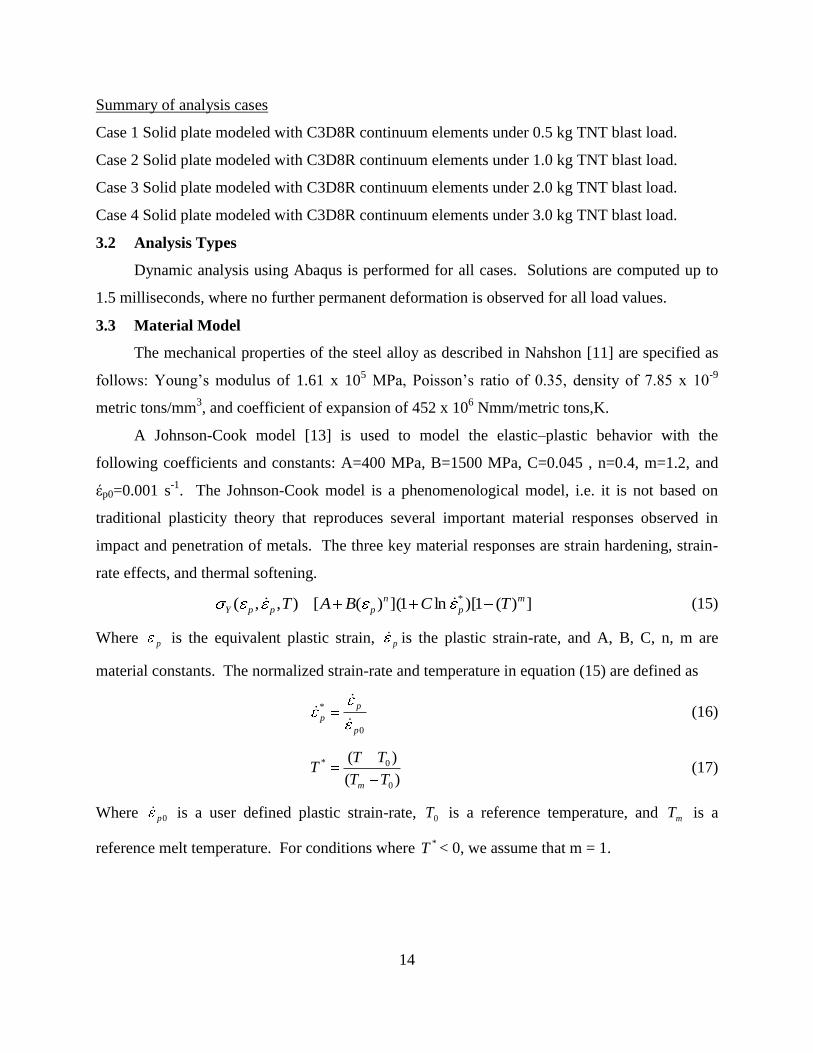
4 DISCUSSION
The center displacement after 1.5 milliseconds was monitored to compare each case with
experimental results. The animation of the deformed plate over the entire time period of 1.5
milliseconds shows large deformation at the center. The plate stabilizes after few oscillations.
The top surface center deflection and the bottom surface center deflection were quite close to
each other. The two values were plotted (Figure 10.0) for each case to compare the midsection
deflection of the solid plate.
Figure 10.0 Displacement of Top/Bottom Center Surface for Various Weight Charge
16
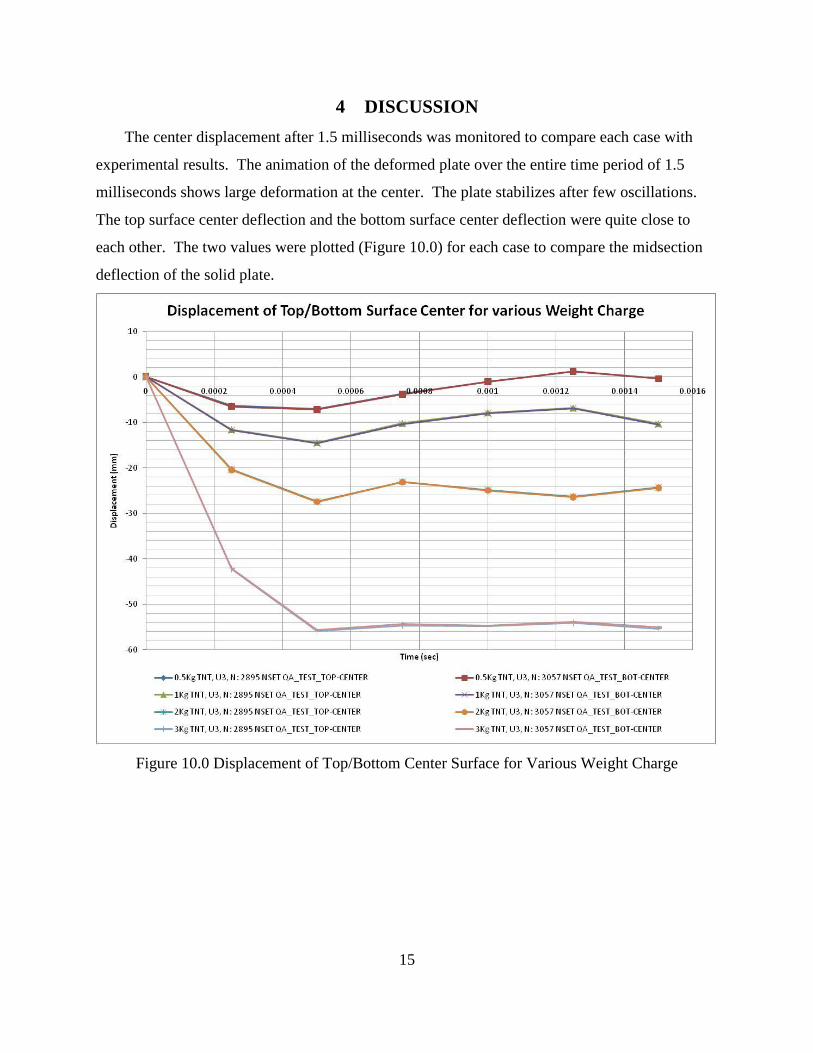
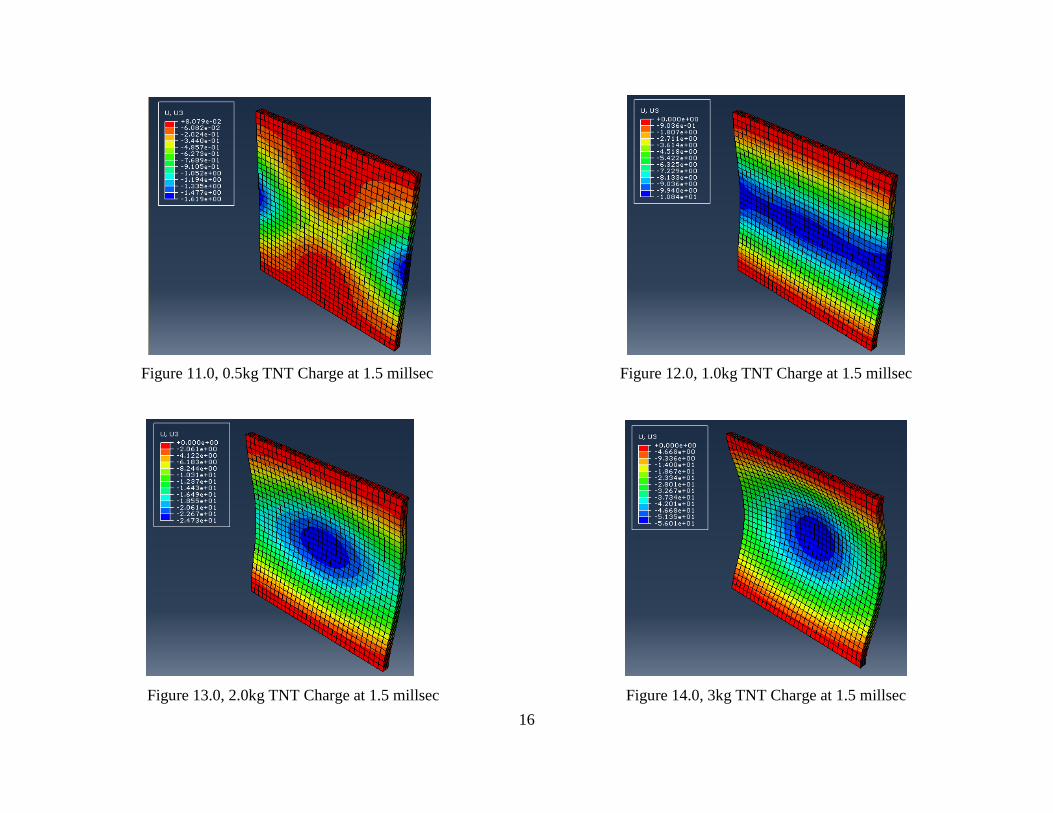
Figure 11.0, 0.5kg TNT Charge at 1.5 millsec Figure 12.0, 1.0kg TNT Charge at 1.5 millsec
Figure 13.0, 2.0kg TNT Charge at 1.5 millsec Figure 14.0, 3kg TNT Charge at 1.5 millsec
17
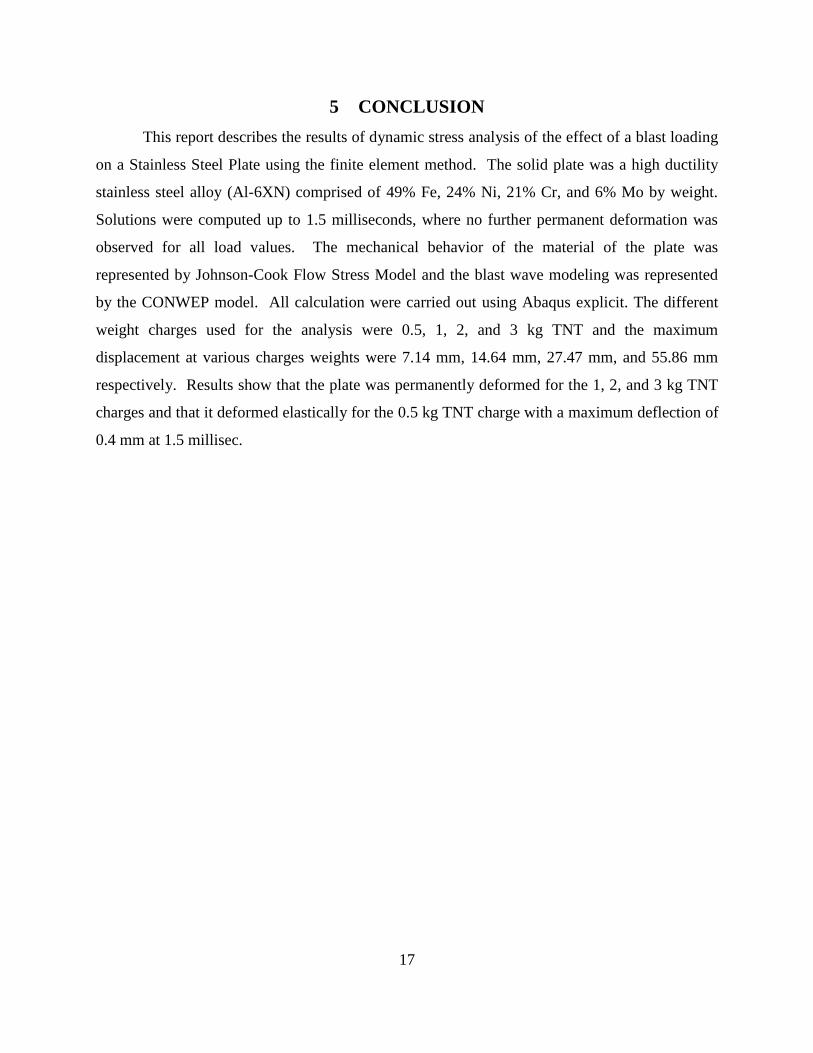
5 CONCLUSION
This report describes the results of dynamic stress analysis of the effect of a blast loading
on a Stainless Steel Plate using the finite element method. The solid plate was a high ductility
stainless steel alloy (Al-6XN) comprised of 49% Fe, 24% Ni, 21% Cr, and 6% Mo by weight.
Solutions were computed up to 1.5 milliseconds, where no further permanent deformation was
observed for all load values. The mechanical behavior of the material of the plate was
represented by Johnson-Cook Flow Stress Model and the blast wave modeling was represented
by the CONWEP model. All calculation were carried out using Abaqus explicit. The different
weight charges used for the analysis were 0.5, 1, 2, and 3 kg TNT and the maximum
displacement at various charges weights were 7.14 mm, 14.64 mm, 27.47 mm, and 55.86 mm
respectively. Results show that the plate was permanently deformed for the 1, 2, and 3 kg TNT
charges and that it deformed elastically for the 0.5 kg TNT charge with a maximum deflection of
0.4 mm at 1.5 millisec.
18
6 REFERENCES
[1] Dobratz, B.M and Crawford, P.C., "LLNL Explosives Handbook", UCRL-52997 Rev.2
January 1985
[2] Longinow, Anatol and Alfawakhiri, Farid, Modern Steel Construction, “Blast Resistant
Design with Structural Steel”, October 2003.
[3] Remennikov, Alexander M. Journal of battlefield technology, “A review of methods for
predicting bomb blast effects on buildings”, Vol 6, no3. Pg 155-161. 2003.
[4] Kingery, Charles N.: Bulmash, Gerald: Airblast Parameters from TNT Spherical Air Burst
and Hemispherical Surface Burst, Defense Technical Information Center, Ballistic Research
Laboratory, Aberdeen Proving Ground, Maryland, 1984.
[5] Kinney, Gilbert F.; Graham, Kenneth J.: Explosive Shocks in Air, Springer, Berlin, 1985.
[6] Baker, Wilfrid E.: Explosions in the Air, University of Texas Pr., Ausint, 1973.
[7] Smith, P.D.; Hetherington, J.G.: Blast and Ballistic Loading of Structures. Laxton’s 1994.
[8] Krauthammer, T.; Altenberg, A.: Negative phase blast effects on glass panels, International
Journal of Impact Engineering, 24 (1), pp. 1-18; 2000.
[9] Kingery, C.N.; Pannill, B.F.: Parametric Analysis of the Regular Reflection of Air Blast,
BRL Report 1249, June 1964 (AD 444997).
[10]Dharmasena, K. P., H. N. G. Wadley, Z. Xue, and J. W. Hutchinson, “Mechanical Response
of Metallic Honeycomb Sandwich Panel Structures to High-Intensity Dynamic Loading,”
Journal of Impact Engineering, vol. 35, pp. 1063–1074, 2008.
[11]Nahshon, K., M. G. Pontin, A. G. Evans, J. W. Hutchinson, and F. W. Zok, “Dynamic
Shear Rupture of Steel Plates,” Journal of Mechanics of Materials and Structures, vol. 2–10,
pp. 2049–2066, December 2007.
[12] Conventional Weapons Effects (“ConWep”, 1991), is a computer programme, based on the
content of technical manual TM 5-855-1 (1986) Fundamentals of protective design for
conventional weapons, Structural Laboratory, Waterways Experimental Station, for the
Department of the Army, US Army Corps of Engineers.
[13] Johnson, G.R.; Cook, W.H. (1983), "A constitutive model and data for metals subjected to
large strains, high strain rates and high", Proceedings of the 7th International Symposium on
Ballistics: 541–547,

19
7 APPENDIX
7.1 Abaqus Input Files (Hyperlink)
..\02 Abaqus Modeling\Input Files\Result_05TNT.inp
..\02 Abaqus Modeling\Input Files\Results_1TNT.inp
..\02 Abaqus Modeling\Input Files\Results_2TNT.inp
..\02 Abaqus Modeling\Input Files\Results_3TNT.inp