Embed Size (px)
Citation preview

DYNAMIC SIMULATION OF THERMAL CAPACITY AND CHARGING/ DISCHARGING PERFORMANCE FOR SENSIBLE HEAT STORAGE IN
BUILDING WALL MASS
Henryk Wolisz, Hassan Harb, Peter Matthes, Rita Streblow, Dirk Müller RWTH Aachen University, E.ON Energy Research Center Institute for Energy Efficient Buildings and Indoor Climate
52074 Aachen, Germany [email protected]
ABSTRACT The potential for utilization of the building mass thermal capacity for demand side management in the residential sector is addressed. A three apartment residential houses made of massive brick, equipped with a heat pump is modeled and its thermal behavior is simulated. It is shown that thermal storage capacity of the building can indeed contribute considerably to residential demand side management activities. Even after heating periods as short as two hours the heating demand for the following four hours can be reduced by almost 20 %. The slow temperature increase within the thermal mass and the heat conduction into deeper wall layers are thereby the main limiting factors.
INTRODUCTION Hand in hand with the increasing installation of renewable non dispatchable energy generation, the challenge of matching electricity production and consumption arises. Heating in residential and commercial buildings accounts for up to 30 % of Germanys end energy consumption (BMWi, 2011) and could therefore potentially play a role in providing flexibility to balance fluctuating electricity availability. Within the scope of the Dual Demand Side Management (2DSM) concept (Molitor, C. et al., 2012) a holistic approach is developed to manage the energy demand (i.e. electrical and thermal) on city quarter level.
One of the focus areas within 2DSM is the analysis of thermal energy storage in buildings, intending to store excess electrical as thermal energy whenever available (i.e. through heat pumps) and reduce the buildings’ demand for electricity in periods of peak load while substituting fossil fuels usually used for heating purposes. Besides of the well-developed thermal storage technology based on hot water tanks the inherent thermal storage capacity of buildings, attributable to the mass and thermal capacity of the used construction materials, is analyzed. This thermal capacity is available in every building at no cost and besides of integration of a suitable heating system it requires no structural alteration to the existing building. This makes the approach particularly attractive for the massive buildings in the existing building stock.
The existing pricing schemes for electricity in Germany are either not time dependent or provide a lower price for electricity consumption at night (STAWAG, 2013). This was for example widely used to operate electrical night storage heating systems, by loading a solid thermal mass or heating a water tank. However, heating the building itself would be in conflict with the thermal comfort of the residents, who generally prefer lower temperatures while sleeping (Peeters, L., 2009). Nevertheless, it is known that during summer in non-residential buildings the lower electricity price was used to pre-cool the building, reducing the power demand for air conditioning during daytime (Artmann, N., 2007; Kolokotroni, M., 1998). Since it is expected that the rising share of renewable electricity generation will lead to dynamic pricing schemes, only dependent on actual availability and demand, low price phases can occur at any time throughout the day. Thus, pre-heating or even overheating a residential building to load its thermal wall mass while it is not occupied could provide additional storage capacity, especially in winter time.
The existing considerations of the impact of differentiated heating phases in buildings were either oriented towards cooling or towards the oscillating effect of periodic temperature reduction at night or during absence of residents (Braun, J., 1990; Kolokotroni, M., 1998; Artmann, N., 2007). In contrast, this analysis examines in detail the effects of one single heating pulse brought into the building. Based on that pulse an assessment of the amount of energy, which can be stored and reclaimed from the buildings mass, is performed. Furthermore, it is examined how the availability of that capacity varies with changing ambient temperature and different timeframes for the heating periods of the building.
The basis for this approach is a simulation of thermal building behavior in Dymola/ Modelica (Modelica Association et al., 2012) combined with a detailed simulation of the electric grid in Neplan (BCP Busarello + Cott + Partner AG, 2012). The simulations are coupled and exchange required variables for every simulated time step, thus allowing to balance energy demand and availability.
Proceedings of BS2013: 13th Conference of International Building Performance Simulation Association, Chambéry, France, August 26-28
- 2716 -
In the next section the approach is presented explaining the chosen simulation scenario and the modelled object of analysis. Afterwards the used thermal building model and the modelled heating system are presented and the suitability for the performed simulations is shown based on two validation scenarios. In the next section the simulation results are presented followed by the discussion of the outcomes and a concluding summary of the found thermal building behaviour.
APPROACH The analysis of the thermal capacity is based on the thermal model of an existing three apartment house build in 1964 and located within the project region of 2DSM in Bottrop, Germany. For this exemplary building it is evaluated how much thermal energy can be stored in the wall mass, by lifting the set temperature of the heat pump based heating system by few degrees for a short period of time. Therefore, the house is modeled in Modelica, based on our institutes’ library of building components. The dynamic simulation of the thermal behavior is than performed in Dymola. In the following the simulation scenario is introduced and the key data of the analyzed building are presented.
Simulation scenario Thermal behavior of a building is a very complex mechanism, which is strongly influenced by the thermal capacity of the building mass. However, within the regular operation of the building the resulting thermal effects that are influenced by the stored heat are hard to distinguish. Usually, only distinct sudden changes in ambient temperature reveal the extent of that capacity. To isolate the effect of thermal storage in building wall mass from other thermal effects within the building a special simulation scenario is created and some basic assumptions are made.
The amount of radiation entering the thermal zone through the windows is very volatile and can bring a huge amount of energy into the building within a short time. In passive solar design, it is assumed that on a sunny day each square meter of window area on the south facade can bring up to 1 kWh of thermal energy into the building (Eicker U., 2012). Thus, taking this effect into account would make it impossible to isolate the thermal storage effects, which in comparison would cause rather small heat flows. Therefore the effect of long wave solar radiation is excluded.
Furthermore, it is assumed that except for the heating and supply system the building is empty, meaning that neither furniture nor other components with a thermal mass are considered. The choice of interior construction, furnishing, flooring etc. would allow for countless combinations of components with significant thermal mass and influence upon thermal
resistance if positioned in contact with wall and floor layers. Therefore, to evaluate the general potential of thermal storage within the wall mass such components are omitted.
The initial air temperature within the building is set to 20 °C. To enable the usage of the total thermal comfort band for the heat storage process that initial air temperature was chosen at the lowest still acceptable comfort limits according to DIN V 18599 – 10 (DIN, 2011) and (Peeters, L., 2009). For the base scenario the ambient temperature and the wind speed are assumed to be constant during the simulation period at 0 °C and 4 m/s respectively, thus corresponding approx. to an average winter day in Germany (DWD, 2012). The temperature of the soil under the building is assumed to be constant at 10 °C (DIN, 2008 /2). Only such stable ambient conditions allow inducing a constant heat flow from the building to the outside. This makes it possible to recognize the changes in heat loss caused by the heat storing activities. Variations of ambient temperature, however, will be additionally performed to compare the storage potential at various conditions.
The simulation is then run under constant thermal conditions for one week making sure that a steady state with constant wall temperatures is reached. Afterwards an overheating phase of the building is started. Within that phase the building’s heating system will be set to lift the indoor temperature to higher temperatures for a given time frame. In accordance with the concept of using excess renewable electricity from short-term production peaks, the overheating phase in the base scenario will be set to two hours. Following the overheating phase the temperature set point is reduced to the base value and the simulation is continued for another week under stable conditions. Within that cool down phase special attention will be given to the time frame of one day directly after overheating, since it is intended to observe short term heat storage results.
Analysis of first dynamic simulations results have shown that after overheating an additional hour is required before the cool down phase starts. Within that time the heat stored in the distribution system and the air volume is also transferred into the buildings thermal mass. Therefore, overheating time is balanced as heating time and one additional hour. The cool down is than measured for the subsequent 24 hours.
Keeping indoor comfort in mind it is observed which temperatures are reached by the chosen heating system and which overheating timeframes are suitable to realize considerable storage effects. Furthermore, the storage effect is analyzed in detail, examining how much reduction of heating demand is achieved in the cool down phase. Finally, the storage efficiency of the wall mass is evaluated.
Proceedings of BS2013: 13th Conference of International Building Performance Simulation Association, Chambéry, France, August 26-28
- 2717 -
Object of analysis The analyzed building comprises approx. 350 m of heated living area divided into three apartments. The building material is assumed to be massive brick with gypsum plaster on the inside and lime plaster on the outside. Ceilings and floor slab are made of concrete with a screed layer on top and an additional layer of mineral wool in the floor slab. The roof is made of rafter, peat fiber and a layer of mineral wool, with lime plaster on the inside and roof tile on top. The properties of the main materials are given in table 1.
Table 1 Properties of main materials
As a reference value, the total static thermal capacity of the building is calculated to approx. 175 ��� �Τ . However, that assumes that all layers of the building will be heated equally by 1 K. This static value can be seen as a benchmark as to which part of the total thermal building capacity is being used in a given scenario. Still, a credible capacity can be only reached through dynamic analysis.
According to the calculations in DIN EN 12831 the simulated building has a design heat load of approx. 25 kW (DIN, 2003 /2). Within this simulation the building is equipped with a heating system composed of an air-water heat pump (HP) with 30 kW nominal- and 40 kW peak-power. Typically a HP heating system is not designed to cover the total thermal demand as a standalone system and is usually combined with a peak-load boiler. However, in this case the HP is dimensioned for standalone operation, to adapt the system with the intended process of storing excess renewable electricity generation within the buildings thermal mass. Furthermore, a traditional radiator system was chosen, since this is the most widespread technology for heat delivery within residential buildings.
It is assumed that within the overheating and cool down no ventilation activities are performed. Nevertheless, air infiltration of the building, which is calculated according to DIN EN 12831, is taken into
account (DIN, 2003 /2). Assuming an n50 value of 3 /h air infiltration is approx. 0.1 /h.
MODELLING Thermal Building Model For the building model all thermal components with different materials properties or ambient conditions are modelled separately. However, all thermal masses with identical structure and surrounding conditions are aggregated. That allows to represent the thermal model with nine thermal components within the building and two external thermal boundary conditions which are presented in table 2.
Table 2 Thermal components of the model
All elements of the building’s thermal mass and the radiators are connected with the indoor air volume through convection and with each other through thermal radiation. The building connects to the environment through convection at outer walls and roof, each assuming a wind speed of 4 m/s. Furthermore, the floor slab of the building connects through thermal conduction with the soil under the building. The coefficient of heat transfer α is dynamically calculated within the simulation (DIN, 2008; Glück, B., 1999). On the inside of the building this results in α values of 1.5 – 3.0 � ሺ�ଶ ή �ሻΤ , while on the outside α is constantly 20 � ሺ�ଶ ή �ሻΤ .
For every type of heat transfer between the building’s thermal mass, the air volume and the environment the heat flow is determined. Additionally, for the overheating and cool down phase heat flow balances are computed to determine which amount of the heating energy could be stored and later reclaimed.
�୵ୟ୪୪Ǥ୧ ൌ σ ൫�ሶ ୡ୭୬୴ǡ୧ ��ሶ ୰ୟǡ୧൯୲ (1)
To get more insight into the thermal activation process of the thermal mass every element of the building material was discretised into layers of 5 mm thickness. Dynamic heat conduction and capacity are calculated separately for every layer, thus allowing for detailed insight into the temperature profiles and the resulting storage capacity within the thermal mass.
component main material thickness Ȝ capacity surface
inner walls (bearing)
massive brick 0.24 0.81 900 186.875
inner walls (other) massive brick 0.15 0.81 900 536.25
inner ceilings concrete 0.2 2 1000 759outer walls massive brick 0.365 0.81 900 256.5floor slab concrete 0.25 2 1000 126.5
roof peat fiber rafter
0,045 0,14
0,09 0,14
1200 1600
123.2
inner plaster gypsum 0.015 0.4 1000 1482.325outer plaster lime 0.02 0.8 1000 379.7
isolation (roof/ floor
slab)mineral wool 0.04 0.04 1030 249.7
screed screed 0.05 1.4 1000 524.625windows glas 0.04 123.2
air volume air V≈1200 m 0.0262 1007 56.2U-Value: 1,3
ሾ [] :ሿdܭ� c: ሾ �ሿ A: [ଶ]
thermal component thermal connectionsinner walls (bearing) convection & thermal radiation
other inner walls convection & thermal radiationinner ceilings convection & thermal radiationouter walls convection & thermal radiationfloor slab convection & thermal radiation
roof convection & thermal radiationwindows convection & thermal radiationradiators convection & thermal radiation
inside air volume convectionoutside air convection (wind speed of 4 m/ s )
soil under the building thermal conduction
Proceedings of BS2013: 13th Conference of International Building Performance Simulation Association, Chambéry, France, August 26-28
- 2718 -
Heating A hydramodelledused in Eavailable storage in
The suppHP unit circuit asrepresent simple Hused to mderives thelectrical temperatupower ougiven set temperatutemperatuas previou
The consthermostavertical dvolume ato manufwork of TbehavioutemperatuAdditionasize is asappropriaa valve aurange is thermostaair tempeearlier in
VALIDA dynambehaviouto the ‘ELaboratorarrangemthe perfor(Manz, Hsetup confor caloraccurate validationmainly inchange rproperties
For the implemenperformanwith the presults aralong wit
system aulic radiatod. This type oEurope and w
for the descn building stru
ply system conand pumps f
s well as simt the connec
HP model tabmodel the HPhe condenser’ power from ure and a loutput is continpoint temper
ure set pointure which is usly described
sumer part conatic valves. direction. Eacand a metallicfacturer data.Tritschler (199
ur. The consuures Tflow/Trally, a safety ssumed. Accoate thermostatuthority of ab
2 K. The satic valve wilerature duringthe section “s
DATION mic validatio
ur without solaxercise 1’ of ries for Mater
ment. This testrmance of bu
H. et al., 200nsists of an ourimetric meas
experimentaln of buildinncludes the trate, the thers, and the ther
validation nted in our
ance of the ceprovided expere shown in tth the underly
r based heaof heating systwill be the mocribed managuctures.
nsists of a monfor the HP ample pressureting piping le based manP’s characters thermal powthe condense
oad factor. Tnuously contr
rature can be rt depends onconstant durind.
nsists of simiRadiators ar
ch section coc wall which i The model 99) and showumer system return/Troom air factor of 1.3
ording to the tic valve is sebout 0.5 and thset point teml be changed
g the experimsimulation sce
on of the tar gains is perthe EMPA (t
rial Testing at was develop
uilding energy06). The EMutdoor test celurements. Thl data that cng energy stest cells’ he
rmo physical rmal performa
the test cer model anell is simulateerimental datathe lower diaing heat input
ating systemtem is commo
ost importantgement of ene
novalent air/wand the consue loss modelnetwork. In
nufacturer datistic. This mwer and the uner and evaporhe HP’s therrollable so threached. The fn the outsideng an experim
ilar radiators wre discretizednsists of a wis sized accord
is based on s a good dyna
is designed = 70/50/20
3 for the radiradiator size
elected to achhe proportionamperature of to raise the ro
ments as explaenario”.
transient therrformed accordthe Swiss Fed
and Research)ped for evalua
simulation coMPA experime
ll that is desighis setup delican be used simulations. Teat input, the
and geometrance of the cel
lls’ structurend the thered and comp
a. The comparagram in figut profile.
m is only case ergy
water umer ls to
this ta is
model nit’s rator rmal
hat a flow
e air ment
with d in water rding n the amic for
0 °C. iator
e the hieve ality
the room ained
rmal rding deral test
ating odes ental gned ivers
for This
e air rical ll.
e is rmal
pared rison ure 1
Figbe
Theabsdiffrespindibetwthe are
Thesucthe guaof t
Havmodmodof aenti25 °SimreacThitherBascap
Thethe env
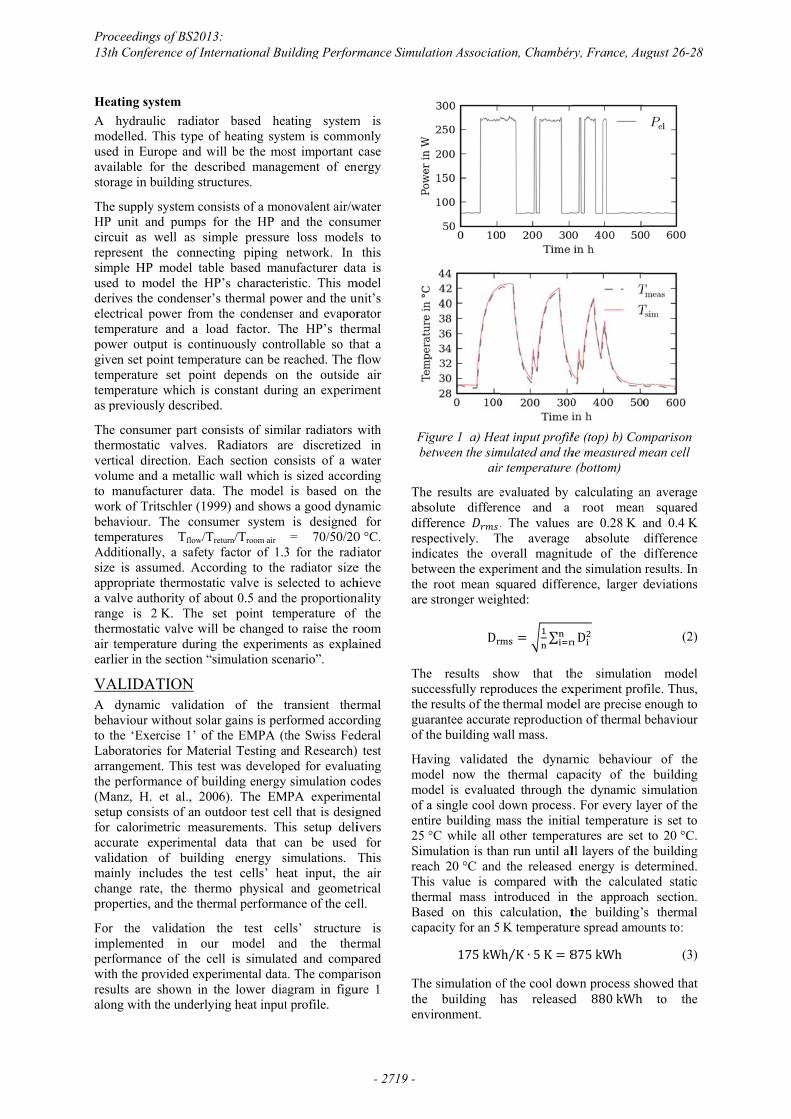
gure 1 a) Heaetween the sim
air
e results are eolute differeference ܦ௦.pectively. Ticates the ovween the experoot mean sstronger weig
�୰
e results shcessfully reprresults of the
arantee accurathe building w
ving validatedel now the del is evaluata single cool dire building m°C while all
mulation is thach 20 °C andis value is crmal mass insed on this pacity for an 5
ͳͷ ��
e simulation obuilding
vironment.
at input profilmulated and thr temperature
evaluated by ence and a . The values
The average verall magniteriment and thquared differ
ghted:
୫ୱ ൌ ටଵ୬σ
୬୧ୀ୬
how that throduces the exthermal modete reproductio
wall mass.
ed the dynamthermal cap
ted through thdown processmass the initiaother temperaan run until ald the released ompared withntroduced in calculation, tK temperatur
�� �Τ ή ͷ � ൌ ͺ
of the cool dowhas released
le (top) b) Comhe measured m (bottom)
calculating aroot mean
are 0.28 K aabsolute
tude of the he simulation rence, larger
�୧ଶ୬
he simulatioxperiment proel are precise on of thermal
mic behavioupacity of thethe dynamic ss. For every laal temperatureatures are set ll layers of th
d energy is deh the calculathe approach
the building’re spread amo
ͺͷ����
wn process shd ͺͺͲ����
mparison mean cell
an average n squared and 0.4 K difference difference results. In deviations
(2)
on model file. Thus, enough to behaviour
ur of the e building simulation ayer of the e is set to to 20 °C.
e building etermined. ated static h section. s thermal
ounts to:
(3)
howed that to the
Proceedings of BS2013: 13th Conference of International Building Performance Simulation Association, Chambéry, France, August 26-28
- 2719 -
The deviamarginal in the anthe static accurately
SIMULFirst, the in steady of 0 °C abuildingsare apprconvectioresults i1807 kWcapacity the entireenough en
Still, this of the bu10.75 kWPerformecharging provides
OverheaDue to thindoor ahigher ththe set temindoor aiThe resutemperatu19 °C. Wis supposoverheatiresults inthe overhthe air maverage overheatiapprox. 2
Fig
ation of approdifferences i
alytical and scapacity of th
y.
LATION REthermal behastate is analy
ambient and 20s heat losses arox. 10 750 Won and 970 Win an energ
Wh per week. calculation p
e building masnergy for app
ሺଵହ�୩୦ Τ ήଵǤହହ�୩
neglects that uilding is unlW, which haed dynamic s
the entire buienough energ
ting phase he used proporair temperaturan the set temmperature is rir temperature
ulting simulatiure of 19.8 °C
Within the ovesed to reach 2ing phase, onn an operativeheating is finimass to cool
temperature ing and one22.7 °C (figure
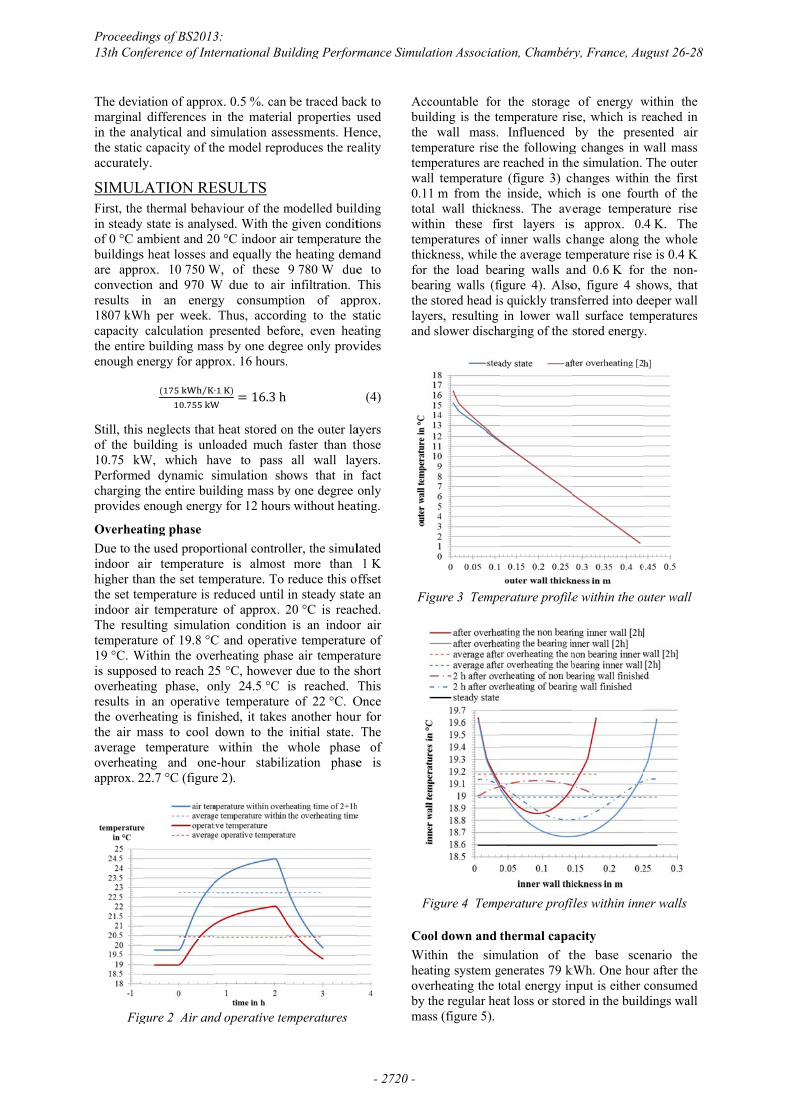
gure 2 Air and
ox. 0.5 %. canin the materiasimulation asshe model repr
ESULTS aviour of the mysed. With the0 °C indoor ai
and equally thW, of these W due to air gy consumpt
Thus, accordpresented befoss by one degrox. 16 hours.
ήଵ�ሻ ൌ ͳǤ͵��
heat stored oloaded much ave to pass simulation shilding mass by
gy for 12 hour
rtional controlre is almost
mperature. To reduced until e of approx. 2ion conditionC and operativerheating phas5 °C, howevenly 24.5 °C e temperatureished, it takesdown to the within the
e-hour stabilie 2).
d operative te
be traced bacal properties usessments. Heroduces the rea
modelled builde given conditir temperaturee heating dem9 780 W dueinfiltration. T
tion of appding to the sore, even heagree only prov.
on the outer lafaster than thall wall lay
hows that in y one degree os without heat
ller, the simulmore than
reduce this oin steady stat20 °C is reac is an indoorve temperaturse air temperaer due to the sis reached. T
e of 22 °C. Os another hour
initial state. whole phaseization phase
emperatures
ck to used ence, ality
ding tions e the
mand e to This
prox. static ating vides
(4)
ayers hose yers. fact
only ting.
lated 1 K
ffset te an ched. r air re of ature short This
Once r for The
e of e is
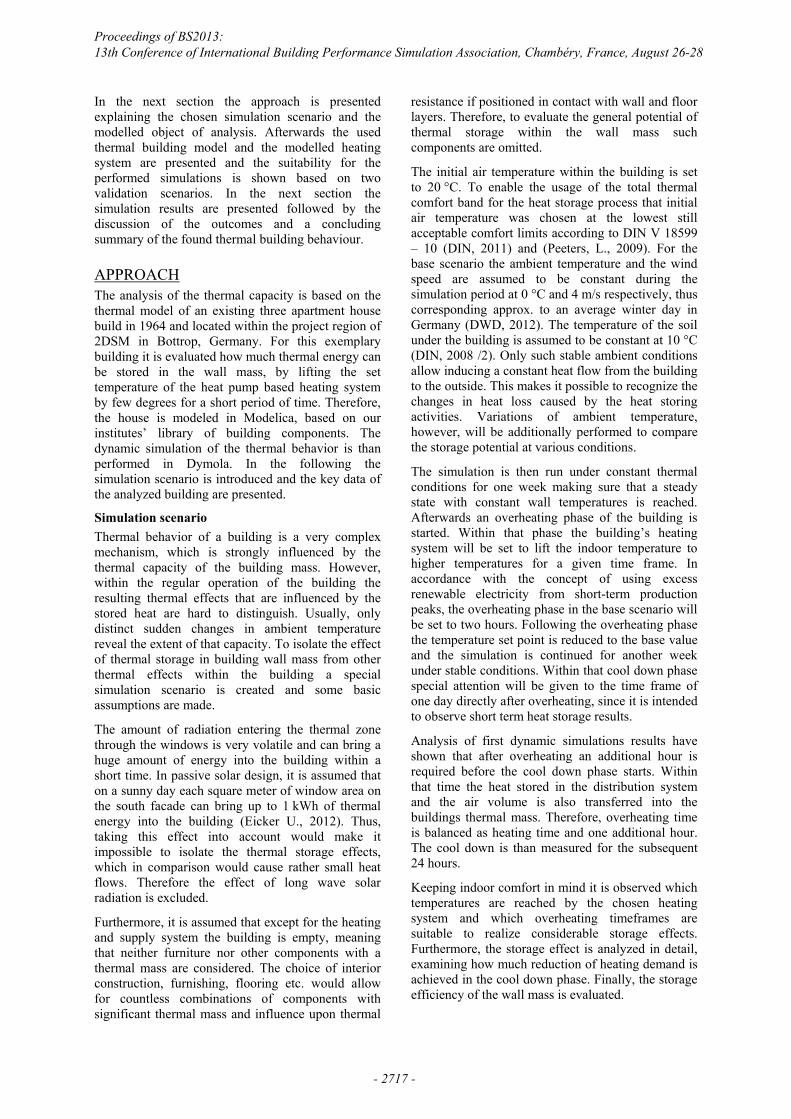
Accbuilthe temtemwal0.1totawithtemthicfor beathe layeand
Fig
F
CooWitheaoveby tmas
countable forlding is the te
wall mass. mperature rise mperatures are ll temperature1 m from theal wall thicknhin these fir
mperatures of ckness, while
the load beaaring walls (fi
stored head isers, resulting
d slower disch
igure 3 Tempe
Figure 4 Temp
ol down and thin the sim
ating system gerheating the tthe regular hess (figure 5).
r the storage emperature ris
Influenced the followingreached in th
e (figure 3) ce inside, whicness. The averst layers isinner walls chthe average tearing walls anigure 4). Alsos quickly transin lower wal
arging of the s
erature profile
perature profi
thermal capamulation of tgenerates 79 ktotal energy inat loss or stor
of energy wse, which is rby the pres
g changes in he simulation. changes withinch is one fouverage tempers approx. 0.change along emperature risand 0.6 K foro, figure 4 shsferred into de
all surface temstored energy
le within the o
iles within inn
acity the base scekWh. One hounput is either red in the build
within the reached in sented air wall mass The outer
n the first urth of the rature rise 4 K. The the whole se is 0.4 K r the non-hows, that eeper wall
mperatures y.
uter wall
ner walls
enario the ur after the consumed dings wall
Proceedings of BS2013: 13th Conference of International Building Performance Simulation Association, Chambéry, France, August 26-28
- 2720 -
Figu
The folloenergy fldesired rheating energy. Fphase theenergy deof four hohours thestored enenergy de
After theprovidingThe 6 kW11.5 kWhadditionaAccordinoverheatimore hea
Fig
Since thelayers it stored enflows aredemand skWh, by other ene38.5 outcorrespon
In order tprocess uwas perf(table 3)
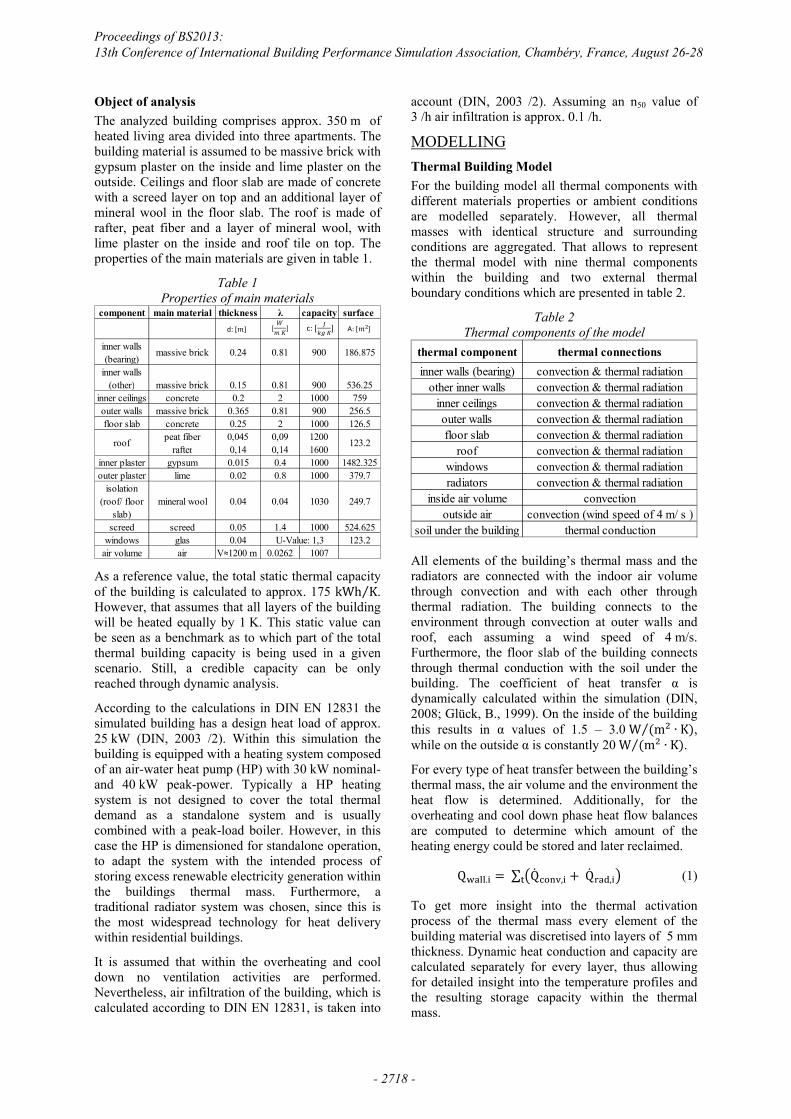
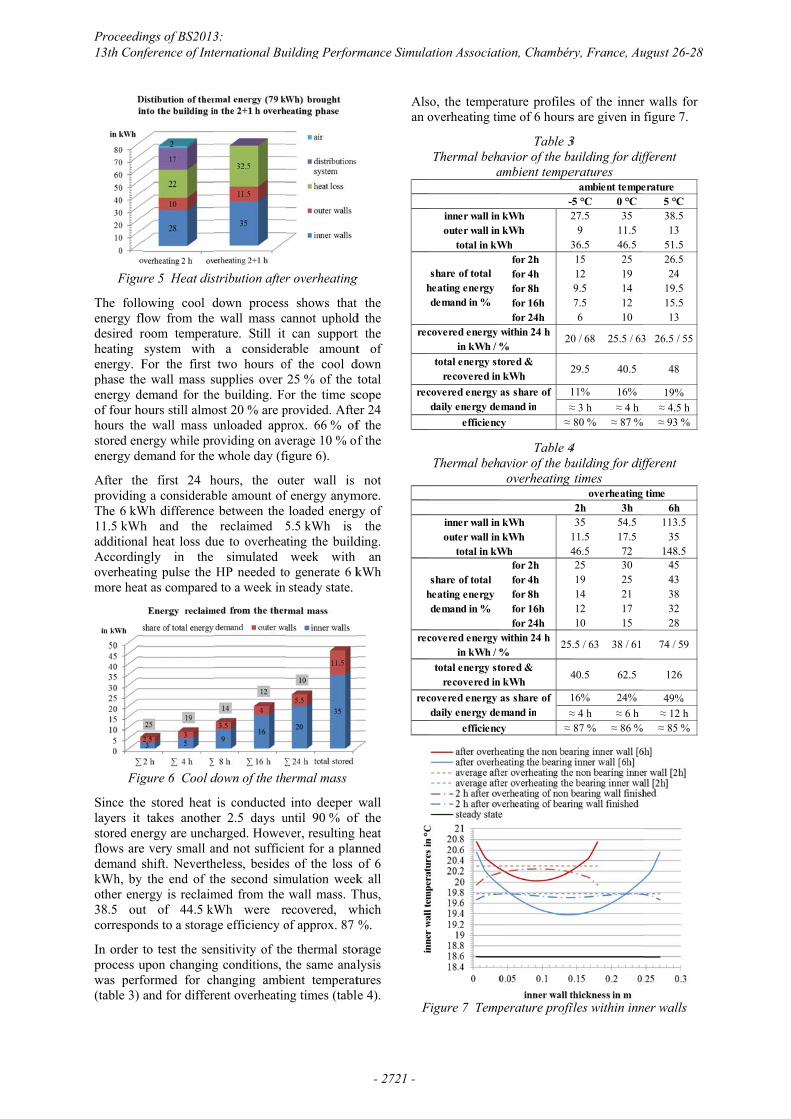
re 5 Heat dis
owing cool dlow from the room temperasystem withFor the first e wall mass semand for theours still almoe wall mass uergy while proemand for the
e first 24 hg a considerabWh difference h and the al heat loss dungly in the ing pulse the at as compared
gure 6 Cool d
e stored heat takes anothe
nergy are unche very small ashift. Neverththe end of th
ergy is reclaimt of 44.5 kWnds to a storag
to test the senupon changingformed for chand for differ
stribution after
down processwall mass c
ature. Still it h a consider
two hours osupplies over e building. Foost 20 % are punloaded appoviding on av whole day (fi
hours, the ouble amount of
between the reclaimed 5
ue to overheasimulated
HP needed tod to a week in
down of the th
is conducted er 2.5 days uharged. Howevand not sufficiheless, besideshe second simmed from the Wh were rge efficiency o
nsitivity of thg conditions, thanging ambient overheatin
r overheating
s shows that annot upholdcan support
rable amountof the cool d
25 % of the tor the time scprovided. Afteprox. 66 % ofverage 10 % offigure 6).
uter wall is f energy anym
loaded energ5.5 kWh is
ating the buildweek with
o generate 6 ksteady state.
ermal mass
into deeper until 90 % ofver, resulting ient for a plans of the loss mulation week
wall mass. Tecovered, wof approx. 87
he thermal stothe same analient temperatng times (table
g
the d the t the t of
down total cope er 24 f the f the
not more. gy of
the ding.
an kWh
wall f the heat
nned of 6 k all
Thus, which
%.
orage lysis tures e 4).
Alsan o
F
rec
rec
h
rec
rec
h
so, the temperoverheating ti
Thermal behaa
Thermal beha
Figure 7 Temp
efficienc
total in kWouter wall in inner wall in
covered energy daily energy de
total energy strecovered in
covered energy in kWh / %
share of total heating energy demand in %
total in kW
covered energy in kWh / %
efficienc
covered energy daily energy de
share of total heating energy demand in %
total energy strecovered in
outer wall in inner wall in
rature profilesme of 6 hours
Table 3avior of the bu
ambient tempe
Table 4avior of the bu
overheating
perature profi
-2
3for 2hfor 4hfor 8hfor 16hfor 24h
20
2
1≈≈ cy
WhkWhkWh
as share of mand in
tored & kWh
within 24 h %
14
for 2hfor 4hfor 8hfor 16hfor 24h
25
4
1≈≈
Wh
within 24 h %
cy
as share of mand in
tored & kWh
kWhkWh
s of the inners are given in
3 uilding for differatures
4 uilding for difftimes
iles within inn
5 °C 0 °C27.5 35
9 11.536.5 46.515 2512 199.5 147.5 126 10
0 / 68 25.5 / 63
29.5 40.5
11% 16%≈ 3 h ≈ 4 h80 % ≈ 87 %
ambient tempe
2h 3h35 54.5
11.5 17.546.5 7225 3019 2514 2112 1710 15
.5 / 63 38 / 61
40.5 62.5
16% 24%≈ 4 h ≈ 6 h87 % ≈ 86 %
overheating
r walls for figure 7.
fferent
fferent
ner walls
5 °C38.513
51.526.524
19.515.513
3 26.5 / 55
48
19%≈ 4.5 h≈ 93 %
erature
6h113.5
35148.5
4543383228
74 / 59
126
49%≈ 12 h≈ 85 %
time
Proceedings of BS2013: 13th Conference of International Building Performance Simulation Association, Chambéry, France, August 26-28
- 2721 -

DISCUSSION Temperatures The chosen minimum temperature of 20 °C results in an operative temperature of approx. 19 °C which according to (Peeters, L., 2009) is still acceptable for approx. 65 % of the occupants for an ambient temperature of 0 °C. Furthermore, an overheating phase would potentially be used to preheat the building before the residents come home. Taking this into account the low initial temperature corresponds well to a temperature setback for the time the building is unoccupied.
The reached upper temperature of 24.5 °C corresponds to an operative temperature of 22 °C, which is acceptable for more than 90 % of occupants (Peeters, L., 2009). Even if the desired 25 °C is reached, operative temperatures stay at a comfortable level. However overheating temperatures should not become much higher due to the increasing difference between air and operative temperature, which is usually recognized as uncomfortable by occupants.
Due to the rise of wall temperatures after the overheating phase the operative temperature decreases slower than the air temperature. Therefore, when the initial air temperature is reached again, the operative temperature is still at a level acceptable for more than 80 % of the occupants.
Storage in thermal mass Already the static analysis for that un-insulated massive brick building shows that even if theoretically charging the total thermal mass of the building by one degree it delivers only enough energy to compensate the heat losses for 16 hours.
Nevertheless, even in the base scenario with only two hours overheating time an energy amount corresponding to the building’s total heat demand for approx. four hours could be stored. For an overheating time of 6 hours even energy corresponding to almost a half day’s energy demand could be stored. This is mainly influenced by the much stronger temperature increase within the inner walls. However, due to heat conduction into deeper wall layers and the slow temperature increase of the heated building mass, the walls cannot deliver the stored heat at the required rate.
Thus it can be seen that while the magnitude of energy, which can be stored in building mass, is considerable the rate of heat transfer is not sufficient to substitute the heating system. Rather the stored energy can reduce the residual heating load for a given timeframe. For such application, however, the building mass delivers good performance. After just an overheating time of 2 hours the buildings thermal demand is reduced by almost 20 % for a timeframe of four hours at an ambient temperature of 0 °C. For comparison, it would require a 350 l water buffer
tank with a temperature difference of approx. 20 °C to store the same amount of energy. The energy released by the wall mass within the next 24 hours after overheating still covers 10 % of the total 24h energy demand of the building. For overheating times of up to 6 h the capacity could be almost tripled. Still, longer overheating times cause heat transfer into deeper layers of the inner wall mass, thus leading to longer discharging times and less controllable Demand Side Management (DSM). Storage efficiency was 87 % for the base scenario and going only slightly down for longer overheating times due to higher heat losses with raised indoor temperature.
For varying ambient temperatures the storage performance changes distinctly. Due to higher heat losses at lower ambient temperatures the installed system fails to reach the desired overheating temperature. With an ambient temperature of -5 °C this reduces the thermal storage capacity by over 20 % as compared to the base scenario. Also the storage efficiency goes down, since the larger temperature spread between inside and outside causes heat stored in the outer wall to be lost before it can be discharged. For even lower ambient temperatures the heating system could not provide enough heat to charge the walls considerably.
For higher temperature, lower heat losses to the ambient allow for a larger storage capacity and higher efficiencies. However, the due to the lower heat losses indoor temperature rises quicker and falls slower thus, bringing more energy into deeper layers of the wall mass. This results in extended discharging times of the wall mass. For an ambient temperature of 5 °C already 13 % less energy is discharged on the first day after overheating. In simulations with higher ambient temperatures the heat pump control reduced the flow temperature to such extent that desired overheating temperatures could not be reached anymore. Thus, such ambient temperature controlled mechanism would require an override if storage in thermal mass is used.
CONCLUSIONS It is shown that even in old un-insulated buildings thermal energy storage within the wall mass has potential to support residential DSM activities. Even for short overheating periods energy amounts equivalent to a typical hot-water buffer tank capacity can be stored. However, due to heat conduction into deeper wall layers and the slow temperature increase of the building mass, the loaded walls cannot substitute the heating system. Still they reduce the buildings energy demand distinctly. Extrapolating the capacity of the ideally modelled building to the whole project region of 2DSM in Bottrop with approx. 950 apartments, thermal energy off 5MWh could be stored within two hours and recovered within five hours after the overheating phase.
Proceedings of BS2013: 13th Conference of International Building Performance Simulation Association, Chambéry, France, August 26-28
- 2722 -

Better storage capacities can be reached with longer overheating phases and higher ambient temperatures. However, stored energy is then discharged very slowly and integration into dynamic DSM would be hard to implement and control. Good DSM performance is reached with shorter overheating periods at cold weather conditions. Thereby less heat is transferred into deeper wall layers and more of the stored energy is consumed within an assessable timeframe.
It is also shown, that such storage activities would be supported by some changes in the buildings heating system and control. Thus, installation of heating systems exceeding the design heat load of the building increase the storage potential, especially in cold ambient conditions. Furthermore, control systems lowering the flow temperature with increasing ambient temperatures would require an overrun function, otherwise this function limits the storage potential significantly.
In further research it needs to be evaluated how the potential storage capacity would change for different building materials. Also the storage effect for other distribution systems e.g. floor heating requires further evaluation. Finally, once the general potential is shown, additional dynamic effects of furnishing upon the storage capacity can be analyzed in the future.
ACKNOWLEDGEMENT Grateful acknowledgement is made for the financial support by E.ON gGmbH.
REFERENCES Artmann, N. (2007). “Climatic potential for passive
cooling of buildings by night-time ventilation in Europe”. Applied Energy. 84 (2), pp. 187-201.
BCP Busarello + Cott + Partner AG (2012). “NEPLAN Desktop Overview”. Available: online. http://www.neplan.ch/. [accessed: 08.12.2012].
BMWi, Bundesministerium für Wirtschaft und Technologie (2011). „Endenergieverbrauch nach Anwendungsbereichen“. Berlin.
Braun, J. (1990). “Reducing energy costs and peak electrical demand through optimal control of building thermal storage.” ASHRAE transactions, 96 (2), pp. 876-888.
DIN, Deutsches Institut für Normung e.V. (2003). „DIN V 4108 - 6.5.2 – Thermal protection and energy economy in buildings – Part 6: Calculation of annual heat and annual energy use”. Berlin: Beuth Verlag.
DIN, Deutsches Institut für Normung e.V. (2003 /2). “DIN EN ISO 12831 – Heating systems in
buildings - Method for calculation of the design heat load”. Berlin: Beuth Verlag.
DIN, Deutsches Institut für Normung e.V. (2008). “DIN EN ISO 6946 – Building components and building elements – Thermal resistance and thermal transmittance – Calculation method”. Berlin: Beuth Verlag.
DIN, Deutsches Institut für Normung e.V. (2008 /2). “DIN EN ISO 13370 – Thermal performance of buildings – Heat transfer via the ground – Calculation methods”. Berlin: Beuth Verlag.
DIN, Deutsches Institut für Normung e.V. (2011). “Energy efficiency of buildings – Calculation of the net, final and primary energy demand for heating, cooling, ventilation, domestic hot water and lighting – Part 10: Boundary conditions of use, climatic data”. Berlin: Beuth Verlag.
DWD, Deutscher Wetterdienst (2012). “Klima und Umwelt – Klimadaten”. Available: online. http://www.dwd.de/. [accessed: 23.11.2012].
Eicker, U. (2012). “Energieverbrauch von Gebäuden und solares Deckungspotential. Wiesbaden: Vieweg+Teubner Verlag.
Glück, B. (1999). “Thermische Bauteilaktivierung - Nutzen von Umweltenergie und Kapillarrohren”. Heidelberg: C. F. Müller Verlag.
Kolokotroni, M. (1998). “Summer cooling with night ventilation for office buildings in moderate climates”. Energy and Buildings, 27 (3), pp. 231-237.
Manz, H. et al. (2006). “Series of experiments for empirical validation of solar gain modeling in building energy simulation codes - Experimental setup, test cell characterization, specifications and uncertainty analysis”. Building and Environment, 41 (12), pp. 1784-1797.
Modelica Association et al. (2012). “Modelica and the Modelica Association”. Available: online. https://www.modelica.org/. [accessed: 08.10.2012].
Molitor, C. et al. (2012). “New energy concepts and related information technologies: Dual Demand Side Management”. Innovative Smart Grid Technologies, 2012 IEEE PES, pp.1-6.
Peeters, L. (2009). “Thermal comfort in residential buildings: comfort values and scales for building energy simulation”. Applied Energy, 86 (5), pp. 772-780.
STAWAG, (2013). “Preisblatt - StromSTA Öko für Wärmepumpe”. Available: online. http://www.stawag.de/. [accessed: 30.01.2013].
Tritschler, M. (1999). „Bewertung der Genauigkeit von Heizkostenverteilern“. Dissertation, Stuttgart University.
Proceedings of BS2013: 13th Conference of International Building Performance Simulation Association, Chambéry, France, August 26-28
- 2723 -