Embed Size (px)
Citation preview

curs andtional and in many alert byic queryad-time
how thattions are
rs and the resultsies and abstractgram’s
ilertion that be
yreceiveompiler
existenceow can
value ofuse they
Dynamic Query-Based Debugging
Raimondas Lencevicius, Urs Hölzle, and Ambuj K. SinghDepartment of Computer Science
University of California, Santa Barbara, CA 93106{raimisl,urs,ambuj}@cs.ucsb.edu
http://www.cs.ucsb.edu/{~raimisl,~urs,~ambuj}
Technical Report TRCS 98–34December 1, 1998
Abstract. Program errors are hard to find because of the cause-effect gap between the time when an error octhe time when the error becomes apparent to the programmer. Although debugging techniques such as condidata breakpoints help to find error causes in simple cases, they fail to effectively bridge the cause-effect gapsituations. Dynamic query-based debuggers offer programmers an effective tool that provides instant errorcontinuously checking inter-object relationships while the debugged program is running. To speed up dynamevaluation, our debugger (implemented in portable Java) uses a combination of program instrumentation, locode generation, query optimization, and incremental reevaluation. Experiments and a query cost model sselection queries are efficient in most cases, while more costly join queries are practical when query evaluainfrequent or query domains are small.
1. Introduction
Many program errors are hard to find because of a cause-effect gap between the time when the error occutime when it becomes apparent to the programmer by terminating the program or by producing incorrect[Eis97]. The situation is further complicated in modern object-oriented systems which use large class librarcreate complicated pointer-linked data structures. If one of these references is incorrect and violates anrelationship between objects, the resulting error may remain undiscovered until much later in the proexecution.
For example, consider thejavac Java compiler, a part of Sun’s JDK distribution. During a compilation, this compbuilds an abstract syntax tree (AST) of the compiled program. Assume that this AST is corrupted by an operaassigns the same expression node to the fieldright of two different parent nodes (Figure 1). The parent nodes may
instances of any subclass ofBinaryExpression; for example, the parent may be anAssignAddExpression object or aDivideExpression object, while the child could be anIdentifierExpression. The compiler traverses the AST mantimes, performing type checks and inlining transformations. During these traversals, the child expression will contradictory information from its two parents. These contradictions may eventually become apparent as the cindicates errors in correct Java programs or when it generates incorrect code. But even after discovering the of the error, the programmer still has to determine which part of the program originally caused the problem. Hwe help programmers to find such errors as soon as they occur?
The programmer could try to use data breakpoints [WLG93], i.e., breakpoints that stop the program when thea particular field changes. However, data breakpoints (even if conditional) do not help to debug this error beca
Figure 1. Error in javac AST
Expression 2
BinaryExpression 1
Expression 1right
BinaryExpression 2
right
1

minished.ly if therom the
itionals true.s whichct—the
thee, so the find allary,rk “by
query-ll object
theent forate,ged may
on tosults of
ovide this result ofry-basedmmer
in 100%] show
n mostons areformancejvm98grams
llows:
are specific to a particular instance. With hundreds or even thousands ofBinaryExpression instances, and in thepresence of asynchronous events and garbage collection, the effectiveness of data breakpoints is greatly diIn addition, it is hard to express the above error as a simple boolean expression. The error occurs onexpression is shared by another parent node—a relationship difficult to observe from the other parent or fchild itself. In other words, by looking just at the fieldright of someBinaryExpression object we cannot determinewhether this object and its new field value are erroneous.
A programmer could also try to use another conventional tool, conditional breakpoints [Kes90]. Condbreakpoints check a condition at a particular program location and stop the program if this condition iConditional breakpoints fail to find our bug for the same reason: the condition cannot easily reference objectare not reachable from the scope containing the breakpoint. Yet we must find exactly such an objeBinaryExpression containing a duplicate reference to the childExpression object. To accomplish this task, theprogrammer could write custom testing code for use by conditional breakpoints. For example, thejavac compilercould keep a list of allBinaryExpression objects and include methods that iterate over the list and checkcorrectness of the AST. However, writing such code is tedious, and the testing code may be used only onceffort of writing it is not easily recaptured. Finally, even with the test code at hand, the programmer still has toassignments to the fieldright and place a breakpoint there; injavac, there are dozens of such statements. In summthe tool (conditional breakpoints) provides minimal support and the programmer ends up doing all the wohand”.
A more effective way to check an inter-object constraint would be to combine conditional breakpoints with a based debugger [LHS97]. Similar to an SQL database query tool, a query-based debugger (QBD) finds atuples satisfying a given boolean constraint expression. For example, the query
BinaryExpression* e1, e2. e1.right == e2.right && e1 != e2
would find the objects involved in the abovejavac error. The breakpoints would then carry the condition that above query return a non-empty result. Unfortunately, even well-optimized QBD executions would be inefficithis task. With hundreds or thousands ofBinaryExpression objects, each query becomes quite expensive to evaluand since the query is reevaluated every time a conditional breakpoint is reached, the program being debugslow down by several orders of magnitude. (We will substantiate this claim in section 4.3.1.)
We propose a new solution,dynamic query-based debugging, which can overcome these problems. In additiimplementing the regular QBD query model, a dynamic query-based debugger continually updates the requeries as the program runs, and can stop the program as soon as the query result changes. To prfunctionality, the debugger finds all places where the debugged program changes a field that could affect thethe query and uses sophisticated algorithms to incrementally reevaluate the query. Therefore, a dynamic quedebugger finds thejavac AST bug as soon as the faulty assignment occurs, and it does so with minimal prograeffort and low program execution overhead.
We have implemented such a dynamic query-based debugger for Java. Our prototype is portable (written pure Java), and surprisingly efficient. Experiments with large programs from the SPECjvm98 suite [SPEC98that selection queries are very efficient for most programs, with a slowdown of less than a factor of two iexperiments. Through measurements, we determined that 95% of all fields in the SPECjvm98 applicatiassigned less than 100,000 times per second. Using these numbers and individual evaluation times, our permodel predicts that selection queries will have less than 43% overhead for 95% of all fields in the SPECapplications. More complicated join queries are less efficient but still practical for small query domains or prowith infrequent queried field updates.
2. Query Model and Examples
Dynamic query-based debugging uses the query model proposed in QBD [LHS97]. The query syntax is as fo
2
of
he classomain
h domain.th certaintly also
ions; we
ividualn SQL
, ensuringeality, thetion, theremental
eaind
e have inaher
<Query> ::== <DomainDeclaration> { ; <DomainDeclaration> } .<ConditionalExpression>
<DomainDeclaration> ::== <ClassName> [*] <DomainVariableName>{ <DomainVariableName> }
The query has two parts: one or moreDomainDeclarations that declare variables of classClassName, and aConditionalExpression. The first part is called thedomain part and the second theconstraint part. Consider anotherjavac query:
FieldExpression fe; FieldDefinition fd.fe.id == fd.name && fe.type == fd.type && fe.field != fd
The first part of the query defines thesearch domain of the query, using universal quantification. The domain partthe above example should be read as “for all FieldExpressionsfe and all FieldDefinitionsfd...”. FieldExpression is aclass name and its domain contains all instances of the class. If a “*” symbol in a domain declaration follows tname (as in thejavac query discussed in the introduction), the domain includes all objects of subclasses of the dclass, otherwise the domain contains only objects of the indicated class itself.
The second part of the query specifies the constraint expression to be evaluated for each tuple of the searcConstraints are arbitrary Java conditional expressions as defined in the Java specification §15.24 [GJS96] wisyntactic restrictions. We disallow variable increments which have no semantic meaning in a query. We currendisallow array accesses but plan to implement them in the future. Constraints can contain method invocatassume that these methods are side effect free.
Semantically, the expression will be evaluated for each tuple in the Cartesian product of the query’s inddomains, and the query result will include all tuples for which the expression evaluates to true (similarly to aselect query). Conceptually, the dynamic debugger reevaluates a query after the execution of every bytecodethat no result changes are unnoticed. The debugger stops the program whenever the result changes. In rdebugger reevaluates the query as infrequently as possible without violating these semantics. In addidebugger will reevaluate only the part of the query that changed since the last evaluation. We describe the increevaluation technique in detail in section 3.4.1.
We refer to queries with a single domain variable asselection queries; following common database terminology, wcall the rest of the queriesjoin queries because they involve a join (Cartesian product) of two or more domvariables. Join queries with equality constraints only (e.g.,p1.x == p2.x) arehash joins because they can be evaluatemore efficiently using a hash table [LHS97].
2.1 Examples
We now discuss examples of queries that illustrate the need for dynamic query debuggers.
2.1.1 Javac Compiler
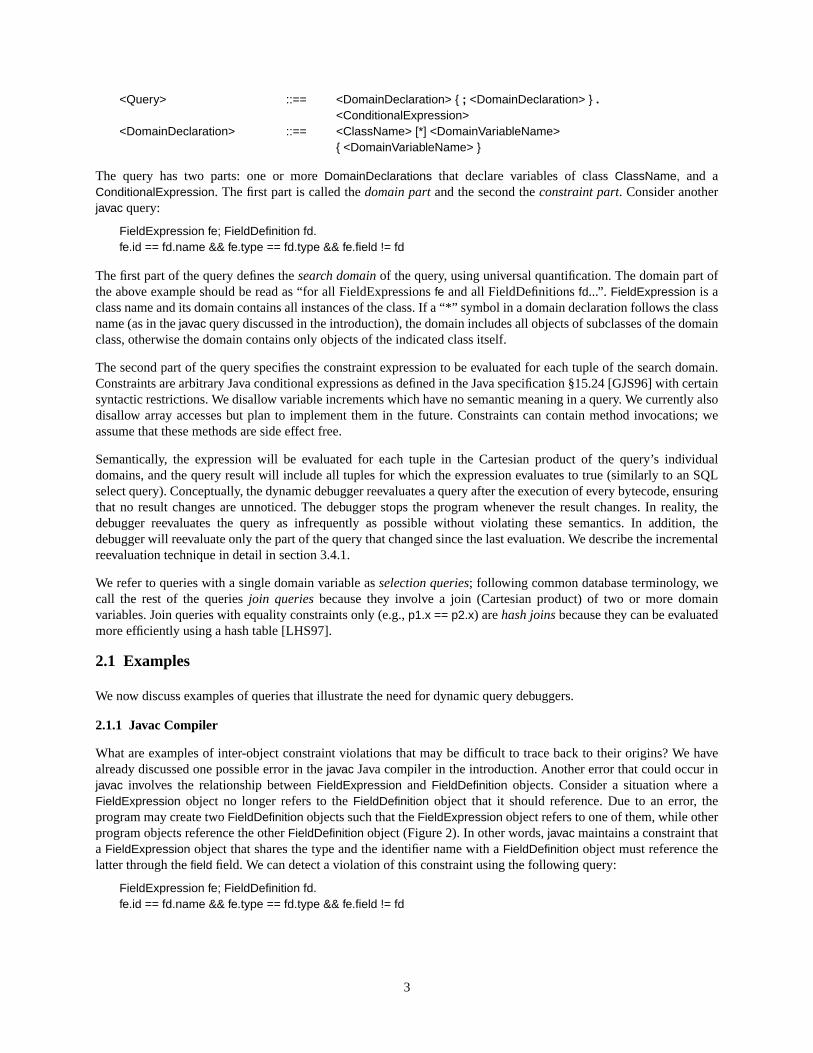
What are examples of inter-object constraint violations that may be difficult to trace back to their origins? Walready discussed one possible error in thejavac Java compiler in the introduction. Another error that could occurjavac involves the relationship betweenFieldExpression and FieldDefinition objects. Consider a situation where FieldExpression object no longer refers to theFieldDefinition object that it should reference. Due to an error, tprogram may create twoFieldDefinition objects such that theFieldExpression object refers to one of them, while otheprogram objects reference the otherFieldDefinition object (Figure 2). In other words,javac maintains a constraint thata FieldExpression object that shares the type and the identifier name with aFieldDefinition object must reference thelatter through thefield field. We can detect a violation of this constraint using the following query:
FieldExpression fe; FieldDefinition fd.fe.id == fd.name && fe.type == fd.type && fe.field != fd
3

cult to
a simple somecan be
g query
e period able to
pear ast shouldilures, as
tures that code
m querymalltalk)
r runs aram and
vant fieldva virtualit invokesate query
ebugger
This complicated constraint can be specified and checked with a simple dynamic query, but it would be diffiverify using conditional breakpoints.
2.1.2 Ideal Gas Tank Example
Another program we examined is an applet simulating a tank with ideal gas molecules. Though this applet is simulation of gas molecules moving in the tank and colliding with the tank walls and each other, it hasinteresting inter-object constraints. First, all molecules have to remain within the tank, a constraint that specified by a simple selection query:
Molecule* m. m.x < 0 || m.x > X_RANGE || m.y < 0 || m.y > Y_RANGE
Another constraint requires that molecules not occupy the same position as other molecules, and the followinchecks this constraint:
Molecule* m1 m2. m1.x == m2.x && m1.y == m2.y && m1 != m2
This constraint is interesting because its violation is a transient failure. Transient failures disappear after somof time, so even though the program behaves differently than the programmer expected, queries will not bedetect failures if they are asked too late. The molecule collision error is such a transient failure—it will disapthe molecules continue to move. However, the applet will behave erroneously: for example, molecules thahave collided with each other will pass through each other. Dynamic queries are necessary to find transient faa delayed query reevaluation may fail to detect the error entirely.
3. Implementation
We have implemented a Java dynamic query-based debugger in pure Java. Java contains a number of feasimplified the implementation. We used the ability to write custom class loaders [LB98] to perform load-timeinstrumentation. Java’s bytecode class files proved simple to instrument. The debugger creates custoevaluation code by using load-time code generation. The debugger can be ported to other languages (e.g. Sthat have an intermediate level format similar to bytecodes.
3.1 General Structure of the System
Figure 3 shows a data-flow diagram of the dynamic query-based debugger. To debug a program, the usestandard Java virtual machine with a custom class loader. The custom class loader loads the user proginstruments the bytecodes loaded, by adding debugger invocations for each domain object creation and releassignment. The class loader also generates and compiles custom debugger code. After loading, the Jamachine executes the instrumented user program. Whenever the program reaches instrumentation points, the custom debugger code, which calls other debugger runtime libraries to reevaluate the query and to generresults. The debugger currently does not handle multithreaded code.
The rest of this section discusses the most important parts of the debugger in more detail: how the dinstruments a Java program, what parts it instruments, and how it evaluates a query.
Figure 2. Another error injavac AST
refers toFieldDefinition 2
FieldDefinition 1
should refer toFieldExpression 1
field
4

class filesnts to thehem. The
e loadere BCA
lsoeplaces a
nts: the
ented
fields loader
xt section
ation thatthat couldts fields ory. We call
a minimalcts and
3.2 Java Program Instrumentation
To enable a dynamic query for a program, the user specifies a query string. The debugger then instruments to invoke the debugger after all events that may change the result of the query. The debugger finds assignmefields referenced in the query change set (section 3.3) and inserts debugger invocations after each one of tsystem also inserts debugger invocations after each call to a constructor of a domain object.
Figure 4 shows an example of the instrumentation process for a Java method. To instrument class files, thtransforms them in memory into a malleable format using modified class file handling tools borrowed from thclass library [KH98]. Then the loader finds allputfield bytecodes that assign to the fields of interest—like fieldx inFigure 4—and replaces theseputfield bytecodes withinvokestatic bytecodes invoking debugger code. The system ainserts such debugger invocations after each call to a constructor of a domain object. When the debugger rputfield bytecode with aninvokestatic call, it also inserts the reference to the customdebug method of theDebuggingCode class into the constant pool of the instrumented class. The custom method takes two argumeobject that theputfield would have updated—aMolecule object in the example—and thenewValue value to beassigned to the object field. These objects are already on the stack before execution of theputfield, so they will becorrectly passed as arguments to thedebug method, and the debugger does no stack manipulation of the instrummethod. Since the originalputfield has been replaced by theinvokestatic bytecode, the customdebug methodperforms the assignment originally executed by theputfield. The debugger determines the name of the assigned and the correct types of objects and values from the class file’s constant pool. After instrumentation, the clastransforms the code back into the class file format and passes the image to the defaultdefineClass method.
The class loader instruments assignments and object constructors that influence the query result. The nedescribes how the debugger determines which assignments and constructors to instrument.
3.3 Change Monitoring
The dynamic query debugger updates the query result every time the debugged program performs an opermay affect the query result. Thus, the program being debugged has to invoke the debugger after every event change the query result. The query result may change because some object assigns a new value to one of ibecause a new object is constructed. However, not all field assignments and object creations affect the querthe set of constructors and object field assignments affecting the results of a query the query’schange set. Though wecan use all assignments and all constructors as a conservative change set for any query, we are interested inchange set for efficient query evaluation. Such a change set contains only constructors of domain objeassignments to domain object fields referenced in a query.
Consider theMolecule query:
Molecule* m1 m2. m1.x == m2.x && m1.y == m2.y && m1 != m2
Figure 3. Data-flow diagram of dynamic query-based debugger
Java program
Query stringand change set
Customdebugger code
InstrumentedJava program
Customclass loader
Standard JavaVirtual Machine
Queryresults
Debuggerlibrary code
5

as
debuggered, the uses the and to domain
ry for the
e
hods onh objectstask; for simplifyt handlegle-levelritten as:
s to askoin query.
calls theery during
never theent, the
The change set of this query consists of the constructors of theMolecule class and its subclasses as well assignments toMolecule fieldsx andy. Assignments to other molecule fields such ascolor do not belong to the changeset.
The change set of a query tells the class loader what assignments and constructors it should instrument. Thetracks all domain objects by maintaining domain object collections. Every time a domain object is creatprogram invokes the debugger which places the new domain object into its domain collection. The debuggerdomain collection in query evaluations to iterate through all domain objects. To maintain query correctnessfacilitate garbage collection, the debugger should allow the garbage collector to delete dead objects fromcollections. While such behavior can be implemented using weak pointers, we have not done so yet.
The change set of a query becomes complicated if constraints contain a chain of references. Consider a queSPECjvm98 ray tracing program:
IntersectPt ip. ip.Intersection.z < 0
The Intersection field is aPoint object, and the query result depends on itsz value. The query result may change if thz value changes, or if a new value is assigned to theIntersection field. Furthermore, thePoint object referenced by theIntersection field may be shared among multiple domain objects. In this case, a change in onePoint object can affectmultiple domain objects. A chain of references also occurs when a domain instance method invokes metobjects referenced in its fields, and these methods in turn depend on the fields of the receiver. Tracking whicaccessed through a chain of field references influence which domain objects becomes a complicated example, to do it efficiently, nested objects need to point back to the domain objects that reference them. Tothe prototype implementation, we support only the explicit chains of references in the query, and we do nomethods that access chains of references. Our debugger rewrites the query by splitting the chain into sinaccesses and by adding additional domains and constraints. For example, the ray tracing query above is rew
IntersectPt ip; Point* __Intersection.ip.Intersection == __Intersection && __Intersection.z < 0
Chain reference splitting adds overhead by introducing additional joins into the query but it also allows usermore complex queries. The overhead can be an order of magnitude when a selection query is rewritten as a jWe do not handle native methods, because their debugging is outside the scope of a Java debugger.
To summarize, we use the change set of the query to instrument the Java program. The instrumented programdebugger after every event that could change the result of the query, and the debugger reevaluates the queach call.
3.4 Overview of Query Execution
In this section we describe what happens after an instrumented event occurs in the debugged program. Wheprogram invokes the debugger, it passes the object involved in the event. If the event is a field assignm
Figure 4. Java program instrumentation
...x += ...;...
...22: iadd23: putfield 3726: aload_0...
Compile
...22: iadd23: invokestatic debug26: aload_0...
public final class DebuggingCode implements RunTimeCode {public static void debug(Molecule updatedObject, int newValue) {... updatedObject.x = newValue; // replaces putfield 37
QueryTool.runTool(updatedObject); // invokes query evaluator}
}
Load and instrument
6

xecution.
er
toating the
ld is equaltion, yetry and can.
ry-basedse joiny using
ies of ourquently, ahniquesnsider a
t union.
usually only theangedes in thenlyeneral,ation. Ifduces an query
curre
program also passes the new value to be assigned to the field. Figure 5 shows the control flow of the query eFirst, the debugger checks whether the changed object is a domain object. Consider a query that findsId objects witha negative type code:
Id x. x.type < 0
Here, Id is a subclass of theExpression class, and thetype field is defined inExpression. Thus, the program mayinvoke the debugger when thetype field inherited from theExpression class is assigned in an object of anothExpression subclass. For example, the program invokes the debugger after assigning thetype field in anArithmeticExpression object. This object shares thetype field with the domain class objects, but it does not belongthe query domain, so the debugger immediately returns to the execution of the user program without reevaluquery.
If the object passes the domain test, the debugger checks whether the value being assigned to the object fieto the value previously held by the field. For example, some molecules do not move in the ideal gas simulatheir coordinates are updated at each simulation step. Such assignments do not change the result of the quebe ignored by the debugger1. The debugger does not perform this test if the invoking event is an object creation
After these two tests, the debugger starts reevaluating the query. Our previous work on non-incremental quedebuggers [LHS97] contained a query evaluation algorithm similar to the evaluation of a relational databacoupled with a selection. The dynamic query-based debugger improves upon the previous algorithm bincremental reevaluation as discussed below.
3.4.1 Incremental Reevaluation
When the program invokes the debugger, it passes the changed object to the debugger. From the propertchange sets, we know that this object is the only object that changed since the last query evaluation. Consefull reevaluation of the query for all domain objects is unnecessary. We use incremental reevaluation tecdeveloped for updates of materialized views in databases [BC79, BLT86] to speed up query execution. Coquery, a join of three domainsA * B * C, e.g.,
A a; B b; C c. a.x == b.y && b.z < c.w
The “*” symbol denotes a Cartesian product with some selection constraint; the “+” symbol below denotes seIf an object of domainB changes, the new result of the query is
A * (B + ∆B) * C = (A * B * C ) + (A * ∆B * C)
The first part of the result is the result of the previous query evaluation. The debugger stores this result—empty for assertion queries—and does not need to reevaluate it. The second part of the result containschanged object (∆B) of domainB combined with objects of the other domains. The debugger evaluates the chpart in the same way as it would evaluate the whole query. Figure 6 shows an incremental evaluation of changquery result. The execution starts with the changed object∆B passed from the user program. Because this is the oobject for which the debugger evaluates the first constraint, the intermediate result is likely to be empty. In gthe size of intermediate results is much smaller in the incremental evaluation, speeding up the query evaluintermediate results are not empty, the debugger continues the evaluation in the usual manner and proincremental result(A * ∆B * C). The system then merges the result with the previous result to form the completeresult.
1 This test is just one example of tests that quickly verify whether the query result changed due to the assignment. We arentlyinvestigating more sophisticated tests that detect more query-invariant assignments.
Same valueassignment test
Instrumented event Domain test
Queryreevaluation
Resultupdate
Figure 5. Control flow of query execution
7

ibed inine theext, and
ing thend calls as. Becausee. During
n
ns. This code thatery has a
ches a
es into
sked bye, eachebuggerd cover
and high queries
The query evaluation is further optimized by finding efficient join orders and by using hash joins as descr[LHS97]. Because sizes of domains change during program runtime and we cannot efficiently determselectivities of constraints, we use simple heuristics for join ordering: execute selections first, equality joins ninequality constraints last.
3.4.2 Custom Code Generation for Selection Queries
Constraints of selection queries are usually very simple and can be evaluated very fast. Instead of performgeneral query execution algorithm described in section 3.4.1, which goes through numerous general steps anumber of methods, the debugger can evaluate just the few tests necessary to check the selection constraintthese tests depend on the query asked, the code for their evaluation has to be generated at program load timthe loading of the user program, the debugger generates a Java class with adebug method. We show such a method iFigure 7 for the query
Molecule1 m. m.x > 350
The first three statements of the method contain the code common for both unoptimized and optimized versiocode performs the domain test and the same value assignment test described in section 3.4. The optimizedfollows evaluates the selection constraint on the changed object and calls the debugger runtime only if the qu
non-empty result. The debugger uses thedebug method as an entry point that the user program calls when it reainstrumentation points. With custom code generated, thedebug method contains all code needed to evaluateselection, so the reevaluation costs only one static method call. Furthermore, thedebug method—a member of afinalclass—may even be inlined into the instrumentation points by a JIT compiler. We could also inline the bytecodthe instrumented method.
4. Experimental Results
Ideally, a test of the efficiency of a dynamic query-based debugger would use real debugging queries aprogrammers using the tool for their daily work. Though we tried to predict what queries programmers will usdebugging situation is unique and requires different queries. To perform a realistic test of the query-based dwithout writing hundreds of possible queries, we selected a number of queries that in complexity and overheathe range of queries asked in debugging situations. The selected queries contain selection queries with lowcost constraints. The test also includes hash-join and nested-join queries with different domain sizes. The
Collection A
Figure 6. Incremental query evaluation
Changed object ∆B Collection (A * ∆B)Instrumentedassignment
Collection (A * ∆B * C)
+Collection (A * B * C)
Collection C
Figure 7. Selection evaluation using custom code
public final class DebuggingCode implements RunTimeCode {public static void debug (Molecule updatedObject, int newValue) {
// Code common for both general and optimized versionsif (! (updatedObject instanceof Molecule1))
{ updatedObject.x = newValue; return; }if (updatedObject.x == newValue) return;updatedObject.x = newValue;// Instead of calling general query evaluation method,// evaluate constraint hereif (updatedObject.x > 350) QueryTool.outputResult(updatedObject);
}
8

s. Thesealuated
icate the
essors)
ing the
1) for a
olecule
ourse
check programs that range from small applets to large applications and (for stress-tests) microbenchmarkapplications invoke the debugger with frequencies ranging from low to very high, where a query has to be evat every iteration of a tight loop. Consequently, the experimental results obtained for the test set should indrange of performance to be expected in real debugging situations.
For our tests we used an otherwise idle Sun Ultra 2/2300 machine (with two 300 MHz UltraSPARC II procrunning Solaris 2.6 and Solaris Java 1.2 with JIT compiler (Solaris VM (build Solaris_JDK_1.2_01, native threads,sunwjit)) [Sun99]. Execution times are elapsed times and were measured with millisecond accuracy usSystem.currentTimeMillis() method.
4.1 Benchmark Queries
To test the dynamic query-based debugger, we selected a number of structurally different queries (Tablenumber of different programs (Table 2):
• Queries 1 and 13 check a small ideal gas tank simulation applet that spends most of the time calculating mpositions and assigns object fields very infrequently. It has 100 molecules divided amongMolecule1, Molecule2andMolecule3 classes. The application performs 8,000 simulation steps.
• Queries 2 and 14 check theDecaf Java subset compiler, a medium size program developed for a compiler cat UCSB. TheToken domain contains up to 120,000 objects.
• Query 3 checks theJess expert system, program from the SPECjvm98 suite [SPEC98].
Query
Slo
wdo
wn
Invocationfrequency(events / s)
Molecule1 z. z.x > 350 1.02 15,000
Id x. x.type < 0 1.11 16,000
spec.benchmarks._202_jess.jess.Token z. z.sortcode == -1 1.25 169,000
spec.benchmarks._201_compress.Output_Buffer z. z.OutCnt < 0 1.18
1,900,000spec.benchmarks._201_compress.Output_Buffer z. z.count() < 0 1.27
spec.benchmarks._201_compress.Output_Buffer z. z.lessOutCnt(0) 1.37
spec.benchmarks._201_compress.Output_Buffer z. z.complexMathOutCnt(0) 5.83
spec.benchmarks._201_compress.Compressor z. z.in_count < 0 1.18 933,000
spec.benchmarks._201_compress.Compressor z. z.out_count < 0 1.10196,000
spec.benchmarks._201_compress.Compressor z. z.complexMathOutCount(0) 1.83
spec.benchmarks._205_raytrace.Point p. p.x == 1 1.23 787,000
spec.benchmarks._205_raytrace.Point p. p.farther(100000000) 1.98 2,300,000
Molecule1 z; Molecule2 z1.z.x == z1.x && z.y == z1.y && z.dir == z1.dir && z.radius == z1.radius (33x33 hash join)2.13 54,000
Lexer l; Token t. l.token == t && t.type == 27 (120,000x600 hash join) 3.43 25,000
spec.benchmarks._205_raytrace.Point p; spec.benchmarks._205_raytrace.IntersectPt ip.p.z == ip.t && p.z < 0 (85,000x8,000 hash join) 229 350,000
spec.benchmarks._201_compress.Input_Buffer z;spec.benchmarks._201_compress.Output_Buffer z1.z1.OutCnt == z.InCnt && z1.OutCnt < 100 && z.InCnt > 0 (1x1 hash join)
157 1,500,000
spec.benchmarks._201_compress.Compressor z;spec.benchmarks._201_compress.Output_Buffer z1.z1.OutCnt < 100 && z.out_count > 1 && z1.OutCnt / 10 > z.out_count (1x1 join)
77 2,600,000
Test5 z. z.x < 0 6.4 42,000,000
TestHash5 th; TestHash1 th1. th.i == th1.i (1x20 hash join) 22840,000,000
TestHash5 th; TestHash1 th1. th.i < th1.i (1x20 join) 930
Table 1. Benchmark queries
9

ce
ance by
ities. Forre costlyuery 6) query 7y similarcationon, i.e.,od to thebugger
evaluationdebugger 15–17,
enefits of
owdownle, the
of 2. Thege as our
equalityonly 33er secondprogramant.
nchmarkrogram
• Queries 4–10, and 16–17 check thecompress program from the SPECjvm98 suite. Our queries referenfrequently updated fields ofcompress.
• Queries 11–12 and 15 check the ray tracing program from the SPECjvm98 suite. ThePoint domain contains up to85,000 objects; theIntersectPt domain has up to 8,000 objects.
• Queries 18–20 check artificial microbenchmarks. These microbenchmarks stress test debugger performexecuting tight loops that continuously update object fields.
Structurally, queries can be divided into the following classes:
• Queries 1–12 and 18 are simple one-constraint selection queries with a wide range of constraint complexexample, query 4 has a very simple low-cost constraint that compares an object field to an integer. The moconstraint in query 5 invokes a method to retrieve an object field. Another costly alternative constraint (qinvokes a comparison method that takes a value as a parameter. Finally, the most costly constraint inperforms expensive mathematical operations before performing a comparison. Queries 8 and 9 have verconstraints, but differ 4.8 times in debugger invocation frequency. In this paper, by “debugger invofrequency” we mean the frequency of events in the original program that would trigger a debugger invocatithe invocation frequency for a debugger with no overhead. Query 12 compares the parameter of the methdistance of a point to the origin. This query combines costly mathematical operations with increased deinvocation frequency, because its result depends on all three coordinates ofPoint objects.
• Queries 13–17 and 19–20 are join queries. Queries 13–16 and 19 can be evaluated using hash joins. The of queries 17 and 20 has to use nested-loop joins. For join queries, the slowdown depends both on the invocation frequency and sizes of the domains. Queries 13–14 have low invocation frequencies; queries19–20 have high invocation frequencies. Queries 14 and 15 have large domains.
In the next section, we discuss the performance of these queries. Section 4.3 then discusses the efficiency bincremental evaluation, custom selection code, and unnecessary assignment detection.
4.2 Execution Time
Figure 8 shows the program execution slowdown for application programs when queries are enabled. The slis the ratio of the running time with the query active to the running time without any queries. For exampslowdown of query 3 indicates that theJess expert system ran 25% slower when the query was enabled.
Overall the results are encouraging. All selection queries except query 7 have overheads of less than a factormedian slowdown is 1.24. We expect overheads of common practical selection queries to be in the same ranexperimental queries; the performance model discussed in section 5 supports this prediction.
Join queries have overheads ranging from 2.13 to 229 for applications. Hash queries (which can be used forjoins) are efficient for queries 13–14, and other joins are practical for query 13 in which the domains contain objects each. Queries 15–17 have large overheads because of frequent invocations (e.g., 2.6 million times pfor query 16) and large domains. Join query performance is acceptable if join domains are small, and the invokes the debugger infrequently. For large domains and frequently invoked queries, the overhead is signific
Microbenchmark stress-test queries 18–20 show the limits of the dynamic query-based debugger. The beupdates a single field in a loop 40 million times per second. When queries depend on this field, the p
Application Size (Kbytes) Execution time (s)
Compress 17.4 50
Jess 387.2 22
Ray tracer 55.7 17
Decaf 55 15
Ideal gas tank 14.3 57
Table 2. Application sizes and execution times
10

down oflowdown
n, thesement in aes percies, thetion 5.
s loader,
m and
is the this time
le,
slowdown is significant. Selection query 18 has a slowdown factor of 6.4, the hash-join evaluation has a slow228 times, and the slower nested-loop join that checks twenty object combinations in each evaluation has a sof 930 times.
Though the microbenchmark results indicate that in the worst case the debugger can incur a large slowdowprograms represent a hypothetical case. Such frequent field updates are possible only with a single assignloop. Adding a few additional operations inside the loop drops the field update frequency to 3 million timsecond which is more in line with the highest update frequencies in real programs. For such update frequenslowdown is much lower as indicated by query 4. We discuss the likelihood of high update frequencies in sec
Figure 9 shows the components of the overhead:
• Loading time, the difference between the time it takes to load and instrument classes using a custom clasand the time it takes to load a program during normal execution.
• Garbage collection time, the difference between the time spent for garbage collection in the queried prograthe GC time in the original program.
• First evaluation time,the time it takes to evaluate the query for the first time. For join queries, the first querymost expensive, because it sets up data structures needed for future query reevaluations. We separatefrom the rest of the query evaluation time, because it is a fixed overhead incurred only once.
1 2 3 4 5 6 7 8 9 10 11 12 13 140
0.5
1
1.5
2
2.5
3
3.5
Slo
wdo
wn
Query number
Figure 8. Program slowdown (queries 15—20 not shown)
5.83
The slowdown is the ratio of the running time with the query active to the running time without any queries. For exampthe slowdown of query 3 indicates that the Jess expert system ran 25% slower when the query was enabled.
1 2 3 4 5 6 7 8 9 10 11 12 13 14 15 16 17 18 19 200
10
20
30
40
50
60
70
80
90
100
Ove
rhea
d pe
rcen
tage
Query number
Loading
GC
First evaluation
Evaluation
Figure 9. Breakdown of query overhead as a percentage of total overheadFor example, 3% of query 14 overhead is spent on instrumentation, 34% on garbage collection,3% in the first evaluation, and 60% in subsequent reevaluations.
11

time.
pent onspent inead is thess thane, as inons areuery 14
n a slightinates ther good
number
• Evaluation time, the time spent evaluating the query. This component does not include the first evaluationThe first evaluation time and the evaluation time together compose thetotal evaluation time.
Figure 9 shows the components of the overhead. For example, 3% of the overhead of query 14 is sinstrumentation, and 34% on garbage collection. The total evaluation time is 63% of the overhead, with 3% the first evaluation, and 60% spent in subsequent reevaluations. On average, the largest part of the overhevaluation time (75.5%), while loading takes only 17% and garbage collection has a negligible overhead (le7%) in most cases1. The loading overhead becomes a significant factor when the loaded class hierarchy is largquery 3 on theJess system. The loading overhead also takes a larger proportion of time when query reevaluatiinfrequent or fast as in queries 1, 2, 9, and 11. Garbage collection was not a significant factor except in qwhich creates 120,000 token objects, and in query 1 which has such a small absolute overhead that eveincrease in GC and loading time becomes a large part of the overhead. Since the evaluation component domoverhead, especially in high-overhead, long-running queries, evaluation optimizations are very important foperformance. We discuss some optimizations already reflected in this graph in the next section.
4.3 Optimizations
To evaluate the benefit of optimizations implemented in the dynamic query-based debugger, we performed aof experiments by turning off selected optimizations.
1 Experiments were run with 128M heap, a factor that decreased the GC overhead.
QuerySlowdownversus non-
instrumented
Slowdownversus
optimized
Molecule1 z. z.x > 350 1.19 1.16
Id x. x.type < 0 613 554
spec.benchmarks._202_jess.jess.Token z. z.sortcode == -1 7135 5,725
spec.benchmarks._201_compress.Output_Buffer z. z.OutCnt < 0 475 402
spec.benchmarks._201_compress.Output_Buffer z. z.count() < 0 474 373
spec.benchmarks._201_compress.Output_Buffer z. z.lessOutCnt(0) 587 428
spec.benchmarks._201_compress.Output_Buffer z. z.complexMathOutCnt(0) 513 88
spec.benchmarks._201_compress.Compressor z. z.in_count < 0 275 233
spec.benchmarks._201_compress.Compressor z. z.out_count < 0 37 33.8
spec.benchmarks._201_compress.Compressor z. z.complexMathOutCount(0) 40 21.8
spec.benchmarks._205_raytrace.Point p. p.x == 1 10,500 8,496
spec.benchmarks._205_raytrace.Point p. p.farther(100000000) 17,800 8,972
Molecule1 z; Molecule2 z1.z.x == z1.x && z.y == z1.y && z.dir == z1.dir && z.radius == z1.radius (33x33 hash join) 21.96 10.3
Lexer l; Token t. l.token == t && t.type == 27 (120,000x600 hash join) 1,973 576
spec.benchmarks._205_raytrace.Point p; spec.benchmarks._205_raytrace.IntersectPt ip.p.z == ip.t && p.z < 0 (85,000x8,000 hash join) 12,400 54
spec.benchmarks._201_compress.Input_Buffer z;spec.benchmarks._201_compress.Output_Buffer z1.z1.OutCnt == z.InCnt && z1.OutCnt < 100 && z.InCnt > 0 (1x1 hash join)
1,708 11
spec.benchmarks._201_compress.Compressor z;spec.benchmarks._201_compress.Output_Buffer z1.z1.OutCnt < 100 && z.out_count > 1 && z1.OutCnt / 10 > z.out_count (1x1 join)
697 9
Test5 z. z.x < 0 5,213 821
TestHash5 th; TestHash1 th1. th.i == th1.i (1x20 hash join) 1,491 6.6
TestHash5 th; TestHash1 th1. th.i < th1.i (1x20 join) 5,602 6.02
Table 3. Overhead of non-incremental evaluation
12

isabledlumn ofriginal
of fullyours. In
d finishedble time.r queriesverhead.)st. For
Thesese joins
erative,
s with theows thewdown
than the
ramsll other
with the 15.
4.3.1 Incremental Reevaluation
The dynamic query debugger benefits considerably from the incremental evaluation of queries. We dincremental query evaluation and reran all queries. Table 3 shows the results of this experiment. The first conumbers in the table shows the ratio of non-incremental query running time to the running time of the oprogram. The second column shows the ratio of non-incremental query running time to the running time optimized incremental query evaluation. For example, query 2 had a factor of 613 overhead and ran for 2.5 hcontrast, the same query ran 554 times faster using the incremental reevaluation, had only 11% overhead anin 16.4 seconds. Query 1 was the only query that the non-incremental debugger could evaluate in a reasonaThe overheads of all other queries were enormous; some programs would have run for more than a day. (Fo3–12 and 14–17, we stopped query reevaluation after the first 100,000 evaluations and estimated the total oDespite the large overall overhead, the individual non-incremental query evaluations are reasonably faexample, even for large join queries 14 and 15, a single query evaluation only took about 50 ms.
The join queries oncompress have an overhead of only 9–11 compared to the incremental optimized version. joins did not benefit much from incremental evaluation and its optimizations because the domains of thecontain only a single object.
Overall, the experiments with non-incremental evaluation of queries show that incremental evaluation is impgreatly reducing the overhead and making a much larger class of dynamic queries practical for debugging.
4.3.2 Custom Generated Selection Code
To estimate the benefit of generating custom code as discussed in section 3.4.2, we ran all selection querieoptimization disabled. The results of the experiment are shown in Table 4. The first column of numbers shslowdown of the unoptimized version compared to the original program. The second column indicates the sloof the unoptimized version compared to the optimized version. For example, query 4 ran 68.5 times slower original program and 58 times slower than the optimized query.
The ideal gas tank applet andDecaf compiler queries did not benefit from this optimization, because these progreevaluate the query infrequently, and the optimization benefit is masked by variations in start-up overhead. Aqueries show significant speedups with the optimization enabled. The benefit of the optimization increases frequency of debugger invocations; overall, custom generated selection code produces a median speedup of
QuerySlowdownversus non-
instrumented
Slowdownversus
optimized
Molecule1 z. z.x > 350 1.05 1.03
Id x. x.type < 0 1.46 1.34
spec.benchmarks._202_jess.jess.Token z. z.sortcode == -1 11.70 9.26
spec.benchmarks._201_compress.Output_Buffer z. z.OutCnt < 0 68.5 58
spec.benchmarks._201_compress.Output_Buffer z. z.count() < 0 64 51
spec.benchmarks._201_compress.Output_Buffer z. z.lessOutCnt(0) 65 47
spec.benchmarks._201_compress.Output_Buffer z.z.complexMathOutCnt(0) 69.6 12
spec.benchmarks._201_compress.Compressor z. z.in_count < 0 43.6 37
spec.benchmarks._201_compress.Compressor z. z.out_count < 0 10.5 9.6
spec.benchmarks._201_compress.Compressor z.z.complexMathOutCount(0) 11 6
spec.benchmarks._205_raytrace.Point p. p.x == 1 21 15
spec.benchmarks._205_raytrace.Point p. p.farther(100000000) 61 31
Test5 z. z.x < 0 1,952 307
Table 4. Benefit of custom selection code (selection queries only)
13

the object and can
s. While the ideal to the
d. Thetions thatly when
, the costjoins, the
rison permber of
del. Thee. This
lmodel
uery. The it spends
ine/JVM
calculate
4.3.3 Same Value Assignment Test
Before evaluating a query after a field assignment, the debugger checks whether the value being assigned to field is equal to the value previously held by the field. Such assignments do not change the result of the querybe ignored by the debugger.
Table 5 shows that the number of unnecessary assignments differs highly depending on the programs or fieldsome programs and fields do not have them at all, others have from 7% to 95% of such assignments. Onlygas tank simulation, theJess expert system, and the ray tracing application have unnecessary assignmentsqueried fields.
To check the efficiency of the same-value test, we disabled it while leaving all other optimizations enableresults show that the test does not make much of a difference in query evaluation for most queries. For seleccan be evaluated fast, the cost of the same-value test is similar to the cost of the full selection evaluation. Onthe selection constraint is costly (as in query 4), does the same-value test reduce the overhead. For joinsreduction is significant for the ideal gas tank query that contains 54% unnecessary assignments. For other percentage of unnecessary assignments is too low to make a difference.
To summarize, the test whether an assignment changes a value of a field costs only one extra compadebugger invocation. It does not change the overhead for most programs, but saves time when the nuunnecessary assignments is large or the query expression is expensive.
5. Performance Model
To better predict debugger performance for a wide class of queries, we constructed a query performance moslowdown depends on the frequency of debugger invocations and on the individual query reevaluation timrelationship can be expressed as follows:
T = Toriginal (1 + Tnochange * Fnochange + Tevaluate * Fevaluate)
This formula relates the total execution time of the program being debuggedT and the execution time of the originaprogramToriginal using frequencies of field assignments in the program and individual reevaluation times. The divides field assignments into two classes:
• Assignments that do not change the value of a field. These assignments do not change the result of the qdebugger has to perform only two comparisons in this case—a domain test and the value equality test, soa fixed amount of time (Tnochange) in such invocations independent of the query. We calculatedTnochange byrunning a query on a program that repeatedly assigned the same value to the queried field; for the machcombination we used,Tnochange = 66 ns.
• Assignments that lead to the reevaluation of a query. The time to reevaluate a queryTevaluate for such an assignmentdepends on the query structure and on the cost of the query constraint expression. For each query, we
QuerySlowdown
versusoptimized
%unnecessaryassignments
Molecule1 z. z.x > 350 0.99 95%
spec.benchmarks._202_jess.jess.Token z. z.sortcode == -1 0.997 7%
spec.benchmarks._205_raytrace.Point p. p.x == 1 0.988 15%
spec.benchmarks._205_raytrace.Point p. p.farther(100000000) 1.16 40%
Molecule1 z; Molecule2 z1.z.x == z1.x && z.y == z1.y && z.dir == z1.dir && z.radius == z1.radius (33x33 hash join) 1.61 54%
spec.benchmarks._205_raytrace.Point p; spec.benchmarks._205_raytrace.IntersectPt ip.p.z == ip.t && p.z < 0 (85,000x8,000 hash join) 1.02 15%
Table 5. Unnecessary assignment test optimization(excluding queries with no unnecessary assignments)
14

uggernmentse
ite
, we can
rogramignment
ncies inted the
Tevaluate by dividing the additional time it takes to run a program with a query into the number of debinvocations. This calculation gives an exact result for programs that have no unnecessary assig(Fnochange = 0). For example, for query 18Tevaluate is 131ns.Tevaluate for query 4 is 140 ns, which is close to thtime to evaluate a similar query in a microbenchmark. When constraints are more costly,Tevaluate increases; forexample, for the highest cost selection query (query 10) it is 4.26µs. It is even higher for join queries where depends on the size of domains in joins; for example, for query 16 it is 60µs, and for query 15 which has largdomains, it is 546µs.
Using the values of reevaluation times and the frequency of assignments to the fields of the change setestimate the debugging overhead. First, we determine the typical field assignment frequency.
5.1 Debugger Invocation Frequency
Debugger invocation frequency is an important factor in the slowdown of programs during debugging. The pinvokes the debugger after object creation and after field assignments. For most queries, the field asscomponent dominates the debugger invocation frequency. To find the range of field assignment frequeprograms, we examined the microbenchmarks and the SPECjvm98 application suite. We instrumenapplications to record every assignment to a field. Table 7 shows results of these measurements.
QueryFevaluate
(assignments
per second)
Tevaluate(µs)
Molecule1 z. z.x > 350 N/A N/A
Id x. x.type < 0 16,000 3.73
spec.benchmarks._202_jess.jess.Token z. z.sortcode == -1 169,000 3
spec.benchmarks._201_compress.Output_Buffer z. z.OutCnt < 0
1,900,000
0.140
spec.benchmarks._201_compress.Output_Buffer z. z.count() < 0 0.208
spec.benchmarks._201_compress.Output_Buffer z. z.lessOutCnt(0) 0.286
spec.benchmarks._201_compress.Output_Buffer z. z.complexMathOutCnt(0) 3.7
spec.benchmarks._201_compress.Compressor z. z.in_count < 0 933,000 0.193
spec.benchmarks._201_compress.Compressor z. z.out_count < 0196,000
0.488
spec.benchmarks._201_compress.Compressor z. z.complexMathOutCount(0) 4.26
spec.benchmarks._205_raytrace.Point p. p.x == 1 787,000 0.486
spec.benchmarks._205_raytrace.Point p. p.farther(100000000) 2,300,000 0.461
Molecule1 z; Molecule2 z1.z.x == z1.x && z.y == z1.y && z.dir == z1.dir && z.radius == z1.radius (33x33 hash join)N/A N/A
Lexer l; Token t. l.token == t && t.type == 27 (120,000x600 hash join) 25,000 56.8
spec.benchmarks._205_raytrace.Point p; spec.benchmarks._205_raytrace.IntersectPt ip.p.z == ip.t && p.z < 0 (85,000x8,000 hash join) 350,000 546
spec.benchmarks._201_compress.Input_Buffer z;spec.benchmarks._201_compress.Output_Buffer z1.z1.OutCnt == z.InCnt && z1.OutCnt < 100 && z.InCnt > 0 (1x1 hash join)
1,500,000 60
spec.benchmarks._201_compress.Compressor z;spec.benchmarks._201_compress.Output_Buffer z1.z1.OutCnt < 100 && z.out_count > 1 && z1.OutCnt / 10 > z.out_count (1x1 join)
2,600,000 51
Test5 z. z.x < 0 42,000,000 0.131
TestHash5 th; TestHash1 th1. th.i == th1.i (1x20 hash join)40,000,000
5.7
TestHash5 th; TestHash1 th1. th.i < th1.i (1x20 join) 23
Table 6. Frequencies and individual evaluation times
15

t wouldop. The
millionve
graphonly four
ulativeve fewer
vocation
n a fields. If the fieldsen for the
tualthe first running
The maximum field assignment frequency in microbenchmarks is 40 million assignments per second, but thabe difficult to reach in an application because the microbenchmarks contain a single assignment inside a locompress program has the highest field assignment frequency in the SPECjvm98 application suite, 1.9 assignments per second. Other SPEC applications, as well as theDecaf compiler and the ideal gas tank applet, hamuch lower maximum field assignment frequencies.
Figure 10 shows the frequency distribution of field assignments in the SPECjvm98 applications. The leftindicates how many fields have an assignment frequency in the range indicated on the x axis. For example, fields are assigned between one million and two million times per second. The right graph shows the cumpercentage of fields that have assignment frequencies lower than indicated on the x axis; 95% of all fields hathan 100,000 assignments per second.
To predict the overhead of a typical selection query, we can now calculate the overhead as a function of infrequency. Figure 11 uses the minimum (130 ns) and maximum (4.26µs) values ofTevaluate from Table 6 to plot theestimated selection query overhead for a range of invocation frequencies. For example, a selection query oupdated 500,000 times per second would have an overhead of 6.5% if its reevaluation time was 130 nreevaluation time was 4.26µs, the overhead will be a factor of 3.13. The graph reveals that selection queries onassigned less than 100,000 times a second—95% of fields—have a predicted overhead of less than 43% evmost costly selection constraint. For less costly selections, the query overhead is acceptable for all fields.
In the current model, the evaluation timeTevaluate models all sources of query overhead. This time includes the acreevaluation time as well as the additional garbage collection time, the class instrumentation cost, and evaluation cost. It would be more exact to model each of these overheads separately. However, for longprograms the evaluation time dominates the total cost, so the values ofTevaluate are likely to fall in the range we havecovered.
Application Maximum frequency(field assignments per second)
Original programexecution time (s)
Compress 1,900,000 50.4
Jess 169,000 22.45
Db 254 75
Javac 217,000 38
Mpegaudio 495,000 57.4
Jack 27,000 27
Ray tracer 787,000 17
Decaf 56,000 15
Ideal gas tank 23,150 57
Microbenchmark 40,000,000 2.4
Table 7. Maximum field assignment frequencies
0.1
0.5 1 5
10 50 100
500
1000
5000
10K
50K
100K
500K 1M 2M
0
10
20
30
40
50
60
70
80
90
100
Cum
ulat
ive
perc
enta
ge o
f fie
lds
Field assignment frequency
0.1
0.5 1 5
10 50 100
500
1000
5000
10K
50K
100K
500K 1M 2M
0
50
100
150
200
250
Num
ber
of fi
elds
Field assignment frequency
Figure 10. Field assignment frequency in SPECjvm98
16

he model
returns a the ideal
ns areisplay ofd shouldpled withs written
tes?
low-costthe same
In summary, the performance model predicts that most selection queries will have less than 43% overhead. Tcan be used as a framework for concrete overhead predictions and future model refinements.
6. Queries with Changing Results
So far we discussed using dynamic queries for debugging, where the program stops as soon as the querynon-empty result. However, programmers can also use queries to monitor program behavior. For example, ingas tank simulation, users may want to monitor all molecule near-collisions with a query:
Molecule* m1 m2. m1.closeTo(m2) && m1 != m2
Programmers may use this information to check the frequency of near-collisions, to find out if near-collisiohandled in a special way by the program, or to check the correspondence of program objects with the visual dthe simulation. In this case, the debugger should not stop after the result becomes non-empty, but insteacontinue executing the program and updating the query result as it changes. Such monitoring, perhaps couvisualization of the changing result, can help users understand abstract object relationships in large programby other people. How can a debugger support continuous updating of query results while the program execu
Query Slowdown
Molecule1 z. z.x < 200 1.05
Id x. x.type == 0 1.23
spec.benchmarks._202_jess.jess.Token z. z.sortcode == 0 1.3
spec.benchmarks._201_compress.Compressor z. z.OutCnt == 0 1.19
spec.benchmarks._201_compress.Compressor z. z.out_count == 0 1.09
Molecule1 z; Molecule2 z1. z.x < z1.x && z.y < z1.y (33x33 join) 1.47
Lexer l; Token t. l.token == t && t.type == 0 (120,000x600 hash join) 4.09
spec.benchmarks._205_raytrace.Point p; spec.benchmarks._205_raytrace.IntersectPt ip.(p.z == ip.t) && (p.z > 100) (85,000x8,000 hash join) 212.4
spec.benchmarks._201_compress.Compressor z;spec.benchmarks._201_compress.Output_Buffer z1. z1.OutCnt == z.out_count (1x1 hash join)9.07
spec.benchmarks._201_compress.Input_Buffer z;spec.benchmarks._201_compress.Output_Buffer z1. z1.OutCnt < z.InCnt (1x1 join) 127
Test5 z. z.x % 2 == 0 45
Table 8. Benchmark queries with non-empty results
0.1
0.5 1 5
10 50
100
500
1000
5000
10K
50K
100K
500K 1M 2M
0
1
2
3
4
5
6
7
8
9
10
Slo
wdo
wn
Field assignment frequency
Low cost
High cost
Figure 11. Predicted slowdownThe graph shows the predicted overhead as a function of update frequency. For example, the predicted overhead of aselection query on a field updated 500,000 times per second is 6.5%; the predicted overhead of a high-cost query with frequency is a factor of 3.13.
17

ries. Thethe same.ssed ing moduleeve that,in object
ity doeselectionselectionelectionan onlyificially
slightditional
y-based
sers to the rootalso
objectst various to the
variety ofN97,ships—HotWirebject run-ical dataoes not
using. Laffra the third
ogramvocationsun-time
The dynamic query-based debugger described above needs only a few changes to support monitoring quebasic scheme and the implementation of the dynamic query-based debugger discussed in section 3 remain The only new component of the debugger is a module that maintains the current query result. As discusection 3.4.1, the debugger reevaluates only the changed part of the query. Consequently, the result handlinmust store the query result from the previous evaluation and then merge it with the new partial result. To achiafter query execution the debugger deletes all tuples from the previous result that contain the changed domaand inserts the new tuples generated by the incremental reevaluation.
Experiments with queries similar to the ones in Table 1 show that adding the query result update functionalnot significantly change the query evaluation overhead (Table 8). The only exception is the microbenchmark squery 11 which updates the query result during each reevaluation. Consequently, the overhead of the increases from 6.4 times to 45 times, although part of this increase can be attributed to the more costly sconstraint. However, such frequent result updates are unlikely for most monitoring queries: programmers cabsorb infrequent result changes, so, if results change rapidly, the display will be unintelligible unless it is artslowed down or used off-line.
To summarize, monitoring queries are useful for understanding and visualizing program behavior. Withmodifications our debugger supports monitoring queries. Unless the result changes very rapidly, the adoverhead of monitoring query execution is insignificant when compared to similar debugging queries.
7. Related Work
We are unaware of other work that directly corresponds to dynamic query-based debugging. The querdebugging model and its non-dynamic implementation are presented in a previous paper [LHS97].
Extensions of object-oriented languages with rules as in R++ [LMP97] provide a framework that allows uexecute code when a given condition is true. However, R++ rules can only reference objects reachable fromobject, so R++ would not help to find thejavac error we discussed. Due to restrictions on objects in the rule, R++ does not handle join queries.
Sefika et al. [SSC96] implemented a system allowing limited, unoptimized selection queries about high-levelin the Choices operating system. The system dynamically shows program state and run-time statistics alevels of abstraction. Unlike our dynamic query-based debugger, the tool uses instrumentation specificapplication (Choices).
While no one has investigated the query-based debugging specifically, various researchers have proposed aenhancements to conventional debugging [And95, Cop94, DHKV93, GH93, GWM89, KRR94, Laf97, LM94, LWG94]. The debuggers most closely related to dynamic query-based debugging visualize object relationusually references or an object call graph. Duel [GH93] displays data structures by using user script code. [LM94] allows users to specify custom object visualizations in constraint language. Look! [And95], OVisualizer [DHKV93], PV [KRR94], and Program Explorer [LN97] provide numerous graphical and statisticaltime views with class-dependent filtering but do not allow general queries. Our debugger can gather statistthrough queries with non-empty results (“How many lists of size greater than 500 exist in the program?”) but ddisplay animated statistical views.
Visualizing debuggers gather information by either instrumenting the source code [DHKV93, LM94] or by program traces [KRR94, LN97]. A port of our debugger to C++ would have to use one of these techniques[Laf97] discusses visual debugging in Java using source code instrumentation or JVM changes. We opted formethod—class file instrumentation at load time. Consens et al. [CHM94, CMR92] use the Hy+ visualization systemto find errors using post-mortem event traces. De Pauw et al. [DLVW98] and Walker et al. [WM+98] use prevent traces to visualize program execution patterns and event-based object relationships, such as method inand object creation. This work is complementary to ours because it focuses on querying and visualizing revents while we query object relationships.
18

rogram in Eiffelr end ofhable byused to queriesisms aslems.
vanectures.hasizesowever,eries.
e basicints in
ified to
ent to theg use ofdirectedr in the
Datatatement
gram statemmers tores:
k objecthnique
urations
less thans in thetimes perdicts that queries
panding
ency for
Dynamic query-based debugging extends work on data breakpoints [WLG93]—breakpoints that stop a pwhenever an object field is assigned a certain value. Pre-/postconditions and class invariants as provided[Mey88] can be thought of as language-supported dynamic queries that are checked at the beginning omethods. Unlike dynamic queries, they are not continuously checked, they cannot access objects unreacreferences from the checked class, nor can they invoke arbitrary methods. Dynamic queries could be implement class assertions for languages that do not provide them. The current implementation of dynamiccannot use the “old” value of a variable, as can be done in postconditions. We view the two mechancomplementary, with queries being more suitable for program exploration as well as specific debugging prob
Software visualization systems such as BALSA [Bro88], Zeus [Bro91], TANGO/XTANGO/POLKA [Sta90], Pa[Rom92], and others [HKWJ95, Mos97, RC93] offer high-level views of algorithms and associated data struSoftware visualization systems aim to explain or illustrate the algorithm, so their view creation process empvivid representation. Hart et al. [HKR97] use Pavane for query-based visualization of distributed programs. Htheir system only displays selected attributes of different processes and does not allow more complicated qu
Dynamic queries are related to incremental join result recalculation in databases [BC79, BLT86]. We use thinsights of this work to implement the incremental query evaluation scheme. Coping with inter-object constrathe extended ODMG model [BG98] may require methods similar to dynamic query-based debugging.
Slicing [Wei81, Tip95] determines the program statements that affect a certain program point. It could be moddetermine the change sets of queries.
8. Conclusions
The cause-effect gap between the time when a program error occurs and the time when it becomes apparprogrammer makes many program errors hard to find. The situation is further complicated by the increasinlarge class libraries and complicated pointer-linked data structures in modern object-oriented systems. A misreference that violates an abstract relationship between objects may remain undiscovered until much lateprogram’s execution. Conventional debugging methods offer only limited help in finding such errors.breakpoints and conditional breakpoints cannot check constraints that use objects unreachable from the scontaining the breakpoint.
We have described a dynamic query-based debugger that allows programmers to ask queries about the proand updates query results whenever the program changes an object relevant to the query, helping progradiscover object relationship failures as soon as they happen. This system combines the following novel featu
• An extension of query-based debugging to include dynamic queries. Not only does the debugger checrelationships, but it determines exactly when these relationships fail while the program is running. This teccloses the cause-effect gap between the error’s occurrence and its discovery.
• Implementation of monitoring queries. The debugger helps users to watch the changes in object configthrough the program’s lifetime. This functionality can be used to better understand program behavior.
The implementation of the query based debugger has good performance. Selection queries are efficient witha factor of two slowdown for most queries measured. We also measured field assignment frequencieSPECjvm98 suite, and showed that 95% of all fields in these applications are assigned less than 100,000 second. Using these numbers and individual evaluation time estimates, our debugger performance model preselection queries will have less than 43% overhead for 95% of all fields in the SPECjvm98 applications. Joinare practical when domain sizes are small and queried field changes are infrequent.
Good performance is achieved through a combination of two optimizations:
• Incremental query evaluation decreases query evaluation overhead by a median factor of 160, greatly exthe class of dynamic queries that are practical for everyday debugging.
• Custom code generation for selection queries produces a median speedup of 15, further improving efficicommonly occurring selection queries.
19

hest forates thatgers willmore
d Jeffystems,CR96–
s,
l
Event4,
1992.
SENIX4.
cations,37.
07-
989.
We believe that dynamic query-based debugging adds another powerful tool to the programmer’s tool ctackling the complex task of debugging. Our implementation of the dynamic query-based debugger demonstrdynamic queries can be expressed simply and evaluated efficiently. We hope that future mainstream debugintegrate a similar functionality, simplifying the difficult task of debugging and facilitating the development of robust object-oriented systems.
9. Acknowledgments
We thank the anonymous reviewers, Amer Diwan, Karel Driesen, Sylvie Dieckmann, Andrew Duncan, anBogda for valuable comments on earlier versions of this paper. This work was funded in part by Sun Microsthe State of California MICRO program, and by the National Science Foundation under CAREER grant C24458 and grants CCR92–21657 and CCR95–05807.
10. References
[And95] Anderson E., Dynamic Visualization of Object Programs Written in C++,Objective Software Technology Ltd., http://www.objectivesoft.com/, 1995.
[BC79] Buneman, O.P.; Clemons E.K., Efficiently Monitoring Relational Databases.ACM Transactions on Database System4(3), pp. 368-382, September 1979.
[BG98] Bertino, E., Guerrini, G., Extending the ODMG Object Model with Composite Objects,Proceedings of OOPSLA’98,pp. 259-270, Vancouver, October 1998. Published asSIGPLAN Notices 33(10), October 1998.
[BLT86] Blakeley, J.A.; Larson P.-A.; Tompa F. Wm.; Efficiently Updating Materialized Views.Proceedings of the ACMSIGMOD Conference on Management of Data, pp. 61-71, Washington, D.C., USA, May 1986. Published asSIGMODRecord 15(2), June 1986.
[Bro88] Brown, M.H., Exploring Algorithms Using Balsa-II,IEEE Computer 21(5), pp. 14-36, May 1988.
[Bro91] Brown, M.H., Zeus: A System for Algorithm Animation and Multi-View Editing,Proceedings of IEEE Workshop VisuaLanguages, pp. 4-9, IEEE CS Press, Los Alamitos, CA., 1991.
[CHM94] Consens, M. P., Hasan M.Z., Mendelzon A.O., Debugging Distributed Programs by Visualizing and QueryingTraces,Applications of Databases, First International Conference, ADB-94, Vadstena, Sweden, June 21-23, 199Proceedings in Lecture Notes in Computer Science, Vol. 819, Springer, 1994.
[CMR92] Consens, M.; Mendelzon, A.; Ryman, A., Visualizing and Querying Software Structures,International Conference onSoftware Engineering, Melbourne, Australia, May 11-15, 1992, ACM Press, IEEE Computer Science, p. 138-156,
[Cop94] Coplien, J.O., Supporting Truly Object-Oriented Debugging of C++ Programs., In: Proceedings of the 1994 UC++ Conference, Cambridge, MA, USA, 11-14 April 1994. pp. 99-108, Berkley, CA, USA: USENIX Assoc, 199
[DHKV93] De Pauw, W.; Helm, R.; Kimelman, D.; Vlissides, J. Visualizing the Behavior of Object-Oriented Systems. InProceed-ings of the 8th Annual ACM Conference on Object-Oriented Programming Systems, Languages, and AppliOOPSLA 1993, Washington, DC, USA, 26 Sept.-1 Oct. 1993. SIGPLAN Notices, Oct. 1993, vol.28, (no.10):326-
[DLVW98]de Pauw, W.; Lorenz, D.; Vlissides, J.; Wegman, M. Execution Patterns in Object-Oriented Visualization.Proceedingsof the Fourth USENIX Conference on Object-Oriented Technologies and Systems, Sante Fe, NM, USA, 27-30 April1998, USENIX Association, 1998. pp. 219-34.
[Eis97] Eisenstadt, M., My Hairiest Bug War Stories,Communications of the ACM, Vol. 40., No. 4, pp. 30–38, April 1997.
[GH93] Golan, M.; Hanson, D.R. Duel-A Very High-Level Debugging Language. In: USENIX Association.Proceedings of theWinter 1993 USENIX Conference. San Diego, CA, 25-29 Jan. 1993. Berkley, CA, USA: USENIX Assoc, 1993. p. 117.
[GJS96] Gosling, J., Joy, B., Steele, G.,The Java Language Specification, Addison-Wesley 1996.
[GWM89] Gamma E., Weinand A., Marty R., Integration of a Programming Environment into ET++ - a Case Study,ProceedingsECOOP’89 (Nottingham, UK, July 10-14), pp. 283-297, S. Cook, ed. Cambridge University Press, Cambridge, 1
[HKR97] Hart D., Kraemer E., Roman G.-C., Interactive Visual Exploration of Distributed Computations.Proceedings of the 11thInternational Parallel Processing Symposium, Geneva, Switzerland, pp.121-127, April 1997.
20

sual- Tele-
ng.
stem
Path-
,
4.
ftware.
[HKWJ95]Hao, M.C.; Karp, A.H.; Waheed, A.; Jazayeri, M., VIZIR: An Integrated Environment for Distributed Program Viization.Proceedings of the Third International Workshop on Modeling, Analysis, and Simulation of Computer andcommunication Systems, MASCOTS ‘95, pp.288–92, Durham, NC, USA, January 1995.
[Kes90] Kessler, P., Fast Breakpoints: Design and Implementation.Proceedings of ACM SIGPLAN conference on ProgrammiLanguage Design and Implementation 1990, Published asSIGPLAN Notices 25(6), pp. 78–84, ACM Press, June 1990
[KH98] Keller, R., Hölzle, U.; Binary Component Adaptation,Proceedings ECOOP’98, Springer Verlag Lecture Notes onComputer Science, Brussels, Belgium, July 1998.
[KRR94] Kimelman D., Rosenburg B., Roth T., Strata-Various: Multi-Layer Visualization of Dynamics in Software SyBehavior,Proceedings of Visualization’94, pp. 172-178, IEEE 1994.
[Laf97] Laffra C.,Advanced Java: Idioms, Pitfalls, Styles and Programming Tips, pp. 229-252, Prentice Hall 1997.
[LB98] Liang, S., Bracha, G.; Dynamic Class Loading in the JavaTM Virtual Machine,Proceedings of OOPSLA’98, pp. 36-44,Vancouver, October 1998. Published asSIGPLAN Notices 33(10), October 1998.
[LHS97] Lencevicius, R.; Hölzle, U.; Singh, A.K., Query-Based Debugging of Object-Oriented Programs,Proceedings ofOOPSLA’97, pp. 304-317, Atlanta, GA, October 1997. Published asSIGPLAN Notices 32(10), October 1997.
[LM94] Laffra C., Malhotra A., HotWire: A Visual Debugger for C++,Proceedings of the USENIX C++ Conference, pp. 109-122, Usenix Association 1994.
[LMP97] Litman D.; Mishra A.; Patel-Schneider P.F., Modeling Dynamic Collections of Interdependent Objects UsingBased Rules,Proceedings of OOPSLA’97, pp. 77-92, Atlanta, GA, October 1997. Published asSIGPLAN Notices32(10), October 1997.
[LN97] Lange, D.B., Nakamura Y. Object-Oriented Program Tracing and Visualization,IEEE Computer, vol. 30, no. 5, pp. 63–70, May 1997.
[Mey88] Meyer B.,Object-Oriented Software Construction, pp. 111 - 163, Prentice-Hall, 1988.
[Mos97] Mössenböck, H., Films as Graphical Comments in the Source Code of Programs.Proceedings of the InternationalConference on Technology of Object Oriented Systems and Languages, TOOLS-23, pp. 89-98, Santa Barbara, CA, USAJuly-August 1997.
[RC93] Roman G.-C., Cox K.C., A Taxonomy of Program Visualization Systems,IEEE Computer 26(12), pp. 11-24, December1993.
[Rom92] Roman, G.-C. et al., Pavane: A System for Declarative Visualization of Concurrent Computations, Journal of VisualLanguages and Computing, Vol. 3, No. 2, pp. 161-193, June 1992.
[SPEC98] Standard Performance Evaluation Corporation, SPEC JVM98 Benchmarks,http://www.spec.org/osg/jvm98/, 1998.
[SSC96] Sefika M., Sane A., Campbell R.H., Architecture-Oriented Visualization, InProceedings of OOPSLA’96, pp. 389-405,San Jose, CA, October 1996. Published as SIGPLAN Notices 31(10), October 1996.
[Sun99] JavaTM 2 SDK Production Release, http://www.sun.com/solaris/, 1999.
[Sta90] Stasko, J., TANGO: A Framework and System for Algorithm Animation,IEEE Computer 23(9), pp. 27-39.
[Tip95] Tip, F., A Survey of Program Slicing Techniques.Journal of Programming Languages, vol.3, (no.3) pp. 121-89, Sept.1995.
[Wei81] Weiser, M., Program Slicing. In:5th International Conference on Software Engineering, San Diego, CA, USA, 9-12March 1981. New York, NY, USA, pp. 439-49, IEEE, 1981.
[WLG93] Wahbe R., Lucco S., Graham S.L., Practical Data Breakpoints: Design and Implementation.Proceedings of ACMSIGPLAN conference on Programming Language Design and Implementation 1993, Albuquerque, June 1993. ACMPress 1993.
[WG94] Weinand, A.; Gamma, E. ET++-a portable, homogenous class library and application framework. In:Computer ScienceResearch at UBILAB, Strategy and Projects. Proceedings of the UBILAB Conference ‘94, Zurich, Switzerland, 1994.pp. 66-92. Edited by: Bischofberger, W.R.; Frei, H.-P. Konstanz, Switzerland: Universitätsverlag Konstanz, 199
[WM+98] Walker, R.J., Murphy, G.C., Freeman-Benson, B., Wright, D., Swanson, D., Isaak, J., Visualizing Dynamic SoSystem Information through High-level Models,Proceedings of OOPSLA’98, pp. 271-283, Vancouver, October 1998Published asSIGPLAN Notices 33(10), October 1998.
21