Embed Size (px)
Citation preview

Dynamic modelling of activated sludge process I. Nonlinear kinetics models
4 . DERCO, b M. KRÁLIK, a M . H U T Ň A N , and a P . GUBOVÁ
л Department of Environmental Chemistry and Technology,
Faculty of Chemical Technology, Slovak Technical University,
CS-812 37 Bratislava
hDepartment of Organic Technology, Faculty of Chemical Technology,
Slovak Technical University, CS-812 37 Bratislava
Received 17 January 1989
This paper deals with experimental investigation and mathematical modelling of the dynamic behaviour of activated sludge process. A simplified mathematical model based on substrate and biomass material balances around aerated tank was derived and verified experimentally for the transient load of a substrate concentration. This model was tested by means of the step change of substrate concentration in the feed. The set of Michaelis—Menten equations of substrate utilization and Monod equation of microbiological growth was found not to be descriptive for the system response. The calculated COD and biomass concentrations profiles using the modified Monod equation provided better fit with those obtained experimentally.
В работе описано экспериментальное изучение и математическое моделирование динамики процесса с активным илом. Упрощенная математическая модель на основе материальных балансов аэротенка была получена и проверена экспериментальным путем. Модель была проверена путем ступенчатного изменения концентрации субстрата во входном потоке. Уравнения Михаелиса—Ментен для субстрата и уравнения Моно для роста микроорганизмов показались неадекватными для описания отклика системы. Вычисленные концентрационные зависимости ХПК и концентрации активного ила при использовании модифицированного уравнения Моно наиболее соответствуют экспериментальным данным.
Treatment of waste waters containing biodegradable organic compounds is currently achieved most economically by the utilization of biochemical reactions mediated by microorganisms. One of the most widely used biological treatment methods that require aerobic environment for effective operation is the activated sludge process.
Because of the time-varying change in flow-rate and composition of the waste water, the process is usually operated under highly variable loading conditions with the variability of effluent quality. Many design engineers do not appreciate
Chem. Papers 44 (3) 409—420 (1990) 409

J. DERCO. M. K R Á L I K . M. H U T Ň A N . P. GL.'BOVÁ
the dynamic character of the process, and steady-state procedures are still almost exclusively used. The transient loading studies of activated sludge process are of interest both to microbiologists and engineers. Microbiologists have been interested in the dynamics of microbiological response from the viewpoint of the fact that the information obtained could be helpful to understanding the mechanisms involved in biological growth and reproduction. The practical interest of engineers is focused on the design and control of the activated sludge process. The increased availability of digital computers encourages the use of mathematical models. Mathematical models are applicable both in the design and operation of treatment plants.
The purpose of this work was to investigate the response to quantitative shock load carried out in the process and to. examine the availability of nonlinear Monod type kinetic models for process description unt'or transient conditions.
Theoretical
Process description
The activated sludge process may be described as one in which the waste water is brought into contact with a suspended culture of microorganisms in an aerobic environment. The aerobic environment is achieved by the use of diffused air or mechanical aeration or even by pure oxygen. This operation takes place in a bioreactor known as an aeration basin. Microbiological reactions occur in the bioreactor resulting in the growth of new bacteria and the oxidation of organic compounds in the waste water. The effluent of the bioreactor flows to a sedimentation tank, where the activated sludge is separated from the liquid phase (Fig. 1). Part of the concentrated sludge is recycled in order to maintain enough mass of viable organisms in the bioreactor and a reasonable food-to-mass
air
i
«r.̂ o
vv x.s
I I
J
\
«•**
/
4 .
9x
Fig. I. Activated sludge process flow sheet.
4 1 0 Chem. Papers 44 (3) 409—420 (1990)
ACTIVATED SLUDGĽ PROCESS. I
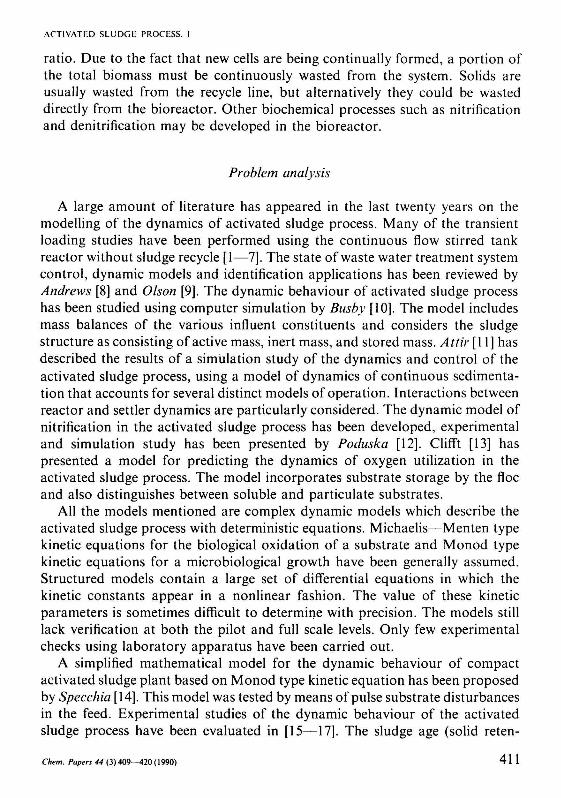
ratio. Due to the fact that new cells are being continually formed, a portion of the total biomass must be continuously wasted from the system. Solids are usually wasted from the recycle line, but alternatively they could be wasted directly from the bioreactor. Other biochemical processes such as nitrification and denitrification may be developed in the bioreactor.
Problem analysis
A large amount of literature has appeared in the last twenty years on the modelling of the dynamics of activated sludge process. Many of the transient loading studies have been performed using the continuous flow stirred tank reactor without sludge recycle [1—7]. The state of waste water treatment system control, dynamic models and identification applications has been reviewed by Andrews [8] and Olson [9]. The dynamic behaviour of activated sludge process has been studied using computer simulation by Busby [10]. The model includes mass balances of the various influent constituents and considers the sludge structure as consisting of active mass, inert mass, and stored mass. Attir [11] has described the results of a simulation study of the dynamics and control of the activated sludge process, using a model of dynamics of continuous sedimentation that accounts for several distinct models of operation. Interactions between reactor and settler dynamics are particularly considered. The dynamic model of nitrification in the activated sludge process has been developed, experimental and simulation study has been presented by Poduška [12]. Clifft [13] has presented a model for predicting the dynamics of oxygen utilization in the activated sludge process. The model incorporates substrate storage by the floe and also distinguishes between soluble and particulate substrates.
All the models mentioned are complex dynamic models which describe the activated sludge process with deterministic equations. Michaelis—Menten type kinetic equations for the biological oxidation of a substrate and Monod type kinetic equations for a microbiological growth have been generally assumed. Structured models contain a large set of differential equations in which the kinetic constants appear in a nonlinear fashion. The value of these kinetic parameters is sometimes difficult to determine with precision. The models still lack verification at both the pilot and full scale levels. Only few experimental checks using laboratory apparatus have been carried out.
A simplified mathematical model for the dynamic behaviour of compact activated sludge plant based on Monod type kinetic equation has been proposed by Specchia [14]. This model was tested by means of pulse substrate disturbances in the feed. Experimental studies of the dynamic behaviour of the activated sludge process have been evaluated in [15—17]. The sludge age (solid reten-
Chem. Papers 44 (3) 409—420 (1990) 411
J. DERCO. M. KRÁLIK. M. HUTŇAN. P. GUBOVÁ
tion time — SRT) affects significantly the quality of the biological treatment. A system characterized by a large SRT would lead to a lesser deterioration in the quality of the process when submitted to mass loadings. Transient inputs are handled better with high solids levels and long hydraulic detention times. Shock loads of different types — hydraulic, quantitative or in combinations — did not produce equivalent disruptions of effluent quality for equal increases in the biomass loading rate. There are different conclusions as for the convenience of Monod type kinetic equation application for dynamic behaviour description judged in the literature [14, 17]. A different approach has been followed in formulating a second-order model for the activated sludge process [18, 19] based on the use of the prey—predator theory. Another one represents the statistical modelling of activated sludge process by Hansen [20].
Model formulation and solution methods
The following assumptions are made in order to simplify the mathematical model of activated sludge process:
— substrate feed contains no suspended solids; — sufficient dissolved oxygen concentration is maintained in bioreactor; — all the biomass entering the settling tank is recycled to the bioreactor, i.e.
no biomass is wasted from the settler, and none escapes in the effluent; — part of the biomass is wasted directly from the bioreactor in order to
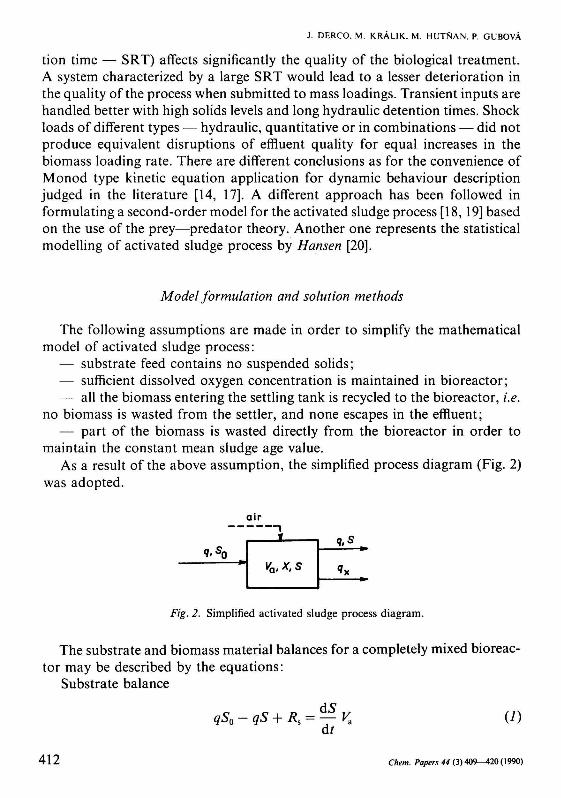
maintain the constant mean sludge age value. As a result of the above assumption, the simplified process diagram (Fig. 2)
was adopted.
air 1
9.so va. X, S
%* r
*x
Fig. 2. Simplified activated sludge process diagram.
The substrate and biomass material balances for a completely mixed bioreactor may be described by the equations:
Substrate balance
qSo-qS+Rs = ^-K (1) at
412 Chem. Papers 44 (3) 409—420 (1990)
ACTIVATED SLUDGE PROCESS. I
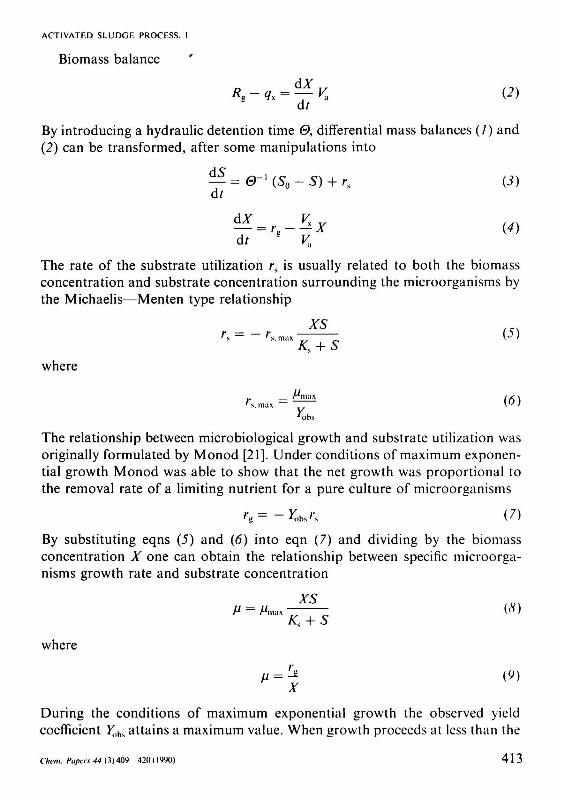
Biomass balance
át
By introducing a hydraulic detention time 0, differential mass balances (7) and (2) can be transformed, after some manipulations into
— = 0-](So-S) + r% (3) át
™-r.-iíx M) át ~ К
The rate of the substrate utilization rs is usually related to both the biomass concentration and substrate concentration surrounding the microorganisms by the Michaelis—Menten type relationship
XS 0) " l K, + S
where
r = H™± (6) ' s . max \w i
Jobs
The relationship between microbiological growth and substrate utilization was originally formulated by Monod [21]. Under conditions of maximum exponential growth Monod was able to show that the net growth was proportional to the removal rate of a limiting nutrient for a pure culture of microorganisms
h= -Yoh^ (7)
By substituting eqns (J) and (6) into eqn (7) and dividing by the biomass concentration X one can obtain the relationship between specific microorganisms growth rate and substrate concentration
XS / v .
where
M = - (9) X
During the conditions of maximum exponential growth the observed yield coefficient Yobs attains a maximum value. When growth proceeds at less than the
Clwm. Papers 44 (3) 409 420 (1990) 413
J. DERCO. M. K R Á L I K . M. H U T Ň A N . P. GUBOVÁ
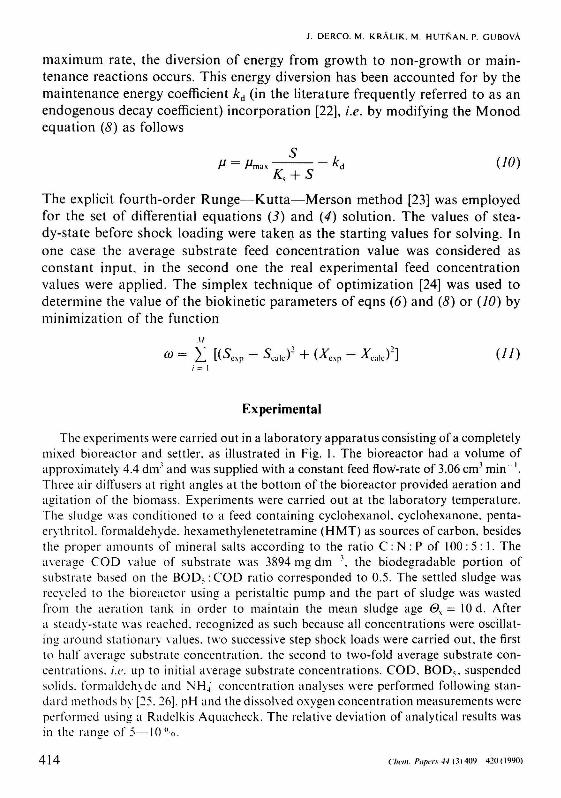
maximum rate, the diversion of energy from growth to non-growth or maintenance reactions occurs. This energy diversion has been accounted for by the maintenance energy coefficient kd (in the literature frequently referred to as an endogenous decay coefficient) incorporation [22], i.e. by modifying the Monod equation (8) as follows
S /* = Anax"" -~ká (10)
The explicit fourth-order Runge—Kutta—Merson method [23] was employed for the set of differential equations (3) and (4) solution. The values of steady-state before shock loading were taken as the starting values for solving. In one case the average substrate feed concentration value was considered as constant input, in the second one the real experimental feed concentration values were applied. The simplex technique of optimization [24] was used to determine the value of the biokinetic parameters of eqns (6) and (8) or (70) by minimization of the function
<o = I [(Sesp - Sm*f + (A-exp - ХЫс)2] (11)
i = 1
Experimental
The experiments were carried out in a laboratory apparatus consisting of a completely mixed bioreactor and settler, as illustrated in Fig. 1. The bioreactor had a volume of approximately 4.4 dnr and was supplied with a constant feed flow-rate of 3.06 cm3 min '. Three air diffusers at right angles at the bottom of the bioreactor provided aeration and agitation of the biomass. Experiments were carried out at the laboratory temperature. The sludge was conditioned to a feed containing cyclohexanol, cyclohexanone, penta-erythritol. formaldehyde, hexamethylenetetramine (HMT) as sources of carbon, besides the proper amounts of mineral salts according to the ratio С: N : P of 100:5: 1. The average COD value of substrate was 3894 mg dm \ the biodegradable portion of substrate based on the BOD5: COD ratio corresponded to 0.5. The settled sludge was recycled to the bioreactor using a peristaltic pump and the part of sludge was wasted from the aeration tank in order to maintain the mean sludge age 6>x = 10 d. After a steady-state was reached, recognized as such because all concentrations were oscillating around stationary values, two successive step shock loads were carried out, the first to half average substrate concentration, the second to two-fold average substrate concentrations, i.e. up to initial average substrate concentrations. COD, BOD5, suspended solids, formaldehyde and NH4 concentration analyses were performed following standard methods by [25. 26]. pH and the dissolved oxygen concentration measurements were performed using a Radelkis Aquacheck. The relative deviation of analytical results was in the range of 5—10%.
414 С 'hem. Papers 44 (3) 409 420 (1990)
ACTIVATED SLUDGK PROCESS. I
Results and discussion
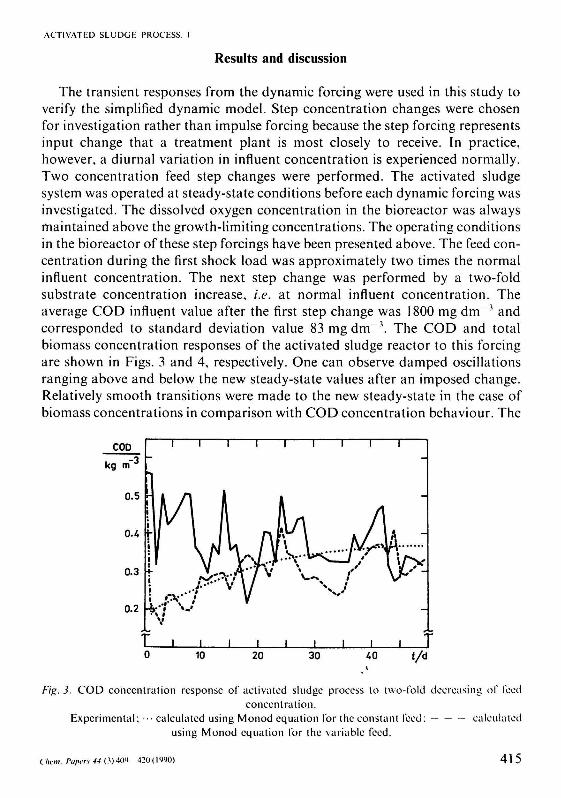
The transient responses from the dynamic forcing were used in this study to verify the simplified dynamic model. Step concentration changes were chosen for investigation rather than impulse forcing because the step forcing represents input change that a treatment plant is most closely to receive. In practice, however, a diurnal variation in influent concentration is experienced normally. Two concentration feed step changes were performed. The activated sludge system was operated at steady-state conditions before each dynamic forcing was investigated. The dissolved oxygen concentration in the bioreactor was always maintained above the growth-limiting concentrations. The operating conditions in the bioreactor of these step forcings have been presented above. The feed concentration during the first shock load was approximately two times the normal influent concentration. The next step change was performed by a two-fold substrate concentration increase, i.e. at normal influent concentration. The average COD influent value after the first step change was 1800 mg d m - 3 and corresponded to standard deviation value 83mgdm~\ The COD and total biomass concentration responses of the activated sludge reactor to this forcing are shown in Figs. 3 and 4, respectively. One can observe damped oscillations ranging above and below the new steady-state values after an imposed change. Relatively smooth transitions were made to the new steady-state in the case of biomass concentrations in comparison with COD concentration behaviour. The
I 1 I I I i i i i I I 0 10 20 30 Д0 ť/d
ľig. 3. COD concentration response of activated sludge process to two-fold decreasing of feed concentration.
Experimental; ••• calculated using Monod equation lor the constant Iced: calculated using Monod equation lor the variable feed.
Chcm. Papers 44(1) 409 420 (1990) 415

J. DERCO. M. K R Á L I K . M. H U T Ň A N . P. GUBOVÁ
experimental results plotted in Figs. 3 and 4 show clearly that more frequent sampling of effluent COD concentration is needed during transient conditions in order to evaluate its oscillatory behaviour and eliminate laboratory operating procedure failures.
У Г I 1 1 1 1 1 1 1 I |
T i i i i I l I i i X 0 10 20 30 40 t/ú
Fig. 4. Biomass concentration responses of activated sludge process to two-fold decreasing of feed concentration.
Experimental: ••• calculated using Monod equation for the constant feed; calculated using Monod equation for the variable feed.
Fewer mixed liquor suspended solids (MLSS) measurements are required in comparison with effluent substrate concentration measurements because of the relative change in the magnitude of response. It was observed that the activated sludge system with lower feed concentration was able to respond to a shock better than the one with a higher COD of the feed solution. More drastic fluctuations of the effluent COD concentrations with higher COD feed concentration were observed. Evaluation of the second step change is presented in [27]. Different system responses to shock load were observed in terms of COD. biomass concentration, ammonium nitrogen, and HMT. Qualitative evaluation of these responses will be published later.
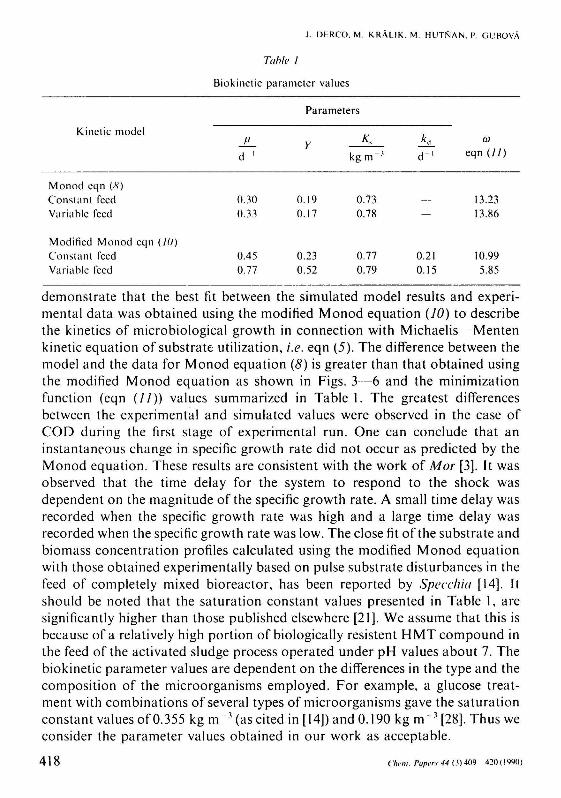
Some of the transient response data were used to obtain the biokinetic parameters for the dynamic model. Computer analysis of these data with a simplex optimization method in connection with Runge—Kutta—Merson routine yielded the parameter values of eqns (6) and (8) or (10), for these experimental conditions. A summary of the parameter values obtained is presented in Table 1. The simulated COD and MLSS concentrations during the first step shock test using the Monod equation (#), both for a constant feed concentration (average COD value) and variable COD in the feed stream are also plotted in
416 Chvm. Papas 44 (3) 409 420 (1990)
ACTIVATĽD SLUDGĽ PROCĽSS. I
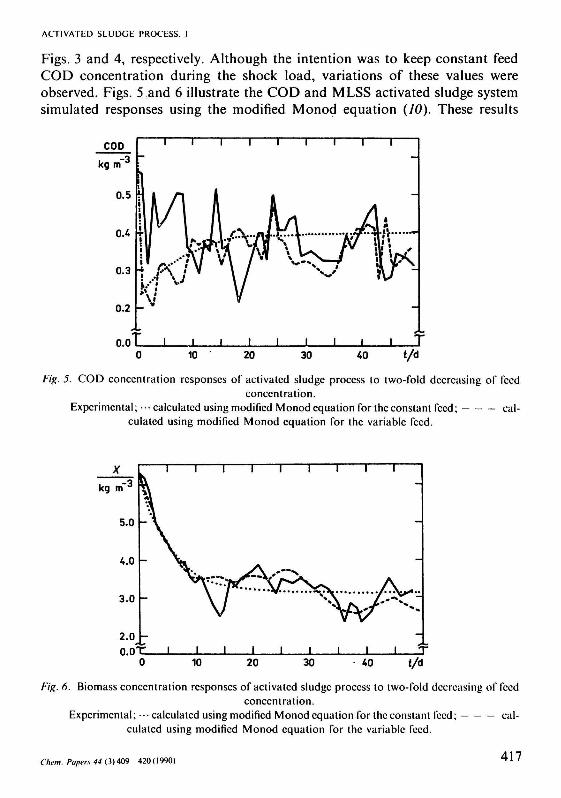
Figs. 3 and 4, respectively. Although the intention was to keep constant feed COD concentration during the shock load, variations of these values were observed. Figs. 5 and 6 illustrate the COD and MLSS activated sludge system simulated responses using the modified Monod equation (10). These results
Fig. 5. COD concentration responses of activated sludge process to two-fold decreasing of feed concentration.
Experimental; ••• calculated using modified Monod equation for the constant feed; calculated using modified Monod equation for the variable feed.
Fig. 6. Biomass concentration responses of activated sludge process to two-fold decreasing of feed concentration.
Experimental; ••• calculated using modified Monod equation for the constant feed; calculated using modified Monod equation for the variable feed.
Chem. Papers 44 0) 409 420 (1990) 417
Kinetic model
Monod eqn (<V) Constant Teed Variable feed
Modified Monod eqn Constant Teed Variable feed
(JO)
Biokinetic
d '
0.30 0.33
0.45 0.77
Table
J. DERCO
/
parameter values
. M. K R Á L I K ,
Parameters
Y
0.19 0.17
0.23 0.52
Ks
kg m - 3
0.73 0.78
0.77 0.79
M. HUTŇAN
d " 1
— —
0.21 0.15
i. P. GUBOVÁ
CÜ
eqn (//)
13.23 13.86
10.99 5.85
demonstrate that the best fit between the simulated model results and experimental data was obtained using the modified Monod equation (70) to describe the kinetics of microbiological growth in connection with Michaelis—Menten kinetic equation of substrate utilization, i.e. eqn (5). The difference between the model and the data for Monod equation (8) is greater than that obtained using the modified Monod equation as shown in Figs. 3—6 and the minimization function (eqn (//)) values summarized in Table 1. The greatest differences between the experimental and simulated values were observed in the case of COD during the first stage of experimental run. One can conclude that an instantaneous change in specific growth rate did not occur as predicted by the Monod equation. These results are consistent with the work of Mor [3]. It was observed that the time delay for the system to respond to the shock was dependent on the magnitude of the specific growth rate. A small time delay was recorded when the specific growth rate was high and a large time delay was recorded when the specific growth rate was low. The close fit of the substrate and biomass concentration profiles calculated using the modified Monod equation with those obtained experimentally based on pulse substrate disturbances in the feed of completely mixed bioreactor, has been reported by Specchia [14]. It should be noted that the saturation constant values presented in Table 1, are significantly higher than those published elsewhere [21]. We assume that this is because of a relatively high portion of biologically resistent H MT compound in the feed of the activated sludge process operated under pH values about 7. The biokinetic parameter values are dependent on the differences in the type and the composition of the microorganisms employed. For example, a glucose treatment with combinations of several types of microorganisms gave the saturation constant values of 0.355 kg m 3 (as cited in [14]) and 0.190 kg m~3 [28]. Thus we consider the parameter values obtained in our work as acceptable.
418 C'lwm. Paper* 44 (3) 409 420 (1990)

ACTIVATED SLUDGI: PROCESS. 1
Conclusion
The major objective of this work was to develop and verify a simplified dynamic model of activated sludge process for the biological solids concentration and effluent COD concentration prediction. The transient responses obtained from the step changes in influent substrate concentration were used to verify the model developed. As a result of this study it may be concluded that the Monod equation is not accurate in the prediction of the transient behaviour of the activated sludge process. The reasonably good fit between experimental data and the simulated results using modified Monod equation for microbiological growth was obtained, particularly in the biomass concentration prediction.
The studies of the dynamic behaviour of activated sludge process presented here are the first step in an elaboration of an adaptive control procedure of activated sludge process. The next step is to verify a linearized dynamic model based on the Monod type kinetics and compare it with a nonlinear dynamic model.
Symbols
BOD, COD A\i * s
M MLSS
4 </x
h i\
rs.m;i\
R
К Дх
s s«. SRT / K K x XR
УоЫ
biochemical oxygen demand chemical oxygen demand endogenous decay coefficient substrate saturation constant number of measurements mixed liquor suspended solids (biomass concentration) feed flow-rate biomass wastage rate growth rate rate of substrate utilization maximum rate of substrate utilization per unit of biomass recycling ratio microbiological growth rate substrate removal rate effluent substrate concentration feed substrate concentration solid retention time time volume of aeration tank biomass wastage flow-rate biomass concentration concentration of recycled biomass observed yield coefficient of biomass per unit of COD removed
kg m kg m h ' kg m
kg m m- h kg h kg m kg m h '
kg h kg h kg m kg m h h m3
m3 h kg m kg m
Clwm. Papers 44 (3) 404 420 (1990) 419
J. DERCO. M. K R Á L I K . M. H U T Ň A N . P. GUBOVÁ
/j specific g r o w t h ra te of m i c r o o r g a n i s m s h " 1
Дп а х m a x i m u m specific g r o w t h ra te h " 1
со minimization function О hydraulic detention time h
References
1. Komolrit. K. and Gaudy, A. F., J. Water Pollut. Contr. Fed. 38, 85 (1966). 2. Komolrit, K. and Gaudy, A. F., J. Water Pollut. Contr. Fed. 38, 1259 (1966). 3. Мог, J. R. and Fiechter, A., Biotechnol. Bioeng. 10, 787 (1968). 4. Gilley. J. W. and Bungay. H. R., Biotechnol. Bioeng. 9, 617 (1967). 5. Gilley, J. W. and Bungay, H. R., Biotechnol. Bioeng. 10, 99 (1968). 6. Young, Т. В., Bruley, D. F., and Bungay, H. R., Biotechnol. Bioeng. 12, 747 (1970). 7. Koga. S. and Humprey, A. E., Biotechnol. Bioeng. 9, 375 (1967). 8. Andrews. J. F., Water Res. 8, 261 (1974). 9. Olson. G.. AIChE Symp. Ser. No. 159. 72, 52 (1976).
10. Busby, J. B. and Andrews, J. F., J. Water Pollut. Contr. Fed. 47, 1055 (1975). 11. Attir, V. and Denn, M. M., AlChEJ. 24, 693 (1978). 12. Poduška, R. A. and Andrews, J. F., J. Water Pollut. Contr. Fed. 47, 2599 (1975). 13. Therien, N. and Perdieux, S., J. Water Pollut. Contr. Fed. 53, 576 (1981). 14. Specchia, V. and Genon, G., Ing. Chim. Ital. 20, 31 (1984). 15. CliŕTt, R. С. and Andrews, J. F., J. Water Pollut. Contr. Fed. 53, 1212 (1981). 16. Roy, D., LeDuy, A., and Roy, P. M., J. Water Pollut. Contr. Fed. 55, 1343 (1983). 17. Manickam, T. S. and Gaudy. A. F., J. Water Pollut. Contr. Fed. 57, 241 (1985). 18. Marsilli-Libelli, S., Ecolog. Model. 9, 15 (1980). 19. Marsilli-Libelli, S., Int. J. Model. Simul. 3, 81 (1983). 20. Hansen, J. L., Fiok, A. E., and Hovious, J. C , J. Water Pollut. Contr. Fed. 52, 1966 (1980). 21. Tchobanoglous, G., Wastewater Engineering. McGraw-Hill, New York, 1979. 22. Schroeder, E. D., Water and Wastewater Treatment. McGraw-Hill, New York, 1979. 23. Kubíček, M., Numerické algoritmy řešení chemicko-inženýrských úloh. (Numerical Algorithms
of Solution of Chemical-Engineering Problems.) Nakladatelství technické literatury (Publishers of Technical Literature), Prague, 1983.
24. Pierre, D. A., Optimization Theory with Applications. J. Wiley, New York, 1969. 25. Horáková, M., Lischke, P., Pekárková, M., Grünwald, A., Metody chemické analýzy vod.
(Methods of Chemical Analysis of Waters.) Nakladatelství technické literatury (Publishers of Technical Literature), Prague, 1981.
26. Standard Methods for the Examination of Water and Wastewater. 15th Edition. American Public Health Association, Washington, 1980.
27. Derco, J., Králik, M., Gubová, P., and Hutňan, M., Chem. Prüm. 39, 258 (1989). 28. Vavilin, V. A., Biotechnol. Bioeng. 24, 1721 (1982).
Translated by J. Derco
420 Chem. řapm 44 (3) 409 420 (1990)