Embed Size (px)
Citation preview

Dynamic modeling and control of yeast cell populations incontinuous biochemical reactors
Michael A. Henson *
Department of Chemical Engineering, University of Massachusetts, Amherst, MA 01003-9303, USA
Received 6 February 2003; accepted 7 February 2003
Abstract
Biochemical reactors are essential unit operations in a wide variety of biotechnological processes. As compared to conventional
chemical reactors, bioreactors present unique modeling and control challenges due to the complexity of the underlying biochemical
reactions and the heterogenous nature of cell populations. The dynamic behavior of bioreactors can be strongly affected by
variations between individual cells that are captured only with cell population models. This paper is intended to highlight our recent
work on dynamic modeling and feedback control of yeast cell populations in continuous bioreactors. The results presented
demonstrate the feasibility of using cell population models as the basis for dynamic analysis and model-based control of continuous
yeast bioreactors. The paper concludes with a short discussion of future research needs in this challenging area.
# 2003 Elsevier Science Ltd. All rights reserved.
Keywords: Biochemical reactors; Yeast cultures; Cell population modeling; Bifurcation analysis; Model-based control
1. Introduction
The goal of biochemical engineering research is
industrial production of biologically based products
such as foods and beverages, pharmaceuticals and
various commodity and specialty chemicals. The bio-
chemical manufacturing industry is growing rapidly due
to dramatic advancements in biotechnology and the
high value of biochemical products such as pharmaceu-
ticals (Lee, 1992). Process control has played a limited
role in the biochemical industry because the economic
incentives for improved process operation often are
dwarfed by costs associated with product research and
development. This situation is expected to change due to
the expiration of key patents and the continuing
development of global competition. Another obstruc-
tion to process control has been the lack of on-line
sensors for key process variables. While this will remain
an issue for the foreseeable future, recent advancements
in biochemical measurement technology make the
development of advanced process control systems a
realistic goal.
A continuous biochemical reactor (also known as a
continuous fermentor) used to grow microbial cells is
depicted in Fig. 1. Medium is supplied continuously to
the reactor to sustain growth of the cell population. The
medium contains substrates metabolized by the cells
during growth as well as other constituents such as
mineral and salts required to mimic the natural growth
environment. The agitator speed is chosen to provide
sufficient mixing while avoiding excessive shear forces
that may damage the cells (Lee, 1992). A stream is
removed continuously from the reactor to achieve
constant volume operation. The removal rate is char-
acterized by the dilution rate, which is the reciprocal of
the reactor residence time. The effluent stream contains
unreacted substrates, cellular biomass and various
metabolites produced by the cells. Desired products
may be the cells themselves and/or some combination of
the metabolites. Off-gases such as carbon dioxide also
are produced as byproducts of the biochemical reac-
tions.Mathematical modeling of microbial cell growth
kinetics continues to be an important focus of biochem-
ical engineering research (Nielsen and Villadsen, 1994).* Tel.: �/1-413-545-3481; fax: �/1-413-545-1647.
E-mail address: [email protected] (M.A. Henson).
Computers and Chemical Engineering 27 (2003) 1185�/1199
www.elsevier.com/locate/compchemeng
0098-1354/03/$ - see front matter # 2003 Elsevier Science Ltd. All rights reserved.
doi:10.1016/S0098-1354(03)00046-2

The potential impact of predictive models on bioprocess
simulation, design, optimization and control is substan-
tial. As compared to conventional chemical reactors,
bioreactors are particularly difficult to model due to the
complexity of the biochemical reactions, the unique
characteristics of individual cells and the lack of key
process measurements. The consumption of substrates
and production of metabolites result from hundreds of
coupled biochemical reactions (Mauch, Arnold, and
Reuss, 1997). Construction and dynamic modeling of
these complex reaction networks is a very challenging
problem. While they often are viewed as homogeneous
mixture of identical cells, microbial cultures actually are
comprised of heterogeneous mixtures of cells that differ
with regard to size, mass and intracellular concentra-
tions of proteins, DNA and other chemical constituents
(Srienc and Dien, 1992). Accurate modeling of cell
growth and metabolite formation kinetics may require
that individual cells be differentiated based on these
characteristics.
As shown in Fig. 1, a typical control system for a
continuous bioreactor consists of simple feedback loops
that regulate reactor liquid volume, temperature and
pH. The control system is designed to supply a constant
nutrient flow that is expected to maximize steady-state
cell growth in the absence of external disturbances. This
open-loop control strategy does not ensure satisfactory
regulation of key output variables such as the biomass
and product concentrations. The development of closed-
loop control strategies for direct biomass/metabolite
optimization would represent a significant advance in
the biochemical industry. Such control strategies require
the availability of appropriate dynamic models and on-
line measurements of key process variables. These
technical obstructions and the lack of clear economic
incentives have hindered the implementation of model-
based control systems on industrial bioreactors. Recent
progress in bioreactor modeling and measurement
techniques and the increasing realization that improved
bioreactor operation is necessary to remain competitive
has motivated new research on cell population model-
ing, dynamics and control.
The objective of this paper is to highlight our recent
work on dynamic modeling and control of continuous
Fig. 1. Continuous biochemical reactor.
M.A. Henson / Computers and Chemical Engineering 27 (2003) 1185�/11991186

yeast bioreactors described by cell population models.
In Section 2, a yeast cell population model that includes
a simple structured description of the extracellular
environment is presented. Section 3 contains dynamicsimulation and bifurcation analysis results for the yeast
model. The potential impact of recent advances in cell
distribution measurement technology on the develop-
ment of model-based control strategies is illustrated in
Section 4 where simulation results for a model predictive
controller that allows direct control of yeast cell
distribution properties are presented. Section 5 contains
a short discussion of future research needs in cellpopulation modeling and control.
2. Yeast cell population modeling
2.1. Background
Saccharomyces cerevisiae (baker’s yeast) is an impor-
tant microorganism in the brewing, baking, food
manufacturing and genetic engineering industries. Ba-
ker’s yeast can be produced in continuous bioreactors
by supplying a nutrient stream containing the substrate
glucose. As shown in Fig. 2, yeast cells proliferate via an
asymmetric process known as budding (Hjortso andNielsen, 1994). A daughter cell grows until it reaches a
critical mass called the transient mass (mt�). At this point
the cell is called a mother cell. All further growth occurs
in the bud attached to the mother cell. At a critical mass
called the division mass (md�) the mother cell and the bud
divide to produce a newborn daughter cell and a
newborn mother cell.
Many investigators have shown that continuous yeastbioreactors can exhibit complex dynamic behavior
characterized by the unpredictable appearance and
disappearance of sustained oscillations (Parulekar, Se-
mones, Rolf, Lievense, and Lim, 1986; Strassle, Sonn-
leitner, and Fiechter, 1989; von Meyenburg, 1973).
While the asymmetric cell cycle has been hypothesized
to play a key role, the underlying cellular mechanisms
that cause oscillatory yeast dynamics are controversial.
Understanding and manipulating these dynamics couldlead to important advances in yeast production pro-
cesses and provide key insights into the cellular behavior
of more complex cells present in higher organisms.
Our group has been developing a cell population
model based on the simple description of the asymmetric
yeast cell cycle to rationalize the oscillatory dynamics
observed experimentally. The long-term goal is to design
model-based controllers that improve bioreactor oper-ability and productivity through the attenuation and/or
stabilization of the oscillatory open-loop dynamics. A
key feature of the cell population model is that the
transition and division masses vary with the glucose
concentration in the extracellular environment. Our
previously published model (Zhu, Zamamiri, Henson,
and Hjortso, 2000) is unstructured in the sense that
other constituents of the extracellular environment areneglected completely. This unstructured model lacks
variables that can be compared directly to readily
available extracellular measurements such as the dis-
solved oxygen and evolved carbon dioxide concentra-
tions. Below our recently developed cell population
model (Mhaskar, Henson, and Hjortso, 2002) which
contains a simple structured description of the extra-
cellular environment is presented. Although not dis-cussed here for the sake of brevity, the model structure is
well suited for the application of estimation techniques
aimed at determining unknown parameters from experi-
mental data (Mhaskar, Henson, and Hjortso, 2002).
2.2. Model formulation
The population balance equation (PBE) that describes
the evolution of the cell mass number distribution is
formulated as follows (Eakman, Fredrickson, and
Tsuchiya, 1996):
@W (m; t)
@t�
@[K(S?)W (m; t)]
@m
�gm?
0
2p(m;m?)G(m?;S?)W (m?; t)dm?
� [D�G(m)]W (m; t) (1)
where m is the cell mass; W (m , t) is the cell number
density; K (S ?) is the overall single cell growth rate; S ? is
the effective substrate concentration (defined below);
p (m , m ?) is the newborn cell probability function;G(m;S?) is the division intensity function; and D is the
dilution rate. The division intensity function is modeled
as:Fig. 2. Simplified cell cycle for budding yeast.
M.A. Henson / Computers and Chemical Engineering 27 (2003) 1185�/1199 1187

G(m;S?)�0 m5mt��mo
ge�o(m�md�)2
m � [mt��mo;md�]g m]md�
8<: (2)
where mt� and md� are the cell transition and division
masses, respectively; mo is the additional mass beyond
mt� that mother cells must gain before division ispossible; and o and g are constant parameters. This
function models the probabilistic nature of cell division.
The newborn cell probability function has the form:
p(m;m?)�A exp[�b(m�mt�)2]
�A exp[�b(m�m?�mt�)2] (3)
when m B/m ? and m ?�/mt��/mo; the function is identi-
cally zero otherwise. Here A and b are constant
parameters. This function yields two Gaussian peaks
in the cell number distribution, one centered at mt�
corresponding to mother cells and one centered at mt��/
m ? corresponding to daughter cells.
Yeast cell cycle events are affected by the extracellularenvironment through a highly complex set of signaling
processes. In principle, these relationships can be
captured by a structured bioreactor model (Nielsen
and Villadsen, 1994). We pursue a much simpler
approach that preserves the unstructured nature of the
intracellular description. The transition and division
masses are assumed to be functions of the effective
substrate concentration:
mt�(S?)�mt0�Kt(Sl�Sh) S?BSl
mt0�Kt(S?�Sh) S? � [Sl;Sh]
mt0 S?�Sh
8<: (4)
md� (S?)�md0�Kd(Sl�Sh) S?BSl
md0�Kd(S?�Sh) S? � [Sl;Sh]
md0 S?�Sh
8<: (5)
where Sl, Sh, mt0, md0, Kt and Kd are constants. Thesesaturation functions are consistent with experimental
observations that the ratio of the division and transition
masses increases as the nutrient concentration increases
(Alberghina, Ranzi, Porro, and Martegani, 1991).
The following reaction sequence accounts for the
major metabolic pathways (glucose fermentation, glu-
cose oxidation and ethanol oxidation) thought to be
involved in oscillatory yeast dynamics:
C6H12O6 0 2C2H5OH�2CO2
C6H12O6�6O2 0 6CO2�6H2O
C2H5OH�3O2 0 2CO2�3H2O (6)
The glucose fermentation rate Kgf is assumed to follow
Monod kinetics with respect to glucose. The glucose
oxidation rate Kgo and the ethanol oxidation rate Keo
are assumed to follow Monod kinetics with respect to
the associated substrate and dissolved oxygen. Prefer-
ential consumption of glucose as compared to ethanol is
modeled by introducing a glucose inhibition term in the
ethanol oxidation rate. The resulting rate expressions
are:
Kgf (G?)�mmgfG?
Kmgf � G?(7)
Kgo(G?;O)�mmgoG?
Kmgo � G?
O
Kmgd � O(8)
Keo(G?;E?;O)�mmeoE?
Kmeo � E?
O
Kmed � O
Kinhib
Kinhib � G?(9)
where O is the dissolved oxygen concentration; mmgf ;mmgo and mmeo are maximum consumption rates; Kmgf,
Kmgo, Kmgd, Kmeo and Kmed are saturation constants;and Kinhib is a constant that characterizes the inhibitory
effect of glucose on ethanol fermentation. The overall
single cell growth rate K (S ?) is the sum of the growth
rates due to the three metabolic pathways.
The substrate mass balance equations are:
dG
dt�D(Gf �G)
�g�
0
�Kgf (G?)
Ygf
�Kgo(G?)
Ygo
�W (m; t)dm (10)
dE
dt�D(Ef �E)�
92
180 g�
0
f (m)Kgf (G?)
Ygf
W (m; t)dm
�g�
0
Keo(E?)
Yeo
W (m; t)dm (11)
where G and E are the glucose and ethanol concentra-
tions, respectively; G ? and E ? are the effective glucose
and ethanol concentrations, respectively; Gf and Ef are
the feed glucose and ethanol concentrations, respec-tively; Ygf, Ygo and Yeo are constant yield coefficients;
and the ratio 92/180 represents the mass of ethanol
produced per mass of glucose fermentatively consumed.
Experimental data suggests that ethanol is excreted
primarily by budded cells (Alberghina, Ranzi, Porro,
and Martegani, 1991). The function f (m ) in Eq. (11) is
used to model this behavior:
f (m)�0 m5mt�ge exp[�oe(m�mt��me)
2] m�mt�
�(12)
where ge; oe and me are constant parameters. The filteredsubstrate concentrations model the delayed response of
cell metabolism to changes in the extracellular environ-
ment:
dG?
dt�ag(G�G?) (13)
dE?
dt�ae(E�E?) (14)
where ag and ae are constants.
M.A. Henson / Computers and Chemical Engineering 27 (2003) 1185�/11991188

The liquid phase oxygen balance is written as:
dO
dt�Kloa(O��O)
�g�
0
�192
180
Kgo(G?)
Ygo
�96
46
Keo(E?)
Yeo
�W (m; t)dm (15)
where O* is the saturation oxygen concentration; Klo isthe oxygen mass transfer coefficient; a is the interfacial
area per unit liquid volume; the ratio 192/180 represents
the mass of oxygen consumed per mass of glucose
oxidatively metabolized; and the ratio 96/46 represents
the mass of oxygen consumed per mass of ethanol
metabolized. The oxygen solubility is assumed to be
governed by Henry’s law:
O��HORTOout (16)
where HO is the Henry’s rate constant for oxygen; Oout
is oxygen partial pressure in the gas exhaust stream; T is
the absolute temperature; and R is the gas constant. The
gas phase oxygen balance is:
dVgOout
dt�F (Oin�Oout)�Kloa(O��O)Vl (17)
where Vg and Vl are the gas phase and liquid phasevolumes, respectively; F is the volumetric air feed flow
rate; and Oin is the oxygen partial pressure in the air feed
stream.
The liquid phase carbon dioxide balance is:
dC
dt�Klca(C��C)
�g�
0
�264
180
Kgo(G?)
Ygo
�88
46
Keo(E?)
Yeo
�W (m; t)dm
�g�
0
�f (m)
88
180
Kgf (G?)
Ygf
�W (m; t)dm (18)
where C is the liquid phase carbon dioxide concentra-
tion; C* is the saturation carbon dioxide concentration;
Klc is the carbon dioxide mass transfer coefficient; theratio 264/180 represents the mass of carbon dioxide
produced per mass of glucose oxidatively metabolized;
the ratio 88/46 represents the mass of carbon dioxide
produced per mass of ethanol metabolized; and the ratio
88/180 represents the mass of carbon dioxide produced
per mass of glucose fermentatively metabolized. The
carbon dioxide solubility is modeled as:
C��HC(pH)RTCout (19)
where HC is the Henry’s constant for carbon dioxidewhich is evaluated at a pH of 5.0; and Cout is the carbon
dioxide partial pressure in the exhaust gas stream. The
gas phase carbon dioxide balance is:
dVgCout
dt�F (Cin�Cout)�Klca(C��C)Vl (20)
where Cin is the carbon dioxide partial pressure in the air
feed stream.
The yeast cell population model contains approxi-
mately 40 parameters which must be specified. Valuesfor parameters such as yield coefficients and maximum
growth rates available in the literature are listed in Table
1. Also listed in this table are nominal operating
conditions used in our laboratory experiments. Other
parameter such as constants in the division intensity and
newborn probability functions are not available. The
parameter values listed in Table 2 have been chosen to
obtain qualitative agreement with experimental data.Although not discussed here, a limited number of these
parameters can be estimated from data to improve the
predictive capability of the model (Mhaskar, Henson,
and Hjortso, 2002).
3. Yeast cell population dynamics
3.1. Experimental data
Many investigators have shown that continuous yeast
bioreactors can exhibit sustained oscillations that are
reflected in measurements of intracellular and extra-
cellular variables (Parulekar, Semones, Rolf, Lievense,
and Lim, 1986; Strassle, Sonnleitner, and Fiechter, 1989;von Meyenburg, 1973). Sustained oscillations are ob-
served only for a specific range of dilution rates
(Parulekar, Semones, Rolf, Lievense, and Lim, 1986);
stable steady-states are obtained for dilution rates below
and above this range. In collaboration with Prof. Martin
Hjortso (LSU), laboratory experiments were undertaken
to further explore this dynamic phenomenon. Batch and
continuous culture experiments were performed using aBioflo 3000 fermenter (New Brunswick) with a working
Table 1
Experimentally derived cell population model parameters
Variable Value Variable Value
Ygf 0.15 g/g mmgf 30�/10�13 g/h
Ygo 0.65 g/g mmgo 3.25�/10�13 g/h
Yeo 0.5 g/g mmeo 7�/10�13 g/h
Kmgf 40 g/l Kmgo 2 g/l
Kmeo 1.3 g/l Kinhib 0.4 g/l
Kmgd 0.001 g/l Kmed 0.001 g/l
HO 0.0404 g/l/atm HC 1.48 g/l/atm
Vg 0.9 l Vl 0.1 l
Kla 1500 h�1 Klc 1500 h�1
D 0.15 h�1 Gf 30 g/l
Ef 0 g/l F 90 l/h
T 298 K Oin 0.21 atm
Cin 0.0003 atm
M.A. Henson / Computers and Chemical Engineering 27 (2003) 1185�/1199 1189

volume of 1.0 l. The fermenter was interfaced to a
personal computer with the necessary software for data
collection and basic regulatory control functions. De-
tails on medium preparation and the experimental
protocol are available elsewhere (Zamamiri, Birol and
Hjortso, 2001).
The top plot in Fig. 3 shows the dynamic response
obtained for batch startup followed by a switch to
continuous operation. The exhaust gas CO2 concentra-
tion is used as a representative output variable for the
culture. Following inoculation with yeast cells at t�/0,
the bioreactor was operated in batch mode to allow a
sufficient density of cells to be produced. Sustained
oscillations were observed immediately following the
switch to continuous operation at t�/20 h. The lower
plot in Fig. 3 shows the cell number distribution as a
function of cell size at the times indicated in the top plot.
Two distinct cell subpopulations were formed as the
culture progresses through batch growth. The first and
second peaks represent subpopulations of daughter cells
and mother cells, respectively. As discussed below, the
presence of such well defined subpopulations is strongly
correlated to the subsequent appearance of sustained
oscillations.
Another experiment was designed to test our hypoth-
esis that a stable steady state and a periodic attractor
can exist at the same operating conditions. A represen-
tative set of results is shown in Fig. 4 (Zamamiri, Birol,
and Hjortso, 2001). The experiment started with oscil-
latory dynamics that were obtained by switching the
Table 2
Other cell population model parameters
Variable Value Variable Value
g 400 o 7
ge 8 oe 20
mo 1�/10�13 g me 1.54�/10�13 g
A /
ffiffiffiffiffiffiffiffiffiffi10=p
pb 40
Sl 0.1 g/l Sh 2.0 g/l
Kt 0.01 g/g l Kd 3.83 g/g l
mto 4.55�/10�13 g mdo 10.25�/10�13 g
ag 20 ae 20
Fig. 3. Experimental switch from batch to continuous operation.
M.A. Henson / Computers and Chemical Engineering 27 (2003) 1185�/11991190
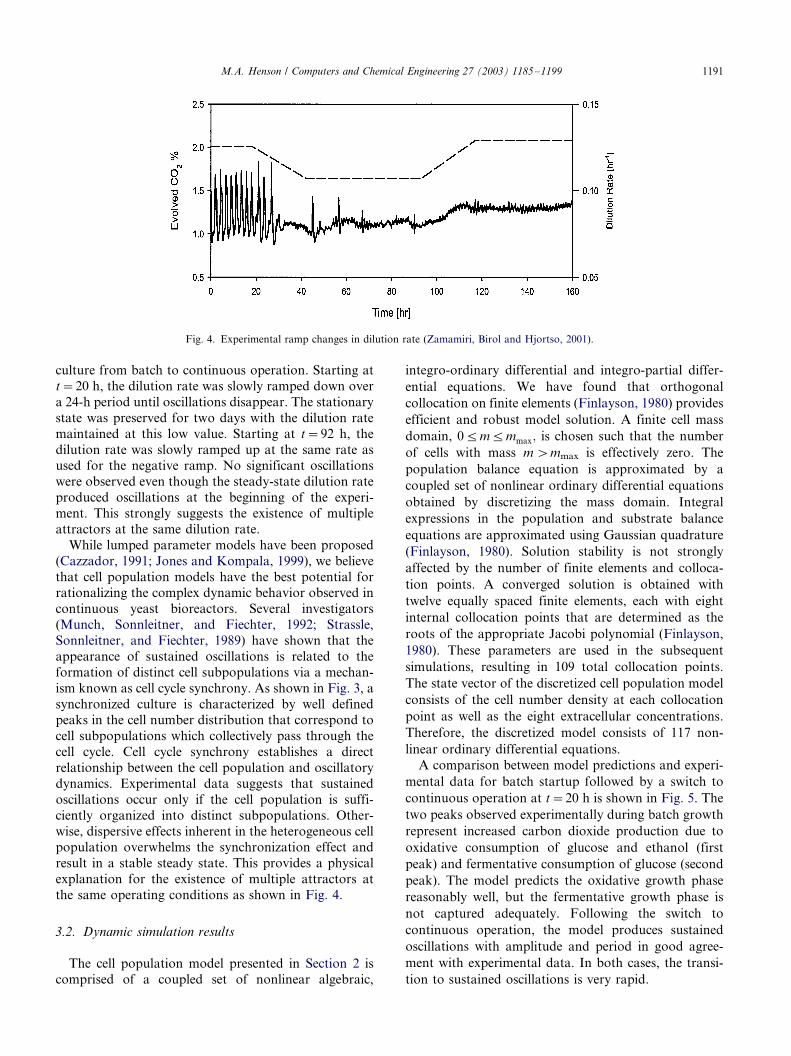
culture from batch to continuous operation. Starting at
t�/20 h, the dilution rate was slowly ramped down over
a 24-h period until oscillations disappear. The stationary
state was preserved for two days with the dilution rate
maintained at this low value. Starting at t�/92 h, the
dilution rate was slowly ramped up at the same rate asused for the negative ramp. No significant oscillations
were observed even though the steady-state dilution rate
produced oscillations at the beginning of the experi-
ment. This strongly suggests the existence of multiple
attractors at the same dilution rate.
While lumped parameter models have been proposed
(Cazzador, 1991; Jones and Kompala, 1999), we believe
that cell population models have the best potential forrationalizing the complex dynamic behavior observed in
continuous yeast bioreactors. Several investigators
(Munch, Sonnleitner, and Fiechter, 1992; Strassle,
Sonnleitner, and Fiechter, 1989) have shown that the
appearance of sustained oscillations is related to the
formation of distinct cell subpopulations via a mechan-
ism known as cell cycle synchrony. As shown in Fig. 3, a
synchronized culture is characterized by well definedpeaks in the cell number distribution that correspond to
cell subpopulations which collectively pass through the
cell cycle. Cell cycle synchrony establishes a direct
relationship between the cell population and oscillatory
dynamics. Experimental data suggests that sustained
oscillations occur only if the cell population is suffi-
ciently organized into distinct subpopulations. Other-
wise, dispersive effects inherent in the heterogeneous cellpopulation overwhelms the synchronization effect and
result in a stable steady state. This provides a physical
explanation for the existence of multiple attractors at
the same operating conditions as shown in Fig. 4.
3.2. Dynamic simulation results
The cell population model presented in Section 2 is
comprised of a coupled set of nonlinear algebraic,
integro-ordinary differential and integro-partial differ-
ential equations. We have found that orthogonal
collocation on finite elements (Finlayson, 1980) provides
efficient and robust model solution. A finite cell mass
domain, 05m5mmax; is chosen such that the number
of cells with mass m �/mmax is effectively zero. The
population balance equation is approximated by a
coupled set of nonlinear ordinary differential equations
obtained by discretizing the mass domain. Integral
expressions in the population and substrate balance
equations are approximated using Gaussian quadrature
(Finlayson, 1980). Solution stability is not strongly
affected by the number of finite elements and colloca-
tion points. A converged solution is obtained with
twelve equally spaced finite elements, each with eight
internal collocation points that are determined as the
roots of the appropriate Jacobi polynomial (Finlayson,
1980). These parameters are used in the subsequent
simulations, resulting in 109 total collocation points.
The state vector of the discretized cell population model
consists of the cell number density at each collocation
point as well as the eight extracellular concentrations.
Therefore, the discretized model consists of 117 non-
linear ordinary differential equations.
A comparison between model predictions and experi-
mental data for batch startup followed by a switch to
continuous operation at t�/20 h is shown in Fig. 5. The
two peaks observed experimentally during batch growth
represent increased carbon dioxide production due to
oxidative consumption of glucose and ethanol (first
peak) and fermentative consumption of glucose (second
peak). The model predicts the oxidative growth phase
reasonably well, but the fermentative growth phase is
not captured adequately. Following the switch to
continuous operation, the model produces sustained
oscillations with amplitude and period in good agree-
ment with experimental data. In both cases, the transi-
tion to sustained oscillations is very rapid.
Fig. 4. Experimental ramp changes in dilution rate (Zamamiri, Birol and Hjortso, 2001).
M.A. Henson / Computers and Chemical Engineering 27 (2003) 1185�/1199 1191

Model and experimental responses for ramp changes
in the dilution rate are shown in Fig. 6. The series of
dilution rate changes are identical to those used to
produce the experimental data in Fig. 4. The predicted
oscillations at the beginning of the test are very similar
to those observed experimentally. Following the nega-
Fig. 5. Comparison of model and experiment for switch from batch to continuous operation.
Fig. 6. Comparison of model and experiment for ramp changes in dilution rate.
M.A. Henson / Computers and Chemical Engineering 27 (2003) 1185�/11991192

tive ramp change, the model predicts that oscillations
will be strongly attenuated but not completely elimi-
nated. This prediction is consistent with experimental
data because the small amplitude oscillations predicted
by the model are below the noise level in the carbon
dioxide measurement. Following the positive ramp
change, the model predicts that oscillations will dis-
appear completely. This test demonstrates that the
model structure is capable of supporting multiple
attractors at the same operating conditions as observed
experimentally.
The effect of the initial cell number distribution on the
model response is illustrated in Figs. 7 and 8. An initial
distribution that leads to a stable steady-state solution is
shown in the top plot of Fig. 7. As shown in the bottom
plot, the initial distribution is sufficiently disorganized
for the oscillations to slowly decay. The final distribu-
tion shown in the top plot is very dispersed as compared
to the initial distribution. A slightly more organized
initial distribution that leads to sustained oscillations is
shown in the top plot of Fig. 8. The oscillation
amplitude grows until a stable periodic solution is
obtained. Two well defined peaks that correspond to
daughter and mother cell subpopulations are present in
the final distribution. These tests verify that the model is
consistent with experimental observations that sustained
oscillations are intimately related to cell cycle synchrony
and the formation of distinct cell subpopulations. Given
their similarities, the initial distributions shown in Figs.
7 and 8 appear to be near the separatix that divides the
domains of attraction of the two solutions.
3.3. Bifurcation analysis results
In our previous publications (Zhang and Henson,
2001; Zhang, Zamamiri, Henson, and Hjortso, 2002),
we have argued that bifurcation analysis allows more
insightful comparisons of bioreactor model predictionsand experimental data than is possible with dynamic
simulation alone. Such analysis can be applied to the
yeast cell population model to characterize the bifurca-
tions that result in appearance and disappearance of
periodic solutions. Because bifurcation theory has been
developed primarily for nonlinear ordinary differential
equation systems (Kuznetsov, 1995), the discretized
version of the cell population model is utilized foranalysis.
The first task is to determine local stability of steady-
state solutions. This is achieved by computing the
eigenvalues of the Jacobian matrix evaluated at each
steady-state of interest. A dilution rate where one or
more eigenvalues cross the imaginary axis is known as a
bifurcation point. Locating periodic solutions and
determining their stability is a more difficult problem.We utilize a continuation code specifically designed for
high-dimensional systems obtained from Prof. Yannis
Fig. 7. Model prediction of steady state.
M.A. Henson / Computers and Chemical Engineering 27 (2003) 1185�/1199 1193

Kevrekidis (Princeton) (Krishnan, Baer, and Imbihl,
2000). A good initial guess of the state variables and the
oscillation period corresponding to the limit cycle must
be supplied to achieve convergence. For stable periodic
solutions, the initial guess is obtained readily by
dynamic simulation.
A bifurcation diagram for the discretized cell popula-
tion model is shown in Fig. 9 where the dilution rate (D )
is the bifurcation parameter and the glucose concentra-
tion (S) is chosen as a representative output variable.
The model possesses a single stable steady-state solution
(�/) at low dilution rates. As the dilution rate is
increased, a bifurcation occurs where the steady-state
solution becomes unstable (k) and a stable periodic
solution with oscillations of the amplitude indicated
(�/ �/ �/) appears. This subcritical Hopf bifurcation is
accompanied by the appearance of large amplitude
oscillations. The stable periodic solution exists with the
unstable steady-state solution for a large range of
dilution rates. As the dilution rate is increased further,
a second bifurcation occurs where the periodic solution
disappears and the steady-state solution regains its
stability. This subcritical Hopf bifurcation is character-
ized by small amplitude oscillations. There is a small
range of dilution rates near the subcritical bifurcation
that supports both steady-state and periodic attractors.
The domains of attractions of the two asymptotic
solutions are separated by an unstable periodic solution
with oscillations of the amplitude indicated (*/). This
result provides a simple qualitative explanation for the
dynamic simulation results presented above.
4. Yeast cell population control
4.1. Motivation
Feedback control is necessary to ensure satisfactory
performance of continuous yeast bioreactors in the
presence of external disturbances and/or changes in
operational requirements. As depicted in Fig. 1, a
typical bioreactor control system consists of simple
regulatory loops designed to maintain environmental
conditions that promote cell growth. Such schemes do
not allow direct control of variables such as biomass andmetabolite concentrations that determine profitability of
the bioprocess. During the last decade, substantial work
has been focused on the development of more advanced
adaptive and/or nonlinear control strategies for contin-
uous bioreactors (Bastin and Dochain, 1990; Hoo and
Kantor, 1986; Kurtz, Henson, and Hjortso, 2000). These
methods are based on lumped parameter models that
neglect the heterogeneous nature of the cell population.Lack of suitable on-line measurements has been a
major obstruction to the development of controller
design techniques based on cell population models.
Fig. 8. Model prediction of sustained oscillations.
M.A. Henson / Computers and Chemical Engineering 27 (2003) 1185�/11991194

This barrier is less daunting with the development of
biochemical measurement technology such as flow
cytometry which enables cell distribution properties to
be elucidated. Flow cytometry allows individual cells to
be differentiated with respect to their protein content,
DNA content and other intracellular properties (Alber-
ghina, Ranzi, Porro, and Martegani, 1991; Srienc, 1999).
Recently, flow cytometry has been combined with flow
injection systems that allow on-line measurement of cell
distribution properties (Zhao, Natarajan, and Srienc,
1999). This provides motivation for the development of
advanced control strategies in which cell population
models are utilized to manipulate cell cycle character-
istics and/or regulate cell property distributions.Our work on continuous yeast bioreactor control has
been focused on modifying the open-loop dynamics that
result in sustained oscillations (Zhang, Zamamiri, Hen-
son, and Hjortso, 2002; Zhu, Zamamiri, Henson, and
Hjortso, 2000). A possible control objective is stabiliza-
tion of a particular steady state to eliminate oscillations
that adversely affect bioreactor stability and productiv-
ity. In some situations, the induction and stabilization of
oscillations that lead to increased production of key
metabolites synthesized only during part of the cell cycle
my be desirable (Hjortso, 1996). Below a linear model
predictive control (LMPC) strategy which allows either
control objective to be achieved is presented. The cell
population model used for controller design is a
simplified version of the model presented in Section 2
where the extracellular environment is described by the
concentration of a single rate limiting substrate. Addi-tional details are available in the original reference (Zhu,
Zamamiri, Henson, and Hjortso, 2000).
4.2. Model predictive control strategy
A linear controller design model is generated directly
from the discretized cell population model. The non-
linear model equations are linearized about the steady-
state operating point and temporally discretized withsampling time Dt/�/0.1 h. The resulting state-space
model has the form:
x(k�1)�Ax(k)�Bu(k)
y(k)�Cx(k) (21)
where x � R111 is the state vector comprised of the cell
mass number density at each collocation point (Wj) and
the substrate and effective substrate concentrations (S ,
S ?); u � R2 is the input vector comprised of the dilution
rate (D ) and the feed substrate concentration (Sf); and
y � Rm is the output vector defined below. The cell mass
number distribution is assumed to be measured via a
method such as flow cytometry. The controllabilitymatrix for the pair (A , B ) has rank four due to the
large state dimension and the strong collinearity of the
state variables. This indicates that the cell distribution
Fig. 9. Bifurcation diagram for cell population model.
M.A. Henson / Computers and Chemical Engineering 27 (2003) 1185�/1199 1195

cannot be modified arbitrarily with the two input
variables available.
The controller design model is completed by defining
the controlled output vector. A straightforward ap-proach is to choose the cell number density at each
collocation point as a controlled output. This can be
problematic because: (i) the control problem is highly
non-square (2 inputs, 109 outputs); (ii) cell number
densities at nearby collocation points are strongly
collinear; and (iii) the substrate concentration also needs
to be controlled to avoid washout. We have found that
good closed-loop performance can be achieved bycontrolling a subset of the cell number densities and
the substrate concentration:
y� [Wj1Wj2
� � �WjpS]T (22)
where the indices fj1; . . . ; jpg define the collocation
points where the associated cell number density is used
as a controlled output. In the subsequent simulations,
the controlled cell number densities are chosen to be the
boundary points of the finite elements. The output
vector of Eq. (22) results in a much lower dimensional
problem (14 outputs) than the full-order case.The LMPC controller is formulated as (Muske and
Rawlings, 1993):
minUN (k)
X�j�0
f[y(k� j½k)�ys]T Q[y(k� j½k)�ys]
� [u(k� j½k)�us]T R[u(k� j½k)�us]
�DuT (k� j½k)SDu(k� j½k)g (23)
where y(k�/j jk ) and u (k�/j jk ) are predicted values of
the output and input vectors, respectively; ys and us are
target values for the output and input vectors, respec-
tively; and Du(k)�u(k)�u(k�1): The decision vari-
ables are current and future values of the inputs:UN(k)� [u(k½k) . . . u(k�N�1½k)] where N is the con-
trol horizon. The inputs are subject to saturation
constraints of the form: umin5u5umax: The infinite
horizon problem in Eq. (23) can be reformulated as a
finite horizon problem and solved using standard
quadratic programming software (Muske and Rawlings,
1993). Only the first calculated input actually is im-
plemented, u (k )�/u (k jk ), and the problem is resolved atthe next time step with new measurements. The target
vectors us and ys can be adjusted on-line using a
disturbance model to eliminate offset (Muske and
Rawlings, 1993). In this application, there is little
motivation to utilize a disturbance model because there
are insufficient degrees of freedom to drive the entire cell
distribution to an arbitrary target distribution.
Fig. 10 shows the ability of the LMPC controller tostabilize a desired steady-state operating point. The
initial cell number distribution W (m , 0) is a highly
synchronized distribution corresponding to a stable
periodic solution, while the setpoint vector is obtained
from the discretized cell mass distribution at the desired
steady-state operating point. Representative output
variables shown are the zeroth-order moment of thecell number distribution m0�f
�
0W (m; t)dm and the
substrate concentration (S ). The solid line is the
LMPC controller response and the dashed line is the
open-loop response obtained in the absence of feedback
control. LMPC yields rapid attenuation of the open-
loop oscillations. Evolution of the cell number distribu-
tion is shown in Fig. 11. The initial distribution has two
well defined subpopulations that typically producesustained oscillations. The controller attenuates the
oscillations and achieves the desired steady-state dis-
tribution by counteracting cell synchrony via dispersion
of the subpopulations.
Fig. 12 demonstrates the ability of the LMPC
controller to stabilize a desired periodic solution. The
initial cell number distribution represents a steady-state
solution, while distributions corresponding to the de-sired periodic solution are defined as a time-varying
setpoint trajectory. The controller stabilizes the periodic
solution by generating oscillatory input moves.
Although not shown here, oscillations with the same
period are maintained when the controller is switched
off and the bioreactor runs under open-loop conditions.
Evolution of the cell mass distribution is shown in Fig.
13. The oscillating dynamics are accompanied bymarked synchronization of the cell population. Two
distinct subpopulations can be identified after 24 h of
operation. These results suggest that feedback control
strategies which provide direct control of the cell
distribution properties have the potential to enhance
the stability and productivity of continuous yeast
bioreactors.
5. Future research directions
This paper has provided an overview of our recent
work in yeast cell population modeling, dynamics and
control. The results presented demonstrate the feasibil-
ity of using cell population models as the basis for
dynamic analysis and feedback control of continuousyeast bioreactors.
Additional work is required to produce engineering
techniques of practical utility. Some possible directions
for future research include:
1. Derivation of cell population models with intra-
cellular structure to enhance understanding of the
complex interactions between individual cell metabolism
and cell population dynamics. The cell ensemble model-ing approach (Domach and Shuler, 1984; Henson,
Muller, and Reuss, 2002) appears to be particulary
promising.
M.A. Henson / Computers and Chemical Engineering 27 (2003) 1185�/11991196

2. Development of numerical solution and dynamic
analysis techniques for structured cell population mod-
els. An overview of available solution strategies for cell
population models is presented in a recent review paper
(Daoutidis and Henson, 2002).
3. Application of parameter estimation techniques to
achieve quantitative agreement between cell population
model predictions and experimental data. Some initial
results are presented in a recent paper (Mhaskar,
Henson, and Hjortso, 2002).
Fig. 10. Feedback stabilization of a steady-state solution.
Fig. 11. Cell number distribution evolution for steady-state solution stabilization.
M.A. Henson / Computers and Chemical Engineering 27 (2003) 1185�/1199 1197

4. Development of cell distribution control strategies
that exploit recent advances in biochemical measure-
ment technology such as on-line flow cytometry. The
LMPC strategy (Zhu, Zamamiri, Henson and Hjortso,
2000) discussed above is just a first step in this direction.
5. Collection of laboratory data for evaluation and
refinement of cell population modeling, dynamics and
control techniques. Oscillatory dynamics in yeast cul-
tures (Aon, Cortassa, Westerhoff and van Dam, 1992;
Keulers, Satroutdinov, Suzuki and Kuriyama, 1996;
Fig. 12. Feedback stabilization of a periodic solution.
Fig. 13. Cell number distribution evolution for periodic solution stabilization.
M.A. Henson / Computers and Chemical Engineering 27 (2003) 1185�/11991198

Parulekar, Semones, Rolf, Lievense and Lim, 1986)
seem well suited for this task.
Acknowledgements
The author would like to acknowledge Prof. Martin
Hjortso (LSU), Prof. Yannis Kevrekidis (Princeton) and
the former LSU students Dr. Abdelqader Zamamiri, Dr.
Guang-Yan Zhu, Dr. Yongchun Zhang and Prashant
Mhaskar for their contributions to the research results
included in the paper.
References
Alberghina, L., Ranzi, B. M., Porro, D., & Martegani, E. (1991). Flow
cytometry and cell cycle kinetics in continuous and fed-batch
fermentations of budding yeast. Biotechnology Progress 7 , 299�/
304.
Aon, M. A., Cortassa, S., Westerhoff, H. V., & van Dam, K. (1992).
Synchrony and mutual stimulation of yeast cells during fast
glycolytic oscillations. Journal of General Microbiology 138 ,
2219�/2227.
Bastin, G., & Dochain, D. (1990). On-line estimation and adaptive
control of bioreactors . Amsterdam: Elsevier Science.
Cazzador, L. (1991). Analysis of oscillations in yeast continuous
cultures by a new simplified model. Bulletin of Mathematical
Biology 53 , 685�/700.
Daoutidis, P., & Henson, M. A. (2002). Dynamics and control of cell
populations in continuous bioreactors. American Institute of
Chemical Engineering, Symposium Series 326 , 274�/289.
Domach, M. M., & Shuler, M. L. (1984). A finite representation model
for an asynchronous culture of E. coli . Biotechnology and
Bioengineering 26 , 877�/884.
Eakman, J. M., Fredrickson, A. G., & Tsuchiya, H. H. (1996).
Statistics and dynamics of microbial cell populations. Chemical
Engineering Progress, Symposium Series 62 , 37�/49.
Finlayson, B. A. (1980). Nonlinear analysis in chemical engineering .
New York: McGraw-Hill.
Henson, M. A., Muller, D., & Reuss, M. (2002). Cell population
modeling of yeast glycolytic oscillations. Biochemical Journal 368 ,
433�/446.
Hjortso, M. A. (1996). Population balance models of autonomous
periodic dynamics in microbial cultures: their use in process
optimization. Canadian Journal of Chemical Engineering 74 ,
612�/620.
Hjortso, M. A., & Nielsen, J. (1994). A conceptual model of
autonomous oscillations in microbial cultures. Chemical Engineer-
ing Science 49 , 1083�/1095.
Hoo, K. A., & Kantor, J. C. (1986). Global linearization and control
of a mixed-culture bioreactor with competition and external
inhibition. Mathematical Biosciences 82 , 43�/62.
Jones, K. D., & Kompala, D. S. (1999). Cybernetic modeling of the
growth dynamics of Saccharomyces cerevisiae in batch and
continuous cultures. Journal of Biotechnology 71 , 105�/131.
Keulers, M., Satroutdinov, A. D., Suzuki, T., & Kuriyama, H. (1996).
Synchronization affector of autonomous short-period-sustained
oscillation of Saccharomyces cerevisiae . Yeast 12 , 673�/682.
Krishnan, J., Baer, M., & Imbihl, R. (2000). Pulse dynamics and
interaction on anisotropic surfaces: a computer-assisted study.
Chemical Engineering Science 55 , 257.
Kurtz, M. J., Henson, M. A., & Hjortso, M. A. (2000). Nonlinear
control of competitive mixed culture bioreactors via specific cell
adhesion. Canadian Journal of Chemical Engineering 78 , 237�/247.
Kuznetsov, Y. A. (1995). Elements of applied bifurcation theory . New
York: Springer�/Verlag.
Lee, J. M. (1992). Biochemical engineering . Englewood Cliffs, NJ:
Prentice-Hall.
Mauch, K., Arnold, S., & Reuss, M. (1997). Dynamic sensitivity
analysis for metabolic systems. Chemical Engineering Science 52 ,
2589�/2598.
Mhaskar, P., Henson, M. A., & Hjortso, M. A. (2002). Cell population
modeling and parameter estimation of continuous cultures of
Saccharomyces cerevisiae . Biotechnology Progress 18 , 1010�/1026.
Munch, T., Sonnleitner, B., & Fiechter, A. (1992). New insights into
the synchronization mechanism with forced synchronous cultures
of Saccharomyces cerevisiae . Journal of Biotechnology 24 , 299�/
313.
Muske, K. R., & Rawlings, J. B. (1993). Model predictive control with
linear models. American Institute of Chemical Engineering Journal
39 , 262�/287.
Nielsen, J., & Villadsen, J. (1994). Bioreaction engineering principles .
New York: Plenum Press.
Parulekar, S. J., Semones, G. B., Rolf, M. J., Lievense, J. C., & Lim,
H. C. (1986). Induction and elimination of oscillations in contin-
uous cultures of Saccharomyces cerevisiae . Biotechnology and
Bioengineering 28 , 700�/710.
Srienc, F. (1999). Cytometric data as the basis for rigorous models of
cell population dynamics. Journal of Biotechnology 71 , 233�/238.
Srienc, F., & Dien, B. S. (1992). Kinetics of the cell cycle of
Saccharomyces cerevisiae. Annuals of the New York Academy of
Sciences 665 , 59�/71.
Strassle, C., Sonnleitner, B., & Fiechter, A. (1989). A predictive model
for the spontaneous synchronization of Saccharomyces cerevisiae
grown in continuous culture. II. Experimental verification. Journal
of Biotechnology 9 , 191�/208.
von Meyenburg, H. K. (1973). Stable synchrony oscillations in
continuous culture of Saccharomyces cerevisiae under glucose
limitation. In B. Chance, E. K. Pye, A. K. Shosh & B. Hess
(Eds.), Biological and biochemical oscillators (pp. 411�/417). New
York: Academic Press.
Zamamiri, A. M., Birol, G., & Hjortso, M. A. (2001). Multiple stable
states and hysteresis in continuous, oscillating cultures of budding
yeast. Biotechnology and Bioengineering 75 , 305�/312.
Zhang, Y., & Henson, M. A. (2001). Bifurcation analysis of
continuous biochemical reactor models. Biotechnology Progress
17 , 647�/660.
Zhang, Y., Zamamiri, A. M., Henson, M. A., & Hjortso, M. A. (2002).
Cell population models for bifurcation analysis and nonlinear
control of continuous yeast bioreactors. Journal of Process Control
12 , 721�/734.
Zhao, R., Natarajan, A., & Srienc, F. (1999). A flow injection flow
cytometry system for on-line monitoring of bioreactors. Biotech-
nology and Bioengineering 62 , 609�/617.
Zhu, G.-Y., Zamamiri, A. M., Henson, M. A., & Hjortso, M. A.
(2000). Model predictive control of continuous yeast bioreactors
using cell population models. Chemical Engineering Science 55 ,
6155�/6167.
M.A. Henson / Computers and Chemical Engineering 27 (2003) 1185�/1199 1199