Embed Size (px)
Citation preview
/ ©2016 NAVIGANT CONSULTING, INC. ALL RIGHTS RESERVED1
INTERIM REPORT AS OF JULY 21, 2016
PRESENTED JULY 21, 2016
DYNAMIC LOAD FLOW
STUDIES OF DISTRIBUTION
FEEDS IN THE SAN JOAQUIN
VALLEY REGION
/ ©2016 NAVIGANT CONSULTING, INC. ALL RIGHTS RESERVED2 / ©2016 NAVIGANT CONSULTING, INC. ALL RIGHTS RESERVED2
TABLE OF CONTENTS
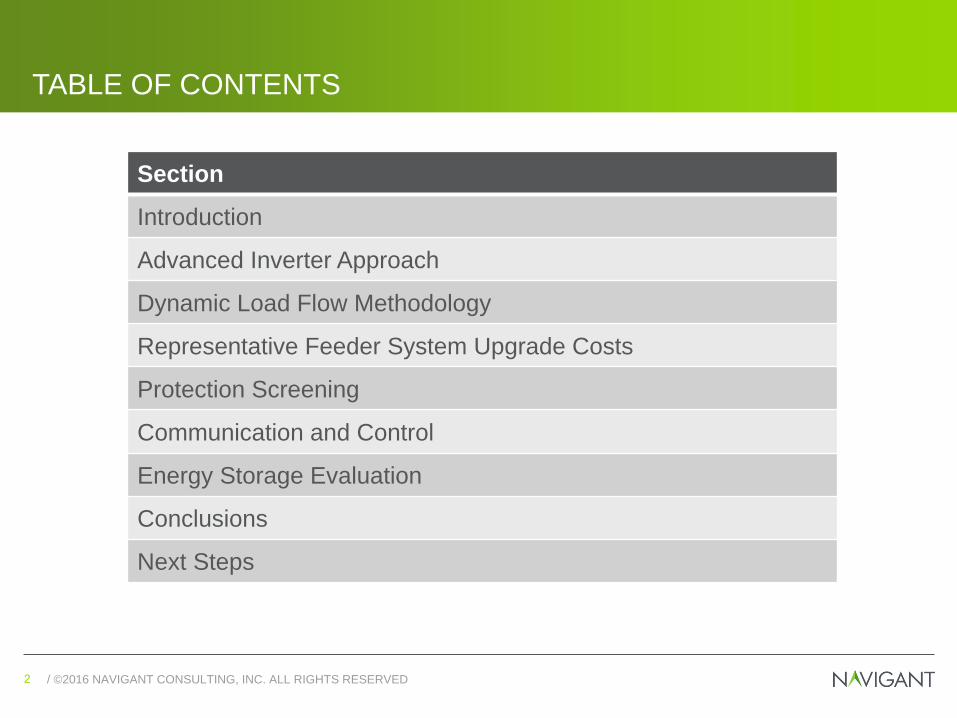
Section
Introduction
Advanced Inverter Approach
Dynamic Load Flow Methodology
Representative Feeder System Upgrade Costs
Protection Screening
Communication and Control
Energy Storage Evaluation
Conclusions
Next Steps
/ ©2016 NAVIGANT CONSULTING, INC. ALL RIGHTS RESERVED3 / ©2016 NAVIGANT CONSULTING, INC. ALL RIGHTS RESERVED3
INTRODUCTION
PHASE I, II AND III
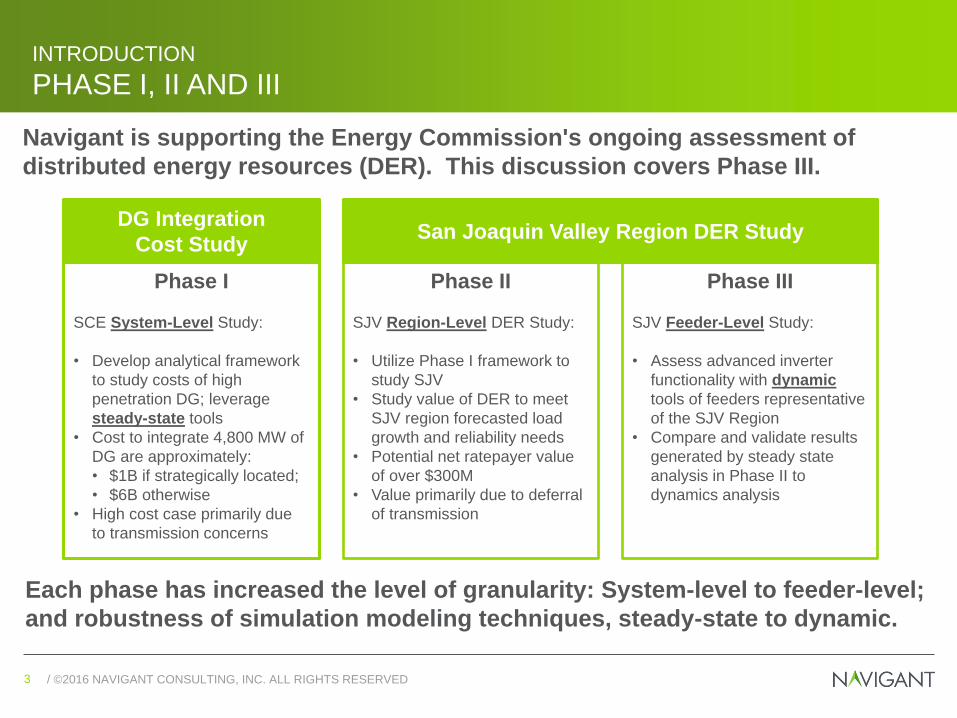
Phase I
SCE System-Level Study:
• Develop analytical framework
to study costs of high
penetration DG; leverage
steady-state tools
• Cost to integrate 4,800 MW of
DG are approximately:
• $1B if strategically located;
• $6B otherwise
• High cost case primarily due
to transmission concerns
Phase II
SJV Region-Level DER Study:
• Utilize Phase I framework to
study SJV
• Study value of DER to meet
SJV region forecasted load
growth and reliability needs
• Potential net ratepayer value
of over $300M
• Value primarily due to deferral
of transmission
Phase III
SJV Feeder-Level Study:
• Assess advanced inverter
functionality with dynamic
tools of feeders representative
of the SJV Region
• Compare and validate results
generated by steady state
analysis in Phase II to
dynamics analysis
DG Integration
Cost StudySan Joaquin Valley Region DER Study
Navigant is supporting the Energy Commission's ongoing assessment of
distributed energy resources (DER). This discussion covers Phase III.
Each phase has increased the level of granularity: System-level to feeder-level;
and robustness of simulation modeling techniques, steady-state to dynamic.
/ ©2016 NAVIGANT CONSULTING, INC. ALL RIGHTS RESERVED4 / ©2016 NAVIGANT CONSULTING, INC. ALL RIGHTS RESERVED4
INTRODUCTION
SAN JOAQUIN VALLEY REGION
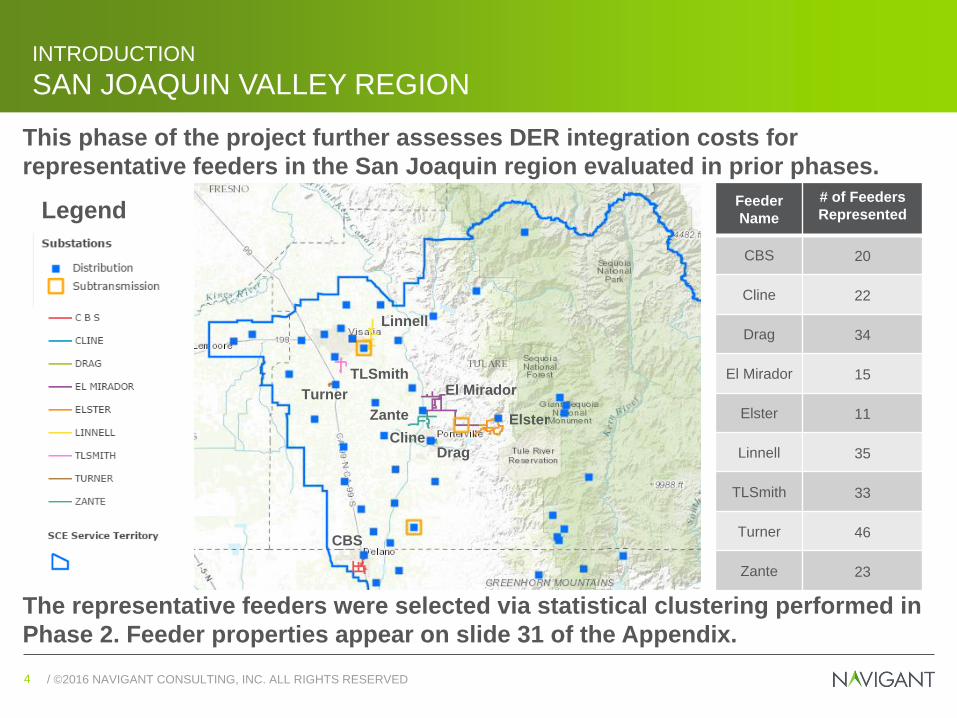
This phase of the project further assesses DER integration costs for
representative feeders in the San Joaquin region evaluated in prior phases.
LegendFeeder
Name
# of Feeders
Represented
CBS 20
Cline 22
Drag 34
El Mirador 15
Elster 11
Linnell 35
TLSmith 33
Turner 46
Zante 23
The representative feeders were selected via statistical clustering performed in
Phase 2. Feeder properties appear on slide 31 of the Appendix.
Linnell
TLSmith
Zante
CBS
El Mirador
Elster
ClineDrag
Turner
/ ©2016 NAVIGANT CONSULTING, INC. ALL RIGHTS RESERVED5 / ©2016 NAVIGANT CONSULTING, INC. ALL RIGHTS RESERVED5
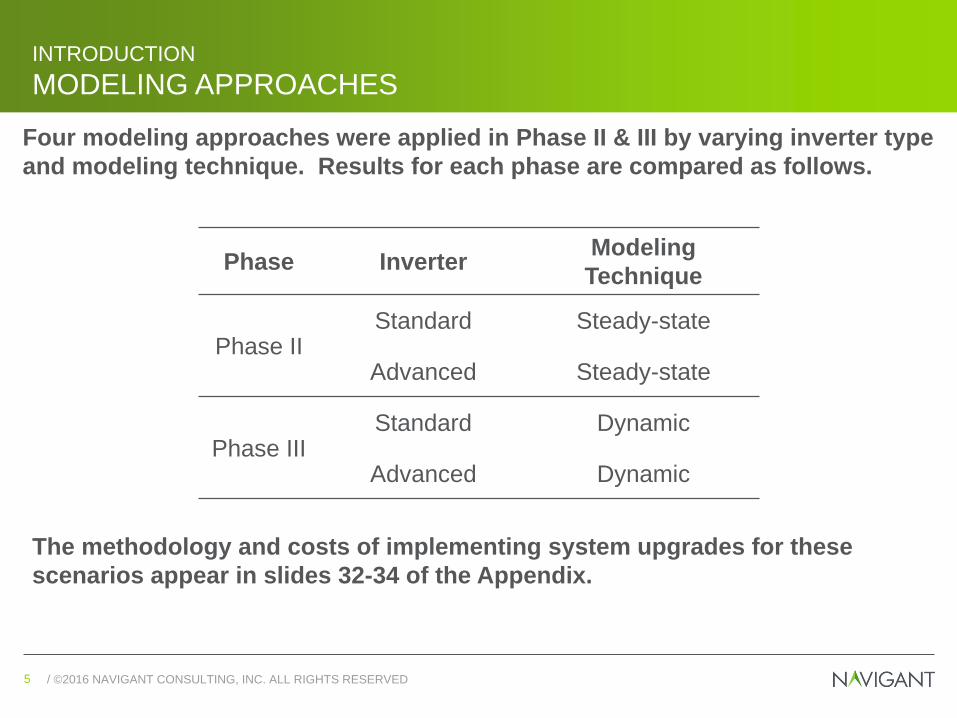
Phase InverterModeling
Technique
Phase IIStandard Steady-state
Advanced Steady-state
Phase IIIStandard Dynamic
Advanced Dynamic
INTRODUCTION
MODELING APPROACHES
Four modeling approaches were applied in Phase II & III by varying inverter type
and modeling technique. Results for each phase are compared as follows.
The methodology and costs of implementing system upgrades for these
scenarios appear in slides 32-34 of the Appendix.
/ ©2016 NAVIGANT CONSULTING, INC. ALL RIGHTS RESERVED6 / ©2016 NAVIGANT CONSULTING, INC. ALL RIGHTS RESERVED6
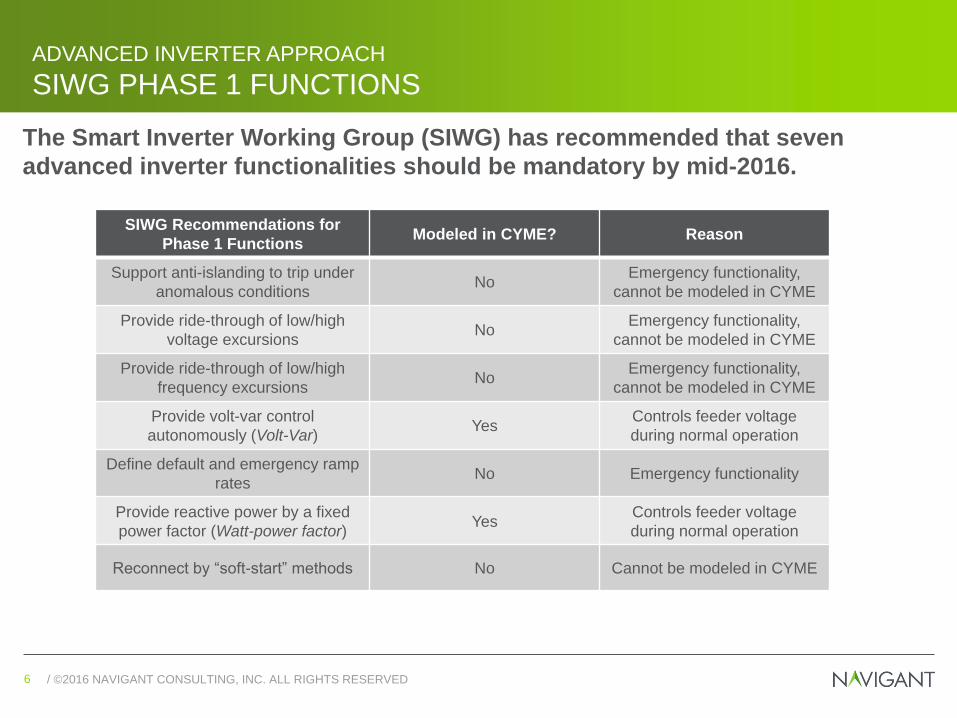
The Smart Inverter Working Group (SIWG) has recommended that seven
advanced inverter functionalities should be mandatory by mid-2016.
ADVANCED INVERTER APPROACH
SIWG PHASE 1 FUNCTIONS
SIWG Recommendations for
Phase 1 FunctionsModeled in CYME? Reason
Support anti-islanding to trip under
anomalous conditionsNo
Emergency functionality,
cannot be modeled in CYME
Provide ride-through of low/high
voltage excursionsNo
Emergency functionality,
cannot be modeled in CYME
Provide ride-through of low/high
frequency excursionsNo
Emergency functionality,
cannot be modeled in CYME
Provide volt-var control
autonomously (Volt-Var)Yes
Controls feeder voltage
during normal operation
Define default and emergency ramp
ratesNo Emergency functionality
Provide reactive power by a fixed
power factor (Watt-power factor)Yes
Controls feeder voltage
during normal operation
Reconnect by “soft-start” methods No Cannot be modeled in CYME
/ ©2016 NAVIGANT CONSULTING, INC. ALL RIGHTS RESERVED7 / ©2016 NAVIGANT CONSULTING, INC. ALL RIGHTS RESERVED7
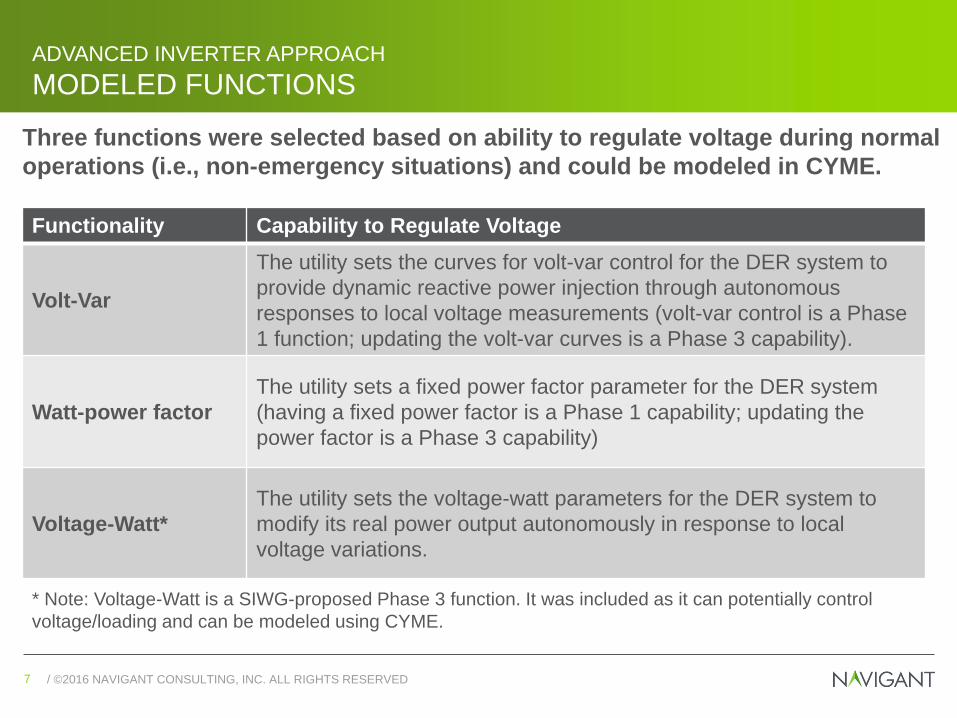
Three functions were selected based on ability to regulate voltage during normal
operations (i.e., non-emergency situations) and could be modeled in CYME.
ADVANCED INVERTER APPROACH
MODELED FUNCTIONS
Functionality Capability to Regulate Voltage
Volt-Var
The utility sets the curves for volt-var control for the DER system to
provide dynamic reactive power injection through autonomous
responses to local voltage measurements (volt-var control is a Phase
1 function; updating the volt-var curves is a Phase 3 capability).
Watt-power factor
The utility sets a fixed power factor parameter for the DER system
(having a fixed power factor is a Phase 1 capability; updating the
power factor is a Phase 3 capability)
Voltage‐Watt*
The utility sets the voltage-watt parameters for the DER system to
modify its real power output autonomously in response to local
voltage variations.
* Note: Voltage-Watt is a SIWG-proposed Phase 3 function. It was included as it can potentially control
voltage/loading and can be modeled using CYME.
/ ©2016 NAVIGANT CONSULTING, INC. ALL RIGHTS RESERVED8 / ©2016 NAVIGANT CONSULTING, INC. ALL RIGHTS RESERVED8
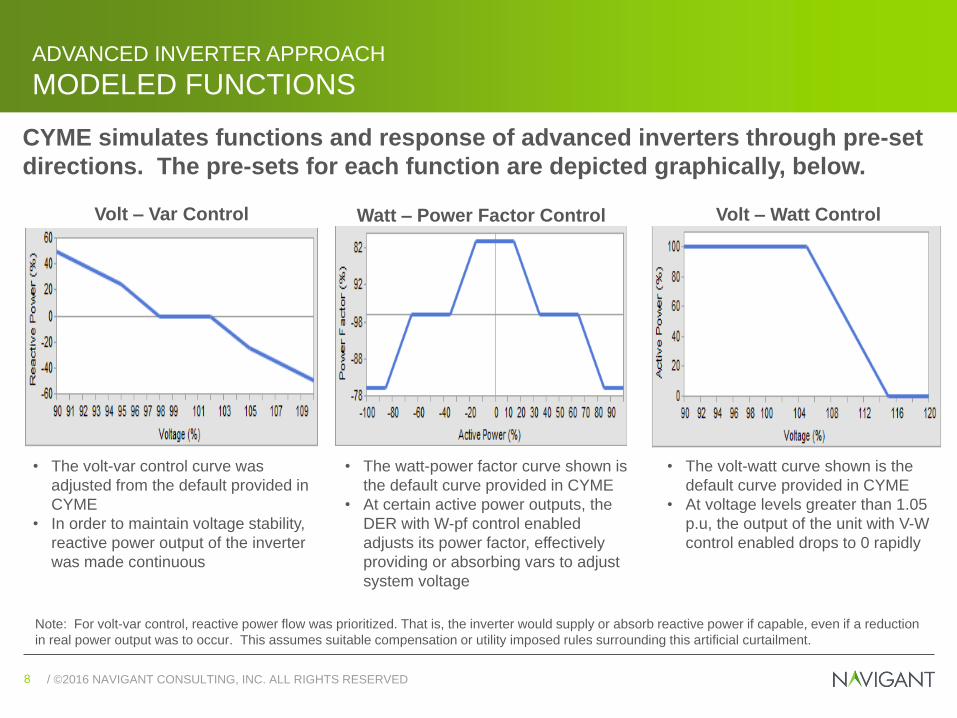
CYME simulates functions and response of advanced inverters through pre-set
directions. The pre-sets for each function are depicted graphically, below.
ADVANCED INVERTER APPROACH
MODELED FUNCTIONS
Volt – Var Control Watt – Power Factor Control
• The volt-var control curve was
adjusted from the default provided in
CYME
• In order to maintain voltage stability,
reactive power output of the inverter
was made continuous
• The watt-power factor curve shown is
the default curve provided in CYME
• At certain active power outputs, the
DER with W-pf control enabled
adjusts its power factor, effectively
providing or absorbing vars to adjust
system voltage
Note: For volt-var control, reactive power flow was prioritized. That is, the inverter would supply or absorb reactive power if capable, even if a reduction
in real power output was to occur. This assumes suitable compensation or utility imposed rules surrounding this artificial curtailment.
Volt – Watt Control
• The volt-watt curve shown is the
default curve provided in CYME
• At voltage levels greater than 1.05
p.u, the output of the unit with V-W
control enabled drops to 0 rapidly
/ ©2016 NAVIGANT CONSULTING, INC. ALL RIGHTS RESERVED9 / ©2016 NAVIGANT CONSULTING, INC. ALL RIGHTS RESERVED9
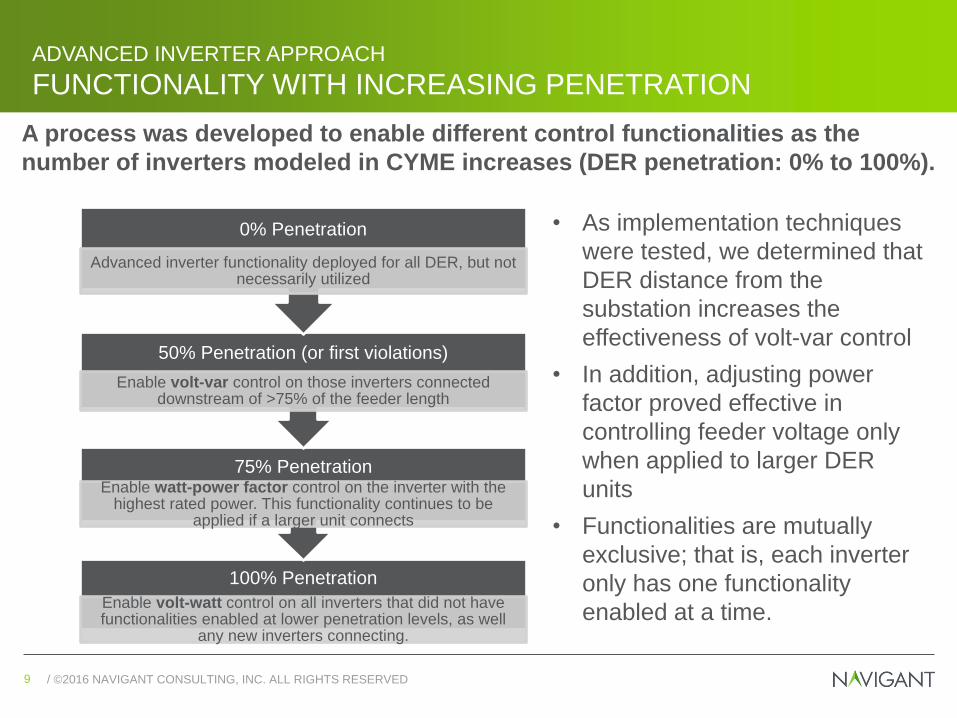
A process was developed to enable different control functionalities as the
number of inverters modeled in CYME increases (DER penetration: 0% to 100%).
ADVANCED INVERTER APPROACH
FUNCTIONALITY WITH INCREASING PENETRATION
• As implementation techniques
were tested, we determined that
DER distance from the
substation increases the
effectiveness of volt-var control
• In addition, adjusting power
factor proved effective in
controlling feeder voltage only
when applied to larger DER
units
• Functionalities are mutually
exclusive; that is, each inverter
only has one functionality
enabled at a time.
100% Penetration
Enable volt-watt control on all inverters that did not have functionalities enabled at lower penetration levels, as well
any new inverters connecting.
75% PenetrationEnable watt-power factor control on the inverter with the
highest rated power. This functionality continues to be applied if a larger unit connects
50% Penetration (or first violations)
Enable volt-var control on those inverters connected downstream of >75% of the feeder length
0% Penetration
Advanced inverter functionality deployed for all DER, but not necessarily utilized
/ ©2016 NAVIGANT CONSULTING, INC. ALL RIGHTS RESERVED10 / ©2016 NAVIGANT CONSULTING, INC. ALL RIGHTS RESERVED10
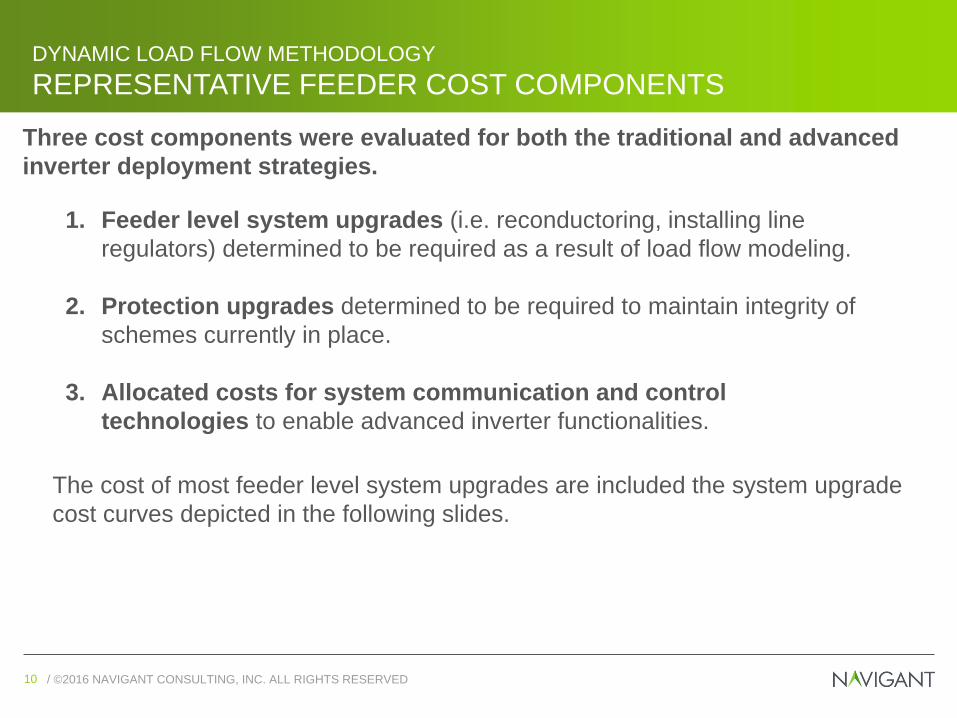
DYNAMIC LOAD FLOW METHODOLOGY
REPRESENTATIVE FEEDER COST COMPONENTS
1. Feeder level system upgrades (i.e. reconductoring, installing line
regulators) determined to be required as a result of load flow modeling.
2. Protection upgrades determined to be required to maintain integrity of
schemes currently in place.
3. Allocated costs for system communication and control
technologies to enable advanced inverter functionalities.
The cost of most feeder level system upgrades are included the system upgrade
cost curves depicted in the following slides.
Three cost components were evaluated for both the traditional and advanced
inverter deployment strategies.
/ ©2016 NAVIGANT CONSULTING, INC. ALL RIGHTS RESERVED11 / ©2016 NAVIGANT CONSULTING, INC. ALL RIGHTS RESERVED11
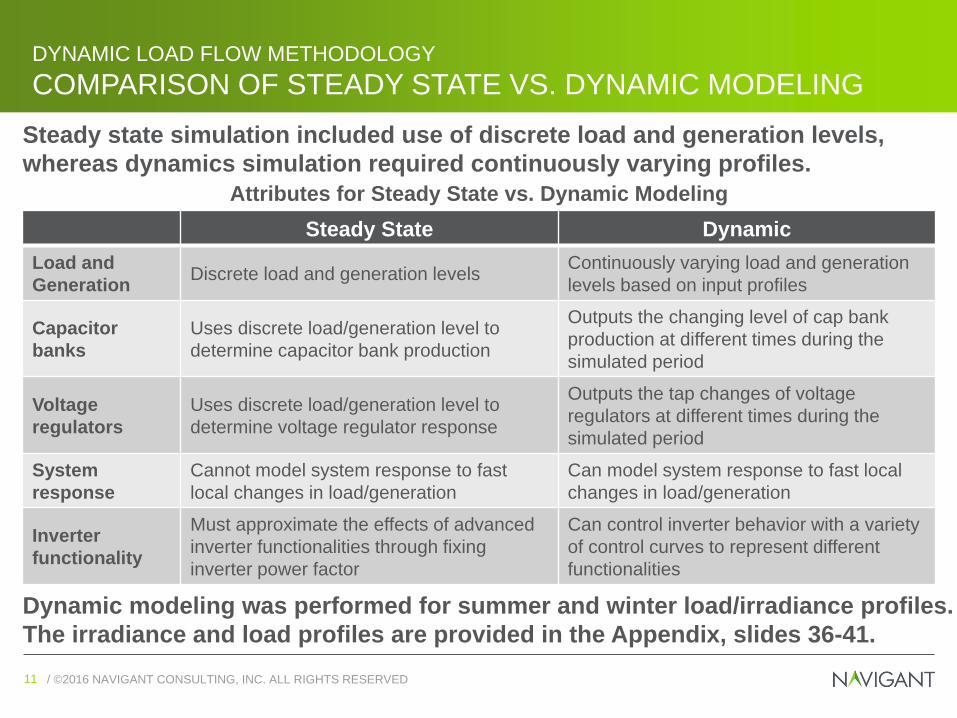
Steady state simulation included use of discrete load and generation levels,
whereas dynamics simulation required continuously varying profiles.
DYNAMIC LOAD FLOW METHODOLOGY
COMPARISON OF STEADY STATE VS. DYNAMIC MODELING
Steady State Dynamic
Load and
GenerationDiscrete load and generation levels
Continuously varying load and generation
levels based on input profiles
Capacitor
banks
Uses discrete load/generation level to
determine capacitor bank production
Outputs the changing level of cap bank
production at different times during the
simulated period
Voltage
regulators
Uses discrete load/generation level to
determine voltage regulator response
Outputs the tap changes of voltage
regulators at different times during the
simulated period
System
response
Cannot model system response to fast
local changes in load/generation
Can model system response to fast local
changes in load/generation
Inverter
functionality
Must approximate the effects of advanced
inverter functionalities through fixing
inverter power factor
Can control inverter behavior with a variety
of control curves to represent different
functionalities
Dynamic modeling was performed for summer and winter load/irradiance profiles.
The irradiance and load profiles are provided in the Appendix, slides 36-41.
Attributes for Steady State vs. Dynamic Modeling
/ ©2016 NAVIGANT CONSULTING, INC. ALL RIGHTS RESERVED12 / ©2016 NAVIGANT CONSULTING, INC. ALL RIGHTS RESERVED12
DYNAMIC LOAD FLOW METHODOLOGY
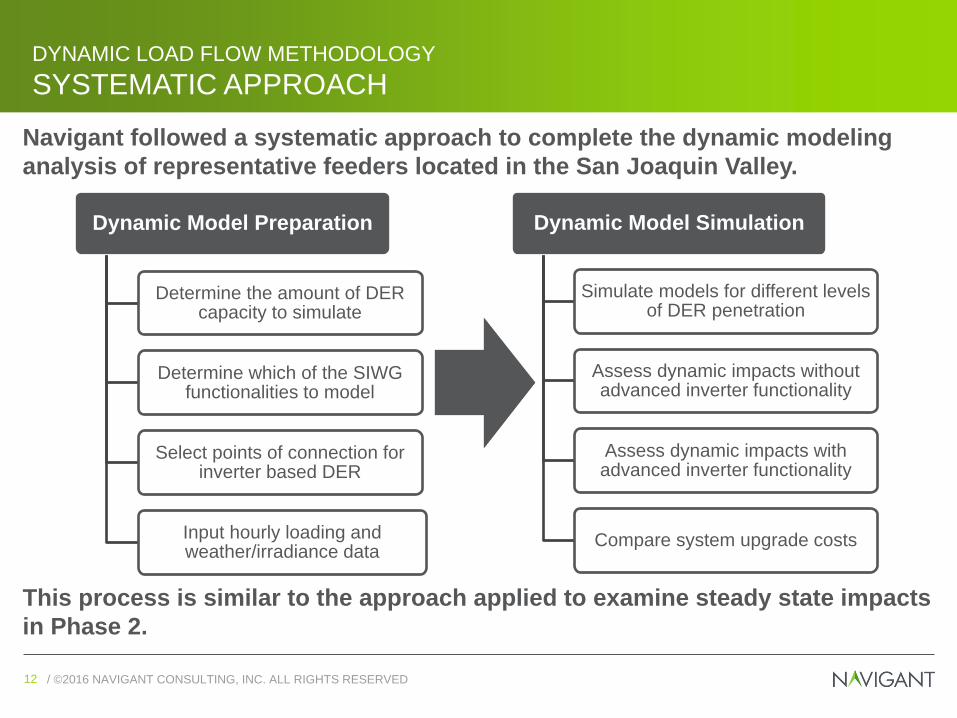
SYSTEMATIC APPROACH
Dynamic Model Preparation
Determine the amount of DER capacity to simulate
Determine which of the SIWG functionalities to model
Select points of connection for inverter based DER
Input hourly loading and weather/irradiance data
Dynamic Model Simulation
Simulate models for different levels of DER penetration
Assess dynamic impacts without advanced inverter functionality
Assess dynamic impacts with advanced inverter functionality
Compare system upgrade costs
Navigant followed a systematic approach to complete the dynamic modeling
analysis of representative feeders located in the San Joaquin Valley.
This process is similar to the approach applied to examine steady state impacts
in Phase 2.
/ ©2016 NAVIGANT CONSULTING, INC. ALL RIGHTS RESERVED13 / ©2016 NAVIGANT CONSULTING, INC. ALL RIGHTS RESERVED13
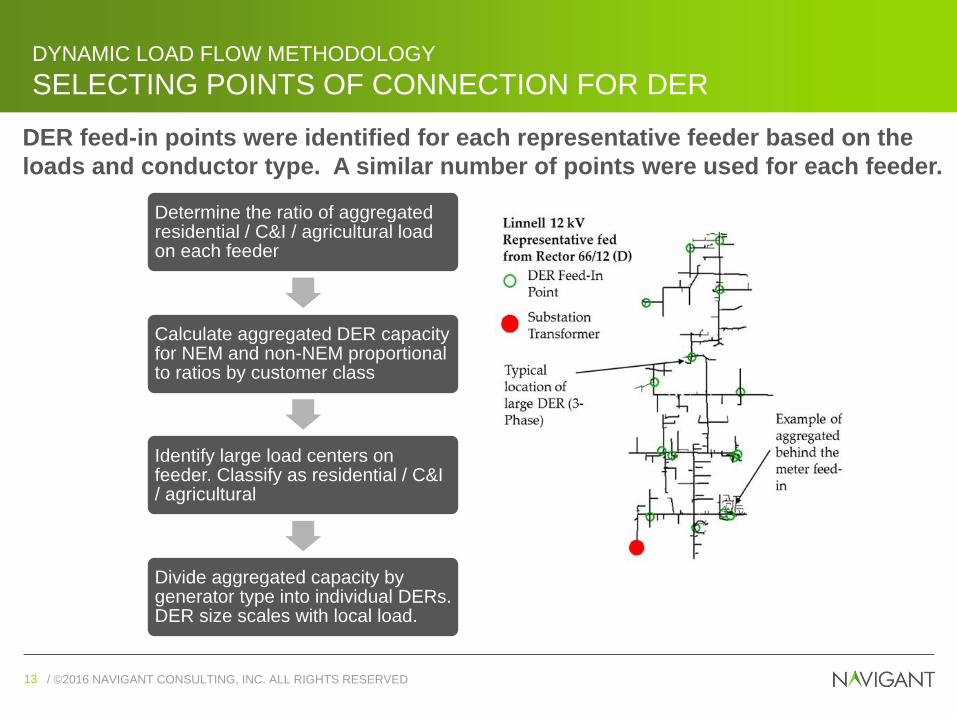
Determine the ratio of aggregated residential / C&I / agricultural load on each feeder
Calculate aggregated DER capacity for NEM and non-NEM proportional to ratios by customer class
Identify large load centers on feeder. Classify as residential / C&I / agricultural
Divide aggregated capacity by generator type into individual DERs. DER size scales with local load.
DYNAMIC LOAD FLOW METHODOLOGY
SELECTING POINTS OF CONNECTION FOR DER
DER feed-in points were identified for each representative feeder based on the
loads and conductor type. A similar number of points were used for each feeder.
/ ©2016 NAVIGANT CONSULTING, INC. ALL RIGHTS RESERVED14 / ©2016 NAVIGANT CONSULTING, INC. ALL RIGHTS RESERVED14
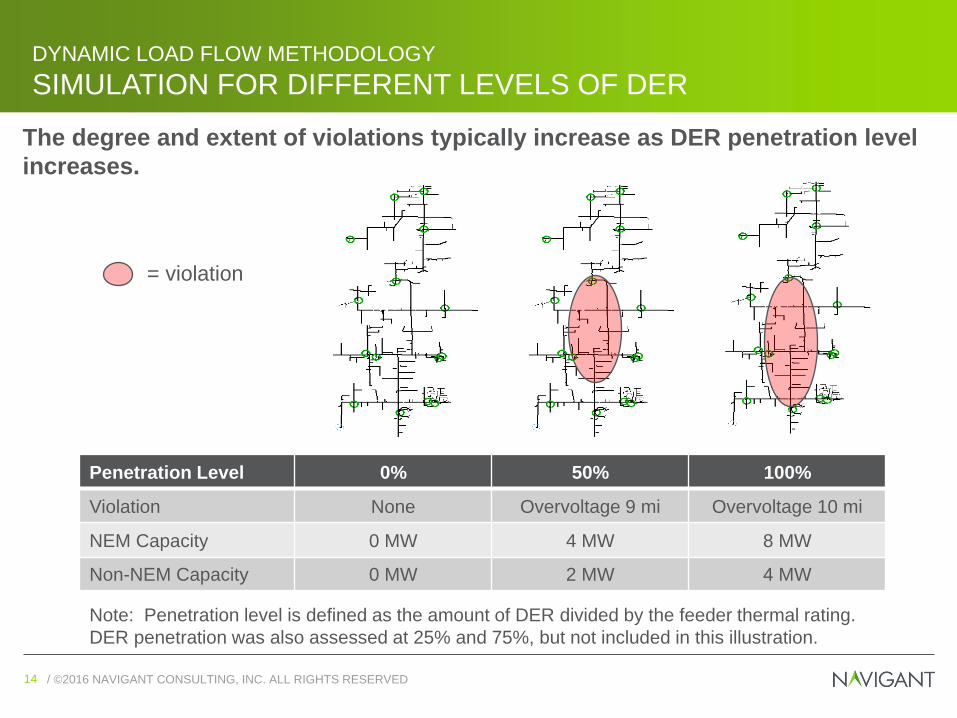
= violation
Penetration Level 0% 50% 100%
Violation None Overvoltage 9 mi Overvoltage 10 mi
NEM Capacity 0 MW 4 MW 8 MW
Non-NEM Capacity 0 MW 2 MW 4 MW
DYNAMIC LOAD FLOW METHODOLOGY
SIMULATION FOR DIFFERENT LEVELS OF DER
Note: Penetration level is defined as the amount of DER divided by the feeder thermal rating.
DER penetration was also assessed at 25% and 75%, but not included in this illustration.
The degree and extent of violations typically increase as DER penetration level
increases.
/ ©2016 NAVIGANT CONSULTING, INC. ALL RIGHTS RESERVED15 / ©2016 NAVIGANT CONSULTING, INC. ALL RIGHTS RESERVED15
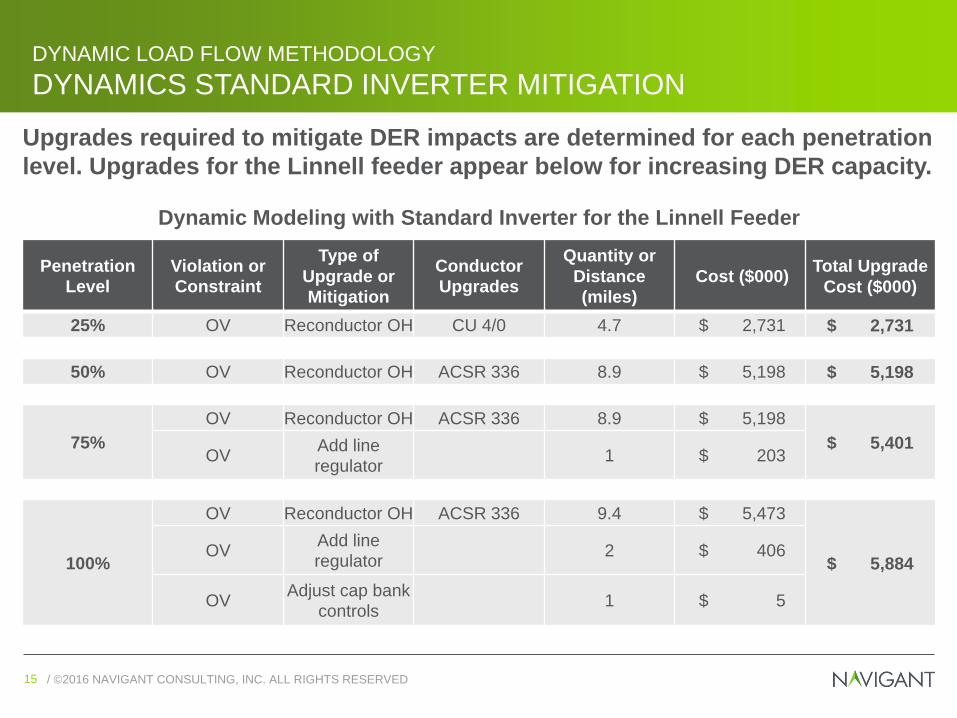
Penetration
Level
Violation or
Constraint
Type of
Upgrade or
Mitigation
Conductor
Upgrades
Quantity or
Distance
(miles)
Cost ($000) Total Upgrade
Cost ($000)
25% OV Reconductor OH CU 4/0 4.7 $ 2,731 $ 2,731
50% OV Reconductor OH ACSR 336 8.9 $ 5,198 $ 5,198
75%
OV Reconductor OH ACSR 336 8.9 $ 5,198
$ 5,401OV
Add line
regulator1 $ 203
100%
OV Reconductor OH ACSR 336 9.4 $ 5,473
$ 5,884OV
Add line
regulator2 $ 406
OVAdjust cap bank
controls1 $ 5
DYNAMIC LOAD FLOW METHODOLOGY
DYNAMICS STANDARD INVERTER MITIGATION
Upgrades required to mitigate DER impacts are determined for each penetration
level. Upgrades for the Linnell feeder appear below for increasing DER capacity.
Dynamic Modeling with Standard Inverter for the Linnell Feeder
/ ©2016 NAVIGANT CONSULTING, INC. ALL RIGHTS RESERVED16 / ©2016 NAVIGANT CONSULTING, INC. ALL RIGHTS RESERVED16
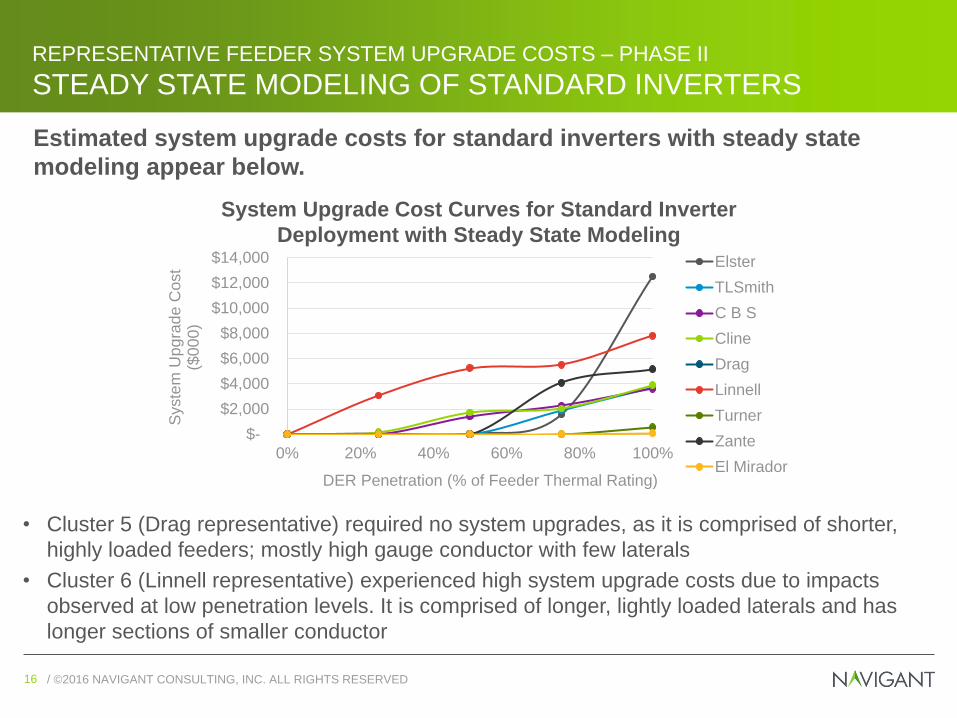
• Cluster 5 (Drag representative) required no system upgrades, as it is comprised of shorter,
highly loaded feeders; mostly high gauge conductor with few laterals
• Cluster 6 (Linnell representative) experienced high system upgrade costs due to impacts
observed at low penetration levels. It is comprised of longer, lightly loaded laterals and has
longer sections of smaller conductor
REPRESENTATIVE FEEDER SYSTEM UPGRADE COSTS – PHASE II
STEADY STATE MODELING OF STANDARD INVERTERS
Estimated system upgrade costs for standard inverters with steady state
modeling appear below.
System Upgrade Cost Curves for Standard Inverter
Deployment with Steady State Modeling
$-
$2,000
$4,000
$6,000
$8,000
$10,000
$12,000
$14,000
0% 20% 40% 60% 80% 100%
Syste
m U
pgra
de C
ost
($000)
DER Penetration (% of Feeder Thermal Rating)
Elster
TLSmith
C B S
Cline
Drag
Linnell
Turner
Zante
El Mirador
/ ©2016 NAVIGANT CONSULTING, INC. ALL RIGHTS RESERVED17 / ©2016 NAVIGANT CONSULTING, INC. ALL RIGHTS RESERVED17
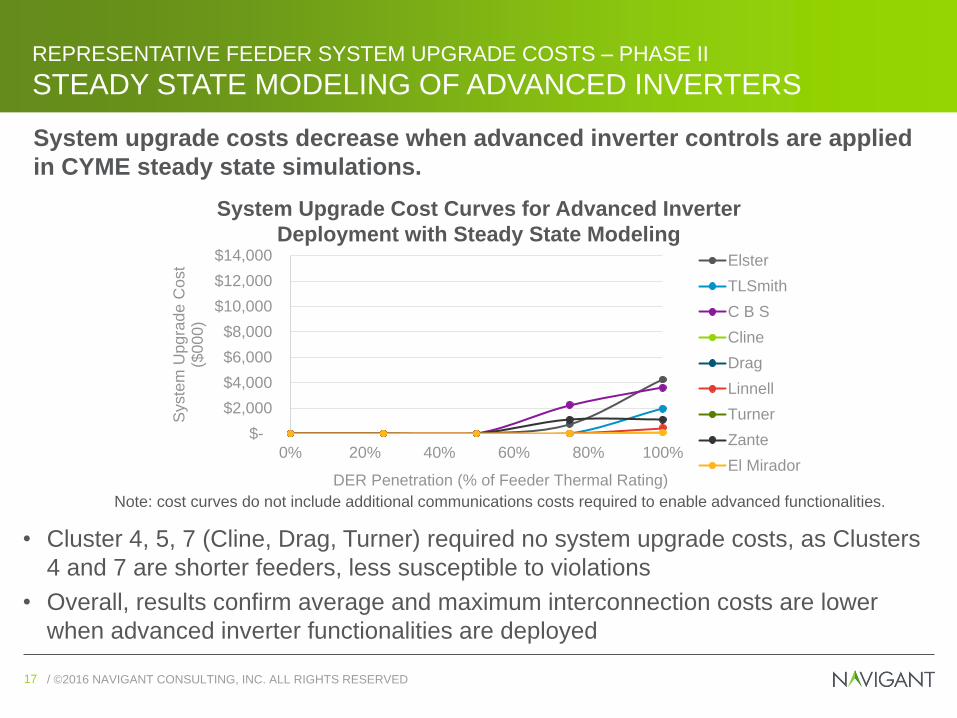
• Cluster 4, 5, 7 (Cline, Drag, Turner) required no system upgrade costs, as Clusters
4 and 7 are shorter feeders, less susceptible to violations
• Overall, results confirm average and maximum interconnection costs are lower
when advanced inverter functionalities are deployed
System Upgrade Cost Curves for Advanced Inverter
Deployment with Steady State Modeling
System upgrade costs decrease when advanced inverter controls are applied
in CYME steady state simulations.
REPRESENTATIVE FEEDER SYSTEM UPGRADE COSTS – PHASE II
STEADY STATE MODELING OF ADVANCED INVERTERS
$-
$2,000
$4,000
$6,000
$8,000
$10,000
$12,000
$14,000
0% 20% 40% 60% 80% 100%
Syste
m U
pgra
de C
ost
($000)
DER Penetration (% of Feeder Thermal Rating)
Elster
TLSmith
C B S
Cline
Drag
Linnell
Turner
Zante
El Mirador
Note: cost curves do not include additional communications costs required to enable advanced functionalities.
/ ©2016 NAVIGANT CONSULTING, INC. ALL RIGHTS RESERVED18 / ©2016 NAVIGANT CONSULTING, INC. ALL RIGHTS RESERVED18
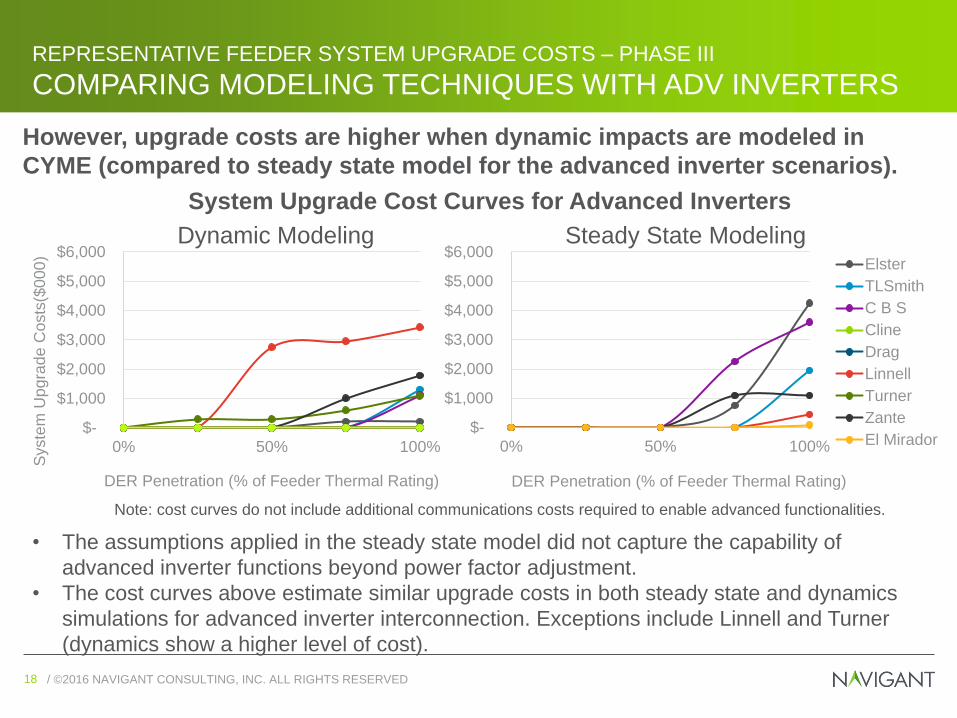
However, upgrade costs are higher when dynamic impacts are modeled in
CYME (compared to steady state model for the advanced inverter scenarios).
REPRESENTATIVE FEEDER SYSTEM UPGRADE COSTS – PHASE III
COMPARING MODELING TECHNIQUES WITH ADV INVERTERS
• The assumptions applied in the steady state model did not capture the capability of
advanced inverter functions beyond power factor adjustment.
• The cost curves above estimate similar upgrade costs in both steady state and dynamics
simulations for advanced inverter interconnection. Exceptions include Linnell and Turner
(dynamics show a higher level of cost).
$-
$1,000
$2,000
$3,000
$4,000
$5,000
$6,000
0% 50% 100%
DER Penetration (% of Feeder Thermal Rating)
Elster
TLSmith
C B S
Cline
Drag
Linnell
Turner
Zante
El Mirador $-
$1,000
$2,000
$3,000
$4,000
$5,000
$6,000
0% 50% 100%
Syste
m U
pgra
de C
osts
($000)
DER Penetration (% of Feeder Thermal Rating)
System Upgrade Cost Curves for Advanced Inverters
Dynamic Modeling Steady State Modeling
Note: cost curves do not include additional communications costs required to enable advanced functionalities.
/ ©2016 NAVIGANT CONSULTING, INC. ALL RIGHTS RESERVED19 / ©2016 NAVIGANT CONSULTING, INC. ALL RIGHTS RESERVED19
$-
$1,000
$2,000
$3,000
$4,000
$5,000
$6,000
0% 50% 100%
Syste
m U
pgra
de C
ost
($000)
DER Penetration (% of Feeder Thermal Rating)
$-
$1,000
$2,000
$3,000
$4,000
$5,000
$6,000
0% 50% 100%
DER Penetration (% of Feeder Thermal Rating)
Elster
TLSmith
CBS
Cline
Drag
Linnell
Turner
Zante
El Mirador
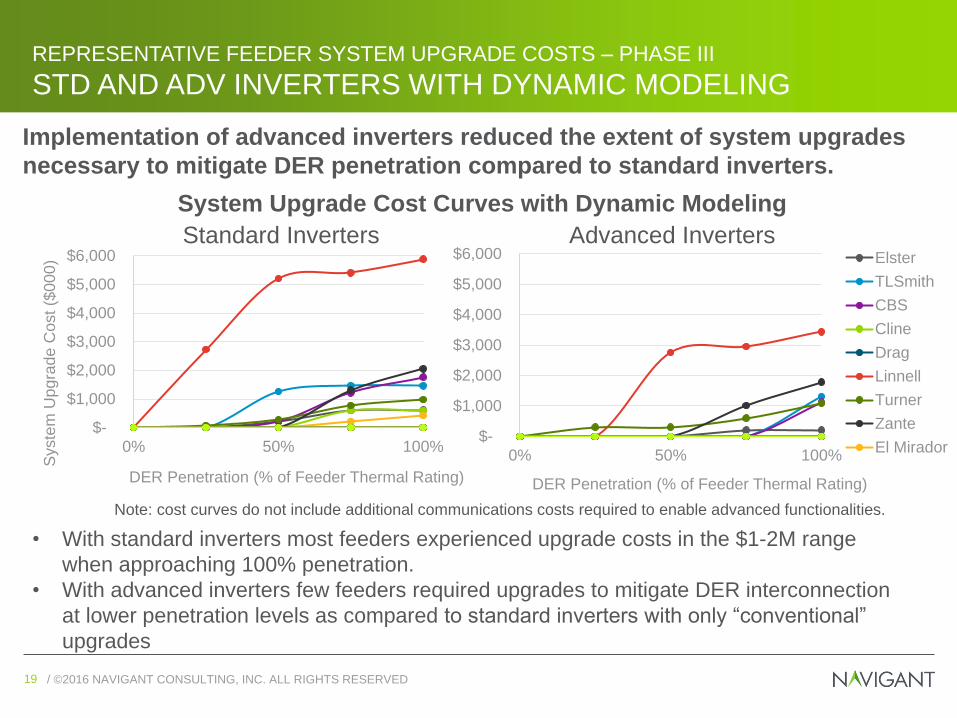
Implementation of advanced inverters reduced the extent of system upgrades
necessary to mitigate DER penetration compared to standard inverters.
REPRESENTATIVE FEEDER SYSTEM UPGRADE COSTS – PHASE III
STD AND ADV INVERTERS WITH DYNAMIC MODELING
• With standard inverters most feeders experienced upgrade costs in the $1-2M range
when approaching 100% penetration.
• With advanced inverters few feeders required upgrades to mitigate DER interconnection
at lower penetration levels as compared to standard inverters with only “conventional”
upgrades
System Upgrade Cost Curves with Dynamic Modeling
Standard Inverters Advanced Inverters
Note: cost curves do not include additional communications costs required to enable advanced functionalities.
/ ©2016 NAVIGANT CONSULTING, INC. ALL RIGHTS RESERVED20 / ©2016 NAVIGANT CONSULTING, INC. ALL RIGHTS RESERVED20
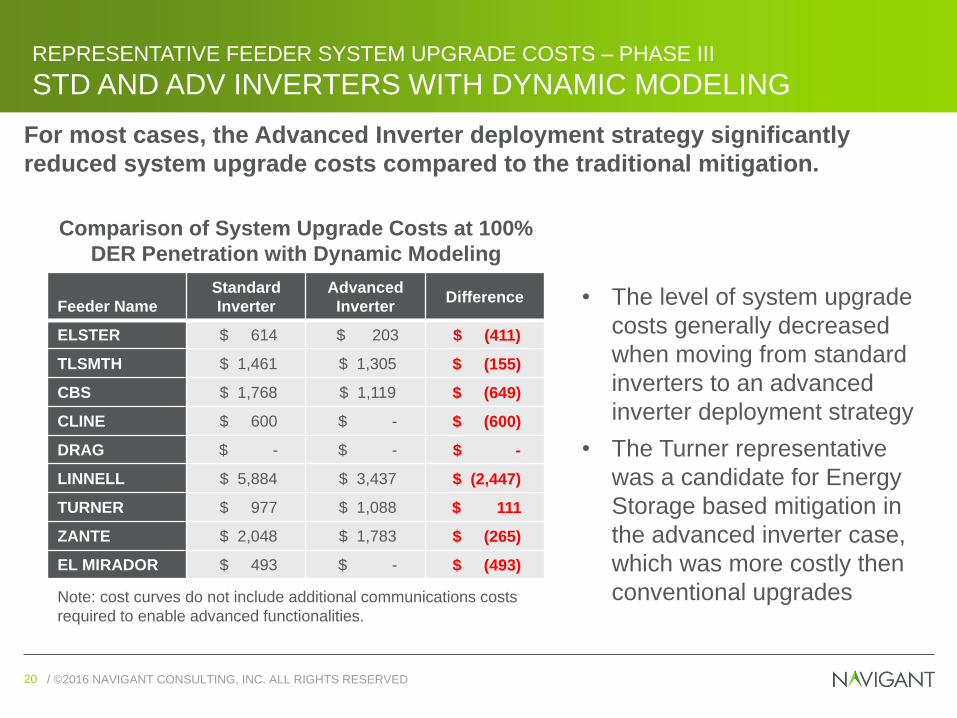
For most cases, the Advanced Inverter deployment strategy significantly
reduced system upgrade costs compared to the traditional mitigation.
REPRESENTATIVE FEEDER SYSTEM UPGRADE COSTS – PHASE III
STD AND ADV INVERTERS WITH DYNAMIC MODELING
Feeder Name
Standard
Inverter
Advanced
InverterDifference
ELSTER $ 614 $ 203 $ (411)
TLSMTH $ 1,461 $ 1,305 $ (155)
CBS $ 1,768 $ 1,119 $ (649)
CLINE $ 600 $ - $ (600)
DRAG $ - $ - $ -
LINNELL $ 5,884 $ 3,437 $ (2,447)
TURNER $ 977 $ 1,088 $ 111
ZANTE $ 2,048 $ 1,783 $ (265)
EL MIRADOR $ 493 $ - $ (493)
• The level of system upgrade
costs generally decreased
when moving from standard
inverters to an advanced
inverter deployment strategy
• The Turner representative
was a candidate for Energy
Storage based mitigation in
the advanced inverter case,
which was more costly then
conventional upgrades
Comparison of System Upgrade Costs at 100%
DER Penetration with Dynamic Modeling
Note: cost curves do not include additional communications costs
required to enable advanced functionalities.
/ ©2016 NAVIGANT CONSULTING, INC. ALL RIGHTS RESERVED21 / ©2016 NAVIGANT CONSULTING, INC. ALL RIGHTS RESERVED21
PROTECTION SCREENING
EVALUATION OF PROTECTION LIMITS
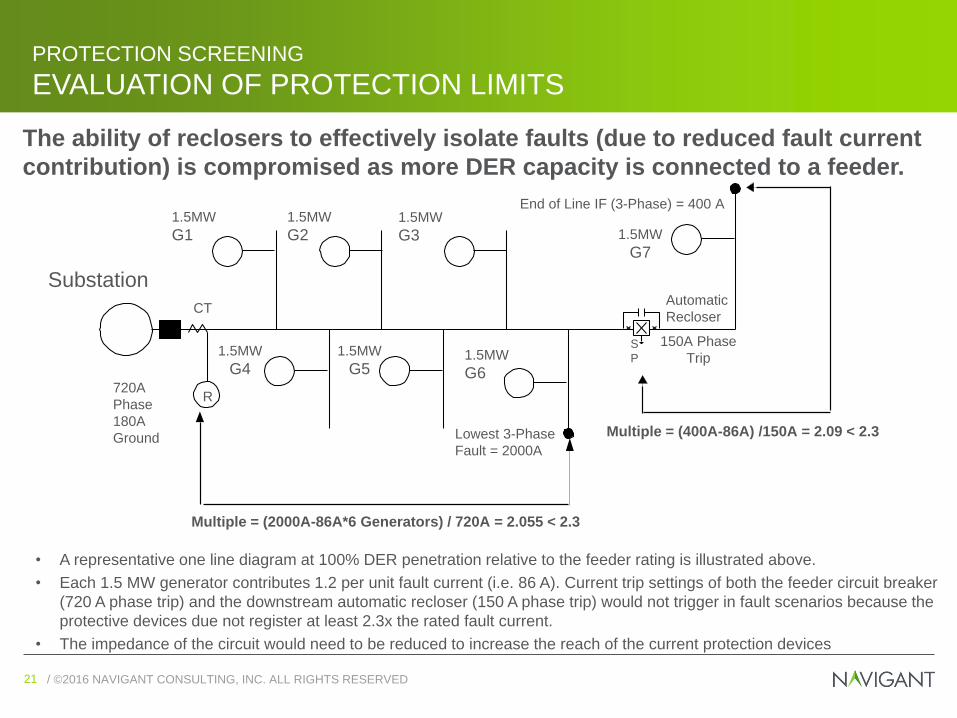
• A representative one line diagram at 100% DER penetration relative to the feeder rating is illustrated above.
• Each 1.5 MW generator contributes 1.2 per unit fault current (i.e. 86 A). Current trip settings of both the feeder circuit breaker
(720 A phase trip) and the downstream automatic recloser (150 A phase trip) would not trigger in fault scenarios because the
protective devices due not register at least 2.3x the rated fault current.
• The impedance of the circuit would need to be reduced to increase the reach of the current protection devices
The ability of reclosers to effectively isolate faults (due to reduced fault current
contribution) is compromised as more DER capacity is connected to a feeder.
1.5MW
G11.5MW
G21.5MW
G3 1.5MW
G7
Automatic
RecloserCT
Substation
S
P1.5MW
G41.5MW
G51.5MW
G6
150A Phase
Trip
Multiple = (2000A-86A*6 Generators) / 720A = 2.055 < 2.3
720A
Phase
180A
Ground
R
Multiple = (400A-86A) /150A = 2.09 < 2.3
End of Line IF (3-Phase) = 400 A
Lowest 3-Phase
Fault = 2000A
/ ©2016 NAVIGANT CONSULTING, INC. ALL RIGHTS RESERVED22 / ©2016 NAVIGANT CONSULTING, INC. ALL RIGHTS RESERVED22
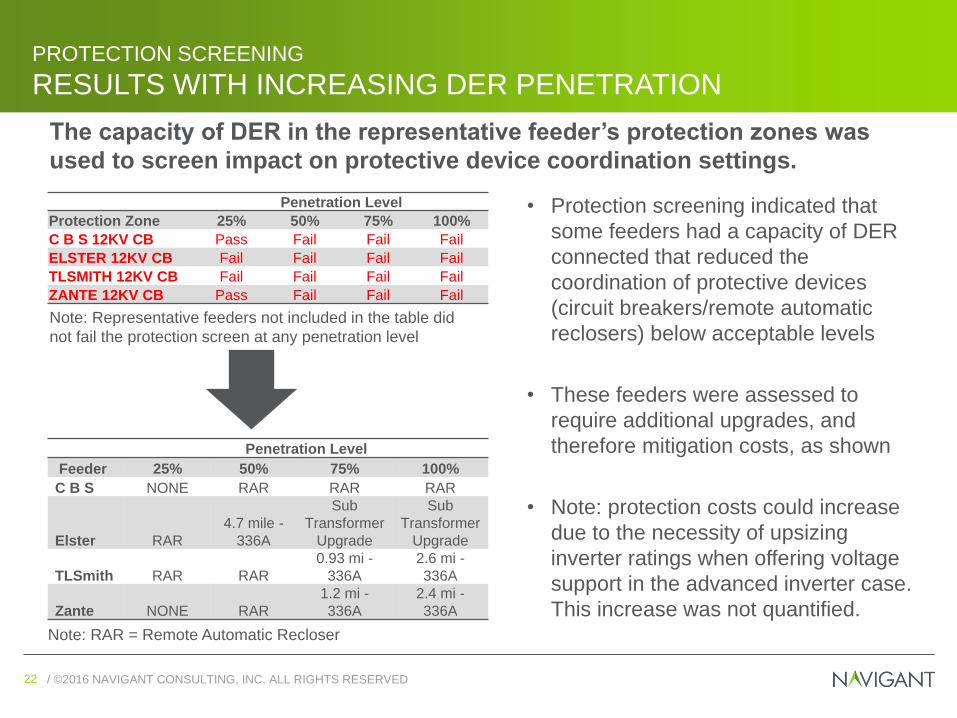
• Protection screening indicated that
some feeders had a capacity of DER
connected that reduced the
coordination of protective devices
(circuit breakers/remote automatic
reclosers) below acceptable levels
• These feeders were assessed to
require additional upgrades, and
therefore mitigation costs, as shown
• Note: protection costs could increase
due to the necessity of upsizing
inverter ratings when offering voltage
support in the advanced inverter case.
This increase was not quantified.
PROTECTION SCREENING
RESULTS WITH INCREASING DER PENETRATION
Penetration Level
Protection Zone 25% 50% 75% 100%
C B S 12KV CB Pass Fail Fail Fail
ELSTER 12KV CB Fail Fail Fail Fail
TLSMITH 12KV CB Fail Fail Fail Fail
ZANTE 12KV CB Pass Fail Fail Fail
Penetration Level
Feeder 25% 50% 75% 100%
C B S NONE RAR RAR RAR
Elster RAR
4.7 mile -
336A
Sub
Transformer
Upgrade
Sub
Transformer
Upgrade
TLSmith RAR RAR
0.93 mi -
336A
2.6 mi -
336A
Zante NONE RAR
1.2 mi -
336A
2.4 mi -
336A
Note: Representative feeders not included in the table did
not fail the protection screen at any penetration level
The capacity of DER in the representative feeder’s protection zones was
used to screen impact on protective device coordination settings.
Note: RAR = Remote Automatic Recloser
/ ©2016 NAVIGANT CONSULTING, INC. ALL RIGHTS RESERVED23 / ©2016 NAVIGANT CONSULTING, INC. ALL RIGHTS RESERVED23
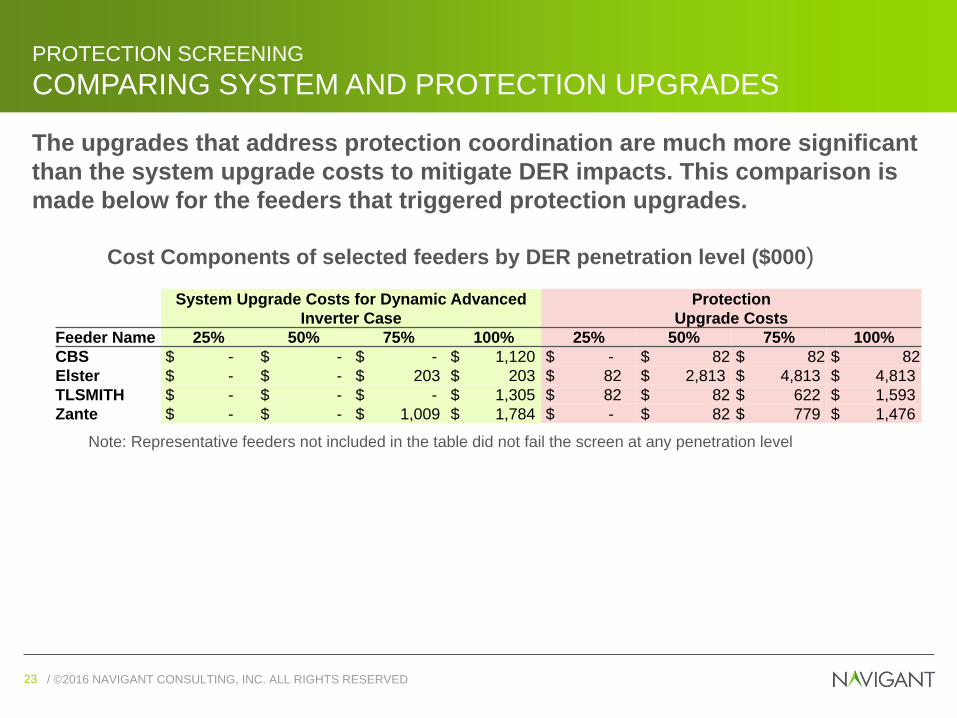
The upgrades that address protection coordination are much more significant
than the system upgrade costs to mitigate DER impacts. This comparison is
made below for the feeders that triggered protection upgrades.
PROTECTION SCREENING
COMPARING SYSTEM AND PROTECTION UPGRADES
Cost Components of selected feeders by DER penetration level ($000)
System Upgrade Costs for Dynamic Advanced
Inverter Case
Protection
Upgrade Costs
Feeder Name 25% 50% 75% 100% 25% 50% 75% 100%
CBS $ - $ - $ - $ 1,120 $ - $ 82 $ 82 $ 82
Elster $ - $ - $ 203 $ 203 $ 82 $ 2,813 $ 4,813 $ 4,813
TLSMITH $ - $ - $ - $ 1,305 $ 82 $ 82 $ 622 $ 1,593
Zante $ - $ - $ 1,009 $ 1,784 $ - $ 82 $ 779 $ 1,476
Note: Representative feeders not included in the table did not fail the screen at any penetration level
/ ©2016 NAVIGANT CONSULTING, INC. ALL RIGHTS RESERVED24 / ©2016 NAVIGANT CONSULTING, INC. ALL RIGHTS RESERVED24
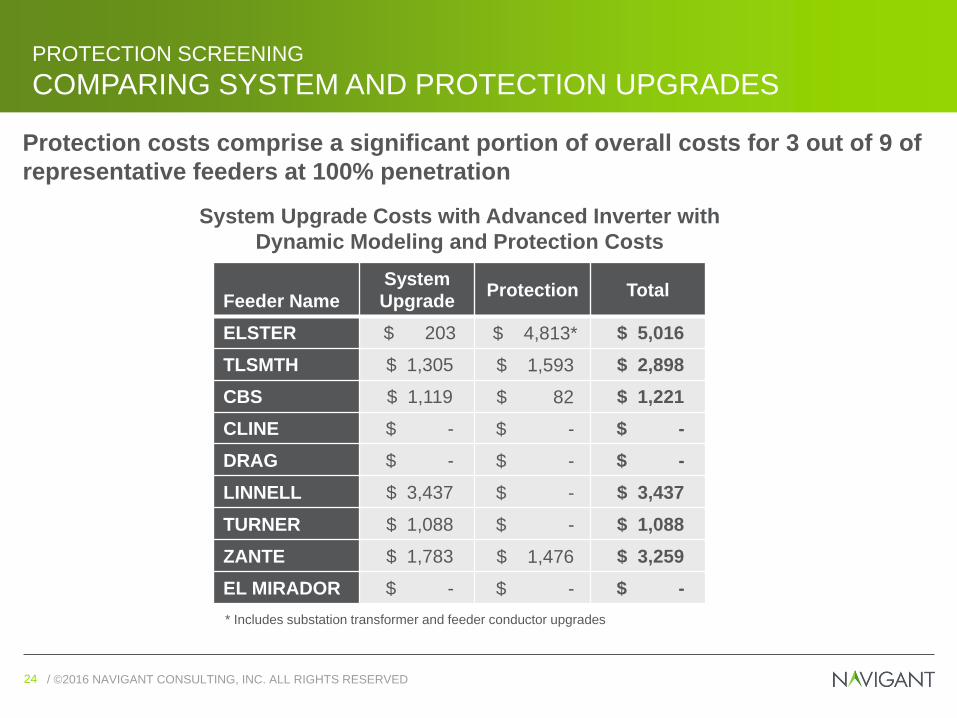
Protection costs comprise a significant portion of overall costs for 3 out of 9 of
representative feeders at 100% penetration
PROTECTION SCREENING
COMPARING SYSTEM AND PROTECTION UPGRADES
Feeder Name
System
UpgradeProtection Total
ELSTER $ 203 $ 4,813* $ 5,016
TLSMTH $ 1,305 $ 1,593 $ 2,898
CBS $ 1,119 $ 82 $ 1,221
CLINE $ - $ - $ -
DRAG $ - $ - $ -
LINNELL $ 3,437 $ - $ 3,437
TURNER $ 1,088 $ - $ 1,088
ZANTE $ 1,783 $ 1,476 $ 3,259
EL MIRADOR $ - $ - $ -
System Upgrade Costs with Advanced Inverter with
Dynamic Modeling and Protection Costs
* Includes substation transformer and feeder conductor upgrades
/ ©2016 NAVIGANT CONSULTING, INC. ALL RIGHTS RESERVED25 / ©2016 NAVIGANT CONSULTING, INC. ALL RIGHTS RESERVED25
• Incremental system level communication and control costs necessary to enable
advanced inverters are being evaluated.
• Upon completion, the additional allocated cost of communication infrastructure will
be associated with the advanced inverter mitigation strategy cost curves.
COMMUNICATION AND CONTROL
COST ESTIMATE
System level communications investments beyond the current SCE strategy is
required to enable widespread operation of the studied functionalities.
/ ©2016 NAVIGANT CONSULTING, INC. ALL RIGHTS RESERVED26 / ©2016 NAVIGANT CONSULTING, INC. ALL RIGHTS RESERVED26
• Energy storage as a mitigation option was implemented on a test feeder.
• A representative feeder was selected that experienced voltage violations that could
not easily be mitigated with voltage regulation devices as well as overloading due to
DER interconnection.
• The Turner representative feeder exhibited these properties – the majority of the
feeder is underground cable and line voltage regulators were ineffective in reducing
overvoltage conditions. Overloading was also present at points of the circuit where
the predominant conductor size was ACSR#4.
ENERGY STORAGE EVALUATION
DESCRIPTION
Energy Storage was evaluated with dynamics simulation as a potential
mitigation option when paired with advanced inverters.
/ ©2016 NAVIGANT CONSULTING, INC. ALL RIGHTS RESERVED27 / ©2016 NAVIGANT CONSULTING, INC. ALL RIGHTS RESERVED27
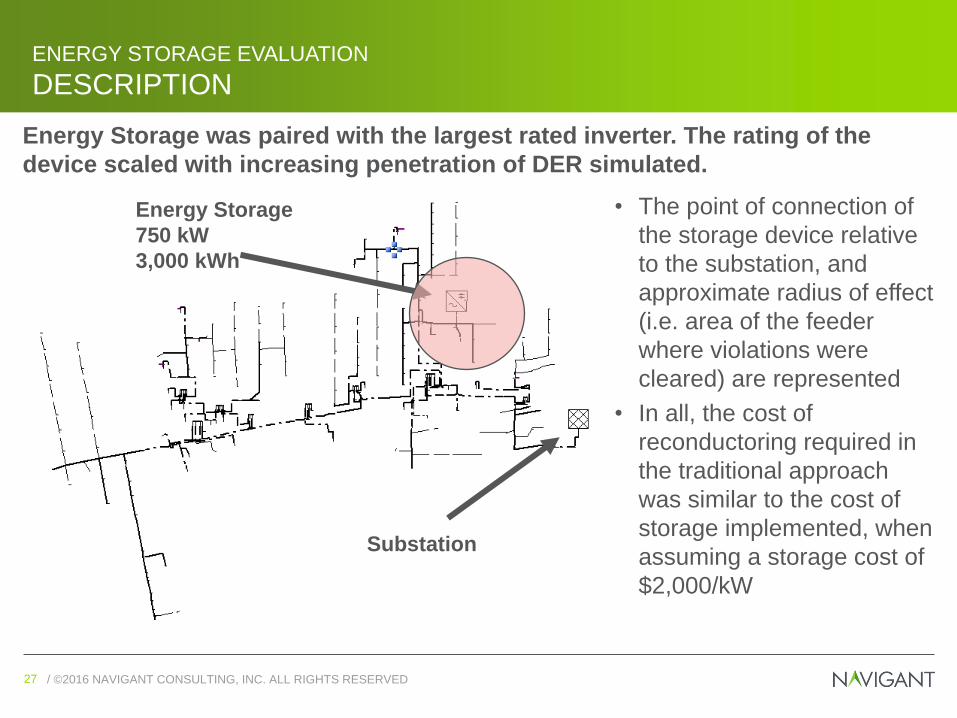
• The point of connection of
the storage device relative
to the substation, and
approximate radius of effect
(i.e. area of the feeder
where violations were
cleared) are represented
• In all, the cost of
reconductoring required in
the traditional approach
was similar to the cost of
storage implemented, when
assuming a storage cost of
$2,000/kW
Energy Storage
750 kW
3,000 kWh
Substation
ENERGY STORAGE EVALUATION
DESCRIPTION
Energy Storage was paired with the largest rated inverter. The rating of the
device scaled with increasing penetration of DER simulated.
/ ©2016 NAVIGANT CONSULTING, INC. ALL RIGHTS RESERVED28 / ©2016 NAVIGANT CONSULTING, INC. ALL RIGHTS RESERVED28
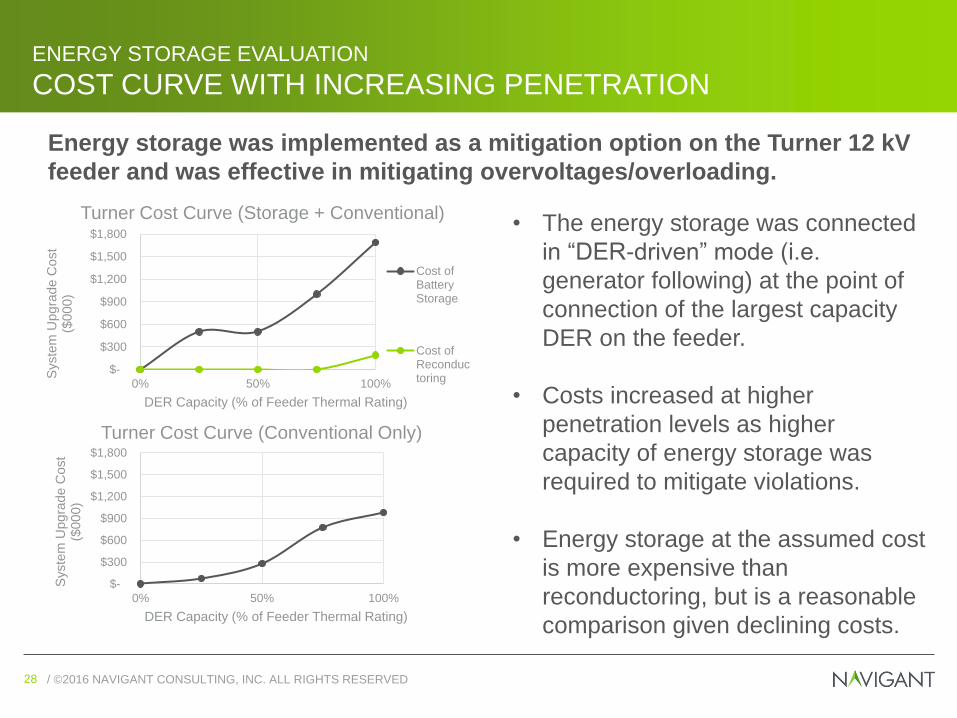
Energy storage was implemented as a mitigation option on the Turner 12 kV
feeder and was effective in mitigating overvoltages/overloading.
ENERGY STORAGE EVALUATION
COST CURVE WITH INCREASING PENETRATION
$-
$300
$600
$900
$1,200
$1,500
$1,800
0% 50% 100%
Syste
m U
pg
rad
e C
ost
($0
00
)
DER Capacity (% of Feeder Thermal Rating)
• The energy storage was connected
in “DER-driven” mode (i.e.
generator following) at the point of
connection of the largest capacity
DER on the feeder.
• Costs increased at higher
penetration levels as higher
capacity of energy storage was
required to mitigate violations.
• Energy storage at the assumed cost
is more expensive than
reconductoring, but is a reasonable
comparison given declining costs.
$-
$300
$600
$900
$1,200
$1,500
$1,800
0% 50% 100%
Syste
m U
pg
rad
e C
ost
($0
00
)
DER Capacity (% of Feeder Thermal Rating)
Cost ofBatteryStorage
Cost ofReconductoring
Turner Cost Curve (Storage + Conventional)
Turner Cost Curve (Conventional Only)
/ ©2016 NAVIGANT CONSULTING, INC. ALL RIGHTS RESERVED29 / ©2016 NAVIGANT CONSULTING, INC. ALL RIGHTS RESERVED29
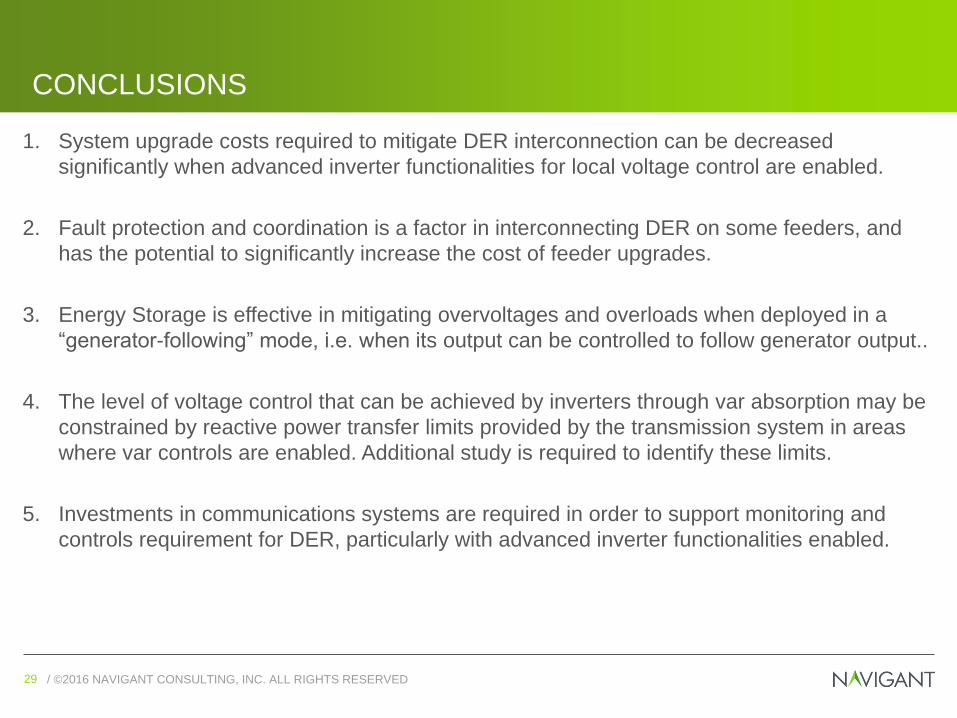
1. System upgrade costs required to mitigate DER interconnection can be decreased
significantly when advanced inverter functionalities for local voltage control are enabled.
2. Fault protection and coordination is a factor in interconnecting DER on some feeders, and
has the potential to significantly increase the cost of feeder upgrades.
3. Energy Storage is effective in mitigating overvoltages and overloads when deployed in a
“generator-following” mode, i.e. when its output can be controlled to follow generator output..
4. The level of voltage control that can be achieved by inverters through var absorption may be
constrained by reactive power transfer limits provided by the transmission system in areas
where var controls are enabled. Additional study is required to identify these limits.
5. Investments in communications systems are required in order to support monitoring and
controls requirement for DER, particularly with advanced inverter functionalities enabled.
CONCLUSIONS
/ ©2016 NAVIGANT CONSULTING, INC. ALL RIGHTS RESERVED30 / ©2016 NAVIGANT CONSULTING, INC. ALL RIGHTS RESERVED30
• Workshop
• Final report
NEXT STEPS
/ ©2016 NAVIGANT CONSULTING, INC. ALL RIGHTS RESERVED31
GENE SHLATZDirector
802.233.1890
FRANCES CLEVELANDXanthus Consulting
831.338.3175
STEVEN TOBIASAssociate Director
781.270.8438
MICHAEL DE PAOLISConsultant
416.777.2455
navigant.com
CONTACTS
/ ©2016 NAVIGANT CONSULTING, INC. ALL RIGHTS RESERVED32 / ©2016 NAVIGANT CONSULTING, INC. ALL RIGHTS RESERVED32
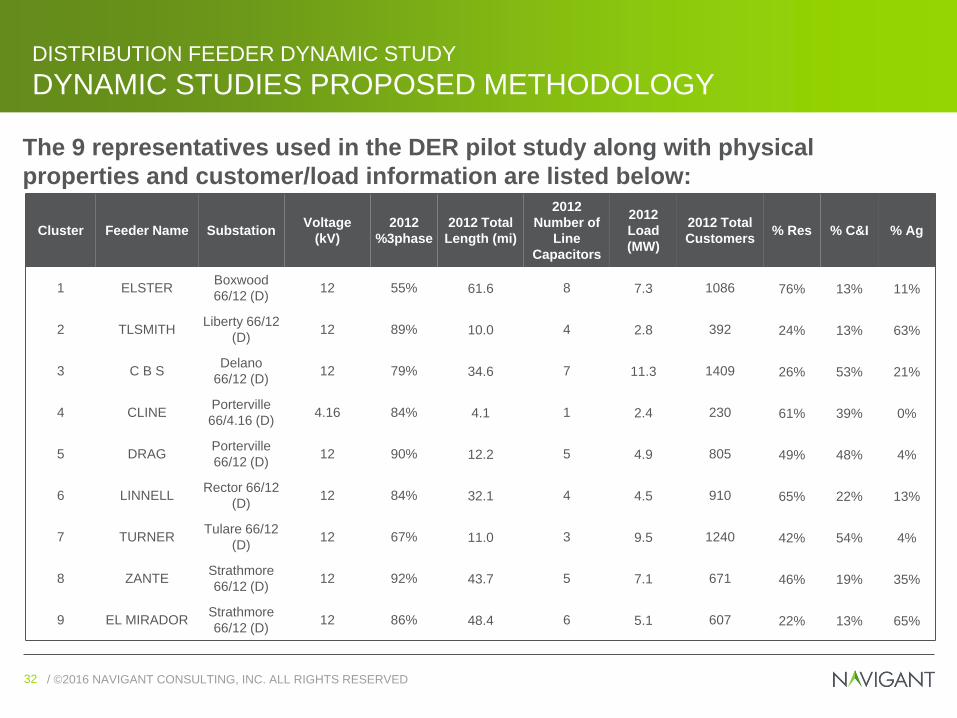
The 9 representatives used in the DER pilot study along with physical
properties and customer/load information are listed below:
DISTRIBUTION FEEDER DYNAMIC STUDY
DYNAMIC STUDIES PROPOSED METHODOLOGY
Cluster Feeder Name SubstationVoltage
(kV)
2012
%3phase
2012 Total
Length (mi)
2012
Number of
Line
Capacitors
2012
Load
(MW)
2012 Total
Customers% Res % C&I % Ag
1 ELSTERBoxwood
66/12 (D)12 55% 61.6 8 7.3 1086 76% 13% 11%
2 TLSMITHLiberty 66/12
(D)12 89% 10.0 4 2.8 392 24% 13% 63%
3 C B SDelano
66/12 (D)12 79% 34.6 7 11.3 1409 26% 53% 21%
4 CLINEPorterville
66/4.16 (D)4.16 84% 4.1 1 2.4 230 61% 39% 0%
5 DRAGPorterville
66/12 (D)12 90% 12.2 5 4.9 805 49% 48% 4%
6 LINNELLRector 66/12
(D)12 84% 32.1 4 4.5 910 65% 22% 13%
7 TURNERTulare 66/12
(D)12 67% 11.0 3 9.5 1240 42% 54% 4%
8 ZANTEStrathmore
66/12 (D)12 92% 43.7 5 7.1 671 46% 19% 35%
9 EL MIRADORStrathmore
66/12 (D)12 86% 48.4 6 5.1 607 22% 13% 65%
/ ©2016 NAVIGANT CONSULTING, INC. ALL RIGHTS RESERVED33 / ©2016 NAVIGANT CONSULTING, INC. ALL RIGHTS RESERVED33
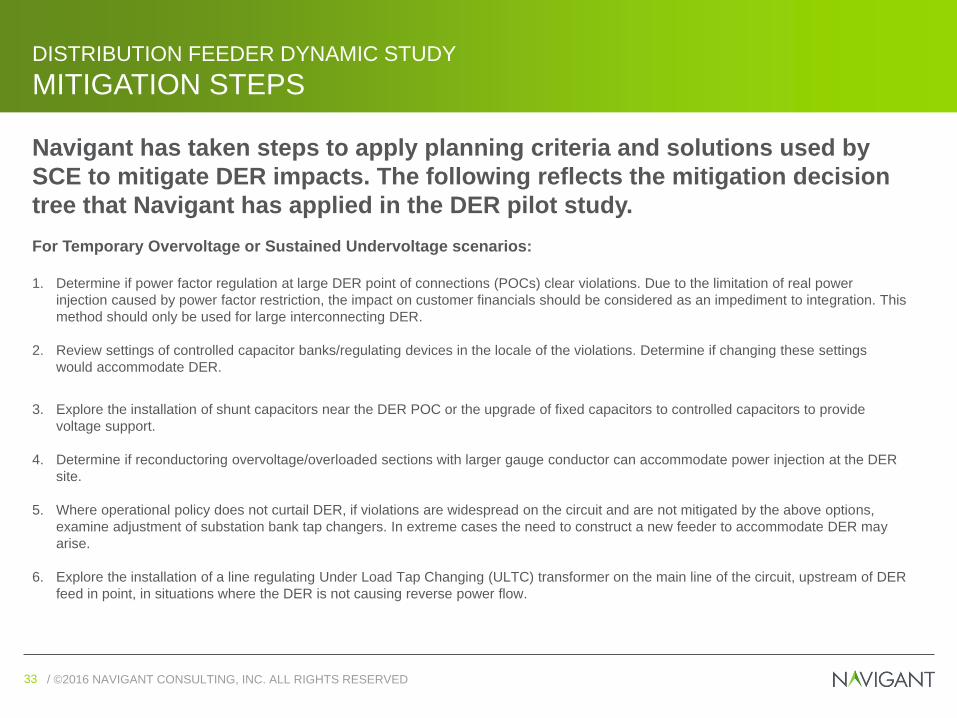
DISTRIBUTION FEEDER DYNAMIC STUDY
MITIGATION STEPS
Navigant has taken steps to apply planning criteria and solutions used by
SCE to mitigate DER impacts. The following reflects the mitigation decision
tree that Navigant has applied in the DER pilot study.
For Temporary Overvoltage or Sustained Undervoltage scenarios:
1. Determine if power factor regulation at large DER point of connections (POCs) clear violations. Due to the limitation of real power
injection caused by power factor restriction, the impact on customer financials should be considered as an impediment to integration. This
method should only be used for large interconnecting DER.
2. Review settings of controlled capacitor banks/regulating devices in the locale of the violations. Determine if changing these settings
would accommodate DER.
3. Explore the installation of shunt capacitors near the DER POC or the upgrade of fixed capacitors to controlled capacitors to provide
voltage support.
4. Determine if reconductoring overvoltage/overloaded sections with larger gauge conductor can accommodate power injection at the DER
site.
5. Where operational policy does not curtail DER, if violations are widespread on the circuit and are not mitigated by the above options,
examine adjustment of substation bank tap changers. In extreme cases the need to construct a new feeder to accommodate DER may
arise.
6. Explore the installation of a line regulating Under Load Tap Changing (ULTC) transformer on the main line of the circuit, upstream of DER
feed in point, in situations where the DER is not causing reverse power flow.
/ ©2016 NAVIGANT CONSULTING, INC. ALL RIGHTS RESERVED34 / ©2016 NAVIGANT CONSULTING, INC. ALL RIGHTS RESERVED34
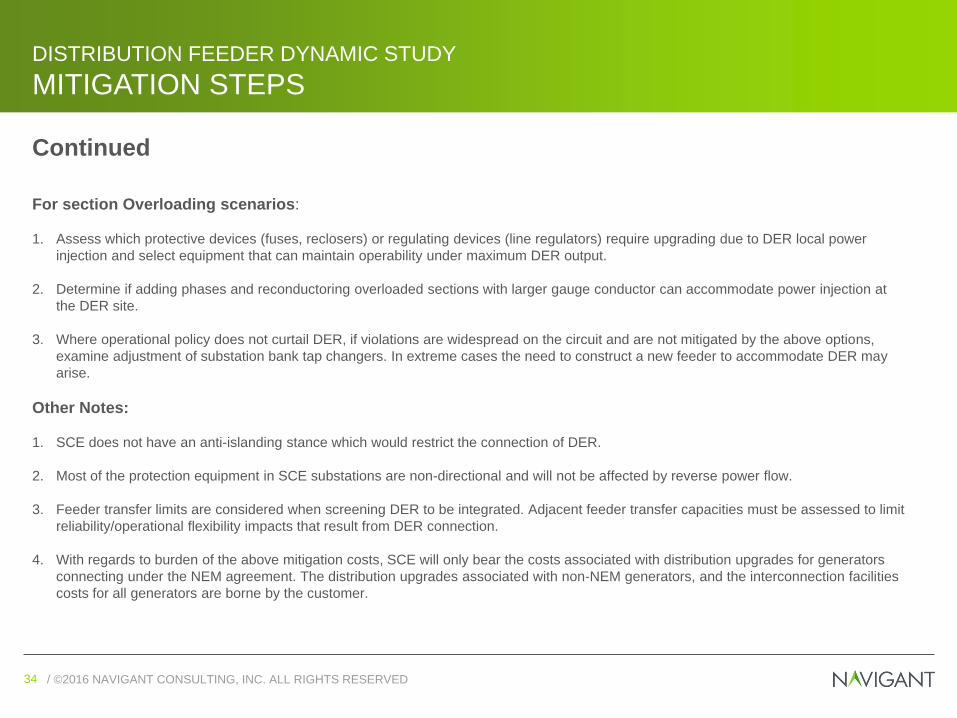
DISTRIBUTION FEEDER DYNAMIC STUDY
MITIGATION STEPS
Continued
For section Overloading scenarios:
1. Assess which protective devices (fuses, reclosers) or regulating devices (line regulators) require upgrading due to DER local power
injection and select equipment that can maintain operability under maximum DER output.
2. Determine if adding phases and reconductoring overloaded sections with larger gauge conductor can accommodate power injection at
the DER site.
3. Where operational policy does not curtail DER, if violations are widespread on the circuit and are not mitigated by the above options,
examine adjustment of substation bank tap changers. In extreme cases the need to construct a new feeder to accommodate DER may
arise.
Other Notes:
1. SCE does not have an anti-islanding stance which would restrict the connection of DER.
2. Most of the protection equipment in SCE substations are non-directional and will not be affected by reverse power flow.
3. Feeder transfer limits are considered when screening DER to be integrated. Adjacent feeder transfer capacities must be assessed to limit
reliability/operational flexibility impacts that result from DER connection.
4. With regards to burden of the above mitigation costs, SCE will only bear the costs associated with distribution upgrades for generators
connecting under the NEM agreement. The distribution upgrades associated with non-NEM generators, and the interconnection facilities
costs for all generators are borne by the customer.
/ ©2016 NAVIGANT CONSULTING, INC. ALL RIGHTS RESERVED35 / ©2016 NAVIGANT CONSULTING, INC. ALL RIGHTS RESERVED35
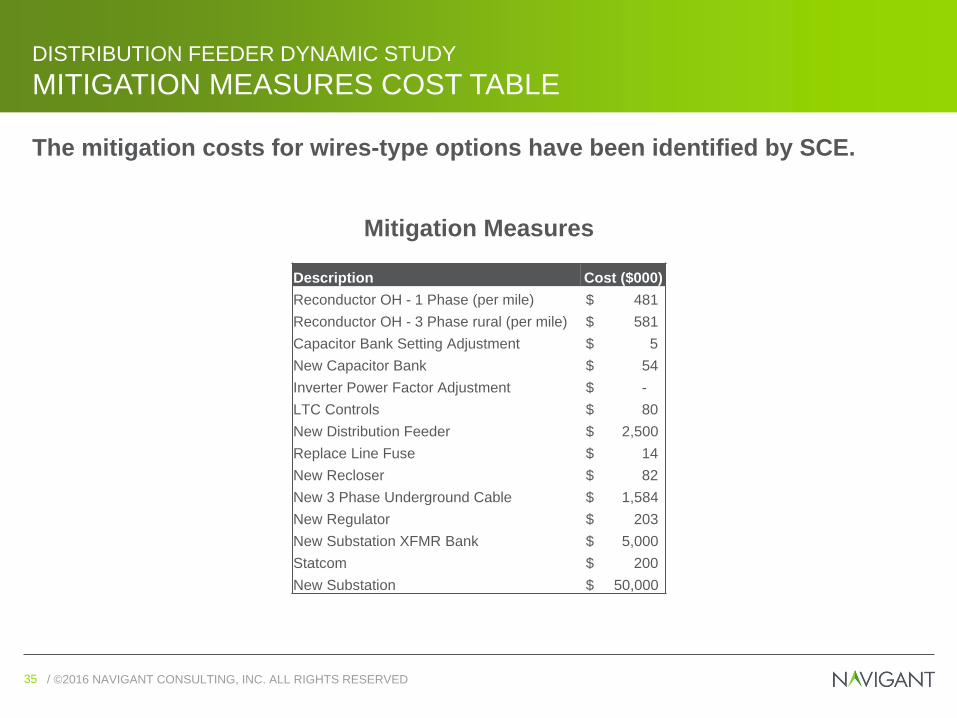
DISTRIBUTION FEEDER DYNAMIC STUDY
MITIGATION MEASURES COST TABLE
Mitigation Measures
Description Cost ($000)
Reconductor OH - 1 Phase (per mile) $ 481
Reconductor OH - 3 Phase rural (per mile) $ 581
Capacitor Bank Setting Adjustment $ 5
New Capacitor Bank $ 54
Inverter Power Factor Adjustment $ -
LTC Controls $ 80
New Distribution Feeder $ 2,500
Replace Line Fuse $ 14
New Recloser $ 82
New 3 Phase Underground Cable $ 1,584
New Regulator $ 203
New Substation XFMR Bank $ 5,000
Statcom $ 200
New Substation $ 50,000
The mitigation costs for wires-type options have been identified by SCE.
/ ©2016 NAVIGANT CONSULTING, INC. ALL RIGHTS RESERVED36 / ©2016 NAVIGANT CONSULTING, INC. ALL RIGHTS RESERVED36
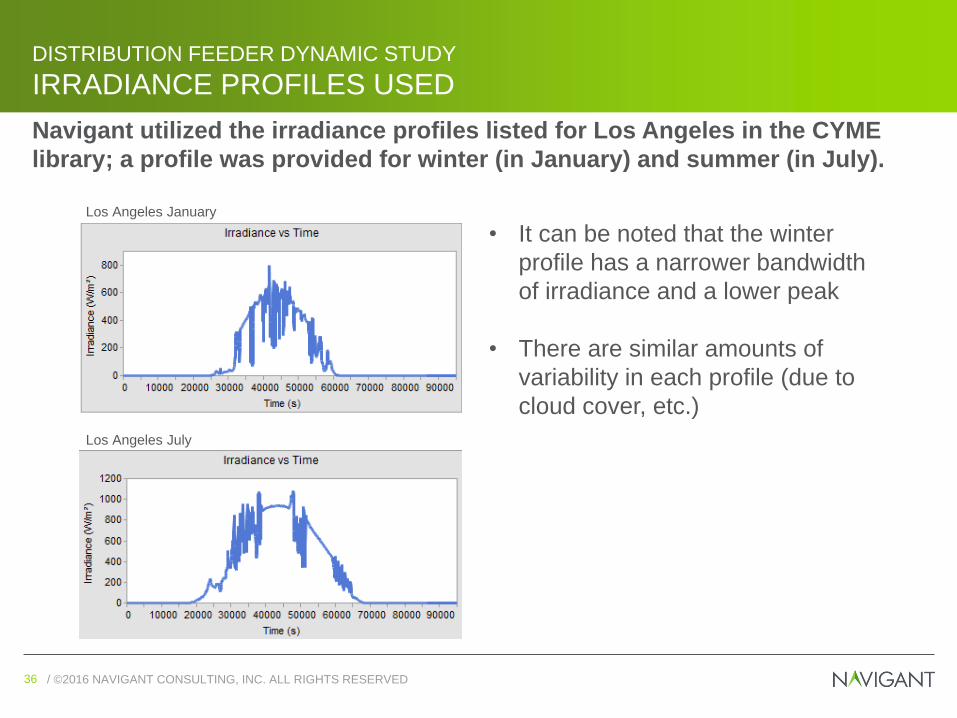
DISTRIBUTION FEEDER DYNAMIC STUDY
IRRADIANCE PROFILES USED
• It can be noted that the winter
profile has a narrower bandwidth
of irradiance and a lower peak
• There are similar amounts of
variability in each profile (due to
cloud cover, etc.)
Los Angeles January
Los Angeles July
Navigant utilized the irradiance profiles listed for Los Angeles in the CYME
library; a profile was provided for winter (in January) and summer (in July).
/ ©2016 NAVIGANT CONSULTING, INC. ALL RIGHTS RESERVED37 / ©2016 NAVIGANT CONSULTING, INC. ALL RIGHTS RESERVED37
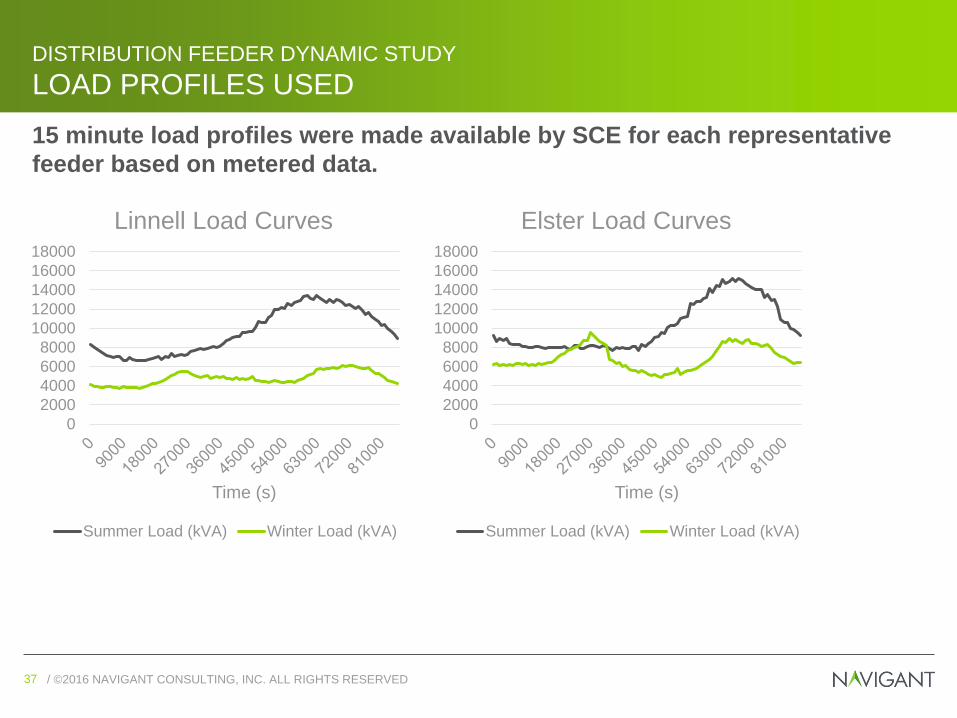
DISTRIBUTION FEEDER DYNAMIC STUDY
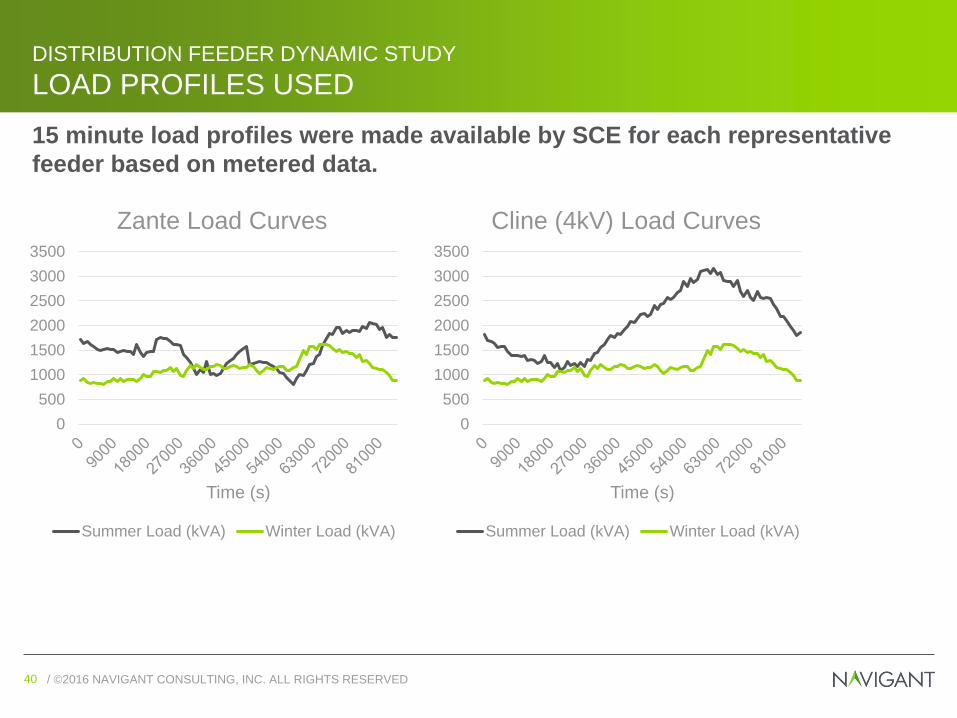
LOAD PROFILES USED
15 minute load profiles were made available by SCE for each representative
feeder based on metered data.
0
2000
4000
6000
8000
10000
12000
14000
16000
18000
Time (s)
Elster Load Curves
Summer Load (kVA) Winter Load (kVA)
0
2000
4000
6000
8000
10000
12000
14000
16000
18000
Time (s)
Linnell Load Curves
Summer Load (kVA) Winter Load (kVA)
/ ©2016 NAVIGANT CONSULTING, INC. ALL RIGHTS RESERVED38 / ©2016 NAVIGANT CONSULTING, INC. ALL RIGHTS RESERVED38
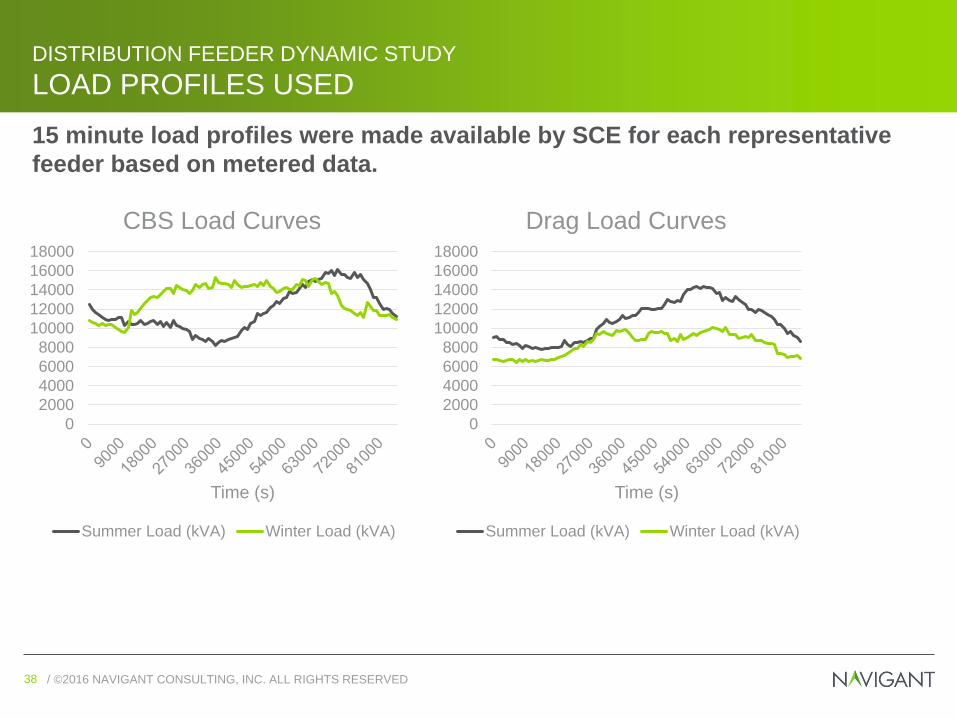
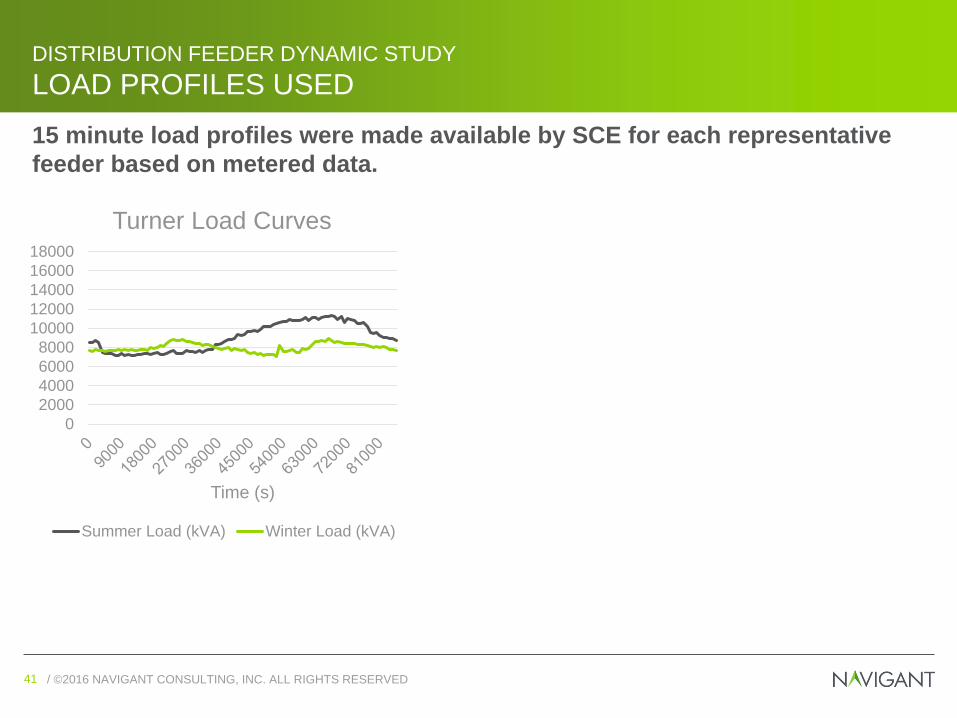
DISTRIBUTION FEEDER DYNAMIC STUDY
LOAD PROFILES USED
15 minute load profiles were made available by SCE for each representative
feeder based on metered data.
0
2000
4000
6000
8000
10000
12000
14000
16000
18000
Time (s)
CBS Load Curves
Summer Load (kVA) Winter Load (kVA)
0
2000
4000
6000
8000
10000
12000
14000
16000
18000
Time (s)
Drag Load Curves
Summer Load (kVA) Winter Load (kVA)
/ ©2016 NAVIGANT CONSULTING, INC. ALL RIGHTS RESERVED39 / ©2016 NAVIGANT CONSULTING, INC. ALL RIGHTS RESERVED39
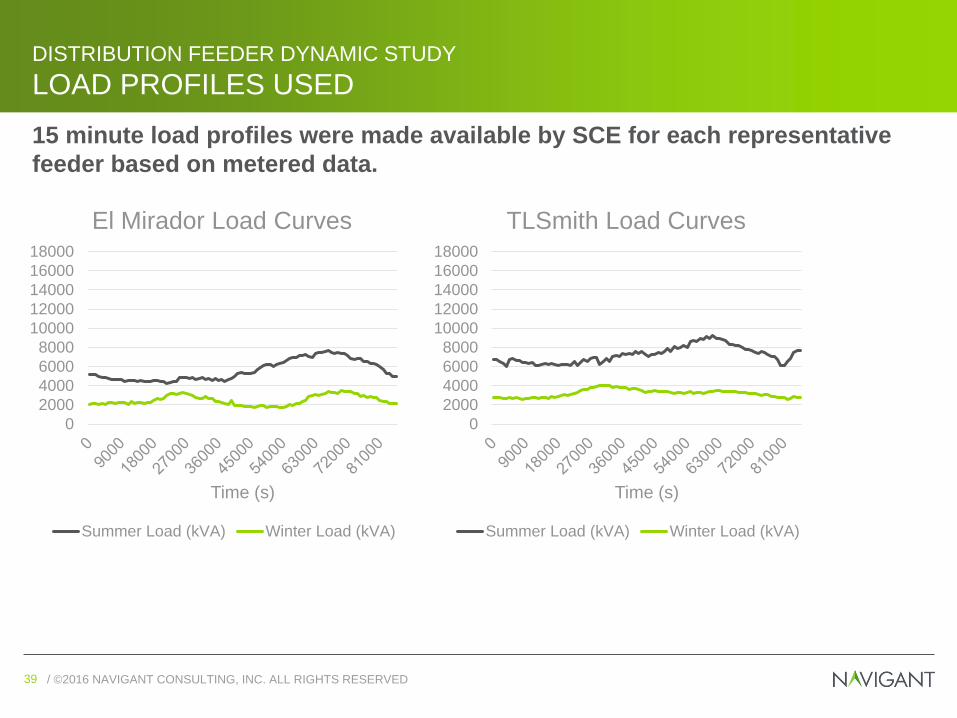
DISTRIBUTION FEEDER DYNAMIC STUDY
LOAD PROFILES USED
15 minute load profiles were made available by SCE for each representative
feeder based on metered data.
0
2000
4000
6000
8000
10000
12000
14000
16000
18000
Time (s)
El Mirador Load Curves
Summer Load (kVA) Winter Load (kVA)
0
2000
4000
6000
8000
10000
12000
14000
16000
18000
Time (s)
TLSmith Load Curves
Summer Load (kVA) Winter Load (kVA)
/ ©2016 NAVIGANT CONSULTING, INC. ALL RIGHTS RESERVED40 / ©2016 NAVIGANT CONSULTING, INC. ALL RIGHTS RESERVED40
DISTRIBUTION FEEDER DYNAMIC STUDY
LOAD PROFILES USED
15 minute load profiles were made available by SCE for each representative
feeder based on metered data.
0
500
1000
1500
2000
2500
3000
3500
Time (s)
Zante Load Curves
Summer Load (kVA) Winter Load (kVA)
0
500
1000
1500
2000
2500
3000
3500
Time (s)
Cline (4kV) Load Curves
Summer Load (kVA) Winter Load (kVA)
/ ©2016 NAVIGANT CONSULTING, INC. ALL RIGHTS RESERVED41 / ©2016 NAVIGANT CONSULTING, INC. ALL RIGHTS RESERVED41
DISTRIBUTION FEEDER DYNAMIC STUDY
LOAD PROFILES USED
15 minute load profiles were made available by SCE for each representative
feeder based on metered data.
0
2000
4000
6000
8000
10000
12000
14000
16000
18000
Time (s)
Turner Load Curves
Summer Load (kVA) Winter Load (kVA)
/ ©2016 NAVIGANT CONSULTING, INC. ALL RIGHTS RESERVED42 / ©2016 NAVIGANT CONSULTING, INC. ALL RIGHTS RESERVED42
DISTRIBUTION FEEDER DYNAMIC STUDY
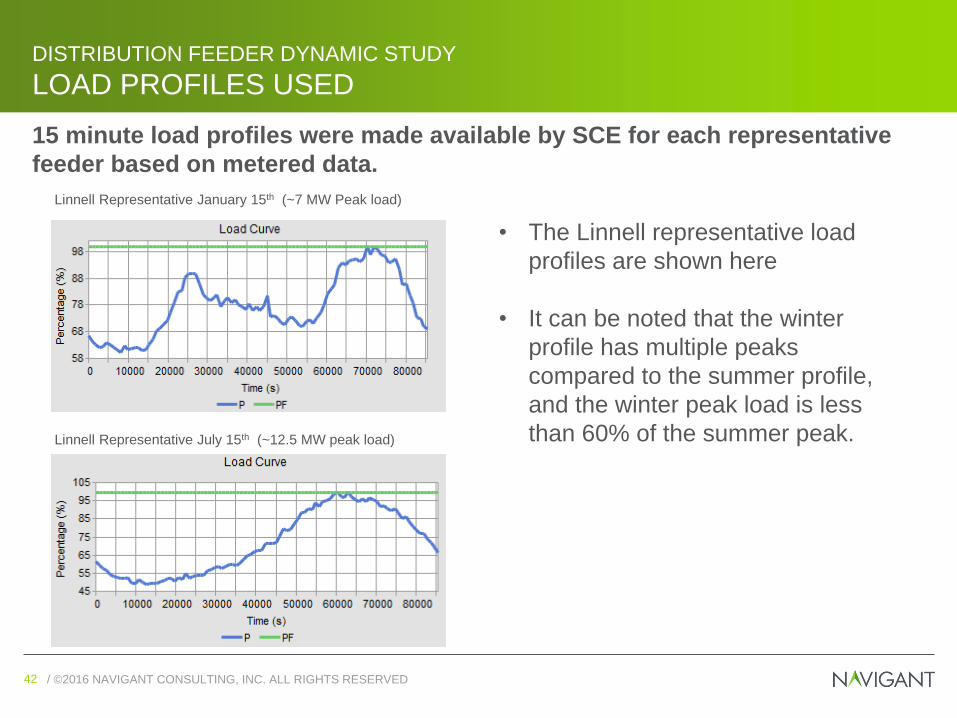
LOAD PROFILES USED
• The Linnell representative load
profiles are shown here
• It can be noted that the winter
profile has multiple peaks
compared to the summer profile,
and the winter peak load is less
than 60% of the summer peak.
Linnell Representative January 15th (~7 MW Peak load)
Linnell Representative July 15th (~12.5 MW peak load)
15 minute load profiles were made available by SCE for each representative
feeder based on metered data.
/ ©2016 NAVIGANT CONSULTING, INC. ALL RIGHTS RESERVED43 / ©2016 NAVIGANT CONSULTING, INC. ALL RIGHTS RESERVED43
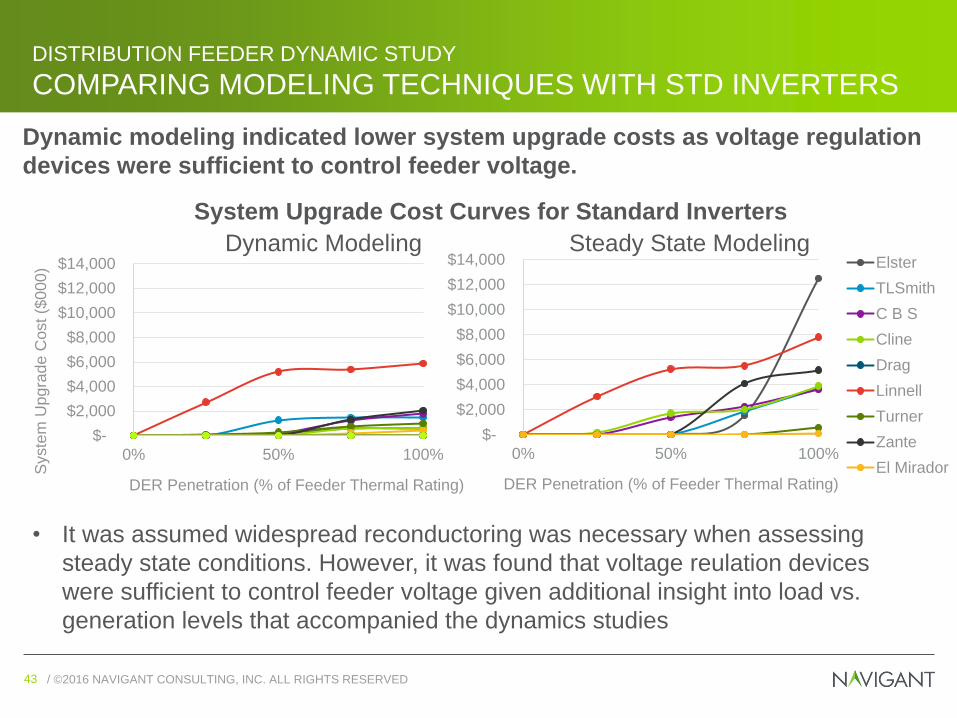
Dynamic modeling indicated lower system upgrade costs as voltage regulation
devices were sufficient to control feeder voltage.
DISTRIBUTION FEEDER DYNAMIC STUDY
COMPARING MODELING TECHNIQUES WITH STD INVERTERS
System Upgrade Cost Curves for Standard Inverters
$-
$2,000
$4,000
$6,000
$8,000
$10,000
$12,000
$14,000
0% 50% 100%
Syste
m U
pgra
de C
ost
($000)
DER Penetration (% of Feeder Thermal Rating)
• It was assumed widespread reconductoring was necessary when assessing
steady state conditions. However, it was found that voltage reulation devices
were sufficient to control feeder voltage given additional insight into load vs.
generation levels that accompanied the dynamics studies
$-
$2,000
$4,000
$6,000
$8,000
$10,000
$12,000
$14,000
0% 50% 100%
DER Penetration (% of Feeder Thermal Rating)
Elster
TLSmith
C B S
Cline
Drag
Linnell
Turner
Zante
El Mirador
Dynamic Modeling Steady State Modeling